the Creative Commons Attribution 4.0 License.
the Creative Commons Attribution 4.0 License.
 | 10 Oct 2022
Automated snow avalanche release area delineation in data-sparse, remote, and forested regions
Pascal Haegeli
Yves Bühler
Potential avalanche release area (PRA) modeling is critical for generating automated avalanche terrain maps which provide low-cost, large-scale spatial representations of snow avalanche hazard for both infrastructure planning and recreational applications. Current methods are not applicable in mountainous terrain where high-resolution (≤5 m) elevation models are unavailable and do not include an efficient method to account for avalanche release in forested terrain. This research focuses on expanding an existing PRA model to better incorporate forested terrain using satellite imagery and presents a novel approach for validating the model using local expertise, thereby broadening its application to numerous mountain ranges worldwide. The study area of this research is a remote portion of the Columbia Mountains in southeastern British Columbia, Canada, which has no pre-existing high-resolution spatial datasets. Our research documents an open-source workflow to generate high-resolution digital elevation models (DEMs) and forest land cover datasets using optical satellite data processing. We validate the PRA model by collecting a polygon dataset of observed potential release areas from local guides, using a method which accounts for the uncertainty in human recollection and variability in avalanche release. The validation dataset allows us to perform a quantitative analysis of the PRA model accuracy and optimize the PRA model input parameters to the snowpack and terrain characteristics of our study area. Compared to the original PRA model our implementation of forested terrain and local optimization improved the percentage of validation polygons accurately modeled by 11.7 percentage points and reduced the number of validation polygons that were underestimated by 14.8 percentage points. Our methods demonstrate substantial improvement in the performance of the PRA model in forested terrain and provide means to generate the requisite input datasets and validation data to apply and evaluate the PRA model in vastly more mountainous regions worldwide than was previously possible.
- Article
(14003 KB) - Full-text XML
-
Supplement
(419 KB) - BibTeX
- EndNote


Snow avalanches are a significant natural hazard for traffic and settlement infrastructure as well as for individuals who travel in snow-covered mountainous regions. Roads, railroads, utilities, and permanent structures located in areas with potential avalanche hazard can be destroyed by large avalanche impacts or blocked for extended periods during winter storm events, causing financial losses and potential for injury or death from individuals being buried in the debris. In economically developed countries, the majority of avalanche fatalities occur during recreational activities (i.e., backcountry skiing, snowmobile riding, mountaineering) where individuals voluntarily expose themselves to avalanche hazard (Boyd et al., 2009), and accidental avalanches are mostly triggered by the party that is caught (Schweizer and Lütschg, 2001; Techel et al., 2016). In North America and Europe, an average of approximately 140 people are killed in avalanches each year (Jamieson et al., 2010; Techel et al., 2016; Colorado Avalanche Information Center, 2020).
To mitigate avalanche hazard, locations with potential for avalanche release need to be identified so elements at risk can attempt to minimize their exposure. This can be achieved by avoiding avalanche-prone areas, minimizing exposure time, or implementing avalanche control methods (McClung and Schaerer, 2006). Avalanche hazard mapping is a time-honored practice for determining the spatial distribution of snow avalanche hazards (Margreth and Funk, 1999; Rudolf-Miklau et al., 2015). Traditional manual hazard mapping combines multiple methods such as terrain inspection, numerical simulations, avalanche event databases, and expert experience to evaluate avalanche hazard exposure and spatial extent, making it both labor- and cost-intensive. This highly detailed approach is the gold standard for determining avalanche zoning for permanent infrastructure, but the costs make it unsuitable for mapping large areas of mountainous terrain (Rudolf-Miklau et al., 2015; Bühler et al., 2018, 2022).
To overcome this challenge, automated GIS and remote sensing methods have been developed to expedite the mapping process and produce avalanche terrain indication maps based on digital elevation model (DEM) and land cover data (Maggioni and Gruber, 2003; Gruber and Haefner, 1995). The foundation of automated avalanche terrain mapping is potential avalanche release area (PRA) modeling, which estimates the location of potential hazards based on the local terrain characteristics (Bühler et al., 2013, 2018; Veitinger et al., 2016). PRA models can be applied to define the spatial extent of release areas in dynamic avalanche simulations, which estimate the runout distance, velocity, and flow height of avalanche debris (Christen et al., 2010), or as a standalone spatial layer to assist with hazard identification. Their ability to operate at the mountain range scale with limited human input dramatically reduces cost and time to develop spatial datasets, which can assist infrastructure planners and recreationists in making more informed decisions about their avalanche hazard exposure (Bühler et al., 2018). The development of large-scale avalanche hazard indication maps in Switzerland has led to them being applied as a tool to help backcountry recreationists visualize terrain hazards and incorporate them into their trip planning process (Harvey et al., 2018).
The current state-of-the-art methods for PRA modeling have been developed and validated in regions with widely available high-resolution DEM and forest cover data as well as long-term records of avalanche observations (Bühler et al., 2018; Veitinger et al., 2016). However, the majority of mountainous regions in the world do not have freely available high-resolution DEM or forest cover data yet, and long-term, spatially accurate records of avalanche release are very rare. This seriously limits the application and local validation of PRA models.
An additional limitation of existing high-resolution PRA models is that they do not account for the interaction between forest characteristics and avalanche release. For example, both the Bühler et al. (2018) and Veitinger et al. (2016) PRA models allow for forested areas to be excluded from PRA calculations based on a forest mask layer, but they do not explicitly capture forest avalanche interaction. This reduces the applicability of these PRA models in mountain ranges where a significant portion of the avalanche terrain is forest-covered, such as in western North America.
To address these challenges and make PRA models applicable more broadly, the objective of this research is to develop a cost-effective workflow for generating the required input datasets for the Bühler et al. (2018) PRA model using satellite data and open-source remote sensing methods. In addition, we present a relatively simple method for adapting the current PRA model to work in forested terrain. In the absence of long-term avalanche observations, we develop a novel approach for utilizing the expertise and terrain knowledge of local mountain guides to validate the PRA model output and optimize the input parameter for the unique terrain and snowpack characteristics of our study area. These three developments – the use of satellite data, the adaptation of the model to work in forested terrain, and the validation with local terrain expertise – together open new opportunities for applying state-of-the-art avalanche terrain modeling in regions with limited existing datasets and resources.
2.1 Potential avalanche release area modeling
Early versions of GIS-based avalanche terrain models (e.g., Gruber and Haefner, 1995; Maggioni and Gruber, 2003) struggled to outperform simple slope-based avalanche release area estimates (Voellmy, 1955) due to the inability of low-resolution DEMs (20–30 m) to detect small-scale terrain features. Current PRA modeling methods evolved over the course of a decade and benefit from developments in high-resolution DEM production and remote sensing (e.g., Bühler et al., 2013, 2018, 2022; Veitinger et al., 2016; Kumar et al., 2019). To define avalanche release areas the algorithms use different combinations of DEM derivatives (i.e., slope angle, terrain ruggedness, curvature, and aspect), which are calculated using focal functions of raster pixels. Bühler et al. (2013) found that 5 m resolution is the optimal tradeoff between processing efficiency and small-scale feature identification for PRA modeling. With DEM resolution of 5 m, a common nine-cell focal neighborhood (3×3) is 225 m2, which is well below the median slab size for human-triggered avalanches of 4000 m2 (Schweizer and Lütschg, 2001). Hence, high-resolution input data are essential to capture sub-release-area-scale terrain characteristics, which are critical for accurate potential release area modeling.
The development of these algorithms depends on a robust validation dataset of observed avalanche events to determine the optimal input parameter settings for the target study area. By comparing the extent of the PRA model output to the location of avalanche observations the overall accuracy of the PRA model can be evaluated, and comparisons can be made between different combinations of input parameters. Such datasets can be created through recording of manual observations or generated by applying satellite mapping (Lato et al., 2012; Bühler et al., 2019; Hafner et al., 2021). The most comprehensive known avalanche release area validation dataset currently available is curated by the WSL Institute for Snow and Avalanche Research SLF in Davos, Switzerland, with experienced staff manually mapping avalanche outlines throughout the winter in the surrounding mountain areas. This avalanche observation catalog began in 1970, and as of 2016 it included 5785 mapped avalanches (Bühler et al., 2018). This dataset is now expanded to include data from satellite avalanche mapping (Bühler et al., 2019) as well as airplane (Bühler et al., 2009; Korzeniowska et al., 2017) and drone surveys (Bühler et al., 2017).
Using a subset of this validation data, Bühler et al. (2018) compared their PRA algorithm performance against another PRA model (Veitinger et al., 2016) and a simple slope-based release area estimation method from Voellmy (1955). The validation study showed that the Bühler et al. (2018) and Veitinger et al. (2016) PRA models had lower probability of detection compared to the slope-based model, by 3.5 % and 2 %, respectively, but also had lower probability of false detection, by 13.3 % and 8.4 %, respectively. This means that the slope-only model detected a greater percentage of observed release areas compared to the PRA models but also overpredicted release areas at a higher rate than the PRA models. Due to the relatively smaller decrease in probability of detection (3.5 % and 2 %) compared to the decrease in probability of false detection (13.3 % and 8.4 %) the more sophisticated PRA models are considered more skillful than the slope-based model. The relatively small improvements over the slope-based release area estimate illustrate the fact that PRA modeling is a field of marginal gains, but when applied over large areas marginal improvements can have a large impact on the output extent of PRA models. The results also show slightly better performance for the Bühler et al. (2018) PRA model over the Veitinger et al. (2016) PRA model, with lower probability of false detection and higher measures of Pierce skill score and Heidke skill score.
An additional advantage of the Bühler et al. (2018) PRA model is the ability to convert the raster-based PRA model output to polygon features using object-based image analysis. Converting the PRA model output to polygon features enables the PRA model to be paired with dynamic avalanche simulation software (Christen et al., 2010; Bühler et al., 2018) to estimate runout distance, impact pressures, flow depth, and velocity of the avalanche flow. This powerful combination of release area and runout modeling represents the state-of-the-art of current avalanche terrain indication modeling practices and is a valuable resource for large-scale avalanche hazard indication mapping. Therefore, this research seeks to improve and expand upon the existing Bühler et al. (2018) PRA model.
The Bühler et al. (2018) PRA model has been applied in multiple regions worldwide, including Chile, Alaska, Afghanistan, and India. However, the input parameters have not been independently tested and optimized using local validation data. Therefore, it is unknown whether the input parameters optimized for Davos, Switzerland, are appropriate for mountain regions with different topographic and snowpack characteristics. Our research aims to address this knowledge gap by applying an updated version of the Bühler et al. (2018) PRA model to the Columbia Mountains of southeastern British Columbia, Canada, and seeks to optimize the input parameters for the study area based on locally available validation data.
2.2 Avalanches in forested terrain
In addition to DEM-derived terrain variables some PRA algorithms use forest coverage to define PRA based on the assumption that avalanche release is less common in areas with tall and dense vegetation. The snowpack in forested areas is generally more stable due to the anchoring effect of trees, forest canopy snow interception, the disruption of the continuity of weak layers due to snow drop from the canopy, and altered snow surface radiation and temperature conditions. However, it is still possible for avalanches to release in forested areas, especially in areas with steep slope angles or low tree density or in openings within forested areas (Bebi et al., 2009). Small and medium avalanches generally do not have enough impact force to damage trees or tree stands, and forests tend to reduce their runout potential by detraining snow from the flowing avalanche (Feistl et al., 2014). Larger avalanches can break or uproot trees and cause massive destruction to the forest ecosystem (Feistl et al., 2015; Bebi et al., 2009). The location of avalanche release areas in relation to the forest plays a large role in whether trees will impede avalanche flow or be destroyed and possibly entrained (Teich et al., 2012).
The ability to account for forest characteristics in avalanche terrain modeling is largely based on locally available datasets. Laser scanning or lidar data provide high-resolution digital surface model (DSM) and digital terrain model (DTM) datasets to define the forest character, including canopy height, location and size of forest gaps, and basal area (Brožová et al., 2020; Dash et al., 2016). Vegetation height models derived from DSM and DTM data can be used to identify forests with a protective function and input as forest masks in PRA models (Bebi et al., 2021; Bühler et al., 2018, 2022; Waser et al., 2015). Similar to their application for DEM production, the high accuracy of these datasets comes at a high cost.
Alternative lower-cost methods for estimating forest characteristics include traditional field-based sample plots and radar or optical remote sensing instruments (Hyyppä et al., 2000; Waser et al., 2015). The most accessible of these alternative methods is satellite-based optical imagery, which can be used to create a forest land cover classification and to determine the extent of the forested area (Bühler et al., 2013) and can be combined with field plot observations of specific forest characteristics to create a predictive model based on the spectral and textural characteristics of the imagery (Dash et al., 2016).
Prior research has attempted to incorporate forest characteristics with PRA modeling (Sharp et al., 2018), but low-resolution DEM and forest data combined with a limited validation dataset make it challenging to evaluate the overall performance of the model. However, the principle of adjusting the potential for avalanche release based on forest character aligns with analytical and theoretical understanding of avalanche release in forested terrain (Bebi et al., 2009; McClung, 2001). This research aims to expand existing methods for capturing forest avalanche interaction in PRA models using satellite remote sensing methods that are cost-effective and efficient for processing large-scale avalanche terrain models.
Applying the potential avalanche release area (PRA) model to the study area required three main analysis steps (Fig. 1): first, developing a pipeline for producing high-resolution DEM and forest classification data from satellite imagery; second, adapting the existing PRA model to better capture forested terrain and processing many versions of the PRA model using a predefined range of input parameters; third, developing new methods to validate the PRA model using polygons collected from local experts in order to optimize the input parameters for our study area. Steps two and three required many iterations (Fig. 1, step 3c) to test different baseline input parameters and evaluate performance using our grid search validation procedure. The datasets and code required for replication of our DEM processing, forest classification, and PRA validation are available in our Open Science Framework (OSF) repository (Sykes et al., 2021).
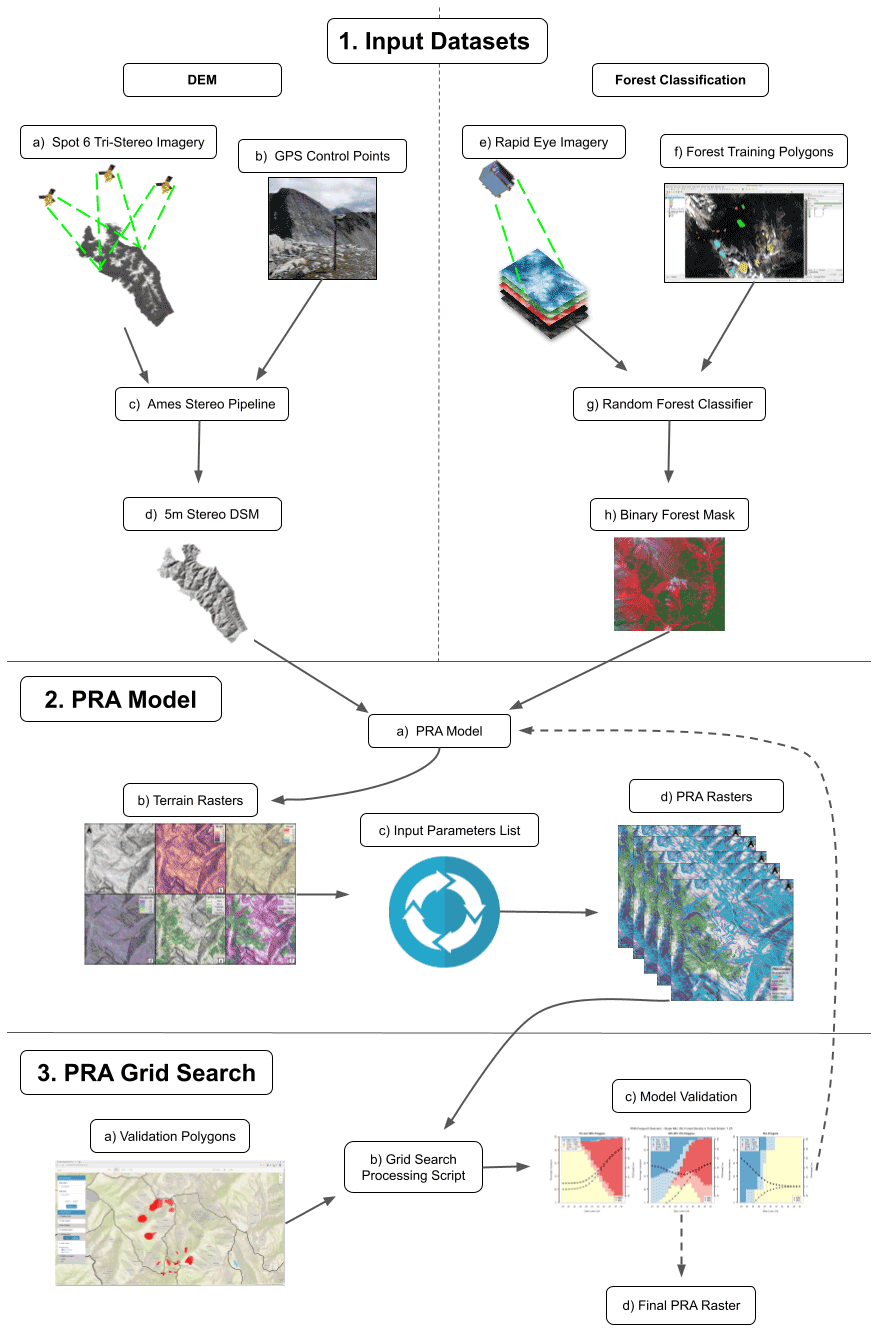
Figure 1Workflow diagram illustrating the necessary input datasets and processing steps to apply and validate the PRA model in our remote, data-sparse, and forested study area. The dashed lines in step 3c indicate the option to either refine the baseline input parameters of the PRA model and re-start from step 2a or select the final PRA model and move to step 3d.
3.1 Study area
The study area for this research is the tenure area of CMH Galena, a mechanized skiing operation that operates in the Selkirk Mountains of British Columbia, Canada, approximately 100 km southeast of Revelstoke (Fig. 2). The tenure covers 1162 km2, ranges from 450 to 3050 m in elevation, and is composed of roughly 60 % forested terrain. The Selkirk Mountains have a transitional snow climate with a maritime influence where persistent avalanche problem types are common. The most common persistent weak layers associated with these avalanche problems are surface hoar and faceted crystals associated with a crust (Hägeli and McClung, 2003; Haegeli and McClung, 2007; Shandro and Haegeli, 2018). The best existing DEM and land cover datasets for the study area are the Canadian Digital Elevation Model (CDEM), with a resolution of 18 m, and the 2015 National Land Cover Dataset (NLCD), with a resolution of 30 m. The resolution of both these datasets is too coarse for high-resolution PRA modeling.
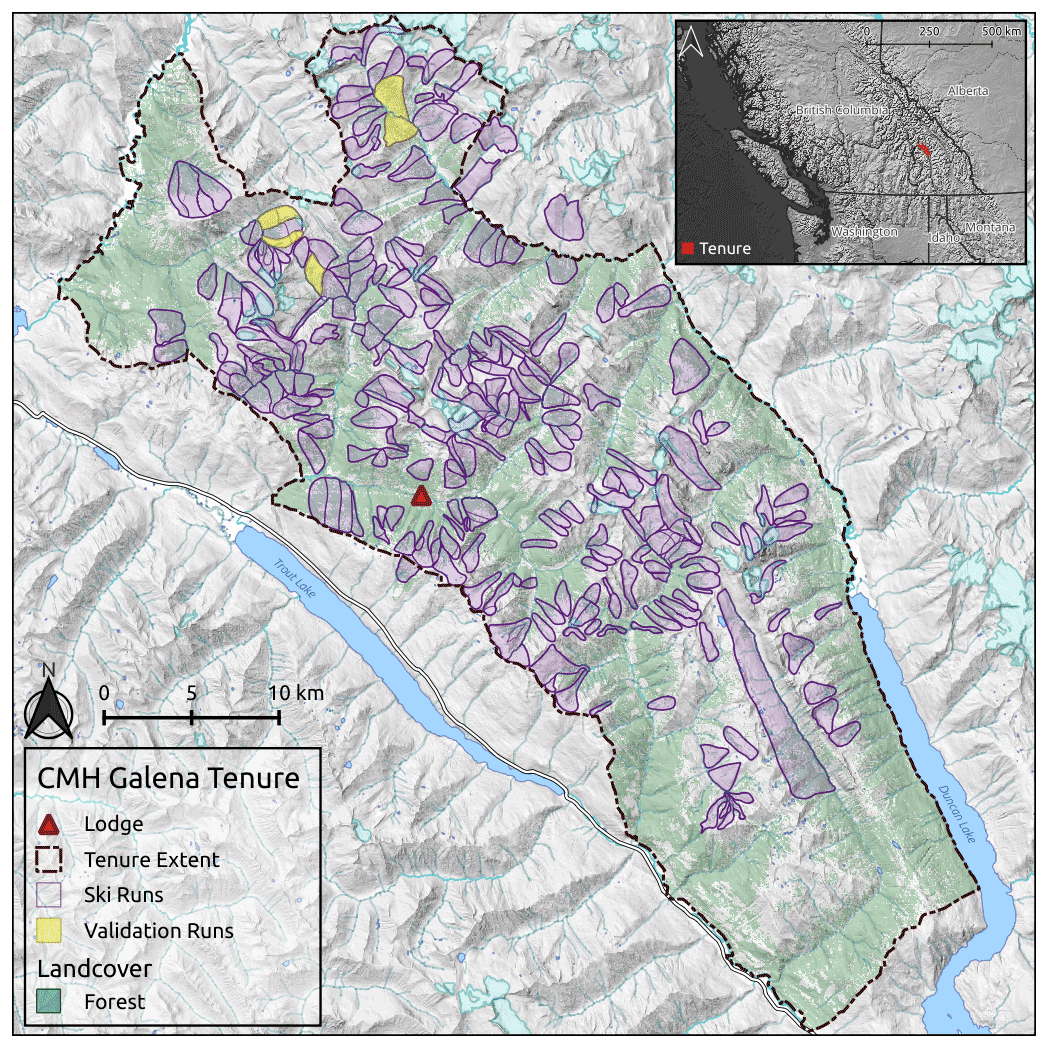
Figure 2Study area map showing the CMH Galena tenure, lodge location, ski run polygons, and the subset of runs used to validate the PRA model. Forest data created using Planet Labs imagery (Planet Team, 2017), inset map made with Natural Earth.
3.2 Data preparation
3.2.1 DEM generation
Based on our desire to develop a cost-effective and reproducible approach for applying PRA models across large areas, we chose to purchase raw satellite imagery and use open-source photogrammetry software to produce our own DEM. At the time we purchased the imagery our estimate was that producing our own DEM would be roughly 2–10 times less expensive than alternative methods to acquire a 5 m DEM based on price quotes from multiple commercial suppliers. However, the cost savings of producing a DEM using raw imagery come at a tradeoff of requiring significant technical knowhow to process the stereo imagery. One downside of this approach is that vegetation cover inhibits the ability to create a bare-ground DEM (known as a digital terrain model; DTM), and we end up with a digital surface model (DSM) that represents the reflective surface at the top of the vegetation. While a DSM is not the ideal representation of terrain in forested areas (Brožová et al., 2020), the high cost of lidar, the only remote sensing method that can produce a DTM in vegetation-covered terrain, currently prevents its widespread use.
Producing a 5 m DEM requires satellite imagery with a spatial resolution of at least 1.5 m. After comparing the products from various providers (Pleiades 1, WorldView 1–4, GeoEye 1, SPOT 6/7, and KOMPSAT 2–3) we purchased SPOT 6/7 imagery based on our requirements of DEM resolution, study area size, and cost. The listed price for tasking new imagery collection for 1.5 m resolution SPOT 6/7 tri-stereo imagery at the time of acquisition was USD 12.65 per square kilometer for a minimum study area of 500 km2, which does not account for any academic or other discounts available through imagery suppliers. The SPOT 6 tri-stereo satellite images were captured on 19 August 2019 with 1.5 % cloud cover and no visible atmospheric distortions (wildfire smoke, haze) in the images. Tri-stereo imagery captures forward-, nadir-, and backward-looking images in a single pass and provides three stereo image perspectives, which increases DEM accuracy in steep terrain and minimizes sensor shading. For a more detailed description of our DEM processing interested readers should reference the Supplement “DSM production in mountainous, forested terrain using SPOT 6 tri-stereo imagery with Ames Stereo Pipeline”.
To improve and assess the accuracy of our DEM we collected a set of 66 ground control points (GCPs) distributed across our study area using a Trimble Geo7x handheld differential global navigation satellite system (DGNSS) unit connected to an H-star base station network, from 24–27 August 2019. We collected GCPs in locations with high contrast such as edges of snowfields, waterbody inlets, bridges, and land cover transitions (e.g., boundary of talus slope and vegetation) to make the locations accurately identifiable in the satellite imagery. The timing of our image collection (19 August 2019) and GCP data collection (24–27 August 2019) meant that there were minimal changes in the natural features we used as reference points (i.e., snowfields, waterbodies).
To process the imagery, we used a combination of open-source software tools from the Geospatial Data Abstraction Software Library (GDAL), QGIS, and the Ames Stereo Pipeline (ASP) version 2.6.2 (Beyer et al., 2018; Rouault et al., 2022; QGIS Development Team, 2021). Several steps of preprocessing were necessary to optimize our images prior to stereophotogrammetry, including bundle adjustment and orthorectification (Shean et al., 2016). The ASP stereo tool was developed for imagery containing bare rock and glacial landscapes. Differences in image texture in forested terrain are challenging for the default settings of ASP to produce accurate pixel matches. To address this issue, we extensively tested different stereo correlation algorithms and stereo processing settings to optimize performance for forested mountainous terrain. Our best results were achieved using the smooth semi-global matching (MGM) stereo correlation algorithm (Facciolo et al., 2015), which resulted in fewer DEM holes in forested terrain and terrain with suboptimal lighting conditions. Optimizing the settings of the ASP stereo tool produced accurate pixel matches in forested terrain and was only limited by artifacts in the original imagery (cloud, cloud shadow, poor lighting conditions).
Our stereo processing workflow generated six separate DSMs from the SPOT 6 tri-stereo imagery by taking all possible combinations of left and right stereo images. The goal of this method was to reduce DSM holes in steep or poorly lit terrain by taking advantage of the multiple view angles provided by the tri-stereo imagery. Before combining the individual DSMs to produce the final DSM mosaic, we removed pixels with a triangulation error greater than the resolution of the input images (1.5 m) to ensure robust elevation estimates (Fig. 3a). Overall, we see low normalized median absolute deviation (NMAD) values across the DSM mosaic (Fig. 3b), with a median NMAD of 0.32 m.
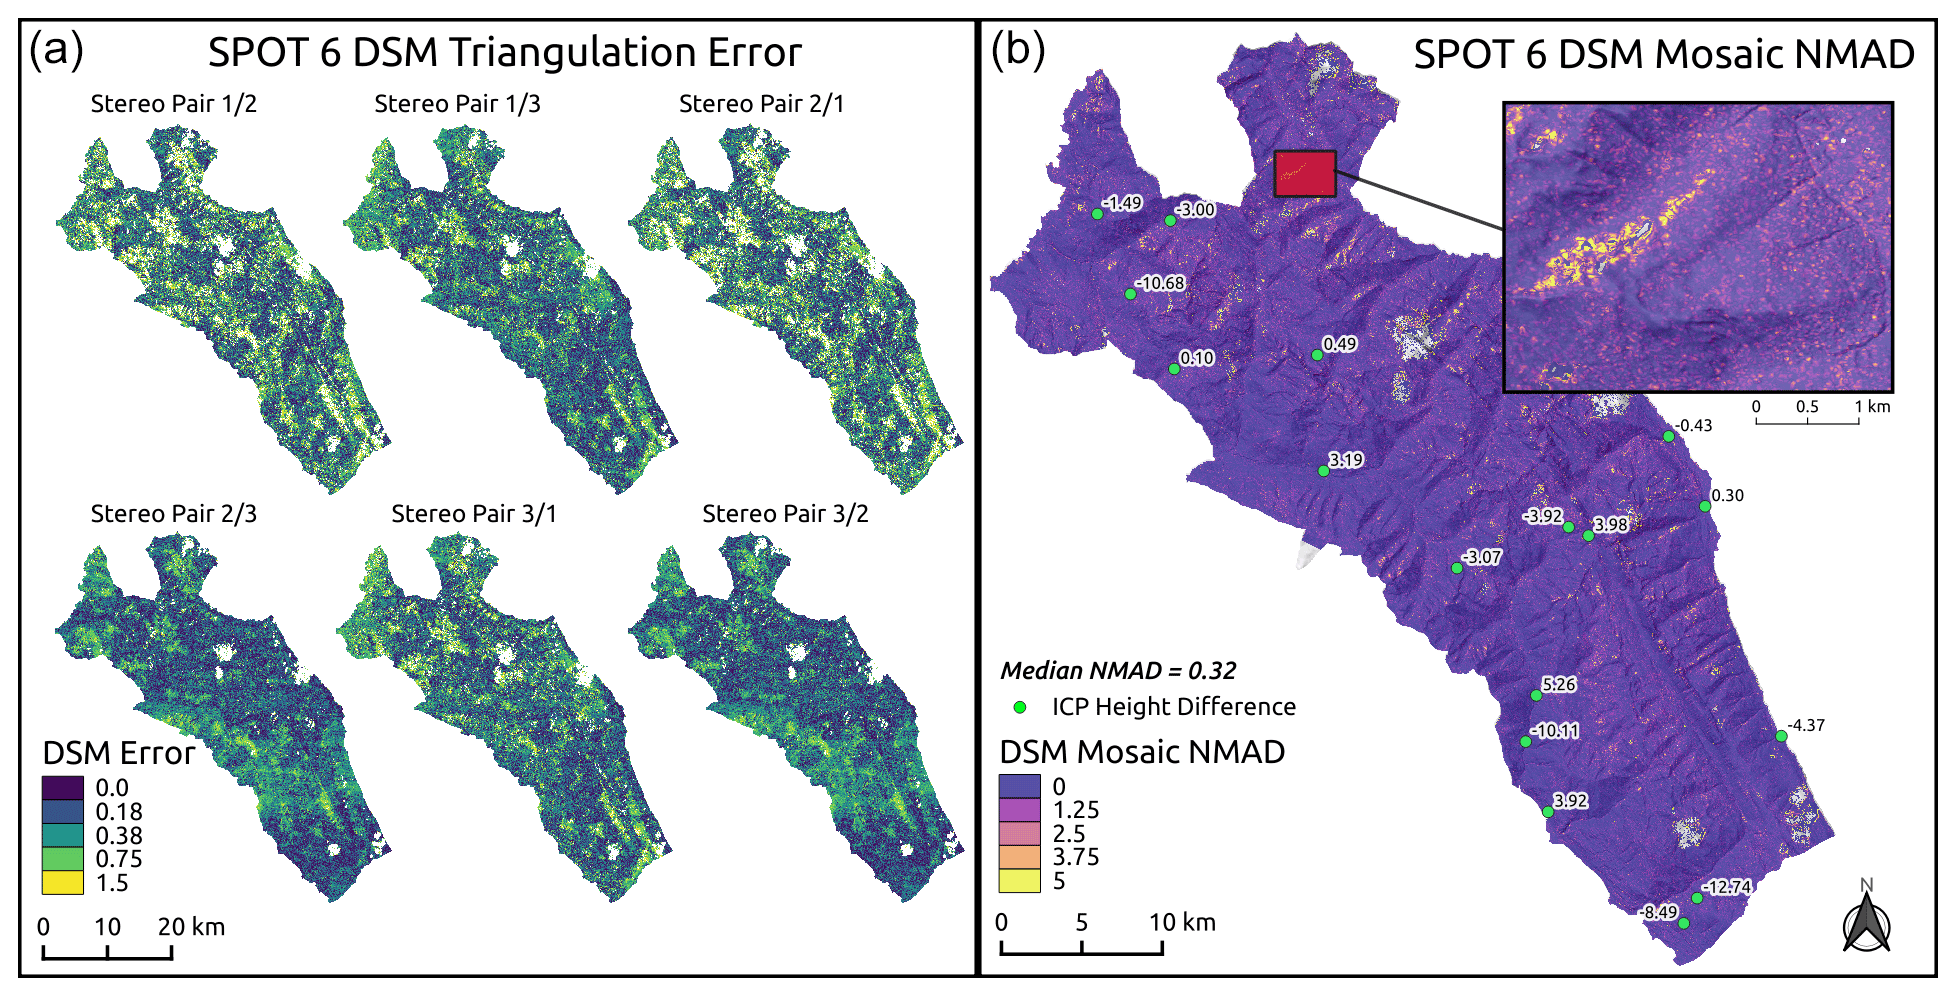
Figure 3SPOT 6 DSM error estimates. Triangulation error for each set of stereo pairs (a) with pixels where error is greater than image resolution (1.5 m) removed from DSM. Normalized median absolute deviation (NMAD) for mosaic of six stereo pairs (b) with inset map showing slope-scale detail. Internal checkpoints (green points) with height difference in meters between DSM surface and DGNSS measurement (negative values indicate that the DSM surface height is lower than internal checkpoint, ICP, height).
To improve the alignment of the final DSM mosaic to our GCP, we used the ASP point cloud alignment tool to co-register the output DSM to the GCP (Shean et al., 2016). To evaluate the accuracy of our DSM we used 15 internal checkpoints which were not used as part of our GCP dataset (Höhle and Höhle, 2009).
Localized cloud cover and poor lighting on steep north-facing terrain caused several holes in our SPOT 6 DSM mosaic, which account for approximately 1 % of the total DEM area (11.7 km2). We filled these holes by down-sampling the existing Canadian DEM to 5 m, aligning the CDEM to our SPOT 6 DSM mosaic using the point cloud alignment tool in ASP, and then blending the two DEM datasets together. To avoid smoothing the entire SPOT 6 DSM we progressively blended the datasets across a 60 m buffer from holes in the SPOT 6 DSM.
The methods described here were only tested on a single set of SPOT 6 tri-stereo images, but the performance in forested terrain was vastly improved compared to the default ASP settings. For more detailed information on the ASP workflow or the computer resources used to calculate the DSM please see the Supplement, or contact the authors.
3.2.2 Forest classification
The existing PRA model of Bühler et al. (2018) uses a binary forest mask based on photogrammetric vegetation height model classification to mask release areas in forested terrain. We tested several approaches to generate a binary forest mask for our study area. Since our SPOT 6 imagery was limited by poor lighting conditions on steep north-facing terrain due to early-morning sun angle, we substituted Planet Labs' RapidEye imagery, collected on 17 July 2018 (Planet Team, 2017). An advantage of the RapidEye imagery is that it includes a red edge band which provides additional spectral resolution to differentiate between forests and other types of vegetation (Dash et al., 2016).
The overall accuracy of the classifier is critical for providing a distinction between forested land cover and other types of vegetation, such as shrubs and herbaceous plants. For avalanche release area modeling this distinction is important because shrubs and herbaceous plants are buried or pressed down beneath the winter snowpack and therefore have minimal effect on the potential for avalanche release. Trees with rigid trunks that resist being laid over by the winter snowpack and canopy heights greater than the snowpack depth (approximately 2–3 m) have an anchoring effect on the snowpack which is essential to capture accurately in order to account for their effect on avalanche release. By iteratively fine-tuning the training dataset we were able to control how the classifier identified forested terrain and opted to select a model that primarily captured densely forested areas and omitted areas with isolated smaller trees surrounded by shrubs and herbaceous plants.
To perform the classification, we used a random forest algorithm on the blue, green, red, red edge, and near-infrared image bands utilizing the Python libraries NumPy, GDAL, Rasterio, and scikit-learn (Rouault et al., 2022; Gillies et al., 2013; Harris et al., 2020; Pedregosa et al., 2011). To improve the classification accuracy, we included the normalized difference red edge index (NDRI), normalized difference vegetation index (NDVI), and normalized difference water index (NDWI) as additional bands for the random forest classifier. Training data were created by manually drawing polygons around individual land cover types (forest, water, bare ground, snow and ice, shrub, moss, and lichen) based on RapidEye, SPOT 6, and Google Earth imagery from our study area. Our training dataset is composed of 253 individual polygons (12.0 km2), with 73 polygons of forested terrain (3.6 km2). For further details on the analysis methods used for the forest classification interested readers are referred to our OSF directory, where the data and code are available for review (Sykes et al., 2021).
3.3 Integration of forest information into PRA model
Our development of additional PRA model functions to improve performance in forested terrain was guided by two principles:
-
Minimize additional complexity when running the PRA model compared to the original version.
-
Utilize remote sensing datasets that are available in data-sparse locations and do not require extensive field validation.
To integrate forest information into the PRA model, we created two additional input parameters: an ordinal forest density (open – 0, sparse – 1, moderate – 2, dense – 3, very dense – 4) (Fig. 4) and a numeric forest slope scalar (0.0–2.0) (Fig. 5). The forest density parameter controls what classes of forest are included in the PRA model, while the forest slope scalar adjusts the slope angle minimum threshold based on the forest density class for each pixel. Including these parameters takes advantage of the existing forest mask functions of the PRA model and only adds two input parameters when running the PRA model, both of which are optional and can be omitted to run the PRA model in the prior configuration from Bühler et al. (2018).
3.3.1 Forest density
To estimate forest density, we used a focal function to calculate the total number of forested pixels within a five-cell neighborhood (625 m2). The function simply summed up the total number of forested pixels and did not account for the location of the forested pixels within the five-cell neighborhood. This step resulted in a forest sum raster with values ranging from 0 to 25, with 0 meaning no forested cells, and 25 meaning all cells within the five-cell neighborhood are forested (Fig. 4, step 3). We included this step to capture the fuzzy transition between forested and non-forested snowpack characteristics. In areas adjacent to forested terrain the snowpack can be altered by forest cover (i.e., wind dynamics, radiation balance, canopy snowfall interception) despite not being directly covered by the forest canopy (Bebi et al., 2009). This method also helps to identify glades or meadows within the forest canopy by creating a fuzzy buffer around small non-forested islands within densely forested terrain. The size of the neighborhood function (625 m2) is representative of small human-triggered avalanches that have the potential to bury or injure a person, especially if they are carried into a forested area (Schweizer and Lütschg, 2001).
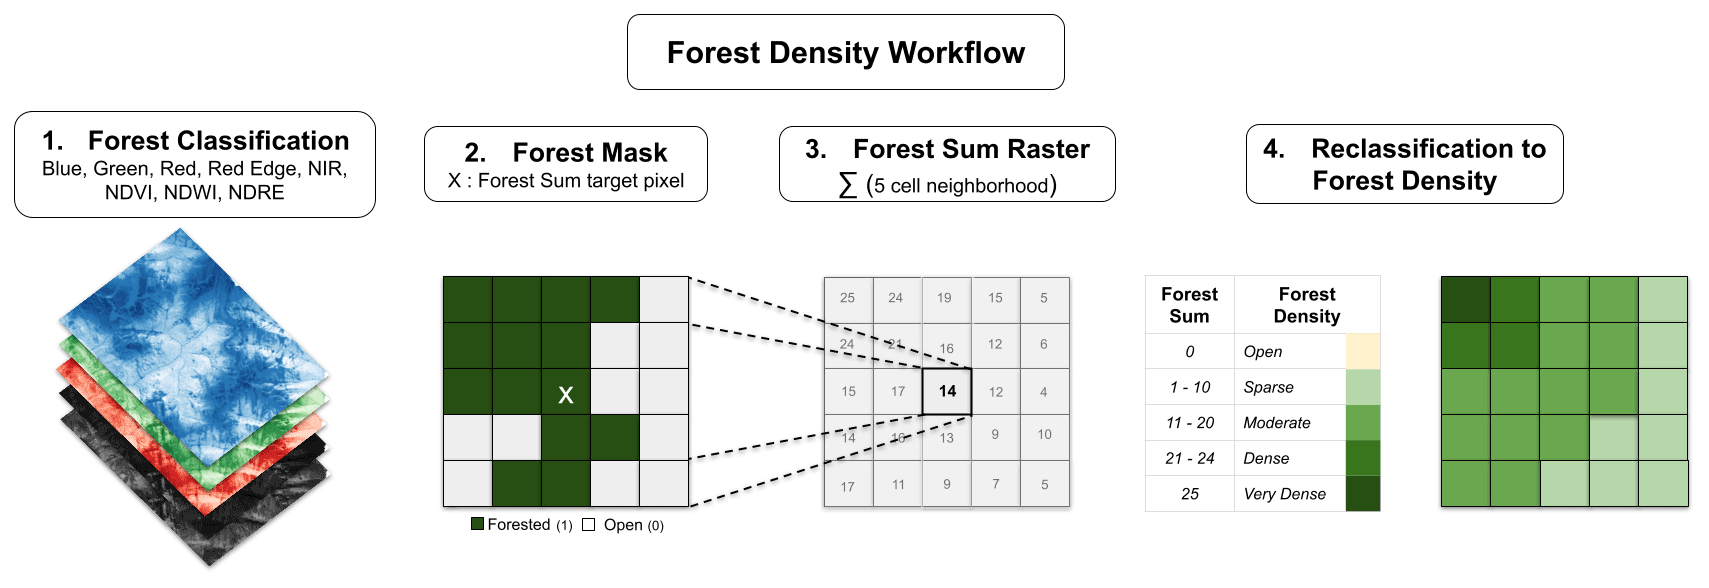
We then reclassified each forest sum cell into an ordinal variable with the forest density categories open (0 cells), sparse (1–10 cells), moderate (11–20 cells), dense (21–24 cells), and very dense (25 cells) (Fig. 4, step 4). We chose this uneven classification scheme to bias the application of the forest-slope-scalar parameter towards increasing the slope angle minimum more strongly in densely or very densely forested areas (i.e., cells with 21 to 25 neighboring forested cells). Since areas with more surrounding forested pixels likely represent more mature forests, this approach captures the fact that more mature forests have a greater potential impact on avalanche release. The resulting forest density layer provides a foundation to control how forested cells are included in the PRA model.
3.3.2 Forest slope scalar
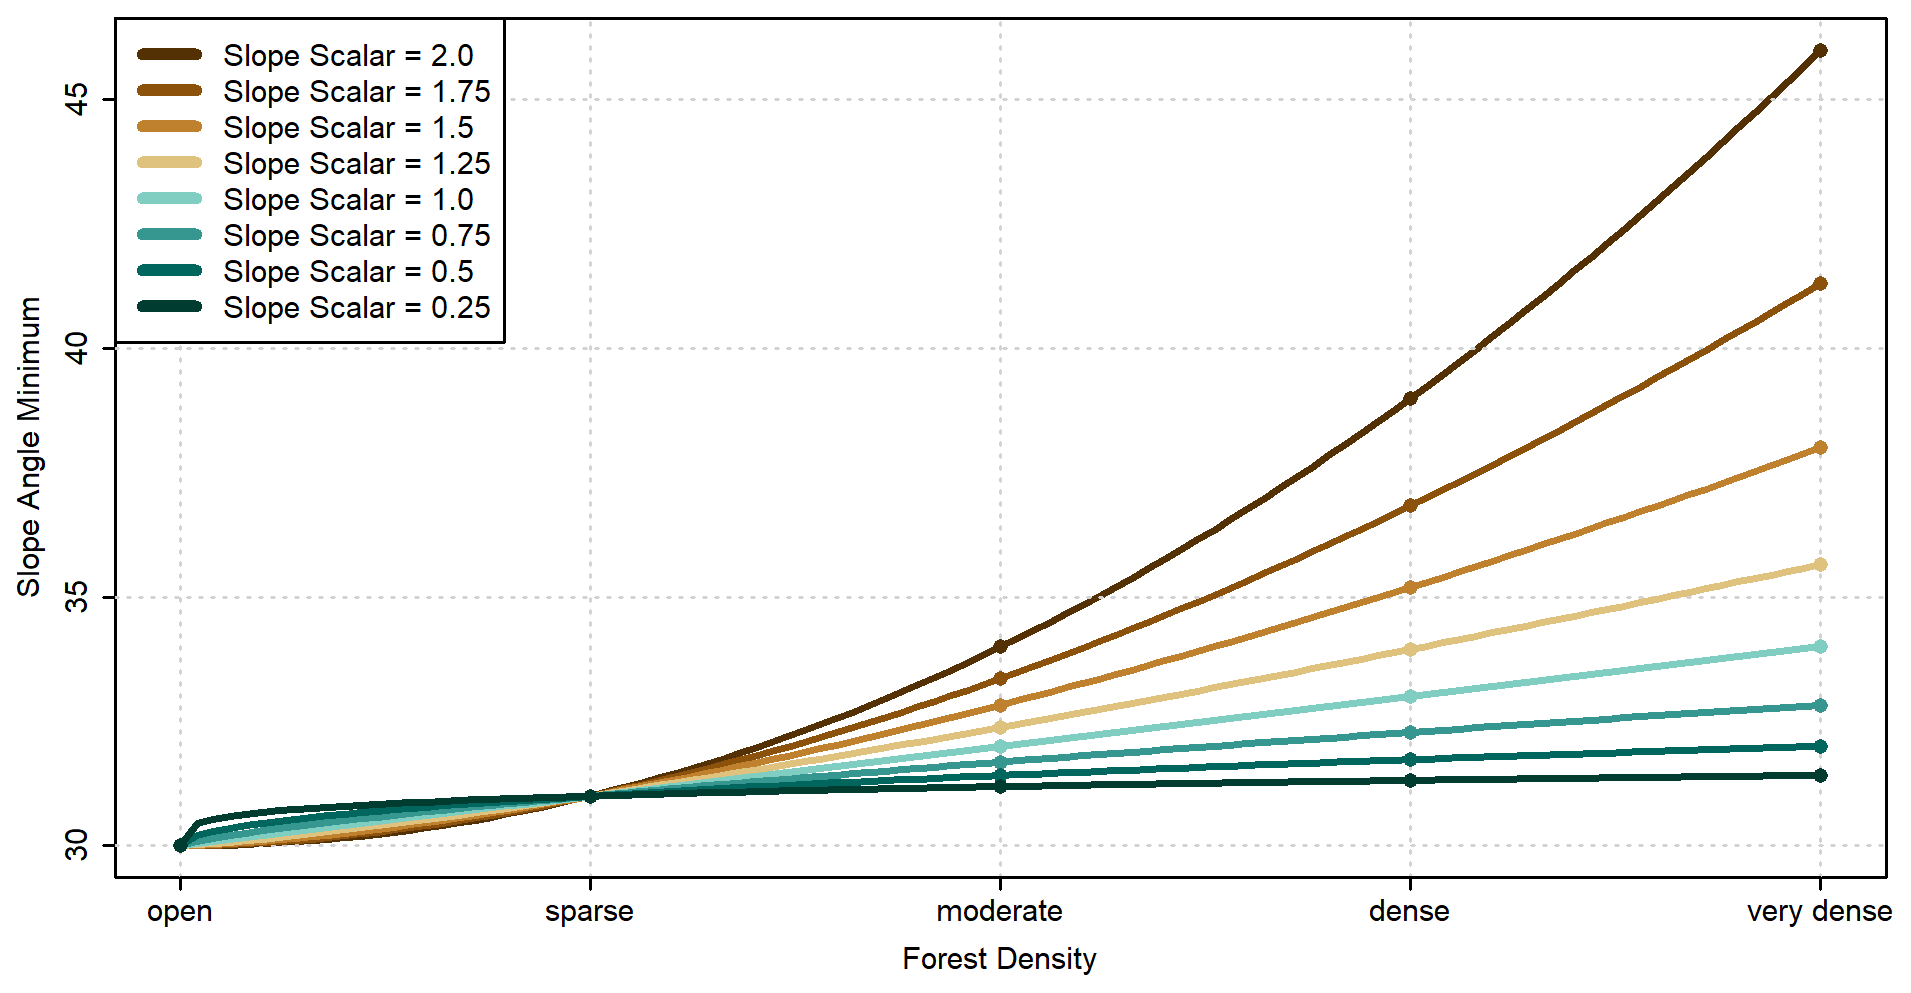
As an additional control on how the PRA model is applied in forested terrain, we introduced a forest-slope-scalar parameter to increase the slope angle minimum based on the forest density value. Applying this parameter assumes that steeper slopes are necessary for avalanche release in forested terrain, which is supported by prior research (Campbell and Gould, 2013; Schneebeli and Bebi, 2004). The rate of slope angle increase is controlled by the forest-slope-scalar parameter (0.0–2.0), which is applied as an exponent to the forest density value (0–4) and added to the slope-angle-minimum value (e.g., 30∘). For example, a slope angle minimum of 30∘ and a forest-slope-scalar value of 1 would result in the following slope angle minimums for forested terrain: open (0) 30∘, sparse (1) 31∘, moderate (2) 32∘, dense (3) 33∘, very dense (4) 34∘. A slope angle minimum of 30∘ and a forest-slope-scalar value of 2 would result in the following slope angle minimums: open (0) 30∘, sparse (1) 31∘, moderate (2) 34∘, dense (3) 39∘, very dense (4) 46∘ (Fig. 5). Altering the slope-angle-minimum input parameter changes the starting position of the forest-slope-scalar function but does not impact the rate of increase for each forest density value.
3.4 Parameter tuning and validation
To develop a meaningful validation dataset in the absence of long-term records of avalanche events, we collaborated with two CMH Galena guides, who each have decades of experience in the study area, to develop a novel method that takes advantage of their local expertise to optimize the PRA model for our study area. For technical details on our statistical calculations and processing workflow, our validation processing script and data necessary to reproduce our results are available in our OSF repository (Sykes et al., 2021).
3.4.1 Validation data collection
CMH Galena primarily operates on approximately 300 defined ski runs within their tenure. The runs range in size from 0.2–19.0 km2, and their locations have been mapped with polygons that outline the typical skiing terrain (Fig. 2). The frequency of how often these runs are used varies significantly depending on terrain characteristics, weather conditions for flying, and snowpack conditions. To validate the PRA model, the two collaborating guides selected five runs (highlighted in Fig. 2) based on their familiarity with the terrain, their representativeness of the terrain characteristics relative to the entire study area, and the balance of forested and alpine avalanche terrain contained in the runs.
The process of collecting validation polygons from the CMH guides was carried out on a custom-designed website. The website platform enabled us to develop and present meaningful reference layers (e.g., satellite imagery, topo maps, terrain data, GPS tracks, heat maps) and provide the guides with multiple perspectives of the study area to assist with drawing the validation polygons. Both guides drew release area polygons for the five validation runs individually before creating a final consensus set of polygons in collaboration. Through the process of developing the validation data collection workflow we found that mapping the precise location of start zones based on personal recollection without being in the terrain at the time is extremely difficult. Therefore, we developed an alternative method that would explicitly accommodate this uncertainty. Instead of forcing the participating guides to explicitly outline all avalanche release areas, we asked them to draw validation polygons around terrain features with similar characteristics (i.e., slope angle, forest density, ruggedness) and specify for each polygon what proportion represents potential release areas (0 %, 25 %, 50 %, 75 %, 100 %) (Fig. 6). Polygons of obvious probable release areas or non-release areas where guides had high confidence about their spatial extent were labeled with 100 % and 0 %, respectively. Areas with scattered probable release areas, such as open forests with glades, where the identification of each probable release area would be cumbersome and unreliable, were marked as larger polygons and labeled with the estimated spatial proportion of the probable release areas (25 %, 50 %, or 75 %). Outliers, such as infrequent release areas with very low slope angles that require specific snowpack structures and weak layer types (e.g., surface hoar), were not included in the validation dataset in order to avoid biassing the validation dataset toward rare events that are not representative of typical conditions in the study area.
Our fuzzy approach to mapping probable release areas has several advantages. Foremost, accommodating uncertainty in the spatial extent of release areas is a requirement when relying on human memory to generate the validation data as specifying probable release areas with higher precision from memory is simply unrealistic. This method also accounts for the variability in release area extent that results from the dynamic nature of snowpack and weather conditions. The workflow also minimizes the effects of local errors in the reference layers that we provided the guides with to record their validation polygons. Specific examples of uncertainty caused by reference layers are variations in satellite imagery lighting due to sun angle and artifacts of the DSM generation process, such as over-steepened slope angle values caused by transitions from forested to non-forested terrain.
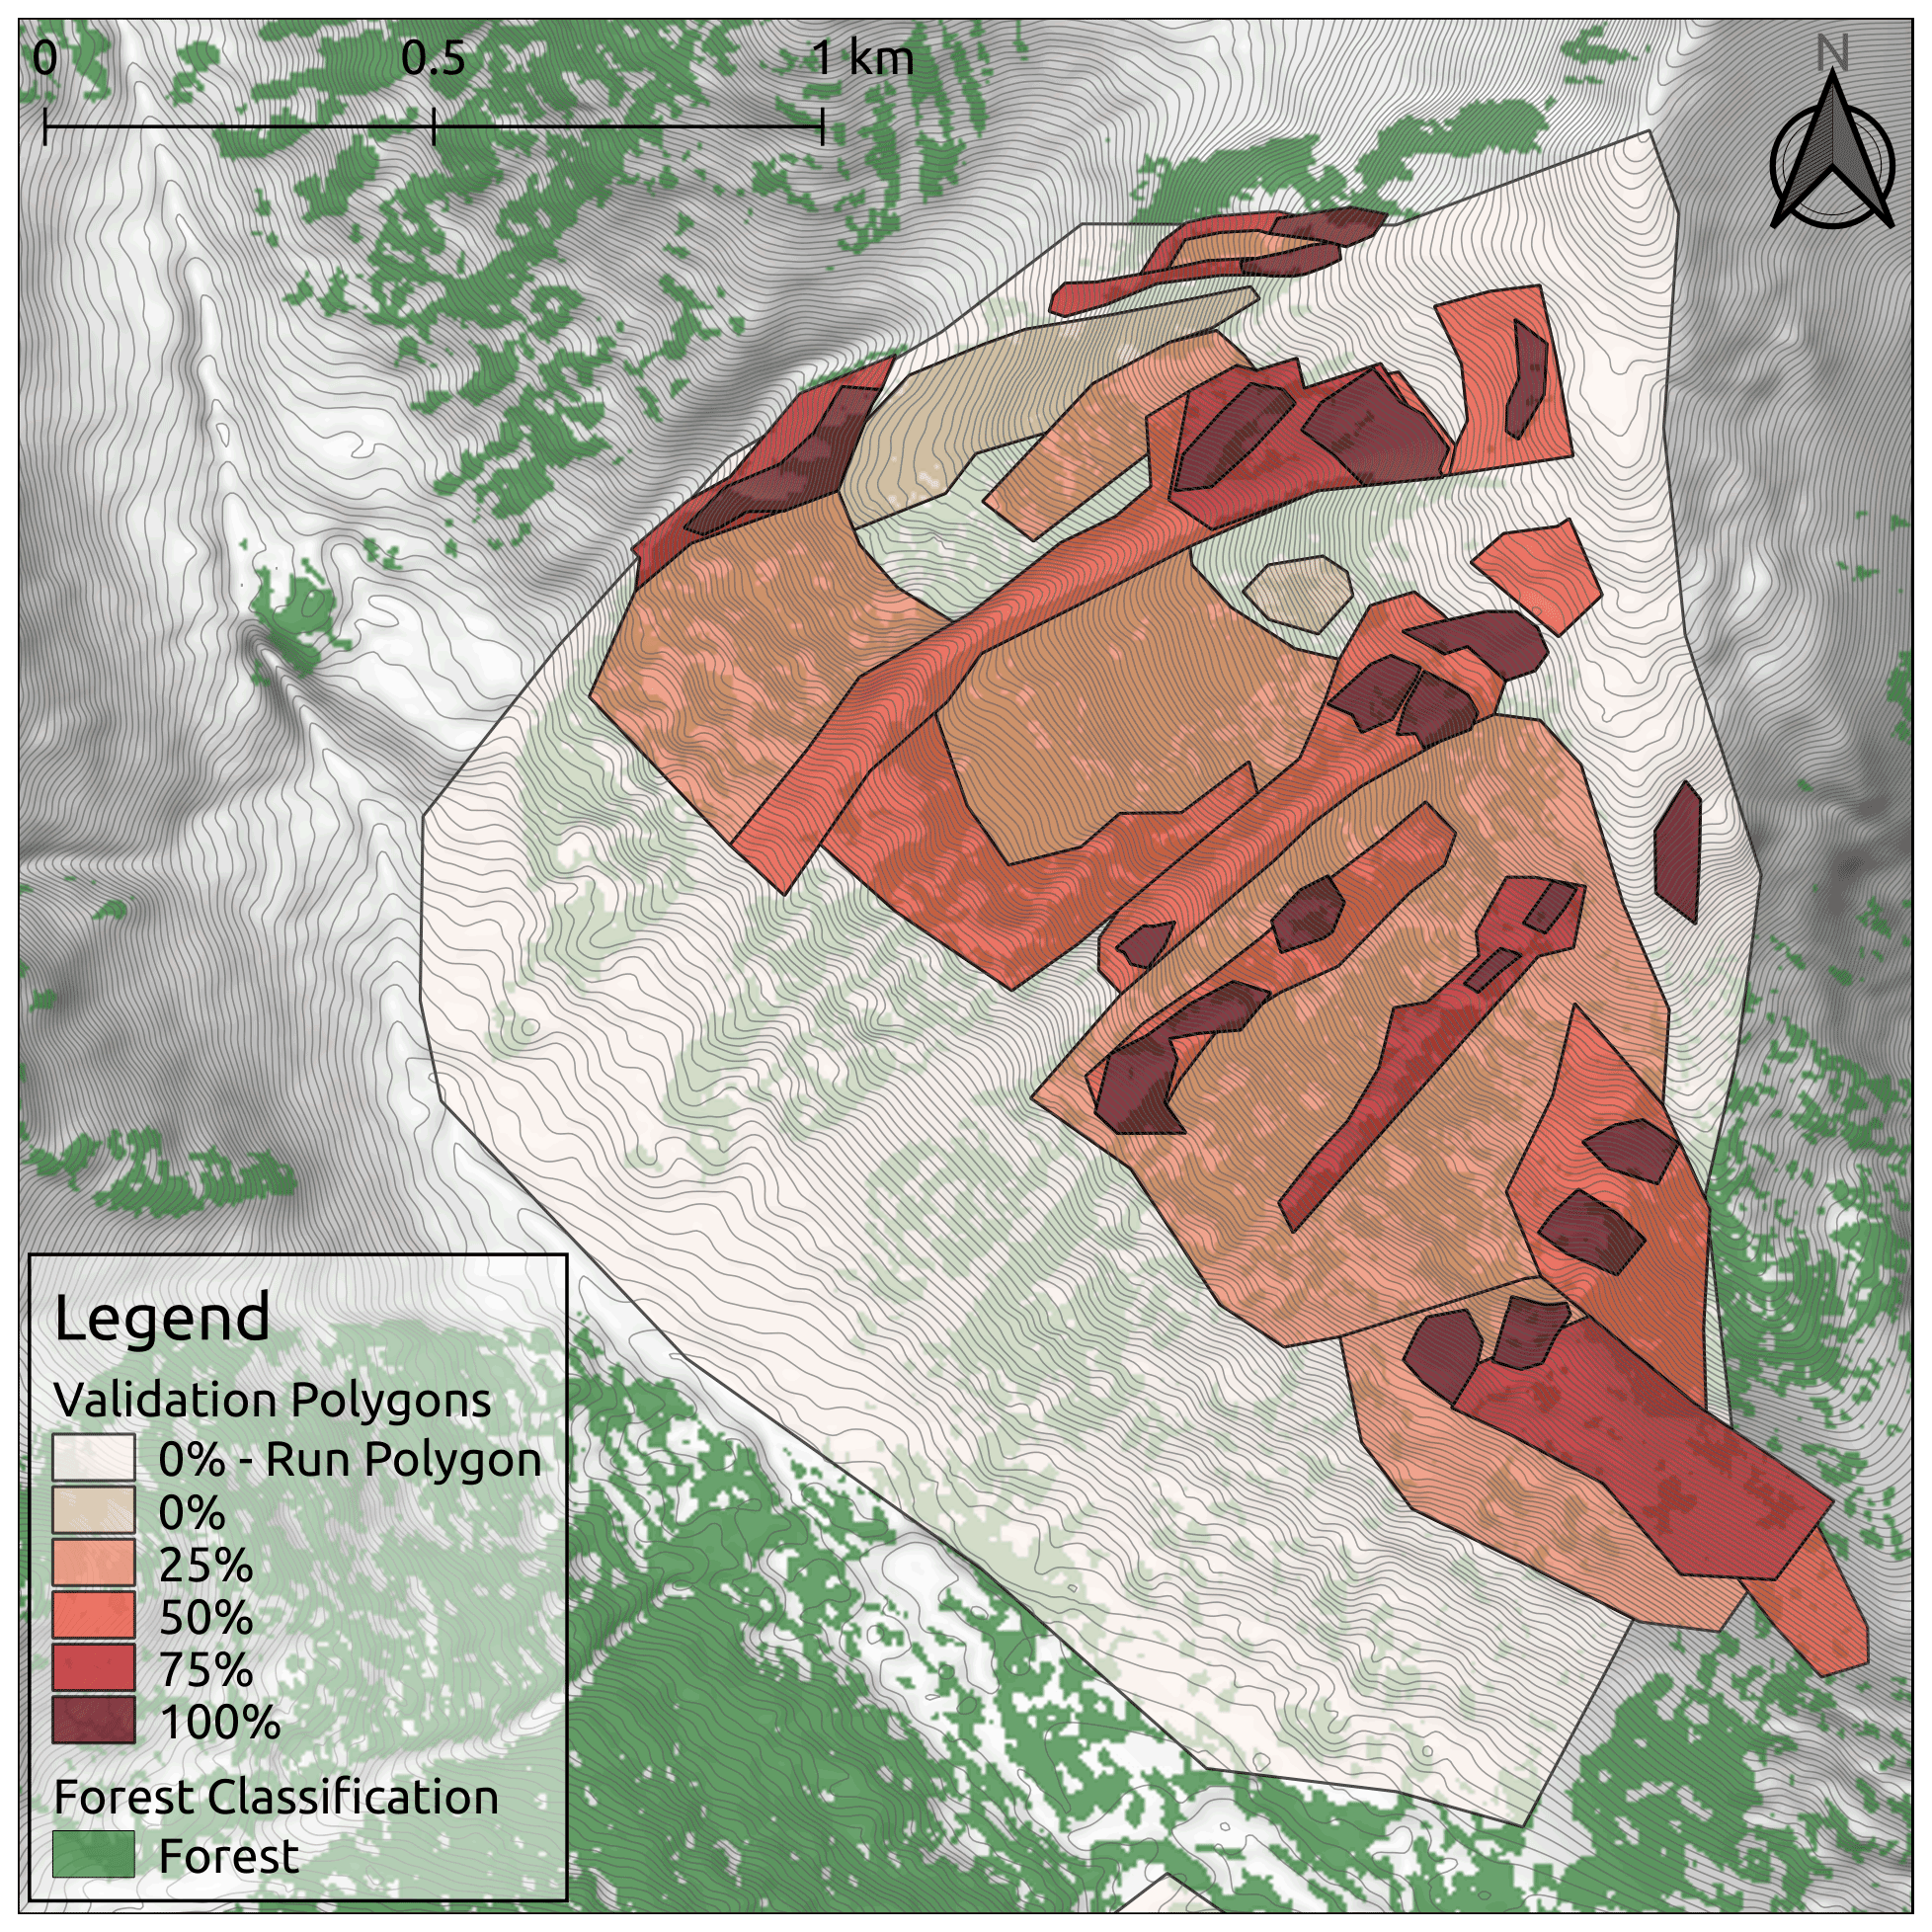
Figure 6Validation polygons from one run at CMH Galena. Polygons are color-coded based on the release area proportion of each polygon. Forest data created using Planet Labs RapidEye imagery (Planet Team, 2017).
Our final validation dataset consists of 167 polygons across five runs with a total area of 8.42 km2, with sample sizes of 100 %=91, 75 %=23, 50 %=23, 25 %=18, 0 %=7, and run polygons =5. In locations where the polygons overlapped, we retained the highest proportion value of the overlapping polygons. The overlapping region was also clipped from the total area of the lower-probability polygon. Locations within the run polygons that were not explicitly mapped by the guides were assumed not to be release areas. However, our validation approach differentiates between these implied and the explicit 0 % validation polygons because we have more confidence in the latter.
3.4.2 PRA model grid search
In contrast to the raster-based validation approach of Bühler et al. (2018), our validation dataset requires analysis on the scale of individual polygons. Since we do not know the explicit locations of the release areas in polygons with release area proportions of 25 %, 50 %, or 75 %, we cannot directly compare the PRA model output to the validation polygons on a pixel-by-pixel basis. Instead, we have to compare the total area within each polygon that is considered a PRA by the model to the proportion provided by the local guides. To calculate the PRA error we subtracted the proportion of the polygon that the PRA model determines as a release area (0 %–100 %) from the release area proportion determined by the guides (0 %, 25 %, 50 %, 75 %, 100 %) for each validation polygon. For example, if the PRA model output predicted that 60 % of the area of a validation polygon contains PRA, and the guides designated that 50 % of the area of that polygon contains release areas, then the PRA error would be −10%. This PRA error value is the basis of our grid search process and can range from −100 % to 100 % depending on whether the PRA model overpredicted or underpredicted the guides' estimated release area proportion.
To properly reflect the validation data collection process in our analysis we also need to consider the hierarchical structure of assessment polygons collected from the local guides. The highest-value validation data are the 100 % and 0 % polygons because they provide explicit spatial extents for PRA locations. These polygons are from locations the participating guides are most familiar with and have the highest level of confidence in. We therefore placed more emphasis on PRA model performance in these areas when selecting the optimal inputs. The validation polygons with the greatest uncertainty are the run polygons. They were not explicitly drawn by the guides, and the absence of PRA within these polygons was implicit and not explicitly specified. Hence, the accuracy of these polygons was weighted least in selecting the optimal PRA input parameters.
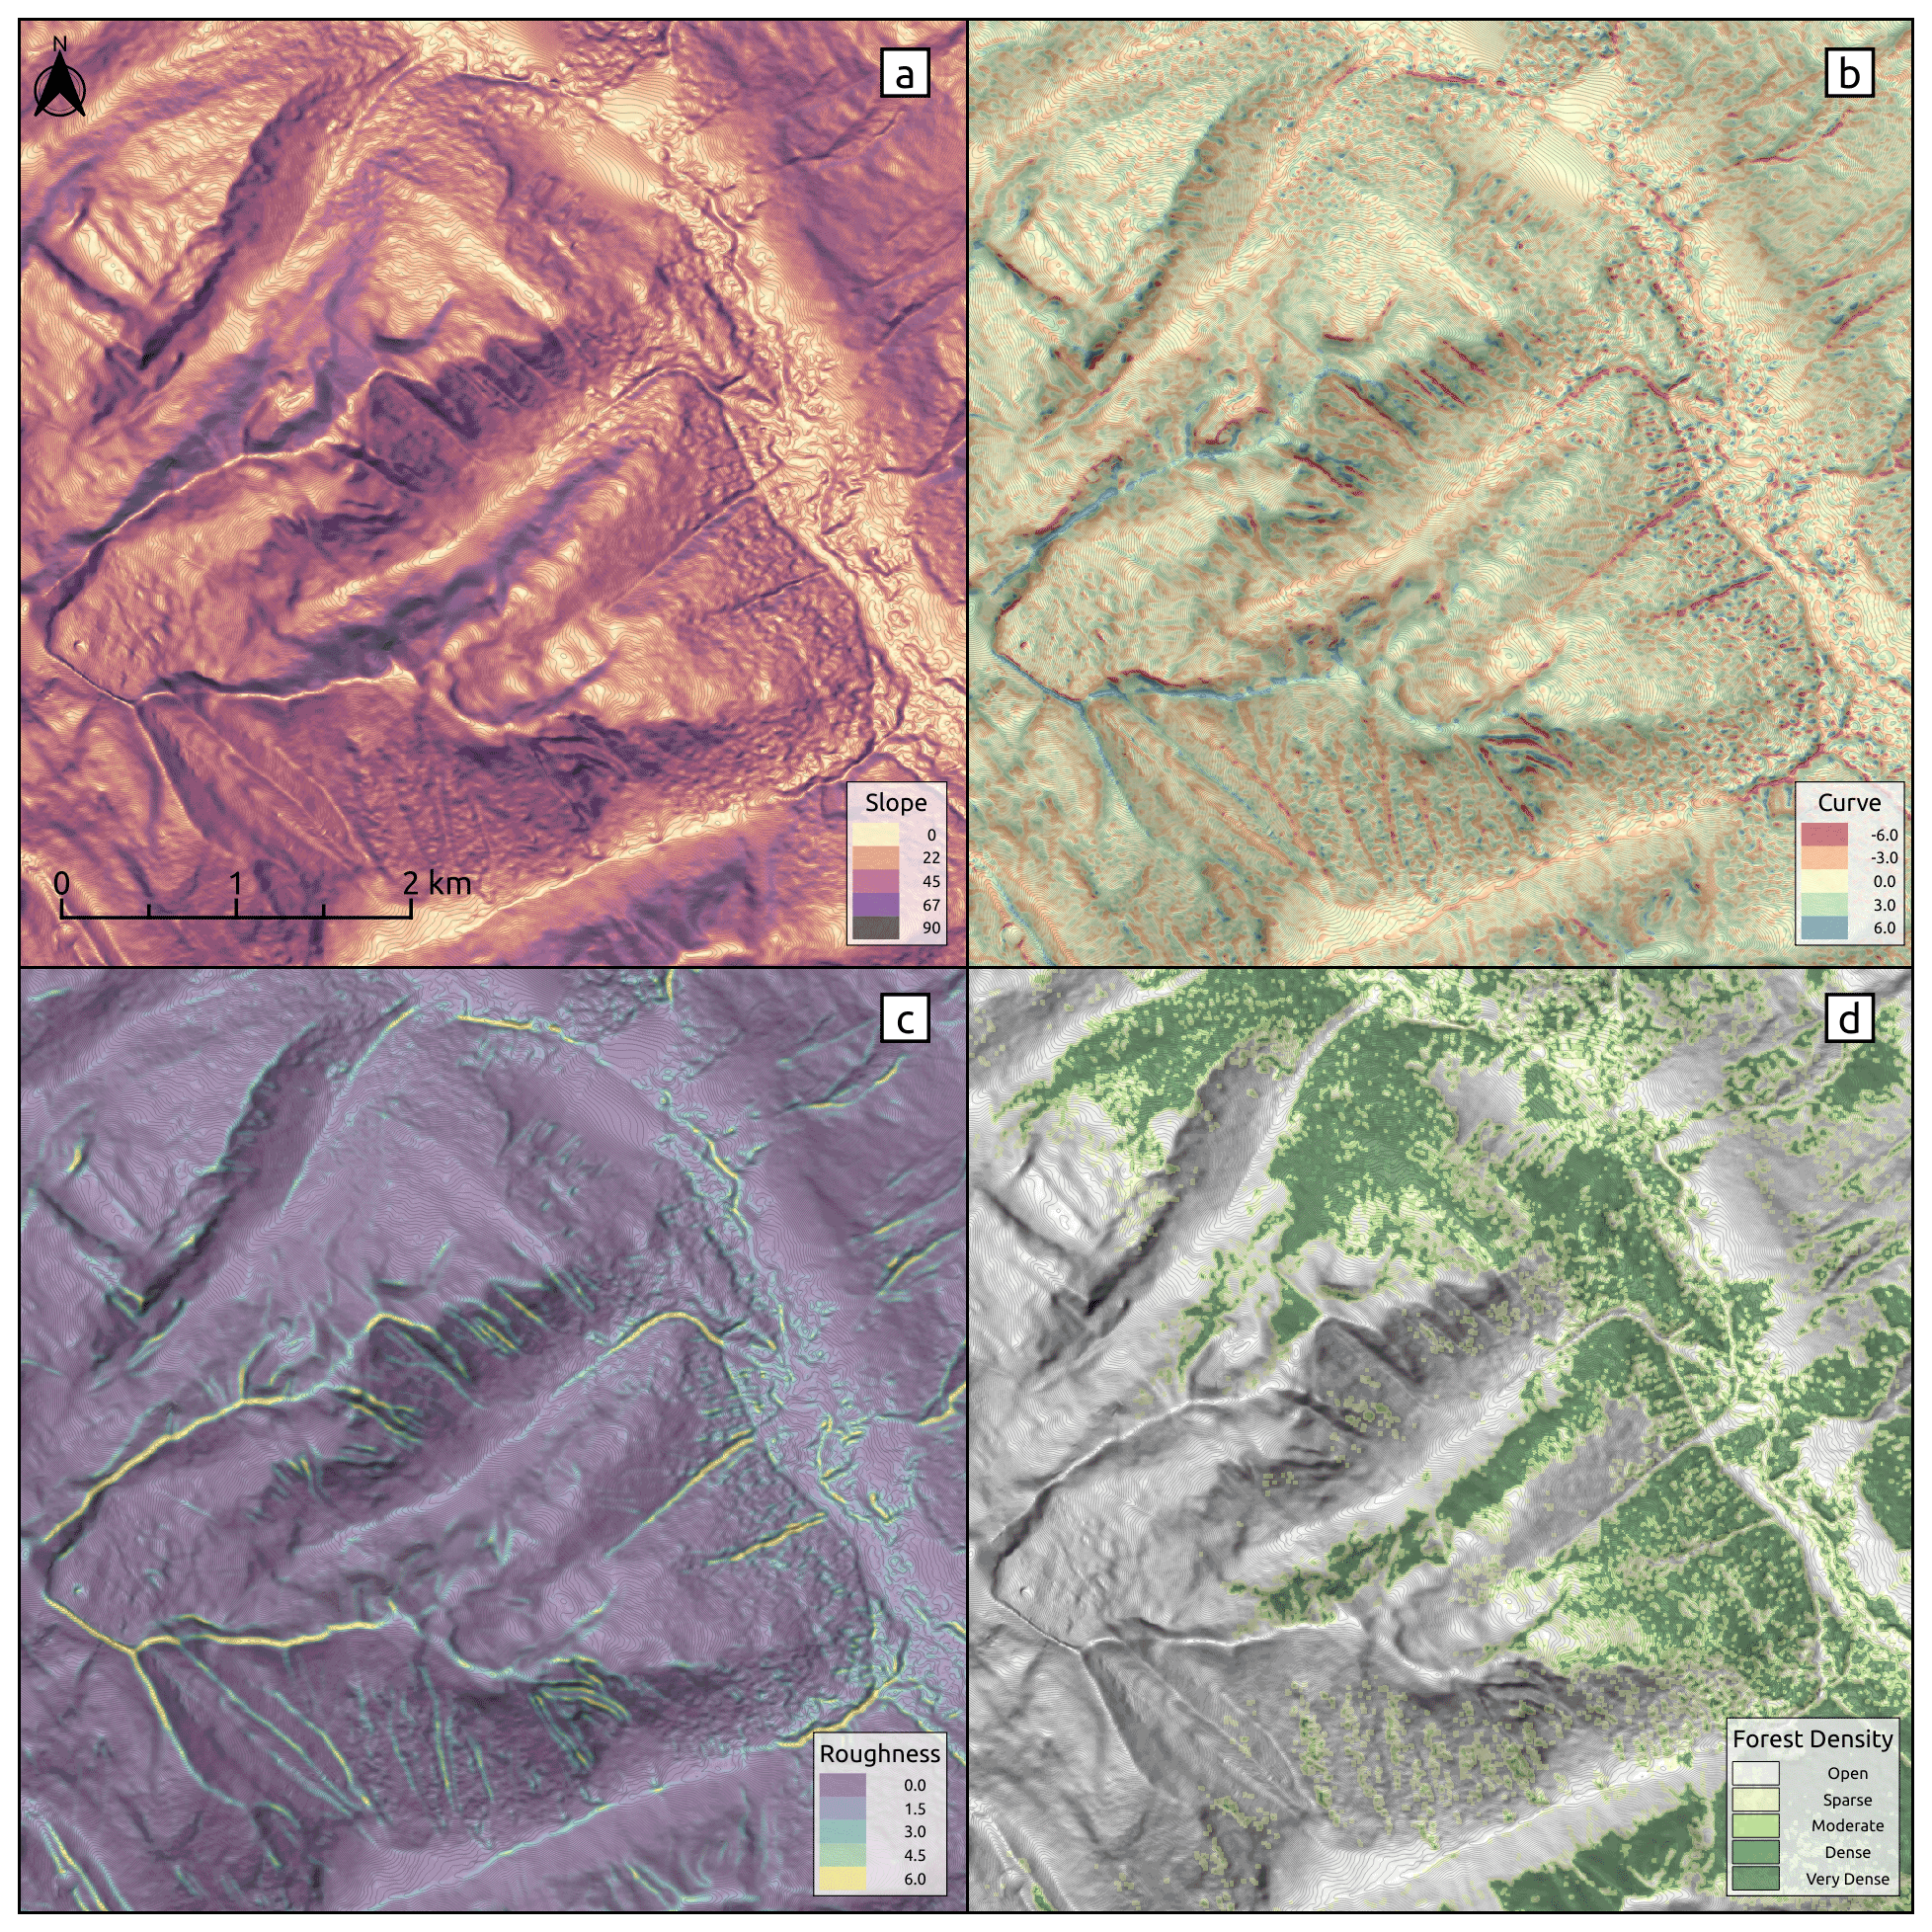
Figure 7PRA model input parameters. Slope angle, curvature, and ruggedness derived from the DEM (a–c) and forest density derived from the forest mask (d). Forest data created using Planet Labs RapidEye imagery (Planet Team, 2017).
To select optimal input parameters for the PRA model we performed a grid search as described by Bühler et al. (2018) using the following values: slope angle minimum (default 30∘, range 20–40∘), slope angle maximum (default 60∘, range 45–65∘), ruggedness window (default 9, range 3–15), ruggedness maximum (default 6.0, range 0.5–10.0), curvature maximum (default 6.0, range 0.5–10.0), forest density (default NA, range 0–4), forest slope scalar (default NA, range 0.0–2.0) (Table 1). It is computationally not feasible to test all possible combinations of input parameters; therefore we used a set of default parameters from Bühler et al. (2018) as a baseline and iterated over each parameter to analyze the impact on the accuracy of the model. Based on validation using the guide polygons we systematically updated the default parameters to optimize the PRA model accuracy for our study area (Fig. 1, Step 3c). The input parameters slope angle minimum, slope angle maximum, ruggedness window, ruggedness maximum, and curvature maximum are derived from the DEM (Fig. 7a–c). The forest density input parameter is derived from the forest mask (Fig. 7d).
Table 1Grid search input parameter values. Optimized input parameters indicate that the grid search led us to change the default input parameter to a value that improved the PRA model accuracy for our study area.
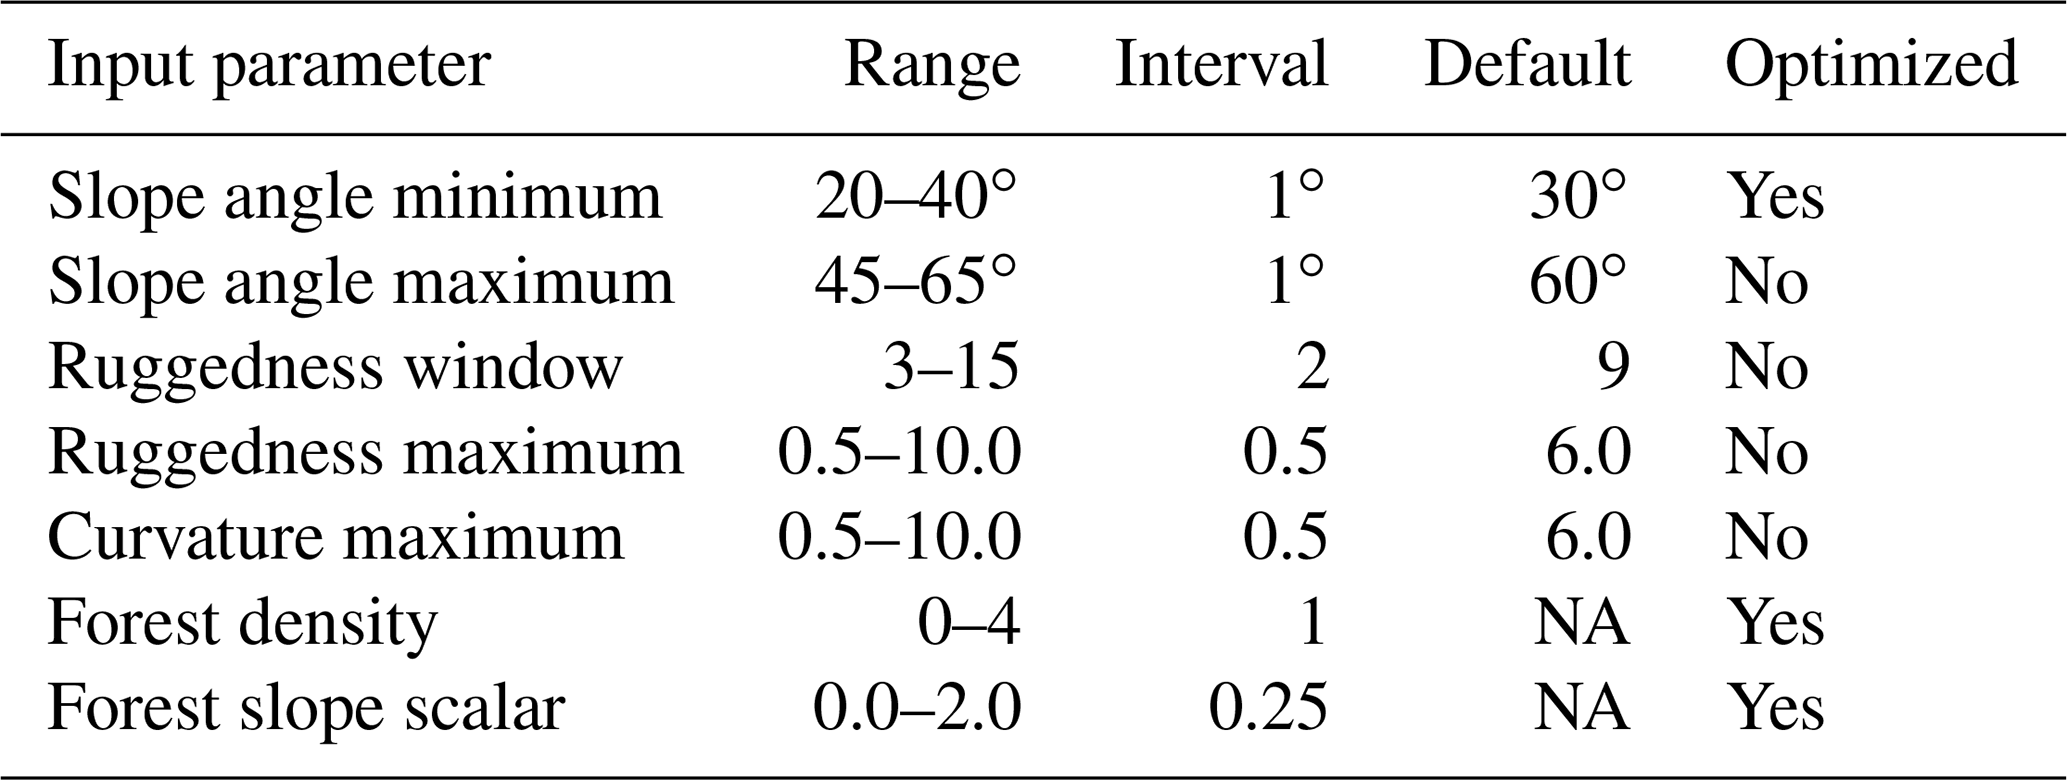
NA: not available.
Selecting the optimal set of input parameters did not rely on any single statistic. Each PRA model iteration was compared using the mean absolute error (MAE), mean bias error (MBE), proportion of accurate polygons, and proportion of underestimated and overestimated errors. MAE values can range from 0 to 100, with lower values indicating a more accurate model. MBE values can range from −100 to 100, with 0 indicating a balance between positive and negative errors. Polygons were considered accurately predicted if the PRA error was within ±12.5 %, meaning that the areas of the PRA model output and guide estimate were within a 25 % range of each other, which is equivalent to one step in the guides' rating scale (0 %, 25 %, 50 %, 75 %, 100 %). Underestimated and overestimated polygons are defined as having a PRA error greater than ±12.5 %, and polygons with a PRA error greater than ±25 % were considered severely overestimated or underestimated.
The accuracy statistics for each grid search iteration were calculated on the basis of the total number of polygons (n=167). We elected not to weight the statistics based on polygon size because the highest-value validation polygons (0 % and 100 %) are generally the smallest. Selecting the optimal input parameters for our PRA model required evaluating performance across all these statistics and taking the structure of our validation dataset into account.
When selecting the optimal set of input parameters we erred on the side of a model that overestimates the extent of potential avalanche release areas, which is indicated by a negative MBE. We consider this an appropriate approach because the guides' polygons reflect only the avalanche conditions that they have experienced and recall. Despite their multiple decades of experience, the guides have not witnessed all potential combinations of snowpack conditions, which could cause avalanche release in uncommon areas. In contrast, the PRA model is a terrain-based tool which aims to identify locations in the study area which have the potential for avalanche release independent of snowpack conditions.
Since the context of the input data, parameter settings, and output from the original model are vital for evaluating the performance of our updated version of the PRA model, we combine the results and discussion into a single section. After presenting and commenting on the results, we conclude this section with an evaluation of some likely sources of error for our updated PRA model and share our thoughts on the limitations of a purely satellite-remote-sensing-based method for capturing forest character in the PRA model.
4.1 Data preparation pipeline
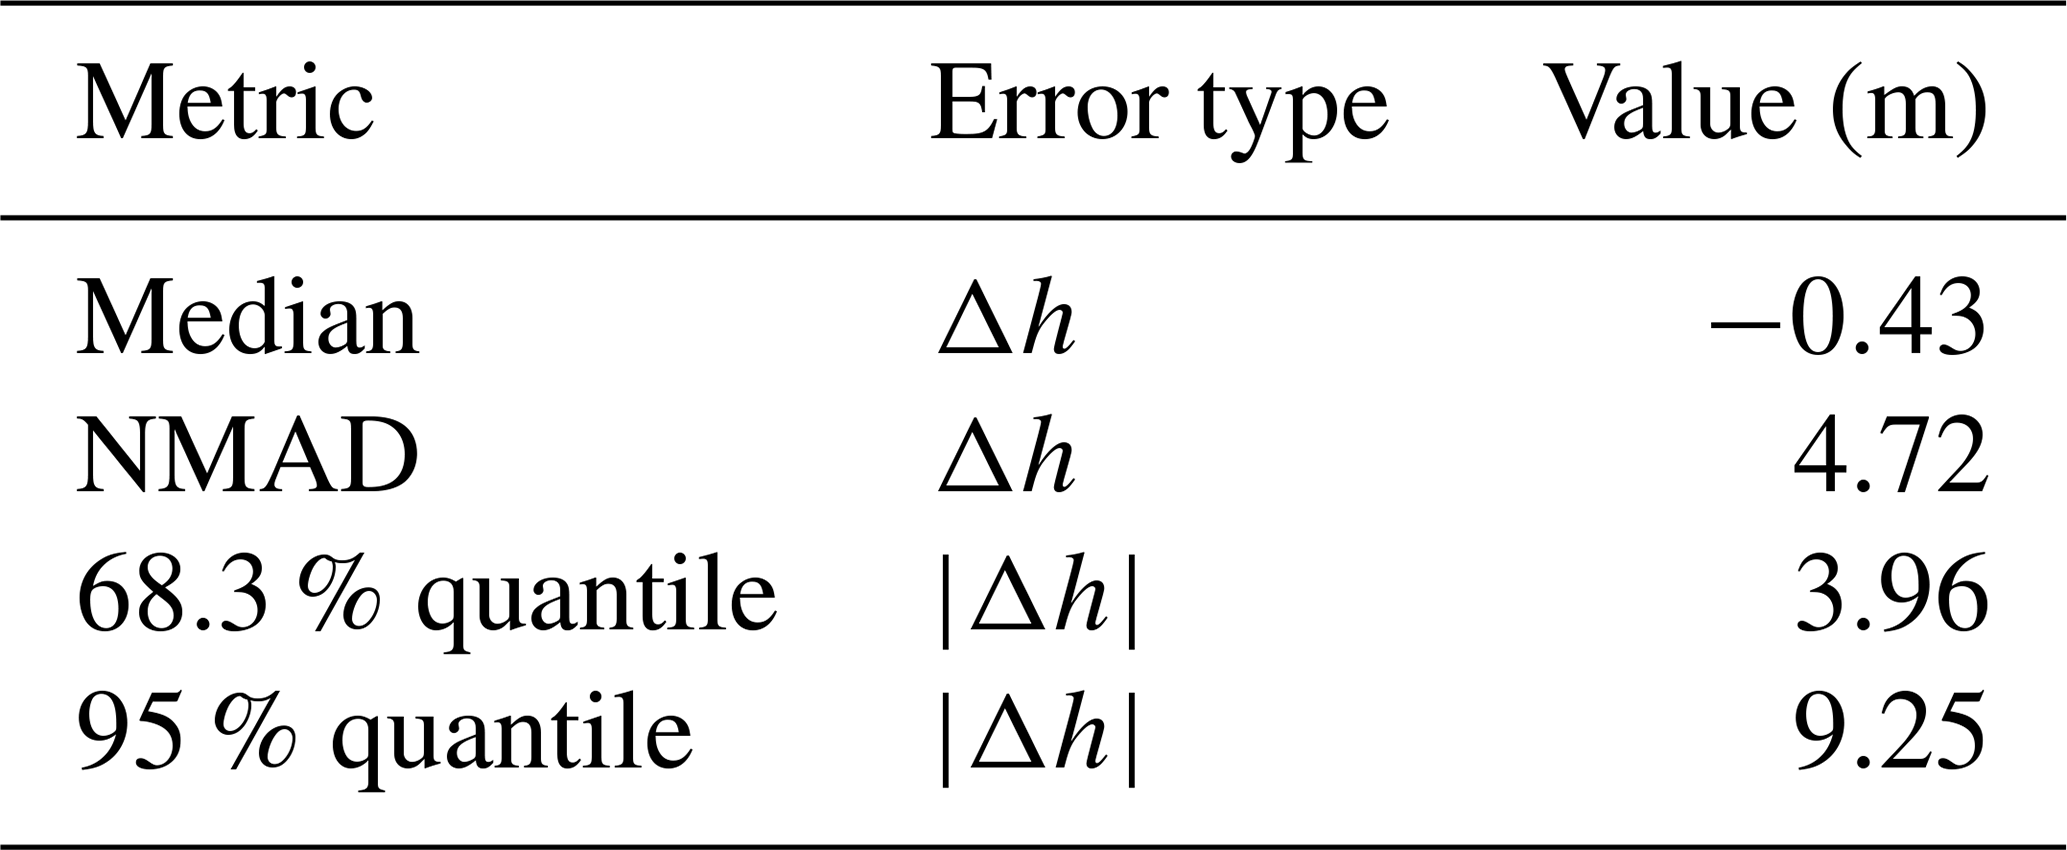
The data preparation pipeline produced a 5 m resolution satellite DSM and forested land cover dataset as input for the PRA model. Using 15 internal checkpoints (ICPs), the DSM accuracy can be described with a median vertical error of −0.43 m and normalized median absolute deviation (NMAD) of 4.72 m (Table 2). These accuracy metrics indicate good performance of the stereo DSM method, especially considering the rugged mountainous terrain across our study area and close proximity of steep slopes to some of the ICPs. Compared to the best available existing DEM for our study area (18 m resolution CDEM), the SPOT 6 DSM provides vastly improved small-scale terrain feature identification (Fig. 8).
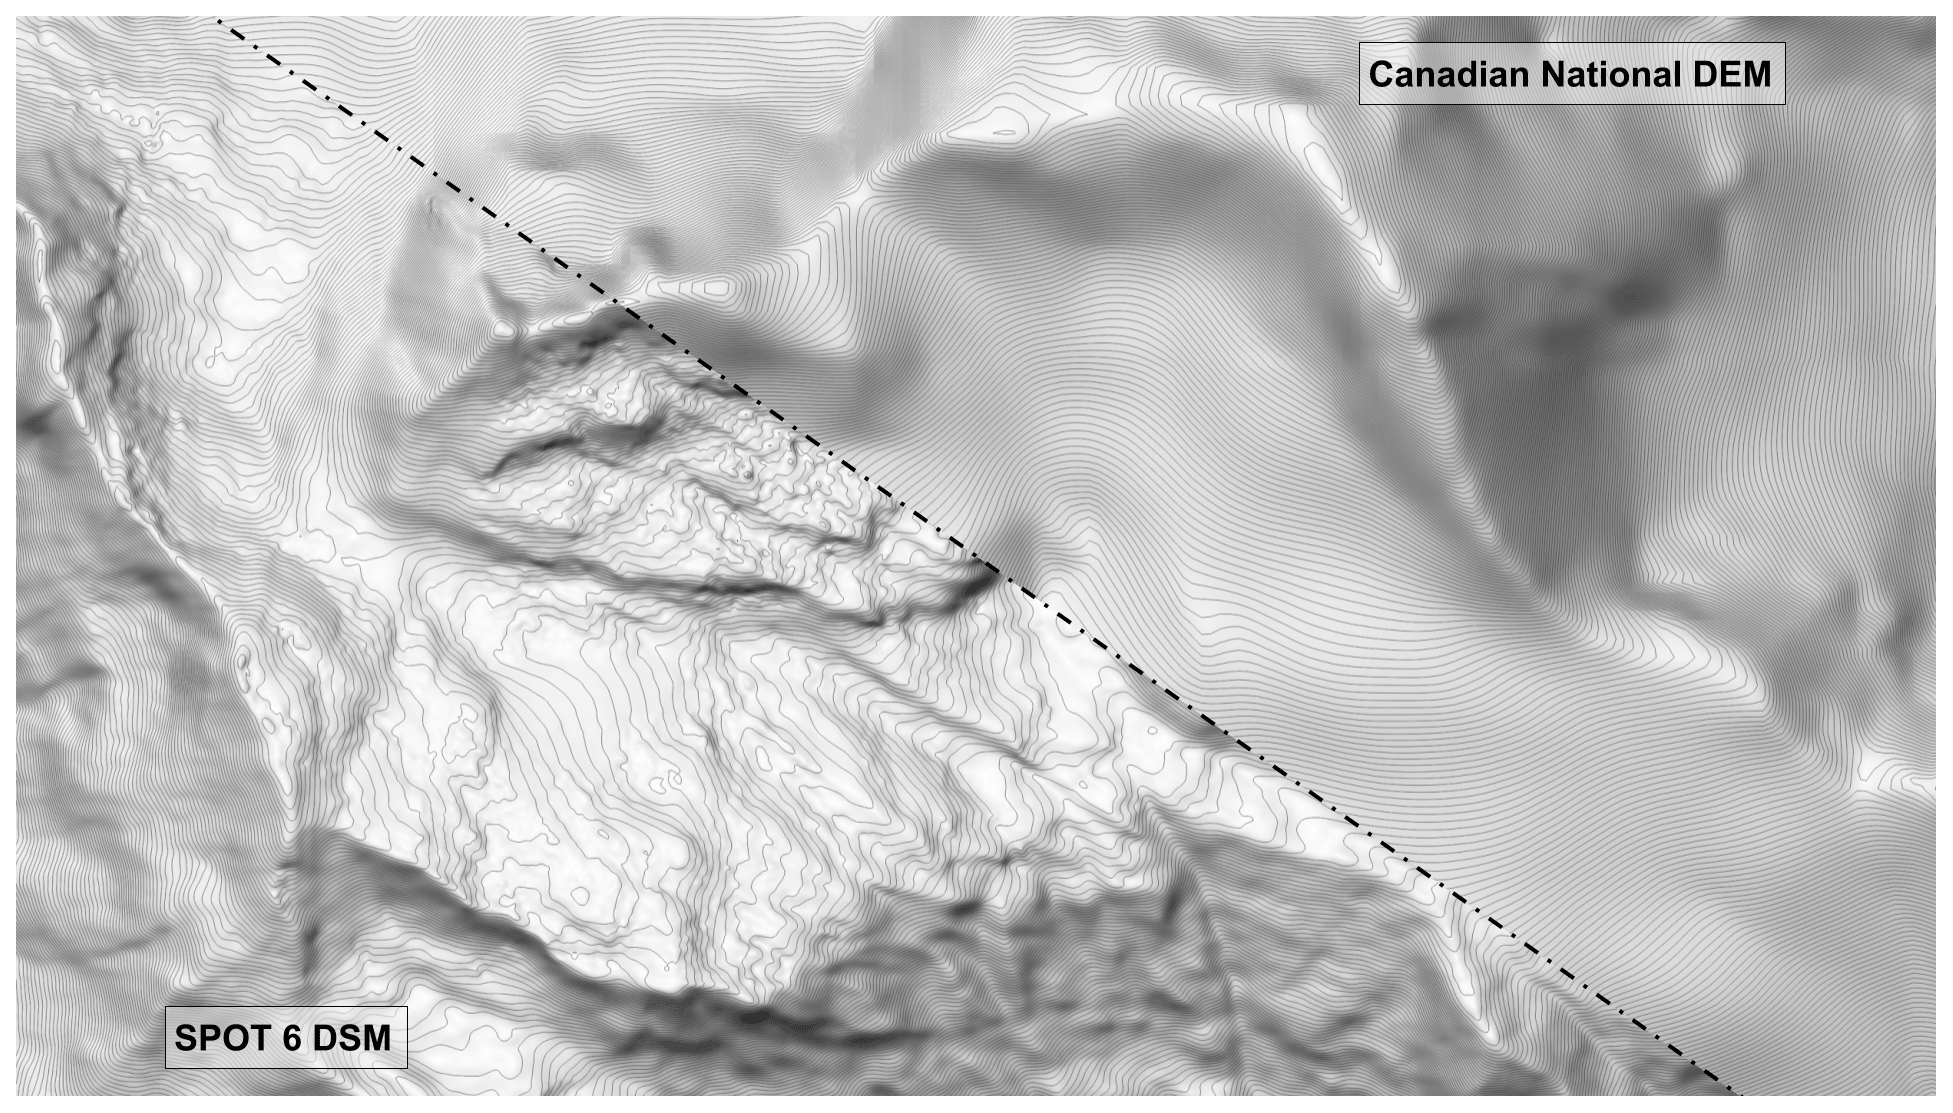
Figure 8Comparison of existing 18 m resolution CDEM to 5 m resolution SPOT 6 satellite stereo DSM, derived from our data preparation pipeline. Canadian DEM data from Natural Resources Canada.
Table 2Accuracy statistics for SPOT 6 satellite stereo DSM based on 15 ICPs. The error type Δh indicates the change in height between the ICP and the DSM surface.
The forested land cover classification that emerged from our random forest analysis yielded an overall accuracy of 98.88 % based on 253 training polygons (12.0 km2). The area under the receiver operating characteristic curve (AUC) is 99.89 %. The classification feature importance showed heavy reliance on the red edge (59.8 %), NDWI (15.2 %), and green (14.9 %) bands. This indicates that the red edge band was by far the most important imagery band to delineate forested pixels.
Creating the forested land cover classification using the same satellite imagery as the stereo DSM processing would be the most efficient workflow for producing the necessary input datasets for PRA modeling because it uses the fewest possible input data and thereby minimizes data acquisition costs and effort. However, in our study, we elected to utilize RapidEye imagery as an alternative due to better overall lighting conditions and improvements in accuracy, primarily due to the red edge spectral band. The overall accuracy of our classifier and the feature importance of the red edge band highlight the strength of RapidEye imagery for forest classification modeling.
Our processing pipeline provides a cost-effective approach for creating high-resolution DEM and forested land cover classification data in remote and data-sparse regions. Compared to alternative methods, such as lidar and commercial satellite stereo DEM products, purchasing raw satellite stereo imagery to produce a high-resolution DEM provides significant cost savings and control over the DEM generation settings and produces a DEM product with sufficient accuracy (Kramm and Hoffmeister, 2019; Shean et al., 2016). The primary limitations are the inability to resolve bare-ground terrain features, susceptibility to DEM holes due to cloud cover and lighting conditions, and degree of technical knowhow and computer processing resources required to convert the raw imagery to a DEM product. Despite these limitations, the processing pipeline enhances accessibility for high-resolution PRA modeling in remote regions.
An alternative approach, which has the advantage of decreasing the technical skills required to produce a stereo DEM while still having significant cost saving benefits over lidar, is to purchase an off-the-shelf stereo DEM from a commercial satellite imagery provider. Costs vary greatly depending on resolution, location, and whether archival imagery is available for a given study area. In our case existing DEMs or stereo imagery was not available in our study area, so the added costs of new image acquisition and processing made producing our own DEM more advantageous. Those interested in applying these methods to their own area should carefully evaluate costs of acquiring a 5 m DEM to assess the feasibility of high-resolution PRA modeling.
4.2 Model parameter selection based on grid search
Based on the grid search we determined that the optimal model input values for our study area are slope angle minimum 27∘, slope angle maximum 60∘, curvature maximum 6.0, ruggedness window 9, ruggedness maximum 6.0, forest density 4, and forest slope scalar 1.25. The grid search method that we implemented is based on a set of default input parameters and does not calculate all possible combinations of input parameters in order to reduce the amount of computer resources necessary. Therefore, the results of the grid search are dependent on the selected default parameters. We tested a wide range of potential default parameters for our grid search and used the values from Bühler et al. (2018) as a starting point. We selected the optimal values by visualizing the distribution of the PRA error and plotting the MAE and MBE values for each grid search iteration (Fig. 9).
Due to the high-quality and long-term avalanche observation records used for validation in Bühler et al. (2018), we retained their default parameter values if the grid search did not demonstrate notable improvement in overall accuracy based on the local validation dataset. This was the case for slope angle maximum, ruggedness window, ruggedness maximum, and curvature maximum. The results of our grid search for these parameters are similar to those shown in Fig. 3 of Bühler et al. (2018), with relatively low variation in accuracy across the range of grid search values (Fig. 9b to e). The consistency of these input parameters for both Davos and Galena is likely due to using the same DEM resolution of 5 m and points to the universality of the physical characteristics necessary for avalanche release. In addition, this consistency is a testament to the accuracy of our satellite DSM in comparison to the high-resolution DEM data used in the Davos research.
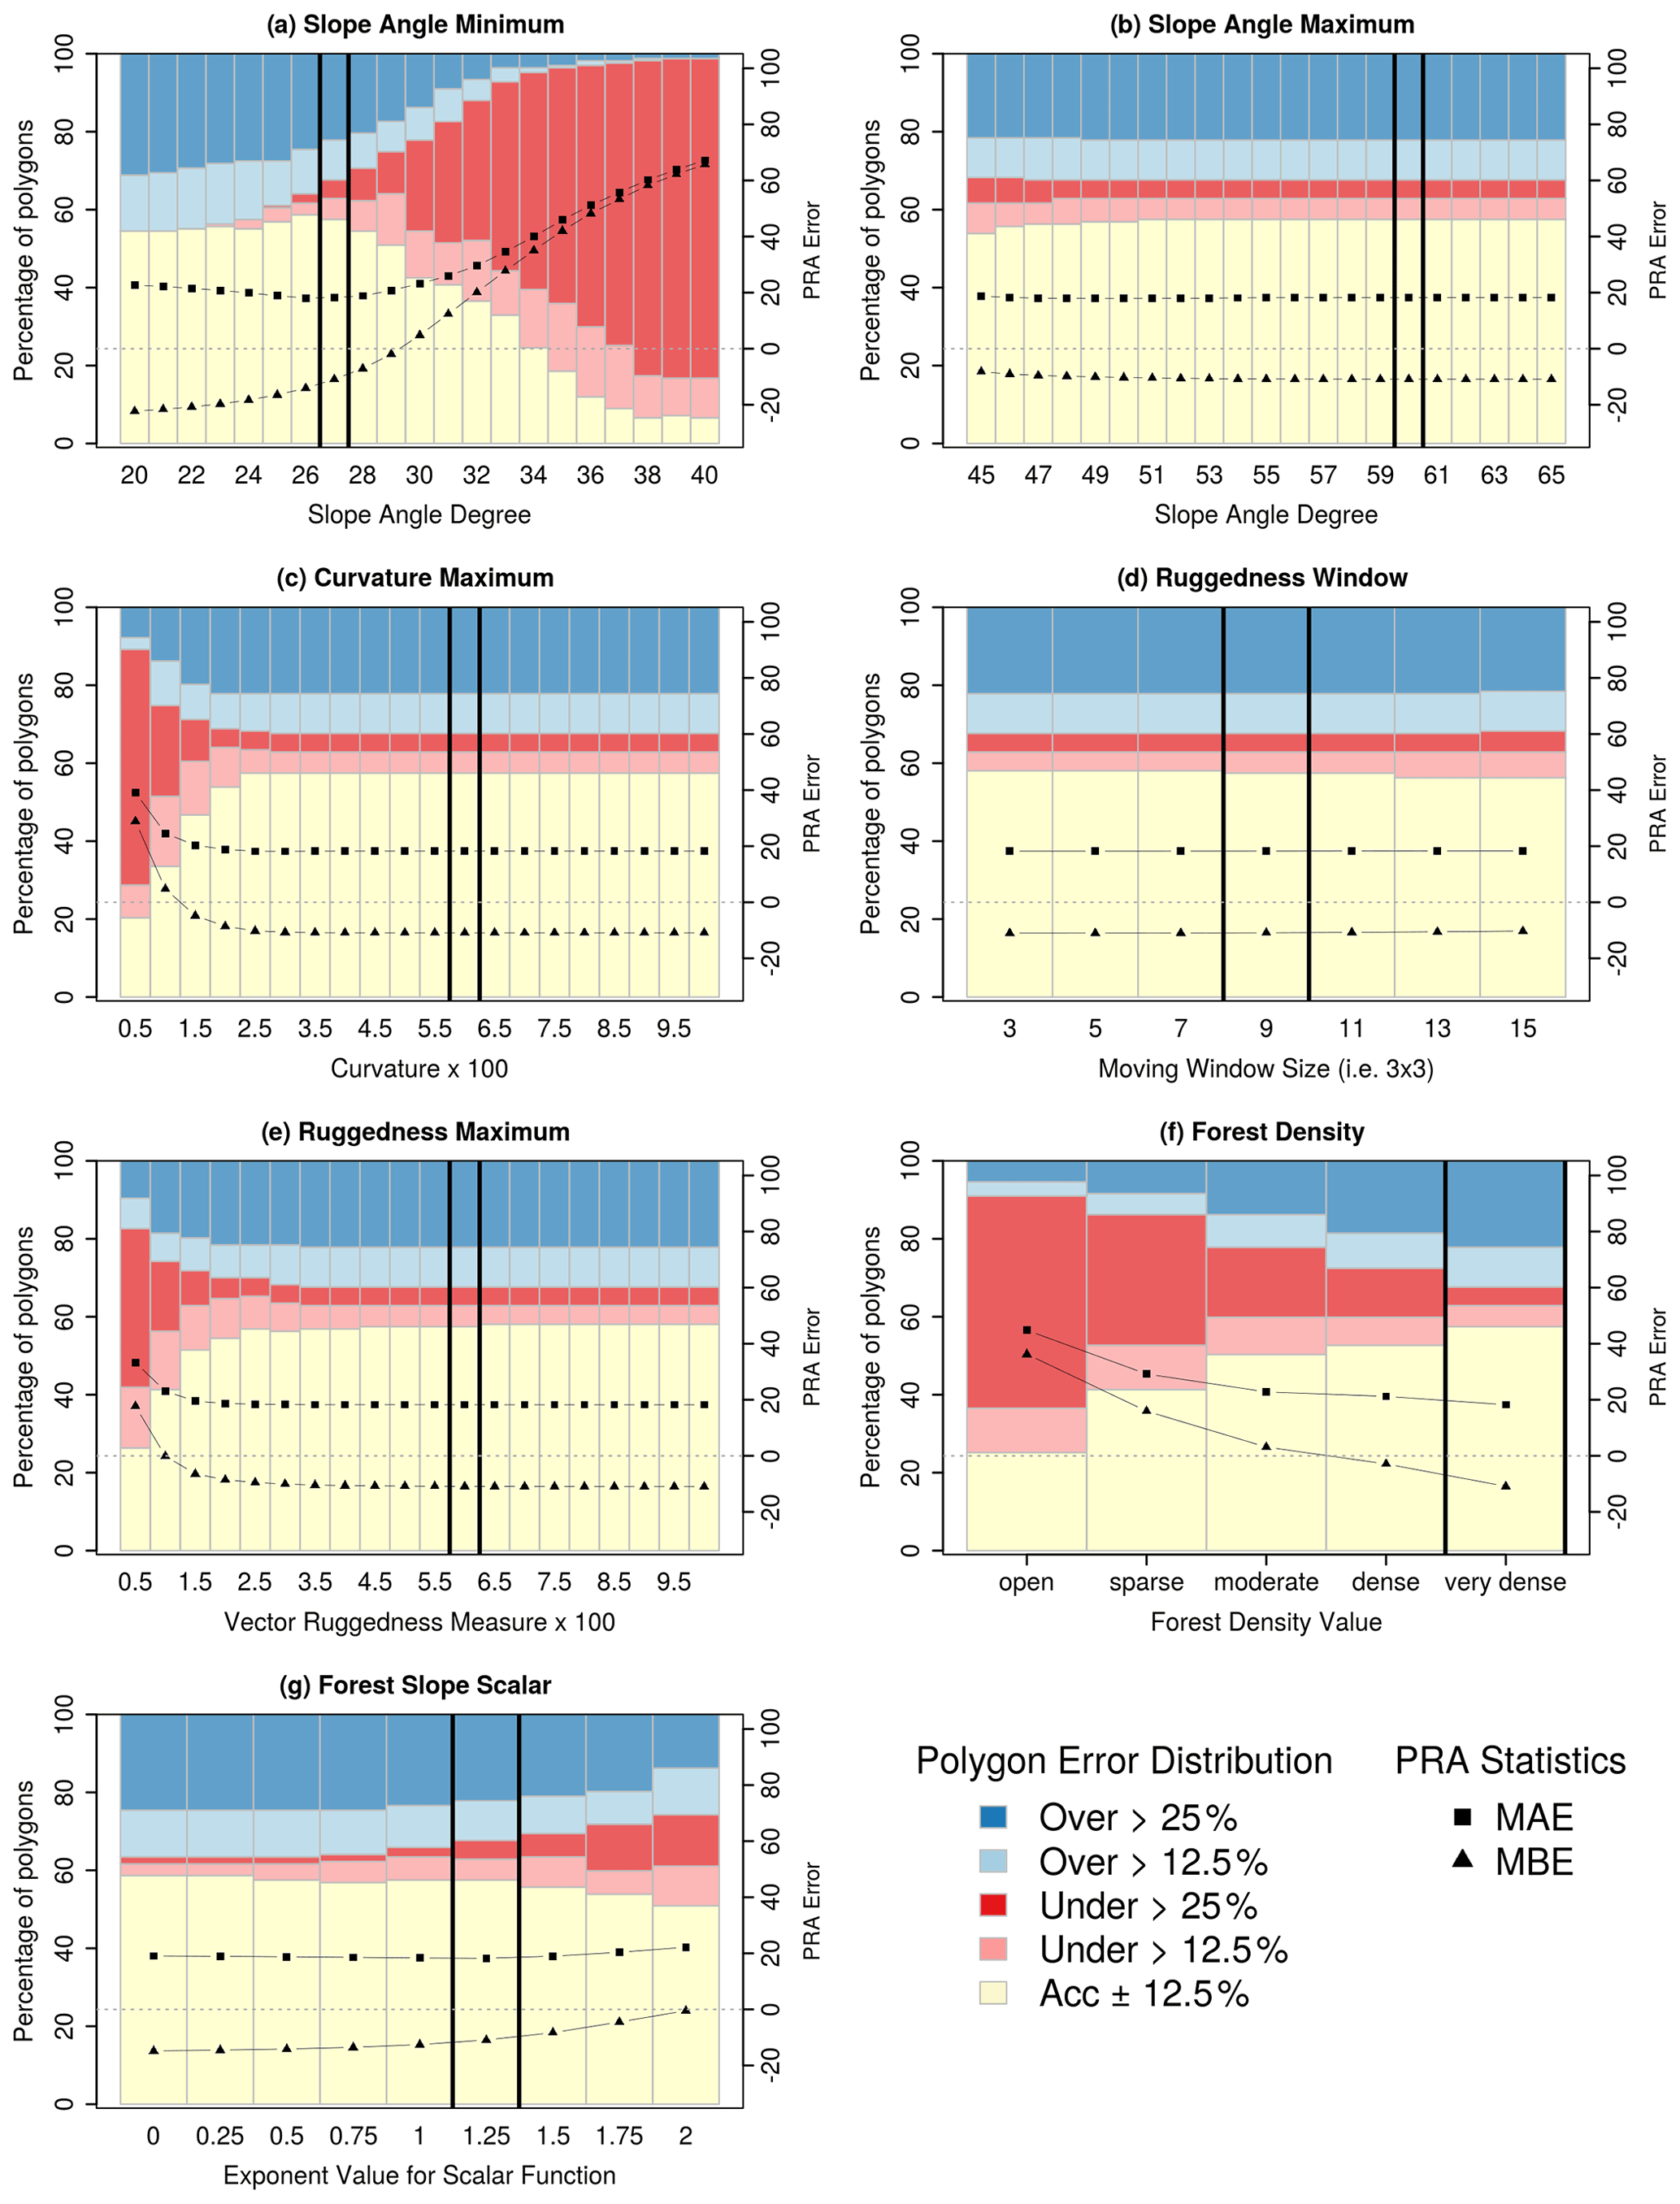
Figure 9Results of PRA model grid search. In each of the panels, the left y axis shows the percentage of polygons in different PRA error classes with colored bars (accurate – yellow, underestimated – red, overestimated – blue). Black squares and triangles show the values of MAE and MBE for each grid search iteration with a horizontal dashed gray line to show the 0 threshold, which corresponds to the right y axis. The vertical black lines indicate the optimized parameter settings.
4.2.1 Slope angle minimum
Slope angle minimum has the largest impact on the performance of the PRA model. Selecting the optimal input parameter required balancing the performance of the PRA model against the different types of validation polygons and considering our target of a frequent avalanche scenario. When considering the entire validation polygon dataset, there is a sharp increase in the percentage of underestimated validation polygons as the slope-angle-minimum threshold increases from 25∘, which indicates that the PRA model progressively excludes observed release areas (Fig. 9a). The MAE minimum of approximately 18 occurs between 26 and 28∘, indicating that these values produce the most accurate versions of the PRA model. The MBE is negative for slope-angle-minimum values below 30∘, with a steep decrease between 26 and 30∘. This shows that decreasing the slope angle minimum below 30∘ creates PRA models that are progressively more biased towards overestimating release areas.
To further analyze the performance of the PRA model we separated the validation polygons based on the validation polygon type; 0 % and 100 % polygons have the highest accuracy with values of slope angle minimum less than 25∘ (Fig. 10a). This trend strongly contrasts the other polygon types (Fig. 10b and c), which have higher percentages of accurate polygons for slope-angle-minimum values >26∘. For 0 % and 100 % polygons the percentage of accurate polygons declines steeply above 26∘, accompanied by an increase in severely underestimated polygons. The MAE and MBE statistics follow a similar trend, with relatively uniform values until 27∘ followed by steeply increasing error rates and positive bias for the remaining grid search inputs.
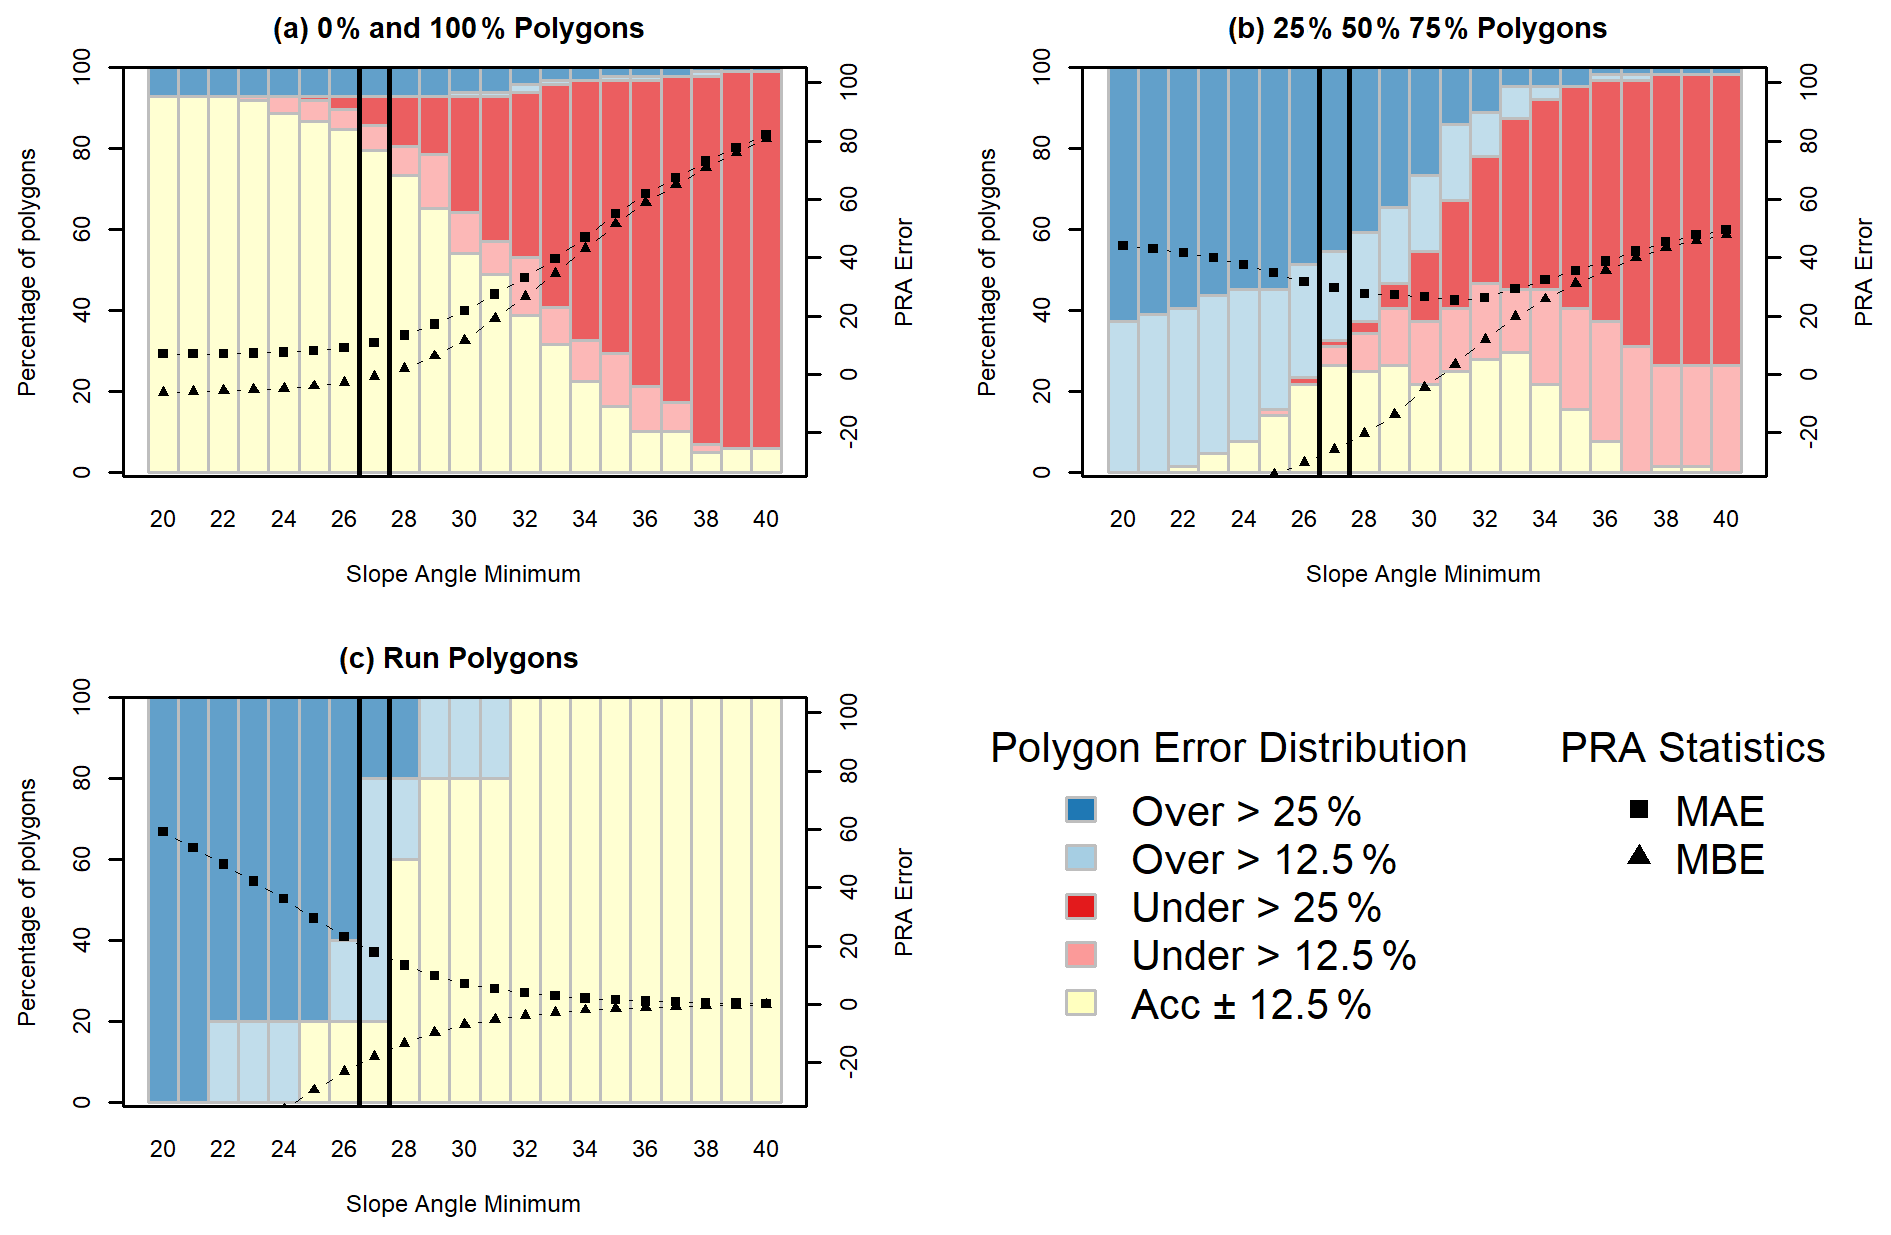
Figure 10Frequent avalanche scenario PRA model grid search results for slope angle minimum with validation polygons split based on the type of polygon.
The 25 %, 50 %, and 75 % polygons (Fig. 10b) have a bimodal distribution for percent of accurate polygons, with slight peaks at 27 and 33∘, accompanied by a steep increase in underestimated polygons from 27∘ upward. The MAE values are at their minimum between 27 and 33∘, with relatively uniform values within that range. Both above and below that range we see increasing MAE values, indicating a less accurate model for this group of polygons. Below 30∘ the MBE values indicate a negative bias and have a steeply negative trajectory. This shows a strong bias toward overestimating PRA area for 25 %, 50 %, and 75 % polygons at lower values of slope angle minimum.
The run polygons (Fig. 10c) have the highest accuracy with slope angle minimum greater than 31∘. However, the percentage of severely overestimated polygons decreases drastically at 27∘. Below 28∘, the MAE and MBE have steeply increasing error rates and negative biases, respectively. Above 28∘ the curves flatten out and trend towards 0 for both MAE and MBE.
Our choice of a 27∘ slope angle minimum strikes a balance between PRA model performance for each polygon type with a priority towards optimizing performance on the 0 % and 100 % polygons, which are the most spatially explicit and have the highest degree of certainty. Setting the slope angle minimum lower than 27∘ would result in too strong of a bias towards minimizing underestimated errors, which is not appropriate given our target of a frequent avalanche scenario. This is illustrated by a decrease in overestimated and severely overestimated polygons at a slope-angle-minimum value of 27∘ for the 25 %, 50 %, and 75 % polygon dataset as well as the run polygons (Fig. 10b and c).
4.2.2 Forest density and forest slope scalar
Determining the optimal value for forest density was the most straightforward of the three parameters we optimized because the percentage of accurate polygons, lowest MAE, and lowest proportion of underestimated polygons all occur at a density value of very dense (4) (Fig. 9f). Setting forest density to very dense (4) means that the PRA model is not restricted by any forest mask, and the forest slope scalar is applied across the full range of forest density values.
Out of the three parameters we optimized, forest slope scalar has the least variation in percentage of accurate polygons, MAE, and MBE across the range of values tested in the grid search (Fig. 9g). This indicates that the PRA model performance is less sensitive to changes in forest slope scalar compared to slope angle minimum and forest density. However, setting this parameter to 1.25 helps to create a more balanced model by decreasing the number of overestimated polygons, which is illustrated in the upward trend of the MBE value.
Similar to slope angle minimum, we see a decrease in the percentage of severely overestimated polygons for the 25 %, 50 %, and 75 % and run polygon datasets for higher values of forest slope scalar (Fig. 11b and c). This is a tradeoff with a slight decrease in the percentage of accurate polygons and increase in percentage of underestimated polygons for the 0 % and 100 % polygons (Fig. 11a). This is reflected in the 0 % and 100 % polygon MBE value of −0.81 at 1.25, which is relatively high compared to the other polygon types. Given our target of a frequent avalanche scenario this tradeoff is justified to create a balanced PRA model and account for the influence of forested terrain on avalanche release.
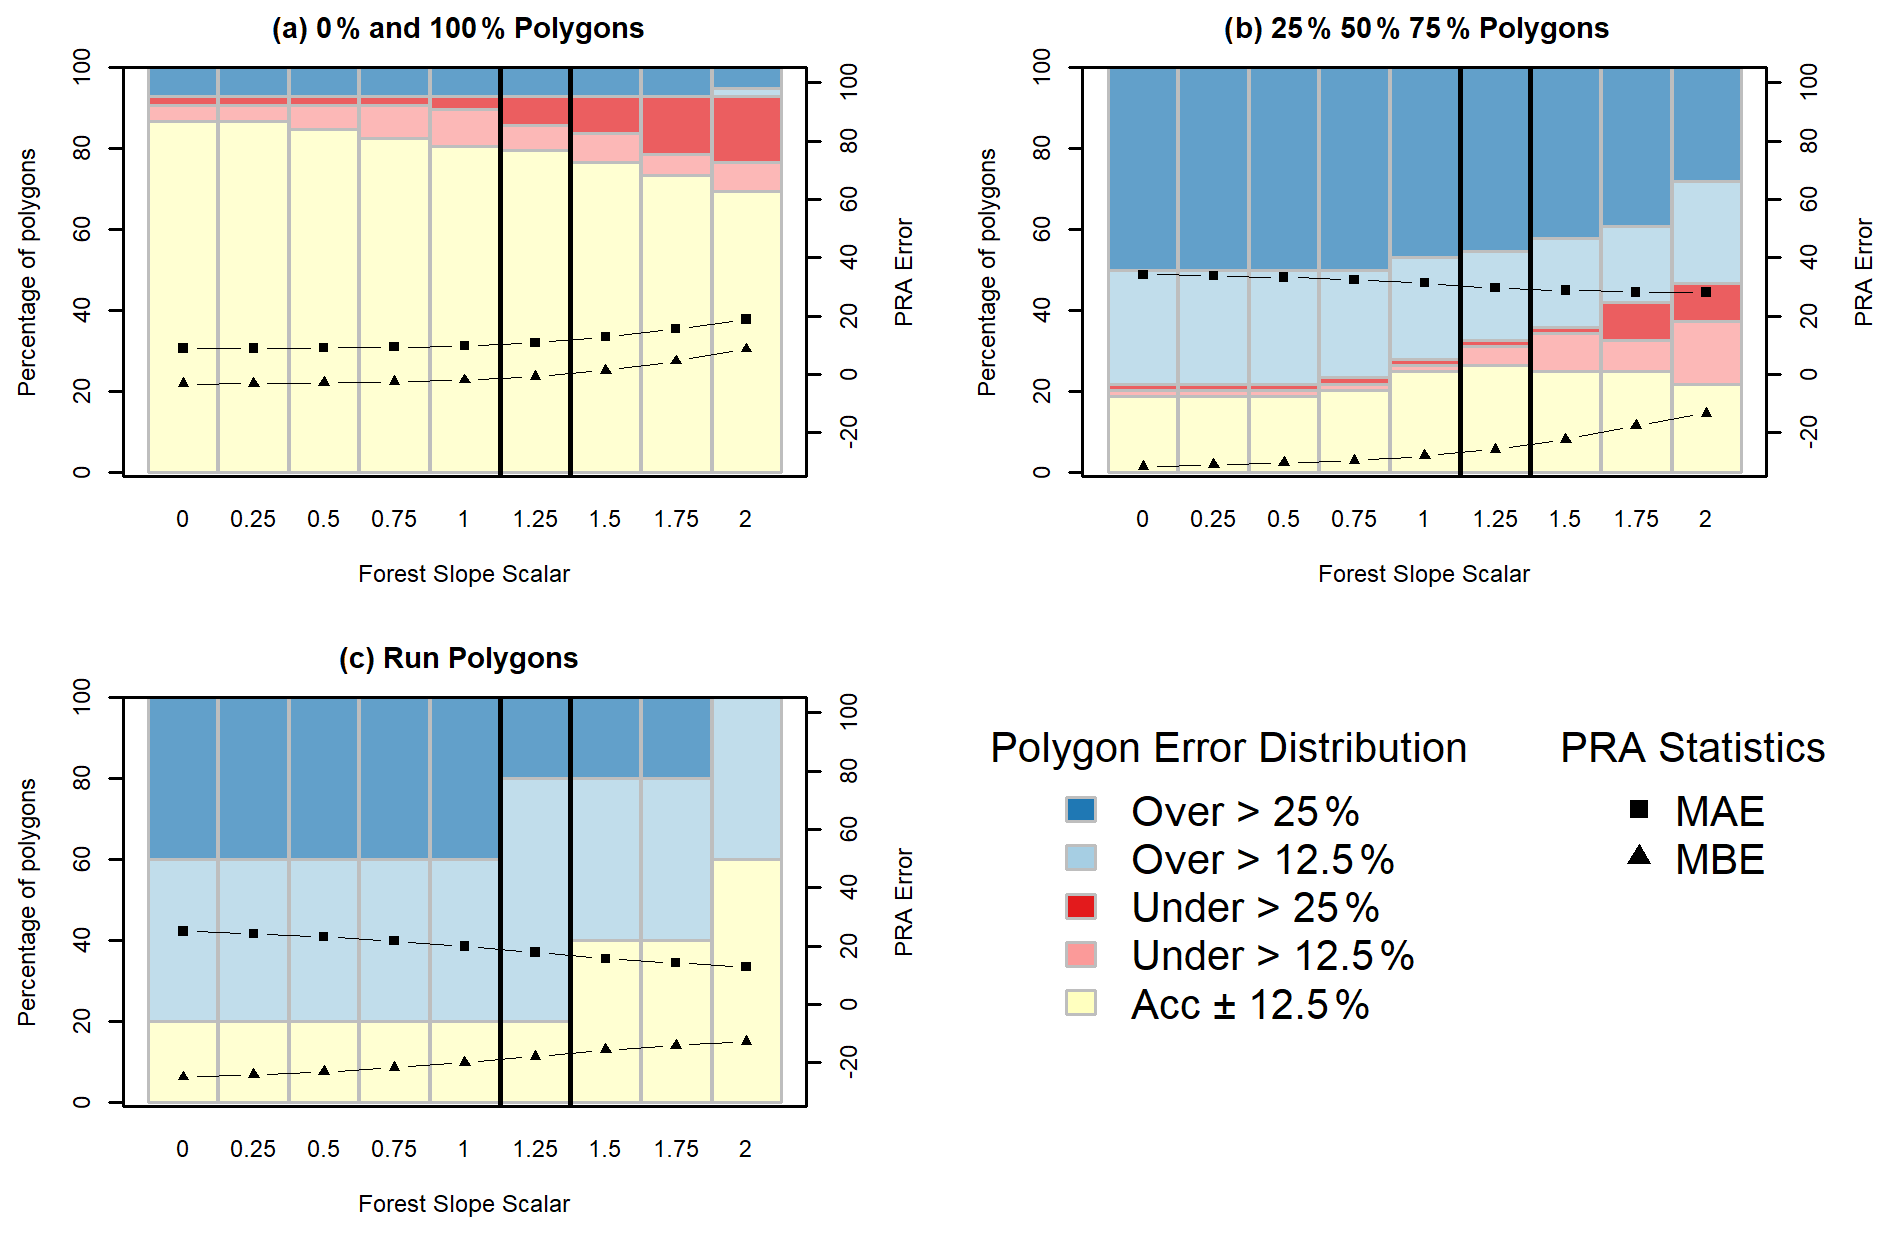
Figure 11Frequent avalanche scenario PRA model grid search results for forest slope scalar with validation polygons split based on the type of polygon.
4.3 PRA model output and comparison
The final PRA model captures 57.5 % (96 of 167) of the consensus validation polygon dataset accurately. Validation polygons are considered accurately predicted if the PRA-estimated area and the guide-estimated release area are within ±12.5 %. The remainder of the validation polygons were either underestimated 10.2 % (17 of 167) or overestimated 32.3 % (54 of 167), compared to the guides' consensus estimates of release area proportion. The MAE value is 18.2, which is a measure of the average error across all polygons. The MBE value is −10.9, which indicates that the PRA model errors are negatively biased towards overestimating release areas. This interpretation of the MBE value aligns with the skewed distribution of underestimated and overestimated polygons.
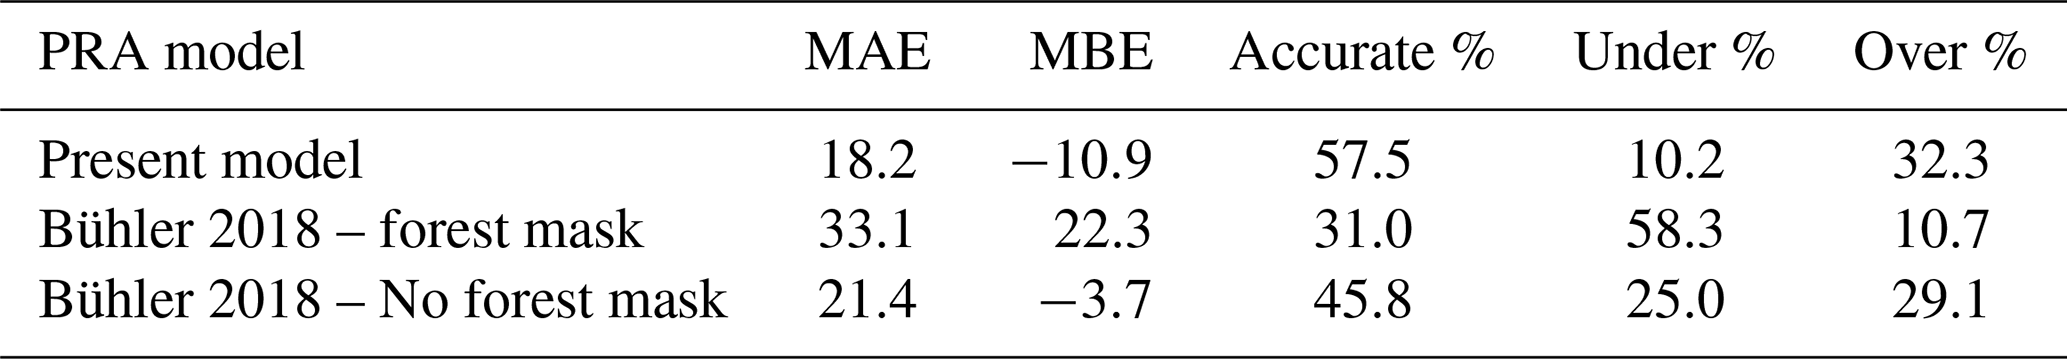
To evaluate whether our parameter optimization demonstrates meaningful improvement, we compared the accuracy statistics of the model using the optimized parameters (present model) to the Bühler et al. (2018) defaults both with and without a forest mask (Table 3). The “Bühler 2018 – forest mask” PRA model does not identify release areas in any terrain identified as forested based on the land cover classification, whereas the “no forest mask” version allows the PRA model to calculate release areas in all terrain. Since the “forest mask” version naturally performs substantially worse in most accuracy statistics due to the large proportion of forested terrain in our study area, we focus the comparison on the “Bühler 2018 – no forest mask” model version.
Overall, we see improvements in the MAE, percent of accurate polygons, and percent of underestimated polygons using the locally optimized input parameters. The MAE for the present model is 18.2 compared to 21.4 for the “Bühler 2018 – no forest mask” version, demonstrating a slight improvement in overall model error (Table 3). The present model improves the percent of accurate polygons by 11.7 percentage points over the “Bühler 2018 – no forest mask” PRA model, which is a substantial improvement given the marginal gains observed in prior PRA model comparisons (Bühler et al., 2018). Similarly, the reduction of 14.8 percentage points for underestimated polygons between the present model and the “Bühler 2018 – no forest mask” demonstrates the improved performance of the grid search optimization. These improvements can be attributed to optimizing the slope-angle-minimum and forest-slope-scalar input parameters using the local validation data.
The tradeoff of the optimized input parameters for the present model is a bias towards overestimation, which is indicated by the MBE of −10.9 compared to −3.7 for the “Bühler 2018 – no forest mask”. This is also shown by the slight increase of 3.2 percentage points in overestimated polygons from the “Bühler 2018 – no forest mask” compared to the present model. Producing a more negatively biased PRA model is in line with our mindset of creating a PRA model that errs on the side of overestimating observed release areas. In our opinion, the benefits of improved percentage of accurate polygons and underestimated polygons outweigh the downside of a slight increase in overestimated polygons.
The present model has a substantially lower slope angle minimum of 27∘ compared to the default value of 30∘ from Bühler et al. (2018), which results in a notable increase in the overall area of the PRA output due to expansion into lower-angle terrain (Fig. 12). The fact that the validation data led us to a substantial decrease in slope angle minimum is likely due to differences in the terrain and snowpack characteristics in our study area compared to the region of Davos in Switzerland, where the model was initially validated. The avalanche character in our study area is prone to persistent avalanche problem types with the most common weak layers being either surface hoar or faceted crystals associated with a crust (Hägeli and McClung, 2003; Haegeli and McClung, 2007; Shandro and Haegeli, 2018). As a weak layer, surface hoar can release at lower slope angles and has increased potential to propagate across terrain features compared to other weak layer types (McClung and Schaerer, 2006). Despite our aim of excluding outlier release areas with extremely low slope angles that are only capable of producing avalanches under very specific snowpack conditions from the validation dataset in order to target a more frequent avalanche scenario, the widespread influence of surface hoar as a weak layer in our study area still contributes to an overall lower minimum slope angle threshold. The fact that our validation dataset and grid search approach produced a PRA model that also aligns with our theoretical understanding of the snowpack properties in our study area is an encouraging result. However, in terrain within the study area that is not prone to surface hoar development, such as alpine terrain with a high degree of wind and sun exposure, our PRA model is likely to overestimate PRA extent.
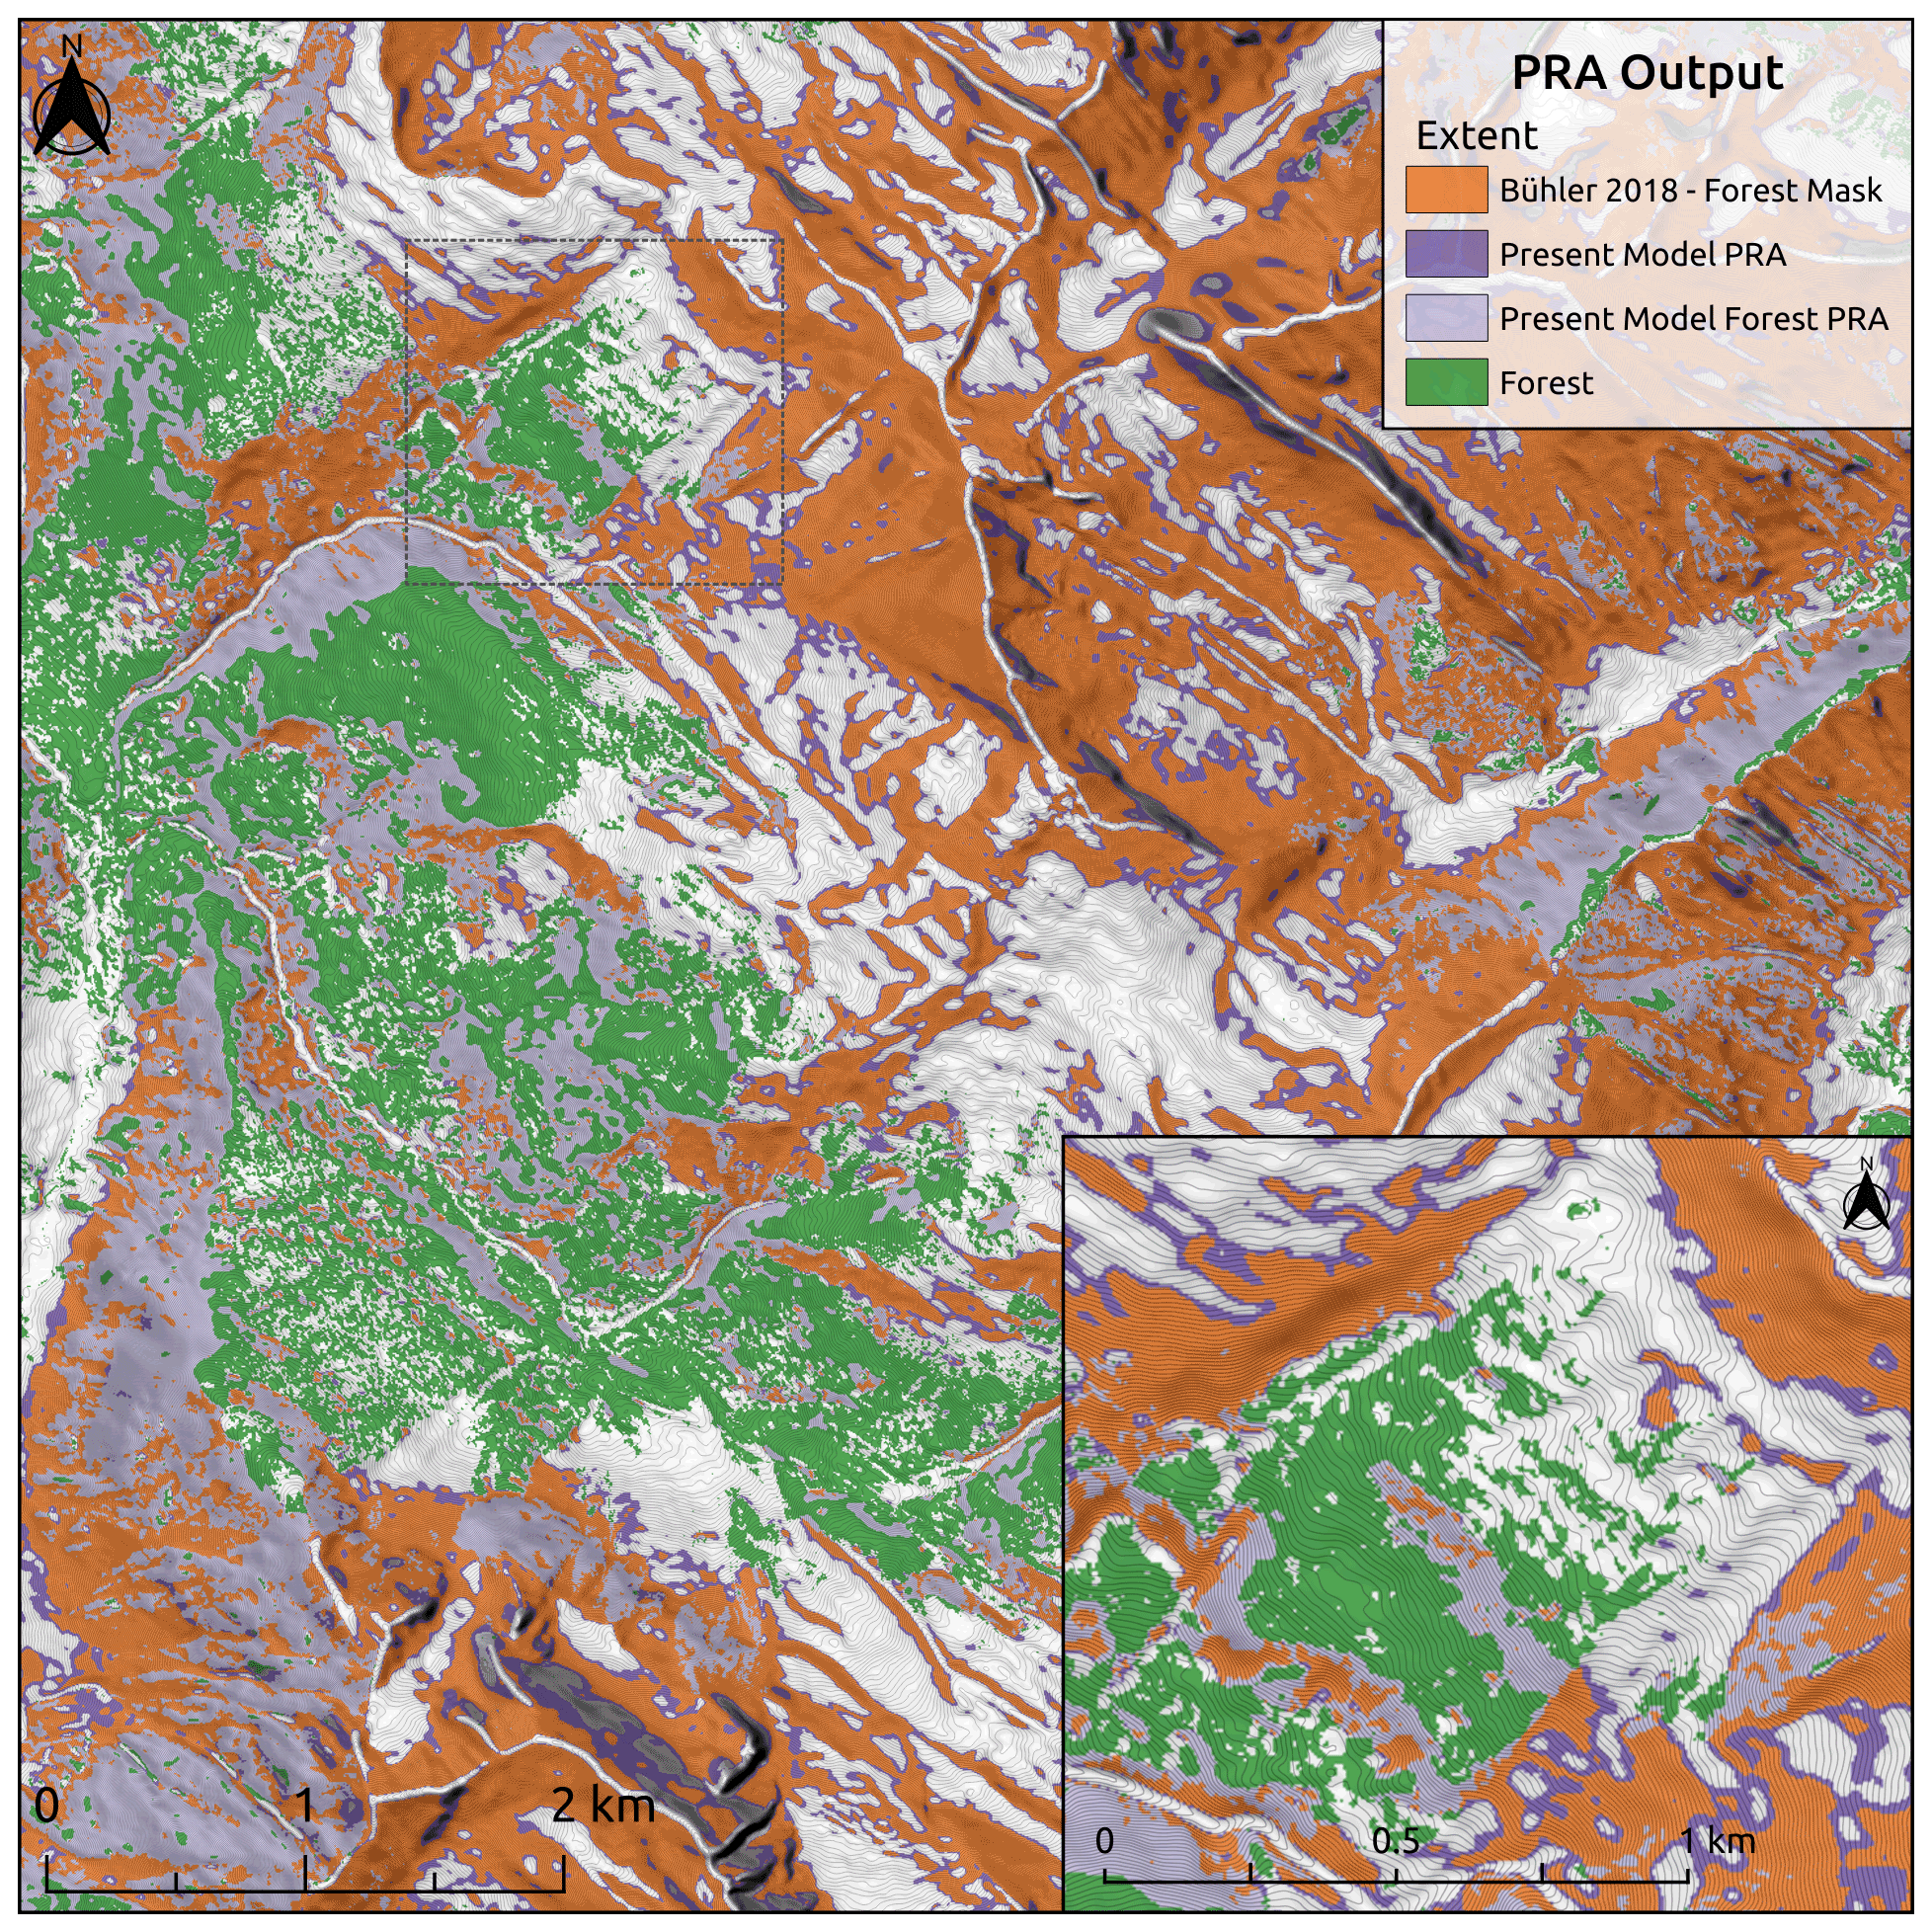
Figure 12Comparison of present PRA model to “Bühler 2018 – forest mask”. Present model PRA area is dark purple with light purple for forested areas. “Bühler 2018 – forest mask” is shown in orange for comparison. Inset map shows detailed PRA comparison on a local scale; extent shown by dotted black line. Forest data created using Planet Labs RapidEye imagery (Planet Team, 2017).
4.4 Potential sources of PRA model errors
Based on discussions with our collaborating guides and exploring spatial patterns of discrepancies between our validation dataset and PRA model output, we have highlighted two likely sources of error in our PRA model. First is the limitation of using a relatively simple remote-sensing-based approach to account for forested release areas in the PRA model, which does not explicitly capture forest characteristics that are known to have a strong bearing on the interaction of avalanches and forest, such as crown cover, stem density, and gap size (Bebi et al., 2009; Teich et al., 2012). Second is the inherent uncertainty in relying on human experience to generate validation data, which can be subject to individual biases and faulty recollection. Overall, we believe that the forest characterization is responsible for a larger portion of the PRA model error and is the most fruitful direction for future research to try and address. This section provides examples of these sources of error and discusses how we have attempted to minimize their impact on the PRA model accuracy.
4.4.1 Forest characteristics
To shed light on potential sources of PRA model errors we applied two different approaches that consider different spatial scales. First, we visualized the spatial patterns in the PRA errors for each validation run and consulted the local guides to obtain their insight. Second, we extracted the terrain characteristics of the entire set of validation polygons and compared the distributions of the terrain characteristics based on the PRA error value. Both approaches yielded similar insight, which highlights the challenge of capturing forested avalanche release areas accurately using an approach based purely on satellite imagery.
Visualizing the patterns of PRA model error by validation run reveals concentrated clusters of higher PRA error on specific runs or subregions within runs (Fig. 13). The “Lunatic Fringe” run has by far the highest proportion of overestimated polygons out of the five validation runs, with 22 out of the 42 validation polygons being overestimated (Fig. 13a). Based on information provided by the local guides, this run is characterized by a steep continuous face with several well-defined large avalanche paths dissecting mostly forested terrain. The forest is very dense and impassable for a guided group at the upper elevations of this run. In contrast, the “Red Baron” run, which is located directly across the valley from Lunatic Fringe, contains lower-slope-angle terrain with a large proportion of mature forest (Fig. 13b). The forest has greater canopy height with widely spaced gaps between the individual trees. The forest canopy between each tree extends horizontally enough that the land cover classification is unable to detect many of the gaps on the forest floor. This run contains seven out of eight of the severely underestimated validation polygons, with the other polygon located in a forested area with similar characteristics on the “Bandito” run.

Figure 13PRA model accuracy for each validation run, with the downslope direction at the bottom of each panel. Validation polygons are labeled by the guides' estimated release area proportion and color-coded based on their PRA error. For overlapping validation polygons we retain the highest release area proportion value and clip that area from the surrounding lower-proportion polygon.
While the forest-slope-scalar input parameter is designed to account for the interaction of forest and avalanche release, it is challenging to apply it on these two drastically different types of forested terrain. For Lunatic Fringe, increasing the forest-slope-scalar input parameter would improve accuracy by increasing the slope-angle-minimum threshold based on the local forest density. However, increasing the forest slope scalar would be detrimental for Red Baron because of the potential for avalanche release in forest gaps within densely forested areas. These two contrasting examples of how the PRA model handles avalanche forest interaction highlight the challenge in creating a balanced PRA model which compromises performance in each type of forested terrain.
The guides' descriptions of the local forest character causing PRA errors for Lunatic Fringe and Red Baron are supported by our analysis of terrain characteristics based on the validation polygon dataset. To investigate whether there are common patterns in the terrain characteristics of validation polygons based on their PRA error value we extracted the aspect, curvature, elevation, forest cover, forest density, ruggedness, and slope angle distributions for the validation polygon dataset. While the majority of these terrain characteristics had similar distributions for all classes of PRA error, forest cover percentage and forest density had distinct differences. For “severely underestimated” polygons the distributions and median values are biased towards higher percentages of forest cover and forest density compared to other PRA error classes (Fig. 14).
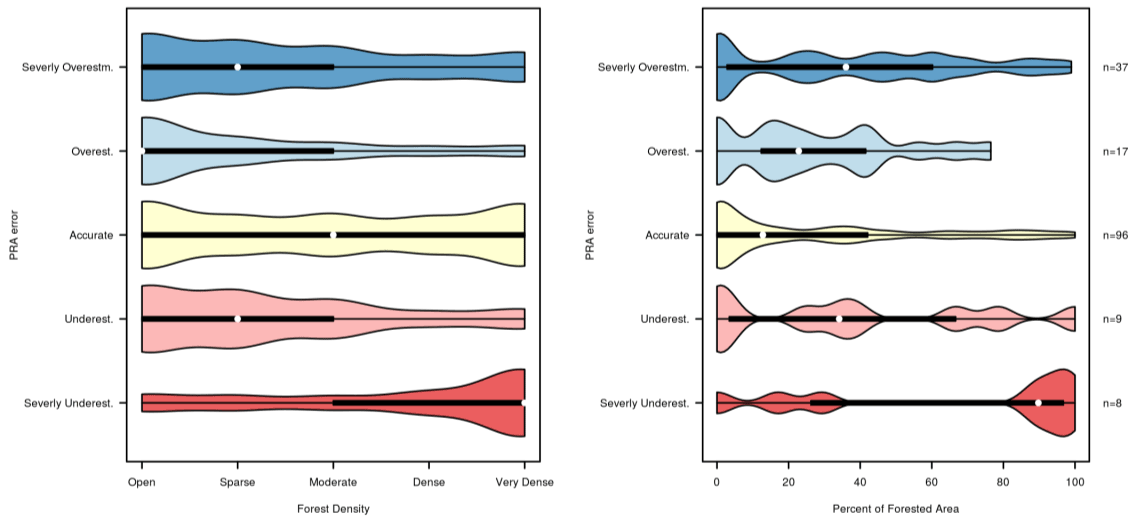
Figure 14Analysis of PRA error based on forest density and percentage of forested area for the validation polygon dataset. The plots show the distribution of forest density and forest cover percentage for validation polygons based on their PRA error.
This further illustrates the guides' interpretation that the severely underestimated polygons on Red Baron have high forest density and the limitation of our forest-slope-scalar approach for accounting for forested terrain with highly variable characteristics. It is important to note that the sample size of “severely underestimated” polygons is small, with only eight polygons. For context, the distribution of “severely overestimated” (n=37) polygons also includes high percentages of forest cover and forest density, which can be partially attributed to the dense and tightly spaced forested terrain on Lunatic Fringe.
The PRA errors on Lunatic Fringe and Red Baron demonstrate the limitations of our approach in capturing the real-world forest characteristics. Further improving the performance of the PRA model in forested terrain would require more detailed datasets such as lidar or a field-based forest inventory which could capture additional forest characteristics such as stem spacing (Waser et al., 2015; Hyyppä et al., 2000; Dash et al., 2016), which are beyond the scope of this research. A notable publicly available source of lidar vegetation height measurements which could be used to interpolate forest height or overall biomass and potentially improve the performance of PRA models in forested terrain is the NASA ICESat-2, which collects lidar point measurements across the globe. The benefit of our method is to create cost-effective and high-resolution avalanche terrain maps based exclusively on remotely sensed data which can be applied in any location, regardless of remoteness or accessibility. For this purpose, our approach allows forested terrain to be captured in the PRA model on a basic level and broadens the range of avalanche terrain that the model can be applied to.
4.4.2 Uncertainty in validation data
One of the key differences in relying on local expertise for model validation is the necessity to incorporate uncertainty. There are two distinct types of uncertainty that are relevant for validating the PRA model: (1) uncertainty in the accuracy of the observations, recollection, and experience of our collaborating guides and (2) uncertainty in the reference datasets we provided them with to transfer their knowledge into spatial datasets and precision of polygon drawing.
In the case of guide observations, the primary sources of uncertainty in determining the location of avalanche release areas are the variability in avalanche conditions, how often the terrain is observed throughout the season, the guides' recollection of avalanche events, and the potential for altered snowpack structure due to frequent guiding. These limitations are inherent to relying on human recollection as a source of validation data. However, our approach for capturing validation polygons from local experts accommodates these limitations by allowing for fuzzy boundaries in drawing polygons, collecting validation data from multiple guides independently, and intentionally minimizing the specificity that we ask the guides to label the release area proportions (0 %, 25 %, 50 %, 75 %, 100 %).
The process for collecting validation data from our collaborating guides evolved through frequent back-and-forth discussions. When applying the validation polygons to select optimal input parameters for our study area we accounted for the nature of the data collection by placing more emphasis on the performance of 0 % and 100 % polygons, which have the highest level of certainty for the guides and are the most spatially explicit. We also preferred input parameters that resulted in a PRA model that is biased toward overestimating release areas in order to account for the potential that the guides have not witnessed all possible combinations of snowpack and weather conditions in our study area, despite their extensive experience.
An example of how the guides' experience can influence our validation dataset can be seen in the right half of the “Rendezvous” ski run, where there are many severely overestimated validation polygons (Fig. 13c). According to our DEM, the slope angles in this area are predominantly in the low to mid-30s, which are within the range observed for human-triggered avalanches (Schweizer and Lütschg, 2001). However, the guiding operation frequently uses this piece of terrain and intentionally manages the snowpack using skier traffic to minimize the potential for weak layers to form and persist on the surface (e.g., surface hoar). Frequent guiding use and intentional maintenance of weak layers can create a modified snowpack structure (Haegeli and Atkins, 2016) and have the potential to impact the guides' perception of release area potential. In areas where the guide's experience is largely based on modified snowpack structures there is a high potential for the PRA model to overestimate avalanche release compared to the validation dataset.
While our workflow for collecting validation data from local guides was customized for our use case, these methods could be adapted to other professional communities such as avalanche forecasters or ski patrol. We recommended considering the following key principles for developing meaningful PRA validation datasets:
-
Identify a manageable-size area to create the validation dataset that is representative of the terrain and snowpack conditions in the larger study area you want to apply the PRA model.
-
Solicit feedback from collaborators to identify sources of uncertainty in their ability to translate their local experience into polygons that can be compared to the PRA model output.
-
Incorporate that uncertainty into the validation process by allowing them to use fuzzy boundaries to identify potential release areas.
-
Take the structure of the validation data into account when performing statistical comparisons to the PRA model output.
This process can be time-consuming and iterative, but it is critical to ensure shared understanding of the validation data between researchers and collaborators. In the absence of long-term observations of avalanche events in most mountainous regions the development of methods to extract local knowledge from human experts is critical to the application and validation of PRA models.
4.5 Limitations
The primary limitations of this research are direct consequences of our aim to minimize the cost of input data production and create a flexible workflow to apply and validate the PRA model in remote and data-sparse regions. Using a DSM as input for a PRA model has not been thoroughly tested, and the inability to detect bare-ground features within forest canopy likely causes localized errors in the PRA model. Recently, a comparison of high-resolution DSM and DTM models for avalanche runout modeling demonstrated some of the limitations of a DSM for dynamic avalanche simulation (Brožová et al., 2020). We were unable to test the accuracy of the SPOT 6 DSM compared to a DTM due to the lack of alternative high-resolution data in our study area.
Relying exclusively on optical satellite imagery to account for forest avalanche interaction provides limited detail on meaningful forest characteristics. Explicit modeling of stem density, gap size, or crown cover could improve the PRA model's ability to capture forest avalanche interaction (Dash et al., 2016; Wallner et al., 2015). However, our focus is on minimizing field data collection to create a workflow that is applicable in remote areas.
Finally, the experience of local experts is not an ideal source to generate validation data compared to long-term observation records. Observations from individual experts are prone to biases in their experience and potential for faulty recollection. We attempted to minimize these effects on our dataset by collaborating closely with the guides to develop a system for recording their observations that allows for uncertainty and is based on independent observations of multiple guides.
This research aimed to increase the range of application for existing high-resolution PRA modeling by developing a cost-effective workflow for generating the required input datasets, expanding current PRA modeling methods to include avalanche forest interaction, and creating a novel approach for validating the model based on the local expertise of avalanche practitioners for data-sparse regions. The research produced an updated version of the Bühler et al. (2018) PRA model which enables high-resolution avalanche terrain modeling in a vastly greater proportion of mountainous terrain than previously possible. This is thanks to the widespread availability of the necessary satellite remote sensing input data and local expertise required to validate and optimize the PRA model input parameters. The updated model also allows for inclusion of forested terrain with varying densities, contributing to a substantial improvement in the performance of the PRA model in our study area.
The data preparation pipeline developed for this research is based on open source software and intended to be reproducible in areas without existing high-resolution DEM and forest cover datasets, which achieves our goal of making high-resolution PRA modeling more accessible in remote and data-sparse areas. Producing a satellite stereo DSM based on raw imagery provides control over the DSM characteristics and minimizes the cost associated with acquiring this essential dataset. Further testing of the DSM pipeline developed for this research is required, especially in forested terrain, and could provide a meaningful direction for future research. Despite the dramatic cost reduction in our workflow, high-resolution satellite stereo imagery is still relatively costly, so readers interested in applying PRA models in their own area should carefully evaluate costs of acquiring the necessary input data.
Using locally optimized input parameters, our updated PRA model has a higher overall accuracy and fewer underestimated release areas compared to the default parameters developed for Davos, Switzerland, in Bühler et al. (2018). Our validation approach utilizes local expertise to collect avalanche release area polygons via a custom-built online mapping tool and applies spatial and statistical analysis to quantify the accuracy of the PRA model. We leveraged this unique validation dataset to develop a new polygon-based grid search approach to optimize the PRA model input parameters. Creating a validation method that allows for optimization of the PRA model in areas without a long-standing avalanche observation dataset is essential to evaluate the PRA model performance in new locations. This method also provides the opportunity for comparison of optimal input parameters in different snow and avalanche climates. Future research applying the PRA model in maritime and continental snow climates would provide additional insight into how the input parameters can be optimized for a broader range of snowpack and avalanche conditions, which are not captured in the existing Davos or Galena study areas.
To include forested terrain in the PRA model we focused on creating a simple addition to the existing PRA model which does not require any additional input data and remains an optional extension of the existing PRA model framework. We also focused on maintaining the ability to create the input datasets via optical satellite remote sensing methods to minimize the overhead cost and effort to produce forest characteristic data. Our approach allows the PRA model to capture the interactions between forests and avalanche release by controlling the forest density where the PRA model is applied and altering the slope-angle-minimum threshold based on the local forest density. These two changes are simple yet effective methods to account for forest cover in PRA modeling.
Additional research focused on satellite-imagery-based modeling of forest characteristics (Dash et al., 2016; Hyyppä et al., 2000), such as stem density and gap size, could further improve the performance of PRA models in forested terrain. While the availability of high-resolution lidar, laser scanning, or field-measured forest characteristics is essential for meaningfully validating the derivation of these forest characteristic datasets (Waser et al., 2015), this type of development and analysis was beyond the scope of this research. The forest regions in our study area are dominated by coniferous tree species, which limits our ability to generalize the effectiveness of the PRA model in coniferous or mixed forest ecosystems. Hence, we encourage other researchers to explore our approach in other forest types.
Despite the limitations and shortcomings of our approach, the present research improves the accessibility of high-resolution PRA modeling by combining an existing state-of-the-art PRA model with open-source software tools and lower-cost input data and presenting a flexible validation method to assess accuracy of the model output based on local terrain expertise. These developments have the potential to enable a more widespread application of high-resolution avalanche terrain indication modeling worldwide.
The data, code, and output for our analysis and the data and code for the figures and tables included in this paper are available at https://doi.org/10.17605/OSF.IO/YQ5S3 (Sykes et al., 2021).
The supplement related to this article is available online at: https://doi.org/10.5194/nhess-22-3247-2022-supplement.
JS created the data preprocessing workflow and input datasets with guidance from YB and PH. YB provided the original PRA model. JS developed the forest density and forest-slope-scalar modification to the PRA model. PH and JS collaborated with CMH Galena guides to collect validation data and implement online mapping tools to record the data. JS developed the validation and grid search methods with guidance from PH. JS prepared the manuscript with contributions from all co-authors.
At least one of the (co-)authors is a member of the editorial board of Natural Hazards and Earth System Sciences. The peer-review process was guided by an independent editor, and the authors also have no other competing interests to declare.
Publisher’s note: Copernicus Publications remains neutral with regard to jurisdictional claims in published maps and institutional affiliations.
The study area of this research is located on the ancestral and unceded territories of the Secwépemc, Ktunaxa, Sinixt, and Okanagan First Nations. We wish to acknowledge our collaborators on this research from the WSL Institute for Snow and Avalanche Research (SLF) and Canadian Mountain Holidays Galena Lodge. In particular, we would like to thank Roger Atkins and Mike Welch for their contribution to this work with their numerous conversations to develop our validation data collection methods and their time and effort in translating their experience into a validation dataset. This research was enabled in part by the support and computer resources provided by WestGrid and Compute Canada. The NSERC Industrial Research Chair in Avalanche Risk Management at Simon Fraser University is financially supported by Canadian Pacific Railway, HeliCat Canada, Mike Wiegele Helicopter Skiing, and the Canadian Avalanche Association. The research program receives additional support from Avalanche Canada and the Avalanche Canada Foundation. The NSERC Industrial Research Chair in Avalanche Risk Management receives financial support from HeliCat Canada, the trade association of mechanized skiing operations in Canada.
This research has been supported by the Government of Canada Natural Sciences and Engineering Research Council via the NSERC Industrial Research Chair in Avalanche Risk Management at Simon Fraser University (grant no. IRC/515532-2016).
This paper was edited by Margreth Keiler and reviewed by Ross Purves, Erich Peitzsch, and Markus Eckerstorfer.
Bebi, P., Kulakowski, D., and Rixen, C.: Snow avalanche disturbances in forest ecosystems – State of research and implications for management, Forest Ecol. Manag., 257, 1883–1892, https://doi.org/10.1016/J.FORECO.2009.01.050, 2009.
Bebi, P., Bast, A., Helzel, K., Schmucki, G., Brozova, N., and Bühler, Y.: Avalanche Protection Forest: From Process Knowledge to Interactive Maps, in: Protective forests as Ecosystem-based solution for Disaster Risk Reduction, IntechOpen, https://doi.org/10.5772/intechopen.99514, 2021.
Beyer, R. A., Alexandrov, O., and McMichael, S.: The Ames Stereo Pipeline: NASA's Open Source Software for Deriving and Processing Terrain Data, Earth and Space Science, 5, 537–548, https://doi.org/10.1029/2018EA000409, 2018.
Boyd, J., Haegeli, P., Abu-Laban, R. B., Shuster, M., and Butt, J. C.: Patterns of death among avalanche fatalities: a 21-year review, Can. Med. Assoc. J. (CMAJ), 180, 507–12, https://doi.org/10.1503/cmaj.081327, 2009.
Brožová, N., Fischer, J. T., Bühler, Y., Bartelt, P., and Bebi, P.: Determining forest parameters for avalanche simulation using remote sensing data, Cold Reg. Sci. Technol., 172, 102976, https://doi.org/10.1016/j.coldregions.2019.102976, 2020.
Bühler, Y., Hüni, A., Christen, M., Meister, R., and Kellenberger, T.: Automated detection and mapping of avalanche deposits using airborne optical remote sensing data, Cold Reg. Sci. Technol., 57, 99–106, https://doi.org/10.1016/j.coldregions.2009.02.007, 2009.
Bühler, Y., Kumar, S., Veitinger, J., Christen, M., Stoffel, A., and Snehmani: Automated identification of potential snow avalanche release areas based on digital elevation models, Nat. Hazards Earth Syst. Sci., 13, 1321–1335, https://doi.org/10.5194/nhess-13-1321-2013, 2013.
Bühler, Y., Adams, M. S., Stoffel, A., and Boesch, R.: Photogrammetric reconstruction of homogenous snow surfaces in alpine terrain applying near-infrared UAS imagery, Int. J. Remote Sens., 38, 3135–3158, https://doi.org/10.1080/01431161.2016.1275060, 2017.
Bühler, Y., von Rickenbach, D., Stoffel, A., Margreth, S., Stoffel, L., and Christen, M.: Automated snow avalanche release area delineation – validation of existing algorithms and proposition of a new object-based approach for large-scale hazard indication mapping, Nat. Hazards Earth Syst. Sci., 18, 3235–3251, https://doi.org/10.5194/nhess-18-3235-2018, 2018.
Bühler, Y., Hafner, E. D., Zweifel, B., Zesiger, M., and Heisig, H.: Where are the avalanches? Rapid SPOT6 satellite data acquisition to map an extreme avalanche period over the Swiss Alps, The Cryosphere, 13, 3225–3238, https://doi.org/10.5194/tc-13-3225-2019, 2019.
Bühler, Y., Bebi, P., Christen, M., Margreth, S., Stoffel, L., Stoffel, A., Marty, C., Schmucki, G., Caviezel, A., Kühne, R., Wohlwend, S., and Bartelt, P.: Automated avalanche hazard indication mapping on a statewide scale, Nat. Hazards Earth Syst. Sci., 22, 1825–1843, https://doi.org/10.5194/nhess-22-1825-2022, 2022.
Campbell, C. and Gould, B.: A proposed practical model for zoning with the Avalanche Terrain Exposure Scale, in: Proceedings International Snow Science Workshop, Grenoble and Chamonix-Mont-Blanc, France, 7–11 October 2013.
Christen, M., Kowalski, J., and Bartelt, P.: RAMMS: Numerical simulation of dense snow avalanches in three-dimensional terrain, Cold Reg. Sci. Technol., 63, 1–14, https://doi.org/10.1016/j.coldregions.2010.04.005, 2010.
Colorado Avalanche Information Center (CAIC): https://avalanche.state.co.us/accidents/statistics-and-reporting/, last access: 27 April 2020.
Dash, J. P., Watt, M. S., Bhandari, S., and Watt, P.: Characterising forest structure using combinations of airborne laser scanning data, RapidEye satellite imagery and environmental variables, Forestry, 89, 159–169, https://doi.org/10.1093/forestry/cpv048, 2016.
Facciolo, G., de Franchis, C., and Meinhardt, E.: MGM: A Significantly More Global Matching for Stereovision, in: Proceedings of the British Machine Vision Conference (BMVC), edited by: Xie, X., Jones, M. W., and Tam, G. K. L., BMVA Press, 90.1–90.12, https://doi.org/10.5244/C.29.90, 2015.
Feistl, T., Bebi, P., Teich, M., Bühler, Y., Christen, M., Thuro, K., and Bartelt, P.: Observations and modeling of the braking effect of forests on small and medium avalanches, J. Glaciol., 60, 124–138, https://doi.org/10.3189/2014JoG13J055, 2014.
Feistl, T., Bebi, P., Christen, M., Margreth, S., Diefenbach, L., and Bartelt, P.: Forest damage and snow avalanche flow regime, Nat. Hazards Earth Syst. Sci., 15, 1275–1288, https://doi.org/10.5194/nhess-15-1275-2015, 2015.
Gillies, S., Perry, M., Wurster, K., et al.: Rasterio: geospatial raster I/O for Python programmers, GitHub [code], https://github.com/rasterio/rasterio/blob/main/CITATION.txt (last access: 19 September 2022), 2013.
Gruber, U. and Haefner, H.: Avalanche hazard mapping with satellite data and a digital elevation model, Appl. Geogr., 15, 99–113, https://doi.org/10.1016/0143-6228(94)00004-A, 1995.
Haegeli, P. and Atkins, R.: Managing the Physical Risk From Avalanches in a Helicopter Skiing Operation–Merging and Contrasting Gps Tracking Data with the Operational Guiding Perspective, in: Proceedings International Snow Science Workshop, Breckenridge, CO, USA, 3–7 October 2016, 104–111, 2016.
Haegeli, P. and McClung, D. M.: Expanding the snow-climate classification with avalanche-relevant information: initial description of avalanche winter regimes for southwestern Canada, J. Glaciol., 53, 266–276, https://doi.org/10.3189/172756507782202801, 2007.
Hafner, E. D., Techel, F., Leinss, S., and Bühler, Y.: Mapping avalanches with satellites – evaluation of performance and completeness, The Cryosphere, 15, 983–1004, https://doi.org/10.5194/tc-15-983-2021, 2021.
Hägeli, P. and McClung, D. M.: Avalanche characteristics of a transitional snow climate – Columbia Mountains, British Columbia, Canada, Cold Reg. Sci. Technol., 37, 255–276, https://doi.org/10.1016/S0165-232X(03)00069-7, 2003.
Harris, C. R., Millman, K. J., van der Walt, S. J., Gommers, R., Virtanen, P., Cournapeau, D., Wieser, E., Taylor, J., Berg, S., Smith, N. J., Kern, R., Picus, M., Hoyer, S., van Kerkwijk, M. H., Brett, M., Haldane, A., del Río, J. F., Wiebe, M., Peterson, P., Gérard-Marchant, P., Sheppard, K., Reddy, T., Weckesser, W., Abbasi, H., Gohlke, C., and Oliphant, T. E.: Array programming with NumPy, Nature, 585, 357–362, https://doi.org/10.1038/s41586-020-2649-2, 2020.
Harvey, S., Schmudlach, G., Buhler, Y., Durr, L., Stoffel, A., and Christen, M.: Avalanche Terrain Maps for Backcountry Skiing in Switzerland, in: Proceedings International Snow Science Workshop, Innsbruck, Austria, 7–12 October 2018, 2018.
Höhle, J. and Höhle, M.: Accuracy assessment of digital elevation models by means of robust statistical methods, ISPRS J. Photogramm., 64, 398–406, https://doi.org/10.1016/j.isprsjprs.2009.02.003, 2009.
Hyyppä, J., Hyyppä, H., Inkinen, M., Engdahl, M., Linko, S., and Zhu, Y. H.: Accuracy comparison of various remote sensing data sources in the retrieval of forest stand attributes, Forest Ecol. Manag., 128, 109–120, https://doi.org/10.1016/S0378-1127(99)00278-9, 2000.
Jamieson, B., Haegeli, P., and Gauthier, D.: Avalanche accidents in Canada, Canadian Avalanche Association, 5, 15–39, ISBN: 978-0-9866597-4-4, 2010.
Korzeniowska, K., Bühler, Y., Marty, M., and Korup, O.: Regional snow-avalanche detection using object-based image analysis of near-infrared aerial imagery, Nat. Hazards Earth Syst. Sci., 17, 1823–1836, https://doi.org/10.5194/nhess-17-1823-2017, 2017.
Kramm, T. and Hoffmeister, D.: EVALUATION OF DIGITAL ELEVATION MODELS FOR GEOMORPHOMETRIC ANALYSES ON DIFFERENT SCALES FOR NORTHERN CHILE, Int. Arch. Photogramm. Remote Sens. Spatial Inf. Sci., XLII-2/W13, 1229–1235, https://doi.org/10.5194/isprs-archives-XLII-2-W13-1229-2019, 2019.
Kumar, S., Srivastava, P. K., Snehmani, and Bhatiya, S.: Geospatial probabilistic modelling for release area mapping of snow avalanches, Cold Reg. Sci. Technol., 165, 102813, https://doi.org/10.1016/j.coldregions.2019.102813, 2019.
Lato, M. J., Frauenfelder, R., and Bühler, Y.: Automated detection of snow avalanche deposits: segmentation and classification of optical remote sensing imagery, Nat. Hazards Earth Syst. Sci., 12, 2893–2906, https://doi.org/10.5194/nhess-12-2893-2012, 2012.
Maggioni, M. and Gruber, U.: The influence of topographic parameters on avalanche release dimension and frequency, Cold Reg. Sci. Technol., 37, 407–419, https://doi.org/10.1016/S0165-232X(03)00080-6, 2003.
Margreth, S. and Funk, M.: Hazard mapping for ice and combined snow/ice avalanches – two case studies from the Swiss and Italian Alps, Cold Reg. Sci. Technol., 30, 159–173, https://doi.org/10.1016/S0165-232X(99)00027-0, 1999.
McClung, D. and Schaerer, P.: The avalanche handbook, 3rd edn., The Mountaineers Books, 342 pp., ISBN: 978-0-89886-809-8, 2006.
McClung, D. M.: Characteristics of terrain, snow supply and forest cover for avalanche initiation caused by logging, Ann. Glaciol., 32, 223–229, https://doi.org/10.3189/172756401781819391, 2001.
Pedregosa, F., Varoquaux, G., Gramfort, A., Michel, V., Thirion, B., Grisel, O., Blondel, M., Prettenhofer, P., Weiss, R., Dubourg, V., Vanderplas, J., Passos, A., Cournapeau, D., Brucher, M., Perrot, M., and Édouard, D.: Scikit-learn: Machine Learning in Python, J. Mach. Learn. Res., 12, 2825–2830, 2011.
Planet Team: Planet Application Program Interface, in: Space for Life on Earth, https://api.planet.com (last access: 5 November 2021), 2017.
QGIS Development Team: QGIS Geographic Information System, http://qgis.org (last access: 5 November 2021), 2021.
Rouault, E., Warmerdam, F., Schwehr, K., Kiselev, A., Butler, H., Łoskot, M., Szekeres, T., Tourigny, E., Landa, M., Miara, I., Elliston, B., Kumar, C., Plesea, L., Morissette, D., Jolma, A., and Dawson, N.: GDAL, Zenodo [code], https://doi.org/10.5281/zenodo.5884351, 2022.
Rudolf-Miklau, F., Skolaut, C., and Sauermoser, S.: Avalanche Hazard Assessment and Planning of Protection Measures, in: The Technical Avalanche Protection Handbook, Ernst & Sohn, 91–126, https://doi.org/10.1002/9783433603840.ch04, 2015.
Schweizer, J. and Lütschg, M.: Characteristics of human-triggered avalanches, Cold Reg. Sci. Technol., 33, 147–162, 2001.
Schneebeli, M. and Bebi, P.: Snow and Avalanche Control, Encyclopedia of Forest Sciences, 397–402, https://doi.org/10.1016/B0-12-145160-7/00271-4, 2004.
Shandro, B. and Haegeli, P.: Characterizing the nature and variability of avalanche hazard in western Canada, Nat. Hazards Earth Syst. Sci., 18, 1141–1158, https://doi.org/10.5194/nhess-18-1141-2018, 2018.
Sharp, E., Haegeli, P., and Welch, M.: Patterns in the exposure of ski guides to avalanche terrain, in: Proceedings International Snow Science Workshop, Innsbruck, Austria, 7–12 October 2018.
Shean, D. E., Alexandrov, O., Moratto, Z. M., Smith, B. E., Joughin, I. R., Porter, C., and Morin, P.: An automated, open-source pipeline for mass production of digital elevation models (DEMs) from very-high-resolution commercial stereo satellite imagery, ISPRS J. Photogramm., 116, 101–117, https://doi.org/10.1016/j.isprsjprs.2016.03.012, 2016.
Sykes, J., Haegeli, P., and Bühler, Y.: Automated snow avalanche release areas delineation in data sparse, remote, and forested regions – Code and Data, OSF [data set, code], https://doi.org/10.17605/OSF.IO/YQ5S3, 2021.
Techel, F., Jarry, F., Kronthaler, G., Mitterer, S., Nairz, P., Pavšek, M., Valt, M., and Darms, G.: Avalanche fatalities in the European Alps: long-term trends and statistics, Geogr. Helv., 71, 147–159, https://doi.org/10.5194/gh-71-147-2016, 2016.
Teich, M., Bartelt, P., Grêt-Regamey, A., and Bebi, P.: Snow Avalanches in Forested Terrain: Influence of Forest Parameters, Topography, and Avalanche Characteristics on Runout Distance, Arct. Antarct. Alp. Res., 44, 509–519, https://doi.org/10.1657/1938-4246-44.4.509, 2012.
Veitinger, J., Purves, R. S., and Sovilla, B.: Potential slab avalanche release area identification from estimated winter terrain: a multi-scale, fuzzy logic approach, Nat. Hazards Earth Syst. Sci., 16, 2211–2225, https://doi.org/10.5194/nhess-16-2211-2016, 2016.
Voellmy, A.: Über die Zerstörungskraft von Lawinen, Schweizerische Bauzeitung, 73, 159–165, 1955 (in German).
Wallner, A., Elatawneh, A., Schneider, T., and Knoke, T.: Estimation of forest structural information using RapidEye satellite data, Forestry, 88, 96–107, https://doi.org/10.1093/forestry/cpu032, 2015.
Waser, L., Fischer, C., Wang, Z., Ginzler, C., Waser, L. T., Fischer, C., Wang, Z., and Ginzler, C.: Wall-to-Wall Forest Mapping Based on Digital Surface Models from Image-Based Point Clouds and a NFI Forest Definition, Forests, 6, 4510–4528, https://doi.org/10.3390/f6124386, 2015.