the Creative Commons Attribution 4.0 License.
the Creative Commons Attribution 4.0 License.
 | 03 Feb 2022
Spatio-temporal evolution of wet–dry event features and their transition across the Upper Jhelum Basin (UJB) in South Asia
Giovanna Grossi
The increasing rate of occurrence of extreme events (droughts and floods) and their rapid transition magnify the associated socio-economic impacts with respect to those caused by the individual event. Understanding of spatio-temporal evolution of wet–dry events collectively, their characteristics, and the transition (wet to dry and dry to wet) is therefore significant to identify and locate most vulnerable hotspots, providing the basis for the adaptation and mitigation measures. The Upper Jhelum Basin (UJB) in South Asia was selected as a case study, where the relevance of wet–dry events and their transition has not been assessed yet, despite clear evidence of climate change in the region. The standardized precipitation evapotranspiration index (SPEI) at the monthly timescale was applied to detect and characterize wet and dry events for the period 1981–2014. The results of temporal variations in SPEI showed a strong change in basin climatic features associated with El Niño–Southern Oscillation (ENSO) at the end of 1997, with the prevalence of wet and dry events before and after 1997 respectively. The results of spatial analysis show a higher susceptibility of the monsoon-dominated region towards wet events, with more intense events occurring in the eastern part, whereas a higher severity and duration are featured in the southwestern part of the basin. In contrast, the westerlies-dominated region was found to be the hotspot of dry events with higher duration, severity, and intensity. Moreover, the surrounding region of the Himalaya divide line and the monsoon-dominated part of the basin were found to be the hotspots of rapid wet–dry transition events.
- Article
(4541 KB) - Full-text XML
-
Supplement
(96 KB) - BibTeX
- EndNote


There is growing evidence that recent warming is leading to significant alteration in the hydrological cycle, exacerbating extreme weather events in general (Peterson et al., 2012) in many regions of the world. Extreme weather events such as floods and droughts and their rapid successions (recurrent spells) during the past few decades have taken a heavy toll on both life and property. Moreover, such events can have large impacts on water availability, agriculture and food security, power production, and natural ecosystems (He et al., 2019; Sheffield and Wood, 2012). These events are projected to regionally intensify and be more frequent within the context of global warming, underscoring the importance of research on wet–dry extreme weather events collectively. The climate change projections for the Asian continent in the sixth Assessment Report (AR6) of the Intergovernmental Panel on Climate Change (IPCC) reported that during the 21st century South Asia is likely to face more intense and frequent heatwaves and humid heat stress, whereas both annual and summer monsoon precipitation will increase, with enhanced inter-annual variability (medium confidence) (Arias et al., 2022). Various studies at local, basin, national, and regional scales already documented and acknowledged the vulnerability to climate change of that region (He and Sheffield, 2020; Zhao et al., 2020; Visser-Quinn et al., 2019; He et al., 2017).
Typically, wet and dry events are generally considered independently in water resource management and planning. However, these events are inherently interconnected and governed by the same underlying hydrological processes and atmospheric dynamics, which may augment hydro-climatic variability under the influence of climate change (He and Sheffield, 2020). A number of rapid wet–dry events in the last decade acknowledged the relevance of sequences of wet and dry events. For example, California's large-scale flood event in 2017 occurred at the offset of prolonged drought (2011–2016) (He et al., 2017; NOAA National Centers for Environmental Information, 2018). South Carolina observed an abrupt transition (within a week) from drought to flood in September 2015 (He and Sheffield, 2020). Other examples include the successive drought and flood events of 2010–2012 and 2015–2016 in the UK (Parry et al., 2013) and Tasmania, Australia respectively (CSIRO, 2018). Such abrupt flood–drought transitions pose a substantial risk for water management practices, especially for reservoir operation, as a trade-off should be set between short-term flood control and long-term water storage imperatives to satisfy water demand (He and Sheffield, 2020). This has aroused widespread concern in the scientific community to understand the wet–dry interplay under a changing environment.
During the past few decades, significant effort was put forward towards the adoption of a multi-hazard approach (consideration of both types of extreme hydrological conditions at the same time) in developing resilience to climate change. Kourgialas (2021) analysed floods and droughts collectively in the Mediterranean agricultural region and proposed water-saving and flood protection measures for adapting to the inevitable adverse effects of climate change. Visser-Quinn et al. (2019) identified hotspot regions in the UK where a spatio-temporally concurrent increase in the number of flood and drought events was projected. Zhao et al. (2020) investigated the rapid transition of flood and drought events under present and future climate change in the Hanjiang Basin and found more frequent drought-to-flood rapid-transition events of higher intensity in the 21st century. Other examples include the analysis of rapid drought-to-flood transitions in river basins in China (Yan et al., 2013) and in England and Wales (Parry et al., 2013). These studies employed the peak-over-threshold (POT) method and various indices recommended by the World Meteorological Organization (WMO) for the detection and characterization of extreme wet and dry events (floods and droughts).
Some commonly used indices are the standardized precipitation index (SPI) (McKee et al., 1993), standardized precipitation evapotranspiration index (SPEI) (Vicente-Serrano et al., 2010), Palmer drought severity index (PDSI) (Palmer, 1965), normalized difference vegetation index (NDVI) (Tucker, 1979), standardized drought indices (SDI) (Svoboda and Fuchs, 2016), and standardized anomaly index (SAI) (Katz and Glantz, 1986). Among these indices, SPI and SPEI are more widely accepted for the following reasons: (a) simple to calculate; (b) require few input data (precipitation and temperature), that are easily accessible in most cases; (c) standardized indices, which facilitate the comparison of different climatic zones; and (d) can be calculated at multiple timescales, depending on the objective. For instance, SPI and SPEI at short timescales (1, 2, 3, or 6 months) better reflect the meteorological and agricultural drought, while longer timescales (12, 24, or 48 months) are usually considered in hydrology (Kourgialas, 2021). The calculation of SPI and SPEI is mathematically similar, but it differs in the input parameters. The SPI only uses precipitation, whereas SPEI is based on the climatic water balance. Many studies advocate the use of SPEI, rather than SPI, due to its link to potential evapotranspiration (PET), which makes it more sensitive in the context of global warming (Himayoun and Roshni, 2019; Yao et al., 2018; Huang et al., 2017; Vicente-Serrano et al., 2010).
In this study, attempts were made to understand the regional evolution of wet–dry events collectively, their characteristics, and their transition (wet to dry and dry to wet) for different severity levels ranging from moderate to extreme. Here, the term “wet and dry events” does not necessarily imply observed flood and drought events, unless explicitly mentioned. There exists a basic difference between a flood and a wet event. The former has a short duration effect (e.g. a few hours or days) while the latter is regarded as a long period without precipitation shortage (e.g. several months or years) (Wu and Chen, 2019).
The proposed framework was implemented with reference to the Upper Jhelum Basin (UJB), where the relevance of wet–dry events and their transition have not been assessed yet, despite clear evidence of climate change in the region. The UJB is located in the western Himalaya and shared by Pakistan and India. The region already witnessed an increase in extreme hydro-meteorological events in the last few decades, but these events are expected to become even more pronounced in the coming future (Pachauri et al., 2014). A study conducted over the northern highlands of Pakistan investigated the trends in time distribution patterns (TDPs) and return periods for event-based extreme precipitation for the period of 1961 to 2014 and found maximum values of 20- and 50-year return levels of TDP for the UJB (Zaman et al., 2020). Another study conducted on a portion of the UJB located in Kashmir, India, uses the SPEI for spatio-temporal characterization of drought events only (Himayoun and Roshni, 2019). Akhtar et al. (2020) investigated the correlation of meteorological and hydrological drought using the SPEI and the standardized streamflow index (SSI) over the Upper Indus Basin (UIB), including UJB. They validated the results with a historically prolonged drought event observed in Pakistan (1999–2002). Another study employed the locally weighted SDI and compared it with SPI and SPEI on 10 meteorological stations within Pakistan (Ali et al., 2019). Ullah et al. (2021a) evaluated four reanalysis products for drought assessment in Pakistan using SPI and SPEI at multiple timescales. All above-mentioned studies put a focus on drought event characteristics only, whereas the wet events and transition of wet–dry events were overlooked. This study attempts to fill this gap by addressing the following specific points.
-
How does climate change influence the evolution of the regional wet–dry events?
-
How comparatively frequent were wet or dry events in the past?
-
What is the average transition time of wet-to-dry and dry-to-wet events?
-
Which parts of the basin are hosting hotspots for rapid wet–dry transition events?
The most widely used index, SPEI, is here adopted to detect and characterize wet and dry events of different severity levels (moderate, severe, and extreme). The analysis was carried out both at each grid cell and averaged over the basin, using corrected ERA5 precipitation and observed temperature data for a period of 35 years (1981–2014).
The Upper Jhelum Basin (UJB) has a latitudinal extent stretching from to E and latitudinal extent from to N (Fig. 1). The basin is mainly located in the sub-tropics and partially in a temperate region. The basin drains the foothills of the western Himalaya and Pir Panjal mountains and feeds the second largest reservoir of Pakistan, the “Mangla Reservoir”. The total area of the basin is about 33 342 km2. The elevation ranges from nearly 223 m in the southwest to about 6201 m in the north, with mean elevation of 2353 m a.s.l. Approximately 0.75 % (252 km2) of the basin is covered by perennial glaciers in the north of the basin (Consortium and Inventory, 2017). Grass, forest, and agriculture are the three major land use–land cover (LULC) types dominating over high-, mid-, and low-elevation areas respectively. Permanent snow and ice cover a negligible area in the northwest of the basin, whereas a small patch of barren land exists over the densely grassy mountains of the western Himalaya and Pir Panjal. The urban settlement covers a small portion of the basin, concentrated in the Kashmir valley.

Figure 1Location of the UJB and spatial distribution of climatic stations.
The climate of the UJB is influenced by dynamic local and regional weather systems, and the topography of the high mountains causes a huge variability in the spatial and seasonal distribution of precipitation (Dolk et al., 2020). Two distinct precipitation patterns (i.e. western disturbances and monsoon) exist in the basin. The western disturbances bring precipitation in the form of snow during the winter season. The monsoon pattern brings liquid rainfall during summer seasons. The monsoon precipitation pattern dominates in the two lower sub-basins, i.e Poonch and Kanshi, and progressively loses strength northward towards the foothills of the western Himalaya, where the influence of western disturbances is predominant (Neelum and Kunhar sub-basins). The basin average annual precipitation and temperature is about 1150 mm yr−1 and 13.2 ∘C respectively. Owing to the steep rugged mountainous topography of the basin and consequent short lag time, the flow level in the river and its tributaries rises abruptly during a rainfall event (Dar et al., 2019). Major extreme events witnessed by the basin are primarily led by vigorous interactions of moisture-laden monsoon circulation and southward-penetrating mid-latitude westerly troughs into the Himalayan region (Vellore et al., 2016).
The daily observed precipitation and temperature data of 15 climatic stations located within the political boundary of Pakistan were collected from the Pakistan Meteorological Department (PMD) and Water and Power Development Authority (WAPDA). For the Indian region, Indian Meteorological Department (IMD) daily gridded precipitation and temperature datasets, derived from a dense network of meteorological stations for the Indian mainland (Pai et al., 2014), were extracted at five stations and used for that region. The analysis was carried out for a period of 34 years (1981–2014), due to the availability of observed data. In fact there are only a few climatic stations where data are available starting from 1971, but the number of stations would not be enough for the spatial analysis. The observed temperature data were used to calculate potential evapotranspiration (PET) using the Thornthwaite equation (Thornthwaite, 1948) due to data limitation. A study conducted by Beguería et al. (2014) compared the SPEI values calculated with three different methods (Penman–Monteith, Hargreaves, and Thornthwaite) and found small differences in humid regions. Mavromatis (2007) also reported similar outcomes of PET methods for drought index calculation. Afterwards PET values were interpolated at 0.25∘ using Kriging with external drift (KED), considering elevation as a predictor (Goovaerts, 2000). For the precipitation, contrasting reviews are reported in the literature about the performance of the KED technique. For instance, Masson et al. (2014) reported considerable improvement in interpolation accuracy with KED compared to other linear regressions not accounting for any predictor in high mountainous regions. On the other hand, Berndt and Haberlandt (2018) and Ly et al. (2011) argue that topographical impact was indispensable for only temperature reconstruction at all temporal resolutions and station densities, but its influence was less clear for daily to monthly precipitation. Furthermore, all spatial interpolation techniques can perform poorly in regions with insufficient high-elevation data, due to inaccurate estimation of local lapse rates (Ruelland and Sciences, 2020). Therefore, the ERA5 precipitation estimates (0.25∘ horizontal resolution) corrected for distribution mapping (DM) were used in the present study. ERA5 is a relatively new reanalysis launched by the European Centre for Medium-Range Weather Forecasts (ECMWF) (Saha et al., 2010). The data are developed by using an advanced 4D-Var assimilation scheme and provide various atmospheric variables at 139 pressure levels for the period 1979–present. The suitability of ERA5 to the UJB and surrounding region was also reported by Liaqat et al. (2021) and Baudouin et al. (2020). The DM method adjusts the cumulative distribution function (CDF) of modelled precipitation to match with the observed precipitation CDF using a transfer function (Sennikovs and Bethers, 2009), and it is commonly used to correct the systematic distributional biases (Cannon et al., 2015). The gamma distribution (Thom, 1958) with a shape and a scale parameter was found to be suitable for the precipitation distribution in the study region (Azmat et al., 2018). The suitability of ERA5 precipitation and the bias correction method with respect to extreme precipitation analysis were checked against observed station data, and a few results of the reliability check of DM-corrected ERA5 are provided in the Supplement (see Fig. S1).
4.1 Wet and dry event identification
SPEI, the most widely used index, was adopted to detect and characterize wet and dry events of different severity levels (moderate, severe, and extreme). The SPEI supports comparisons over time and space, as proxies of wet and dry conditions from both the meteorological and agricultural perspectives. Although the SPEI was originally proposed for drought monitoring, it can also be used as a tool to detect flood risk. The calculation procedure of SPEI involves two steps: fitting a log-logistic distribution to the monthly climatic water balance (P-PET) time series and then transforming the cumulative probability of the fitted distribution into a standard normal distribution (with mean zero and variance 1). According to this distribution method, the probability distribution function of a variable x is expressed as
where α, β, and γ are the shape, scale, and origin parameters respectively. In the second step, SPEI is calculated as the standardized value of F(x) as follows:
where
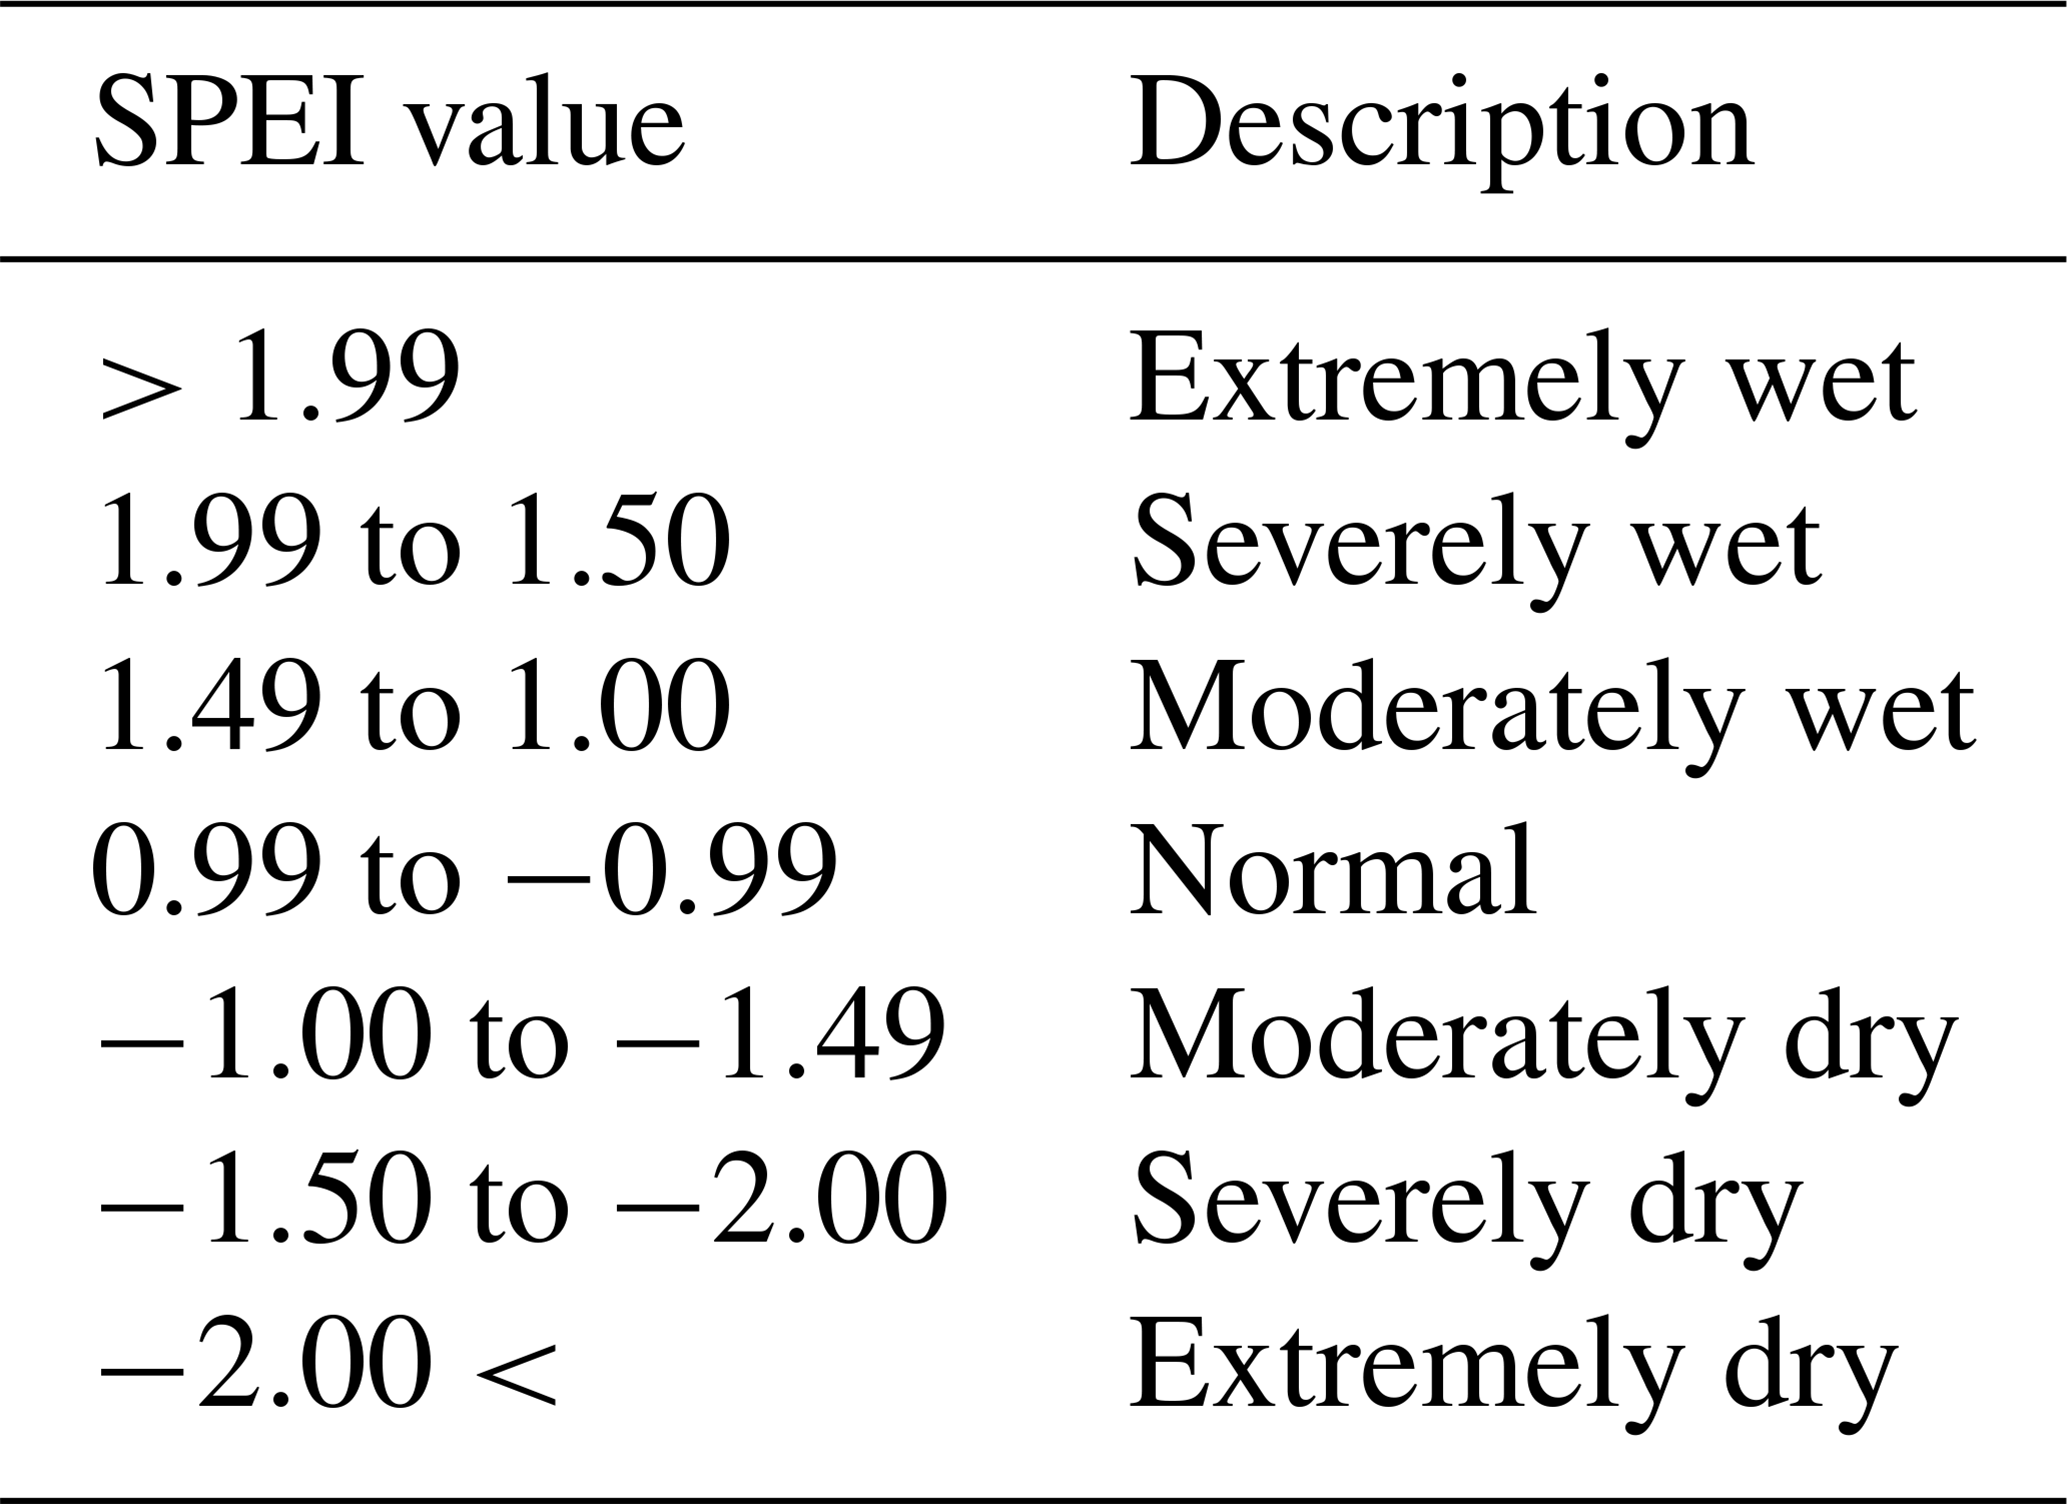
The parameters C0, C1, C2, d1, d2, and d3 are SPEI constants (Vicente-Serrano et al., 2010). The log-logistic distribution for SPEI calculation was used and recommended by many researchers (Ullah et al., 2021a; Akhtar et al., 2020; Himayoun and Roshni, 2019; Vicente-Serrano et al., 2010). The detailed description of the SPEI calculation procedure can be found in Vicente-Serrano et al. (2010). In this study, SPEI was calculated using the “SPEI” package in R environment (Beguería et al., 2017). The severity levels of wet and dry events based on SPEI values were classified according to Chen et al. (2020), and results are listed in Table 1. Positive and negative values of SPEI represent the severity of wet and dry events respectively.
Table 1SPEI classification of dry and wet events (from Chen et al., 2020).
4.2 Wet and dry event characteristics
In this study, three characteristics (severity, duration, and intensity) of wet and dry events were calculated for each pixel. Following Spinoni et al. (2014), the duration (D) of a wet–dry event is the length of time (months) that the index is consecutively above or below a truncation value; the severity (S) refers to the cumulative value of the index from the first month to the last month of the wet–dry event, and it represents the water surplus and deficit respectively; and the intensity (I) of an event is the ratio of severity (S) to duration (D). These characteristics were computed for each event and then further the total wet and dry event duration (TWD and TDD), total wet and dry severity (TWS and TDS), total wet and dry intensity (TWI and TDI), average wet and dry event duration (AWD and ADD), average wet and dry severity (AWS and ADS), average wet and dry intensity (AWI and ADI), maximum wet and dry event duration (MWD and MDD), maximum wet and dry severity (MWS and MDS), and maximum wet and dry intensity (MWI and MDI) were calculated for a period of 34 years (1981–2014).
4.3 Wet–dry (WD) ratio
The wet–dry (WD) ratio is defined as the natural logarithm of the ratio of the total number of wet months (Nw) to the total number of dry months (Nd) (Luca et al., 2020). The WD ratio was calculated for different levels of severity (moderate, severe, and extreme) at each pixel for the studied period (1981–2014) using Eq. (5):
The WD ratio provides information about the susceptibility of a given area to be more affected by wet or dry events. A WD ratio greater than 0 implies the prevalence of wet events, whereas a WD ratio lower than 0 shows a dominance of dry events. The natural logarithm was used to narrow the range of WD ratio values and to separate the wet-dominated versus dry-dominated regions by sign.
4.4 Wet–dry transition time
The total number of transitions and their average transition time (Tt) in months for wet-to-dry and dry-to-wet events was computed for each grid cell for the period 1981–2014, as described by Luca et al. (2020). The calculation procedure of wet-to-dry transition time (Tt) involves four steps: (i) extraction of wet and dry events and arranging them in an ascending order of time (from the oldest to the most recent); (ii) in case of consecutive dry and wet months, keep only the first and the last month value respectively; (iii) calculate the difference in months between wet to dry events within the time series; and (iv) take the average of the time interval. The same procedure was applied for calculating dry-to-wet transition time (Tt), with the only difference being in step (ii) in which the first and last months of wet and dry events were kept respectively, and in step (iii) in which the time interval was calculated between dry-to-wet events. The wet-to-dry and dry-to-wet transition times were calculated separately for each level of severity (moderate, severe, extreme).
4.5 Wet–dry rapid-transition events
The wet–dry rapid-transition event is defined as the consecutive occurrence of wet and dry months/events. For instance, a dry (or wet) event occurring in the ith month abruptly altered to a wet (or dry) event in the i+1 month. In this study, the frequency of wet-to-dry (wet event followed by dry event) and dry-to-wet (dry event followed by wet event) rapid-transition events was calculated for each pixel to identify the geographical hotspot for compound extreme events. Unlike the wet–dry average transition time, which was calculated separately for each severity level, the wet–dry rapid-transition events were calculated considering all levels of severity together.
5.1 Change trends of the wet–dry events
The basin average SPEI time series at 1-month (SPEI-1), 3-month (SPEI-3), 6-month (SPEI-6), and 12-month (SPEI-12) timescales is presented in Fig. 2. It can be seen that the study domain mostly experienced moderate-to-severe wet–dry events, whereas the extreme wet–dry events (SPEI>2 or ) rarely occurred during the study period. For the SPEI-1, the wet (blue) and dry (red) events changed more frequently than accumulated SPEI (at 3, 6, and 12 months), and there was no extended dry or wet period. The reason might be that the precipitation and temperature of each new month have a substantial impact on the accumulative values of that period. By contrast, with the increase in SPEI timescale (SPEI-1 to SPEI-12), a clear change/shift of basin climate from wet to dry conditions can be seen (Fig. 2), showing the stability in the frequency of incidence of wet–dry events over the study domain. This could be explained as the slow and consistent response of SPEI towards changes in climatic variables, indicating strong and clear durations of annual and multiple-year dry and wet conditions. This means that at longer timescales of SPEI the number of occurrences of wet–dry events will decrease, but the duration will increase.

Figure 2Temporal variations in SPEI at 1-, 3-, 6-, and 12-month timescales over UJB for the period 1981–2014.
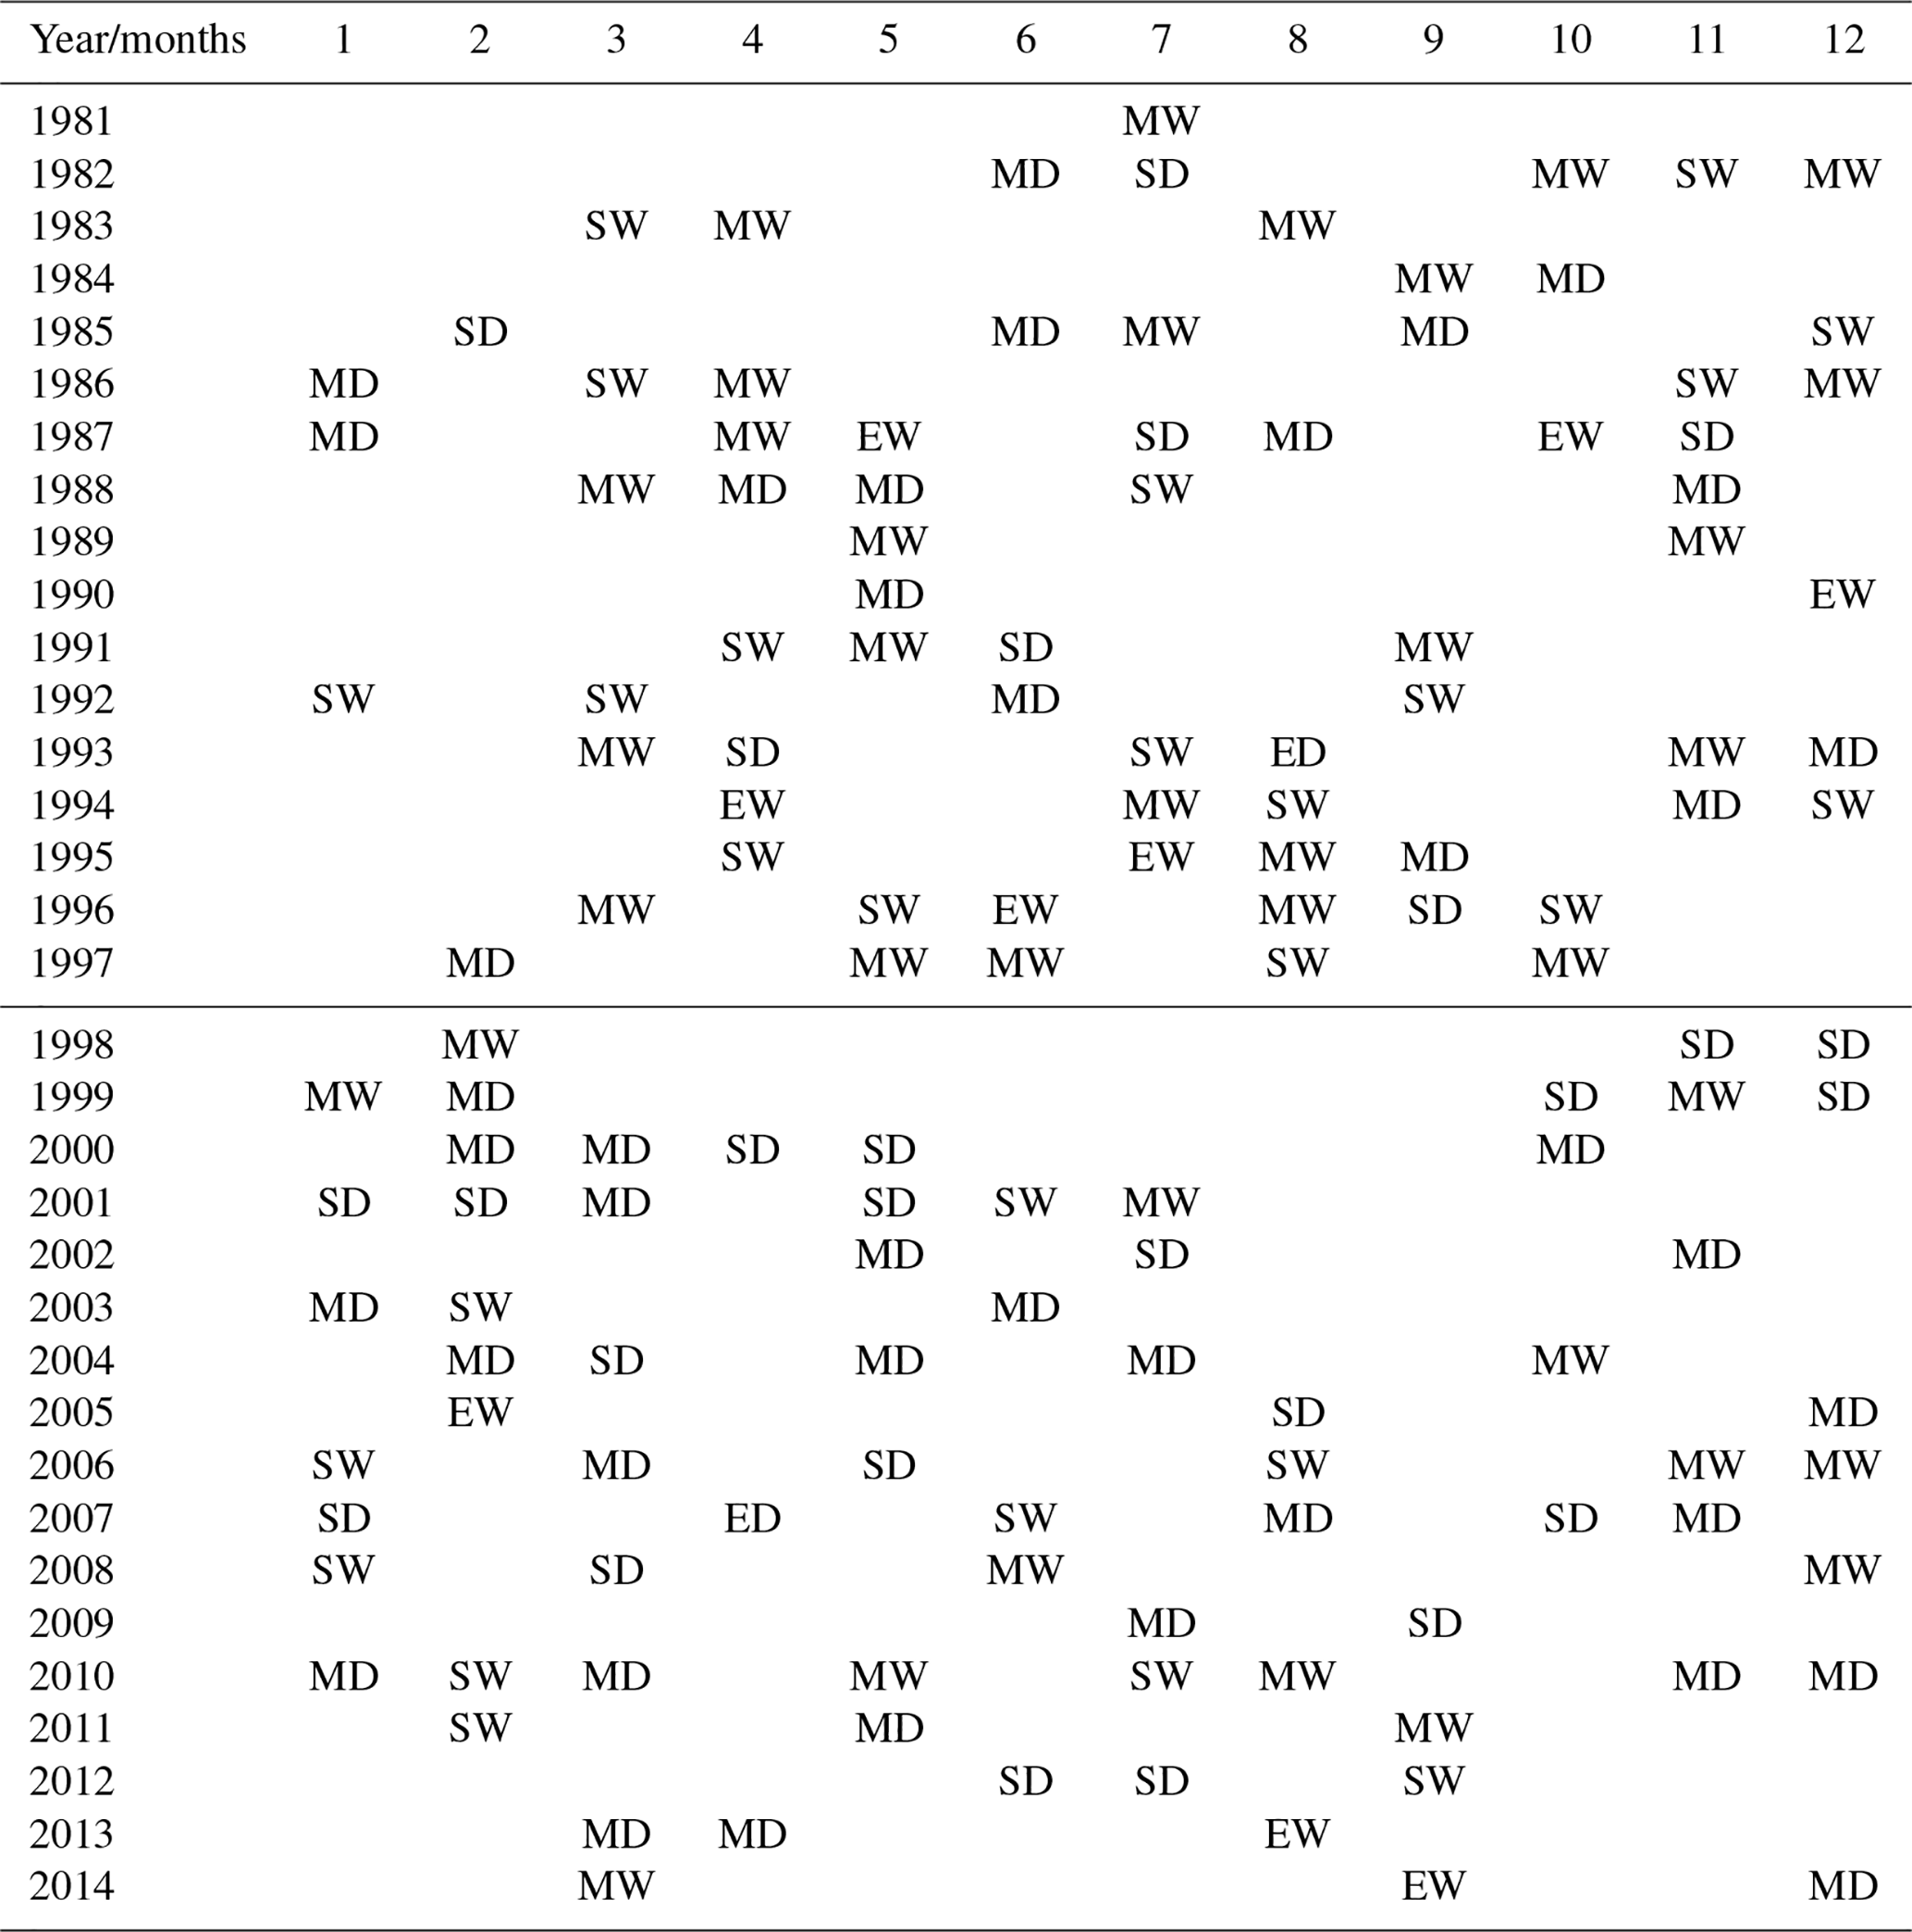
This study focuses on the short-timescale conditions to analyse frequent variations in climatic conditions and their interplay; therefore, more detailed analysis was carried out at the monthly timescale. Moreover, the floods and flash droughts are not clearly associated with long-term SPEI, because the averaging effect of long-term accumulated precipitation and temperature surpasses the signal of extreme precipitation and temperature over a short period. Flash drought is a relatively new type of drought. Currently, there is not a universally accepted definition or criteria for flash drought, though there is general consensus on the principle of rapid onset or intensification characterized by moisture deficits and abnormally high temperatures for a period lasting at least 3 weeks (Lisonbee et al., 2021; Otkin et al., 2018; Hunt et al., 2009). This highlights the usefulness of SPEI at the monthly scale in representing flood and flash drought events. It is noted that the terms “wet–dry events” or “wet–dry months” present similar meaning for our study, as the analysis was made at the monthly time step. A clearer picture of the monthly evolution of wet–dry events of different severity levels and their variability can be seen in Table 2. The SPEI-1 values fluctuate remarkably from one month to another. For example, an extremely wet October in 1987 was followed by a severely dry November, and a severely wet June occurred at the tail of the longest drought spell in May 2001. Such rapid transition from wet to dry and from dry to wet events was more prominent during the first half of the study period (before the year 1997). Another interesting observation concerns the strong change in the basin climatic features which can be noticed around the years 1997–1998. During the first half of the study period (1981–1997), the dominancy of wet events of different categories prevails whereas the basin conditions lean towards dryer conditions during the second half of the period (1998–2014).
Table 2Temporal variations in monthly SPEI over UJB from 1981–2014. The blank cells show normal months, and the different severity levels are presented as EW – extremely wet; ED – extremely dry; SW – severely wet; SD –severely dry; MW – moderately wet; and MD – moderately dry). The line between 1997 and 1998 indicates the strong change in the basin climatic features.
Annual variations in the number of months affected by dry–wet events (SPEI and SPEI ≥1) is displayed in Fig. 3. Usually, every year encountered at least one dry and wet month of any severity level. Approximately 35 % of the total number of months experienced anomalous dry or wet conditions. The proportion of wet months (18.1 %) was slightly higher than that of dry ones (16.9 %).
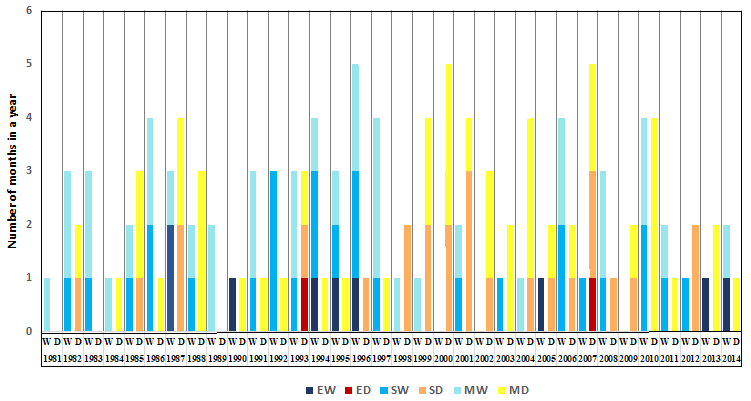
Figure 3Annual variations in the number of months affected by wet–dry conditions during 1984–2014. The brown and blue colours present dry and wet months respectively. Different shades of the colours define the different severity levels (EW – extreme wet; ED – extreme dry; SW – severe wet; SD – severe dry; MW – moderate wet; MD – moderate dry).
5.2 Wet–dry event analysis
The wet–dry event characteristics (duration, severity, and intensity) were computed for each pixel to analyse their spatial distribution. Pixel-based analysis shows the location of the most vulnerable parts of the basin, providing the basis for future decisions on adaptation and mitigation measures. In this study, the total, average, and maximum values of duration, severity, and intensity were computed for the study period (1981–2014). The maps of wet and dry duration are displayed in Fig. 4. Overall, the study area encountered relatively more wet months than dry months during the whole study period. The total wet duration (TWD) and the total dry duration (TDD) vary from 66 to 80 and from 61 to 65 months respectively for most of the basin. The low-elevation parts in the south of the basin show the highest value of TWD whereas the TDD is higher across the Himalaya divide line than in other parts of the basin. The Himalaya divide line is a line in the middle of the UJB at the Pir Panjal mountainous range, separating the dominance of the two precipitation patterns: westerlies in the north-facing slopes and monsoon in the south-facing slopes of the line (Archer and Fowler, 2008).

Figure 4Spatial distribution of total wet duration (TWD), total dry duration (TDD), average wet duration (AWD), average dry duration (ADD), maximum wet duration (MWD), and maximum dry duration (MDD) for the period 1981–2014.
The average wet and dry event durations (AWD and ADD) were found to be similar throughout the basin with a slight difference in the range of 1–2 weeks. However, their spatial patterns were found to be mostly complementary. Maximum wet and dry event durations (MWD and MDD) exhibit high values in two distinct parts of the basin. The MWD is about 6–7 months in the east of the basin, which is located in Kashmir, India, whereas it varies between about 4–5 months and 2–3 months in the northwest and southwest parts of the basin. For the MDD, the northwest and central parts of the basin show higher values (4–5 months) than the remaining parts (2–3 months).
The spatial distribution of total, average, and maximum severity of wet–dry events is presented in Fig. 5. All wet–dry severity maps show similar spatial patterns as wet–dry duration maps. In terms of total wet severity (TWS) and total dry severity (TDS), the wet and dry hotspots are located in the south and middle (across Himalaya divide line) of the basin respectively. Unlike the spatial patterns of TDD, the TDS is relatively higher in the north of the basin above the Himalaya divide line. This shows more intense dry events in this part of the basin. The underlying reason for higher TDS could be the higher warming rates in western Himalaya, hosted in the north of the basin. The average severity of wet and dry events is categorized from moderate to severe levels. The average wet severity (AWS) exhibits random spatial patterns, whereas the average dry severity (ADS) is relatively higher in the north of the basin. Observed spatial patterns of maximum wet severity (MWS) and maximum dry severity (MDS) were similar to those of MWD and MDD. The eastern part of the basin experienced wet events of higher severity than the western one, whereas the most severe dry events affected the northwest and central parts of the basin.
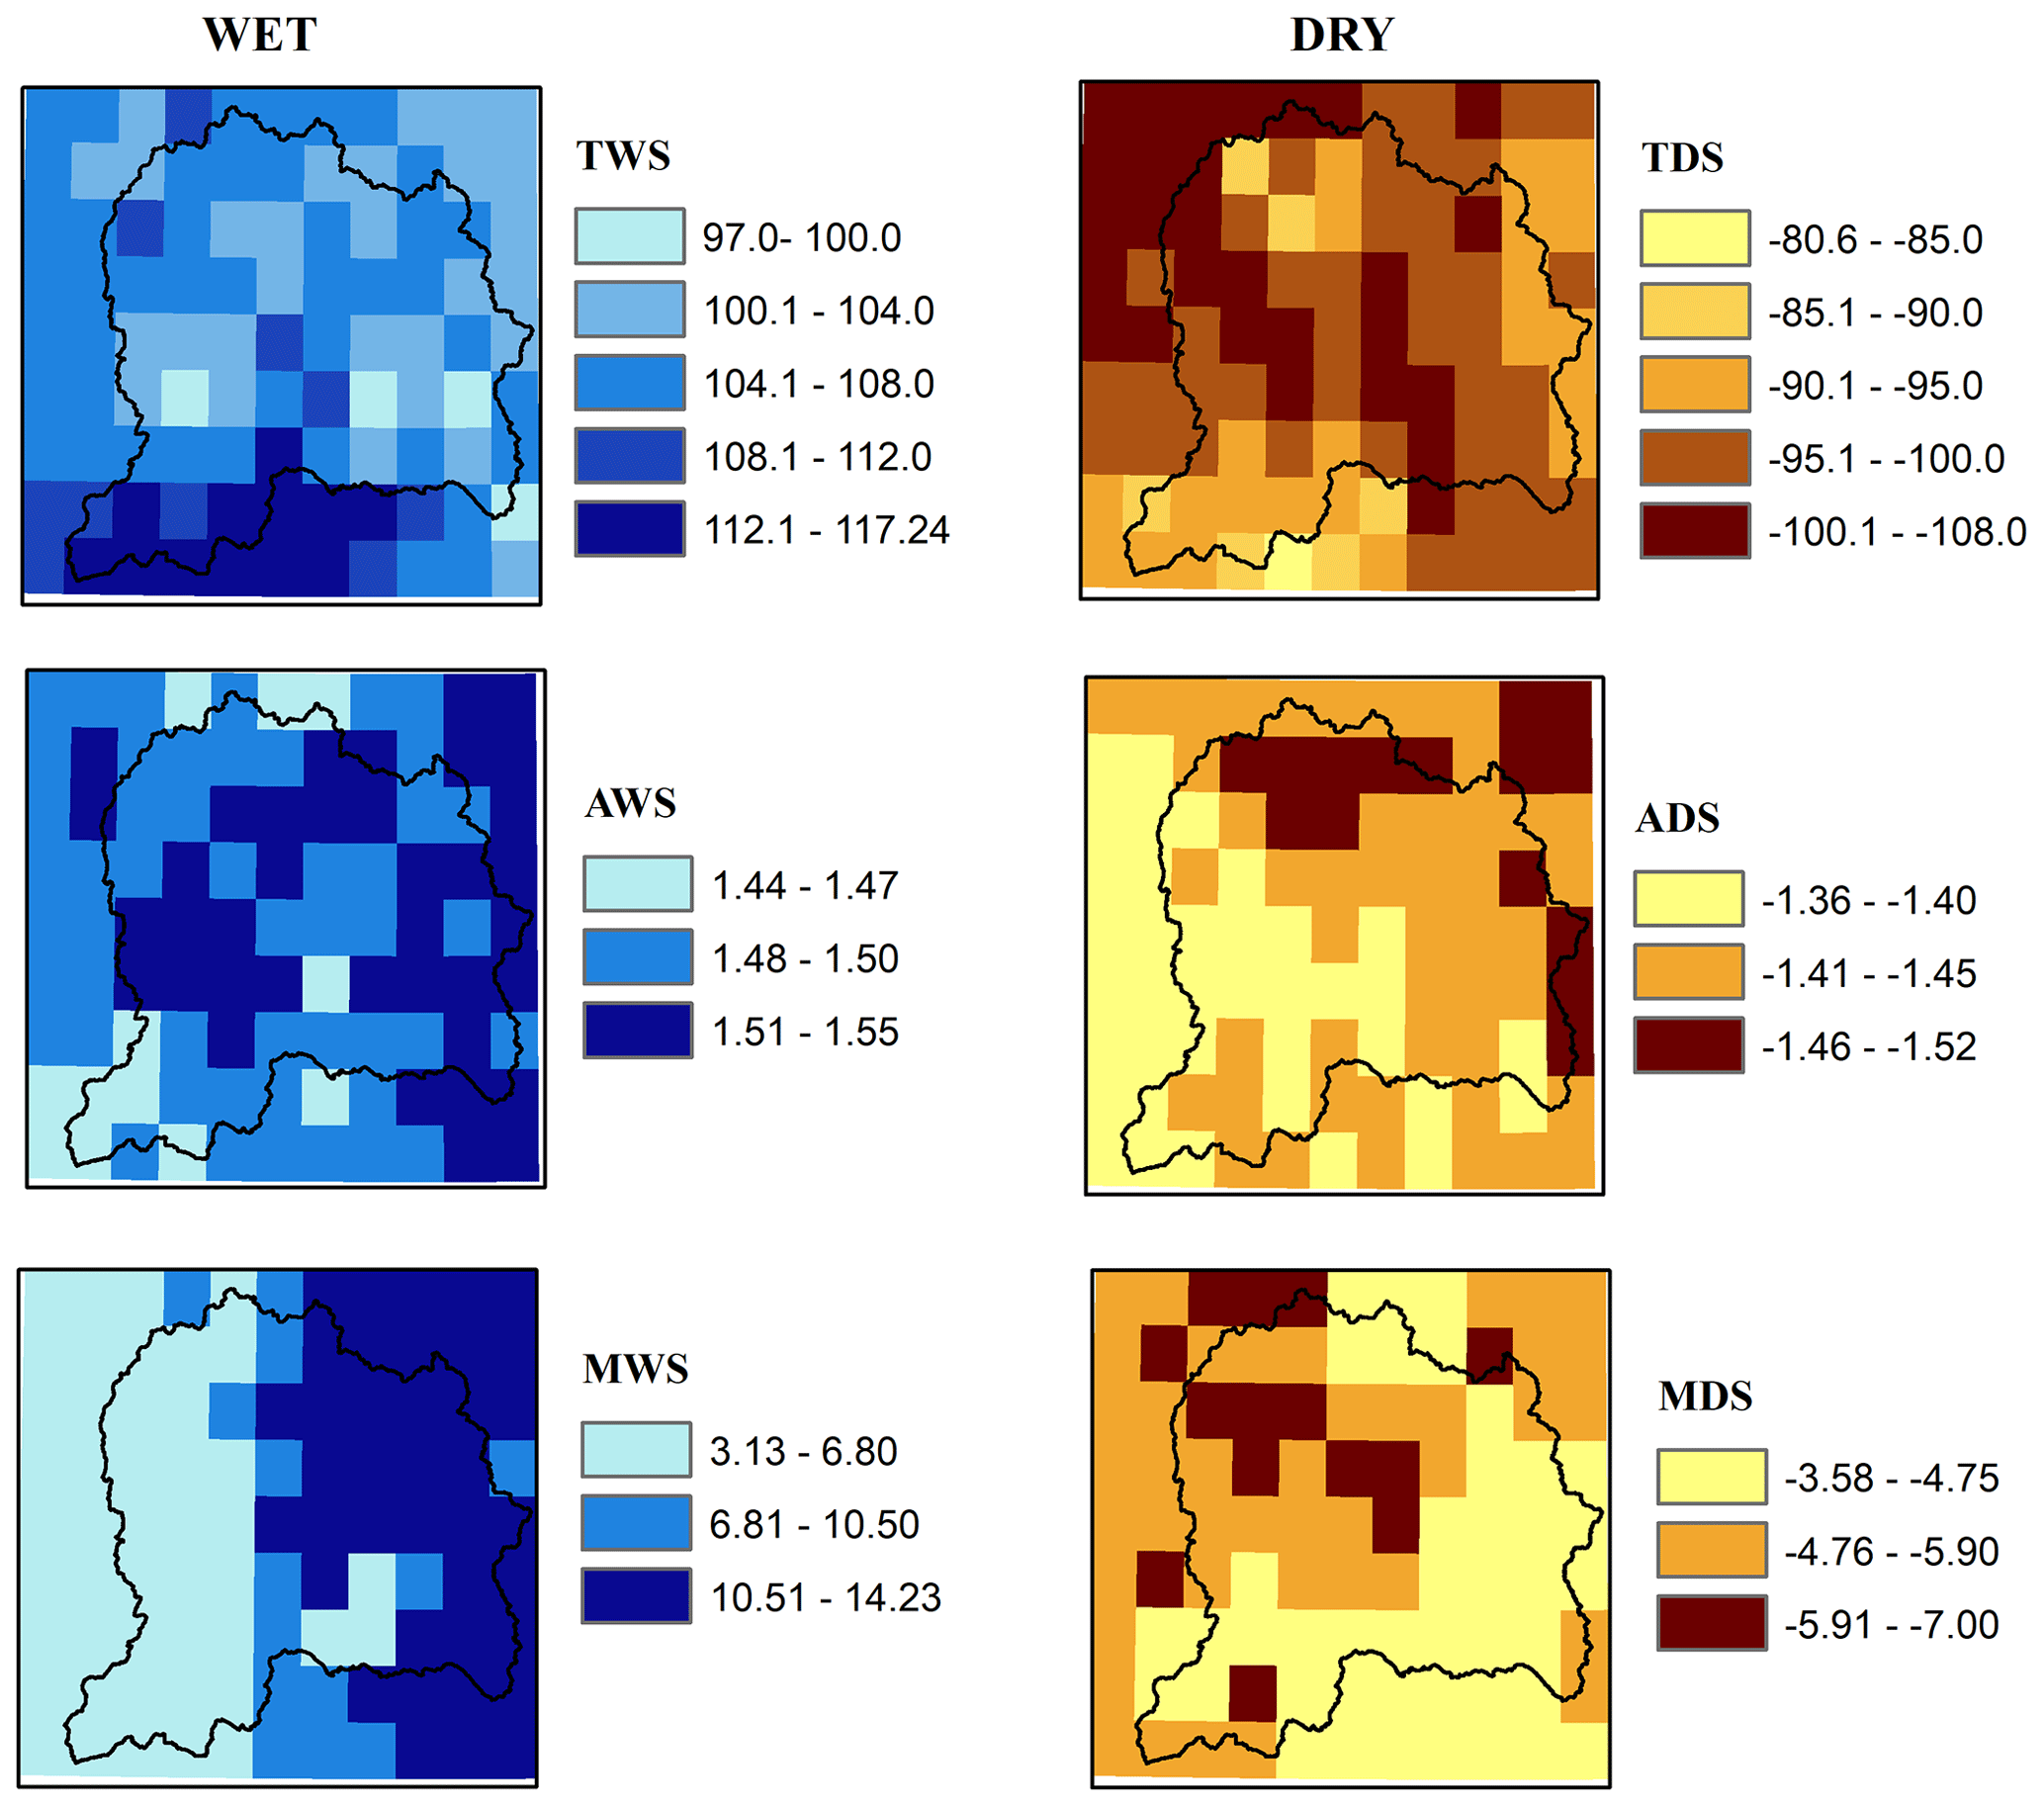
Figure 5Spatial distribution of total wet severity (TWS), total dry severity (TDS), average wet severity (AWS), average dry severity (ADS), maximum wet severity (MWS), and maximum dry severity (MDS) for the period 1981–2014.
Figures 6 illustrates the spatial distribution of intensities of wet–dry events, calculated as the ratio of severity to duration. The total wet intensity (TWI) and total dry intensity (TDI) vary from moderate to severe with a noted range of 1.44 to 1.55 and −1.36 to −1.52 for wet and dry events respectively. Irrespective of TWD and TWS, which is highest in the south of the basin, TWI is more intense in the middle and northeast of the basin. The TDI is found to be more intense over western Himalaya, north of the basin. The average wet intensity (AWI) and average dry intensity (ADI) vary within the moderate class of hazard. However, their spatial patterns are much different from average duration (AWD and ADD) and average severity (AWS and ADS) patterns. Regarding maximum intensities, the spatial patterns of maximum wet intensity (MWI) resemble the patterns of MWD and MWS well, whereas the maximum dry intensity (MDI) exhibits much different spatial patterns from MDD and MDS. The dry events are found to be more intense than wet events, but only for a few pixels in the southwest of the basin. On the other hand, wet events with higher intensities are found to be more widespread than dry events.
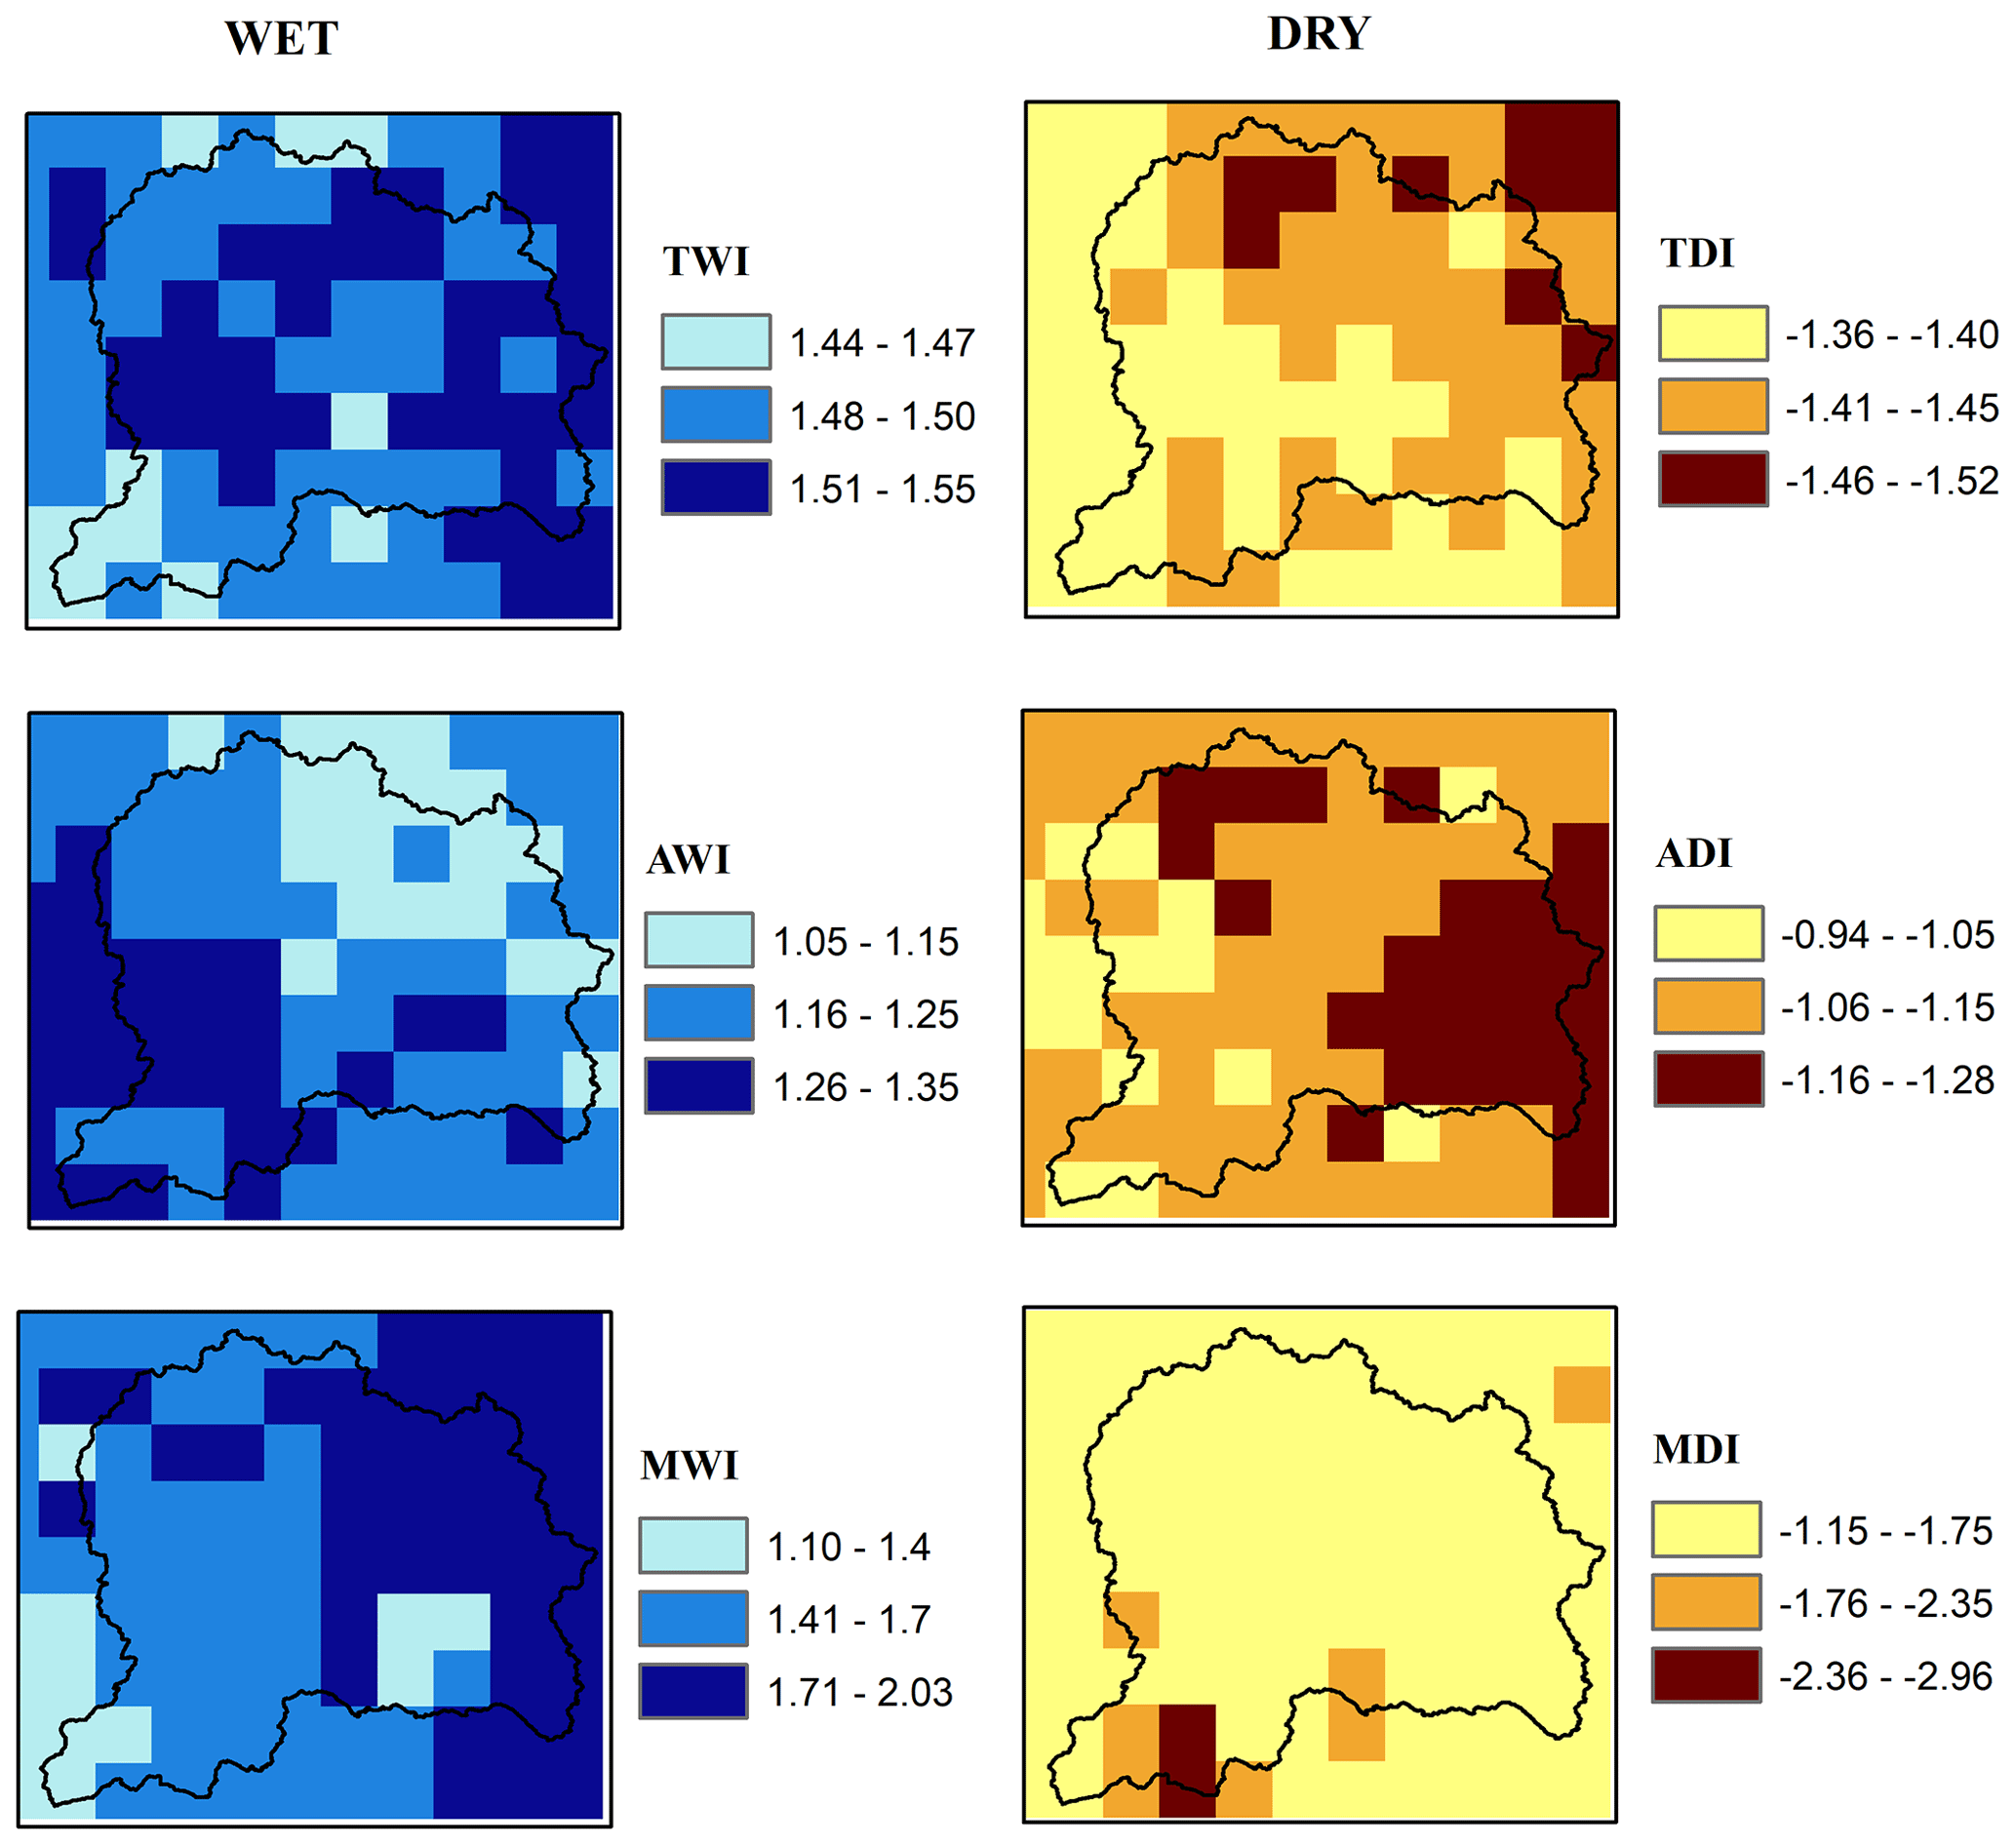
Figure 6Spatial distribution of total wet intensity (TWI), total dry intensity (TDI), average wet intensity (AWI), average dry intensity (ADI), maximum wet intensity (MWI), and maximum dry intensity (MDI) for the period 1981–2014.
5.3 Wet–dry ratio
The WD ratio features the dominance of wet or dry events for the period of 34 years (1981–2014). The WD ratio for the three severity levels (moderate, severe, and extreme) at pixel basis is presented in Fig. 7. The positive and negative values of WD ratio depict the prevalence of wet and dry events respectively. As the figure shows, higher frequencies of moderate dry events with respect to moderate wet events were found throughout the basin except for a few pixels in the south. By contrast, severe to extreme wet events are more frequent for most parts of the basin. The highest positive values of WD ratio for extreme level of hazard were found in the southwest of the basin, which shows the higher susceptibility of the area towards extreme wet events. Moreover, the analysis of wet–dry event characteristics also revealed the prevalence of wet events with higher duration and severity over monsoon-dominated regions.
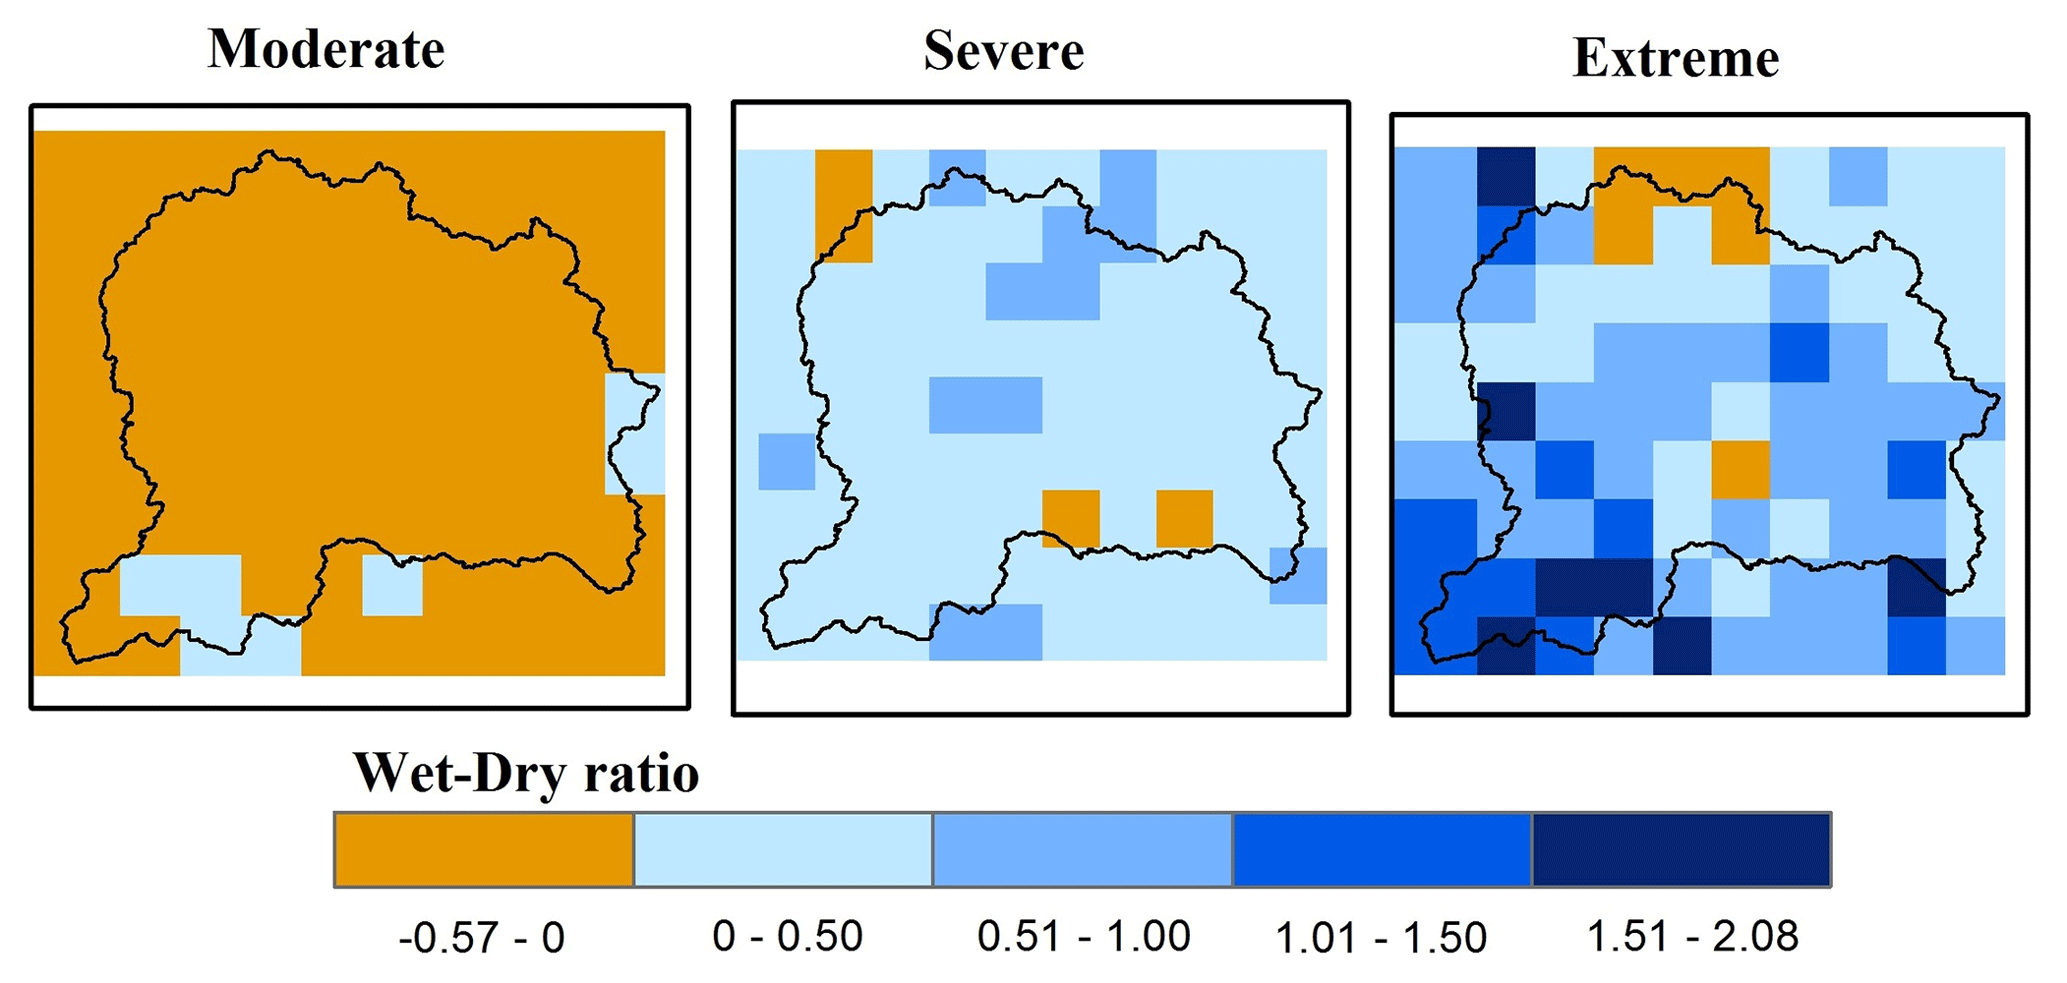
Figure 7Spatial distribution of wet–dry (WD) ratio derived for three levels of severity (moderate, severe, and extreme) during the period 1981–2014. Blue (WD ratio>0) means that the area experienced more wet than dry events. Brown (WD ratio<0) indicates the opposite.
5.4 Wet–dry transition time
The number of transitions and their average transition time for wet-to-dry and dry-to-wet events for the period 1981–2014 are presented in Figs. 8 and 9. As expected, the number of transitions for wet-to-dry and dry-to-wet events was the highest for the moderate level of events, followed by severe and extreme levels of events. Consequently the average transition time from wet-to-dry and dry-to-wet events was found to be the highest for the extreme level of event followed by severe and moderate levels of events. The number of transitions for moderate, severe, and extreme levels of events varies from 15 to 26, from 6 to 16, and from 1 to 5 respectively. Overall, the number of transitions for dry-to-wet events is larger than the wet-to-dry events for severe and extreme levels of events, whereas the opposite was found for the moderate level of events. The transition time for moderate, severe, and extreme levels of events varies from 1.8 to 6.5, from 1.8 to 16.75, and from 3.5 to 187.0 months respectively. Overall, 53.57 % and 17.86 % of pixels in the UJB showed longer transition time from wet to dry than from dry to wet for moderate and extreme levels, whereas the opposite was seen for severe events.
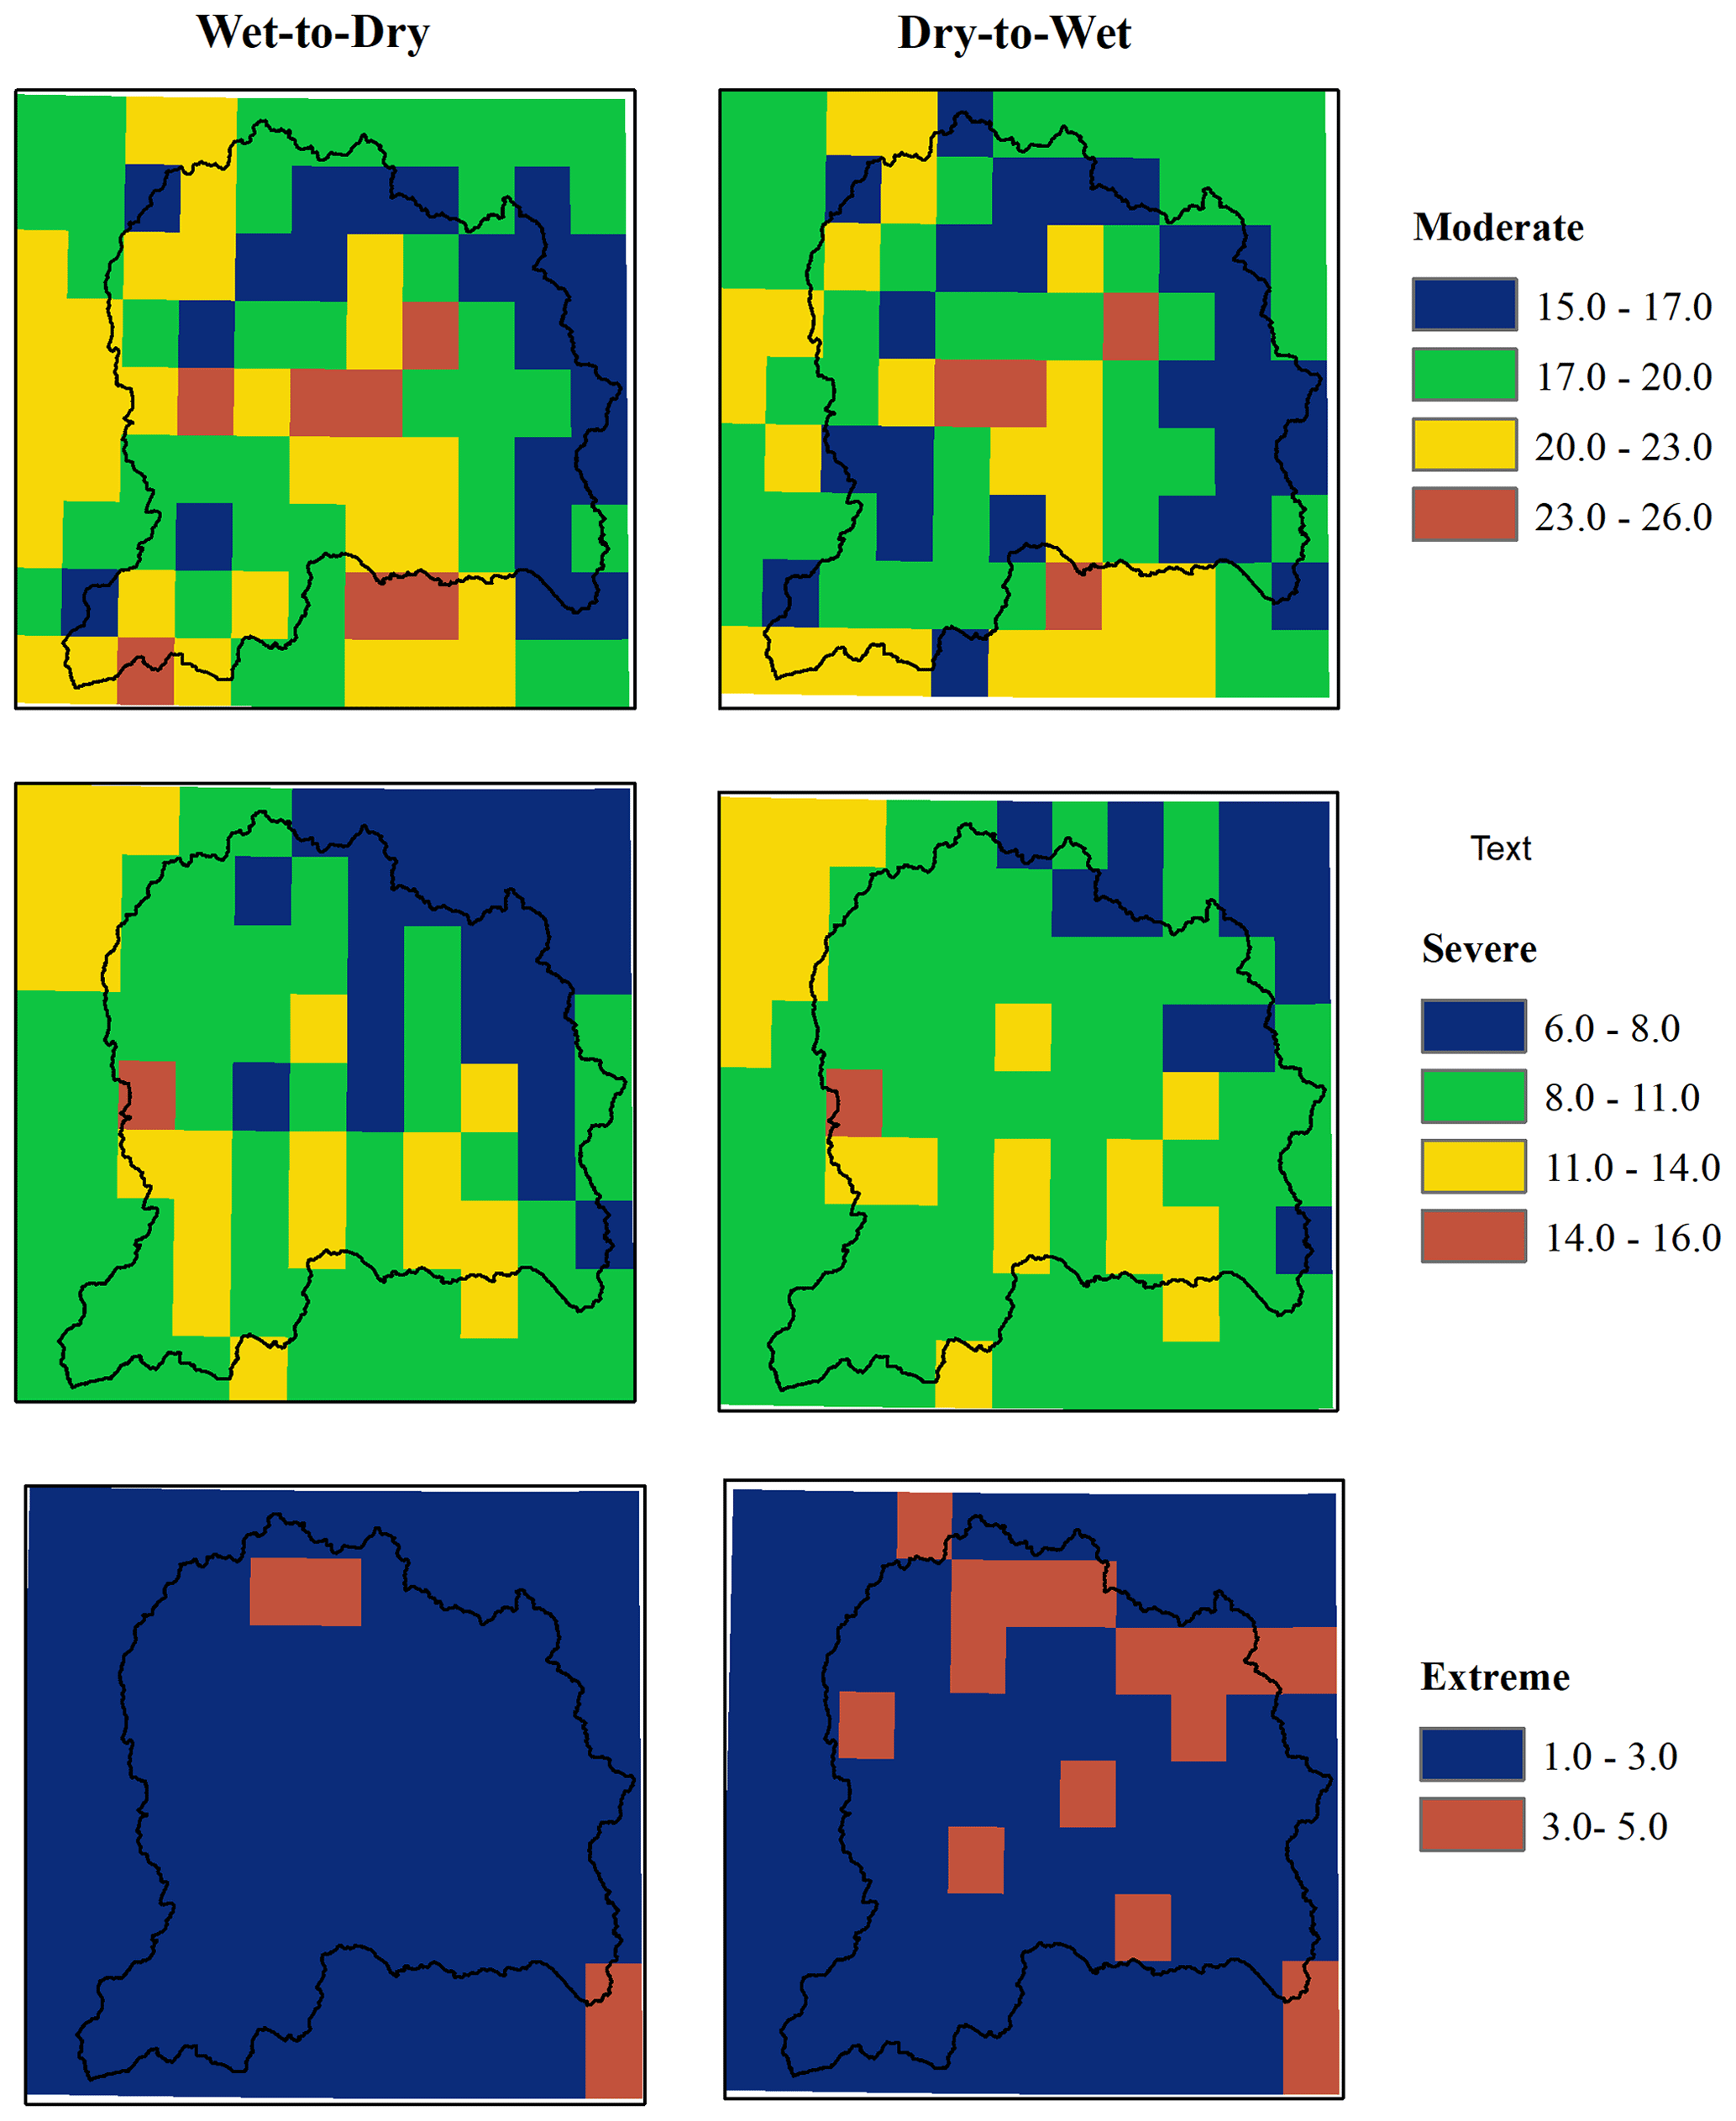
Figure 8Number of transitions from wet-to-dry (left) and dry-to-wet (right) events for three levels of severity (moderate, severe, extreme) for the period 1981–2014.
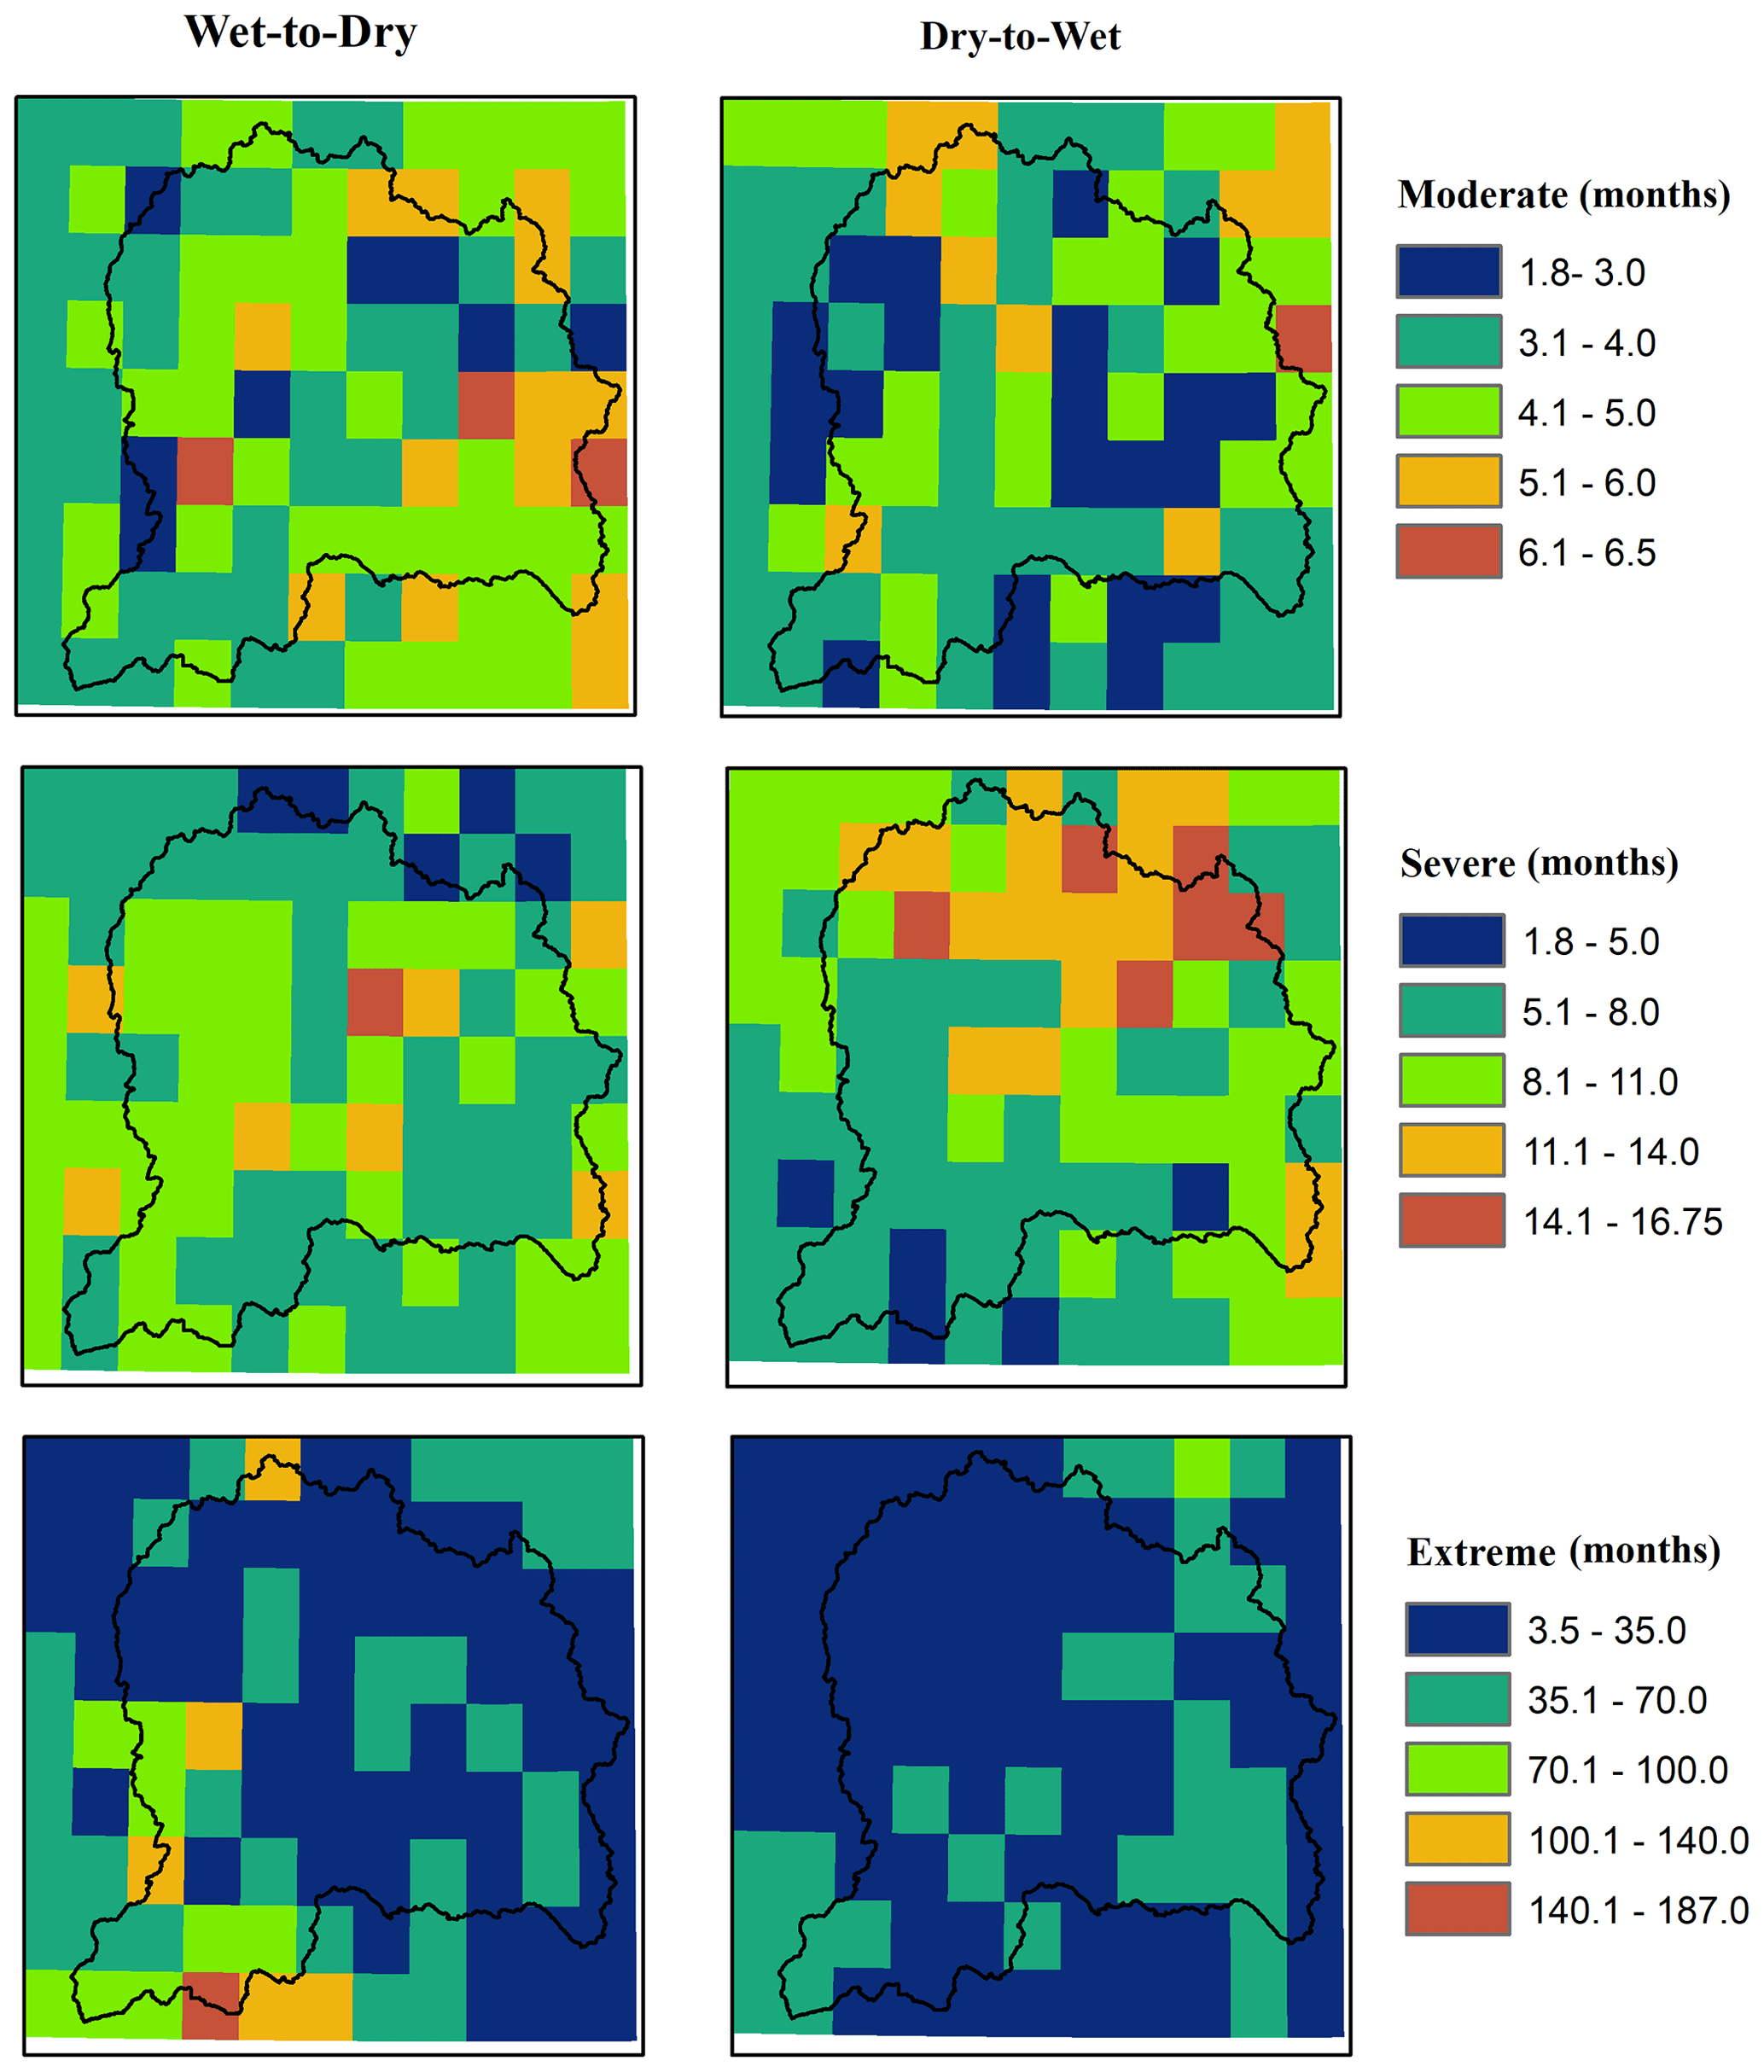
Figure 9Average transition time (Tt) intervals in months for wet-to-dry (left) and dry-to-wet (right) events for three levels of severity (moderate, severe, extreme) for the period 1981–2014.
5.5 Wet–dry rapid-transition events
The wet–dry rapid transition is the consecutive occurrence of wet and dry months of any severity level. The frequency of wet-to-dry (wet month followed by dry month) and dry-to-wet (dry month followed by wet month) rapid-transition events was computed for each grid cell and is shown in Fig. 10. The frequency of wet–dry transition events varies/ranges from 5 to 20 events during the 34 years of the study period. About 50 % of pixels in the UJB encountered a higher number of wet events terminated at dry months. The spatial distribution of frequency of wet–dry rapid-transition events revealed that the wet-to-dry events are less frequent over the westerlies-dominated region of the basin, whereas the southwestern part of the basin was more affected by the abrupt wet-to-dry events. By contrast, abrupt dry-to-wet events are found to be more frequent over pixels surrounding the Himalaya divide line, whereas the remaining part of the basin depicts less incidence of dry-to-wet events.
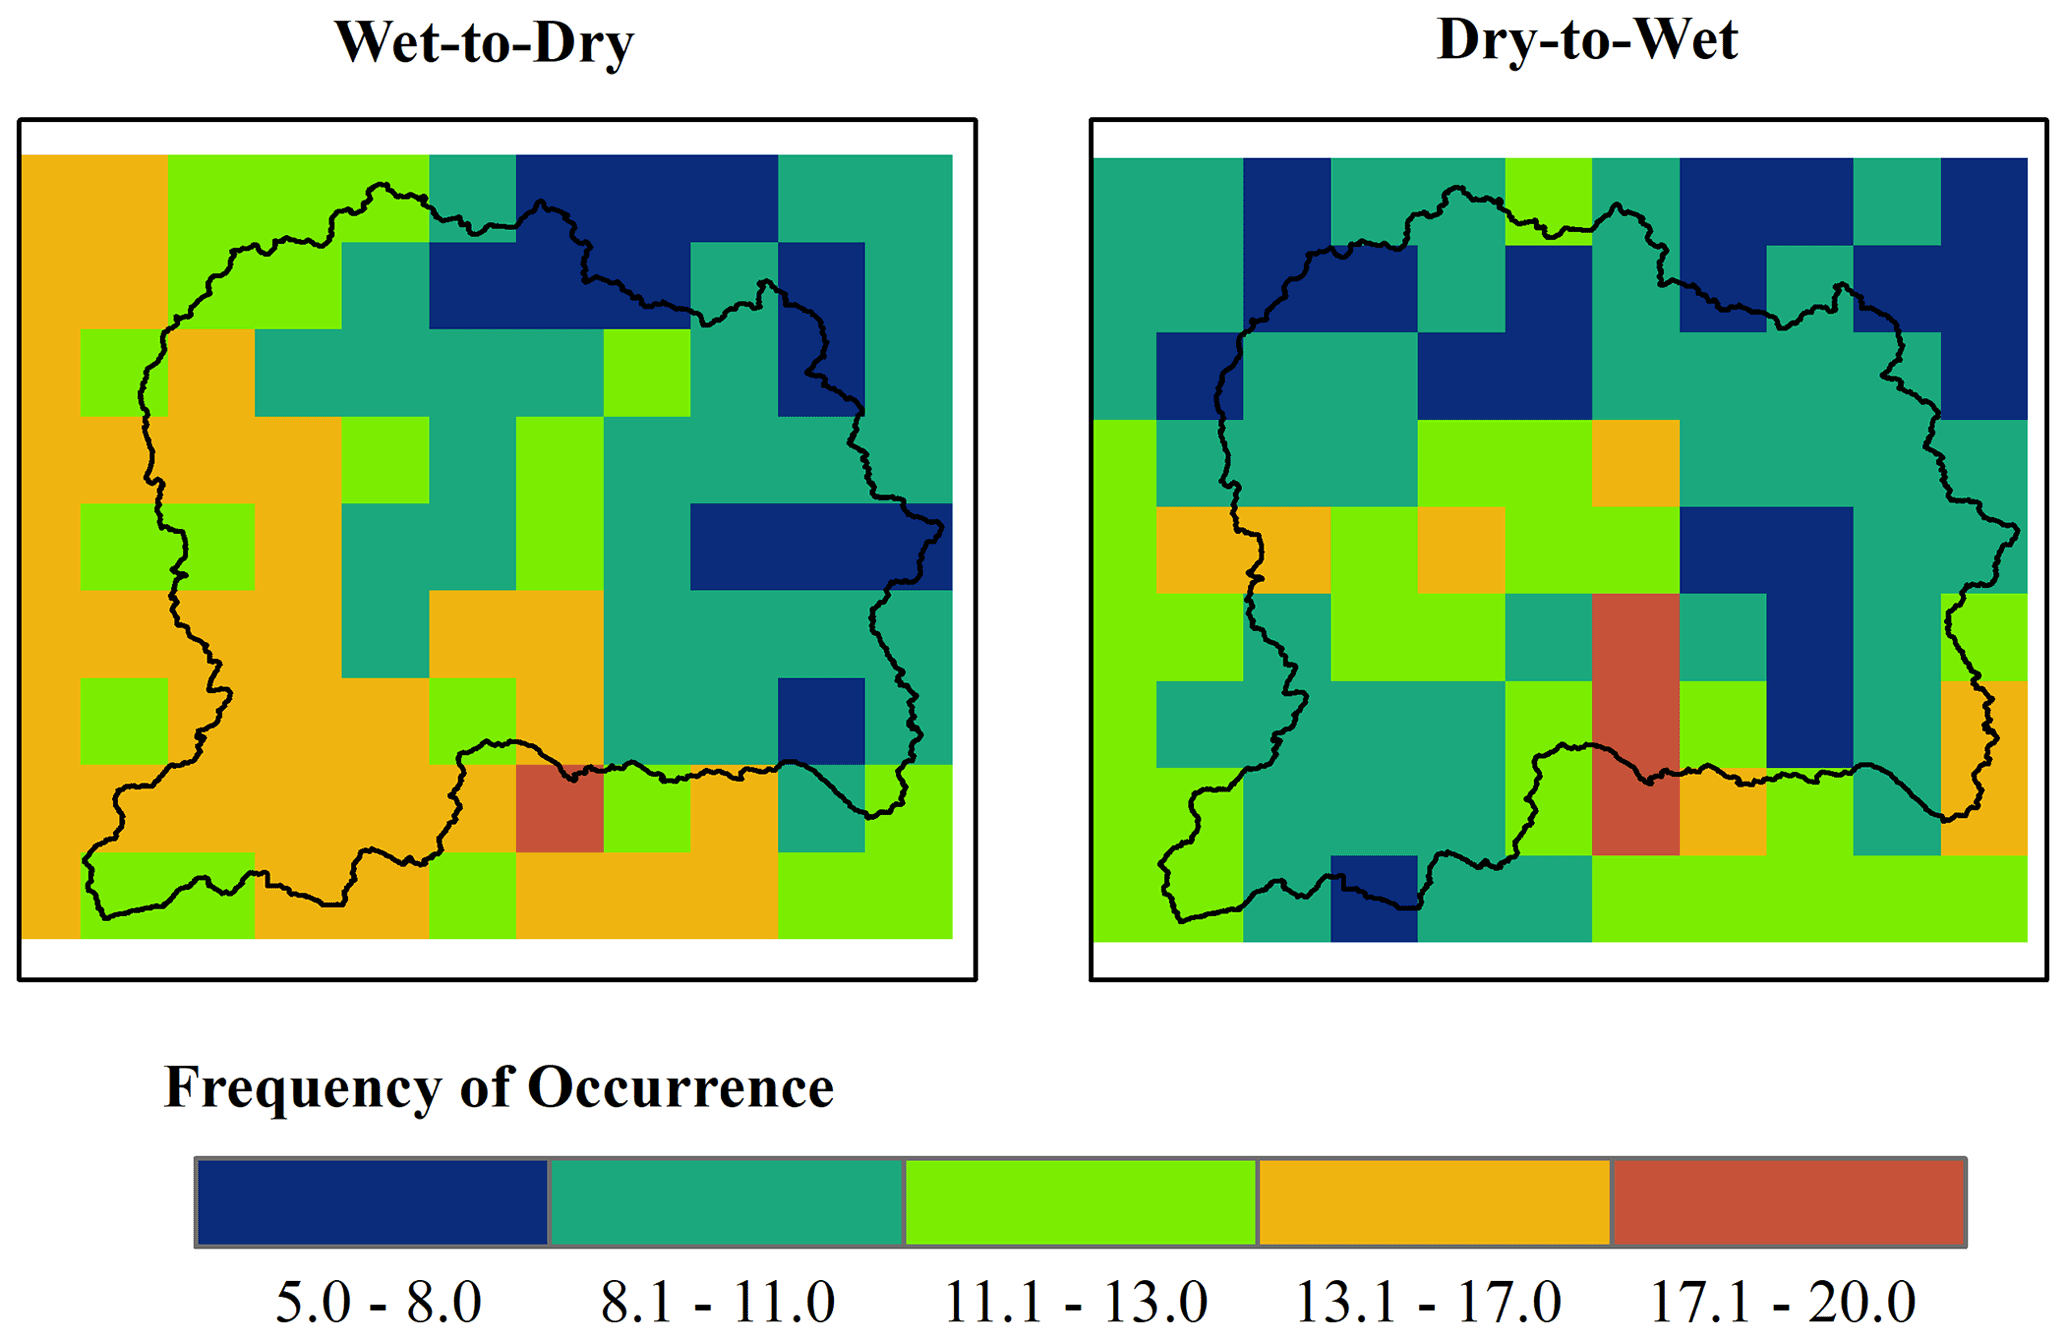
Figure 10Frequency of occurrence of abrupt events, wet to dry (left) and dry to wet (right), during the period 1981–2014.
This study attempts to investigate the spatiotemporal variations in wet–dry events collectively, their characteristics (duration, severity, intensity), and transition from wet-to-dry and dry-to-wet events during the period 1981–2014 in the Upper Jhelum Basin (UJB) in South Asia. The SPEI, which incorporates both precipitation and potential evapotranspiration, was used to extract and analyse the wet–dry events. The whole analysis was carried out at the monthly timescale, but the temporal evolution of the basin-averaged index was also simulated at multiple timescales (1, 3, 6, and 12 months). The reason for selecting the monthly timescale for this study is that it is expected to provide the best performance in detecting floods and flash droughts, as longer time steps are more appropriate for long-term droughts only and not for floods.
The results of temporal variations in SPEI showed that the study domain mostly encountered moderate to severe wet–dry events, whereas the extreme wet–dry events rarely occurred during the study period. The results of basin-average SPEI at multiple timescales revealed that the response of SPEI to the deviations in climatic features varies with the accumulation time. Therefore, shorter timescales are more appropriate for detecting frequent seasonal and inter-annual variations, whereas longer timescales provide useful information regarding the signature of the events over the region (Ayugi et al., 2020; Du et al., 2013). Furthermore, the SPEI time-series plots capture the observed extreme floods and drought events that occurred in the basin during the study period well: for instance, the longest drought event occurred from the late 1990s to early 2000s, as evident in Fig. 2 and Table 2. The drought started in 1998 and was considered to be the worst in the history of Pakistan. The drought spell in 2001–2002 resulted in water shortage of up to 51 % of normal supplies (Ahmad et al., 2004). Likewise, the notable flooding events, usually flash floods ranging from moderate to severe, occurred in the years 1988, 1992, 1994, 1997, 2007, and 2014 (Bhat et al., 2019) and were well captured by the SPEI, confirming its valuable contribution to this type of analysis.
An interesting clue to the changing climate is the strong change that occurred in the basin at the end of 1997 (Table 2). Before this change (1981–1997), wet events of different severity levels predominated in the basin, whereas dryer conditions prevailed after 1997. However, it still needs to be investigated whether dryer conditions are expected to continue in the future or whether a large multi-decadal variation is taking place. This strong change in the basin climate coincides with the strongest El Niño–Southern Oscillation (ENSO) event in the winter season of 1997–1998, where the Oceanic Niño Index (ONI) peaked at 2.3 and influenced the climate conditions all over the world (MRCC, 2021). The 1998–2002 drought in southwestern Asia, accompanied by the most severe drought conditions in the last 50 years, was also a result of this strong ENSO event (Ain et al., 2020; Ahmed et al., 2018). ENSO is the primary mode of inter-annual variability, having great influence on global weather and climate via atmospheric circulations (Ullah et al., 2021a). Many researchers reported the close association between variations in atmospheric circulation patterns and climatic variables, extreme weather phenomena like drought and flood (Luca et al., 2020; Omidvar et al., 2016; Sun et al., 2015). Kenyon and Hegerl (2010) examined the response patterns of hydroclimate extremes to ENSO over global land areas and stated a significant decrease in precipitation extremes over Southeast Asia, Indonesia, Australia, and the northernmost region of South America during El Niño phases, whereas in the southern tier of the United States and the region from Argentina to southern Brazil heavy precipitation increased during El Niño phases, and vice versa during La Niña phases. The strength of such connections for Pakistan was also demonstrated in several studies. El Niño suppresses monsoon rainfall activity over Pakistan, while La Nina has a negative impact on winter precipitation over Pakistan (Farooqi et al., 2005; Khan, 2004). Ullah et al. (2021a) found significant impacts of three large-scale climate indices, i.e sea surface temperature (SST) and multivariate El Niño–Southern Oscillation (ENSO4.0), on seasonal droughts across Pakistan.
The results of wet–dry event characteristics (duration, severity, intensity) at pixel basis outline the greater susceptibility of the westerlies-dominated region to dry events with higher duration, severity, and intensity. The dryer conditions in this region could be explained with the increasing rates of global warming over the mountainous region of the basin, also reported by many researchers (Rashid et al., 2020; Shafiq et al., 2020; Zaz et al., 2019). Studies by Negi et al. (2018) and Dimri and Dash (2012) also confirm that most of the western Himalayan region recorded a significant warming trend from 1975 onwards in particular. This is also supported by the tree-ring chronologies of the region, which indicate a rapid growth of the tree rings in recent decades, especially at higher altitudes (Borgaonkar et al., 2009). The impact of global warming on short-term dry events (soil moisture drought) is not straightforward as rising temperature did not necessarily cause increase in actual ET, especially in arid and semiarid regions (Trenberth et al., 2014; Sheffield et al., 2012). In fact the rate and amount of ET results from a complex interaction of temperature, radiation balance, precipitation rates and vegetation physiological control, rather than being exclusively limited by one of these factors. For flash drought, the rapid soil moisture decline should be a result of the intensification of ET driven by higher temperature, which is very common in humid and semi-humid regions, where soil moisture can sustain higher ET amounts up to a few weeks (Yuan et al., 2019). Further decrease in winter and spring precipitation leads to water deficit conditions in this part of the basin. The worst drought event period (2000–2001), partially induced by a stronger ENSO in winter, was also due to the low winter and spring precipitation, as shown in Table 2. During 2000–2001, winter and spring seasons were moderately to severely dry, whereas the monsoon and autumn seasons observed normal months. By contrast, the higher duration and severity of wet events were detected in the monsoon-dominated region, implying that floods mainly occurred during monsoon season with heavy rainfall along with snowmelt. However, the eastern part of the basin was the hotspot of more intense wet events. The above discussion is also supported by the historic database of observed flood events, as most of these events occurred during monsoon season.
The results of the WD ratio showed the prevalence of severe to extreme wet events for most of the basin, while the dry events of moderate severity level were more frequent in the study domain. The southwestern part of the basin, located in the monsoon-dominated region, was found to be the hotspot for the extreme wet events. Moreover, the analysis of wet–dry event characteristics also revealed the prevalence of wet events with higher duration and severity over the same monsoon-dominated region. The spatial patterns of average transition time from one extreme type to the other type was found to be heterogeneous and different for the three severity levels. Overall, a greater number of pixels took a shorter time to switch from dry to wet events than from wet to dry events. Apart from the average transition period, the study domain also experienced rapid transition of wet–dry events. In general, the surrounding region of the Himalaya divide line and the monsoon-dominated part of the basin were found to be the hotspots of rapid wet–dry transition. The rapid wet–dry swings could be explained in the context of global warming. In a warmer climate, increased evapotranspiration rates in response to increased temperature could elevate the drought risk and frequency. At the same time, the prospect of localized heavy precipitation causing floods is expected to increase in response to increased atmospheric moisture content due to increased evapotranspiration rates (He and Sheffield, 2020; Krishnan et al., 2020). Further warming-induced changes in global climate variability, such as El Niño and La Niña, can cause more inter-annual variability or persistence in global weather and climate, significantly affecting regional precipitation and temperature distribution in space and time (Ullah et al., 2021b). Further compelling scientific evidence of human interventions, such as boosted human water intake and land use changes, exacerbates the extreme flood and drought risk hazard.
To conclude, knowledge of wet–dry event characteristics and their rapid transition provides meaningful insight into the geographical hotspots of compound extreme events, which could be of practical value to inform a group of stakeholders (researchers, local authorities, policy makers, relief agencies, non-governmental organizations (NGOs), and (re)insurance companies) on the potential risk. In general, results contribute to hydrological predictability and risk assessment and therefore effectively support disaster preparedness and risk management, ensuring the regional water, food, and socio-economic security and stability against the background of a changing environment. Future work should explore to what extent future wet–dry event frequency will respond to anthropogenic forcing, internal atmospheric processes, and human interventions.
All calculations and plots were produced using ArcMap (version 10.8) and R (version3.3.2) by making use of open-source R packages. The potential evapotranspiration (PET) and standardized precipitation evapotranspiration index (SPEI) were calculated with the R package “SPEI” (version 1.7). The interpolation of PET values was done using the R package “hydroTSM” (Version 0.6-0). Data and code written to generate the figures are available from the corresponding author upon request.
The ERA5 precipitation data can be accessed online (DOI: https://doi.org/10.24381/cds.adbb2d47, Hersbach et al., 2018). For the Pakistani region, the observed precipitation and temperature data are available from the Pakistan Meteorological Department (PMD) and Water and Power Development Authority (WAPDA) upon request. For the Indian region, Indian Meteorological Department (IMD) daily gridded precipitation and temperature datasets are freely available (https://cdsp.imdpune.gov.in/home_gridded_data.php, Pai et al., 2014).
The supplement related to this article is available online at: https://doi.org/10.5194/nhess-22-287-2022-supplement.
This paper was conceptualized by RA and GG. RA performed the data analysis and visualization. The original draft was written by RA and revised by GG.
The contact author has declared that neither they nor their co-authors have any competing interests.
Publisher's note: Copernicus Publications remains neutral with regard to jurisdictional claims in published maps and institutional affiliations.
This article is part of the special issue “Recent advances in drought and water scarcity monitoring, modelling, and forecasting (EGU2019, session HS4.1.1/NH1.31)”. It is a result of the European Geosciences Union General Assembly 2019, Vienna, Austria, 7–12 April 2019.
The authors are grateful to the Pakistan Meteorological Department (PMD) and Water and Power Development Authority (WAPDA) for sharing the data.
The authors received funding from the Cooperation Agreement PFK PhD programme 2019–2022 “Partnership for Knowledge-Platform 2: Health and WASH (WAter Sanitation and good Hygiene)” of the AICS-Italian Agency for Development Cooperation to attend higher education programmes in Italy in favour of non-Italian citizens.
This paper was edited by Brunella Bonaccorso and reviewed by two anonymous referees.
Ahmad, S., Hussain, Z., Qureshi, A. S., Majeed, R., and Saleem, M.: Drought mitigation in Pakistan: current status and options for future strategies, vol. 85, IWMI, ISBN 92-9090-580-8, 2004.
Ahmed, K., Shahid, S., and Nawaz, N.: Impacts of climate variability and change on seasonal drought characteristics of Pakistan, Atmos. Res., 214, 364–374, https://doi.org/10.1016/j.atmosres.2018.08.020, 2018.
Ain, N., Latif, M., Ullah, K., Adnan, S., Ahmed, R., Umar, M., and Azam, M.: Investigation of seasonal droughts and related large-scale atmospheric dynamics over the Potwar Plateau of Pakistan, Theor. Appl. Climatol., 140, 69–89, https://doi.org/10.1007/s00704-019-03064-8, 2020.
Akhtar, T., Mushtaq, H., and Hashmi, M. Z.-R.: Drought monitoring and prediction in climate vulnerable Pakistan: Integrating hydrologic and meteorologic perspectives, Hydrol. Earth Syst. Sci. Discuss. [preprint], https://doi.org/10.5194/hess-2020-297, in review, 2020.
Ali, Z., Hussain, I., and Faisal, M.: Annual Characterization of Regional Hydrological Drought using Auxiliary Information under Global Warming Scenario, Nat. Hazards Earth Syst. Sci. Discuss. [preprint], https://doi.org/10.5194/nhess-2018-373, 2019.
Arias, P. A., Bellouin, N., Coppola, E., Jones, R. G., Krinner, G., Marotzke, J., Naik, V., Palmer, M. D., Plattner, G.-K., Rogelj, J., Rojas, M., Sillmann, J., Storelvmo, T., Thorne, P. W., Trewin, B., Achuta Rao, K., Adhikary, B., Allan, R. P., Armour, K., Bala, G., Barimalala, R., Berger, S., Canadell, J. G., Cassou, C., Cherchi, A., Collins, W., Collins, W. D., Connors, S. L., Corti, S., Cruz, F., Dentener, F. J., Dereczynski, C., Di Luca, A., Niang, A. D., Doblas-Reyes, F. J., Dosio, A., Douville, H., Engelbrecht, F., Eyring, V., Fischer, E., Forster, P., Fox-Kemper, B., Fuglestvedt, J. S., Fyfe, J. C., Gillett, N. P., Goldfarb, L., Gorodetskaya, I., Gutierrez, J. M., Hamdi, R., Hawkins, E., Hewitt, H. T., Hope, P., Islam, A. S., Jones, C., Kaufman, D. S., Kopp, R. E., Kosaka, Y., Kossin, J., Krakovska, S., Lee, J.-Y., Li, J., Mauritsen, T., Maycock, T. K., Meinshausen, M., Min, S.-K., Monteiro, P. M. S., Ngo-Duc, T., Otto, F., Pinto, I., Pirani, A., Raghavan, K., Ranasinghe, R., Ruane, A. C., Ruiz, L., Sallée, J.-B., Samset, B. H., Sathyendranath, S., Seneviratne, S. I., Sörensson, A. A., Szopa, S., Takayabu, I., Tréguier, A.-M., van den Hurk, B., Vautard, R., von Schuckmann, K., Zaehle, S., Zhang, X., and Zickfeld, K.: Technical Summary, in: Climate Change 2021: The Physical Science Basis, Contribution of Working Group I to the Sixth Assessment Report of the Intergovernmental Panel on Climate Change, edited by: Masson-Delmotte, V., Zhai, P., Pirani, A., Connors, S. L., Péan, C., Berger, S., Caud, N., Chen, Y., Goldfarb, L., Gomis, M. I., Huang, M., Leitzell, K., Lonnoy, E., Matthews, J. B. R., Maycock, T. K., Waterfield, T., Yelekçi, O., Yu, R., and Zhou, B., Cambridge University Press, in press, 2022.
Ayugi, B., Tan, G., Niu, R., Dong, Z., Ojara, M., Mumo, L., Babaousmail, H., and Ongoma, V.: Evaluation of meteorological drought and flood scenarios over Kenya, East Africa, Atmosphere, 11, 307, https://doi.org/10.3390/atmos11030307, 2020.
Azmat, M., Qamar, M. U., Huggel, C., and Hussain, E.: Future climate and cryosphere impacts on the hydrology of a scarcely gauged catchment on the Jhelum river basin, Northern Pakistan, Sci. Total Environ., 639, 961–976, https://doi.org/10.1016/j.scitotenv.2018.05.206, 2018.
Baudouin, J.-P., Herzog, M., and Petrie, C. A.: Cross-validating precipitation datasets in the Indus River basin, Hydrol. Earth Syst. Sci., 24, 427–450, https://doi.org/10.5194/hess-24-427-2020, 2020.
Beguería, S., Vicente-Serrano, S. M., Reig, F., and Latorre, B.: Standardized precipitation evapotranspiration index (SPEI) revisited: parameter fitting, evapotranspiration models, tools, datasets and drought monitoring, Int. J. Climatol., 34, 3001–3023, https://doi.org/10.1002/joc.3887, 2014.
Beguería, S., Vicente-Serrano, S. M., and Beguería, M. S.: Package “SPEI”, Calculation of the Standardised Precipitation-Evapotranspiration Index, CRAN [Package], 2017.
Berndt, C. and Haberlandt, U.: Spatial interpolation of climate variables in Northern Germany – Influence of temporal resolution and network density, Journal of Hydrology: Regional Studies, 15, 184–202, https://doi.org/10.1016/j.ejrh.2018.02.002, 2018.
Bhat, M. S., Alam, A., Ahmad, B., Kotlia, B. S., Farooq, H., Taloor, A. K., and Ahmad, S.: Flood frequency analysis of river Jhelum in Kashmir basin, Quatern. Int., 507, 288–294, https://doi.org/10.1016/j.quaint.2018.09.039, 2019.
Borgaonkar, H., Ram, S., and Sikder, A.: Assessment of tree-ring analysis of high-elevation Cedrus deodara D. Don from Western Himalaya (India) in relation to climate and glacier fluctuations, Dendrochronologia, 27, 59–69, https://doi.org/10.1016/j.dendro.2008.09.002, 2009.
Cannon, A. J., Sobie, S. R., and Murdock, T. Q.: Bias correction of GCM precipitation by quantile mapping: How well do methods preserve changes in quantiles and extremes?, J. Climate, 28, 6938–6959, https://doi.org/10.1175/JCLI-D-14-00754.1, 2015.
Chen, H., Wang, S., Zhu, J., and Zhang, B.: Projected changes in abrupt shifts between dry and wet extremes over China through an ensemble of regional climate model simulations, J. Geophys. Res.-Atmos., 125, e2020JD033894, https://doi.org/10.1029/2020JD033894, 2020.
CSIRO, State of the Climate 2018, Commonwealth Scientific and Industrial Research Organisation, Australia, ISBN 978-1-925315-97-4, 2018.
Dar, R. A., Mir, S. A., and Romshoo, S. A.: Influence of geomorphic and anthropogenic activities on channel morphology of River Jhelum in Kashmir Valley, NW Himalayas, Quatern. Int., 507, 333–341, https://doi.org/10.1016/j.quaint.2018.12.014, 2019.
De Luca, P., Messori, G., Wilby, R. L., Mazzoleni, M., and Di Baldassarre, G.: Concurrent wet and dry hydrological extremes at the global scale, Earth Syst. Dynam., 11, 251–266, https://doi.org/10.5194/esd-11-251-2020, 2020.
Dimri, A. and Dash, S.: Wintertime climatic trends in the western Himalayas, Climatic Change, 111, 775–800, https://doi.org/10.1007/s10584-011-0201-y, 2012.
Dolk, M., Penton, D. J., and Ahmad, M. D.: Amplification of hydrological model uncertainties in projected climate simulations of the Upper Indus Basin: Does it matter where the water is coming from?, Hydrol. Process., 34, 2200–2218, https://doi.org/10.1002/hyp.13718, 2020.
Du, J., Fang, J., Xu, W., and Shi, P.: Analysis of dry/wet conditions using the standardized precipitation index and its potential usefulness for drought/flood monitoring in Hunan Province, China, Stoch. Env. Res. Risk A., 27, 377–387, https://doi.org/10.1007/s00477-012-0589-6, 2013.
Farooqi, A. B., Khan, A. H., and Mir, H.: Climate change perspective in Pakistan, Pakistan Journal of Meteorology, 2, 11–21, 2005.
Goovaerts, P.: Geostatistical approaches for incorporating elevation into the spatial interpolation of rainfall, J. Hydrol., 228, 113–129, https://doi.org/10.1016/S0022-1694(00)00144-X, 2000.
He, X. and Sheffield, J.: Lagged compound occurrence of droughts and pluvials globally over the past seven decades, Geophys. Res. Lett., 47, e2020GL08792, https://doi.org/10.1029/2020GL087924, 2020.
He, X., Wada, Y., Wanders, N., and Sheffield, J.: Intensification of hydrological drought in California by human water management, Geophys. Res. Lett., 44, 1777–1785, https://doi.org/10.1002/2016GL071665, 2017.
He, X., Estes, L., Konar, M., Tian, D., Anghileri, D., Baylis, K., Evans, T. P., and Sheffield, J.: Integrated approaches to understanding and reducing drought impact on food security across scales, Curr. Opin. Env. Sust., 40, 43–54, https://doi.org/10.1016/j.cosust.2019.09.006, 2019.
Hersbach, H., Bell, B., Berrisford, P., Biavati, G., Horányi, A., Muñoz Sabater, J., Nicolas, J., Peubey, C., Radu, R., Rozum, I., Schepers, D., Simmons, A., Soci, C., Dee, D., and Thépaut, J.-N.: ERA5 hourly data on single levels from 1979 to present, Copernicus Climate Change Service (C3S) Climate Data Store (CDS), https://doi.org/10.24381/cds.adbb2d47, 2018.
Himayoun, D. and Roshni, T.: Spatio-temporal variation of drought characteristics, water resource availability and the relation of drought with large scale climate indices: a case study of Jhelum basin, India, Quatern. Int., 525, 140–150, https://doi.org/10.1016/j.quaint.2019.07.018, 2019.
Huang, C., Zhang, Q., Singh, V. P., Gu, X., and Shi, P.: Spatio-temporal variation of dryness/wetness across the Pearl River basin, China, and relation to climate indices, Int. J. Climatol., 37, 318–332, https://doi.org/10.1002/joc.5005, 2017.
Hunt, E. D., Hubbard, K. G., Wilhite, D. A., Arkebauer, T. J., and Dutcher, A. L.: The development and evaluation of a soil moisture index, Int. J. Climatol., 29, 747–759, https://doi.org/10.1002/joc.1749, 2009.
Khan, A. H.: The influence of La-Nina phenomena on Pakistan’s precipitation, Pakistan Journal of Meteorology, 1, 23–31, 2004.
Katz, R. W. and Glantz, M. H.: Anatomy of a rainfall index, Mon. Weather Rev., 114, 764–771, https://doi.org/10.1175/1520-0493(1986)114<0764:AOARI>2.0.CO;2, 1986.
Kenyon, J. and Hegerl, G. C.: Influence of modes of climate variability on global precipitation extremes, J. Climate, 23, 6248–6262, https://doi.org/10.1175/2010JCLI3617.1, 2010.
Kourgialas, N. N.: Hydroclimatic impact on mediterranean tree crops area–Mapping hydrological extremes (drought/flood) prone parcels, J. Hydrol., 596, 125684, https://doi.org/10.1016/j.jhydrol.2020.125684, 2021.
Krishnan, R., Sanjay, J., Gnanaseelan, C., Mujumdar, M., Kulkarni, A., and Chakraborty, S.: Assessment of climate change over the Indian region: a report of the ministry of earth sciences (MOES), Government of India, Springer Nature, https://doi.org/10.1007/978-981-15-4327-2, 2020.
Liaqat, M. U., Grossi, G., ul Hasson, S., and Ranzi, R.: Characterization of Interannual and Seasonal Variability of Hydro-Climatic Trends in the Upper Indus Basin, Theor. Appl. Climatol., 147, 1163–1184, https://doi.org/10.1007/s00704-021-03850-3, 2021.
Lisonbee, J., Woloszyn, M., and Skumanich, M.: Making sense of flash drought: Definitions, indicators, and where we go from here, Journal of Applied and Service Climatology, 2021, 1–19, https://doi.org/10.46275/JOASC.2021.02.001, 2021.
Ly, S., Charles, C., and Degré, A.: Geostatistical interpolation of daily rainfall at catchment scale: the use of several variogram models in the Ourthe and Ambleve catchments, Belgium, Hydrol. Earth Syst. Sci., 15, 2259–2274, https://doi.org/10.5194/hess-15-2259-2011, 2011.
Masson, D. and Frei, C.: Spatial analysis of precipitation in a high-mountain region: exploring methods with multi-scale topographic predictors and circulation types, Hydrol. Earth Syst. Sci., 18, 4543–4563, https://doi.org/10.5194/hess-18-4543-2014, 2014.
Mavromatis, T.: Drought index evaluation for assessing future wheat production in Greece, Int. J. Climatol., 27, 911–924, https://doi.org/10.1002/joc.1444, 2007.
McKee, T. B., Doesken, N. J., and Kleist, J.: The relationship of drought frequency and duration to time scales, in: Proceedings of the 8th Conference on Applied Climatology, Anaheim, California, 17–22 January 1993, 179–183, 1993.
Midwestern Regional Climate Center (MRCC): https://mrcc.illinois.edu/mw_climate/elNino/climatology.jsp, last access: 20 June 2021.
Negi, H., Kanda, N., Shekhar, M., and Ganju, A.: Recent wintertime climatic variability over the North West Himalayan cryosphere, Curr. Sci. India, 114, 760–770, 2018.
NOAA National Centers for Environmental Information: U. S. billion-dollar weather and climate disasters, https://www.ncdc.noaa.gov/billions/, last access: 20 June 2021.
Omidvar, K., Fatemi, M., Narangifard, M., and Hatami Bahman Beiglou, K.: A study of the circulation patterns affecting drought and wet years in Central Iran, Adv. Meteorol., 2016, 1843659, https://doi.org/10.1155/2016/1843659, 2016.
Otkin, J. A., Svoboda, M., Hunt, E. D., Ford, T. W., Anderson, M. C., Hain, C., and Basara, J. B.: Flash droughts: A review and assessment of the challenges imposed by rapid-onset droughts in the United States, B. Am. Meteorol. Soc., 99, 911–919, https://doi.org/10.1175/BAMS-D-17-0149.1, 2018.
Pachauri, R. K., Allen, M. R., Barros, V. R., Broome, J., Cramer, W., Christ, R., Church, J. A., Clarke, L., Dahe, Q., Dasgupta, P., Dubash, N. K., Edenhofer, O., Elgizouli, I., Field, C. B., Forster, P., Friedlingstein, P., Fuglestvedt, J., Gomez-Echeverri, L., Hallegatte, S., Hegerl, G., Howden, M., Jiang, K., Jimenez Cisneroz, B., Kattsov, V., Lee, H., Mach, K. J., Marotzke, J., Mastrandrea, M. D., Meyer, L., Minx, J., Mulugetta, Y., O'Brien, K., Oppenheimer, M., Pereira, J. J., Pichs-Madruga, R., Plattner, G. K., Pörtner, H. O., Power, S. B., Preston, B., Ravindranath, N. H., Reisinger, A., Riahi, K., Rusticucci, M., Scholes, R., Seyboth, K., Sokona, Y., Stavins, R., Stocker, T. F., Tschakert, P., van Vuuren, D., and van Ypserle, J. P.: Climate Change 2014: Synthesis Report. Contribution of Working Groups I, II and III to the Fifth Assessment Report of the Intergovernmental Panel on Climate Change, edited by: Pachauri, R. and Meyer, L., Geneva, Switzerland, IPCC, 151 pp., ISBN 978-92-9169-143-2, 2014.
Pai, D. S., Sridhar, L., Rajeevan, M., Sreejith, O. P., Satbhai, N. S., and Mukhopadhyay, B.: Development of a new high spatial resolution (0.25∘ × 0.25∘) long period (1901–2010) daily gridded rainfall data set over India and its comparison with existing data sets over the region, Mausam, 65, 1–18, https://cdsp.imdpune.gov.in/home_gridded_data.php (last access: 12 December 2020), 2014.
Palmer, W. C.: Meteorological drought, Research Paper No. 45, vol. 30, US Department of Commerce, Weather Bureau, 1965.
Parry, S., Marsh, T., and Kendon, M.: 2012: from drought to floods in England and Wales, Weather, 68, 268–274, 2013.
Peterson, T. C., Stott, P. A., and Herring, S.: Explaining extreme events of 2011 from a climate perspective, B. Am. Meteorol. Soc., 93, 1041–1067, https://doi.org/10.1175/BAMS-D-12-00021.1, 2012.
Rashid, I., Majeed, U., Aneaus, S., and Pelto, M.: Linking the recent glacier retreat and depleting streamflow patterns with land system changes in Kashmir Himalaya, India, Water, 12, 1168, https://doi.org/10.3390/w12041168, 2020.
RGI Consortium: Randolph Glacier Inventory – A Dataset of Global Glacier Outlines: Version 6.0, Technical Report, Global Land Ice Measurements from Space, Colorado, USA, https://doi.org/10.7265/N5-RGI-60, 2017.
Ruelland, D.: Should altitudinal gradients of temperature and precipitation inputs be inferred from key parameters in snow-hydrological models?, Hydrol. Earth Syst. Sci., 24, 2609–2632, https://doi.org/10.5194/hess-24-2609-2020, 2020.
Saha, S., Moorthi, S., Pan, H.-L., Wu, X., Wang, J., Nadiga, S., Tripp, P., Kistler, R., Woollen, J., and Behringer, D.: The NCEP climate forecast system reanalysis, B. Am. Meteorol. Soc., 91, 1015–1058, https://doi.org/10.1175/2010BAMS3001.1, 2010.
Sennikovs, J. and Bethers, U.: Statistical downscaling method of regional climate model results for hydrological modelling, in: 18th World IMACS/MODSIM Congress on Modelling and Simulation, Cairns, Australia, 13–17 July 2009, 3962–3968, http://mssanz.org.au/modsim09, 2009.
Shafiq, M. U., Islam, Z. U., Bhat, I. A., and Ahmed, P.: Spatio-temporal behaviour of Nehnar Glacier from 1962 to 2017, Jhelum basin, Kashmir Himalayas, India, Phys. Geogr., 41, 517–536, https://doi.org/10.1080/02723646.2019.1706704, 2020.
Sheffield, J. and Wood, E. F.: Drought: past problems and future scenarios, Routledge, https://doi.org/10.4324/9781849775250, 2012.
Sheffield, J., Wood, E. F., and Roderick, M. L.: Little change in global drought over the past 60 years, Nature, 491, 435–438, https://doi.org/10.1038/nature11575, 2012.
Spinoni, J., Naumann, G., Carrao, H., Barbosa, P., and Vogt, J.: World drought frequency, duration, and severity for 1951–2010, Int. J. Climatol., 34, 2792–2804, https://doi.org/10.1002/joc.3875, 2014.
Sun, X., Renard, B., Thyer, M., Westra, S., and Lang, M.: A global analysis of the asymmetric effect of ENSO on extreme precipitation, J. Hydrol., 530, 51–65, https://doi.org/10.1016/j.jhydrol.2015.09.016, 2015.
Svoboda, M. and Fuchs, B.: Handbook of drought indicators and indices, Integrated drought management programme (IDMP), integrated drought management tools and guidelines series 2. World meteorological organization and global water partnership, Geneva, Switzerland, 52, ISBN 978-92-63-11173-9, ISBN 978-91-87823-24-4, 2016.
Thom, H. C.: A note on the gamma distribution, Mon. Weather Rev., 86, 117–122, https://doi.org/10.1175/1520-0493(1958)086<0117:ANOTGD>2.0.CO;2, 1958.
Thornthwaite, C. W.: An approach toward a rational classification of climate, Geogr. Rev., 38, 55–94, https://doi.org/10.2307/210739, 1948.
Trenberth, K. E., Dai, A., Van Der Schrier, G., Jones, P. D., Barichivich, J., Briffa, K. R., and Sheffield, J.: Global warming and changes in drought, Nat. Clim. Change, 4, 17–22, https://doi.org/10.1038/NCLIMATE2067, 2014.
Tucker, C. J.: Red and photographic infrared linear combinations for monitoring vegetation, Remote Sens. Environ., 8, 127–150, https://doi.org/10.1016/0034-4257(79)90013-0, 1979.
Ullah, I., Ma, X., Yin, J., Asfaw, T. G., Azam, K., Syed, S., Liu, M., Arshad, M., and Shahzaman, M.: Evaluating the meteorological drought characteristics over Pakistan using in situ observations and reanalysis products, Int. J. Climatol., 41, 4437–4459, https://doi.org/10.1002/joc.7063, 2021a.
Ullah, I., Ma, X., Yin, J., Saleem, F., Syed, S., Omer, A., Habtemicheal, B. A., Liu, M., and Arshad, M.: Observed changes in seasonal drought characteristics and their possible potential drivers over Pakistan, Int. J. Climatol., 2021, 1–21, https://doi.org/10.1002/joc.7321, 2021b.
Vellore, R. K., Kaplan, M. L., Krishnan, R., Lewis, J. M., Sabade, S., Deshpande, N., Singh, B. B., Madhura, R. K., and Rao, M. R.: Monsoon-extratropical circulation interactions in Himalayan extreme rainfall, Clim. Dynam., 46, 3517–3546, https://doi.org/10.1007/s00382-015-2784-x, 2016.
Vicente-Serrano, S. M., Beguería, S., and López-Moreno, J. I.: A multiscalar drought index sensitive to global warming: the standardized precipitation evapotranspiration index, J. Climate, 23, 1696–1718, https://doi.org/10.1175/2009JCLI2909.1, 2010.
Visser-Quinn, A., Beevers, L., Collet, L., Formetta, G., Smith, K., Wanders, N., Thober, S., Pan, M., and Kumar, R.: Spatio-temporal analysis of compound hydro-hazard extremes across the UK, Adv. Water Resour., 130, 77–90, https://doi.org/10.1016/j.advwatres.2019.05.019, 2019.
Wu, J. and Chen, X.: Spatiotemporal trends of dryness/wetness duration and severity: The respective contribution of precipitation and temperature, Atmos. Res., 216, 176–185, https://doi.org/10.1016/j.atmosres.2018.10.005, 2019.
Yan, D. H., Wu, D., Huang, R., Wang, L. N., and Yang, G. Y.: Drought evolution characteristics and precipitation intensity changes during alternating dry–wet changes in the Huang–Huai–Hai River basin, Hydrol. Earth Syst. Sci., 17, 2859–2871, https://doi.org/10.5194/hess-17-2859-2013, 2013.
Yao, J., Zhao, Y., Chen, Y., Yu, X., and Zhang, R.: Multi-scale assessments of droughts: a case study in Xinjiang, China, Sci. Total Environ., 630, 444–452, https://doi.org/10.1016/j.scitotenv.2018.02.200, 2018.
Yuan, X., Wang, L., Wu, P., Ji, P., Sheffield, J., and Zhang, M.: Anthropogenic shift towards higher risk of flash drought over China, Nat. Commun., 10, 1–8, https://doi.org/10.1038/s41467-019-12692-7, 2019.
Zaman, M., Ahmad, I., Usman, M., Saifullah, M., Anjum, M. N., Khan, M. I., and Qamar, M. U.: Event-based time distribution patterns, return levels, and their trends of extreme precipitation across Indus Basin, Water, 12, 3373, https://doi.org/10.3390/w12123373, 2020.
Zaz, S. N., Romshoo, S. A., Krishnamoorthy, R. T., and Viswanadhapalli, Y.: Analyses of temperature and precipitation in the Indian Jammu and Kashmir region for the 1980–2016 period: implications for remote influence and extreme events, Atmos. Chem. Phys., 19, 15–37, https://doi.org/10.5194/acp-19-15-2019, 2019.
Zhao, Y., Weng, Z., Chen, H., and Yang, J.: Analysis of the Evolution of Drought, Flood, and Drought-Flood Abrupt Alternation Events under Climate Change Using the Daily SWAP Index, Water, 12, 1969, https://doi.org/10.3390/w12071969, 2020.
- Abstract
- Introduction
- Characterization of the study area
- Data description
- Methods
- Results
- Discussion and conclusion
- Code availability
- Data availability
- Author contributions
- Competing interests
- Disclaimer
- Special issue statement
- Acknowledgements
- Financial support
- Review statement
- References
- Supplement