the Creative Commons Attribution 4.0 License.
the Creative Commons Attribution 4.0 License.
 | 11 Aug 2022
Identifying plausible historical scenarios for coupled lake level and seismicity rate changes: the case for the Dead Sea during the last 2 millennia
Mariana Belferman
Regina Katsman
Zvi Ben-Avraham
Studies of seismicity induced by water level changes in reservoirs and lakes focus typically on well-documented contemporary records. Can such interactions be explored on a historical timescale when the two data types suffer from severe uncertainties stemming from the different nature of the data, methods and resolution? In this study, we show a way to considerably improve the correlation between interpolated records of historical Dead Sea level reconstructions and discrete seismicity patterns in the area, over the period of the past 2 millennia. Inspired by the results of our previous study, we carefully revise the historical earthquake catalog in the Dead Sea to exclude remote earthquakes and include small local events. For addressing the uncertainties in lake levels, we generate an ensemble of random interpolations of water level curves and rank them by correlation with the historical records of seismic stress release. We compute a synthetic catalog of earthquakes, applying a Mohr–Coulomb failure criterion. The critical state of stress at hypocentral depths is achieved by static poroelastic deformations incorporating the change in effective normal stress (due to the best-fit water level curve) superimposed on the regional strike-slip tectonic deformations. The earthquakes of this synthetic catalog show an impressive agreement with historical earthquakes documented to have damaged Jerusalem. We refine the seismic catalog by searching for small local events that toppled houses in Jerusalem; including all local events improves the correlation with lake levels. We demonstrate for the first time a high correlation between water level changes and the recorded recurrence intervals of historical earthquakes.
- Article
(6408 KB) - Full-text XML
- BibTeX
- EndNote


Earthquakes induced by water level changes in lakes and reservoirs have been a focus of seismic investigations around the world (e.g., Simpson et al., 1988; Pandey and Chadha, 2003; Durá-Gómez and Talwani, 2010). Triggering is attributed to a drop in the effective normal stress at a fault, induced by water level change at the overlying lake's bed (Simpson et al., 1988; Durá-Gómez and Talwani, 2010; Hua et al., 2013b; Gupta, 2018). This kind of triggering may be particularly significant for areas with moderate and low tectonic strain accumulations (Pandey and Chadha, 2003; Gupta, 2018), such as the Dead Sea Fault (DSF) in the Middle East (e.g., Masson et al., 2015).
Seismic activity due to water level change was observed beneath artificial reservoirs immediately after their first filling (e.g., Simpson et al., 1988; Hua et al., 2013a). It also appeared after several seasonal filling cycles (Simpson et al., 1988; Talwani, 1997), explained by diffusion of pore pressure to the earthquake's hypocentral depth via the fault (Durá-Gómez and Talwani, 2010). In addition, reservoir-induced seismicity sometimes manifests itself at long distances away from the reservoir (e.g., at 35 km, Durá-Gómez and Talwani, 2010). The correspondence of this kind of contemporary seismicity to water level change is usually identified based upon real-time data.
Alternatively, on a much longer timescale, changing seismic activity may also be associated with water level changes in historical water bodies (e.g., the Dead Sea, since 2 ka, Fig. A1, in Appendix A, which occupies the tectonic depression along the Dead Sea Fault). Water level hikes of ∼15 m, characteristic for time intervals of centuries to millennia, were analyzed in Belferman et al. (2018) and shown to be able to moderate the seismicity pattern at the Dead Sea Fault.
However, reconstruction of fluctuations in historical lake levels and the concurrent seismicity are both subject to significant uncertainties. They stem from the differing nature of the data gathered on these two phenomena and thus deserve special consideration. Earthquake dating can be quite precise, and its accuracy is verified when different historical sources show consensus (Guidoboni et al., 1994; Guidoboni and Comastri, 2005; Ambraseys, 2009). Assessment of the extent of damage (hence earthquake magnitude), similarly requires such a consensus between the different data sources. Sediment records can help to calibrate the analysis of the historical evidence (Agnon, 2014; Kagan et al., 2011). Such records can be tested by trenching (Wechsler et al., 2014; Marco and Klinger, 2014; Lefevre et al., 2018). However, in many cases the earthquake epicenter can be imprecise or not even known. Consequently, considerable uncertainty pertains to the historical catalog of earthquakes related directly to the Dead Sea.
By contrast, historical water level records are quite precise regarding elevation, as they are obtained from different points around the lake (Bookman et al., 2004; Migowski et al., 2006). However, water level dating could have an error of about ±45 years, as estimated from the radiocarbon dating of shoreline deposits in fan delta outcrops (Bookman et al., 2004). This may underestimate the actual dating uncertainty due to the reworking of organic matter, sometimes redeposited a century or more after equilibration with the atmosphere (Migowski et al., 2004). In addition, the entire past bi-millennial Dead Sea level record is constrained by less than 20 “anchor points” (the data obtained by the dating collected from surveyed paleo-shorelines, Bookman et al., 2004). Therefore, its continuous reconstruction, as suggested in the literature (Migowski et al., 2006; Stern, 2010), usually takes different forms within the acceptable limits dictated by the evidence, geomorphological (Bookman et al., 2004) and limnological (Migowski et al., 2006). A challenging uncertainty for our study arises from the interpolations required for periods when the available data do not constrain the water levels.
In this article, we take advantage of the correlation between the historical water level (WL) reconstructions at the Dead Sea and seismicity patterns in the area over the past 2 millennia. We demonstrate for the first time that plausible scenarios for the lake level history can fit the record of the historical earthquake recurrence intervals (RIs) very well. Based on the correlation between these phenomena, we offer an alternative explanation regarding the triggering of earthquakes in the area of the Dead Sea.
To investigate the relationship between an accurate but discrete chronology of earthquakes and the continuous WL change, we first explore the space of possible WL histories by a statistical approach. Using a random number generator, we generate an ensemble of WL curves (based on the anchor points, Bookman et al., 2004) within the limits dictated by climatic and morphological constraints (Bookman et al., 2004; Migowski et al., 2006; Stern, 2010).
In our analysis we associate all the historical earthquakes presented (Tables 1A and 2A in Appendix A) with a rupture of the strike-slip faults, which agrees with our modeling approach. Hence, the major strike-slip faults constituting the plate boundary (lower Jordan Fault, Dead Sea Fault and northern Arava) could be affected by Dead Sea WL changes. Therefore, our study covers the area within this distance.
2.1 A best-fit random method of WL curve prediction
The compilation of WL curves of the Dead Sea for the last 2 millennia from three recent publications (Bookman et al., 2004; Migowski et al., 2006; Stern 2010) is presented in Fig. 1a by dashed curves. Generally, the differences between all dashed curves at anchor points are included within an error limit of ±45 years as indicated by error bars, with an exception of the anchor point dated to 1400 CE (Bookman et al., 2004) for which Migowski et al. (2006) and Stern (2010) suggested a higher WL. Nevertheless, each hypothetical WL curve is forced to pass through all anchor points provided by Bookman et al. (2004) except for one, at around 500 CE. The WL drop around this time, according to Migowski et al. (2006) and Stern (2010), occurred later than was originally suggested by Bookman et al. (2004) (Fig. 1a). Because this shift is within the permissible error limits (±45 years), this anchor point is shifted to the left (+40 years). In addition, the WL determined on the curve edges of the studied bi-millennial time interval was defined by additional two anchor points, through which the estimated WL curve passed according to all three references. In total, we have 13 anchor points. Between each pair of points, the trends in the WLs are constrained by the sedimentary facies (Migowski et al., 2006) that specify the edge points of the interval as the extrema for the acceptable WL variation.
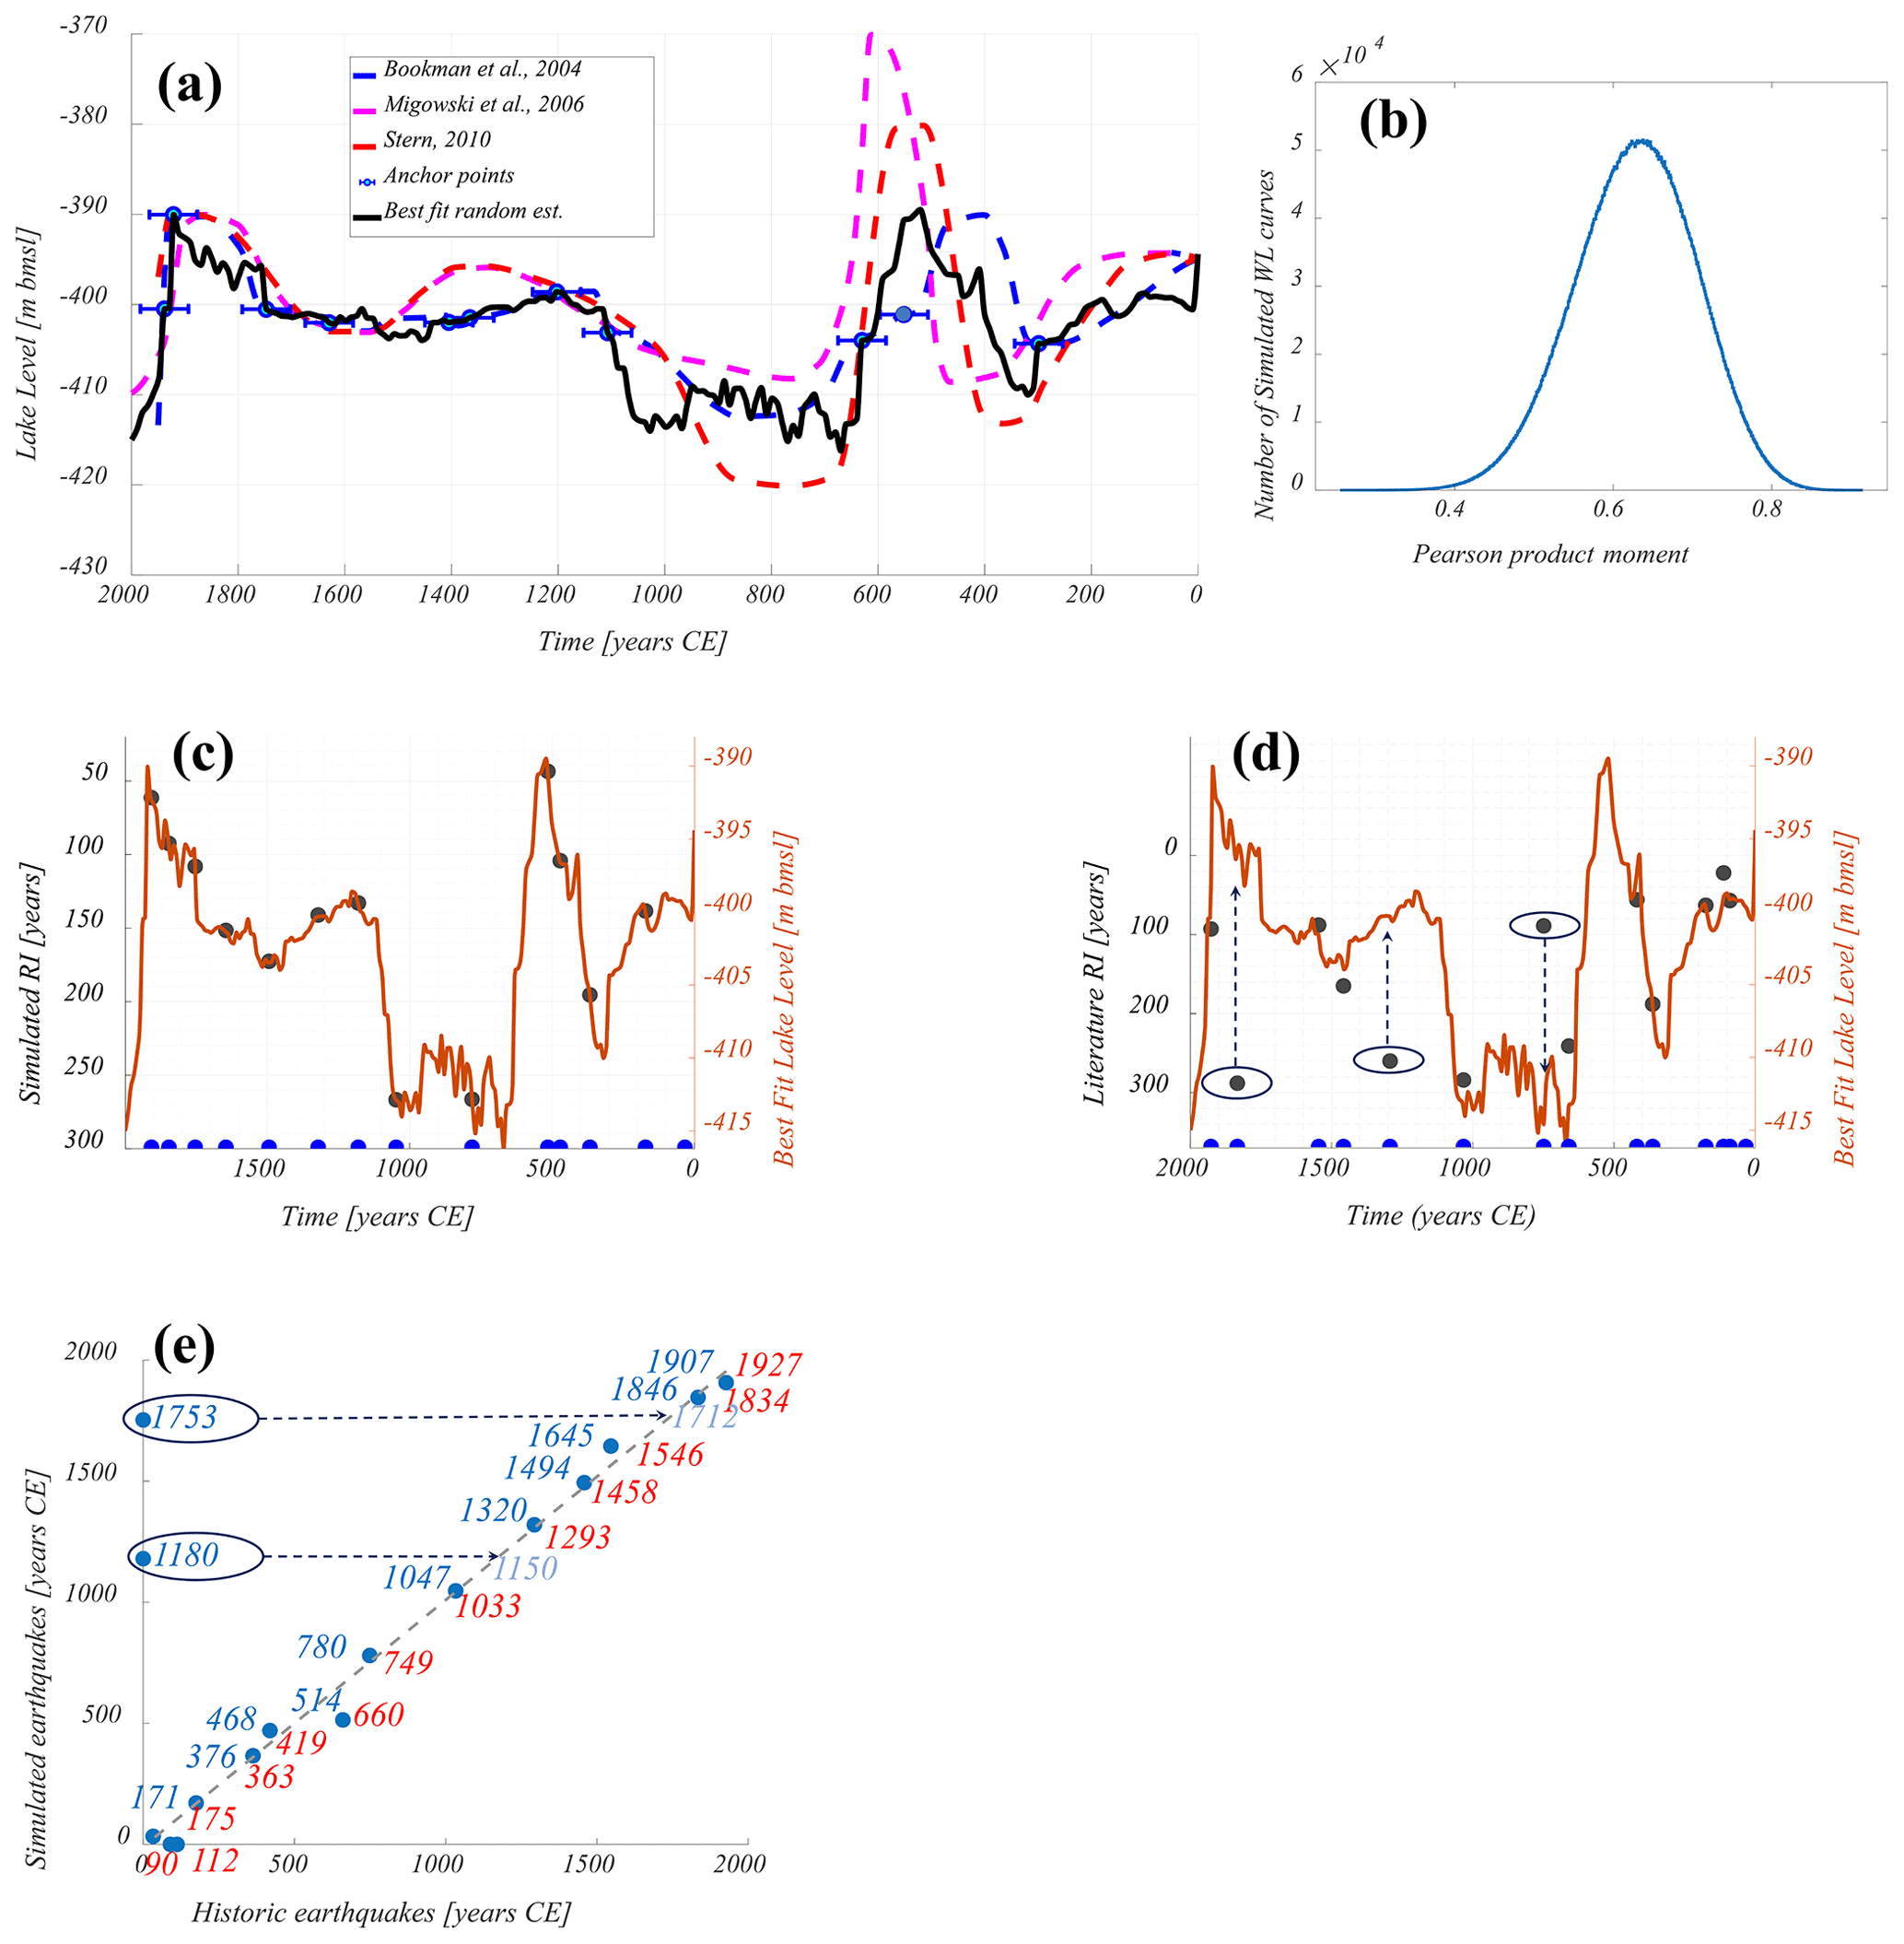
Figure 1(a) The Dead Sea WL reconstructions for the last 2 millennia. The dashed curves are suggested by the literature sources. Turquoise anchor points follow Bookman et al. (2004) as used in WL interpretation, while one point (in dark blue) is shifted to the left in the error interval of ±45 years. The water curve (solid, black line) is suggested by this study. (b) Distribution of Pearson's product-moment correlation coefficient of randomly interpolated WLs and RIs of historic earthquakes. Normal distribution results from 10 million random WLs reconstructions. (c, d) Orange curve represents the best-fit random WL curve vs. simulated and historic RIs, correspondingly. The blue dots mark the dates of the seismic events, while the black dots indicate the recurrence interval between these events. For an optimal visualization of the correlation, the degree of scaling freedom for the RI axis was set for these figures. (e) Dates of historic vs. simulated earthquakes based on the suggested best-fit WLs curve (panels c, d) are compared.
However, within the largest interval between the anchor points (600–1100 CE), the field studies (Migowski et al., 2006; Stern, 2010; Bookman et al., 2004) constrained the WL to be lower than the extrema at the edges of that interval. For this period, the WL was randomly interpolated between the higher (e.g., Migowski et al., 2006) and lower (e.g., Stern, 2010) bounds. To maintain a monotony of the WL variation (required by the facies analysis of Migowski et al., 2006), a moving average filtered the random noise between every pair of the anchor points. Accounting for the above-mentioned limits and setting a 10-year step, the model has generated 10 million WL curves for the last bi-millennial interval, using a uniformly distributed random number generator.
We test for linear correlation between the RIs of the widely recorded moderate-to-large (M>5.5) historical earthquakes available from the literature (Table A1 and the text description in Appendix A) and the WL interpolations (as in Fig. 9 in Belferman et al., 2018) and evaluate the values of the Pearson product-moment correlation coefficient, R (Fig. 1b). We use this statistic for evaluating the suitability of each randomly interpolated WL curve for our analysis, for identification and elimination of any outliers, and for studying the behavior of the entire ensemble of the curves generated.
2.2 The earthquake simulation algorithm
The most suitable WL curve suggested by this correlation (discussed in the “Results” section below) was used to generate a “synthetic” earthquake catalog based on the algorithm described in this section. Effective (normal) poroelastic stress change due to the WL change is superimposed on the tectonic stress accumulated consistently with the slip deficit since the preceding seismic event, and synthetic earthquakes are simulated using a Coulomb failure envelope and a Mohr circle (e.g., Jaeger et al., 2009). A vertical strike-slip fault below the lake/reservoir bed is assumed (simulating a Dead Sea Fault), embedded in the 2D (plain strain) geometry of the upper crust (Belferman et al., 2018). Tectonic horizontal strike-slip displacements across the fault are approximated by a simple-shear approach with no normal strain component.
In the poroelastic part of the model, horizontal stress change normal to the strike-slip fault produced by the WL change is calculated under a uniaxial (vertical) strain condition (Eq. 10b in Belferman et al., 2018). This is applicable to a post-diffusion stage, i.e., when pore pressure at hypocentral depth equilibrates with the lake's bed. An array of the effective horizontal normal stress changes, , at the fault, induced by the water load change at the lake's bed, , corresponds to the array of the WL change, over the interpolated WL curve in Fig. 1d (Eq. 10b in Belferman et al., 2018):
where β is Biot's coefficient and ν is Poisson's ratio, , where ρ is the density of water and g is the acceleration of gravity.
A radius and a center location of the Mohr circle change as a function of the tectonic deformations and WL changes, correspondingly, eventually reaching a failure envelope that simulates an earthquake. The model uses Byerlee's law envelope (Byerlee, 1978) to define a residual strength of a seismogenic zone at the fault immediately after the earthquake (see Belferman et al., 2018, for more detail). Since the effective stress upon the onset of an earthquake is specified by a high failure envelope and the effective stress following the slip is given by Byerlee's law (e.g., Belferman et al., 2018), the model is time-predictable. The stress drop, at least in the nucleation zone of a single-fault model, is expected to be proportional to the RI.
A starting point of the simulations is the date of the first historical earthquake (33 CE, Table A1 in Appendix A) from the bi-millennial time interval studied. The simulation incrementally proceeds with time over the WL curve generated (as above) under the accumulating tectonic stress. After each stress release, the time to the next earthquake, Δt, is calculated from the solution of the Mohr–Coulomb failure criterion for a strike-slip tectonic regime and a WL change, Δhi, characteristic of the Dead Sea Fault (Belferman et al., 2018):
assuming that is the tectonic shear stress accumulated consistently with the slip deficit at the strike-slip fault during the period Δt (time passed since the last earthquake), C is cohesion, φ is an angle of internal friction, σ0 and τ0 are the coordinates of the Mohr circle center immediately after the earthquake with R0 as its radius, and tRI is the reference RI corresponding to the minimal WL.
For each time step, the algorithm determines whether there is a single, two or no solutions. A case of no solutions means that the Mohr circle is yet to reach the failure envelope, as the accumulating tectonic stress and the WL increase are still insufficient. The system of Eq. (2) may have a single solution when the failure criterion is met at the end of some time step or two solutions when it is met before the end of the time step. A case of two solutions is rounded down to a case of a single solution if a time step (1 year) is small compared to the earthquake RI (several hundreds of years).
This solution of Eq. (2) yields an RI as a function of the change in effective normal horizontal stress, (Belferman et al., 2018):
where tRI is the reference RI corresponding to the minimal WL, C is cohesion, and φ is an angle of internal friction. From this formula, an array of earthquake dates is obtained.
Substitution of Eq. (1) into Eq. (3) yields a linear dependence of a simulated RI on a WL change, Δhi, evolving with time:
A tectonic slip rate is set at 5 mm yr−1 (e.g., Hamiel et al., 2018; Hamiel and Piatibratova, 2019; Masson et al., 2015). Coefficients for the simulations were previously determined in Belferman et al. (2018). Note that the cohesion, C, is not a priori known; hence it is fixed by the empirical correlation between WL and RI for a given lake level history considered. Its value, C=0.08 MPa, and a reference RI, tRI=300 years, were adjusted numerically for a WL curve, providing the average RI of 144 years over the modeled period of 2 millennia justified by historical, archeological and geological data (Agnon, 2014).
The 10 most suitable WL curves are identified out of the set of 10 million randomly generated WL curves (“ensemble”) by the Pearson product-moment correlation test. The values of the correlation coefficients, R, for the entire ensemble are distributed normally around R=0.63 (Fig. 1b) with a standard deviation of σ=0.076. The 10 most suitable WL curves ordered by their correlation coefficients, R, are presented in Fig. 2.

Figure 2The 10 most suitable WLs identified out of the 10 million randomly generated by the Pearson product-moment correlation test.
Three outliers from the 13 RIs of the widely recorded historic earthquakes (749, 1293 and 1834 CE in Fig. 1) were identified and reevaluated (explanation in Appendix A). A curve with the highest Pearson coefficient of R=0.912 was chosen from the correlation between the RIs of the revised historic catalog and the randomly generated WLs (Fig. 2). This correlation can be specified by a linear prediction function:
where RI is given in years and WL is in meters. In addition, a synthetic earthquake history including 14 seismic events was simulated from the best-fit randomly interpolated WL curve with R=1 specified above. The synthetic RIs can be approximated based on the WLs using the linear relationship of Eq. (4):
for which the dates of the simulated synthetic earthquakes are presented and compared to the dates of the historical earthquakes from the literature (Table A1, Appendix A) in Fig. 1e.
The synthetic earthquake stress history is presented in Fig. 3. The effective horizontal normal stress change, (Fig. 3a), linearly depends on the WL (Eq. 1) and, as expected, follows its variability. The tectonic shear stress change, Δτxy, drops to zero after the accumulated shear stress is released by the strike-slip earthquake (Fig. 3b). Less shear stress is required to induce the earthquake when the change in WL is larger (Fig. 3a, b), modeled with the Mohr–Coulomb failure criteria (Fig. 3c) (explained also in Belferman et al., 2018).

Figure 3(a) The change in effective normal stress, Δσ′, induced by WL change in Eq. (1). (b) The change in tectonic shear stress, Δτxy, accumulated consistently with the slip deficit on the strike-slip fault during the time passed since the last earthquake. The shear stress accumulation rate used in this study is about 23 kPa per century (formulation below Eq. 2, following Belferman et al., 2018). (c) Evolution of the stress change on the fault due to combined tectonic and water loading. The state of the effective stress at the fault immediately after an earthquake is restricted by the Byerlee's law envelope with zero cohesion, C=0, and a friction angle, φ=0.54 rad. The center of the Mohr circle is located at σ0, τ0=0 (see Belferman et al., 2018, for more detail). The failure envelope is defined by C≥0 and φ=0.54 rad. The left shift in the center of the circle by Δσ′ represents pore pressure (due to WL) change at this moment (panel a); the increase in radius represents tectonic shear stress, Δτxy, accumulated during the inter-seismic period (panel b). Failure occurs when the circle tangents the failure envelope (presented here for the representative 1320 CE earthquake).
Uncertainties in the WL reconstructions associated with dating and resolution lead to considerable variance in possible interpolations (Fig. 1b). A Pearson correlation coefficient test shows that most of the randomly interpolated WL curves give a linear correlation with earthquake RIs (indicated by a mean Pearson coefficient of R=0.63), excluding the three outliers (Fig. 1d) to be discussed below. Figure 2 shows a similar pattern of the WL change for the 10 most correlated curves. In all cases, a significant rise in the WL around 400 and 1100 CE is visible as well as a decrease in the WL around 200 and 600 CE. Also, the maximum level around 500 and 1900 CE appears in all 10 cases.
For simulating synthetic earthquakes triggered by the WL change, we use the WL curve that generates the highest correlation with the revised historical catalog (R=0.912) (Fig. 2). The dates of these simulated synthetic earthquakes are comparable with historical earthquakes (Fig. 1e), excluding two events whose date labels are offset to the y axis for clarity of presentation (1753 and 1180 CE). The dates of these synthetic earthquakes might be connected to three outliers from the historical catalog (1834, 1293 and 749 CE, depicted in Fig. 1d) as explained below.
The 1180 CE synthetic earthquake (Fig. 1e) is comparable to an earthquake in the literature dated by Amiran et al. (1994) to the mid-12th century (∼1150 CE). Ambraseys (2009) doubted the precise dating but accepted this mid-12th-century estimate. The damaged area of this earthquake spanned Jericho and Jerusalem, and the event could be considered significant because it led to the total destruction of two monasteries, one of which is 10 km south of Jerusalem's curtain wall. By admitting the ∼1150 CE earthquake into the amended catalog, we reduce the RI of the subsequent earthquake in 1293 CE (Fig. 1d) from 260 to 143 years, thereby bringing this outlier very close to the linear correlation.
Our model also generates an earthquake in the 18th century, dated 1753 CE, for which there were no matches in our initial historical catalog (Belferman et al., 2018). However, in Amiran's et al. (1994) catalog an earthquake in 1712 CE is indicated as follows: “The quake shook the solid houses and ruined three Turkish houses. Felt in Ramle, but not in Jaffa”. Additionally, this earthquake is evidenced by seismites dated to 1700–1712 CE from an Ein Gedi site (Migowski et al., 2004).
Regarding the modeled 1907 CE event, we note the well-documented (although often overlooked) 29 March 1903 CE earthquake (Amiran et al., 1994). This was a moderate but prolonged earthquake: local intensity reached VII (modified Mercalli intensity scale) in a number of localities distributed outside the rift valley over an area of 140×70 km2 (including Jerusalem), whereas the maximum intensity reported in the rift was VII as well (Jericho). We prefer to correlate the modeled 1907 CE event with the stronger 1927 CE Jericho earthquake that clearly released stress in the Dead Sea (e.g., Shapira et al., 1993; Avni et al., 2002; Agnon, 2014). This leaves the 1903 CE unmatched to our model. Perhaps the earthquake ruptured the northern part of the central Jordan Valley, north of the Dead Sea and south of Lake Kinneret (Sea of Galilee).
Regarding the last outlier from the historical earthquakes dated to 749 CE (or its neighbors 747 and 757 CE, Table A1 in Appendix A) (Fig. 1d) and corresponding to the simulated 780 CE earthquake (Fig. 1e): the simulation generated the preceding earthquake in 514 CE associated with the 659/660 CE event from the literature (Table A1 in Appendix A) with a deviation of 146 years. The rupture zone of the 659/660 CE event is uncertain, and this earthquake is not necessarily related to stress release at the Dead Sea basin. Alternatively, following Russell (1985), as a result of the 551 CE earthquake, a fortress east of the southern Dead Sea and Petra were destroyed. Newer data contradict the assertion regarding Petra; a failure in the Dead Sea region is still plausible. Replacing the 660 CE earthquake with 551 CE in the catalog changes the RI preceding the 749 CE historical earthquake from 89 to 198 CE, which brings this outlier into a satisfactory linear correlation (Fig. 1d).
Additionally, it should be emphasized that in the simulation presented in this article, the starting point is quite arbitrarily, regarding the earthquake of 33 CE. This event together with the subsequent earthquakes in 90 and 112 CE (not predicted by our model) span a single century where the catalog is nebulous. Each of these events could thus represent the starting point of the simulations or could be omitted at this early and poorly documented interval.
Summarizing the above amendments, we add to our catalog of historical events the 551, ∼1150 and 1712 CE earthquakes and remove the 90, 112 and 659/660 CE earthquakes (Fig. 1e). Altogether, we get 14 triggered historical earthquakes. The correlation between the WL and RI is noticeable for the various variants of the WL curve reconstruction (Fig. 4).
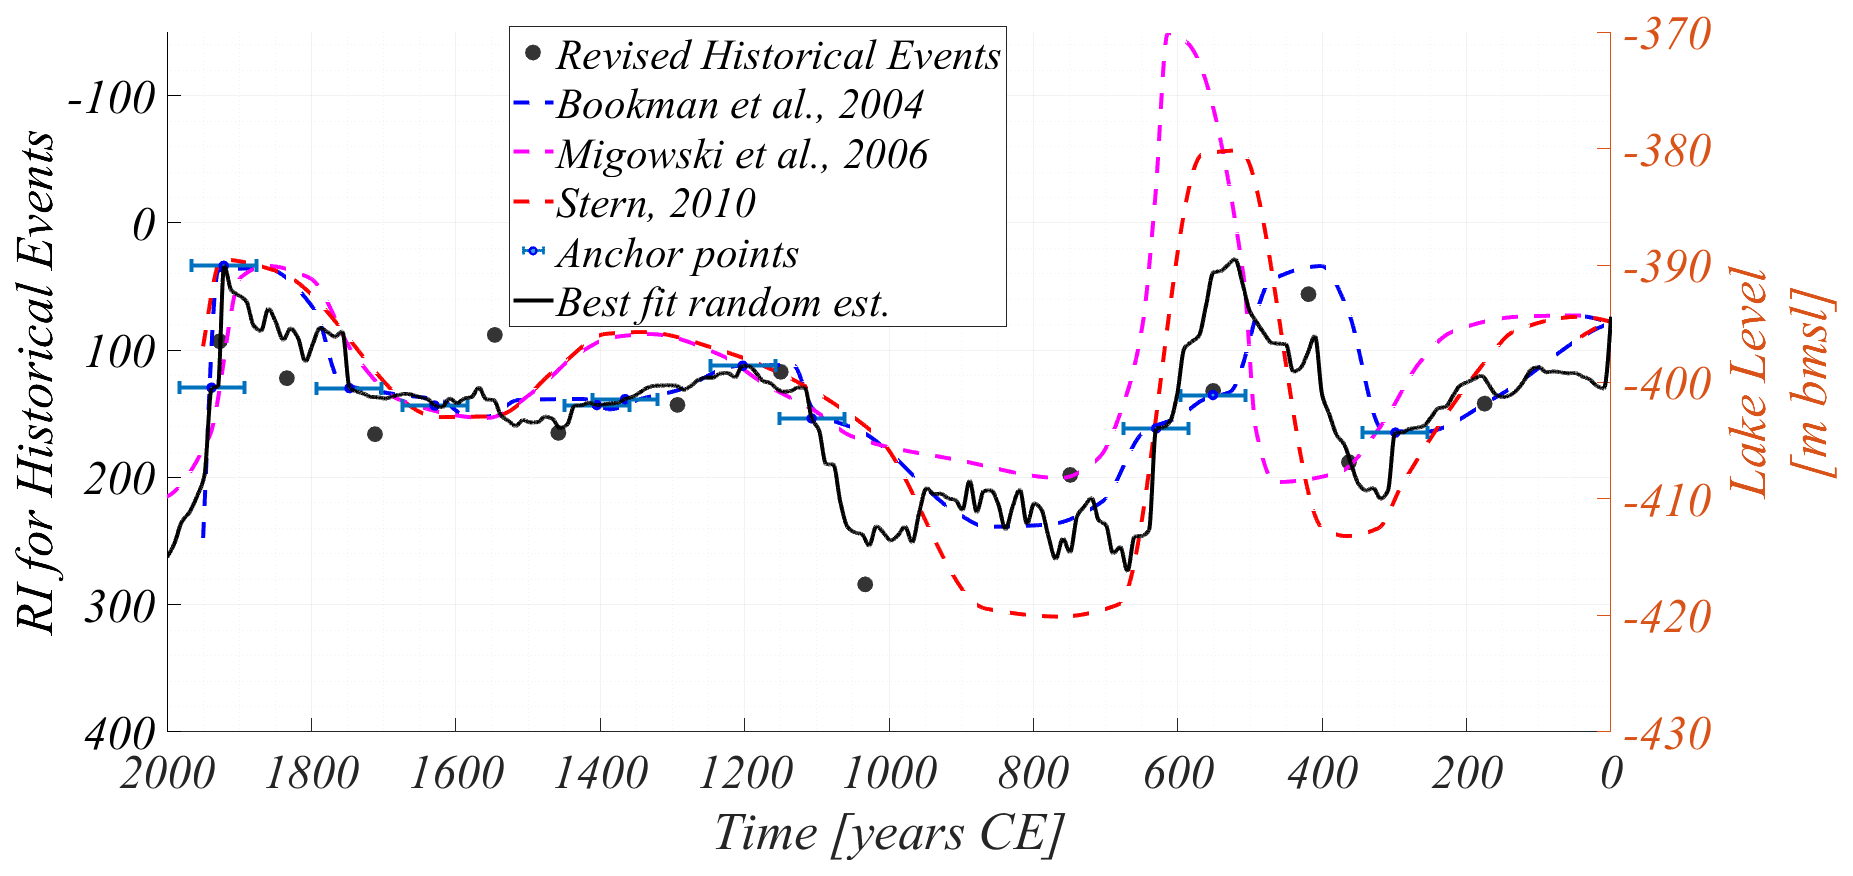
Figure 4The Dead Sea WL reconstruction for the last 2 millennia. The dashed curves are suggested by the literature. Blue anchor points have an error interval of ±45 years, following Bookman et al. (2004). The solid black line is the WL curve suggested by this study. The black points represent the RI for revised historical events, suggested in this study as being relevant to the Dead Sea area.
The correlation of RI with the best-fit random estimated curve can be specified by a linear prediction function:
This linear relationship between WL and RI underscores the previously proposed correlations between these phenomena (in Fig. 9 in Belferman et al., 2018).
Since the last earthquake (1927 CE), the WL in the Dead Sea has continuously decreased at an average annual rate of ∼1 m yr−1. Today the WL is about −440 (m b.m.s.l., below mean sea level); thus our prediction function (Eq. 7) suggests an RI of 377 years, for such a WL. Namely, should the WL in the Dead Sea remain constant (−440 m b.m.s.l.), as intended in some mitigation plans, we would expect the next earthquake at about ∼2300 CE.
This paper stresses that the reconstruction of WL curves is not unique and may take various forms under the constraints available (e.g., Fig. 1a). However, the correlation with an independent record of RIs of seismic events, assuming that earthquakes are affected by WL hikes, allows for deciphering plausible scenarios for WL evolution. Moreover, for cases with the best but a not perfect correlation, the deviation might be consistent with a release of elastic energy by smaller earthquakes, which are not accounted for by the deterministic part of our model. We note that smaller earthquakes might rupture dip-slip fault planes, again not accounted for by our simple model.
Additionally, as large earthquakes are accompanied by aftershocks, some of the elastic energy is released by them. It was shown earlier that in areas of reservoir-induced seismicity, earthquakes are not only accompanied by aftershocks but also preceded by foreshocks (Gupta, 2002). The decay curve of this kind of seismicity satisfies the criteria for the second class of earthquake sequences by Mogi (1963). The lack of instrumental records of historical earthquakes in our study area does not allow for comparison with this class. The 1995 CE Gulf of Aqaba earthquake (7.2 Mw), the last large instrumentally recorded earthquake, was accompanied by a long period (significant enough for stress release consideration) of the aftershocks. The earthquake occurred along the southern part of the plate boundary, which is far enough from the Dead Sea and most likely is not influenced by the WL change. Following this earthquake aftershocks continued for about 2 years. At least 50 % of the total moment associated with these aftershocks was released during the first day after the main shock, with over 95 % in the first 3 months (Baer et al., 2008). In total, the post-seismic moment released during the period of 6 months to 2 years after the Nuweiba earthquake is about 15 % of the co-seismic moment release (Baer et al., 2008). This earthquake showed that the response of the crust to earthquakes by aftershocks is negligible, as noted for many large earthquakes (e.g., Scholz, 1972).
For the case of artificial reservoirs, it was shown that for reservoir-induced seismicity sequences, aftershocks continue for a longer time than for tectonic earthquake sequences (Gupta, 2002). However, given the timescale of RI, the period of aftershocks is insufficient to consider earthquakes from the sequence in our model as separate events. Regarding the timescale presented in our study, when the minimal inter-seismic period is about 50 years, the stress released during a post-seismic period can be considered a part of the main shock.
The mechanical model used in this article is rather simplistic, where earthquakes release the strike-slip component of the tectonic loading (Fig. 3b). The basins around the Dead Sea Fault system also testify to an extensional component that could be manifested in co-seismic motion along normal faults. To justify our focus on a single type of fault (strike-slip), we list the following arguments:
-
The far-field maximal and minimal principal stresses in the Dead Sea region are horizontal (Hofstetter et al., 2007; Palano et al., 2013). This is compatible with the dominance of strike-slip faulting (Anderson, 1951). The tectonic motion at the DSF is characterized predominantly by a left-lateral strike-slip regime with a velocity of ∼5 mm yr−1 along various segments (Garfunkel, 2014; Masson et al., 2015; Sadeh et al., 2012). Large earthquakes that initiate clusters are likely to rupture along the straight ∼100 km strike-slip segments (Lyakhovsky et al., 2001). The strike of these segments parallels the relative plate velocity vector and thus can be approximated by simple shear. Additionally, in the Dead Sea basin, GPS surveys indicate the dominance of strike-slip loading. Hamiel et al. (2018) show that, on a plate scale, horizontal shear loading dominates the velocity north of the lake. Hamiel and Piatibratova (2019) detected a component of extension of under a millimeter per year across the southern normal fault bounding the Dead Sea pull-apart (Amatzyahu Fault), yet the strike-slip component across this very fault is much larger.
-
Normal, as well as strike-slip, faults similarly react to WL change that contributes to the vertical stress component and pore pressure change. The seismicity induced by surface WL fluctuations and affected by the faulting regime is critically determined by the relative orientations of the three principal stresses in Earth's crust (Anderson, 1951). In regions where the vertical compressive stress is not minimal (normal and strike-slip faulting), seismic activity is more sensitive to the effective stress change due to WL change than in regions where it is minimal (thrust faulting) (Simpson, 1976; Snow, 1982; Roeloffs, 1988). This is applicable to reservoirs approximated as “infinite” in the horizontal plane (e.g., Wang, 2000), with respect to the fault zone horizontal cross-section. Since we are using a 1D model, such an approximation is valid for our study area where the Dead Sea is large enough in a horizontal plane (100 km×10 km) compared to the thickness of the underlying strike-slip fault (cross-section) located in the central part of the valley.
Our results demonstrate that a fairly simple forward model (based on a 1D analytical solution, Belferman et al., 2018) achieves a convincing correlation between WLs and RIs of moderate-to-strong earthquakes on the Dead Sea Fault. Whereas the fault system along the Dead Sea Fault is more complicated, 3D modeling of the tectonic motion, coupled with the pore pressure evolution, may give more reliable predictions regarding earthquake ruptures and their chronology. However, based on the relationship between the WL and RI changes presented in this article, with the current anthropogenic decrease in the Dead Sea level (with an average annual rate of ∼1 m yr−1), a moderate-to-severe earthquake will not be triggered by the mechanism discussed here. This article not only suggests the existence of a connection between WL and RI but also provides additional guidance based on this connection.
Numerous publications list earthquakes that hit the Dead Sea and its surroundings during the last 2 millennia (e.g., Agnon, 2014; Ambraseys et al., 1994; Ambraseys, 2009; Amiran et al., 1994; Guidoboni et al., 1994; Guidoboni and Comastri, 2005). In Belferman et al. (2018) we adopted from the scores of listed events only the most destructive ones, typically causing local intensities of VII or higher in Jerusalem. For a minimal epicentral distance of 30 km, this would translate to a magnitude of ∼5.7 or higher (according to the attenuation relation of Hough and Avni, 2011).
Table A1 lists the Dead Sea earthquakes considered for stress release across the Dead Sea basin during the last 2 millennia. We used two criteria: noticeable damage in fortified Jerusalem and seismites in the northern Dead Sea. Our simple model simulates an earthquake time series, given a water level curve. A total of 11 events from this time series correlate with events of magnitude ∼6 or more in the historical record. Yet, the model generates four events that are not included in our original catalog. On the other hand, a single event (∼660 CE) listed in Belferman et al. (2018) has no counterpart in the simulations despite a wide range of level curves tested. All these curves are generated by a random number generator, subject to constraints from field data. We first discuss the four events required by the simulations one by one. Then we review the ∼660 CE event along with other historical events that were left out already in Belferman et al. (2018).
Table A1A catalog of earthquakes that could potentially damage Jerusalem. The classes denote the level of acceptance of damage to Jerusalem among the researchers: C – consensual; B – accepted by Belferman et al. (2018); A – amended here; R – rejected here.

Abbreviations and notes:
a Ze'elim Creek.
b Ein Gedi core.
c Ein Feshkha Nature Reserve. The modified Mercalli intensity scale (MMS) is given by I0 (local intensity), followed by Roman numerals (range from I to XII). A: I0 – local intensity defined by Amiran et al. (1994). HA: I0 – local intensity defined by Hough and Avni (2011). GMPE: ground motion prediction equations.
AM: Ambraseys (2009).
A: Amiran et al. (1994).
HA: Hough and Avni (2011).
K: Kagan et al. (2011).
KT: Ken-Tor et al. (2001).
MI: Migowski et al. (2004).
PA: Parker (1982).
W: Williams et al. (2012).
The earthquakes in Table A1 are classified according to the level of acceptance for being destructive in Jerusalem. The nine events of Class C are all consensual (also used by Belferman et al., 2018). These events appear in all catalogs and lists and need no further discussion. The six events of Class A are debated events, accepted in the present study. All earthquakes in this class are selected by simultaneously satisfying two criteria: (1) the acceptance regularizes the relation between recurrence intervals and lake level, and (2) they are corroborated by evidence from seismites in the northern basin of the Dead Sea (Ein Feshkha and Ein Gedi sites, Fig. A1, corroborate this).
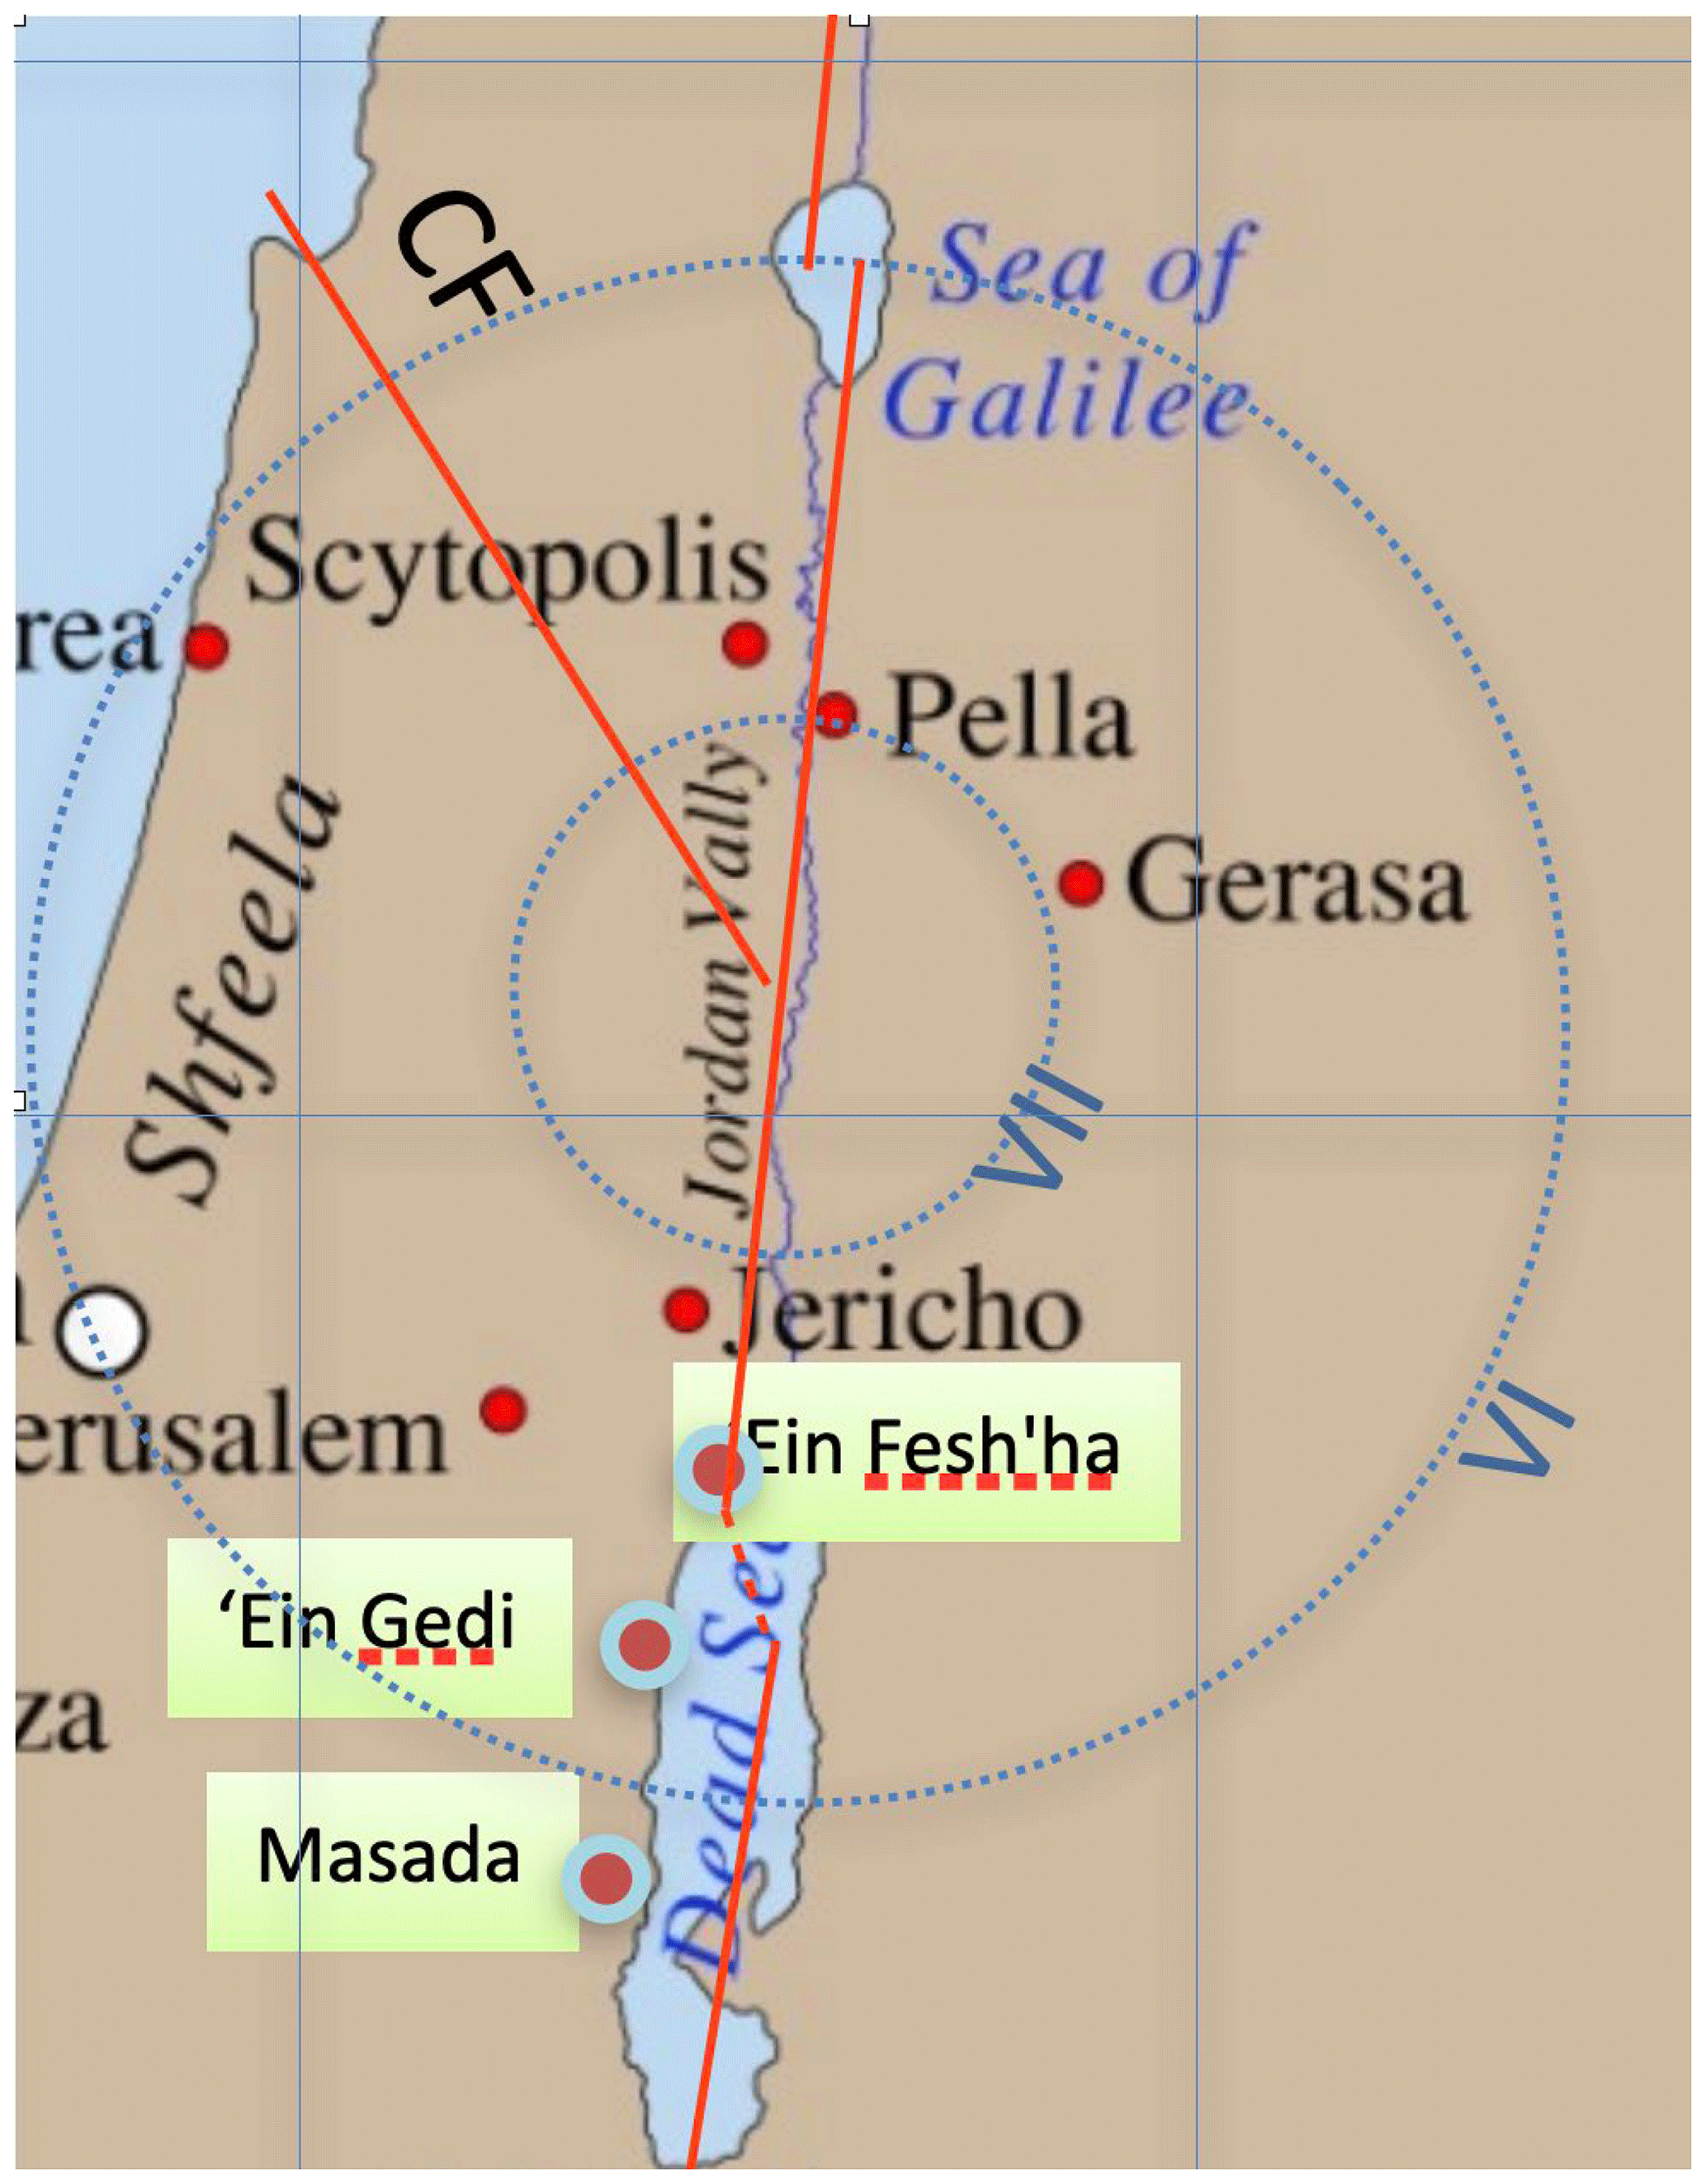
Figure A1A map showing the epicenter reconstructed by Langgut et al. (2015) for the 659/660 CE mainshock. CF – Carmel Fault.
We chose the year 33 CE to start our simulations. While this earthquake did not cause widespread damage, it was recorded in all three seismite sites (Kagan et al., 2011), with a maximum of a decade of uncertainty based on dating by counting lamina under the microscope (Migowski et al., 2004; Williams et al., 2012).
The second entry in Table A1, ∼100 CE, refers to 2 decades of unrest. Migowski et al. (2004) identified a pair of seismites around 90 and 112 CE in the Ein Gedi core. The corresponding sequences in Ein Feshkha and Ze'elim Creek are laminates, attesting to quiescence. A historical hiatus between the Roman demolition of Jerusalem and the erection of Aelia Capitolina in its stead (70–130 CE) preclude historical evidence, although damage to the Masada fortress has been assigned to an earthquake in 1712 CE.
Table A2 lists 10 earthquakes that have been reported to have caused damage around Jerusalem but are not required by our simulations. The seven events of Class R are the debated events, rejected here after discussion. The three Class S events were skipped altogether in that compilation of Ambraseys (2009).
Table A2Events listed in some catalogs and subsequently skipped (Class S) or declined (Class D) by Ambraseys (2009) or rejected (Class R) in the present study.
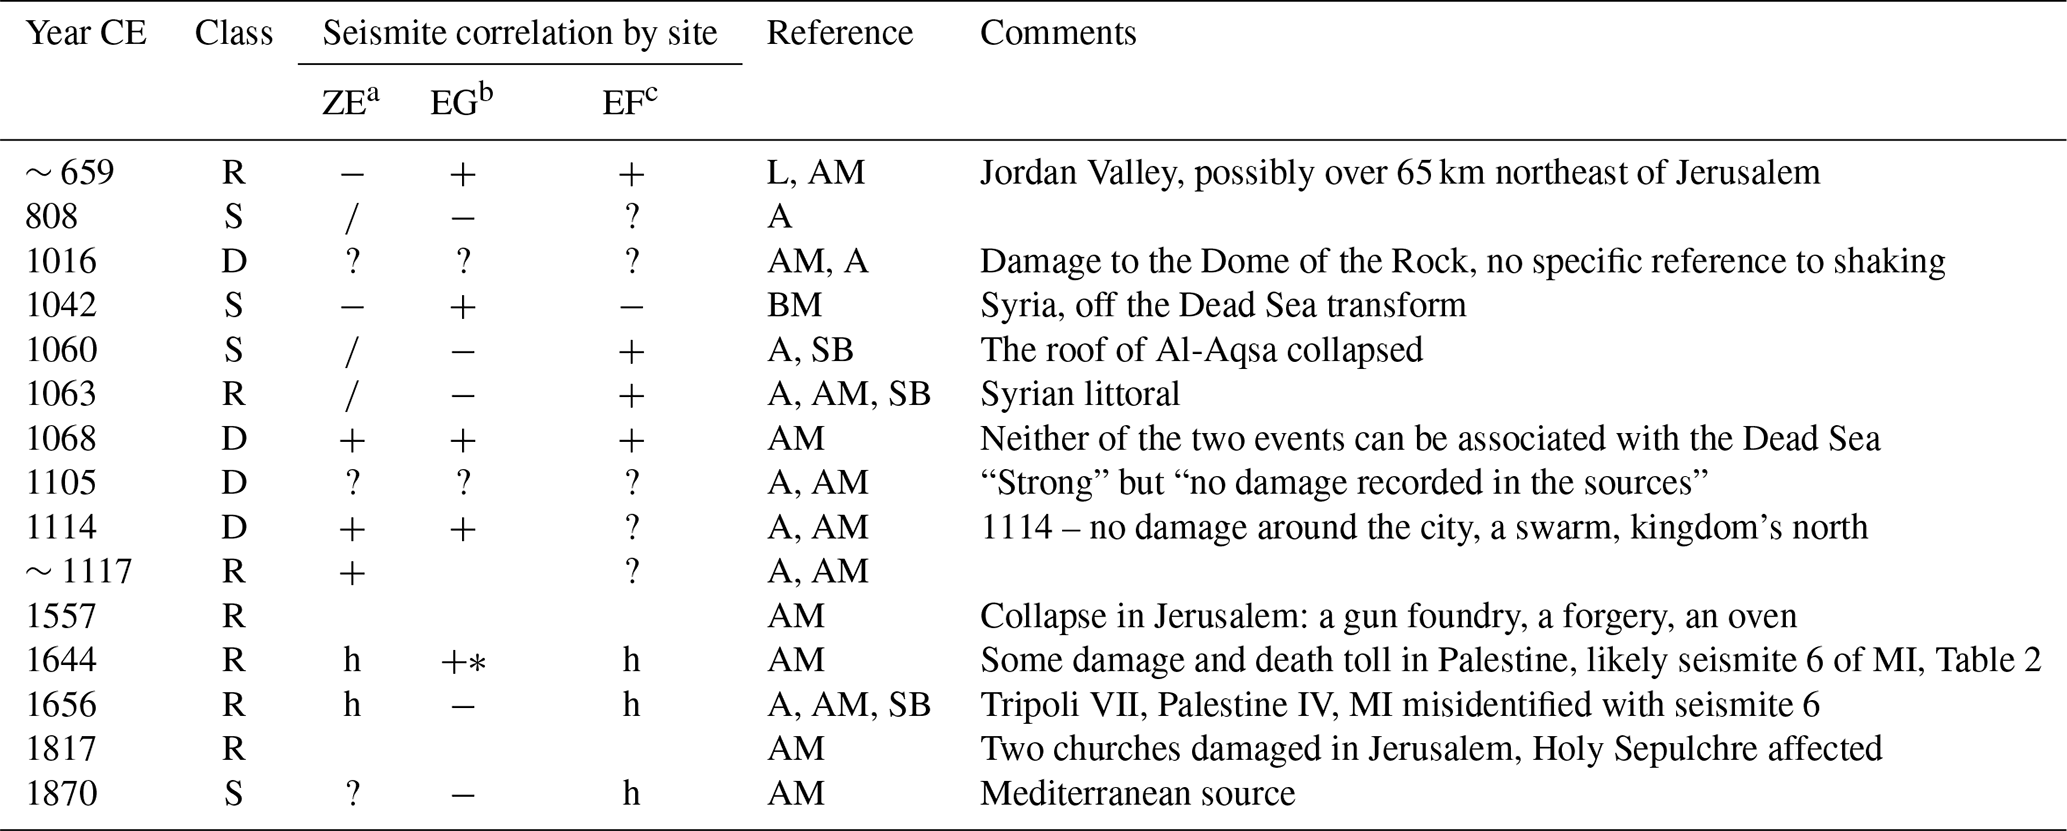
Abbreviations and notes: a Ze'elim Creek. b Ein Gedi core. c Ein Feshkha Nature Reserve. The modified Mercalli intensity scale (MMS) is given in Roman numerals (range from I to XII). AM: Ambraseys (2009). A: Amiran et al. (1994). BM: Ben-Menahem (1991). L: Langgut et al. (2015). SB: Sbeinati et al. (2005). MI: Migowski et al. (2004).
Of the seven Class R events, the 7 June 659 CE earthquake was accepted by us in Belferman et al. (2018). The earthquake has been associated with the destruction of the Monastery of Euthymius 10 km east of Jerusalem, but no damage in the town of Jerusalem has been unequivocally reported (Ambraseys, 2009). In Belferman et al. (2018) we included this event in the catalog of Dead Sea earthquakes, as Langgut et al. (2015) have located it in the center of the Jordan Valley segment of the transform (Fig. A1). However, this interpretation neglected the possibility that the rupture could have been outside the hydrological effect of the Dead Sea basin. One of the lessons of our numerous simulations is that our model would not support triggering of this earthquake shortly (less than a century) before the mid-eighth-century crisis, when lake levels were dropping to the lowest point in the studied period (420 m b.m.s.l., Fig. 1a). When rejecting the 659 CE event, the 419 CE earthquake is the one preceding the mid-eighth-century crisis; the 3-century recurrence interval fits the low lake level well.
-
1016 CE. The collapse of the Dome of the Rock was not explicitly attributed to an earthquake by the original sources, who found it enigmatic as well (Ambraseys, 2009).
-
1644 CE. Ambraseys (2009) quoted a late Arab author, al-Umari, who reported collapse of houses and deaths of five persons in “the town of Filistin”. While Ambraseys has interpreted it to probably be Jerusalem, it might refer to al-Ramla, the historical capital of the classical district of Filistin, as in “al-Ramla, Madinat Filastin” (Elad, 1992, p. 335). It could also be a mistranslation of “Bilad Filistin” which at that time referred to the entire district of the Holy Land, without specifying a town (Gerber, 1998). Jerusalem, at that time, was called Bayt al-Maqdis or, as nowadays, al-Quds. The only report of an earthquake in Jerusalem around 1644 CE mentions horror but no structural damage – the 1643 CE event that Ambraseys (2009) tends to equate with the 1644 CE event. A seismite in Ein Gedi core can be correlated with this event (Migowski et al., 2004, their Table 2, entry 6). Migowski et al. (2004) have identified the seismite with the 1656 CE earthquake that was felt in Palestine; Ambraseys' (2009) interpretation was not yet available for them.
-
1656 CE. This event was strong in Tripoli and only felt in Palestine. Migowski et al. (2004) correlated it to a seismite based on deposition rates (no lamina counting for that interval). Given the 1644 CE entry of Ambraseys (2009), this interpretation should be revised, and the 1656 CE earthquake is not to be associated with any local rupture in the Dead Sea.
All raw data can be provided by the corresponding authors upon request.
MB and AA conceptualized the project. AA collected and analyzed the data. MB modeled and visualized the data and analyzed the results. RK validated the results. MB prepared the original draft of the paper, and MB, RK and AA reviewed and revised it. AA, ZB and RK acquired funding and resources.
The contact author has declared that none of the authors has any competing interests.
Publisher's note: Copernicus Publications remains neutral with regard to jurisdictional claims in published maps and institutional affiliations.
This project was supported by grants from the Ministry of Energy (grant no. 213-17-002) and the German–Israeli Foundation for Scientific Research and Development (GIF; grant no. I-1280-301.8) and by PhD fellowships from the University of Haifa, Israel. The data for this paper were obtained with analytical and numerical modeling. We thank the editor and reviewers for their contribution in enhancing this paper.
This research has been supported by the Ministry of Energy of Israel (grant no. 213-17-002) and the German–Israeli Foundation for Scientific Research and Development (grant no. I-1280-301.8).
This paper was edited by Oded Katz and reviewed by three anonymous referees.
Agnon, A.: Pre-instrumental earthquakes along the Dead Sea rift, in: Dead Sea transform fault system: Reviews, edited by: Garfunkel, Z., Ben-Avraham, Z., and Kagan, E., Springer, Dordrecht, Netherlands, 207–261, https://doi.org/10.1007/978-94-017-8872-4_8, 2014.
Ambraseys, N.: Earthquakes in the Mediterranean and Middle East: a multidisciplinary study of seismicity up to 1900, Cambridge University Press, https://doi.org/10.1017/CBO9781139195430, 2009.
Ambraseys, N., Melville, C. P., and Adams, R. D.: The Seismicity of Egypt, Arabia and the Red Sea: A Historical Review, Cambridge Univ. Press, Cambridge, https://doi.org/10.1017/S1356186300007240, 1994.
Amiran, D. H., Arieh, E., and Turcotte, T.: Earthquakes in Israel and adjacent areas: macroscopic observations since 100 B.C.E., Isr. Explor. J., 44, 260–305, http://www.jstor.org/stable/27926357 (last access: 22 July 2022), 1994.
Anderson, E. M.: The Dynamics of Faulting and Dyke Formation with applications to Britain, 2nd edn., edited by: Oliver and Boyd, Edinburgh, Scotland, 1951.
Avni, R., Bowman, D., Shapira, A., and Nur, A.: Erroneous interpretation of historical documents related to the epicenter of the 1927 Jericho earthquake in the Holy Land, J. Seismol., 6, 469–476, https://doi.org/10.1023/A:1021191824396, 2002.
Baer, G., Funning, G. J., Shamir, G., and Wright, T. J.: The 1995 November 22, Mw 7.2 Gulf of Elat earthquake cycle revisited, Geophys. J. Int., 175, 1040–1054, https://doi.org/10.1111/j.1365-246X.2008.03901.x, 2008.
Belferman, M., Katsman, R., and Agnon, A. Effect of large-scale surface water level fluctuations on earthquake recurrence interval under strike-slip faulting, Tectonophysics, 744, 390–402, https://doi.org/10.1016/j.tecto.2018.06.004, 2018.
Ben-Menahem, A.: Earthquake catalogue for the Middle East (92 B.C.-1980 A.D.), B. Geofis. Teor. Appl., 21, 245–313, 1979.
Bookman, R., Enzel, Y., Agnon, A., and Stein, M.: Late Holocene lake levels of the Dead Sea, GSA Bulletin, 116, 555–571, https://doi.org/10.1130/B25286.1, 2004.
Byerlee, J. D.: Friction of rocks, in: Rock Friction and Earthquake Prediction, edited by: Byerlee, J. D. and Wyss, M., Springer, Birkhäuser, Basel, 615–626, https://doi.org/10.1007/978-3-0348-7182-2, 1978.
Durá-Gómez, I. and Talwani, P.: Reservoir-induced seismicity associated with the Itoiz Reservoir, Spain: a case study, Geophys. J. Int., 181, 343–356, https://doi.org/10.1111/j.1365-246X.2009.04462.x, 2010.
Elad, A.: Two Identical Inscriptions From Jund Filasṭīn From the Reign of the 'Abbāsid Caliph, Al-Muqtadir, J. Econ. Soc. Hist. Orie., 35, 301–360, https://doi.org/10.2307/3632739, 1992.
Garfunkel, Z.: Lateral motion and deformation along the Dead Sea Transform, in: Dead Sea Transform Fault System: Reviews, edited by: Garfunkel, Z., Ben-Avraham, Z., and Kagan, E., Springer, Dordrecht, Netherlands, 109–150, https://doi.org/10.1007/978-94-017-8872-4, 2014.
Gerber, H.: “Palestine” and Other Territorial Concepts in the 17th Century, Int. J. Middle E. Stud., 30, 563–572, https://www.jstor.org/stable/164341, 1998.
Guidoboni, E. and Comastri, A.: Catalogue of Earthquakes and Tsunamis in the Mediterranean Area from the 11th to the 15th Century, Istituto nazionale di geofisica e Vulcanologia, Rome, Italy, https://doi.org/10.1515/BYZS.2008.854, 2005.
Guidoboni, E., Comastri, A., and Traina, G.: Catalogue of Ancient Earthquakes in the Mediterranean Area Up to the 10th Century, Istituto nazionale di geofisica, Rome, Italy, https://doi.org/10.1163/182539185X01377, 1994.
Gupta, H. K.: A review of recent studies of triggered earthquakes by artificial water reservoirs with special emphasis on earthquakes in Koyna, India, Earth-Sci. Rev., 58, 279–310, https://doi.org/10.1016/S0012-8252(02)00063-6, 2002.
Gupta, H. K.: Reservoir triggered seismicity (RTS) at Koyna, India, over the past 50 yrs, B. Seismol. Soc. Am., 108, 2907–2918, https://doi.org/10.1785/0120180019, 2018.
Hamiel, Y. and Piatibratova, O.: Style and distribution of slip at the margin of a pull-apart structure: Geodetic investigation of the Southern Dead Sea Basin, J. Geophys. Res.-Sol. Ea., 124, 12023–12033, https://doi.org/10.1029/2019JB018456, 2019.
Hamiel, Y., Masson, F., Piatibratova, O., and Mizrahi, Y.: GPS measurements of crustal deformation across the southern Arava Valley section of the Dead Sea Fault and implications to regional seismic hazard assessment, Tectonophysics, 724, 171–178, https://doi.org/10.1016/j.tecto.2018.01.016, 2018.
Hofstetter, R., Klinger, Y., Amrat, A. Q., Rivera, L., and Dorbath, L.: Stress tensor and focal mechanisms along the Dead Sea fault and related structural elements based on seismological data, Tectonophysics, 429, 165–181, https://doi.org/10.1016/j.tecto.2006.03.010, 2007.
Hua, W., Chen, Z., and Zheng, S.: Source parameters and scaling relations for reservoir induced seismicity in the Longtan reservoir area, Pure Appl. Geophys., 170, 767–783, https://doi.org/10.1007/s00024-012-0459-7, 2013a.
Hua, W., Chen, Z., Zheng, S., and Yan, C.: Reservoir-induced seismicity in the Longtan reservoir, southwestern China, J. Seismol., 17, 667–681, https://doi.org/10.1007/s10950-012-9345-0, 2013b.
Hough, S. E. and Avni, R.: The 1170 and 1202 CE Dead Sea Rift earthquakes and long-term magnitude distribution of the Dead Sea Fault Zone, Israel J. Earth Sci., 58, 295–308, https://doi.org/10.1560/IJES.58.3-4.295, 2011.
Jaeger, J., Cook, N. G., and Zimmerman, R.: Fundamentals of rock mechanics, fourth edition, Blackwell Publishing, Oxford, UK, ISBN: 978-0-632-05759-7, 2009.
Kagan, E., Stein, M., Agnon, A., and Neumann, F.: Intrabasin paleoearthquake and quiescence correlation of the late Holocene Dead Sea, J. Geophys. Res.-Sol. Ea., 116, 148–227, https://doi.org/10.1029/2010JB007452, 2011.
Ken-Tor, R., Agnon, A., Enzel, Y., Stein, M., Marco, S., and Negendank, J. F.: High-resolution geological record of historic earthquakes in the Dead Sea basin, J. Geophys. Res.-Sol. Ea., 106, 2221–2234, https://doi.org/10.1029/2000JB900313, 2001.
Langgut, D., Yannai, E., Taxel, I., Agnon, A., and Marco, S.: Resolving a historical earthquake date at Tel Yavneh (central Israel) using pollen seasonality, Palynology, 40, 145–159, https://doi.org/10.1080/01916122.2015.1035405, 2015.
Lefevre, M., Klinger, Y., Al-Qaryouti, M., Le Béon, M., and Moumani, K.: Slip deficit and temporal clustering along the Dead Sea fault from paleoseismological investigations, Sci. Rep.-UK, 8, 4511, https://doi.org/10.1038/s41598-018-22627-9, 2018.
Lyakhovsky, V., Ben-Zion, Y., and Agnon, A.: Earthquake cycle, fault zones, and seismicity patterns in a rheologically layered lithosphere, J. Geophys. Res.-Sol. Ea., 106, 4103–4120, https://doi.org/10.1029/2000JB900218, 2001.
Marco, S. and Klinger, Y.: Review of On-Fault Palaeoseismic Studies Along the Dead Sea Fault, in: Dead Sea Transform Fault System: Reviews, edited by: Garfunkel, Z., Ben-Avraham, Z., and Kagan, E., Springer, Dordrecht, Netherlands, 183–205, https://doi.org/10.1007/978-94-017-8872-4_7, 2014.
Masson, F., Hamiel, Y., Agnon, A., Klinger, Y. and Deprez, A.: Variable behavior of the Dead Sea Fault along the southern Arava segment from GPS measurements, C.R. Geosci., 347, 161–169, https://doi.org/10.1016/j.crte.2014.11.001, 2015.
Migowski, C., Agnon, A., Bookman, R., Negendank, J. F., and Stein, M.: Recurrence pattern of Holocene earthquakes along the Dead Sea transform revealed by varve-counting and radiocarbon dating of lacustrine sediments: Earth Planet. Sc. Lett., 222, 301–314, https://doi.org/10.1016/j.epsl.2004.02.015, 2004.
Migowski, C., Stein, M., Prasad, S., Negendank, J. F. W., and Agnon, A.: Holocene climate variability and cultural evolution in the Near East from the Dead Sea sedimentary record, Quaternary Res., 66, 421-431, https://doi.org/10.1016/j.yqres.2006.06.010, 2006.
Mogi, K.: Some discussions on aftershocks, foreshocks and earthquake swarms: the fracture of a semi-infinite body caused by an inner stress origin and its relation to the earthquake phenomena (3rd paper), B. Earthq. Res. I. Tokyo, 41, 615–658, 1963.
Palano, M., Imprescia, P., and Gresta, S.: Current stress and strain-rate fields across the Dead Sea Fault System: Constraints from seismological data and GPS observations, Earth Planet. Sc. Lett., 369, 305–316, https://doi.org/10.1016/j.epsl.2013.03.043, 2013.
Pandey, A. P. and Chadha, R. K.: Surface loading and triggered earthquakes in the Koyna–Warna region, western India, Phys. Earth Planet. In., 139, 207–223, https://doi.org/10.1016/j.pepi.2003.08.003, 2003.
Parker, S. T.: Preliminary Report on the 1980 Season of the Central “Limes Arabicus” Project, B. Am. Sch. Oriental Re., 247, 1–26, https://doi.org/10.2307/1356476, 1982.
Roeloffs, E. A.: Fault stability changes induced beneath a reservoir with cyclic variations in water level, J. Geophys. Res.-Sol. Ea., 93, 2107–2124, https://doi.org/10.1029/JB093iB03p02107, 1988.
Russell, K. W.: The earthquake chronology of Palestine and northwest Arabia from the 2nd through the mid-8th century AD, B. Am. Sch. Oriental Re., 260, 37–59, https://doi.org/10.2307/1356863, 1985.
Sadeh, M., Hamiel, Y., Ziv, A., Bock, Y., Fang, P., and Wdowinski, S.: Crustal deformation along the Dead Sea Transform and the Carmel Fault inferred from 12 years of GPS measurements, J. Geophys. Res.-Sol. Ea., 117, B08410, https://doi.org/10.1029/2012JB009241, 2012.
Sbeinati, M. R., Darawcheh, R., and Mouty, M.: The historical earthquakes of Syria: an analysis of large and moderate earthquakes from 1365 B.C. to 1900 A.D., Ann. Geophys., 48, 347–435, http://hdl.handle.net/2122/908, 2005.
Scholz, C. H.: Crustal movements in tectonic areas, Tectonophysics, 14, 201–217, https://doi.org/10.1016/0040-1951(72)90069-8, 1972.
Shapira, A., Avni, R., and Nur, A.: A new estimate for the epicenter of the Jericho earthquake of 11 July 1927, Israel J. Earth Sci., 42, 93–96, 1993.
Simpson, D. W.: Seismicity changes associated with reservoir loading, Eng. Geol., 10, 123–150, https://doi.org/10.1016/0013-7952(76)90016-8, 1976.
Simpson, D. W., Leith, W., and Scholz, C.: Two types of reservoir-induced seismicity, B. Seismol. Soc. Am., 78, 2025–2040, 1988.
Snow, D. T.: Hydrogeology of induced seismicity and tectonism: Case histories of Kariba and Koyna, Geol. S. Am. Spec. Pap., 189, 317–360, https://doi.org/10.1130/SPE189-p317, 1982.
Stern, O.: Geochemistry, Hydrology and Paleo-Hydrology of Ein Qedem Spring System, Geological Survey of Israel, Jerusalem, Israel, Report GSI/17/2010, https://www.gov.il/he/Departments/publications/reports/stern-report-2010 (last access: 2 August 2022), 2010 (in Hebrew).
Talwani, P.: On the nature of reservoir-induced seismicity, Pure Appl. Geophys., 150, 473–492, https://doi.org/10.1007/978-3-0348-8814-1_8, 1997.
Wang, H.: Theory of Linear Poroelasticity with Applications to Geomechanics and Hydrogeology, University Press, Princeton, https://doi.org/10.1515/9781400885688, 2000.
Wechsler, N., Rockwell, T. K., Klinger, Y., Štěpančíková, P., Kanari, M., Marco, S., and Agnon, A.: A paleoseismic record of earthquakes for the Dead Sea transform fault between the first and seventh centuries C.E.: Nonperiodic behavior of a plate boundary fault, B. Seismol. Soc. Am., 104, 1329–1347, https://doi.org/10.1785/0120130304, 2014.
Williams, J. B., Schwab, M. J., and Brauer, A.: An early first-century earthquake in the Dead Sea, Int. Geol. Rev., 54, 1219–1228, https://doi.org/10.1080/00206814.2011.639996, 2012.