the Creative Commons Attribution 4.0 License.
the Creative Commons Attribution 4.0 License.
 | 09 Aug 2022
Projected impact of heat on mortality and labour productivity under climate change in Switzerland
Zélie Stalhandske
Valentina Nesa
Marius Zumwald
Martina S. Ragettli
Alina Galimshina
Niels Holthausen
Martin Röösli
David N. Bresch
Extreme temperatures have reached unprecedented levels in many regions of the globe due to climate change, and a further increase is expected. Besides other consequences, high temperatures increase the mortality risk and severely affect the labour productivity of workers. We perform a high-resolution spatial analysis to assess the impacts of heat on mortality and labour productivity in Switzerland and project their development under different Representative Concentration Pathway (RCP) scenarios, considering that no socio-economic changes take place. The model is based on the risk framework of the Intergovernmental Panel on Climate Change (IPCC), which combines the three risk components: hazard, exposure, and vulnerability. We model the two impact categories in the same spatially explicit framework, and we integrate uncertainties into the analysis by a Monte Carlo simulation. We model first that about 658 deaths are associated with heat exposure currently each year in Switzerland. Second, the economic costs caused by losses in labour productivity amount to around CHF 665 million (approx. USD 700 million) per year. Should we remain on an RCP8.5 emissions pathway, these values may double (for mortality) or even triple (for labour productivity) by the end of the century. Under an RCP2.6 scenario impacts are expected to slightly increase and peak around mid-century, when climate is assumed to stop warming. Even though uncertainties in the model are large, the underlying trend in impacts is unequivocal. The results of the study are valuable information for political discussions and allow for a better understanding of the cost of inaction.
- Article
(3622 KB) - Full-text XML
-
Supplement
(9631 KB) - BibTeX
- EndNote


Temperatures around the globe keep increasing, with an observed mean positive warming of about 1∘C from pre-industrial levels (IPCC, 2013). As a result, extreme heat events are becoming more intense, last longer, and happen more frequently (Alexander et al., 2006; Coumou et al., 2013; Della-Marta et al., 2007; Fischer and Schär, 2009; Schär et al., 2004). These trends are particularly strong in central and southeastern Europe (Fischer and Knutti, 2014; Donat et al., 2013; Fischer and Schär, 2010; Morabito et al., 2017). As extreme heat events become more common, humans experience an increase in environmental heat stress exposure (Willett and Sherwood, 2012; Zhao et al., 2015).
The impacts of heat on human physiology have societal and economic consequences (Carleton and Hsiang, 2016; Haines et al., 2006; Mora et al., 2017; Kjellstrom et al., 2018). Heat-related illnesses happen when the human thermoregulatory capacity is exceeded, increasing core body temperature (Parsons, 2014; WHO, 2008). Overheating can put vital organs at risk and leads to heat cramps, heat exhaustion, or, in the worst case, life-threatening heatstroke. At the same time, existing critical health conditions, such as chronic pulmonary and cardiac diseases, kidney disorders, and psychiatric illnesses, can be aggravated (WHO, 2015). Several studies have reported temperature-related excess mortality and increased morbidity. For example, in the summer of 2015, the second warmest summer in Switzerland on record, an increase in mortality of 5.4 % was reported, with people older than 75 making up 77 % of the deaths (Vicedo-Cabrera et al., 2016).
Heat effects on human metabolism can also decrease labour productivity (Dasgupta et al., 2021; Sahu et al., 2013; Wyndham, 1969). Before the metabolic effects become life threatening, heat in the workplace leads to diminished physical work capacity, diminished mental ability, and increased accident risk (Kjellstrom et al., 2009c; Hancock et al., 2007). Physically demanding tasks create excess heat in the body of (outdoor) workers, rendering them particularly vulnerable to heat stress (WHO, 2008; Kjellstrom et al., 2016). Labour represents a major component of a country’s national GDP, and sustained losses in labour productivity can have important repercussions on the overall economy (Carleton and Hsiang, 2016; Kjellstrom et al., 2018; Dunne et al., 2013; Kjellstrom et al., 2009a; Zhao et al., 2021). A better knowledge of environmental heat exposure and the resulting societal impacts is of decisive importance for protecting population health and reducing economical losses.
As heat has become a major hazard in many parts of the world, heat-related mortality and labour productivity losses have become active research fields in the last years. The majority of studies focus on mortality and have assessed the burden of past events (Vicedo-Cabrera et al., 2016; Ragettli et al., 2017; Lay et al., 2021; Vicedo-Cabrera et al., 2021). But recent studies have also projected future changes in temperature-related mortality due to climate change (Martínez-Solanas et al., 2021; Gasparrini et al., 2017; Vicedo-Cabrera et al., 2016; Huber et al., 2020). On the topic of labour productivity, studies have mainly explored the potential impact of climate change from a global to regional perspective based on general circulation models (Kjellstrom et al., 2018; Casanueva et al., 2020; Orlov et al., 2019; Dasgupta et al., 2021; Shayegh et al., 2020; Zhang and Shindell, 2021). These studies have however rarely been performed with high-resolution climate models and exposure data and are based on a limited number of climate models. More detailed analysis however has been made possible as many countries are producing high-spatial-resolution information about the past, present, and future climate for national assessments (Sørland et al., 2020). Here, we provide a detailed impact assessment and future projections for excess mortality and losses in labour productivity in Switzerland at the kilometre level for distinct population groups and activity classes using a common modelling framework (Aznar-Siguan and Bresch, 2019). This is the first work to our knowledge combining these two impact categories in the same model, which is valuable when assessing the benefits of adaptation measures.
The study is structured as follows. The data and methods for each of the two impact categories (mortality and labour productivity) are described in Sect. 2. Results are presented in Sect. 3, consisting of the impact assessment and projections for the two issues. In Sect. 4, the results and the policy implications are discussed, and the main conclusions are drawn.
We base our calculations on the risk framework proposed by the IPCC (2014) as implemented in the open-source CLIMADA impact modelling platform (Aznar-Siguan and Bresch, 2019). This framework combines the three risk components hazard, exposure, and vulnerability to quantify socio-economic impacts of natural hazards. A schema for this modelling approach is presented in Fig. 1 for the calculation of the labour productivity losses. With this method, different impacts are explored with the same modelling framework. We model heat-related impacts in Switzerland throughout the century, combining high-resolution datasets, namely (i) the CH2018 Climate Scenarios (NCCS, 2018), national climate scenarios with daily data until 2080 on a 2×2 km grid for several RCP (Representative Concentration Pathway) scenarios (hazard), and (ii) the geographical distribution of population and workers per hectare (exposure). We represent the link between local exposure and heat hazards by impact functions (vulnerability). While the hazard is spatio-temporally variable, we assume the exposure to vary only in space, and we keep the vulnerability constant. We then combine the three risk components using a Monte Carlo simulation to assess the uncertainties.
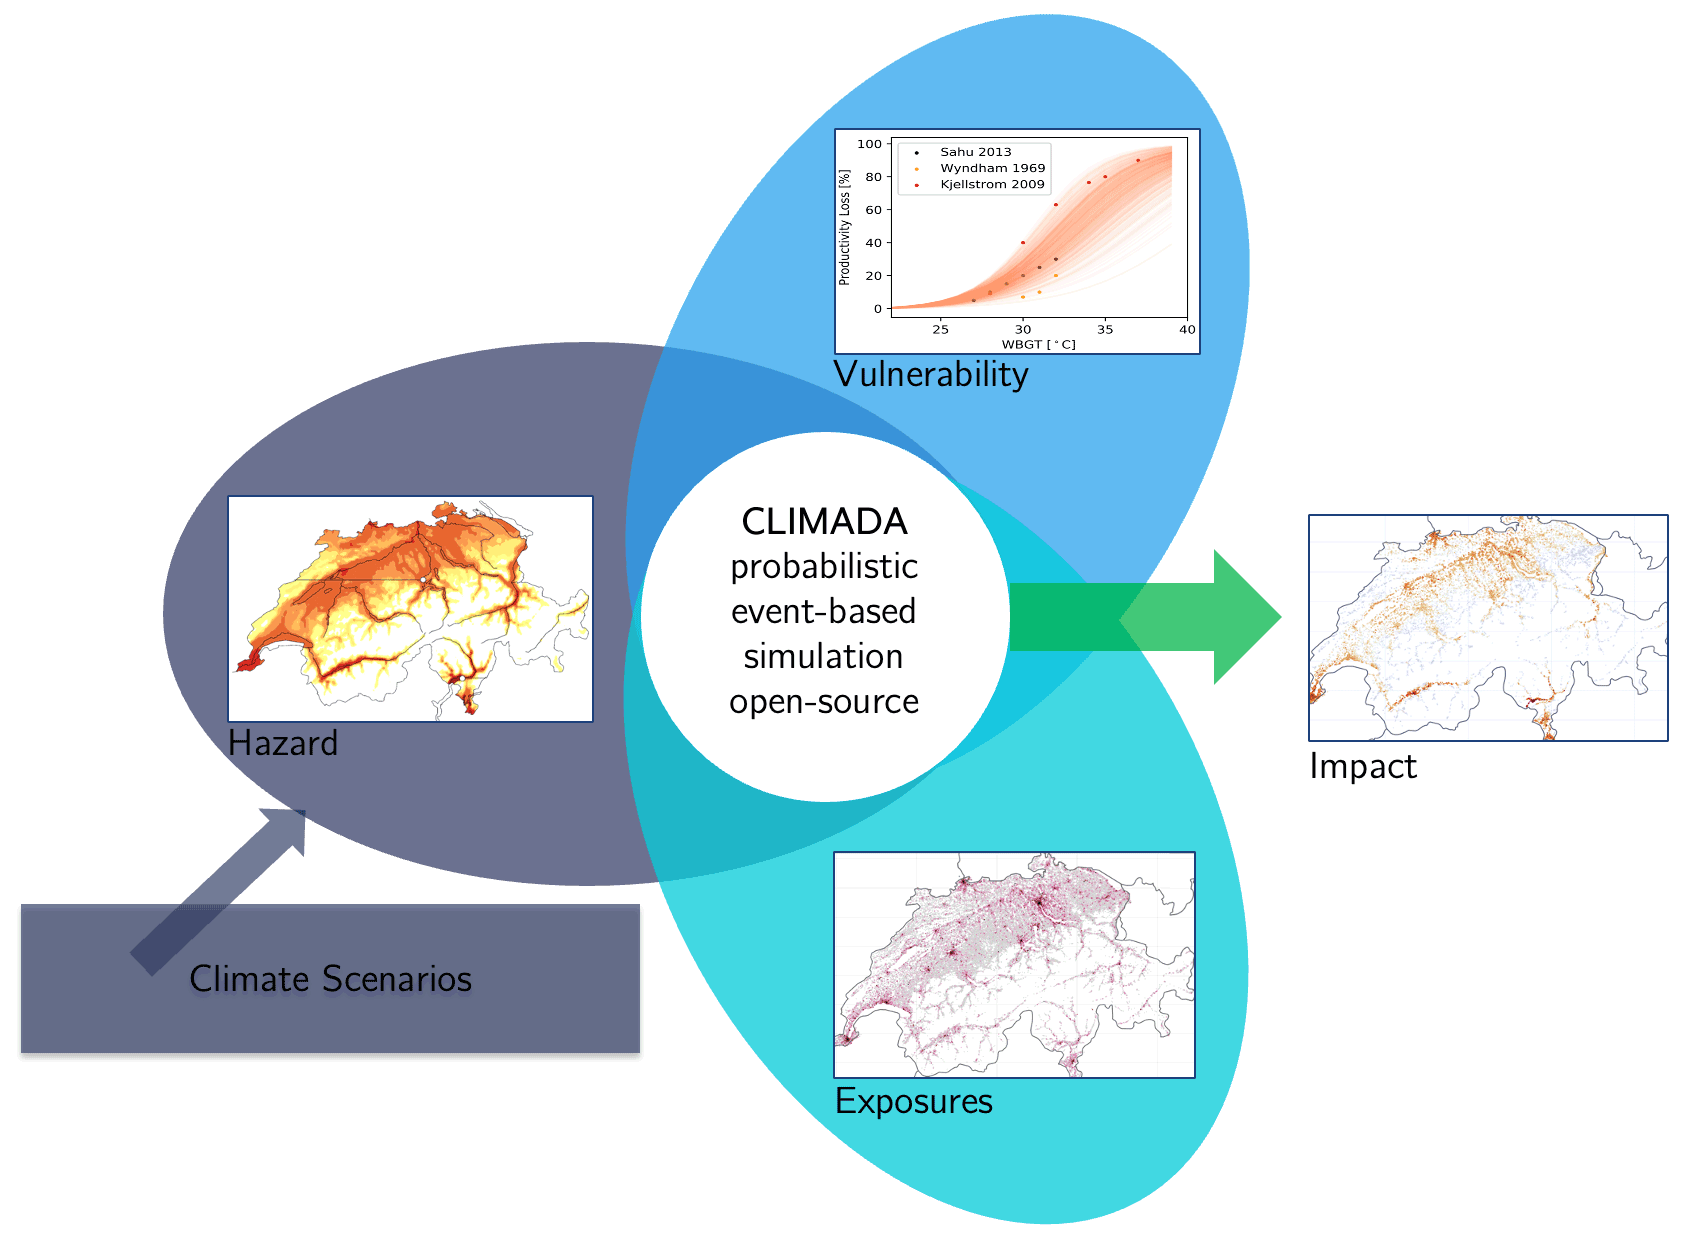
Figure 1IPCC risk framework applied to the modelling of heat impact on labour productivity in CLIMADA (Aznar-Siguan and Bresch, 2019).
2.1 Mortality
To compute the impact of heat on mortality, we use the daily maximum temperature (Tmax) of the CH2018 Climate Scenarios for Switzerland. The CH2018 data were produced by applying a statistical bias-correction and downscaling method (quantile mapping, QM) to the original output of EURO-CORDEX climate model simulations using station observations and observation-based gridded analyses as observational reference (NCCS, 2018). We choose Tmax as an indicator as it was used in previous analyses of heat-related mortality in Switzerland (Vicedo-Cabrera et al., 2016), including the study used to compute the impact functions (Ragettli et al., 2017).
We use population data of the Swiss Federal Statistical Office (FSO), representing the geographical distribution of residents at hectare level (BFS, 2018). For each grid cell, the number of residents and their age are specified. We divide the population into two age categories: people younger than 75 years and people of 75 years and older, based on the impact functions reported by Ragettli et al. (2017).
We finally use the impact functions linking the maximum temperature to the excess mortality for the two age categories and their uncertainty ranges from Ragettli et al. (2017). In their work, the authors explored the relationship between temperature and daily mortality (natural causes and accidents) for eight Swiss cities using data of the warm season (May to September) between 1995 and 2013 . The association was computed for different temperature indicators in terms of relative risk (RR) using the median temperature of the warm season (May to September) across all cities as reference. For this study we use the RR calculated for Tmax. The function describes the non-linear and delayed effect of daily maximum temperature on mortality. From the mean RR estimate and the 95 % confidence interval for each degree of temperature, we generate the impact functions by sampling across the confidence interval according to a normal distribution as shown in Fig. 2 for the people older than 75 years (see Sect. S6 of the Supplement for further information). We assumed the relative risk to be the same for all regions of Switzerland.
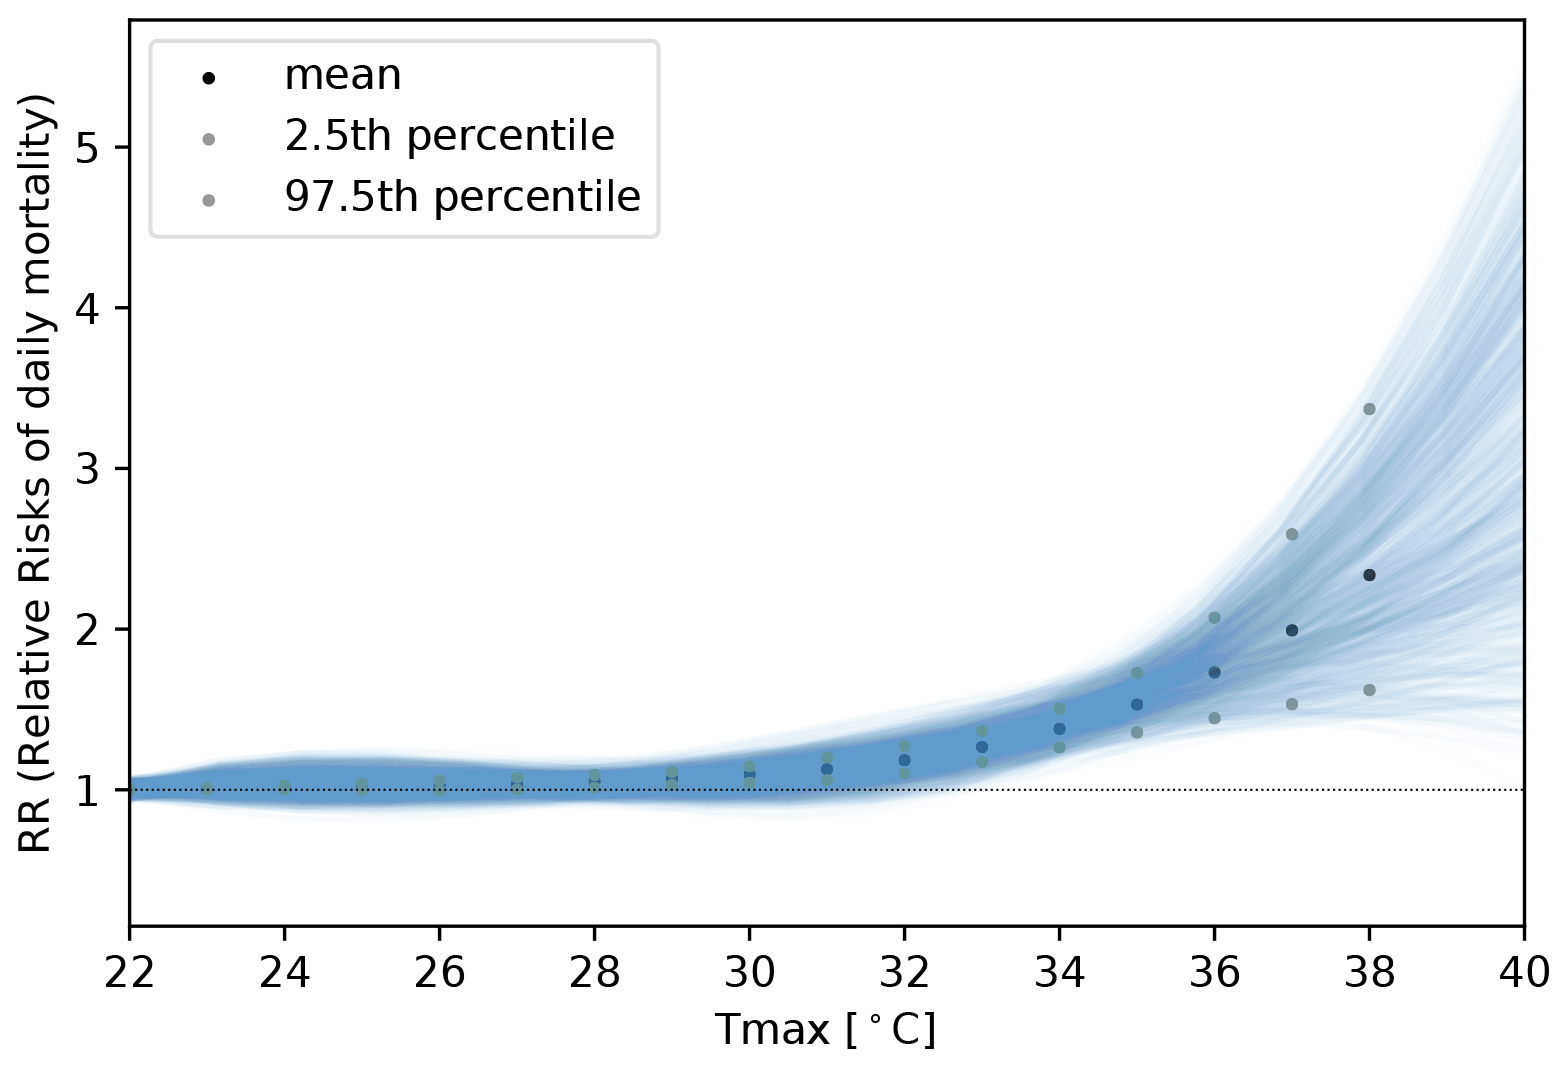
Figure 2Distribution of functions describing the relationship between daily maximum temperature and relative risk of daily mortality for people at or above the age of 75. The mean curve and the confidence interval are taken from Ragettli et al. (2017).
To calculate the impact of heat on mortality, we first divide the daily number of deaths (i.e. the average number of daily deaths in the summer half year between 2010 and 2019; BFS, 2020b) by the RR of daily mortality for each degree of temperature above 22 ∘C. The aim of this step is to exclude the deaths due to heat by applying a correction factor and avoid an overestimation. It is important to note that we assume that deaths are evenly distributed throughout the warm season (May to September) and the same on each day. To calculate the daily number of deaths per cell, we multiply the computed average by the fraction of the population per cell with respect to the total Swiss population. In a further step, we calculate the fraction of deaths attributable to heat (AF) for each degree of temperature using Eq. (1) (Perez and Künzli, 2009). For each degree of temperature we furthermore count the number of days in the year reaching that maximum temperature in the cell. We consider the closest integer temperature as these are the values provided for the RR. We then multiply per each degree of temperature the average number of daily deaths per cell, the AF, and the number of days reaching the respective temperature as maximum and sum the obtained values up to obtain the number of heat-related deaths per year at a cell level. We then aggregate hectare values for the entire country (see Eq. 2).
where RR(T) represents the RR of daily mortality for the respective temperature (i.e. impact functions).
2.2 Labour productivity
For the impact of heat on labour productivity we use the hourly wet bulb globe temperature (WBGT), an index that represents apparent temperature combining several meteorological variables that regulate human heat exchanges (i.e. air temperature, humidity, wind speed, and solar radiation). This metric is commonly used in research on labour productivity (Kjellstrom et al., 2018, 2009c) and also for international standards for occupational health and safety (ISO standards) (ISO, 1989).
As the CH2018 gridded data are available for minimum and maximum temperature, we predict the WBGT inside and outside buildings, both in the shade and in the sun, based on the hour of the day, and the minimum and maximum daily temperature, including the uncertainty of this transformation in the Monte Carlo simulation. To derive the prediction model, we first calculate the WBGT from the CH2018 data for building simulations, which provides hourly humidity, wind speed, temperature, and radiation for 45 stations across Switzerland but only for 6 statistical years in 2035 and 2060, based on the RCP2.6 and RCP8.5 scenarios (see Sect. S2 of the Supplement) (MeteoSwiss, 2022). In order to estimate the WBGT inside buildings from the CH2018 data for building simulations, we use the EnergyPlus engine to perform a thermal dynamic analysis (Roudsari and Pak, 2013). We construct the simplified 3-D model of a typical office building in Zurich using the Rhinoceros 5 modelling tool and simulate temperature using the Honeybee plugin (Roudsari and Pak, 2013). The analysis includes the hourly energy demand of the building and the operating temperature inside (see Sect. S3 of the Supplement).
As to model the exposure, we use companies' structure statistics of the FSO, depicting the geographical distribution of workers in 85 activity classes at hectare level (BFS, 2017). The dataset indicates the number of full-time equivalent employees per activity class within a hectare, which we multiply by the respective average hourly salary of each class (BFS, 2020a). Next we assign the activity classes to three main categories: low, moderate, and high physical activity (Kjellstrom et al., 2018). For each activity class we furthermore specify whether the work tasks are mainly conducted inside or outside buildings. For example, we assign people working in the construction sector to the category outside – high physical activity, whereas people working for different types of administration are assigned to the category inside – low physical activity (see Sect. S5 of the Supplement).
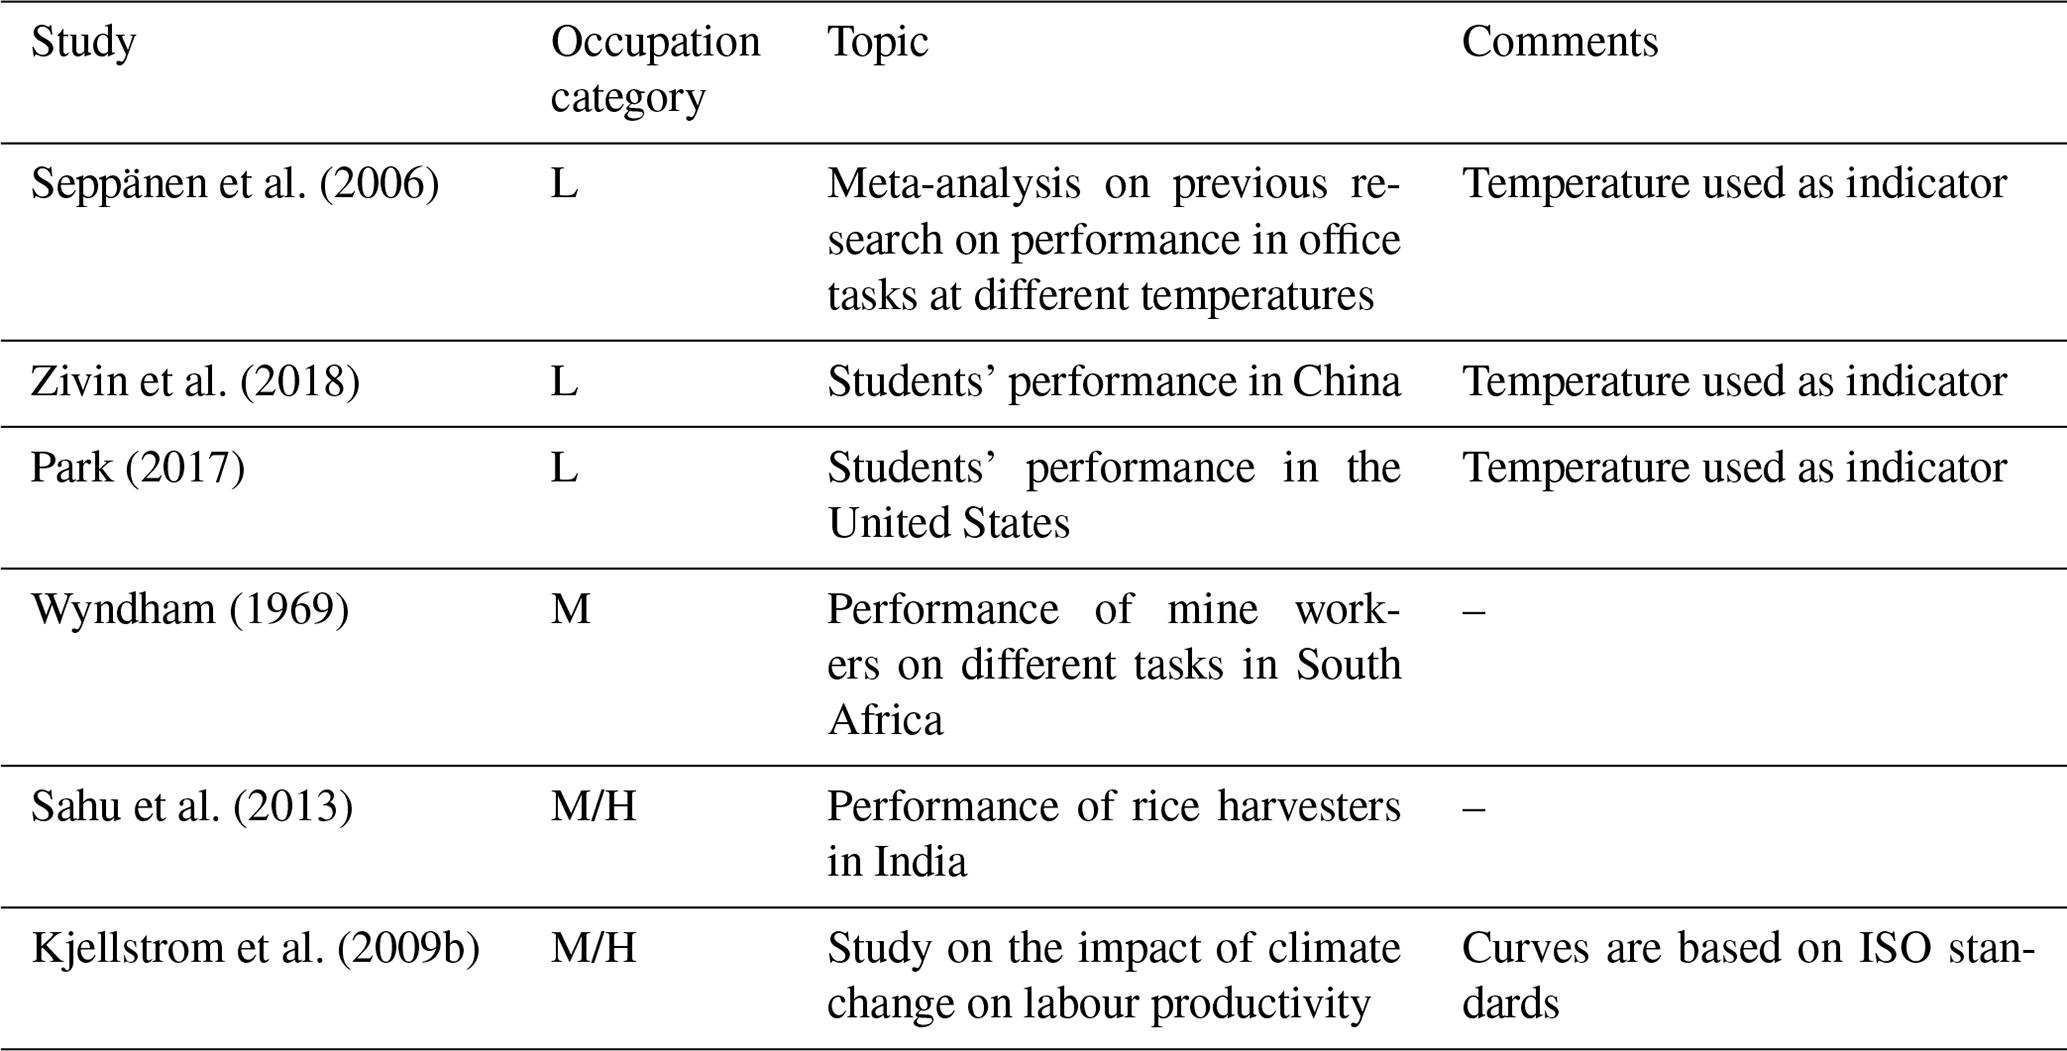
We finally generate the impact functions depicting the relationship between environmental heat exposure (i.e. WBGT values) and loss in labour productivity on the basis of six studies, which are listed and characterized in Table 1. We construct three impact functions and uncertainty estimations, each corresponding to a work category: low, moderate, and high physical activity (see Sect. S7 of the Supplement). We use mainly empirical studies (i.e. studies describing the observed response of workers in different thermal environments) since they best represent the real impact of heat on labour productivity. In the case there are no such studies available, we use functions derived from ISO standards, as done in previous studies (Kjellstrom et al., 2009a).
For the development of the curves, we fit the respective sigmoid functions (see Sect. S7.1) using the least squares method. Given the scarcity of studies that meet all the criteria, the large amount of uncertainty involved, and that we apply a significant amount of subjective judgement, we use a range of possible impact functions in the analysis as shown in Fig. 3 for the moderate physical activity (see Sect. S7.2 for the impact functions of other categories). We assume a normal distribution, setting its parameters so as to take into account all the different studies when sampling the functions.
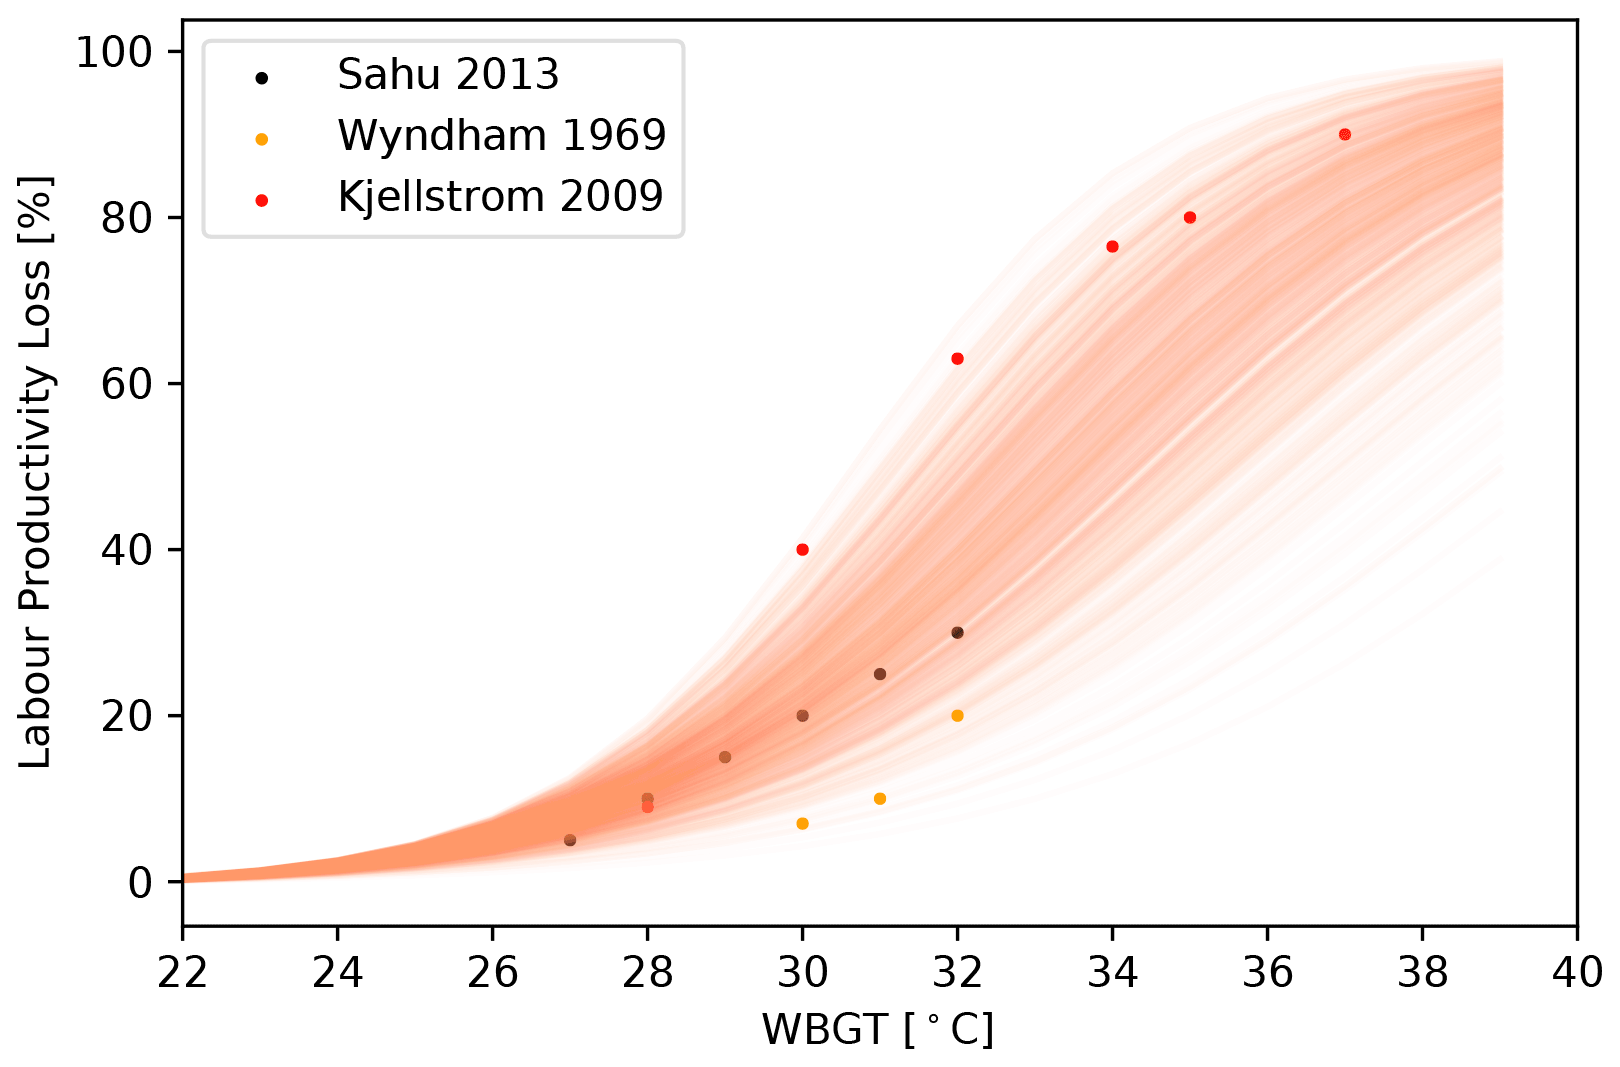
Figure 3Distribution of impact functions describing the relationship between WBGT and percentage of labour productivity loss for people working at a moderate physical activity.
We compute the impact of heat on labour productivity by multiplying the total exposed salary value at each hectare with the hourly predicted loss in labour productivity for the respective WBGT and by summing up the values per working day, throughout the year, and for the entire country (see Eq. 3).
where Ecell indicates exposed salary value at each cell and Loss(WBGThour) the hourly predicted loss in labour productivity for the respective WBGT (i.e. impact functions).
Seppänen et al. (2006)Zivin et al. (2018)Park (2017)Wyndham (1969)Sahu et al. (2013)Kjellstrom et al. (2009b)Table 1Characterization of the studies used to develop the impact functions for labour productivity. The second column illustrates the occupation category (low (L), moderate (M), and high (H) physical activity) that the study analysed for the construction of the function. The procedure to transform results expressed as a function of the temperature in WBGT is illustrated in Sect. S4 (see fourth column: Comments).
2.2.1 Uncertainty analysis
With regards to the hazard, uncertainties originate from the climate simulations, the natural variability in the CH2018 climate data, and, when estimating losses of labour productivity, from the calculation of hourly WBGT. The CH2018 ensemble consists of 12 simulations for RCP2.6, 25 for RCP4.5, and 31 for RCP8.5. Averaging those would result in losing the most extreme values, which play an essential role in this study. Therefore, we consider these as the climate model uncertainty, and each time we compute the impact, we randomly pick a different simulation within the ensemble.
Because of the natural variability in the CH2018 climate data, in each run we sample uniformly a random year in a ±3-year time range. We choose this range as it proved to reduce the variability between consecutive years so that the climate trend remains stronger.
For the transformations used to retrieve hourly WBGT values from minimum and maximum daily temperature data, we assume a normal distribution based on the RMSE of the prediction models.
For each run, we randomly pick if workers outside are working in the sun or in the shadow to account for the difference in WBGT.
Finally, for uncertainties related to the impact functions (vulnerability) we assume normal distributions. A summary of all uncertainties and the shape of their distributions can be found in Sect. S8.
To integrate uncertainties in the analysis, we use a Monte Carlo approach: we calculate the impacts 1000 times, each time of which we randomly pick the transformations or variables that entail uncertainty from the respective distributions.
Unless stated otherwise, we indicate the median estimates of the Monte Carlo simulations for specific RCP scenarios and time horizons. These represent statistical numbers based on climate model data, even for 2020 (the baseline), and do not represent the observed number of heat-related deaths. We represent the baseline by the RCP8.5 scenario in 2020 as we are currently following this emission trajectory. It is furthermore important to note that the results refer to the average yearly impact.
3.1 Mortality
For today's baseline, we obtain 658 heat-related deaths per year in Switzerland (see Fig. 4); 64 % thereof or 421 deaths occur in the category of people older than 75 years, albeit they only represent 10 % of the total population. Under the RCP2.6 scenario, the number of deaths peaks in 2050 with 695 yearly heat-related deaths. According to this scenario the increase in temperature in Switzerland stops around the middle of the century. For the RCP4.5 scenario, we find 814 yearly deaths in 2050 and 854 in 2080. For the RCP8.5 scenario, the number of deaths caused by heat increases to 934 per year in 2050, exceeding 1500 in 2080. Uncertainties are large; for example for the RCP8.5 in 2050 the upper bound (95th percentile) is 1883 deaths, close to 2 times the median value – yet the lower bound (5th percentile) is 241 deaths as the uncertainty is not normally distributed, as shown in Fig. 4. Detailed maps showing the spatial distribution of the impact for 2050 can be found in Sect. S10.

Figure 4Median of the number of heat-related deaths calculated in the Monte Carlo simulation for the baseline (2020, RCP8.5) and the years 2035, 2050, 2065, and 2080 under the three RCP scenarios. The uncertainty estimate corresponds to the 90 % confidence interval.
3.2 Labour productivity
With regard to the impact on labour productivity, the median estimate of labour productivity losses in Switzerland for today's baseline amounts to CHF 665 million per year (approx. USD 700 million; see Fig. 5). In 2050, the total labour productivity loss increases by only 8 % in the case of the RCP2.6 scenario but by 65 % compared to today, reaching CHF 1.1 billion per year, for the RCP8.5 scenario. The median cost for this case corresponds to about 0.24 % of the total yearly exposed salary value: 0.21 % for the low physical activity and 0.54 % for the high physical activity categories. For all years and scenarios, between 45 % and 50 % of the losses are experienced by the low physical activity exposure type as this category actually represents 67 % of the total exposure value since most workers belong to this category and their salary is higher on average. The high physical activity type represents 22 % to 29 % of the losses, which means that a much higher percentage is affected, considering that only 10 % of workers belong to this category. The uncertainties are larger than the mortality model due to the estimations of the hourly WBGT, as shown in Fig. 5. For example in 2050 for the RCP8.5 the 95th percentile is CHF 4 billion per year, which is almost 4 times higher than the median estimate (CHF 1.1 billion).
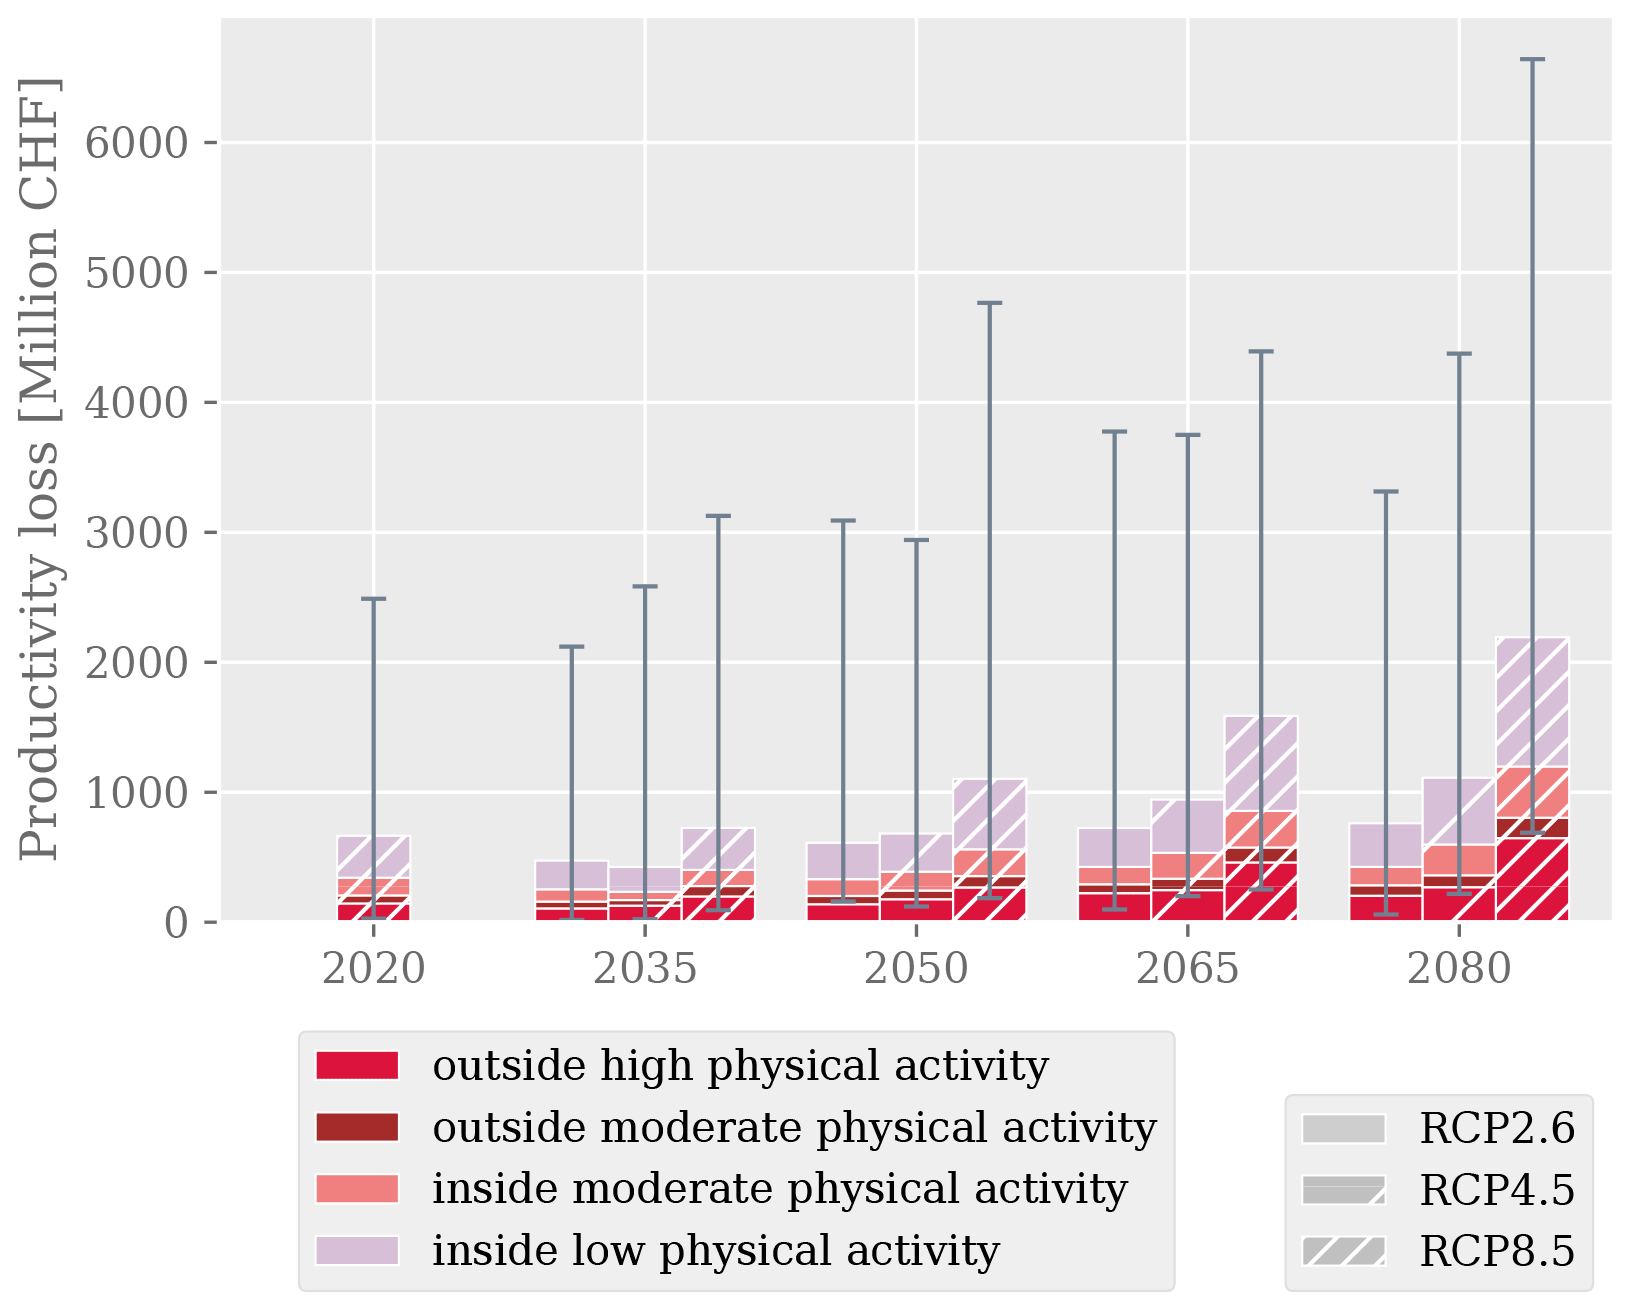
Figure 5Median of the labour productivity losses calculated in the Monte Carlo simulation for the baseline (2020, RCP8.5) and the years 2035, 2050, 2065, and 2080 under the three RCP scenarios. The uncertainty estimate corresponds to the 90 % confidence interval.
Spatially explicit results for labour productivity losses of the high physical activity exposures type for the year 2050 and under the RCP8.5 scenario are shown in Fig. 6. The southern cantons (Ticino, Valais, and Geneva) are most impacted, as well as the area of Basel. Detailed results at cantonal level can be found in Sect. S13. The relative increase in impact between the baseline and 2050 for the RCP2.6 and the RCP8.5 scenarios is illustrated in Fig. 7. The relative changes in 2050 compared to the baseline are very apparent under the RCP8.5 scenario, while they are more moderate for the RCP2.6 scenario. The valleys and mountainous areas experience the highest relative changes. This is because these high-altitude regions currently rarely experience any days above the temperature threshold at which impacts may occur, while these become more common throughout the century.
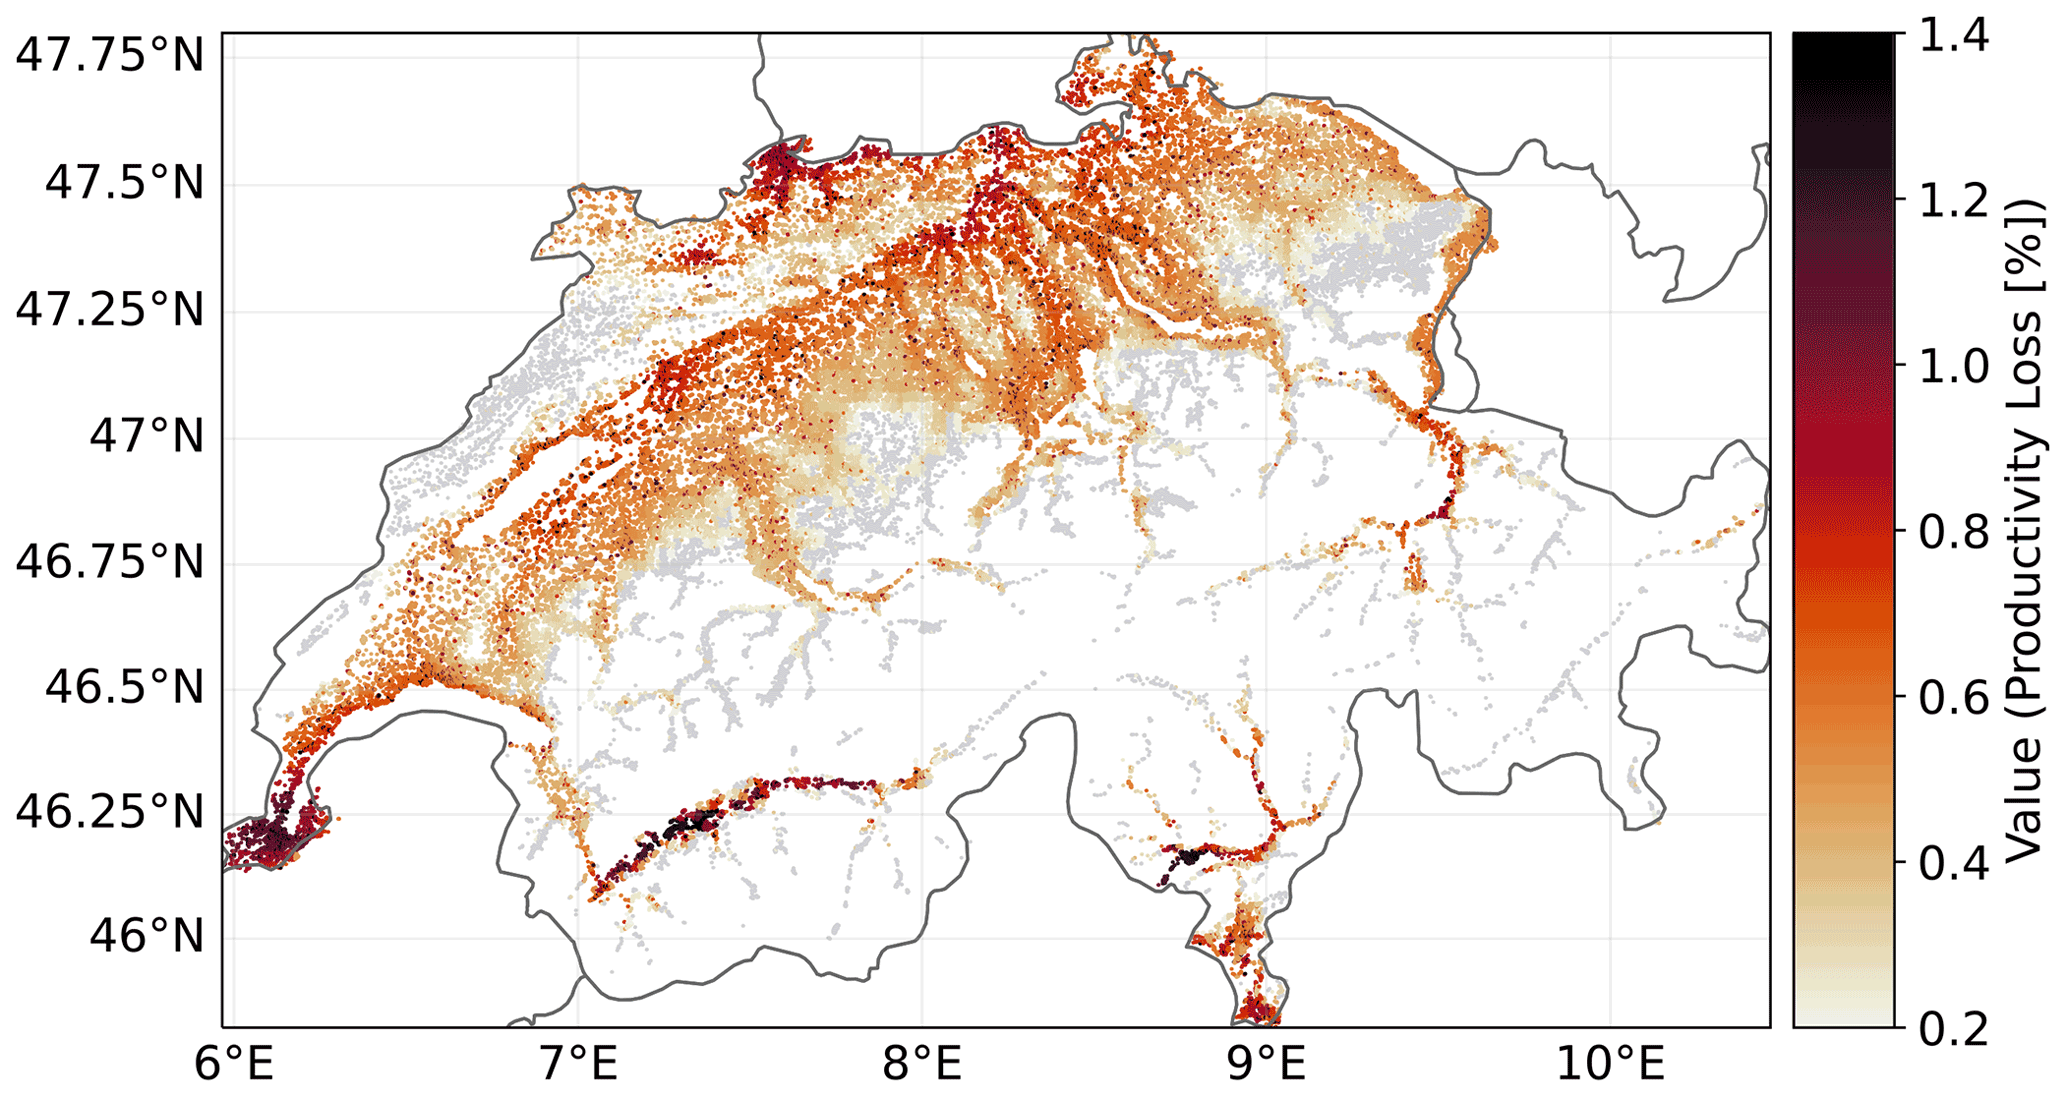
Figure 6Map showing the spatial impact for labour productivity in percentage compared to the total exposure value for the year 2050, the RCP8.5 scenario, and the category high physical activity.
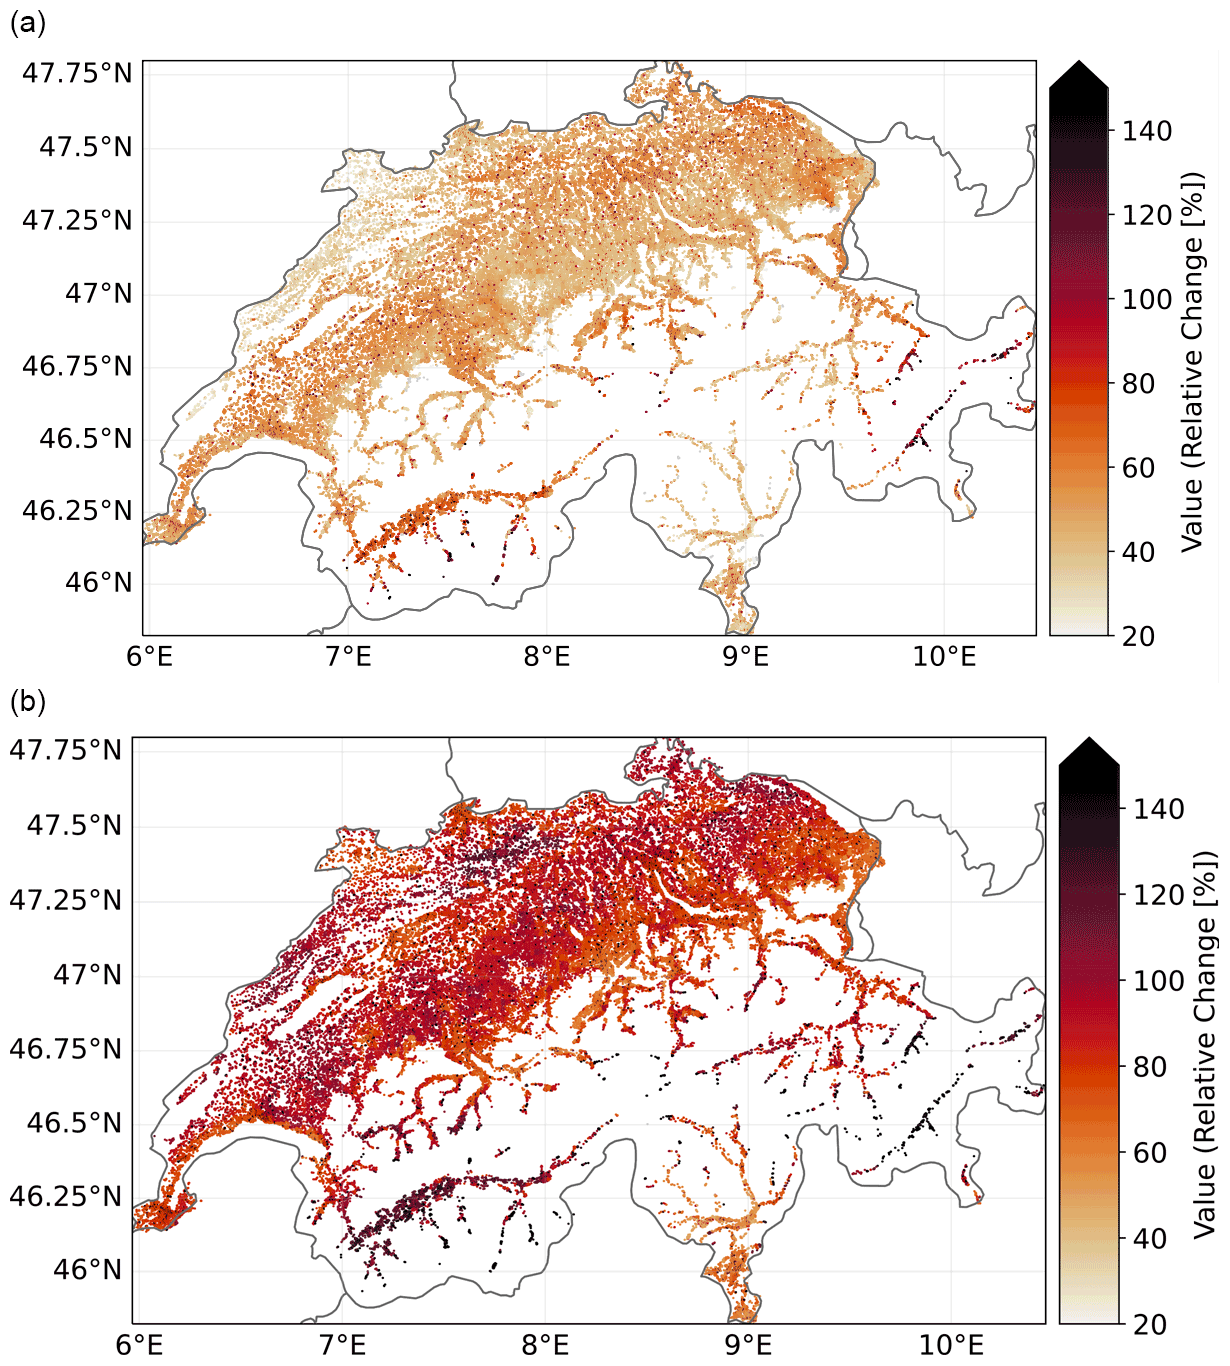
Figure 7Maps showing the relative increase in the loss of labour productivity due to heat compared to the baseline for the year 2050 under the RCP2.6 (a) and the RCP8.5 (b) scenarios for the high physical activity category.
Our results show that heat is associated with the death of about 658 people in Switzerland and causes losses in labour productivity of CHF 665 million in an average year in today's climate.
This compares well with a study which estimates for summer 2019 a heat-related excess mortality of 521 people (Ragettli and Röösli, 2020). For the hottest recorded summers in Switzerland in 2003 and 2015, a previous study found 975 and 804 excess deaths, respectively (Vicedo-Cabrera et al., 2016). These values refer to extreme years, and it is therefore expected that they would be higher than our median estimate. But these are included in the uncertainty range of our results for the present situation. However, the authors of this study only looked at summer months, while our model also takes into account heat days occurring in the spring for example. Other authors have projected a similar increase in mortality under climate change in central Europe; for example Huber et al. (2020) project an average change factor of 2.8 in mortality due to heat under a global 3∘ increase in temperature for Germany, which is equivalent to an RCP8.5 scenario in 2080, for which we estimate a change factor of about 2.3. Gasparrini et al. (2017) project a 4.3-fold increase in 2090–2099 compared to 2000–2010 under an RCP8.5 scenario and a 2.4-fold increase under an RCP6.0 scenario, which is close to the increase in impact that we estimate for 2080.
For labour productivity, no estimations exist for past events in Switzerland. With the use of climate data, Kjellstrom et al. (2009a) predicted a total labour productivity loss of 0.1 % on average over central Europe in the 2050s considering a high-emission scenario. This number is very close to our estimation for Switzerland (0.17 %). It is however important to note that they did consider changes in labour patterns, which is not the case in our work.
In 2080, the difference in heat impacts under an RCP8.5 scenario versus the RCP2.6 scenario is, according to our model, 823 (+117 %) additional heat-related deaths per year and an increase of CHF 1381 million (+170 %) for labour productivity losses.
4.1 Uncertainties
The uncertainties are skewed towards higher values (see Figs. 4 and 5, as well as Sect. S9 for the sensitivity analysis). The climate projections used in the model (NCCS, 2018) are the largest source of uncertainty, stemming from natural variability and the differences between the climate simulations. For labour productivity, a large source of uncertainty arises from the transformation to retrieve indoor temperature values and WBGT values. Having more detailed information on the different types of buildings and being able to model them more precisely would therefore be a first key step in reducing the uncertainty. In addition, the availability of high-resolution data for more indicators to directly compute WBGT values would also greatly increase the accuracy of the model. Finally, the modelling of the vulnerability (impact functions) appears to make a smaller contribution to the overall uncertainty.
4.2 Limitations
A number of limitations exist in our modelling approach. The influence of heat waves, consisting of the cumulative physiological strain of consecutive hot days and the lack of rest due to hot night temperatures, is not considered. Also, the CH2018 climate data do not account for the urban heat island effect (Oke, 1982); hence temperatures and consequently impacts in the most densely populated areas are underestimated. Furthermore, our projections account only for the risk due to climate change and ignore demographic changes and potential effects of future adaptations of society to a warmer climate (Ragettli and Röösli, 2020; Martinez et al., 2019). Including these factors is an important next step to be built on the developed framework in order to fully assess the future risk. We also use one RR estimate for the whole country in the modelling of heat-related mortality, while these can vary a lot between cities. Validations of our results are warranted using more recent and area-specific RRs. As for labour productivity, the impact functions are based on global studies, and the response of workers is likely different in Switzerland. We furthermore only consider a loss in labour productivity during working hours and do not consider a reduction in labour supply due to heat, which could result in a higher loss as has been shown in other studies (Dasgupta et al., 2021). Finally, we have estimated the physical activity of the workers based on the sector that they work in, but more precise information on the type of work that workers perform would be valuable to better understand their physical activity.
4.3 Policy implications
To better understand the implications of the results, these can be put in perspective with other public health issues. For example the flu provides us with an interesting comparison as it both has an economic impact on the labour force and is responsible for a number of deaths in the population. Between 2015 and 2018, influenza caused around 600 to 700 deaths per year in Switzerland, being responsible for about CHF 100 million in direct annual healthcare costs (BAG, 2018). Additionally, the indirect economic costs due to absences from work are estimated to amount to CHF 200 million (BAG, 2018). Hence, already today the economic costs of heat and the number of heat-related deaths are comparable to or even higher than those caused by flu.
The results regarding labour productivity costs and their increasing trend help us to better understand local benefits of (global) climate mitigation progress for the Swiss economy. Our results on mortality, furthermore, indicate an increasing health burden for the Swiss population. Hence, the results of this study are valuable information for political discussions on the commensurability of additional investment costs for decarbonization in Switzerland, allow a better understanding of the cost of inaction, and highlight the need for adaptation (Bresch and Aznar-Siguan, 2021).
In addition, the obtained high-resolution maps derived by the spatially explicit modelling approach are useful to identify areas that are and will be particularly affected by heat events. This reveals that, although some areas are and will remain more impacted by heat on an absolute level (for example Ticino and Geneva), the relative increase due to climate change is more important for other regions (e.g. in mountainous areas). These areas may be less prepared to face high heat stress since they have never experienced it in the past.
In this work, we use the IPCC risk framework (IPCC, 2014) to model the impacts of heat on mortality and labour productivity in Switzerland under the changing climate, keeping socio-economic factors constant. We model the different impact categories in the same spatially explicit framework, and we conduct a Monte Carlo simulation in order to quantify uncertainties. We find that the monetary costs of heat and the effects on mortality are substantial already today. The magnitude of these impacts may double (for mortality) or even triple (for labour productivity) by the end of the century should we remain on the current high-greenhouse-gas emissions pathway (RCP8.5). Even though uncertainties in the model are substantial, the underlying trend in impacts remains unequivocal. Future work could easily implement scenarios of dynamically changing exposure and spatially varying vulnerability once they become available. The model could furthermore be used to analyse adaptation measures and their effectiveness (Bresch and Aznar-Siguan, 2021).
The code and link to the input data that support the findings of this study are openly available at https://doi.org/10.5281/zenodo.6908285 (Stalhandske and Nesa, 2022a) and https://github.com/zeliest/heat_mortality_productivity_impacts (last access: August 2022). The median estimate of the impact for each category, each time step, and each climate scenario is additionally available at https://doi.org/10.3929/ethz-b-000556636 (Stalhandske and Nesa, 2022b).
The supplement related to this article is available online at: https://doi.org/10.5194/nhess-22-2531-2022-supplement.
All authors contributed to the study design and to the manuscript. All authors read and approved the final manuscript. ZS and VN contributed equally as first authors, developing the model and writing the first draft of the manuscript. MZ and DNB contributed to the general design of the study and the manuscript. MSR and MR contributed to the modelling of heat-related mortality and to the related parts of the manuscript. AG provided the methodology to model the temperature in buildings and wrote the corresponding section in the manuscript. NH was responsible for the policy applications of the model and contributed to the discussion section in the manuscript.
The contact author has declared that none of the authors has any competing interests.
Publisher’s note: Copernicus Publications remains neutral with regard to jurisdictional claims in published maps and institutional affiliations.
We thank Samuel Lüthi for his valuable feedback and Christopher Fairless for the language revision, as well as the entire Weather and Climate Risks Group at ETHZ for the interest shown in our project and the provided support.
This research has been supported by the Schweizerischer Nationalfonds zur Förderung der Wissenschaftlichen Forschung (National Research Programme 75 Big Data, project number 167215).
This paper was edited by Vassiliki Kotroni and reviewed by Veronika Huber and one anonymous referee.
Alexander, L. V., Zhang, X., Peterson, T. C., Caesar, J., Gleason, B., Tank, A. M. K., Haylock, M., Collins, D., Trewin, B., Rahimzadeh, F., Tagipour, A., Kumar, K. R., Revadekar, J., Griffiths, G., Vincent, L., Stephenson, D. B., Burn, J., Aguilar, E., Brunet, M., Taylor, M., New, M., Zhai, P., Rusticucci, M., and Vazquez-Aguirre, J. L.: Global observed changes in daily climate extremes of temperature and precipitation, J. Geophys. Res.-Atmos., 111, D05109, https://doi.org/10.1029/2005JD006290, 2006. a
Aznar-Siguan, G. and Bresch, D. N.: CLIMADA v1: a global weather and climate risk assessment platform, Geosci. Model Dev., 12, 3085–3097, https://doi.org/10.5194/gmd-12-3085-2019, 2019. a, b, c
BAG: Nationale Strategie zur Prävention der saisonalen Grippe (GRIPS) 2015–2018, Tech. rep., Bundesamt für Gesundheit, https://www.bag.admin.ch/dam/bag/de/dokumente/mt/i-und-i/grips/strategie-grips.pdf.download.pdf/Strategie GRIPS.pdf (last access: July 2022), 2018. a, b
BFS: Statistik der Unternehmensstruktur (STATENT), Beschäftigte und Arbeitsstätten: Geodaten, https://www.bfs.admin.ch/bfs/de/home/dienstleistungen/geostat/geodaten-bundesstatistik/arbeitsstaetten-beschaeftigung/statistik-unternehmensstruktur-statent-ab-2011.assetdetail.9526894.html (last access: December 2020), 2017. a
BFS: Statistik der Bevölkerung und Haushalte (STATPOP), Geodaten 2018, https://www.bfs.admin.ch/bfs/de/home/dienstleistungen/geostat/geodaten-bundesstatistik/gebaeude-wohnungen-haushalte-personen/bevoelkerung-haushalte-ab-2010.assetdetail.9947069.html (last access: December 2020), 2018. a
BFS: Swiss Earnings Structure Survey in 2018: initial findings, https://www.bfs.admin.ch/bfs/en/home/statistics/work-income/wages-income-employment-labour-costs.gnpdetail.2019-0502.html (last access: December 2020), 2020a. a
BFS: Deaths per week by 5-year age group, sex and major region, 2000–2019, https://www.bfs.admin.ch/bfs/en/home/statistics/population/births-deaths/deaths.assetdetail.13187304.html (last access: December 2020), 2020b. a
Bresch, D. N. and Aznar-Siguan, G.: CLIMADA v1.4.1: towards a globally consistent adaptation options appraisal tool, Geosci. Model Dev., 14, 351–363, https://doi.org/10.5194/gmd-14-351-2021, 2021. a, b
Carleton, T. A. and Hsiang, S. M.: Social and economic impacts of climate, Science, 353, aad9837, https://doi.org/10.1126/science.aad9837, 2016. a, b
Casanueva, A., Kotlarski, S., Fischer, A. M., Flouris, A. D., Kjellstrom, T., Lemke, B., Nybo, L., Schwierz, C., and Liniger, M. A.: Escalating environmental summer heat exposure – a future threat for the European workforce, Reg. Environ. Change, 20, 40, https://doi.org/10.1007/s10113-020-01625-6, 2020. a
Coumou, D., Robinson, A., and Rahmstorf, S.: Global increase in record-breaking monthly-mean temperatures, Climatic Change, 118, 771–782, https://doi.org/10.1007/s10584-012-0668-1, 2013. a
Dasgupta, S., van Maanen, N., Gosling, S. N., Piontek, F., Otto, C., and Schleussner, C.-F.: Effects of climate change on combined labour productivity and supply: an empirical, multi-model study, The Lancet Planetary Health, 5, e455–e465, https://doi.org/10.1016/S2542-5196(21)00170-4, 2021. a, b, c
Della-Marta, P. M., Haylock, M. R., Luterbacher, J., and Wanner, H.: The role of increasing temperature variability, J. Geophys. Res.-Atmos., 112, D15103, https://doi.org/10.1029/2007JD008510, 2007. a
Donat, M. G., Alexander, L. V., Yang, H., Durre, I., Vose, R., Dunn, R. J., Willett, K. M., Aguilar, E., Brunet, M., Caesar, J., Hewitson, B., Jack, C., Tank, A. M. K., Kruger, A. C., Marengo, J., Peterson, T. C., Renom, M., Rojas, C. O., Rusticucci, M., Salinger, J., Elrayah, A. S., Sekele, S. S., Srivastava, A. K., Trewin, B., Villarroel, C., Vincent, L. A., Zhai, P., Zhang, X., and Kitching, S.: Updated analyses of temperature and precipitation extreme indices since the beginning of the twentieth century: The HadEX2 dataset, J. Geophys. Res.-Atmos., 118, 2098–2118, https://doi.org/10.1002/jgrd.50150, 2013. a
Dunne, J. P., Stouffer, R. J., and John, J. G.: Reductions in labour capacity from heat stress under climate warming, Nat. Clim. Change, 3, 563–566, https://doi.org/10.1038/nclimate1827, 2013. a
Fischer, E. M. and Knutti, R.: Detection of spatially aggregated changes in temperature and precipitation extremes, Geophys. Res. Lett., 41, 547–554, https://doi.org/10.1002/2013GL058499, 2014. a
Fischer, E. M. and Schär, C.: Future changes in daily summer temperature variability: Driving processes and role for temperature extremes, Clim. Dynam., 33, 917, https://doi.org/10.1007/s00382-008-0473-8, 2009. a
Fischer, E. M. and Schär, C.: Consistent geographical patterns of changes in high-impact European heatwaves, Nat. Geosci., 3, 398, https://doi.org/10.1038/ngeo866, 2010. a
Gasparrini, A., Guo, Y., Sera, F., Vicedo-Cabrera, A. M., Huber, V., Tong, S., de Sousa Zanotti Stagliorio Coelho, M., Saldiva, P. H. N., Lavigne, E., Correa, P. M., Ortega, N. V., Kan, H., Osorio, S., Kyselý, J., Urban, A., Jaakkola, J. J., Ryti, N. R., Pascal, M., Goodman, P. G., Zeka, A., Michelozzi, P., Scortichini, M., Hashizume, M., Honda, Y., Hurtado-Diaz, M., Cruz, J. C., Seposo, X., Kim, H., Tobias, A., Iñiguez, C., Forsberg, B., Åström, D. O., Ragettli, M. S., Guo, Y. L., fu Wu, C., Zanobetti, A., Schwartz, J., Bell, M. L., Dang, T. N., Van, D. D., Heaviside, C., Vardoulakis, S., Hajat, S., Haines, A., and Armstrong, B.: Projections of temperature-related excess mortality under climate change scenarios, The Lancet Planetary Health, 1, e360-e367, https://doi.org/10.1016/S2542-5196(17)30156-0, 2017. a, b
Haines, A., Kovats, R., Campbell-Lendrum, D., and Corvalan, C.: Climate change and human health: impacts, vulnerability, and mitigation, Lancet, 367, 2101–2109, https://doi.org/10.1016/S0140-6736(06)68933-2, 2006. a
Hancock, P. A., Ross, J. M., and Szalma, J. L.: A meta-analysis of performance response under thermal stressors, Human Factors, 49, 851–877, https://doi.org/10.1518/001872007X230226, 2007. a
Huber, V., Krummenauer, L., Peña-Ortiz, C., Lange, S., Gasparrini, A., Vicedo-Cabrera, A. M., Garcia-Herrera, R., and Frieler, K.: Temperature-related excess mortality in German cities at 2 °C and higher degrees of global warming, Environ. Res., 186, 109447, https://doi.org/10.1016/j.envres.2020.109447, 2020. a, b
IPCC: IPCC, 2013: Climate Change 2013: The Physical Science Basis. Contribution of Working Group I to the Fifth Assessment Report of the Intergovernmental Panel on Climate Change, Tech. rep., 2013. a
IPCC: Climate change 2014 impacts, adaptation and vulnerability: Part A: Global and sectoral aspects: Working group II contribution to the fifth assessment report of the intergovernmental panel on climate change, https://doi.org/10.1017/CBO9781107415379, 2014. a, b
ISO: Hot environments-{Estimation} of heat stress on working man, based on the {WBGT}-index (wet bulb globe temperature), Geneva: International Standards Organization, 1989. a
Kjellstrom, T., Gabrysch, S., Lemke, B., and Dear, K.: The 'hothaps' programme for assessing climate change impacts on occupational health and productivity: An invitation to carry out field studies, Global Health Action, 2, 2082, https://doi.org/10.3402/gha.v2i0.2082, 2009a. a, b, c
Kjellstrom, T., Holmer, I., and Lemke, B.: Workplace heat stress, health and productivity-an increasing challenge for low and middle-income countries during climate change, Global Health Action, 2, 2082, https://doi.org/10.3402/gha.v2i0.2047, 2009b. a
Kjellstrom, T., Kovats, R. S., Lloyd, S. J., Holt, T., and Tol, R. S.: The direct impact of climate change on regional labor productivity, Archives of Environmental and Occupational Health, 64, 217–227, https://doi.org/10.1080/19338240903352776, 2009c. a, b
Kjellstrom, T., Otto, M., Lemke, B., Hyatt, O., Briggs, D., Freyberg, C., Lines, L., and Kjellstrom, T.: Climate change and labour: Impacts of heat in the workplace, Tech. rep., https://www.ilo.org/wcmsp5/groups/public/---ed_emp/---gjp/documents/publication/wcms_476194.pdf (last access: July 2020), 2016. a
Kjellstrom, T., Freyberg, C., Lemke, B., Otto, M., and Briggs, D.: Estimating population heat exposure and impacts on working people in conjunction with climate change, Int. J. Biometeorol., 62, 291–306, https://doi.org/10.1007/s00484-017-1407-0, 2018. a, b, c, d, e
Lay, C. R., Sarofim, M. C., Vodonos Zilberg, A., Mills, D. M., Jones, R. W., Schwartz, J., and Kinney, P. L.: City-level vulnerability to temperature-related mortality in the USA and future projections: a geographically clustered meta-regression, The Lancet Planetary Health, 5, e338–e346, https://doi.org/10.1016/S2542-5196(21)00058-9, 2021. a
Martinez, G. S., Linares, C., Ayuso, A., Kendrovski, V., Boeckmann, M., and Diaz, J.: Heat-health action plans in Europe: Challenges ahead and how to tackle them, Environ. Res., 176, 108548, https://doi.org/10.1016/j.envres.2019.108548, 2019. a
Martínez-Solanas, È., Quijal-Zamorano, M., Achebak, H., Petrova, D., Robine, J.-M., Herrmann, F. R., Rodó, X., and Ballester, J.: Projections of temperature-attributable mortality in Europe: a time series analysis of 147 contiguous regions in 16 countries, The Lancet Planetary Health, 5, e446–e454, 2021. a
MeteoSwiss: Climate scenarios indoor climate, https://www.meteoswiss.admin.ch/home/climate/swiss-climate-in-detail/climate-scenarios-indoor-climate.html (last access: July 2022), 2022. a
Mora, C., Dousset, B., Caldwell, I. R., Powell, F. E., Geronimo, R. C., Bielecki, C. R., Counsell, C. W., Dietrich, B. S., Johnston, E. T., Louis, L. V., Lucas, M. P., Mckenzie, M. M., Shea, A. G., Tseng, H., Giambelluca, T. W., Leon, L. R., Hawkins, E., and Trauernicht, C.: Global risk of deadly heat, Nat. Clim. Change, 7, 501–506, https://doi.org/10.1038/nclimate3322, 2017. a
Morabito, M., Crisci, A., Messeri, A., Messeri, G., Betti, G., Orlandini, S., Raschi, A., and Maracchi, G.: Increasing heatwave hazards in the southeastern European Union capitals, Atmosphere, 8, 115, https://doi.org/10.3390/atmos8070115, 2017. a
NCCS: CH2018 – Climate Scenarios for Switzerland, Tech. rep., National Centre for Climate Services, Zurich, https://www.nccs.admin.ch/nccs/en/home/climate-change-and-impacts/swiss-climate-change-scenarios/technical-report.html (last access: July 2022), 2018. a, b, c
Oke, T. R.: The energetic basis of the urban heat island, Q. J. Roy. Meteorol. Soc., 108, 1–24, https://doi.org/10.1002/qj.49710845502, 1982. a
Orlov, A., Sillmann, J., Aaheim, A., Aunan, K., and de Bruin, K.: Economic Losses of Heat-Induced Reductions in Outdoor Worker Productivity: a Case Study of Europe, Economics of Disasters and Climate Change, 3, 191–211, https://doi.org/10.1007/s41885-019-00044-0, 2019. a
Park, J.: Hot Temperature, Human Capital and Adaptation to Climate Change, Harvard University Economics Department, https://scholar.harvard.edu/files/jisungpark/files/paper_nyc_aer.pdf (last access: July 2022), 2017. a
Parsons, K.: Human thermal environments: The effects of hot, moderate, andcold environments on human health, comfort, and performance, CRC Press, third edition, https://doi.org/10.1201/b16750, 2014. a
Perez, L. and Künzli, N.: From measures of effects to measures of potential impact, International J. Pub. Health, 54, 45–48, https://doi.org/10.1007/s00038-008-8025-x, 2009. a
Ragettli, M. S. and Röösli, M.: Gesundheitliche Auswirkungen von Hitze in der Schweiz und die Bedeutung von Präventionsmassnahmen, Tech. rep., https://so.ch/fileadmin/internet/ddi/ddi-gesa/pdf/kaed/Umwelt/BT_SwissTPH_2020_Gesundheitliche_Auswirkungen_von_Hitze_2019_Vergleich_2003-2015-2018_d.pdf (last access: July 2022), 2020. a, b
Ragettli, M. S., Vicedo-Cabrera, A. M., Schindler, C., and Röösli, M.: Exploring the association between heat and mortality in Switzerland between 1995 and 2013, Environ. Res., 158, 703–709, https://doi.org/10.1016/j.envres.2017.07.021, 2017. a, b, c, d, e
Roudsari, M. S. and Pak, M.: Ladybug: A parametric environmental plugin for grasshopper to help designers create an environmentally-conscious design, Proceedings of BS 2013: 13th Conference of the International Building Performance Simulation Association, Chambery, France, 26–28 August 2013, 2013. a, b
Sahu, S., Sett, M., and Kjellstrom, T.: Heat exposure, cardiovascular stress and work productivity in rice harvesters in India: Implications for a climate change future, Industrial Health, 51, 424–431, https://doi.org/10.2486/indhealth.2013-0006, 2013. a, b
Schär, C., Vidale, P. L., Lüthi, D., Frei, C., Häberli, C., Liniger, M. A., and Appenzeller, C.: The role of increasing temperature variability in European summer heatwaves, Nature, 427, 332–336, https://doi.org/10.1038/nature02300, 2004. a
Seppänen, O., Fisk, W., and Lei, Q.: Effect of Temperature on Task Performance in Office Environment, Lawrence Berkeley National Laboratory, https://indoor.lbl.gov/publications/effect-temperature-task-performance (last access: July 2022), 2006. a
Shayegh, S., Manoussi, V., and Dasgupta, S.: Climate change and development in South Africa: the impact of rising temperatures on economic productivity and labour availability, Clim. Develop., 13, 1–11, https://doi.org/10.1080/17565529.2020.1857675, 2020. a
Sørland, S. L., Fischer, A. M., Kotlarski, S., Künsch, H. R., Liniger, M. A., Rajczak, J., Schär, C., Spirig, C., Strassmann, K., and Knutti, R.: CH2018 – National climate scenarios for Switzerland: How to construct consistent multi-model projections from ensembles of opportunity, Climate Services, 20, 100196, https://doi.org/10.1016/j.cliser.2020.100196, 2020. a
Stalhandske, Z. and Nesa, V.: zeliest/heat_mortality_productivity_impacts: v1.0.0 (v1.0.0), Zenodo [code], https://doi.org/10.5281/zenodo.6908285, 2022a. a
Stalhandske, Z. and Nesa, V.: Data from “Projected Impact of Heat on Mortality and Labour Productivity under Climate Change in Switzerland”, ETH Zürich [data set], https://doi.org/10.3929/ethz-b-000556636, 2022b. a
Vicedo-Cabrera, A. M., Ragettli, M. S., Schindler, C., and Röösli, M.: Excess mortality during the warm summer of 2015 in Switzerland, Swiss medical weekly, 146, w14379, https://doi.org/10.4414/smw.2016.14379, 2016. a, b, c, d, e
Vicedo-Cabrera, A. M., Scovronick, N., Sera, F., Royé, D., Schneider, R., Tobias, A., Astrom, C., Guo, Y., Honda, Y., Hondula, D. M., Abrutzky, R., Tong, S., Coelho, M. d. S. Z. S., Saldiva, P. H. N., Lavigne, E., Correa, P. M., Ortega, N. V., Kan, H., Osorio, S., Kyselý, J., Urban, A., Orru, H., Indermitte, E., Jaakkola, J. J. K., Ryti, N., Pascal, M., Schneider, A., Katsouyanni, K., Samoli, E., Mayvaneh, F., Entezari, A., Goodman, P., Zeka, A., Michelozzi, P., de’Donato, F., Hashizume, M., Alahmad, B., Diaz, M. H., Valencia, C. D. L. C., Overcenco, A., Houthuijs, D., Ameling, C., Rao, S., Di Ruscio, F., Carrasco-Escobar, G., Seposo, X., Silva, S., Madureira, J., Holobaca, I. H., Fratianni, S., Acquaotta, F., Kim, H., Lee, W., Iniguez, C., Forsberg, B., Ragettli, M. S., Guo, Y. L. L., Chen, B. Y., Li, S., Armstrong, B., Aleman, A., Zanobetti, A., Schwartz, J., Dang, T. N., Dung, D. V., Gillett, N., Haines, A., Mengel, M., Huber, V., and Gasparrini, A.: The burden of heat-related mortality attributable to recent human-induced climate change, Nat. Clim. Change, 11, 492–500, https://doi.org/10.1038/s41558-021-01058-x, 2021. a
WHO: Heat-health action plans, Tech. rep., World Health Organization, Geneva, https://www.who.int/publications/i/item/9789289071918 (last access: July 2022), 2008. a, b
WHO: Heatwaves and health: guidance on warning-system development, Tech. rep., World Health Organization, Geneva, https://public.wmo.int/en/resources/library/heatwaves-and-health-guidance-warning-system-development (last access: July 2022), 2015. a
Willett, K. M. and Sherwood, S.: Exceedance of heat index thresholds for 15 regions under a warming climate using the wet-bulb globe temperature, Int. J. Climatol., 32, 161–177, https://doi.org/10.1002/joc.2257, 2012. a
Wyndham, C. H.: Adaptation to heat and cold, Environ. Res., 2, 442–469, https://doi.org/10.1016/0013-9351(69)90015-2, 1969. a, b
Zhang, Y. and Shindell, D. T.: Costs from labor losses due to extreme heat in the USA attributable to climate change, Climatic Change, 164, 35, https://doi.org/10.1007/s10584-021-03014-2, 2021. a
Zhao, M., Lee, J. K. W., Kjellstrom, T., and Cai, W.: Assessment of the economic impact of heat-related labor productivity loss: a systematic review, Climatic Change, 167, 22, https://doi.org/10.1007/s10584-021-03160-7, 2021. a
Zhao, Y., Ducharne, A., Sultan, B., Braconnot, P., and Vautard, R.: Estimating heat stress from climate-based indicators: Present-day biases and future spreads in the CMIP5 global climate model ensemble, Environ. Res. Lett., 10, 084013, https://doi.org/10.1088/1748-9326/10/8/084013, 2015. a
Zivin, J. G., Song, Y., Zhang, P., and Tang, Q.: Temperature and High-Stakes Cognitive Performance: Evidence From The National College Entrance Examination in China, SSRN Electronic Journal, NBER Working Paper No. w24821, https://doi.org/10.2139/ssrn.3296057, 2018. a