the Creative Commons Attribution 4.0 License.
the Creative Commons Attribution 4.0 License.
 | 18 Jul 2022
Compound flood impact of water level and rainfall during tropical cyclone periods in a coastal city: the case of Shanghai
Hanqing Xu
Zhan Tian
Laixiang Sun
Qinghua Ye
Elisa Ragno
Jeremy Bricker
Ganquan Mao
Jinkai Tan
Jun Wang
Qian Ke
Shuai Wang
Ralf Toumi
Compound flooding is generated when two or more flood drivers occur simultaneously or in close succession. Multiple drivers can amplify each other and lead to greater impacts than when they occur in isolation. A better understanding of the interdependence between flood drivers would facilitate a more accurate assessment of compound flood risk in coastal regions. This study employed the D-Flow Flexible Mesh model to simulate the historical peak coastal water level, consisting of the storm surge, astronomical tide, and relative sea level rise (RSLR), in Shanghai over the period 1961–2018. It then applies a copula-based methodology to calculate the joint probability of peak water level and rainfall during historical tropical cyclones (TCs) and to calculate the marginal contribution of each driver. The results indicate that the astronomical tide is the leading driver of peak water level, followed by the contribution of the storm surge. In the longer term, the RSLR has significantly amplified the peak water level. This study investigates the dependency of compound flood events in Shanghai on multiple drivers, which helps us to better understand compound floods and provides scientific references for flood risk management and for further studies. The framework developed in this study could be applied to other coastal cities that face the same constraint of unavailable water level records.
- Article
(3517 KB) - Full-text XML
-
Supplement
(438 KB) - BibTeX
- EndNote


Compound flooding is generated when two or more flood drivers, e.g. water level, rainfall, and high river discharges, occur simultaneously or in close succession. Such flood drivers can amplify each other and lead to greater impacts than when they occur in isolation (Leonard et al., 2014; Zscheischler et al., 2018; Visser-Quinn et al., 2019; Chao et al., 2021). Coastal cities such as Shanghai are particularly prone to compound flooding associated with tropical cyclones (TCs), which often bring heavy rainfall and storm surges. For a more accurate assessment of compound flooding in coastal regions, a thorough understanding of the interdependence between multiple flood drivers is necessary. In other words, an enriched knowledge about the dynamic interactions between flood drivers would significantly improve the quantification of compound flooding risks in estuarine environments (Feng and Beighley, 2020). As such, the joint probability theory has been incorporated into the analysis of compound flood risk to take advantage of Sklar's theorem (Sklar, 1959). According to Sklar's theorem, any multivariate joint cumulative distribution function can be expressed in terms of univariate marginal distribution functions and a copula that describes the structure of dependency between the variables (Couasnon et al., 2018; Bevacqua et al., 2019).
Coastal regions are usually the most densely populated and economically developed areas of a country, and they are also the most vulnerable regions to the risk of compound flooding from heavy rainfall and extreme storm surges due to this large population and high property density (Neumann et al., 2015; Hu et al., 2019). Shanghai is the largest and most developed coastal megacity in China. Rainstorms and storm surges caused by typhoons from June to October often cause substantial losses (Li et al., 2018). For example, extreme storm flooding caused nearly 30 thousand casualties in 1905 (Li et al., 2019). In 1962, storm flooding inundated half of the downtown region for nearly 10 d due to 46 failures along the floodwalls of the Huangpu River and its branches and led to huge losses (one-sixth) of the local gross domestic product (GDP) in Shanghai (Ke, 2014). In 1997, Typhoon Winnie killed seven people and flooded more than 5000 households due to the extreme storm surge and rainfall (Ke et al., 2021). Although the construction of flood control measures in the past 50 years (especially after Typhoon Winnie in 1997) has effectively reduced the risk of storm surges and rainstorm floods, Typhoon Matsa in 2005 (which caused USD 2.23 billion of damage), Typhoon Fitow in 2013 (USD 10.4 billion of damage), and Typhoon Lekima in 2019 (USD 2.55 billion of damage) also caused significant damage to Shanghai (Du et al., 2020). Given the substantial damage caused by compound flooding, comparing the rainfall and storm surge encounters during typhoon season is urgently necessary in order to understand the driving mechanisms and frequency of compound flooding in Shanghai. However, owing to the unavailability of water level records, there is little research that has been able to estimate the dependency between peak water level and accumulated rainfall during historical TCs.
The copula method is widely used in statistics to model the interdependence between two or more variables (Anandalekshmi et al., 2019; Balistrocchi et al., 2019; Xu et al., 2021). Recent research using the copula model emphasizes the importance of studying the combined effects of rainfall and water level processes in estuaries and coastal regions (Zheng et al., 2013; Wahl et al., 2015; Zellou and Rahali, 2019; Couasnon et al., 2020). For example, Xu et al. (2018) showed the existence of some positive dependences between rainfall and water level in a coastal city on Hainan Island, while the water level poses an additional risk of flooding. Studies by Xu et al (2021) and Xu et al. (2018) confirmed that the copula method is a promising tool for studying multivariate problems in hydrology and coastal engineering. However, when applying the copula-based methods to 3 dimensions, controversies arise, and uncertainties can explode (Bevacqua et al., 2017; Santos et al., 2021). A univariate flood driver cannot provide an accurate evaluation if the underlying drivers are modelled as independent extreme events (Li et al., 2016; Khanal et al., 2019).
A flood induced by a TC is the most frequent natural disaster in the eastern coastal region of China (Zhang et al., 2020). The East Asian typhoon season is characterized by heavy inland rainfall and high storm tides, which are the major driving factors of coastal flood hazards in China. The slowdown in the forward speeds of landfalling TCs in the Northwest Pacific over the period 1949–2015 increased the risk of flooding from water levels and rainfall, even without considering the changes in storm strength (Kossin, 2018). The simultaneous and/or consecutive occurrence, both in time and space, of heavy rainfall and a high tide can lead to compound flooding (Wahl et al., 2015; Bilskie et al., 2021; Liu et al., 2022). Furthermore, the risk posed by the interactions between hydrometeorological events under the conditions of sea level rises and changing tidal regimes is bound to increase in the future (Idier et al., 2020). Despite the increasing threat of compound flooding events along the Chinese coast, owing to the unavailability of water level records during typhoon events, the associated joint probabilities and driving mechanisms have not been explored (Fang et al., 2021). This research intends to fill this important niche.
TCs often produce strong onshore winds and low barometric pressure, which cause extreme storm surges and, at the same time, generate heavy rainfall in the coastal region (Hoque et al., 2018; Sohn et al., 2021). However, the peak water level during a TC is not only the result of the combination of a storm surge and the astronomical tide. Additionally, the combination of the absolute sea level rise (SLR) due to global warming and the land subsidence due to urbanization has caused a relative sea level rise (RSLR) (IPCC, 2021; Jebbad et al., 2022). According to the Regulations of Shanghai Municipality on the Administration of Land Subsidence Prevention and Control, the land subsidence rate was 6.19 mm yr−1 from 1965 to 2001. Since 2001, the land subsidence rate has been controlled to varying degrees by adaptation measures such as recharging aquifers.
This study establishes the joint distribution of peak water level and rainfall during typhoon events in the Shanghai estuary region, with the aims being to better understand the risk of compound flooding and to improve the assessment of the flood-defence design standard for adaptation strategies. Our modelling framework couples a state-of-the-art hydrodynamic model and statistical model. This model coupling enables us to quantify the joint distribution of rainfall and storm surge events during the typhoon season, and also to consider the comparative cases with and without RSLR for Shanghai. The procedure for the modelling framework is as follows. First, the peak water levels, consisting of astronomical tides, storm surges associated with TCs, and the RSLR, in Shanghai over the period 1961–2018 are generated using the D-Flow Flexible Mesh (D-Flow FM) model, after which a compound hazard scenario for deriving design values is chosen. Second, we compare and investigate the peak water levels with and without RSLR, and we select the extreme compound flood events according to the design standard of the joint hazard scenario. Finally, we analyse the contributions of the storm surge, astronomical tide, and RSLR to the peak water level based on the top seven extreme compound flood events over the study period. We provide a framework that could be applied to other coastal cities that face the same constraint of unavailable water level records. The findings from our research could be useful for decision makers when developing coastal flood defence measures in Shanghai and other East Asian coastal cities. This is the major contribution of this research.
2.1 Study area
Shanghai is surrounded by water on three sides, and the Huangpu River and Suzhou River pass through the city (Fig. 1). The total area of Shanghai is 6340.5 km2, and it had a population of 24.87 million in 2020. The annual rainfall is around 1200 mm. June to September are the rainy months. From late August until early September, Shanghai is frequently affected by typhoons and rainstorms (Yin et al., 2021). Storm flooding caused by typhoons is the main natural disaster in Shanghai. Shanghai's flood risk is about USD 63 million yr−1 under an optimistic scenario of a maximum protection level of 1/1000 per year (Hallegatte et al., 2013). Although the construction of flood control measures in the past 50 years has effectively reduced the risk of storm floods, TC Matsa in 2005, TC Fitow in 2013, and TC Lekima in 2019 caused substantial losses in Shanghai. In particular, Typhoon Winnie in 1997 led to direct economic damage of over USD 100 million. During the Typhoon Winnie period, the peak water level at Huangpu Park (in the city centre) rose to 5.72 m, equivalent to the water level with a 500-year return period. During Typhoon Fitow in 2013, the water level at Mishidu in the inland area of the Huangpu River was recorded at WD (Wusong Datum is adopted as the reference) as 4.61 m, which broke the record (Ke et al., 2018). In the context of climate change, relative sea level rises, and urban expansion, Shanghai will face higher compound flood risks and challenges from TCs, storm surges, and extreme rainstorms in the future (Wang et al., 2018).

Figure 1Location map of Shanghai.
2.2 Data
This study systematically collected the geographic and meteorological data for the study area, including TC tracks (1961–2018) and daily accumulated rainfall (1961–2018). Due to the unavailability of measured water level data from historical TCs, in this study we evaluate the dependence coefficient (Spearman's ρ and Kendall's τ) between rainfall and water level based on observed rainfall and simulated peak water levels during TCs. Observations come from a set of rain gauge measurements. The International Best Track Archive for Climate Stewardship (IBTrACS) from NOAA's National Climatic Data Center contains 6 h TC centre longitude and latitude data, minimum central pressure (Pc) data, and sustained maximum surface wind velocity (Vmax) data. Multiple agencies provide TC best tracks in the West Pacific, and we opt to use the best tracks from Hong Kong Observatory (https://www.hko.gov.hk/en/index.html, last access: 16 July 2020). This choice was made because it includes the most complete set of observations from TCs that made landfall in China (Chen et al., 2011). Based on the modelled TC data, we use the D-Flow FM model (Knapp et al., 2010) to simulate water levels during TC periods.
We analysed the historical TCs influencing Shanghai between 1961 and 2018. We first defined a 6∘-latitude square box around Shanghai (Fig. 2). The area covered by the blue box can be regarded as an alert area in terms of a TC causing potential damage in Shanghai. The size of the blue box was designed to be just large enough to include the partial tracks of the top 10 most severe TCs for Shanghai since 1949 (personal communication with Shanghai Climate Centre). We then selected historical TCs lasting for at least 24 h in the blue box. After this best-track pre-processing, 210 TCs for the period of 1961–2018 are selected for this study (Fig. 2). Additionally, we obtain tidal level data (1997) for the Wusongkou tide gauge from the Shanghai Municipal Water Authority, which are used for hydrodynamic model validation.
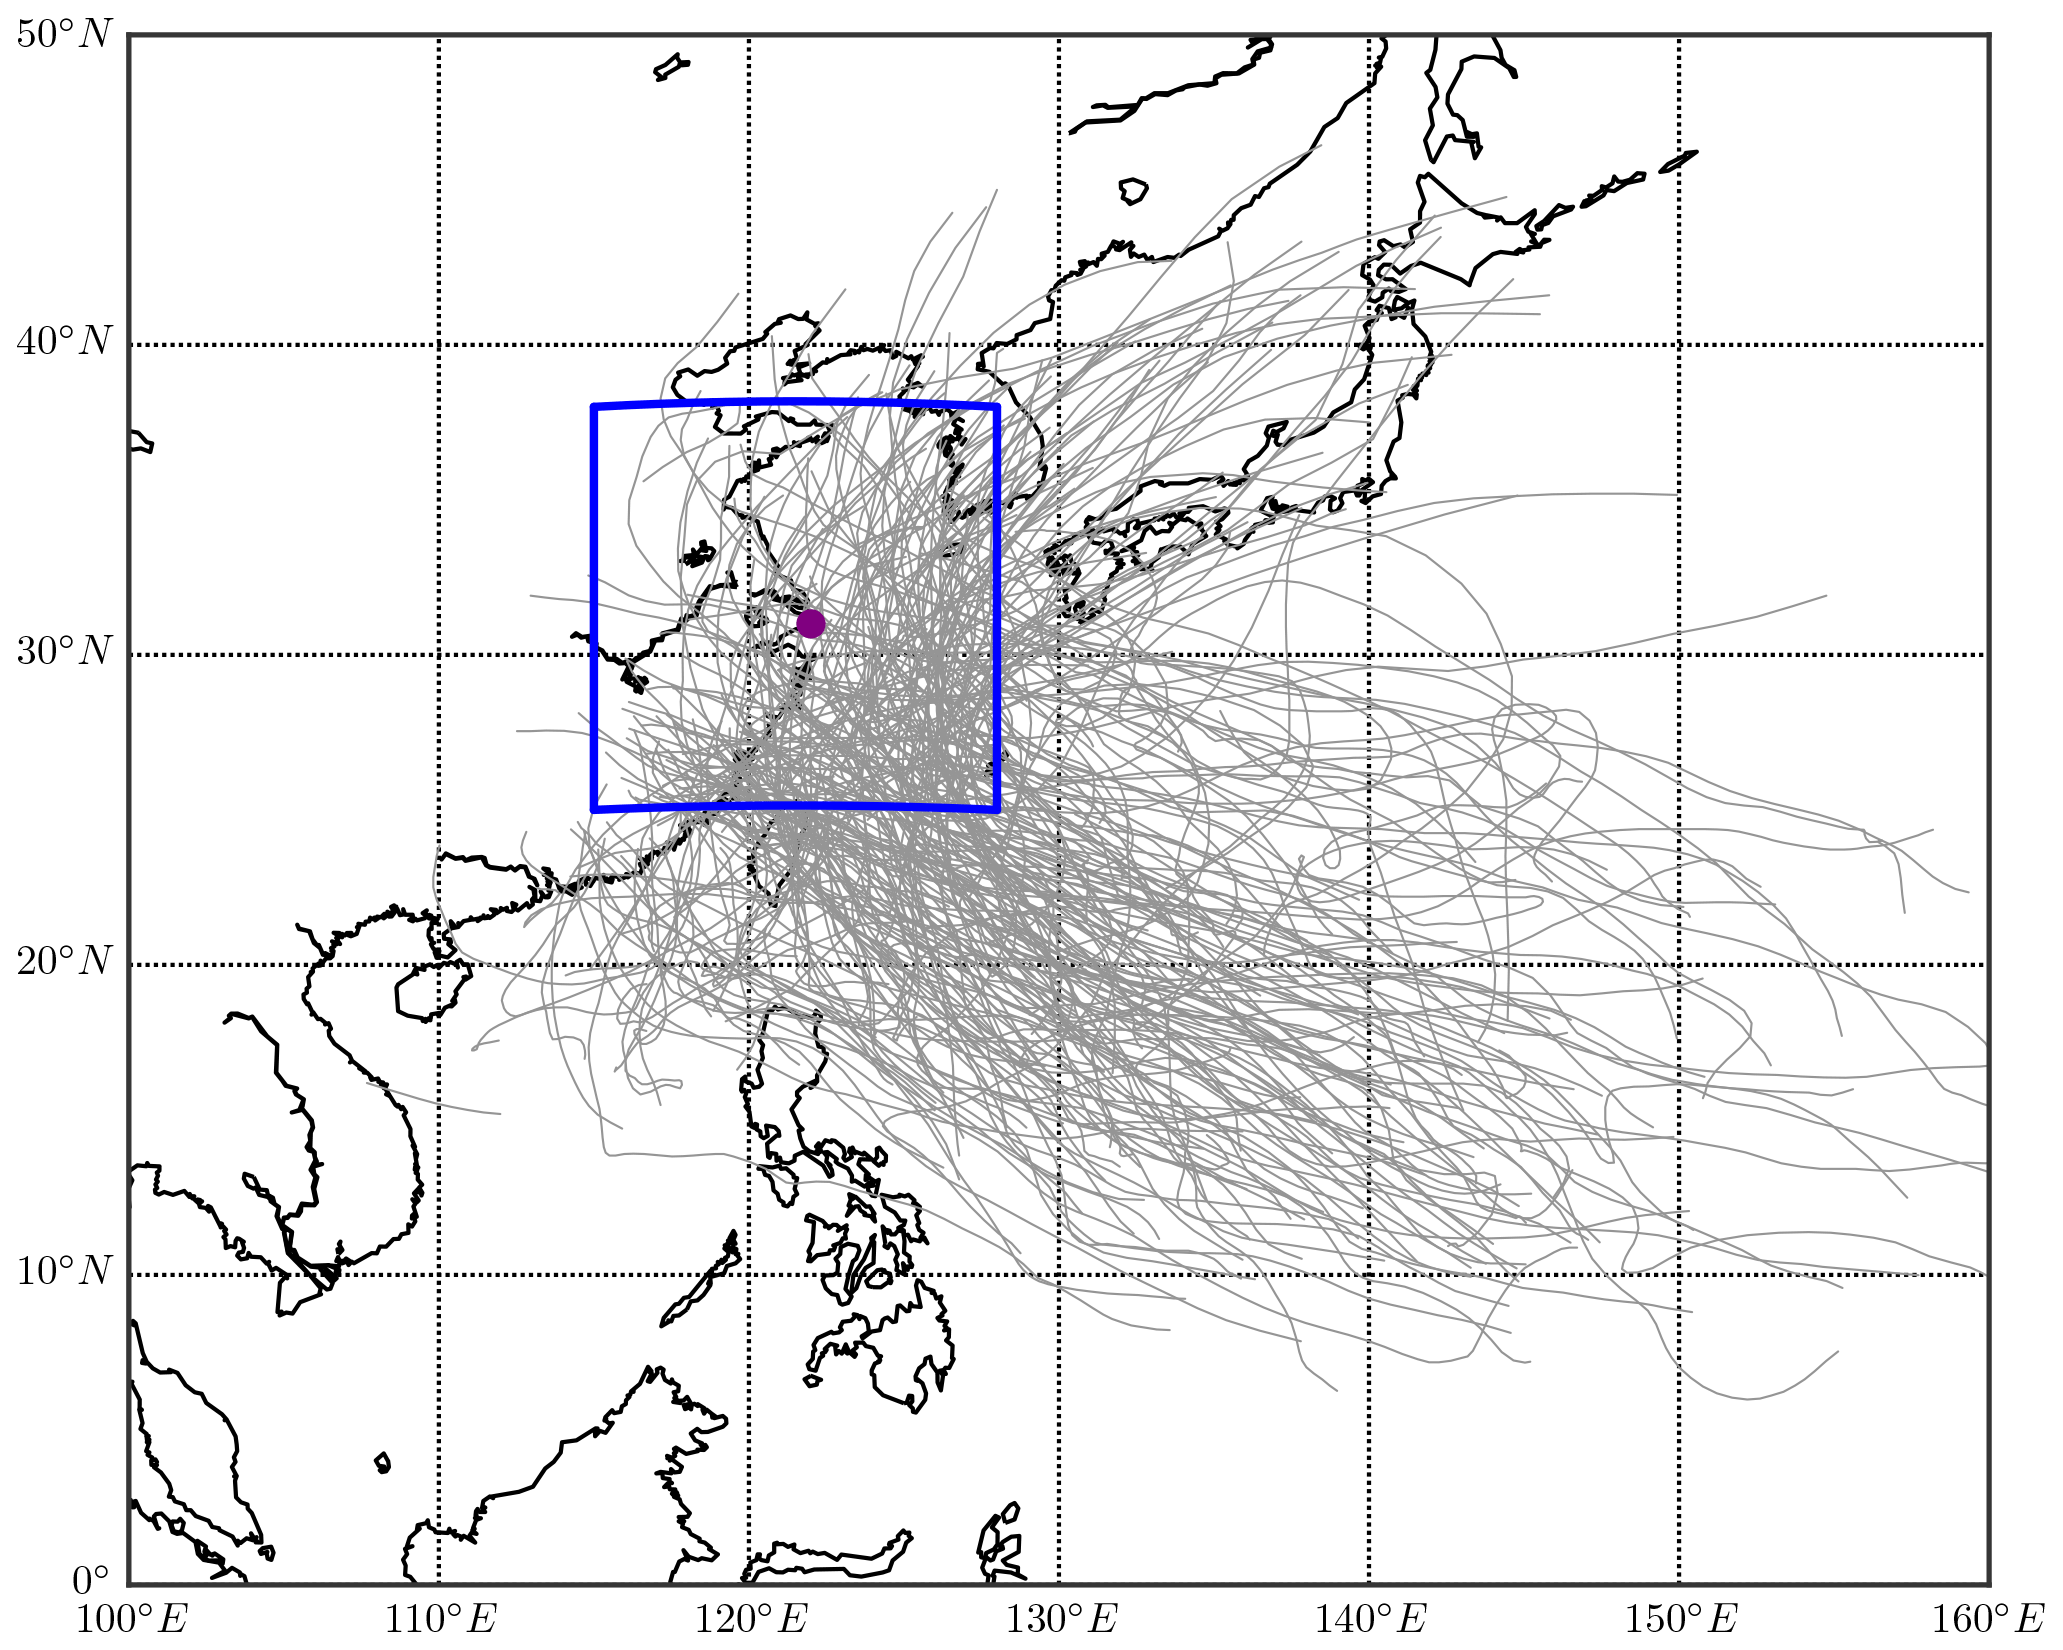
Figure 2Location map for the area of interest. Grey lines indicate major historical typhoon tracks within the region. Blue box indicates the selection criteria.
Daily rainfall records from 1961 to 2018 are collected from the China Meteorological Administration (CMA, http://data.cma.cn/, last access: 16 July 2020) for the Baoshan gauge station, the closest to the Wusongkou surge station (Fig. 1). The annual precipitation in Shanghai is 1200 mm, with the rainiest months being from June through September. Rainfall data are used in this study to approximate the TC-induced runoff. To implicitly account for the rainfall travel time to the catchment outlet, the 1-, 2-, and 3-day accumulated rainfall were also estimated, and the correlation between the accumulated rainfall and the peak water level was then estimated.
According to the Chinese Sea Level Bulletin of 2020, which was compiled by the State Oceanic Administration of China, the absolute sea level rose at a rate of 3.4 mm yr−1. According to the Regulations of Shanghai Municipality on the Administration of Land Subsidence Prevention and Control, the land subsidence rate was 27.93 mm yr−1 from 1921 to 1964. From 1965 to 2001, the land subsidence rate was 6.19 mm yr−1. Since 2001, the land subsidence rate has been controlled to a varying extent by adaptation measures such as recharging aquifers with water, and it is 5–15 mm yr−1 in most regions. We use 10 mm yr−1 as the land subsidence rate from 2001 to 2018. The downside of such an assumption is that it fails to consider possible accelerating factors such as population growth, vertical and horizontal urban expansion, and deep strata motions, but these complex factors are beyond the scope of this research.
2.3 The framework
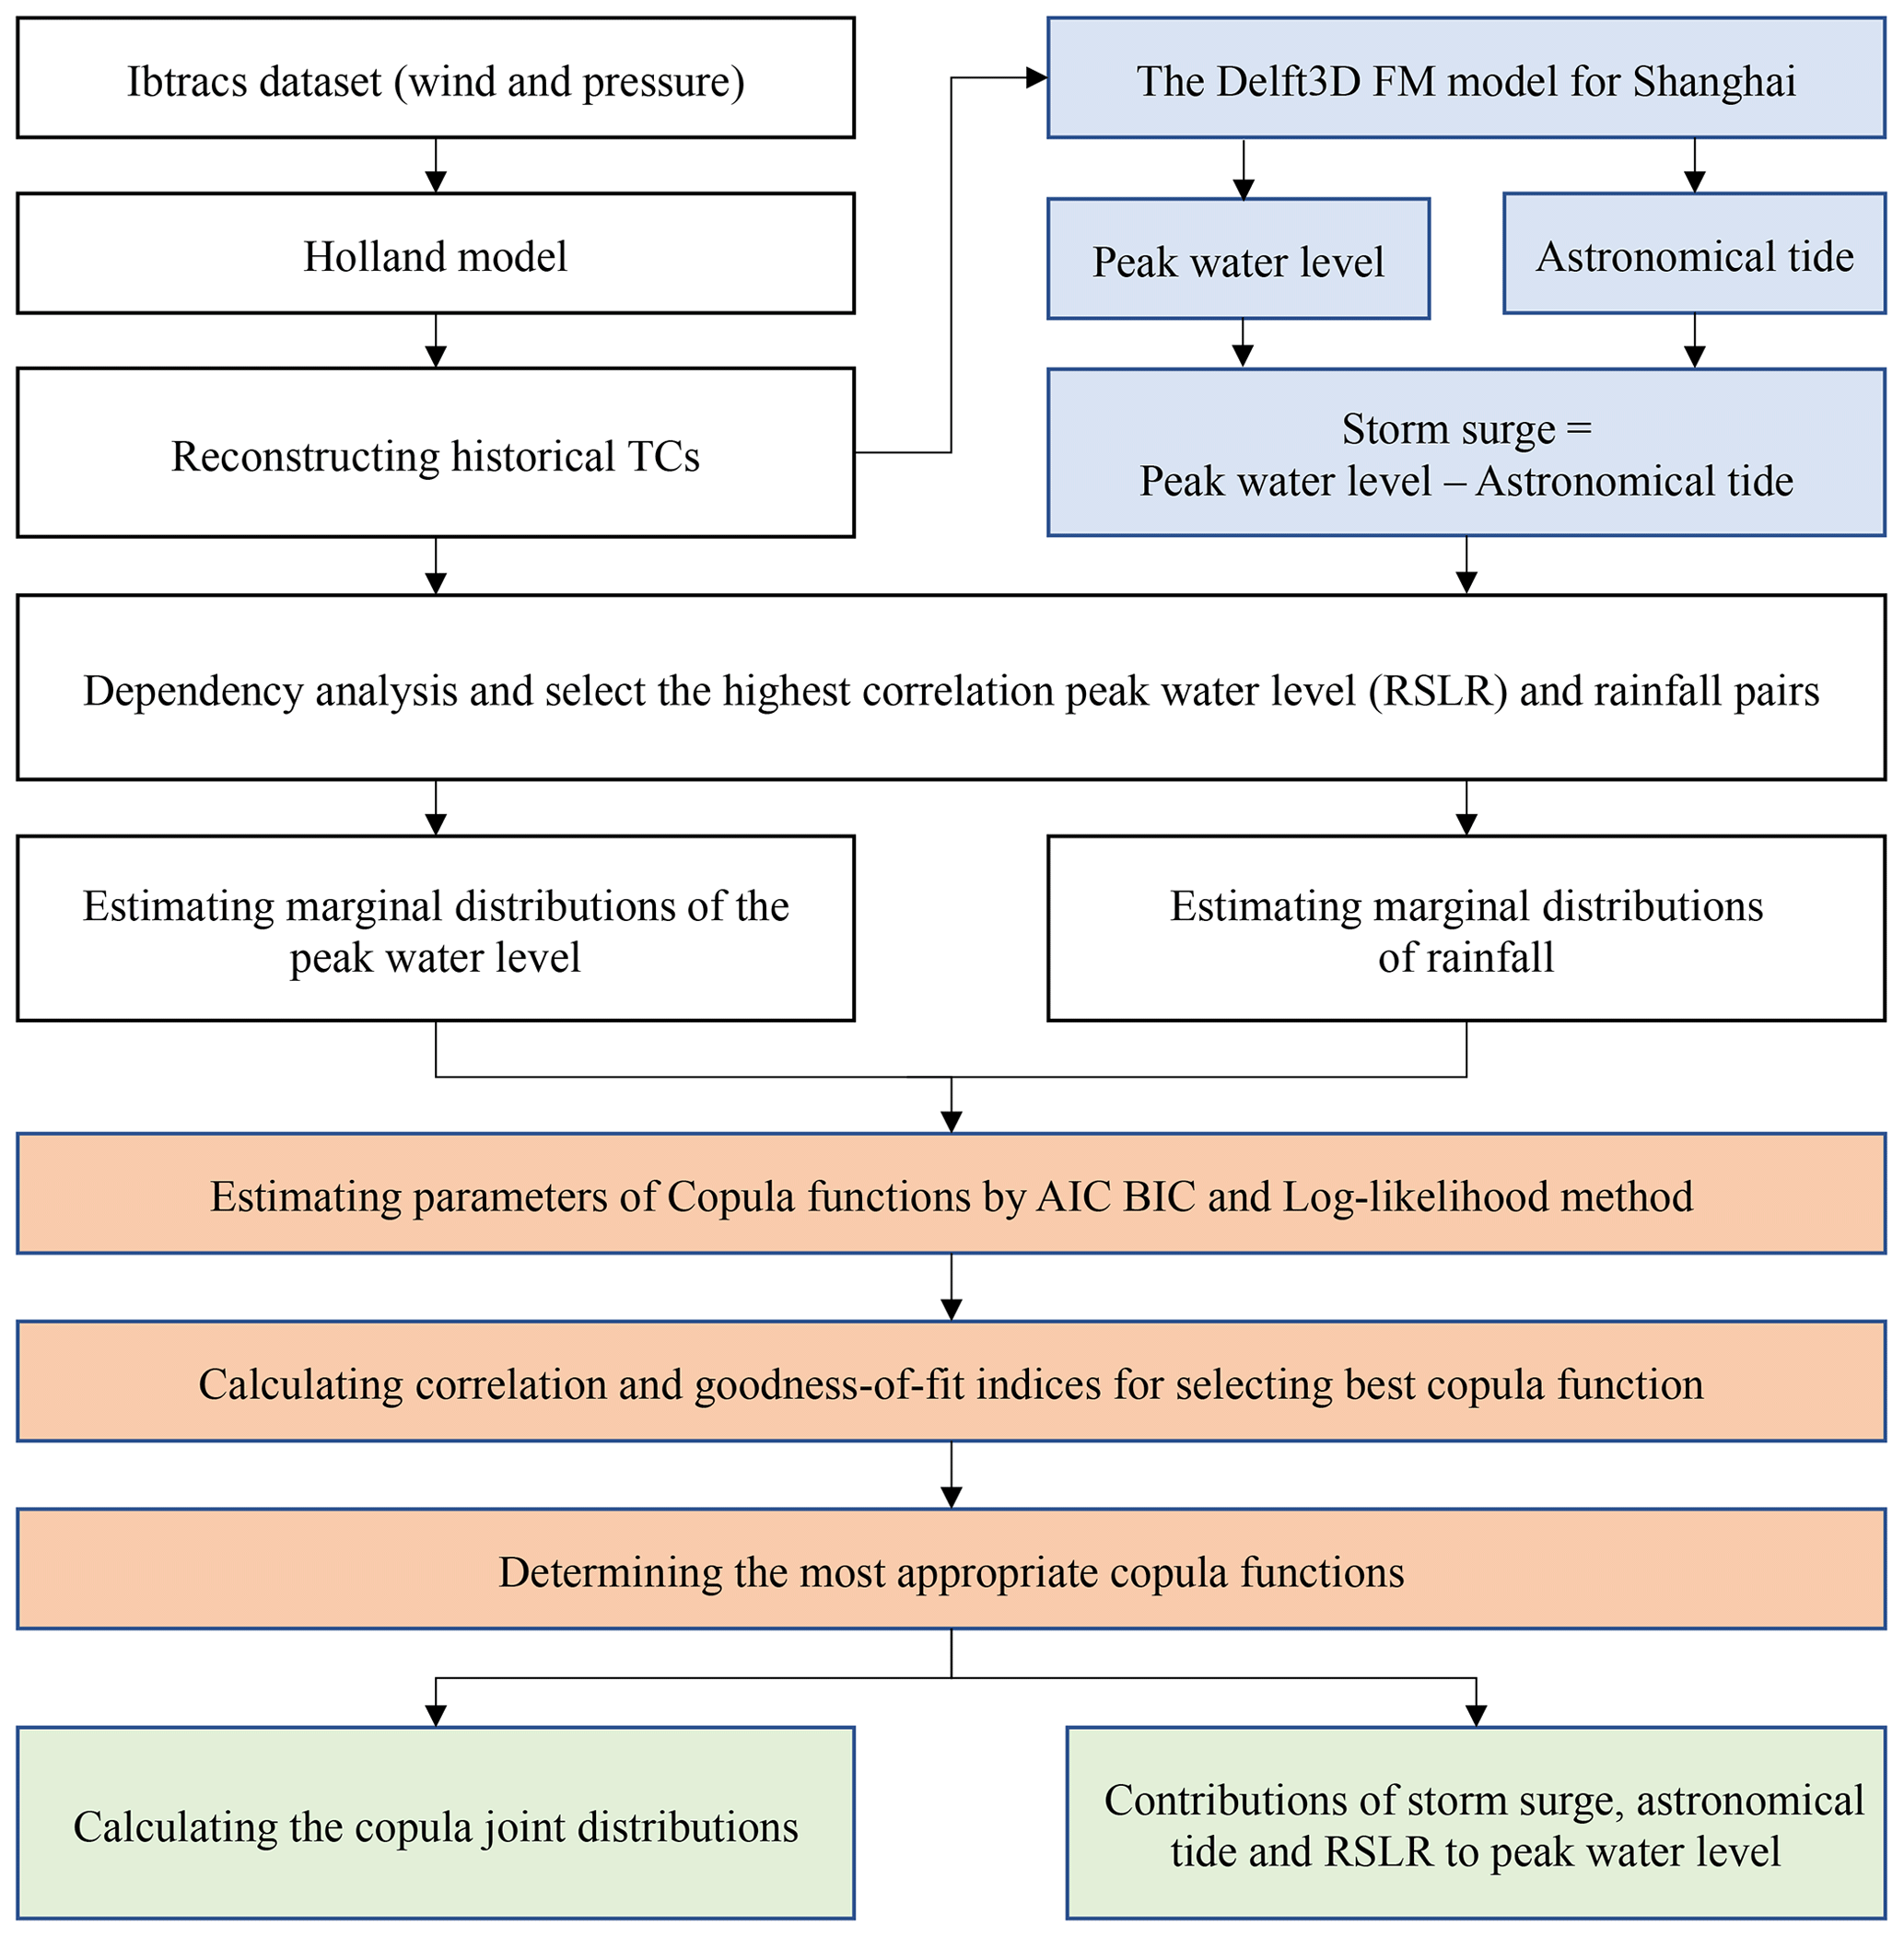
The objectives of this study are to overcome the limitation of unavailable water level records during TCs and set up a framework to improve the methods for selecting the most suitable TCs for the research and for investigating the influence of TCs on the water level. Due to the limited water level data availability, we employ an empirical track model for pressure and wind fields, followed by a physics-based ocean model to simulate the storm tides and astronomical tides during TCs in Shanghai. A numerical simulation is carried out to better understand the distribution and timing of the peak water level and the areas of the country affected. The physics-based ocean model was calibrated using the recorded atmospheric pressure, and focused on TCs with the most severe damage; the results compared well with the results from field survey data (Ke et al., 2021). Following this, the copula function is used to connect peak water level with accumulated rainfall and construct a joint distribution. After that, we compare and investigate the difference between the peak water level and the accumulated rainfall under the effect of RSLR, and select extreme compound flood events according to the design value of the joint hazard scenario. Finally, we analyse the contributions of the storm surge, astronomical tide, and RSLR to the peak water level for the extreme compound flood events (Fig. 3).
2.4 D-Flow FM model
Delft3D WES (Wind Enhance Scheme), a built-in module in Delft3D, is used to generate the wind and air pressure fields of each TC according to the Holland formula (Holland et al., 2010). It is able to generate tropical cyclone wind and pressure fields around storm centre positions on a high-resolution grid. Delft3D WES slightly improves on this by including asymmetry. This asymmetry is included by using the translational speed of the cyclone centre's displacement by the steering flow and the rotation of the wind velocity due to friction (Takagi and Wu, 2016). The output of Delft3D WES is suitable for use as input for the D-Flow FM model to simulate the water level, including the effect of a storm surge.
The D-Flow FM module (part of the Delft3D Flexible Mesh suite) solves the non-linear shallow water equations for unsteady flow and transport phenomena derived from the three-dimensional Navier–Stokes equations for incompressible free surface flow (Symonds et al., 2016). The hydrodynamic model D-Flow FM is employed in this study to solve multi-disciplinary problems in coastal, river, and estuarine environments (Meijer and Hutten,, 2018). The domain of the model covers the East China Sea, Hangzhou Bay, the Yangtze Estuary, and the downstream reach of the Yangtze River, ranging from 24 to 34∘ N and 118 to 128∘ E, and consists of 69 000 mesh cells. The model has been validated with observed storm tide and astronomical tide data obtained from 10 stations around Shanghai during TC Winnie in 1997 (Ke et al., 2021). The storm tides and astronomical tides of 210 TCs are calculated in this D-Flow FM model. Then, the peak storm tide from each TC is selected. In addition, the storm surge is calculated as the storm tide minus the astronomical tide at the same time as the peak storm tide. In this study, we assume that the Yangtze River discharge equals its annual mean, 31 000 m3 s−1.
2.5 Dependence modelling and design value via copulas
We define the joint distribution of accumulated rainfall and peak water level, FR, WL, as , where FR and FWL are the marginal distributions of the accumulated rainfall and the peak water level, respectively, and C is the associated dependence function, i.e. the copula, which models the dependence between the accumulated rainfall and the peak water level independently using their marginal distributions (Sklar, 1973; Salvadori and De Michele, 2004). Hence, we select marginal distributions from among the most commonly used distribution functions for extremes, namely the generalized extreme value (GEV), Pearson type III (P-III), Gumbel, exponential, and Weibull distributions.
The copula function introduced by Sklar can model the dependence structure and joint probability distributions. The Gaussian, Clayton, Frank, and Gumbel copula functions are selected to establish the joint distribution of the peak water level and accumulated rainfall. To evaluate the fitting error and select the appropriate copula function by the non-parametric estimation method, the Akaike information criterion (AIC), Bayesian information criterion (BIC), and root mean square error (RMSE) are employed.
Here, K is the number of estimated parameters in the model including the intercept, and is the log-likelihood at its maximum point in the estimated model; n is the sample size. The rule of selection was that the smaller the value of the AIC, the better the model, and similarly for the BIC.
where n is the number of observations; XC is the theoretical probability from the copula, and XO is the empirical observed probability. It is also worth noting that the dependence between the accumulated rainfall and peak water level is given by their linear correlation, i.e. Spearman's ρ, or concordant and discordant pairs, i.e. Kendall's τ.
Following Salvadori and De Michele (2004), copulas allow a straightforward definition of two hazard scenarios, i.e. pairs with an occurrence probability greater than a safety threshold, namely “AND” and “OR” scenarios. The “AND” scenario assumes that a hazardous condition is realized when both the dependent variables, in this case rainfall and water level, exceed their predefined thresholds, while the “OR” scenario assumes that a hazardous condition can occur when either one of the two dependent variables exceeds its predefined threshold. The “AND” scenario is commonly used for compound flooding, mostly because the flooding can be generated by excessive runoff, a high sea level, or a combination of both (H. R. Moftakhari et al., 2017; H. Moftakhari et al., 2019; Zellou and Rahali, 2019). The joint exceedance probability based on the “AND” scenario is given by Eq. (4).
where U=FR and V=FWL are the marginal distributions and ud and vd are the safety thresholds of the accumulated rainfall and peak water level, respectively. The dependent design values can be inferred from Eq. (4) based on the level of safety desired.
The joint probability cannot be directly used as the reference value of the actual engineering fortification standard. We calculate the joint design value combinations with the joint return period, which can serve as a reference for the engineering design. For given peak water level and accumulated rainfall events, under the conditions of a given joint return period, we design a series of (ud,vd) combinations to maximize , thereby obtaining the optimal combination design value. In the practical calculation, the intersection of the diagonal of the critical probabilistic surface and the probability isoline gives the design values of (ud,vd).
3.1 Effect of the relative sea level rise on the peak water level
The correlation between peak water level and accumulated rainfall is positive (Table S1 in the Supplement). The peak water level has a higher correlation with the 2-day accumulated rainfall than the 1-day or 3-day accumulated rainfall. The correlation between peak water level and accumulated rainfall is significant (Pvalue<0.05) in all cases. Consequently, the remaining analysis will be performed by considering the 2-day accumulated rainfall (R2d hereafter).
The probability density function is a useful tool for comparing peak water levels between the cases with and without the RSLR. The results in Fig. 4 show a clear shift in the distribution of the peak water level during TC periods. This demonstrates that the RSLR increases both the mean and the variance of the peak water level, thus resulting in a higher risk of flooding in Shanghai.
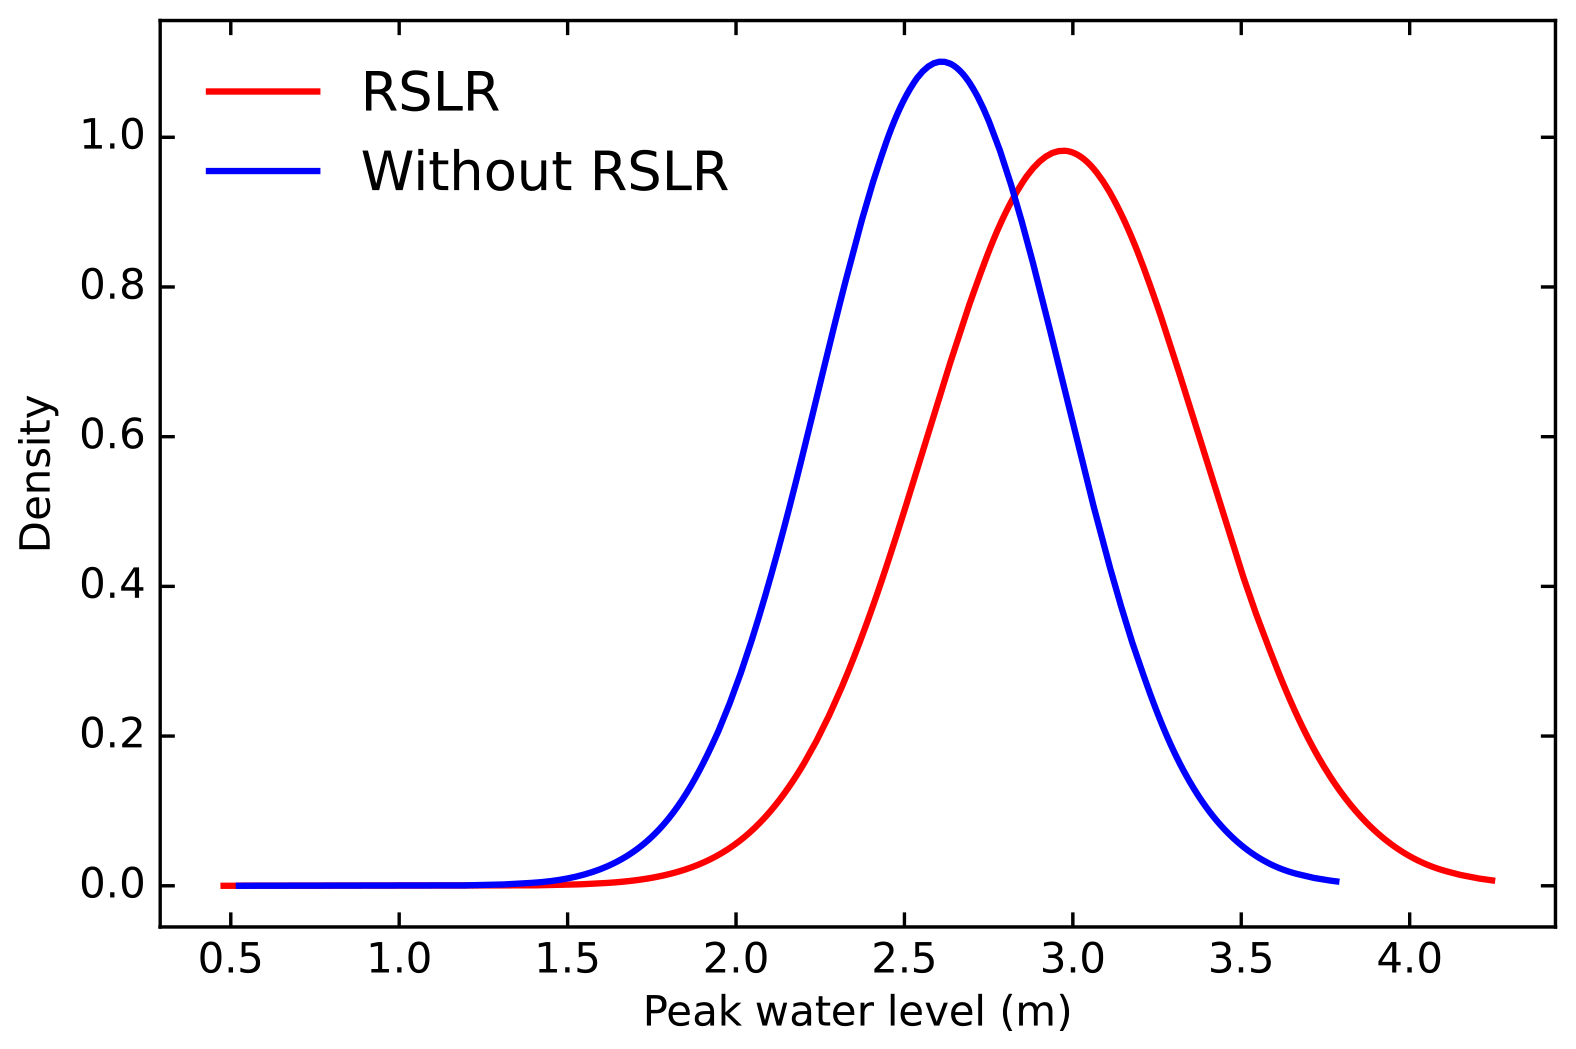
Figure 4The shift of the probabilistic distribution of the peak water level in Shanghai during 1961–2018 with the RSLR and without the RSLR.
The marginal distributions are used to transform the peak water level and R2d into the uniform marginals uWL and uR2d, respectively. Then, the preferred copula is selected from among the Clayton, Frank, Gumbel, and Gaussian copulas. In the case without the RSLR, the preferred copula is Clayton because it has the smallest AIC, BIC, and RMSE (the upper panel in Table 1). In the case with the RSLR, the lower panel in Table 1 shows that the Gaussian copula has the smallest AIC, BIC, and RMSE. Therefore, the Gaussian copula is selected as the best fit for the peak water level and accumulated rainfall under the effect of the RSLR. Figure 5 shows the difference between peak water level and accumulated rainfall with the RSLR and without the RSLR. This figure indicates that different copula families can return different dependence structures. In Fig. 5, both peak water level and accumulated rainfall are presented in probability space. Gaussian and Clayton copula families are used to explain the bivariate dependence between peak water level and accumulated rainfall in this study. The red and blue isolines are fitted Gaussian copulas and Clayton copulas, respectively. Neither of these is among the commonly used copulas in the hydrological literature. This highlights the importance of the choice of copula, and quantifies the difference in results caused by choosing a different copula.
Table 1Performance measures of the estimated copula functions (data of functions selected for this study are indicated in bold).
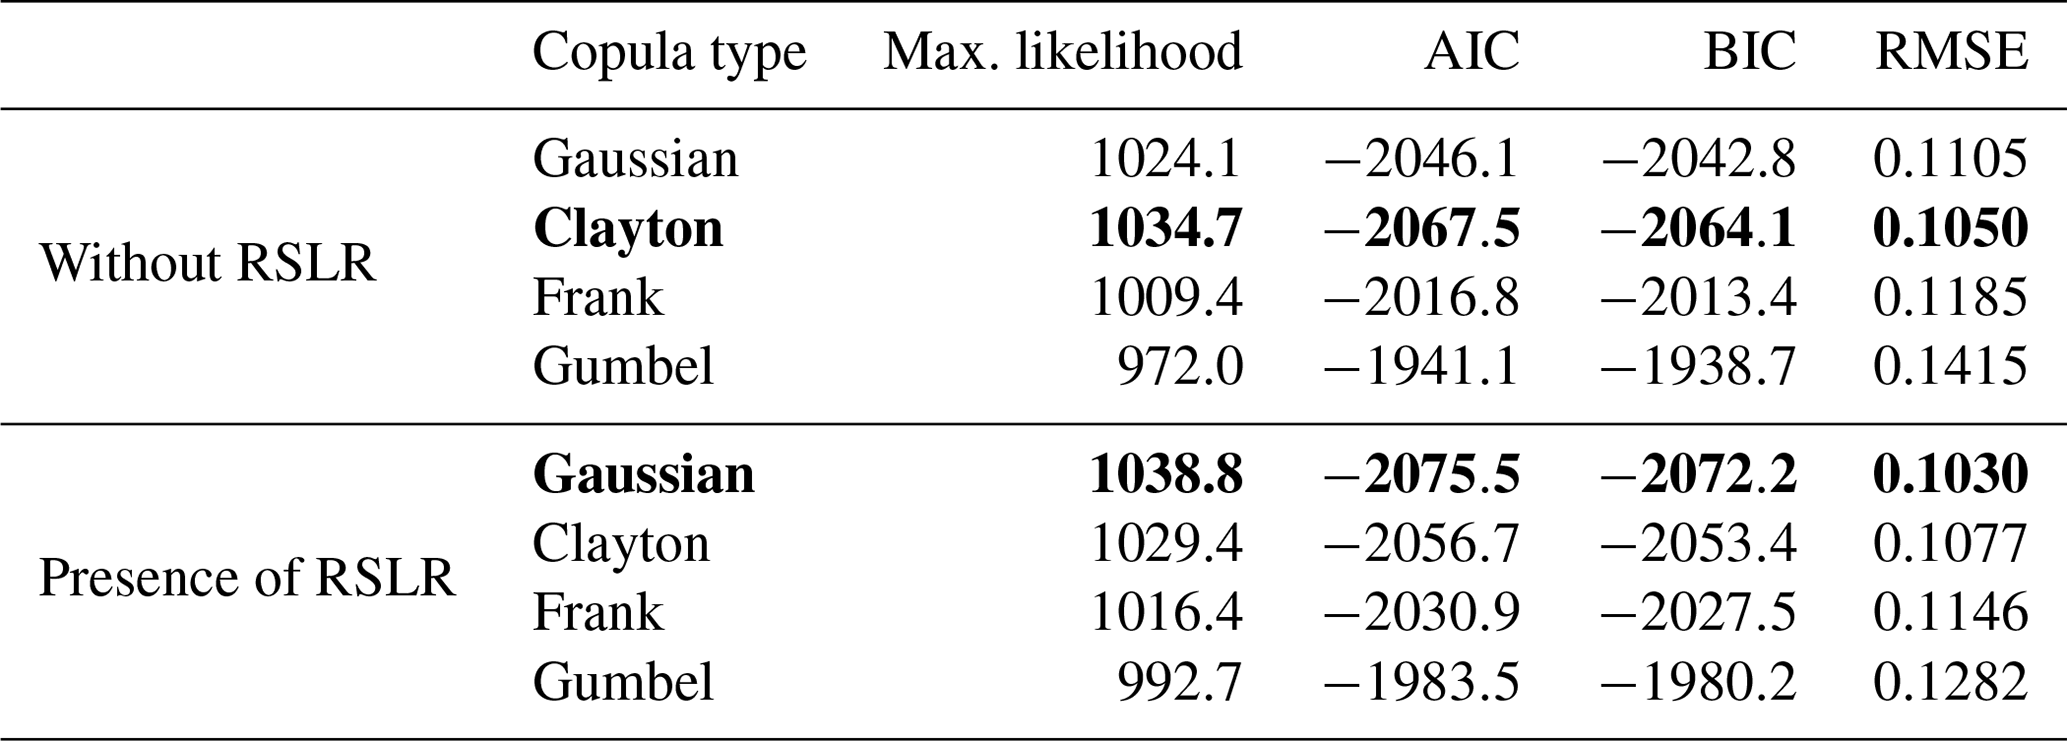

Figure 5With RSLR (red) and without RSLR (blue) for two different copulas. Both the peak water level (x axis) and the accumulated rainfall (y axis) are presented in probability space. The red isolines are the fitted Gaussian copula and the blue lines use a Clayton copula. The lines are copula isolines and the dots show observed data. The vertical axis on the right-hand side shows the joint probability values of the isolines.
3.2 Contributions of the storm surge, astronomical tide, and RSLR to the peak water level
Figure 6 presents a scatter plot of peak water level and accumulated rainfall with and without the RSLR. It shows that the influence of the RSLR pushes up the design value of the peak water level from 3.25 to 3.36 m under the 10-year joint return period with the corresponding design value of rainfall at 90.39 mm. The univariate analysis approach is to assume no dependence between rainfall and sea level; this independence assumption will generally lead to lower design values compared to scenarios for the copula-based method. It usually depends on how one selects the pairs and the statistical model used (independent or dependent). This is a direct consequence of the difference between both approaches in the sampling of extreme observations.
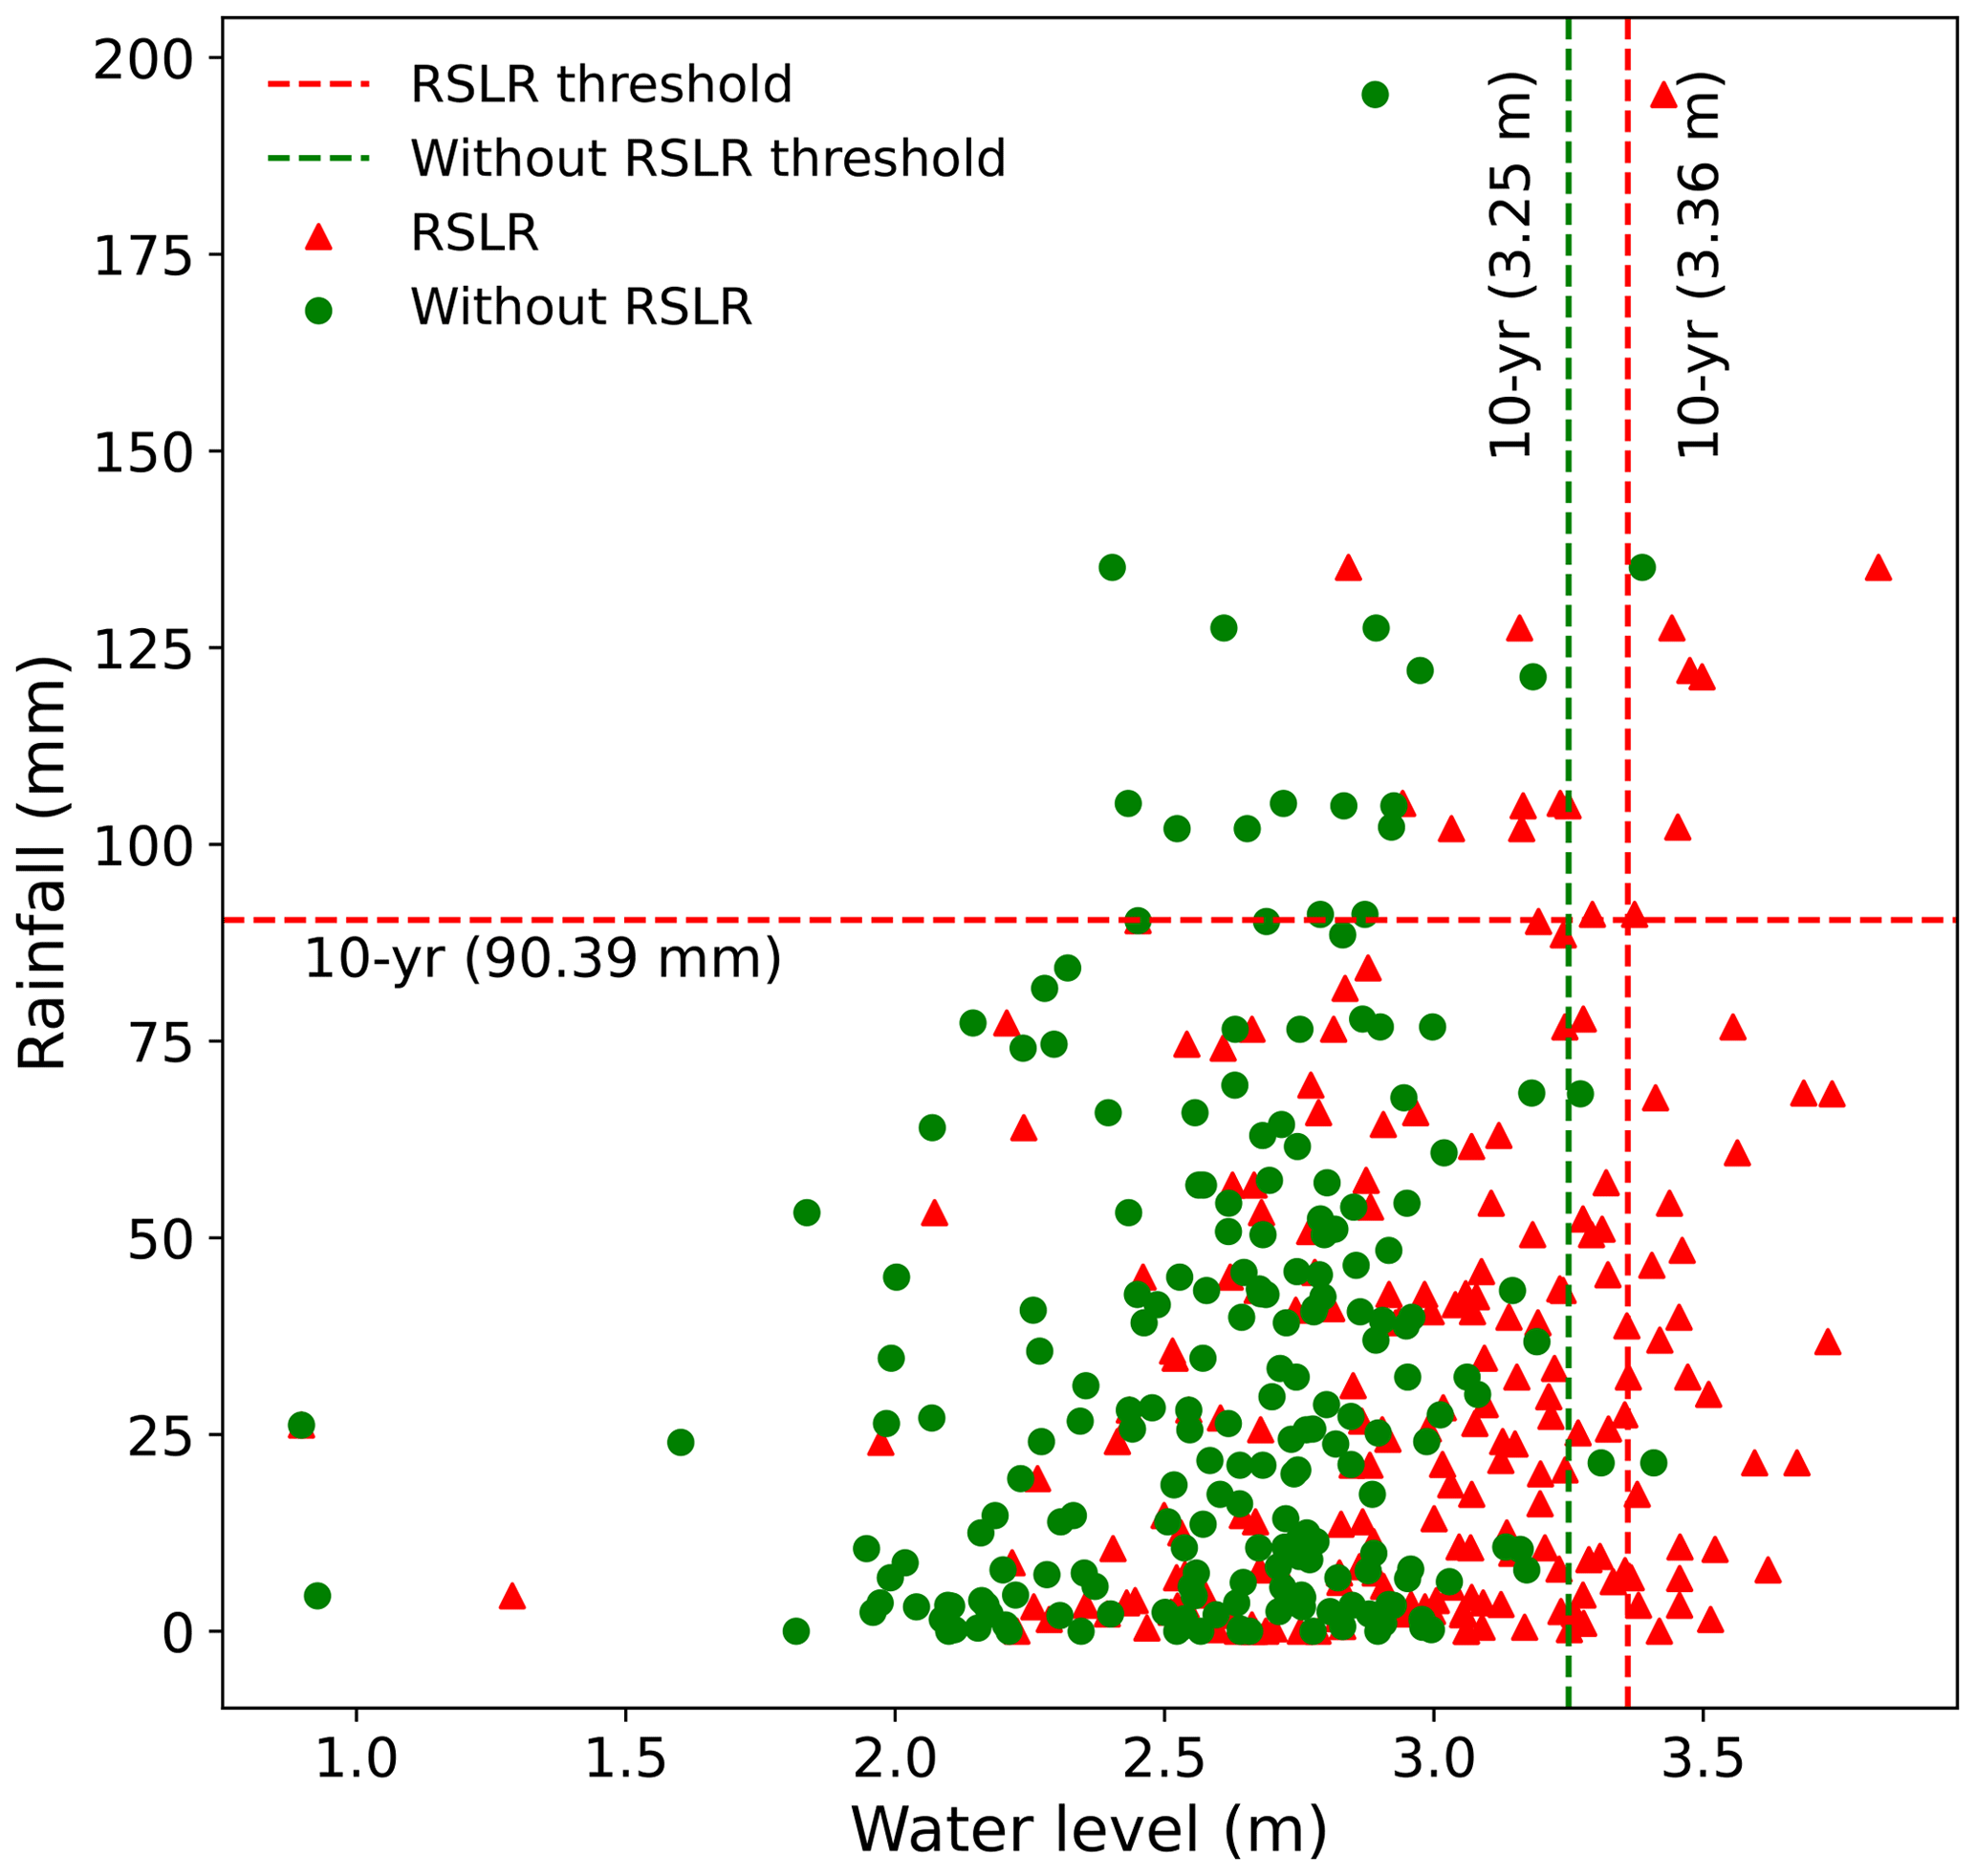
Figure 6Analysis of a scatter plot of water level and rainfall. Red lines show the design value of the 10-year joint return period with the effect of the RSLR. Green lines show the design value of the 10-year joint return period without the effect of the RSLR.
Based on the results in Fig. 6, we defined a compound flood event as having a peak water level and accumulated rainfall that are both greater than their design values for the 10-year joint return period (i.e. peak water level >3.36 m and accumulated rainfall >90.39 mm). Based on this criterion, we identified seven compound flood events under the influence of the RSLR (Fig. 7).
The peak water level results from the combination of a storm surge, the astronomical tide, and the RSLR. Figure 7 shows the contributions of the storm surge, the astronomical tide, and the RSLR to the peak water levels for the seven extreme compound flood events in Shanghai. We consider the effect of the RSLR in the cases and split the peak water level according to the contributions of its components, i.e. storm surge, astronomical tide, and RSLR, to investigate their contributions.
Overall, the storm surge explains 32 % of the peak water level, while the astronomical tide accounts for 55 % and the RSLR accounts for 13 % of the peak water level. The astronomical tide is, in general, the leading contributor to the peak water level, but the storm surge can be the leading contributor in some cases, e.g. TC 4, in which the contribution of the storm surge accounted for 45 % of the peak water level. In the scenario of future global warming and further urbanization, the impact of the RSLR will increase and should not be treated as less important.
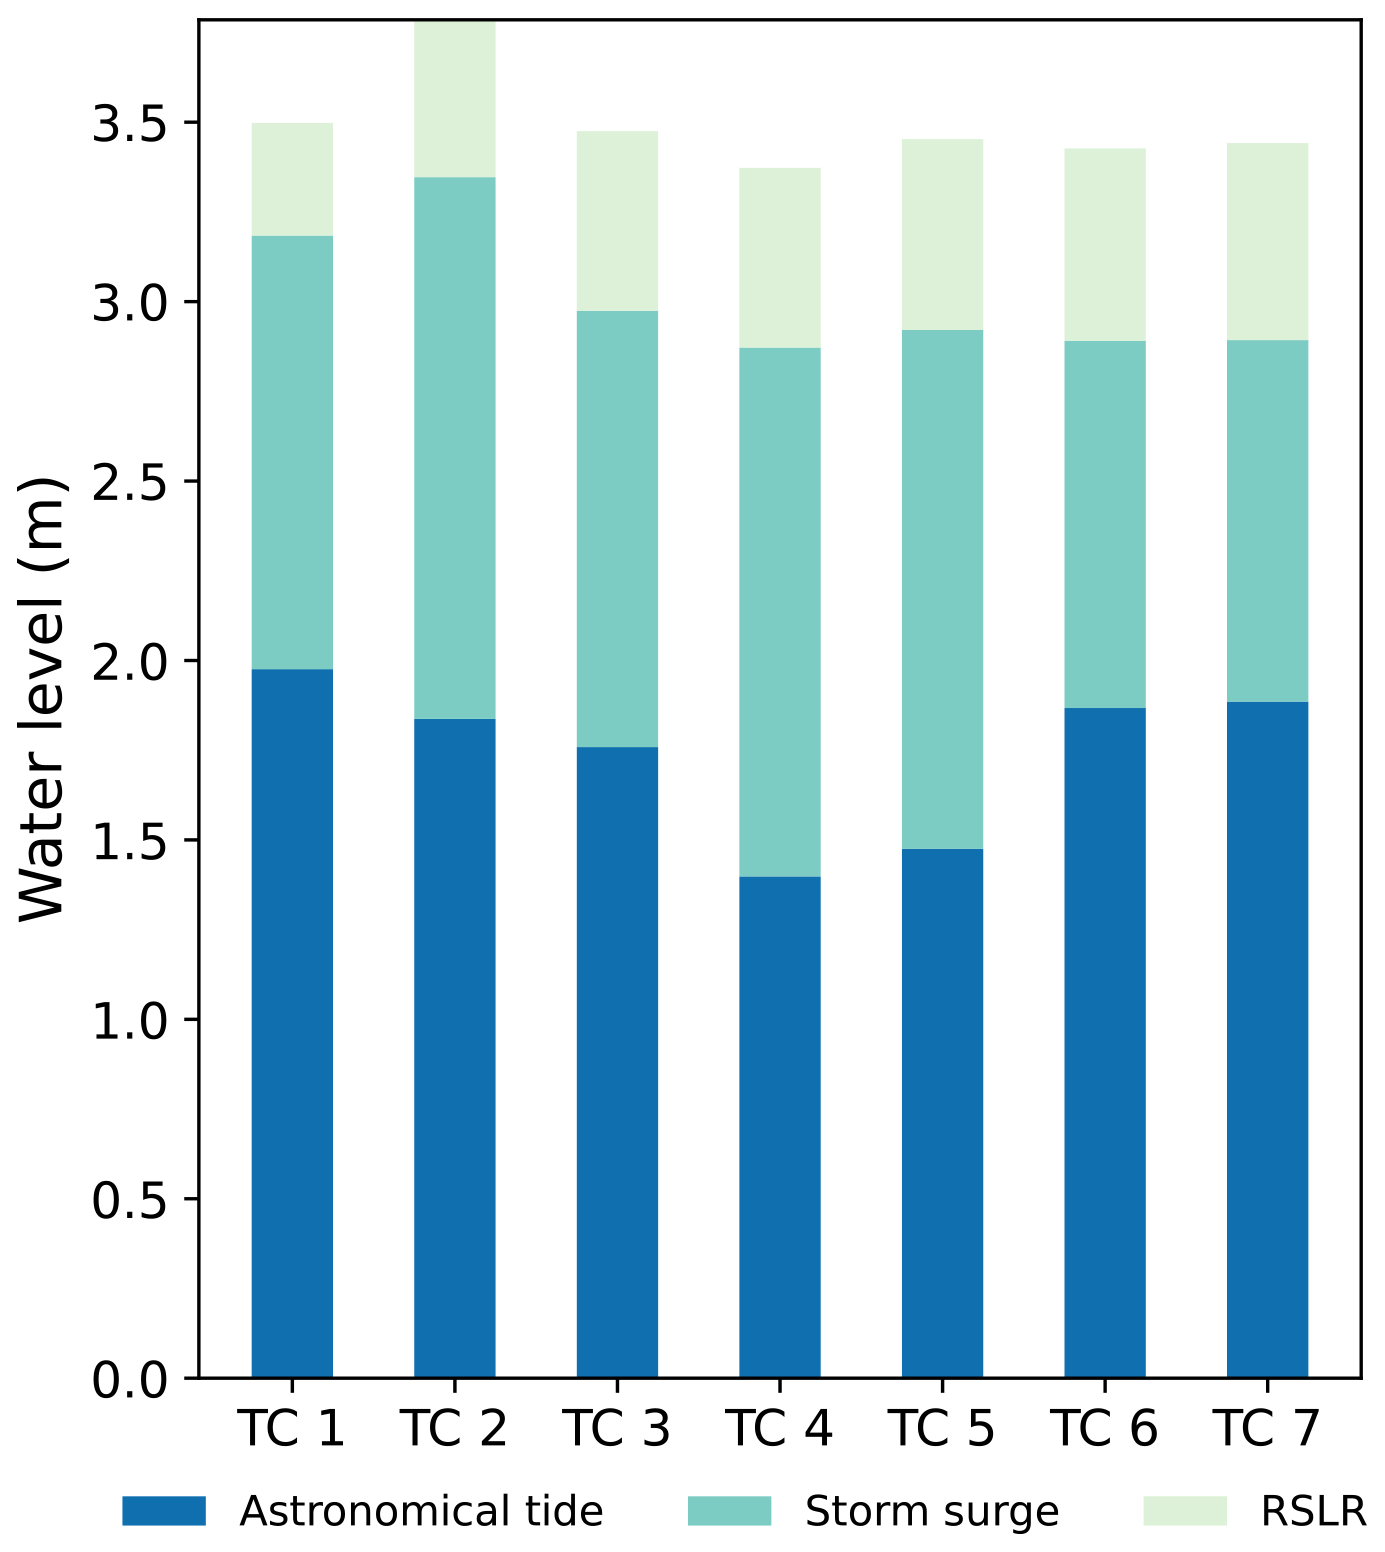
Figure 7The contributions of the storm surge, the astronomical tide, and the RSLR to the peak water level (cases are samples with a joint return period of greater than 10 year.
Coastal areas are the most densely populated and economically developed areas of many countries, and they are also the most vulnerable regions to the risk of compound floods from heavy precipitation and storm surges because of their high population and property density as well as the storm surge risk (Shen et al., 2019). In this study, we provide a framework that could be applied in general to coastal cities that face the constraint of unavailable water level records.
4.1 The dependency between the water level and rainfall
The dependences among different drivers of compound floods have been widely studied. For example, Zheng et al. (2013) identified a significant dependence between precipitation and storm surge along the coastline of Australia; Wahl et al. (2015) examined the enhanced dependence between precipitation and storm surge, and reported an increasing trend in compound flood risk along the coast of the US in past decades. These findings are critical to achieving a better understanding of the changing compound flood risk and provide important references for the evaluation of simulation-based studies.
The correlation between rainfall and storm surges is determined by various factors such as the meteorological conditions and regional topography. For example, compound floods from heavy precipitation and storm surges can occur during TCs (Wahl et al., 2015; Bevacqua et al., 2019). TCs are one of the most important triggers of compound floods due to heavy rainfall and storm surges in coastal regions. Even though compound floods are receiving attention, few studies have analysed the dependency between water level and rainfall during historical TCs in China. This study enriches this stream of literature by quantifying the joint distribution of peak water level and rainfall during TCs in the Shanghai estuary region. On the other hand, it is worth noting that the record lengths of observational data in our study are relatively short, and the uncertainties of simulation-based studies could be large. Therefore, further studies are needed once more observational data become available.
4.2 The effect of the RSLR on the peak water level
Deltas are especially vulnerable to the RSLR because of their low elevation and commonly high rates of land subsidence (Wang et al., 2012; Higgins et al., 2014). Long-term tide gauge records show that global mean sea levels have risen by 1.7 ± 0.3 mm yr−1 over the last century (Holgate, 2007; Cipollini et al., 2017). Nearly 90 % of the world's river deltas are suffering from the impact of the RSLR, including Shanghai and Manila (He and Silliman, 2019). The accelerated rise of the global sea level puts low-lying coastal regions at risk of increases in the frequency and magnitude of flooding (Cazenave and Cozannet, 2014). For example, the sea level rose on average by ∼10 cm over the 20th century along the Italian coast, and flood frequency increased by more than seven times in that area (Kulp and Strauss, 2019). Increased flooding because of the RSLR in regions that experience storm surges from TCs further increases the vulnerability of coastal regions to inundation (Edmonds et al., 2020).
Previous studies of Shanghai have reported an increased risk of coastal floods due to global and local changes (Wang et al., 2012; Yan et al., 2016). Including the increased RSLR we estimated for the past 58 years (0.55 m), a 4.3 m projected RSLR due to additional land subsidence along the Yangtze River delta by 2100 would result in half of Shanghai being flooded by extreme storm-water levels (Wang et al., 2012). Several potential carbon emission scenarios are used to project the sea-level rise. Regardless of the methods and emission scenarios used to estimate future sea levels, the consensus is that sea levels are rising, and the rate at which they are rising is expected to accelerate (Wahl et al., 2017). We investigated the effect of the RSLR for a low return period and under stationary climate conditions. This approach needs adaptation if using climate projections for future climate change. By contrast, this paper presents a probabilistic analysis of the impact of the RSLR on the peak water level, accounting for the effects of the sea level rise and land subsidence on coastal flooding in Shanghai over the period 1961–2018. The findings from our research provide a more solid foundation for the future-scenario-based analysis and should be useful for decision making about adaption via coastal flood defence measures for Shanghai.
4.3 Multiple contributors to the peak water level
Coastal flooding from peak water levels is one of the most devastating natural hazards to Shanghai. A storm with strong winds and low atmospheric pressure can produce a large storm surge and large waves. A storm surge is an increase in water level above the normal sea level and is a function of storm intensity, duration, size, and location (Cooper et al., 2008). Tides are an astronomical phenomenon caused by the gravitational attraction of the moon and the sun to the earth's oceans, while a storm surge is a meteorological phenomenon (Karim and Mimura, 2008). If a storm surge coincides with an astronomical high tide, these water levels superpose, and an extreme water level may be generated. Southeast Asia is highly vulnerable to, and frequently impacted by, extreme sea-level events of different origins: TCs cause severe storm surges and rainfall with potentially devastating impacts on the economy and environment, and, in many cases, loss of human life.
Astronomical tides are deterministic and can be predicted far in advance, whereas storm surges can only be accurately hindcast from tide gauge records. Predicting a storm surge is possible days in advance of a TC landfall; it can be simulated by taking into account predicted forcing variables, such as the wind stress and sea level pressure over the sea surface. Tide gauge records have been used to study sea level extremes. However, 90 % of the tide gauges located in Southeast Asia have record lengths of less than 30 years. One way to overcome the absence of long tide gauge records is to employ numerical models to simulate the storm surge component (Park and Suh, 2012) using best-track TC data or meteorological reanalysis results, as we have done in this research.
In this study, we have demonstrated that the astronomical tide plays an important role in the total water level in Shanghai. Indeed, surges might occur at any tidal level, and are especially strong in shallow estuaries. A high tide at Wusongkou gauge would extend to downtown Shanghai, causing a fluvial flood. The flood extent, depth, and duration can be exacerbated by a storm surge, and consequently the disruptive impact increases strongly (Ke et al., 2018). Astronomical tides contribute to peak water levels during TCs (Sweet et al., 2009). Bacopoulos (2017) showed that in the St. Johns River in Florida, the astronomical tide could contribute as much as 94 % to the extreme water level. Our study highlights that the critical components to consider in the analysis of peak water levels during TCs are the astronomical tides, storm surges, and the RSLR. In future research, we will explore the applicability of the presented methodology to other regions where limited observational data availability has hampered a better understanding of peak water levels, storm surges, and potential changes related to climate variability and change.
It is important to consider the compounding effects of multiple interdependent extremes or drivers to accurately characterize the underlying hazard. In this study, we focused on the joint impact of peak water level and accumulated rainfall in Shanghai, a coastal megacity located in the Yangtze River Delta region. We showed that Shanghai is prone to compound flooding, and this justifies the adoption of a probabilistic modelling framework to incorporate the interdependence of multiple flood drivers.
Between 1961 and 2018, the RSLR increased by 0.55 m in Shanghai. With the ongoing global warming and further urbanization vertically and horizontally in the city, the process of RSLR will continue and amplify the peak water levels in extreme flooding events. The sample data we consolidated show an increase in the probability of peak water level under the effect of the RSLR. We also identified the extent of the shift in the joint distribution of peak water level and accumulated rainfall during TC periods between the theoretical setting without the RSLR and the real setting with the RSLR by employing the best-fitting copula functions. The shift indicates that the RSLR leads to an increase in both the mean and the variance of the peak water levels, and thus a significantly higher level of flooding risk in Shanghai.
The design values of the peak water level and accumulated rainfall are 3.36 m and 90.39 mm during TCs under the 10-year joint return period and with the influence of the RSLR. We selected potential compound flood events according to this pair of design values and identified seven potential compound flood events. The analysis of these seven events showed that the astronomical tide is, in general, the most important driver of the peak water level; however, there was one case in which the storm surge is the leading driver of the peak water level. If the astronomical tide is measured relative to the mean high water instead of the mean sea level, the length of the tide may be smaller. However, we argue that the peak water level is the most dangerous hazard to coastal cities. The combination of the astronomical tide, the storm surge, and the RSLR drives the peak water level. We cannot neglect the contribution of the tide during the typhoon season.
The framework developed in this study could be applied to other coastal cities or regions in East and Southeast Asia. The impact of the RSLR in amplifying the peak water level will significantly increase in the future. Therefore, monitoring and predicting the RSLR should be an important component of the development of future design standards for flood preparedness. Furthermore, the RSLR caused by climate change and intensive use of urban land will also increase social vulnerability, which could be an interesting topic for future research.
The data used in this study such as the typhoon tracks and rainfall records are freely available. The tracks are from Hong Kong Observatory (2020, https://www.hko.gov.hk/en/index.html). The daily rainfall records are collected from the China Meteorological Administration (http://data.cma.cn/, CMA, 2020).
The supplement related to this article is available online at: https://doi.org/10.5194/nhess-22-2347-2022-supplement.
ZT, HQ, LS, and JW conceived the study. HQ, ER, JB, and LS drafted the manuscript. HQ, ER, GM, and JT contributed to the Copula method. HQ, QY, and QK were responsible for hydrodynamic modelling. SW and RT contributed to tropical cyclone analysis. All authors commented on the manuscript.
The contact author has declared that neither they nor their co-authors have any competing interests.
Publisher’s note: Copernicus Publications remains neutral with regard to jurisdictional claims in published maps and institutional affiliations.
This article is part of the special issue “Advances in flood forecasting and early warning”. It is not associated with a conference.
The authors would like to acknowledge Jie Yin and the three anonymous referees for the thoughtful and constructive comments. Hanqing Xu is thankful for financial support from the program of China Scholarships Council (no. 202006140040).
This research has been supported by the National Key R&D Program of China (grant no. 2019YFE0124800), the National Natural Science Foundation of China (grant nos. 51761135024 and 41971199), the Netherlands Organization for Scientific Research (NWO) (grant no. ALWSD.2016.007), the Engineering and Physical Sciences Research Council of the UK (grant no. R034214/1), and also the Shanghai Science and Technology Support Program (grant no. 19DZ1201505), the Major Program of the National Social Science Foundation of China (grant no. 18ZDA105), and the ECNU Academic Innovation Promotion Program for Excellent Doctoral Students (grant no. YBNLTS2020035).
This paper was edited by Jie Yin and reviewed by three anonymous referees.
Anandalekshmi, A., Panicker, S. T., Adarsh, S., Siddik, A. M., Aloysius, S., and Mehjabin, M.: Modeling the concurrent impact of extreme rainfall and reservoir storage on kerala floods 2018: a Copula approach, Model. Earth Syst. Environ., 5, 1283–1296, https://doi.org/10.1007/s40808-019-00635-6, 2019.
Bacopoulos, P.: Tide-surge historical assessment of extreme water levels for the St. Johns River: 1928–2017, J. Hydrol., 553, 624–636, https://doi.org/10.1016/j.jhydrol.2017.08.041, 2017.
Balistrocchi, M., Moretti, G., Orlandini, S., and Ranzi, R.: Copula-based modeling of earthen levee breach due to overtopping, Adv. Water Resour., 134, 103433, https://doi.org/10.1016/j.advwatres.2019.103433, 2019.
Bevacqua, E., Maraun, D., Hobæk Haff, I., Widmann, M., and Vrac, M.: Multivariate statistical modelling of compound events via pair-copula constructions: analysis of floods in Ravenna (Italy), Hydrol. Earth Syst. Sci., 21, 2701–2723, https://doi.org/10.5194/hess-21-2701-2017, 2017.
Bevacqua, E., Maraun, D., Vousdoukas, M. I., Voukouvalas, E., Vrac, M., Mentaschi, L., and Widmann, M.: Higher probability of compound flooding from precipitation and storm surge in Europe under anthropogenic climate change, Science Advances, 5, eaaw5531, https://doi.org/10.1126/sciadv.aaw5531, 2019.
Bilskie, M. V., Zhao, H., Resio, D., Atkinson, J., Cobell, Z., and Hagen, S. C.: Enhancing flood hazard assessments in coastal louisiana through coupled hydrologic and surge processes, Frontiers in Water, 3, 5, https://doi.org/10.3389/frwa.2021.609231, 2021.
Cazenave, A. and Cozannet, G. L.: Sea level rise and its coastal impacts, Earth's Future, 2, 15–34, https://doi.org/10.1002/2013EF000188, 2014.
Chao, S. R., Ghansah, B., and Grant, R. J.: An exploratory model to characterize the vulnerability of coastal buildings to storm surge flooding in Miami-Dade County, Florida, Appl. Geogr., 128, 102413, https://doi.org/10.1016/j.apgeog.2021.102413, 2021.
Chen, X., Wu, L., and Zhang, J.: Increasing duration of tropical cyclones over 432 china, Geophys. Res. Lett., 38, L02708, https://doi.org/10.1029/2010GL046137, 2011.
China Meteorological Administration (CMA): Daily Data From Surface Meteorological Stations In China, http://data.cma.cn/, last access: 16 July 2020.
Cipollini, P., Calafat, F. M., Jevrejeva, S., Melet, A., and Prandi, P.: Monitoring sea level in the coastal zone with satellite altimetry and tide gauges, in: Integrative Study of the Mean Sea Level and Its Components, Surv. Geophys., 35–59, https://doi.org/10.1007/978-3-319-56490-6_3, 2017.
Cooper, M. J., Beevers, M. D., and Oppenheimer, M.: The potential impacts of sea level rise on the coastal region of New Jersey, USA, Climatic Change, 90, 475–492, https://doi.org/10.1007/s10584-008-9422-0, 2008.
Couasnon, A., Sebastian, A., and Morales-Nápoles, O.: A copula-based bayesian network for modeling compound flood hazard from riverine and coastal interactions at the catchment scale: An application to the houston ship channel, Texas, Water, 10, 1190, https://doi.org/10.3390/w10091190, 2018.
Couasnon, A., Eilander, D., Muis, S., Veldkamp, T. I. E., Haigh, I. D., Wahl, T., Winsemius, H. C., and Ward, P. J.: Measuring compound flood potential from river discharge and storm surge extremes at the global scale, Nat. Hazards Earth Syst. Sci., 20, 489–504, https://doi.org/10.5194/nhess-20-489-2020, 2020.
Du, S., Scussolini, P., Ward, P. J., Zhang, M., Wen, J., and Wang, L.: Hard or soft flood adaptation? advantages of a hybrid strategy for shanghai, Global Environ. Chang., 61, 102037, https://doi.org/10.1016/j.gloenvcha.2020.102037, 2020.
Edmonds, D. A., Caldwell, R. L., Brondizio, E. S., and Siani, S. M.: Coastal flooding will disproportionately impact people on river deltas, Nat. Commun., 11, 1–8, https://doi.org/10.1038/s41467-020-18531-4, 2020.
Fang, J., Wahl, T., Fang, J., Sun, X., Kong, F., and Liu, M.: Compound flood potential from storm surge and heavy precipitation in coastal China: dependence, drivers, and impacts, Hydrol. Earth Syst. Sci., 25, 4403–4416, https://doi.org/10.5194/hess-25-4403-2021, 2021.
Feng, D. and Beighley, E.: Identifying uncertainties in hydrologic fluxes and seasonality from hydrologic model components for climate change impact assessments, Hydrol. Earth Syst. Sci., 24, 2253–2267, https://doi.org/10.5194/hess-24-2253-2020, 2020.
Hallegatte, S., Green, C., Nicholls, R. J., and Corfee-Morlot, J.: Future flood losses in major coastal cities, Nat. Clim. Change, 3, 802–806, https://doi.org/10.1038/nclimate1979, 2013.
He, Q. and Silliman, B. R.: Climate change, human impacts, and coastal ecosystems in the Anthropocene, Curr. Biol., 29, 1021–1035, https://doi.org/10.1016/j.cub.2019.08.042, 2019.
Higgins, S. A., Overeem, I., Steckler, M. S., Syvitski, J. P., Seeber, L., and Akhter, S. H.: InSAR measurements of compaction and subsidence in the Ganges-Brahmaputra Delta, Bangladesh, J. Geophys. Res.-Earth, 119, 1768–1781, https://doi.org/10.1002/2014JF003117, 2014.
Holgate, S. J.: On the decadal rates of sea level change during the twentieth century, Geophys. Res. Lett., 34, L01602, https://doi.org/10.1029/2006GL028492, 2007.
Holland, G. J., Belanger, J. I., and Fritz, A.: A revised model for radial profiles of hurricane winds, Mon. Weather Rev., 138, 4393–4401, https://doi.org/10.1175/2010MWR3317.1, 2010.
Hong Kong Observatory: Hong Kong Observatory Tracks of Tropical Cyclones, https://www.hko.gov.hk/en/index.html, last access: 16 July 2020.
Hoque, M. A. A., Phinn, S., Roelfsema, C., and Childs, I.: Assessing tropical cyclone risks using geospatial techniques, Appl. Geogr., 98, 22–33, https://doi.org/10.1016/j.apgeog.2018.07.004, 2018.
Hu, H., Tian, Z., Sun, L., Wen, J., Liang, Z., Dong, G., and Liu, J.: Synthesized trade-off analysis of flood control solutions under future deep uncertainty: An application to the central business district of shanghai, Water Res., 166, 115067, https://doi.org/10.1016/j.watres.2019.115067, 2019.
Idier, D., Rohmer, J., Pedreros, R., Le Roy, S., Lambert, J., Louisor, J., and Le Cornec, E.: Coastal flood: a composite method for past events characterisation providing insights in past, present and future hazards-joining historical, statistical and modelling approaches, Nat. Hazards, 101, 465–501, https://doi.org/10.1007/s11069-020-03882-4, 2020.
IPCC: Climate Change 2021: The Physical Science Basis, Contribution of Working Group I to the sixth Assessment Report of the Intergovernmental Panel on Climate Change, Cambridge University Press, Cambridge, United Kingdom and New York, NY, USA, in Press, 2021.
Jebbad, R., Sierra, J. P., Mösso, C., Mestres, M., and Sánchez-Arcilla, A.: Assessment of harbour inoperability and adaptation cost due to sea level rise. Application to the port of Tangier-Med (Morocco), Appl. Geogr., 138, 102623, https://doi.org/10.1016/j.apgeog.2021.102623, 2022.
Karim, M. F. and Mimura, N.: Impacts of climate change and sea-level rise on cyclonic storm surge floods in Bangladesh, Global Environ. Chang., 18, 490–500, https://doi.org/10.1016/j.gloenvcha.2008.05.002, 2008.
Ke, Q.: Flood risk analysis for metropolitan areas – a case study for Shanghai, PhD,, TU Delft: Delft University of Technology, ISBN 9789065623669, https://doi.org/10.4233/uuid:61986b2d-72de-45e7-8f2a-bd61c725325d, 2014.
Ke, Q., Jonkman, S. N., Van Gelder, P. H., and Bricker, J. D.: Frequency analysis of storm-surge-induced flooding for the huangpu river in Shanghai, China, Journal of Marine Science and Engineering, 6, 70, https://doi.org/10.3390/jmse6020070, 2018.
Ke, Q., Yin, J., Bricker, J. D., Savage, N., Buonomo, E., Ye, Q., Paul, V., Guangtao D., Shuai, W., Zhan, T., Laixiang, S., Ralf, T., and Jonkman, S. N.: An integrated framework of coastal flood modelling under the failures of seadikes: a case study in Shanghai, Nat. Hazards, 109, 671–703, https://doi.org/10.1007/s11069-021-04853-z, 2021.
Khanal, S., Ridder, N., Terink, W., and v. d. Hurk, B.: Storm surge and extreme river discharge: A compound event analysis using ensemble impact modelling, Front. Earth Sci., 7, 224, https://doi.org/10.3389/feart.2019.00224 2019.
Knapp, K. R., Kruk, M. C., Levinson, D. H., Diamond, H. J., and Neumann, C. J.: The international best track archive for climate stewardship (IBTrACS) unifying tropical cyclone data, B. Am. Meteorol. Soc., 91, 363–376, https://doi.org/10.1175/2009BAMS2755.1, 2010.
Kossin, J. P.: A global slowdown of tropical-cyclone translation speed, Nature, 558, 104-107, https://doi.org/10.1038/s41586-018-0158-3, 2018.
Kulp, S. A. and Strauss, B. H.: New elevation data triple estimates of global vulnerability to sea-level rise and coastal flooding, Nat. Commun., 10, 1–12, https://doi.org/10.1038/s41467-019-12808-z, 2019.
Leonard, M., Westra, S., Phatak, A., Lambert, M., van den Hurk, B., McInnes, K., and Stafford-Smith, M.: A compound event framework for understanding extreme impacts, Wires Clim. Change, 5, 113–128, https://doi.org/10.1002/wcc.252, 2014.
Li, F. and Zheng, Q.: Probabilistic modelling of flood events using the entropy copula, Adv. Water Resour., 97, 233–240, https://doi.org/10.1016/j.advwatres.2016.09.016, 2016.
Li, M., Kwan, M. P., Yin, J., Yu, D., and Wang, J.: The potential effect of a 100-year pluvial flood event on metro accessibility and ridership: A case study of central Shanghai, China, Appl. Geogr., 100, 21–29, https://doi.org/10.1016/j.apgeog.2018.09.001, 2018.
Liu, Q., Xu, H., and Wang, J.: Assessing tropical cyclone compound flood risk using hydrodynamic modelling: a case study in Haikou City, China, Nat. Hazards Earth Syst. Sci., 22, 665–675, https://doi.org/10.5194/nhess-22-665-2022, 2022.
Li, W., Wen, J., Xu, B., Li, X., and Du, S.: Integrated assessment of economic losses in manufacturing industry in Shanghai metropolitan area under an extreme storm flood scenario, Sustainability, 11, 126, https://doi.org/10.3390/su11010126, 2019.
Meijer, D. and Hutten, R.: 2D urban modelling using Delft3D FM, Deltares, 2018.
Moftakhari, H. R., Salvadori, G., AghaKouchak, A., Sanders, B. F., and Matthew, R. A.: Compounding effects of sea level rise and fluvial flooding, P. Natl. Acad. Sci. USA, 114, 9785–9790, https://doi.org/10.1073/pnas.1620325114, 2017.
Moftakhari, H., Schubert, J. E., AghaKouchak, A., Matthew, R. A., and Sanders, B. F.: Linking statistical and hydrodynamic modeling for compound flood hazard assessment in tidal channels and estuaries, Adv. Water Resour., 128, 28–38, https://doi.org/10.1016/j.advwatres.2019.04.009, 2019.
Neumann, B., Vafeidis, A. T., Zimmermann, J., and Nicholls, R. J.: Future Coastal Population Growth and Exposure to Sea-Level Rise and Coastal Flooding – A Global Assessment, PLoS ONE, 10, e0118571, https://doi.org/10.1371/journal.pone.0131375, 2015.
Park, Y. H. and Suh, K. D.: Variations of storm surge caused by shallow water depths and extreme tidal ranges, Ocean Eng., 55, 44–51, https://doi.org/10.1016/j.oceaneng.2012.07.032, 2012.
Salvadori, G. and De Michele, C.: Frequency analysis via copulas: Theoretical aspects and applications to hydrological events, Water Resour. Res., 40, W12511, https://doi.org/10.1029/2004WR003133, 2004.
Santos, V. M., Casas-Prat, M., Poschlod, B., Ragno, E., van den Hurk, B., Hao, Z., Kalmár, T., Zhu, L., and Najafi, H.: Statistical modelling and climate variability of compound surge and precipitation events in a managed water system: a case study in the Netherlands, Hydrol. Earth Syst. Sci., 25, 3595–3615, https://doi.org/10.5194/hess-25-3595-2021, 2021.
Sklar, A.: Random variables, joint distribution functions, and copulas, Kybernetika, 9, 449–460, 1973.
Shen, Y., Morsy, M. M., Huxley, C., Tahvildari, N., and Goodall, J. L.: Flood risk assessment and increased resilience for coastal urban watersheds under the combined impact of storm tide and heavy rainfall, J. Hydrol., 579, 124159, https://doi.org/10.1016/j.jhydrol.2019.124159, 2019.
Sklar, M.: Fonctions de Répartition à n Dimensions et Leurs Marges, Publ. inst. statist. univ. Paris, 8, 229–231, 1959 (in French).
Sohn, W., Bae, J., and Newman, G.: Green infrastructure for coastal flood protection: The longitudinal impacts of green infrastructure patterns on flood damage, Appl.Geogr., 135, 102565, https://doi.org/10.1016/j.apgeog.2021.102565, 2021.
Sweet, W. W. V., Zervas, C. E., and Gill, S. K.: Elevated east coast sea level anomaly: June–July 2009. NOAA Tech. Rep. No. NOS CO-OPS 051, NOAA Natl. Ocean Service, Silver Spring, Md, 2009.
Symonds, A. M., Vijverberg, T., Post, S., Van Der Spek, B. J., Henrotte, J., and Sokolewicz, M.: Comparison between Mike 21 FM, Delft3D and Delft3D FM flow models of western port bay, Australia, Coast. Eng., 2, 1–12, https://doi.org/10.9753/icce.v35.currents.11, 2016.
Takagi, H. and Wu, W.: Maximum wind radius estimated by the 50 kt radius: improvement of storm surge forecasting over the western North Pacific, Nat. Hazards Earth Syst. Sci., 16, 705–717, https://doi.org/10.5194/nhess-16-705-2016, 2016.
Visser-Quinn, A., Beevers, L., Collet, L., Formetta, G., Smith, K., Wanders, N., Thober, S., Pan, M., and Kumar, R.: Spatio-temporal analysis of compound hydro-hazard extremes across the UK, Adv. Water Resour., 130, 77–90, https://doi.org/10.1016/j.advwatres.2019.05.019, 2019.
Wahl, T., Jain, S., Bender, J., Meyers, S. D., and Luther, M. E.: Increasing risk of compound flooding from storm surge and rainfall for major US cities, Nat. Clim. Change, 5, 1093–1097, https://doi.org/10.1038/nclimate2736, 2015.
Wahl, T., Haigh, I. D., Nicholls, R. J., Arns, A., Dangendorf, S., Hinkel, J., and Slangen, A. B.: Understanding extreme sea levels for broad-scale coastal impact and adaptation analysis, Nat. Commun., 8, 1–12, https://doi.org/10.1038/ncomms16075, 2017.
Wang, J., Gao, W., Xu, S., and Yu, L.: Evaluation of the combined risk of sea level rise, land subsidence, and storm surges on the coastal areas of Shanghai, China, Climatic Change, 115, 537–558, https://doi.org/10.1007/s10584-012-0468-7, 2012.
Wang, J., Yi, S., Li, M., Wang, L., and Song, C.: Effects of sea level rise, land subsidence, bathymetric change and typhoon tracks on storm flooding in the coastal areas of shanghai, Sci. Total Environ., 621, 228–234, https://doi.org/10.1016/j.scitotenv.2017.11.224, 2018.
Xu, H., Xu, K., Bin, L., Lian, J., and Ma, C.: Joint risk of rainfall and storm surges during typhoons in a coastal city of Hainan Island, China, Int. J. Env. Res. Pub. He., 15, 1377, https://doi.org/10.3390/ijerph15071377, 2018.
Xu, P., Wang, D., Wang, Y., Qiu, J., Singh, V. P., Ju, X., Zhang, A., Wu, J., and Zhang, C.: Time-varying copula and average annual reliability-based nonstationary hazard assessment of extreme rainfall events, J. Hydrol., 603, 126792, https://doi.org/10.1016/j.jhydrol.2021.126792, 2021.
Yan, B., Li, S., Wang, J., Ge, Z., and Zhang, L.: Socio-economic vulnerability of the megacity of Shanghai (China) to sea-level rise and associated storm surges, Reg. Environ Change., 16, 1443–1456, https://doi.org/10.1007/s10113-015-0878-y, 2016.
Yin, J., Lin, N., Yang, Y., Pringle, W. J., Tan, J., Westerink, J. J., and Yu, D.: Hazard Assessment for Typhoon-Induced Coastal Flooding and Inundation in Shanghai, China, J. Geophys. Res.-Oceans, 126, e2021JC017319, https://doi.org/10.1029/2021JC017319, 2021.
Zellou, B. and Rahali, H.: Assessment of the joint impact of extreme rainfall and storm surge on the risk of flooding in a coastal area, J. Hydrol., 569, 647–665, https://doi.org/10.1016/j.jhydrol.2018.12.028, 2019.
Zhang, W., Chang, W. J., Zhu, Z. C., and Hui, Z.: Landscape ecological risk assessment of Chinese coastal cities based on land use change, Appl. Geogr., 117, 102174, https://doi.org/10.1016/j.apgeog.2020.102174, 2020.
Zheng, F., Westra, S., and Sisson, S. A.: Quantifying the dependence between extreme rainfall and storm surge in the coastal zone, J. Hydrol., 505, 172–187, https://doi.org/10.1016/j.jhydrol.2013.09.054, 2013.
Zscheischler, J., Westra, S., Van Den Hurk, B. J., Seneviratne, S. I., Ward, P. J., and Pitman, A.: Future climate risk from compound events, Nat. Clim. Change, 8, 469–477, https://doi.org/10.1038/s41558-018-0156-3, 2018.