the Creative Commons Attribution 4.0 License.
the Creative Commons Attribution 4.0 License.
 | 06 Apr 2022
Environmental factors affecting wildfire-burned areas in southeastern France, 1970–2019
Christos Bountzouklis
Dennis M. Fox
Elena Di Bernardino
Forest fires burn an average of about 440 000 ha each year in southern Europe. These fires cause numerous casualties and deaths and destroy houses and other infrastructure. In order to elaborate on suitable firefighting strategies, complex interactions between human and environmental factors must be taken into account. In this study, we investigated the spatiotemporal evolution in the burned area over a 50-year period (1970–2019) and its interactions with topography (slope aspect and inclination) and vegetation type in southeastern France by exploiting the geographic information system (GIS) databases. Data were analyzed for two 25-year periods (1970–1994 and 1995–2019), since a new fire suppression policy was put into place after 1994, which focused on rapid extinction of fires in their early phase. In the last 25 years, the burned area decreased sharply, and the geographic distribution of fires also changed, especially in regions where large fires occur (Var administrative division). Elsewhere, even though forest fires remain frequent, the total extent of the burned area decreased substantially. Fire hotspots appear closer to built-up areas in the west, are randomly distributed in the east, and they almost completely disappear in the central region of the study area where there is a history of large fires. Slope orientation presents an increasingly important role in the second period; south-facing slopes are preferred the most by fire, and north-facing slopes are preferentially avoided. Even though the slope inclination is less affected by the new firefighting strategy, low slope inclinations are even more avoided after 1994. The greatest proportion of the burned area is strongly associated with the location of sclerophyllous vegetation clusters which exhibit highly fire prone and expand in area over time. Natural grasslands are also preferred by fire, while broadleaved, coniferous, and mixed forest are increasingly avoided by fire.
- Article
(12501 KB) - Full-text XML
- BibTeX
- EndNote


Forest fire is a common and important element of the Earth system (Bond and Keeley, 2005) that disturbs natural ecosystems and threatens human welfare and wellbeing throughout the globe. The Mediterranean climate is characterized by hot and dry summers which favor fire ignition and propagation. Consequently, wildfires are particularly active around the Mediterranean basin, and fires in the Mediterranean climate zones are considered to have a wide range of environmental and socioeconomic impacts (Miller et al., 2009; San-Miguel-Ayanz et al., 2013; Ganteaume et al., 2013).
Forest fires burn an average of 440 000 ha each year in the Euro–Mediterranean region, and this corresponds to about 85 % of the total burned area (BA) in Europe (San-Miguel-Ayanz et al., 2020). Of the five principal Euro–Mediterranean countries concerned by forest fires (France, Greece, Italy, Portugal, and Spain), France has the lowest amount of BA (San-Miguel-Ayanz et al., 2020). It also has the smallest potential burnable area, since only the southern Mediterranean fringe is affected by forest fires. France, Spain, Italy, and Greece all show similar trends in decreasing decadal BA in 1980–2010, and only Portugal experienced a progressive increase during this interval (San-Miguel-Ayanz et al., 2020). It should be noted that BA is generally decreasing despite increases in summer temperatures throughout the Euro–Mediterranean zone (Pokorná et al., 2018; Rodrigues et al., 2020), and this can be attributed to more efficient firefighting strategies (Fox et al., 2015; Turco et al., 2016; Ganteaume and Barbero, 2019).
Forest fire spatial distribution, size, and frequency are associated with several interacting factors that can be categorized into two main groups, namely (i) environmental and (ii) anthropogenic factors. Environmental factors generally include fuel characteristics (e.g., type and water content), topography (e.g., slope inclination, altitude, and aspect), and weather conditions (e.g., temperature, humidity, and wind speed); anthropogenic factors include the characteristics of the transitional zone between wildland vegetation and artificial areas in the wildland–urban interface (WUI).
Among the environmental characteristics, several studies provide evidence of spatial patterns relating forest fire probability and BA to topography (Dickson et al., 2006; Nunes et al., 2016; Padilla and Vega-García, 2011). Slope aspect affects incoming solar radiation and can determine fuel type, fuel moisture, and fuel density, all of which influence flammability (Holden et al., 2009). In addition, aspect influences the degree of ecological change related to fire (fire severity; Birch et al., 2015; Estes et al., 2017; Parks et al., 2018). In the Northern Hemisphere, south-facing slopes receive more solar radiation during the day than north-facing slopes, and this can enhance burn severity (Alexander et al., 2006; Oliveira et al., 2014a; Oliveras et al., 2009), but the trend is not systematic (Broncano and Retana, 2004). In addition to the impact on fire severity, other studies (Mouillot et al., 2003) have demonstrated that south-facing slopes in Corsica (France) can burn more frequently than other exposures. On the northern shore of the Mediterranean, south-facing slopes frequently have more housing than north-facing slopes, and this may contribute to a greater number of ignitions (Fox et al., 2018). Steep slopes tend to have higher spread rates and fire intensities (Capra et al., 2018); fatality rates are also greater compared to flat areas (Molina-Terrén et al., 2019). Csontos and Cseresnyés (2015) observed an exponential increase in upslope fire spread with increase in slope inclination, whereas downslope fire spread velocity was unaffected by slope angle and was similar to rates detected on flat terrain. Slope and altitude tend to be correlated, but their association with fires is often conflicting. For instance, Nunes et al. (2016) found that BA and ignition density were positively correlated with elevation and slope at a municipal scale in Portugal. Similarly, Elia et al. (2019) showed that the probability of fire ignition increased with elevation and slope in southern Italy. However, Narayanaraj and Wimberly (2012) observed a negative impact of elevation and slope inclination on human-caused fires.
The role of vegetation is complex and can be influenced by flammability (Michelaki et al., 2020; Molina et al., 2017) or spatial patterns of vegetation in the landscape (Curt et al., 2013). Vegetation continuity affects the fire propagation, which contributes to determining the BA (Duane et al., 2015; Fernandes et al., 2016). Vegetation type is another important factor to consider which has been explored in number of studies on fire selectivity indices (Bajocco and Ricotta, 2008; Barros and Pereira, 2014; Carmo et al., 2011; Moreira et al., 2009; Moreno et al., 2011; Nunes et al., 2005; Pereira et al., 2014). Overall, there is widespread agreement in the literature that shrublands are regarded as fire prone areas at multiple scales, including regional (Carmo et al., 2011; Moreno et al., 2011), national (Nunes et al., 2016, 2005), and continental (Moreira et al., 2011; Oliveira et al., 2014b; Pereira et al., 2014) scales. The probability of large fires is greater in dense shrublands than in forested ecosystems in the Mediterranean basin (Moreira et al., 2011; Ruffault and Mouillot, 2017). According to Mermoz et al. (2005), fire proneness of shrublands could be related to their recovery rate, since shrublands can regenerate faster and favor fuel accumulation in a short time, unlike forests which take longer to recover and expand. In addition, Oehler et al. (2012) point out that shrubs are considered a low suppressing priority by firefighters due to the low cost of restoration. In Europe, grasslands are also considered to be fire prone (Oliveira et al., 2014a). Cultivated areas are the least fire prone vegetation types because of their low combustibility and proximity to built-up land covers, which facilitates rapid fire detection and suppression (Moreira et al., 2011). Forested areas are found to be more fire prone than cultivated areas but less than shrublands (Moreira et al., 2011). More specifically, broadleaved forests are usually less prone to burning than coniferous species, which present a greater fire hazard (Moreira et al., 2009; Oliveira et al., 2014a).
Spatial relationships between fire occurrence and environmental factors evolve over time, due to changes in biomes and climate, but also as the result of fire management practices. Mapping and understanding these trends are crucial for evaluating the effectiveness of firefighting strategies and developing suitable policies (Bowman et al., 2017). There are numerous recent efforts that aim to analyze the spatial and temporal trends of fire activity at a global, national, and regional level. Otón et al. (2021) analyzed global trends of BA, based on the FireCCILT11 database, which is the longest available global BA dataset to date (1982–2018). At a national level, Catarino et al. (2020) investigated the trends of annual BA in Angola between 2001 and 2019 using MODIS products (MCD64A1) and associated the significant trends to land cover, ecological regions, and protected areas. Ganteaume and Barbero (2019) utilized a long-term (1957–2017) fire geodatabase to analyze the spatiotemporal variations in large fires in terms of frequency and BA in the French Mediterranean. Silva et al. (2019) used a satellite-derived BA dataset covering a 39-year period over the Iberian Peninsula to study BA trends and explore the relationship between areas with significant BA trends and fire danger. Urbieta et al. (2019) studied the spatiotemporal trends in Spain between 1980 and 2013 with regard to fire frequency, BA, and fire size and their relationship with changes in climate, land use and land cover, and fire suppression. Viedma et al. (2018) assessed the changing role of environmental and human-related factors in reference to fire activity in west-central Spain from 1979 to 2008. Fire suppression is an important factor that can influence fire spread. In France, as a response to the large fires that occurred between 1986 and 1990, a major change in the fire suppression strategy was established in the 1990s; it focused on the rapid suppression of fire ignitions, regardless of the weather conditions, in order to avoid fire propagation (Battesti, 1997). The fire policy had a significant impact on fire activity in southern France and weakened the fire–weather relationship (Ruffault and Mouillot, 2015). Despite the sharp decrease in BA after the full implementation of the fire management policy, its effectiveness on very large fires was not as successful as for smaller fires, since changes in BA that correspond to large return periods are not significant (Evin et al., 2018). Although many studies have focused on determining the relationships between fire behavior and driving factors (Mhawej et al., 2015), few studies have examined how fire suppression strategies impact the spatial distribution of BA. Identifying spatial patterns and the main driving forces that determine fire distribution provides useful information for fire and civil protection agencies, and it assists in the allocation of appropriate firefighting resources and in designing proper prevention actions (Moreira et al., 2011).
The objective of this study is to quantify changes in spatiotemporal BA patterns induced by a major shift in the fire suppression strategy initiated in the early 1990s in southeastern France. The time interval under study spans 5 decades (1970–2019) and includes the relation of BA with respect to environmental factors such as (a) topography (slope aspect and inclination) and (b) vegetation type. Although several studies have investigated the relationships between BA and environmental factors, very few have covered such a long time interval based on burn scar polygons, and they have not been explicitly related to changes in fire suppression methods.
2.1 Study area
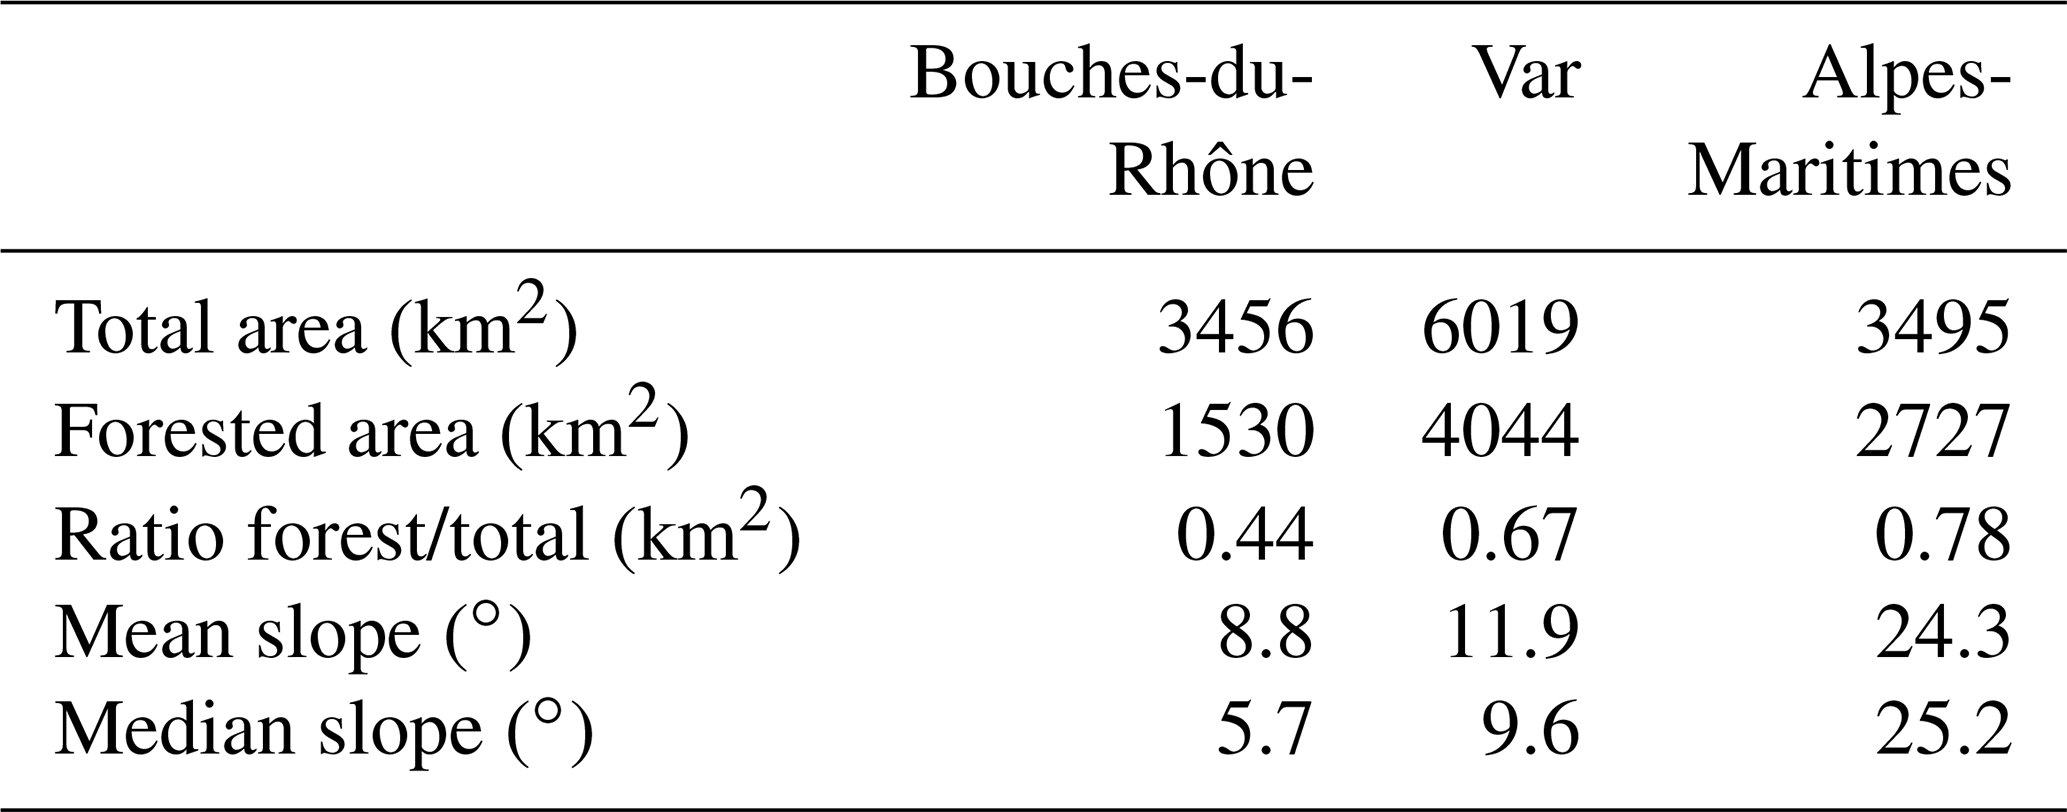
The study area is comprised of a subset of the three administrative division, with the greatest BA in continental France (only Corsica has a greater burned area), according to the French official forest fire database (http://promethee.com, last access: 15 February 2022) for Bouches-du-Rhône, Var, and Alpes-Maritimes (Table 1; Fig. 1). Areas within the administrative division limits that were excluded represent surfaces that cannot burn, such as marshlands in the westernmost part of Bouches-du-Rhône and the high alpine mineral surfaces located in the northern part of Alpes-Maritimes.
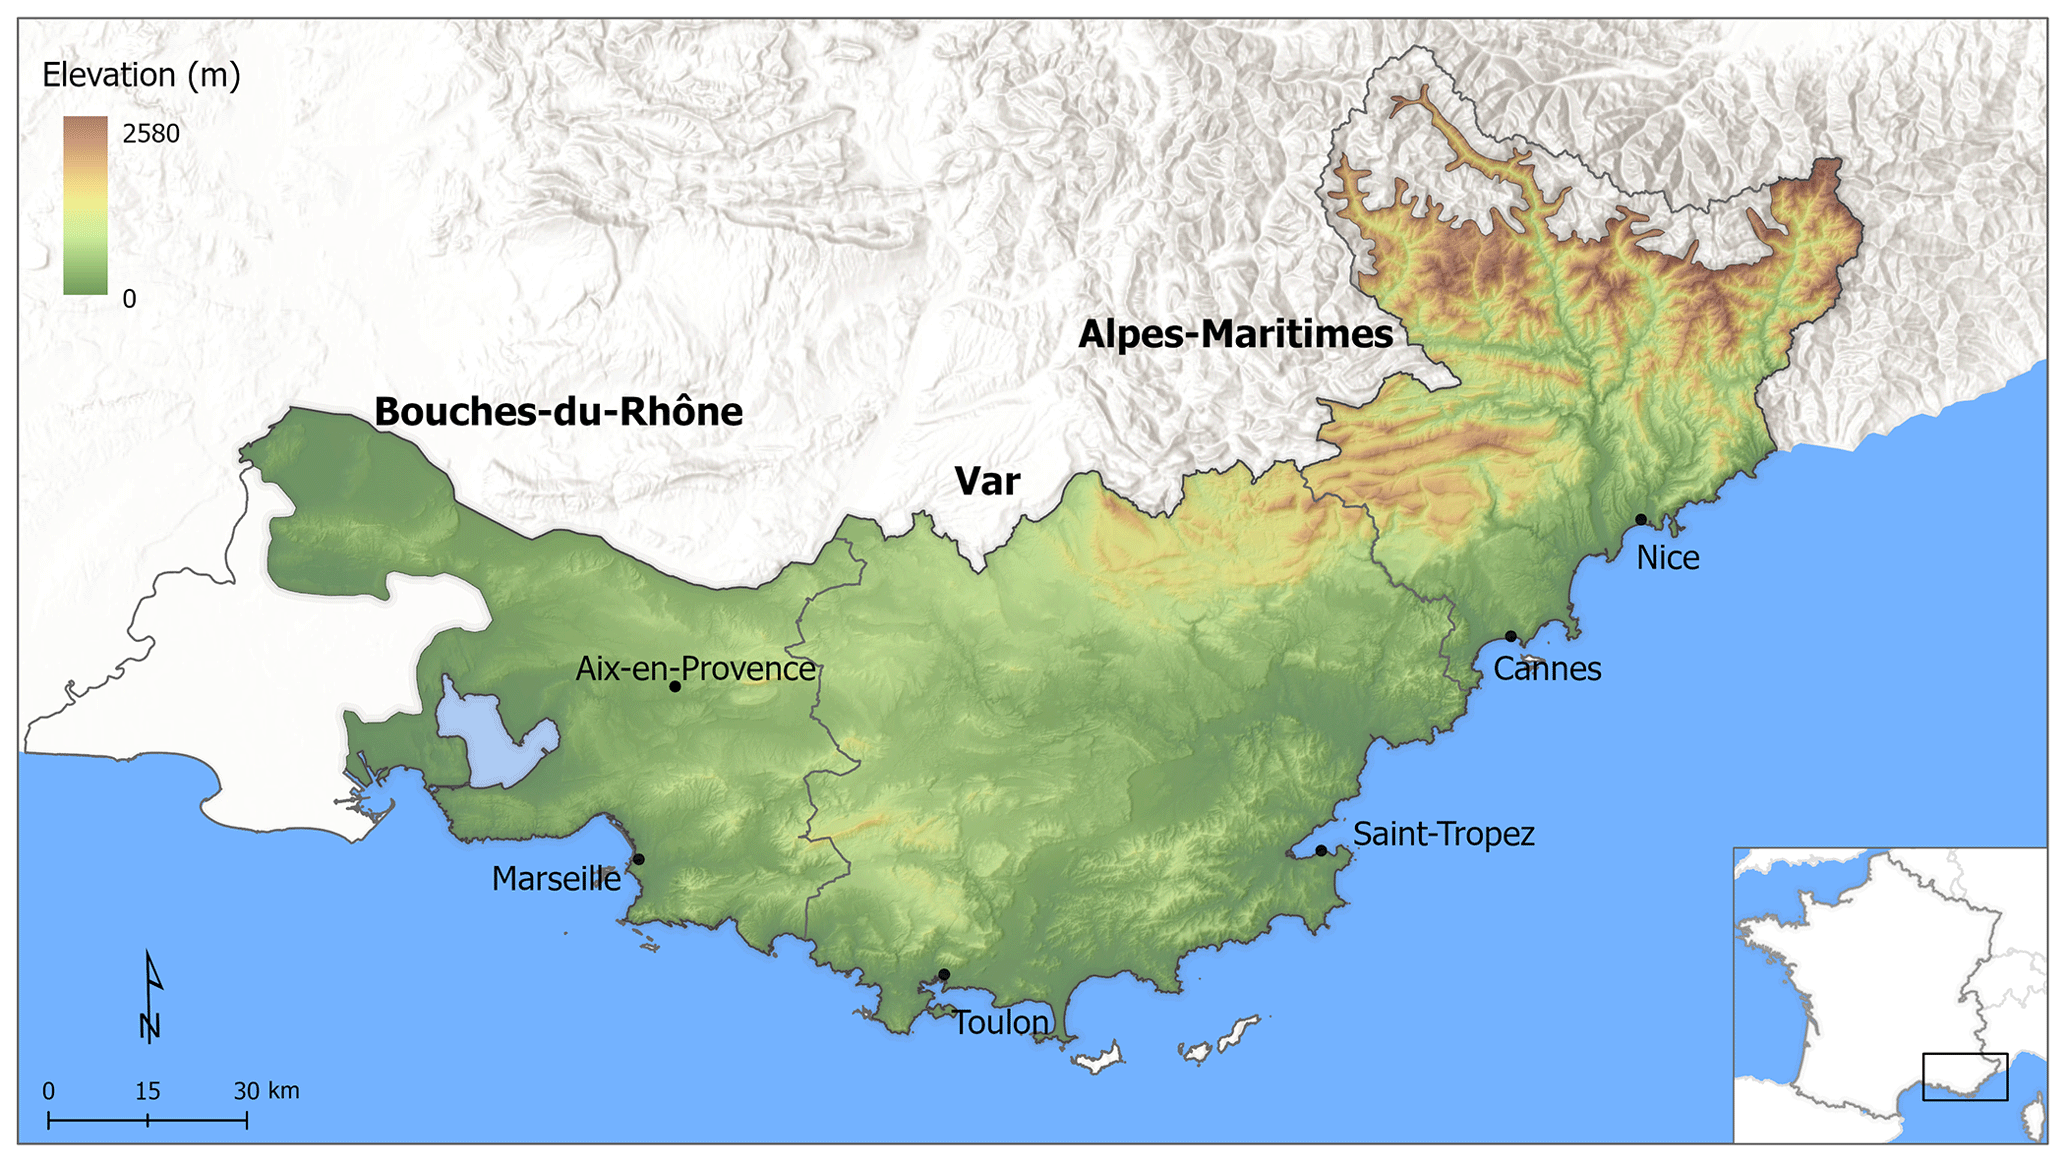
Figure 1Map of southeastern France showing the study area and the administrative division limits overlain on a 5 m digital elevation model.
Table 1Environmental characteristics of the study area per administrative division unit.
Topography varies from west to east (Fig. 1). The gentlest slopes are found in the west (Bouches-du-Rhône), and both the altitude and slope inclination increase eastwards. The steepest slope inclinations are found in the northeastern part of the study area where the French Alps are located. Topography influences the population distribution since much of the built area is concentrated along the coast or on shallow to intermediate slopes in the WUI. In the Bouches-du-Rhône area, the western portion of the administrative division has particularly low population densities due to the presence of the national park and wetlands mentioned above. Similarly, much of the population in the Alpes-Maritimes region is concentrated in the southern portion of the administrative division. The 2010 population densities of 388.8, 167.5, and 252.0 persons per square kilometer for the Bouches-du-Rhône, Var, and Alpes-Maritimes, respectively, are approximative as they simply divide population by total area without accounting for geographic distributions. The order, however, is accurate and shows the greatest population density for Bouche-du-Rhône, and the lowest for the Var. Based on the demographic and environmental characteristics described above, the westernmost section (Bouche-du-Rhône) of the study area has low potential for fire ignition and propagation, but this increases when moving towards the eastern half of administrative division. The central part of the study area (Var administrative division) has a high potential for fire ignition and the greatest potential for fire propagation, since it has a high forested area and a large continuous WUI area. Finally, the eastern section (Alpes-Maritimes administrative division) has high ignition and propagation potentials in the southern portion of the administrative division and low ignition/high propagation at higher altitudes.
2.2 Fire database
Forest fire research in France is frequently based on the national database for forest fires in France (http://promethee.com), where the fire location is defined as the municipality where fire ignition occurred. For this study, we used a fire geographic information systems (GIS) database provided by the National Forestry Office (Office National des Forêts – ONF) and the Delegation for the Protection of the Mediterranean Forest (Délégation à la Protection de la Forêt Méditerranéenne – DPFM). Even though the number of recorded fires is significantly lower than the Prométhée database, the total area burned is almost identical; the very small fires recorded in Prométhée are not all digitized in the ONF database. To the best of our knowledge, this is only the second use of this geodatabase after Ganteaume and Barbero (2019). The dataset includes more than 3000 digitized burn scar polygons for fires that occurred between 1970 and 2019. Due to the long temporal extent of the database, the accuracy and the methods used to define burn scars varied over time. In the 1970s, burn scars were mapped using field measurements with GPS devices, and the technique progressively evolved to integrate remote sensing data (satellite imagery and orthophotos). Although the description of how BA was defined is not recorded in the database, earlier polygons are clearly less accurate (coarse shapes with little detail) than burn scars after the advent of satellite imagery (Fig. 2).
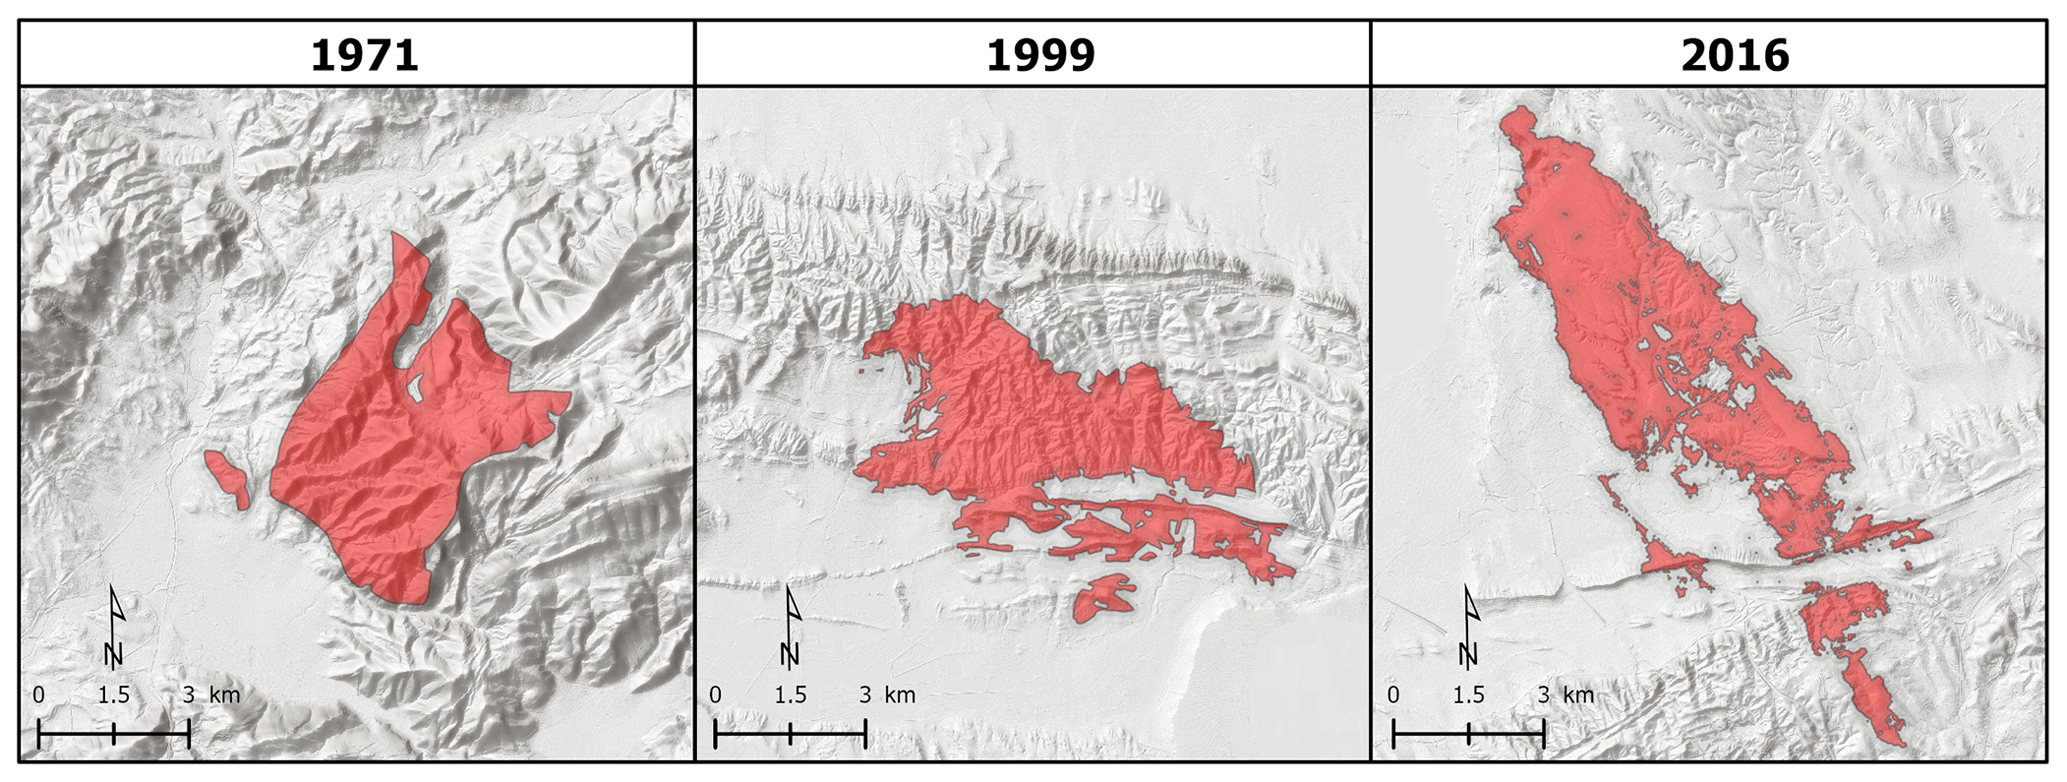
Figure 2Evolution of digitized burn scar accuracy over the past few decades.
2.3 Environmental variables
2.3.1 Topography
Burn scar polygons were rasterized to a 5 m spatial resolution and overlain on a 5 m digital elevation model (DEM) extracted from RGE ALTI©, the official National Geographic Institute (Institut Géographique National – IGN) database. The DEM was used to calculate the slope aspect and inclination. In the conversion of vector polygons to raster cells, BA polygons smaller than half the cell size (25 m2) were not defined as being burned during rasterization, so BA for the slope aspect and inclination analyses represent approximately 96 % of actual BA in the study area. The aspect was divided into the following five categories: flat, north, east, south, and west. The inclination was divided into the following five categories: 0–10, 10–20, 20–30, 30–40, and > 40∘.
2.3.2 Vegetation type
For the computation of the forested BA and the identification of fire prone vegetation categories, GIS forest layers were extracted from the European CORINE Land Cover (CLC) database. The database includes five reference years of 1990, 2000, 2006, 2012, and 2018. In addition to the CLC reference layers, it was considered best to backcast two additional forest cover layers for 1972 and 1980 to account for any transitions between forested and non-forested surfaces for the 2 decades preceding the CLC database. The methodology followed for the projection process is addressed in the section on forest layer projection. The fire geodatabase was then matched with the CLC layer that was chronologically closest to the equivalent fire period (see Table 2).
Table 2CORINE Land Cover layers and their respective fire periods.
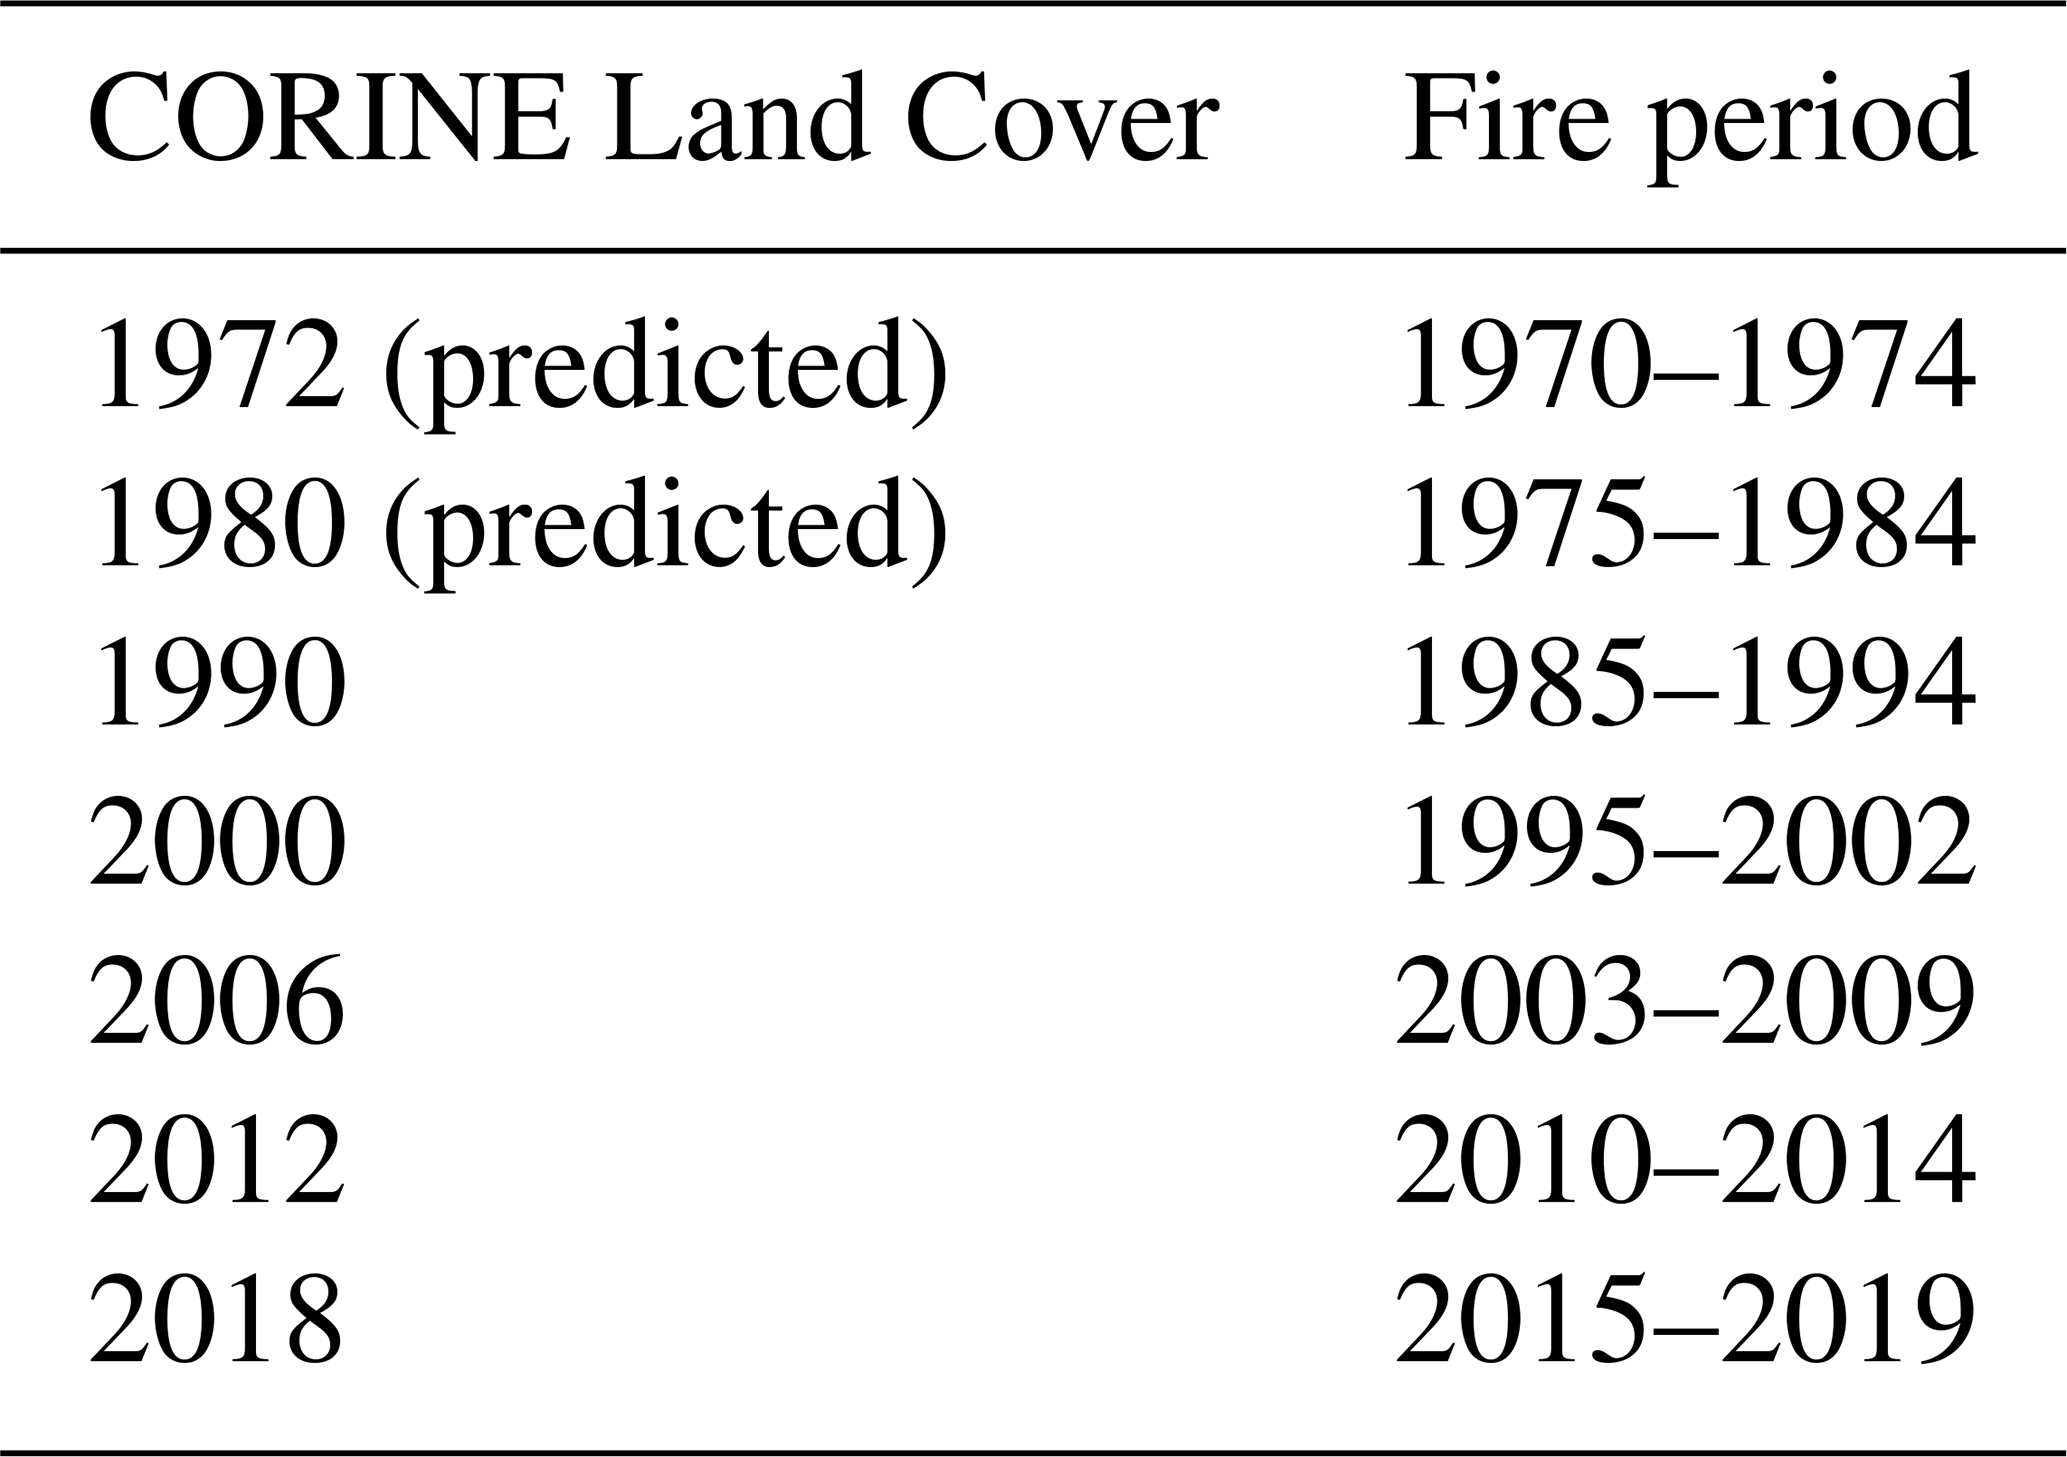
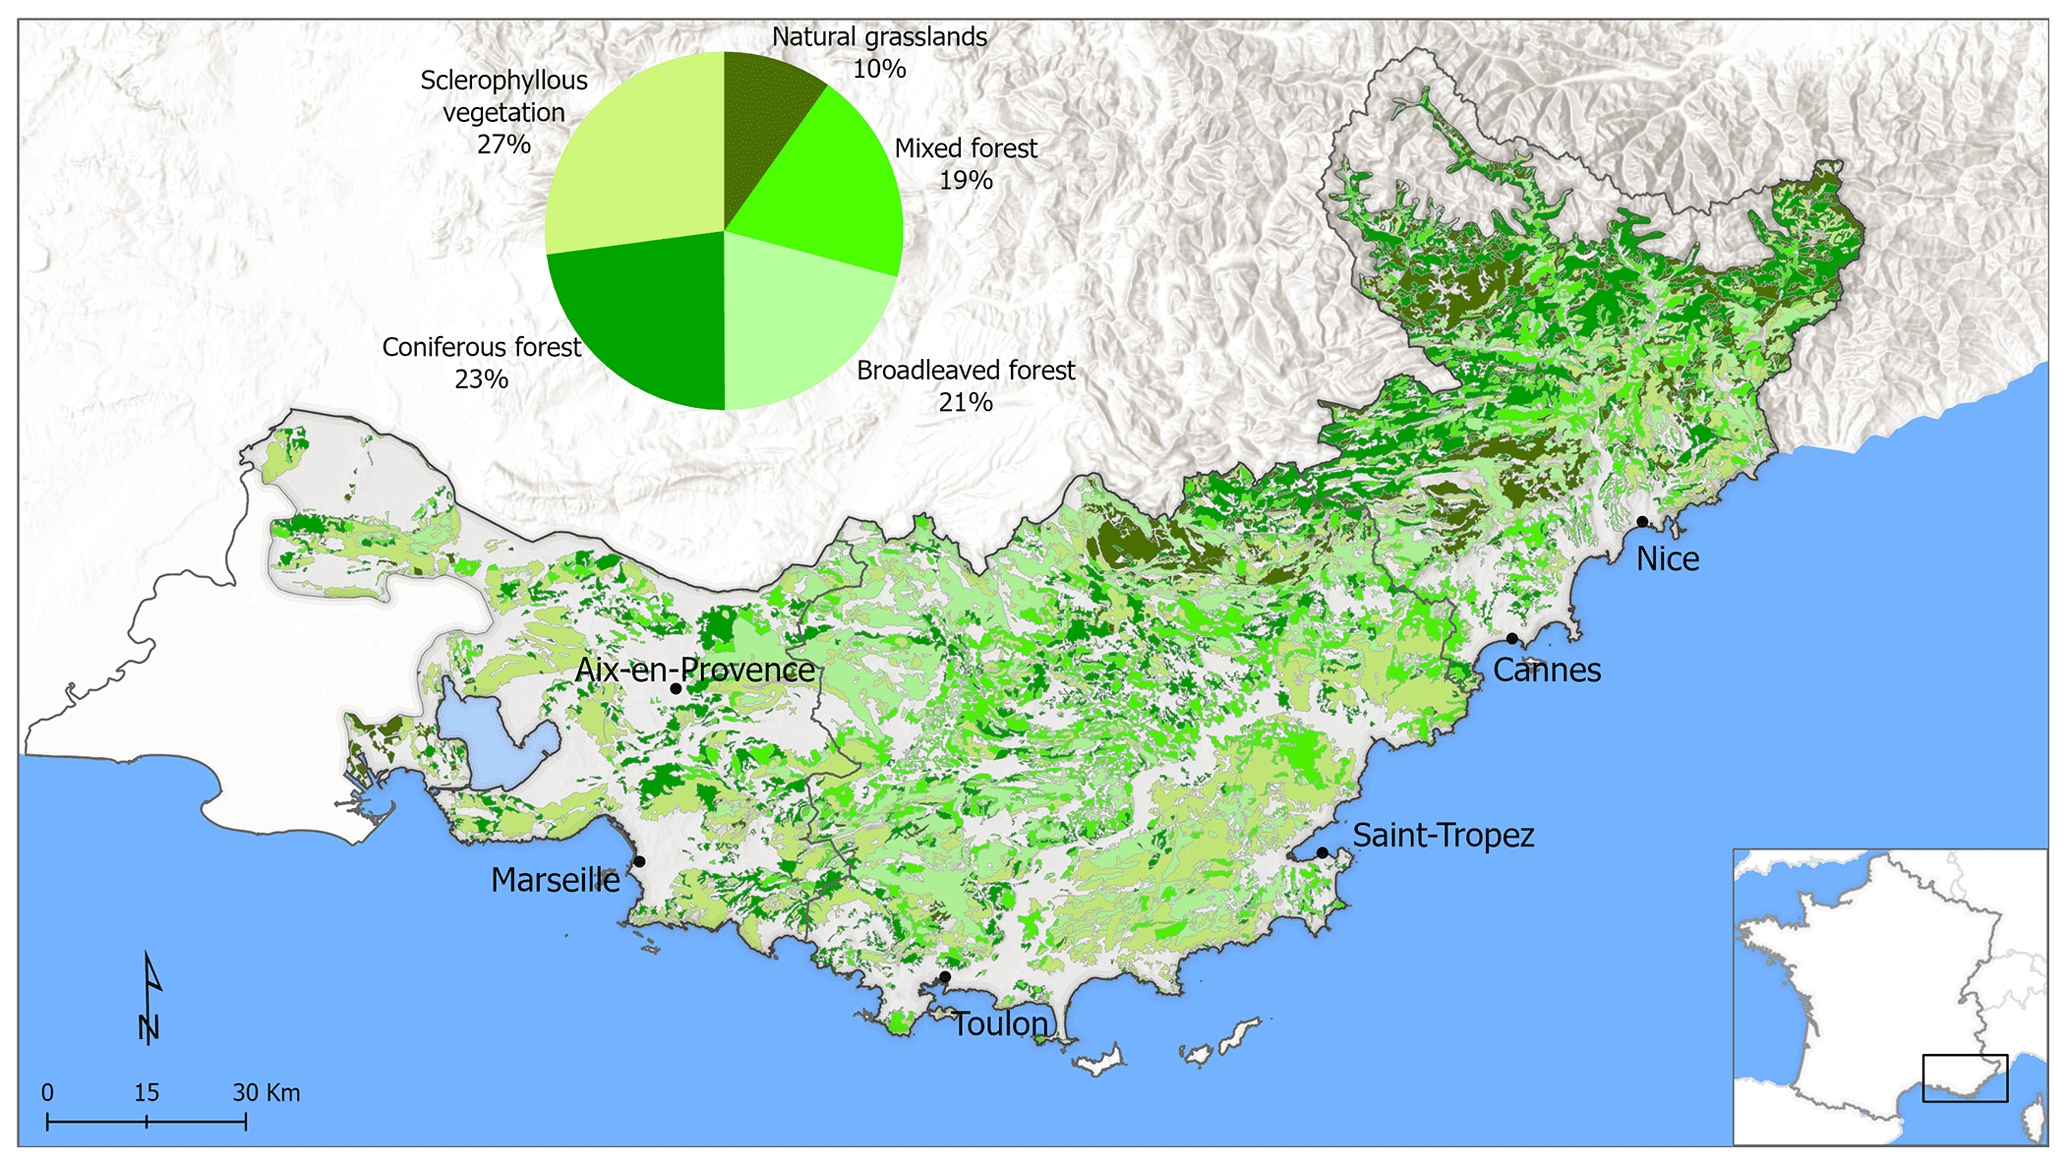
Figure 3Distribution of vegetation types based on CLC 2018.
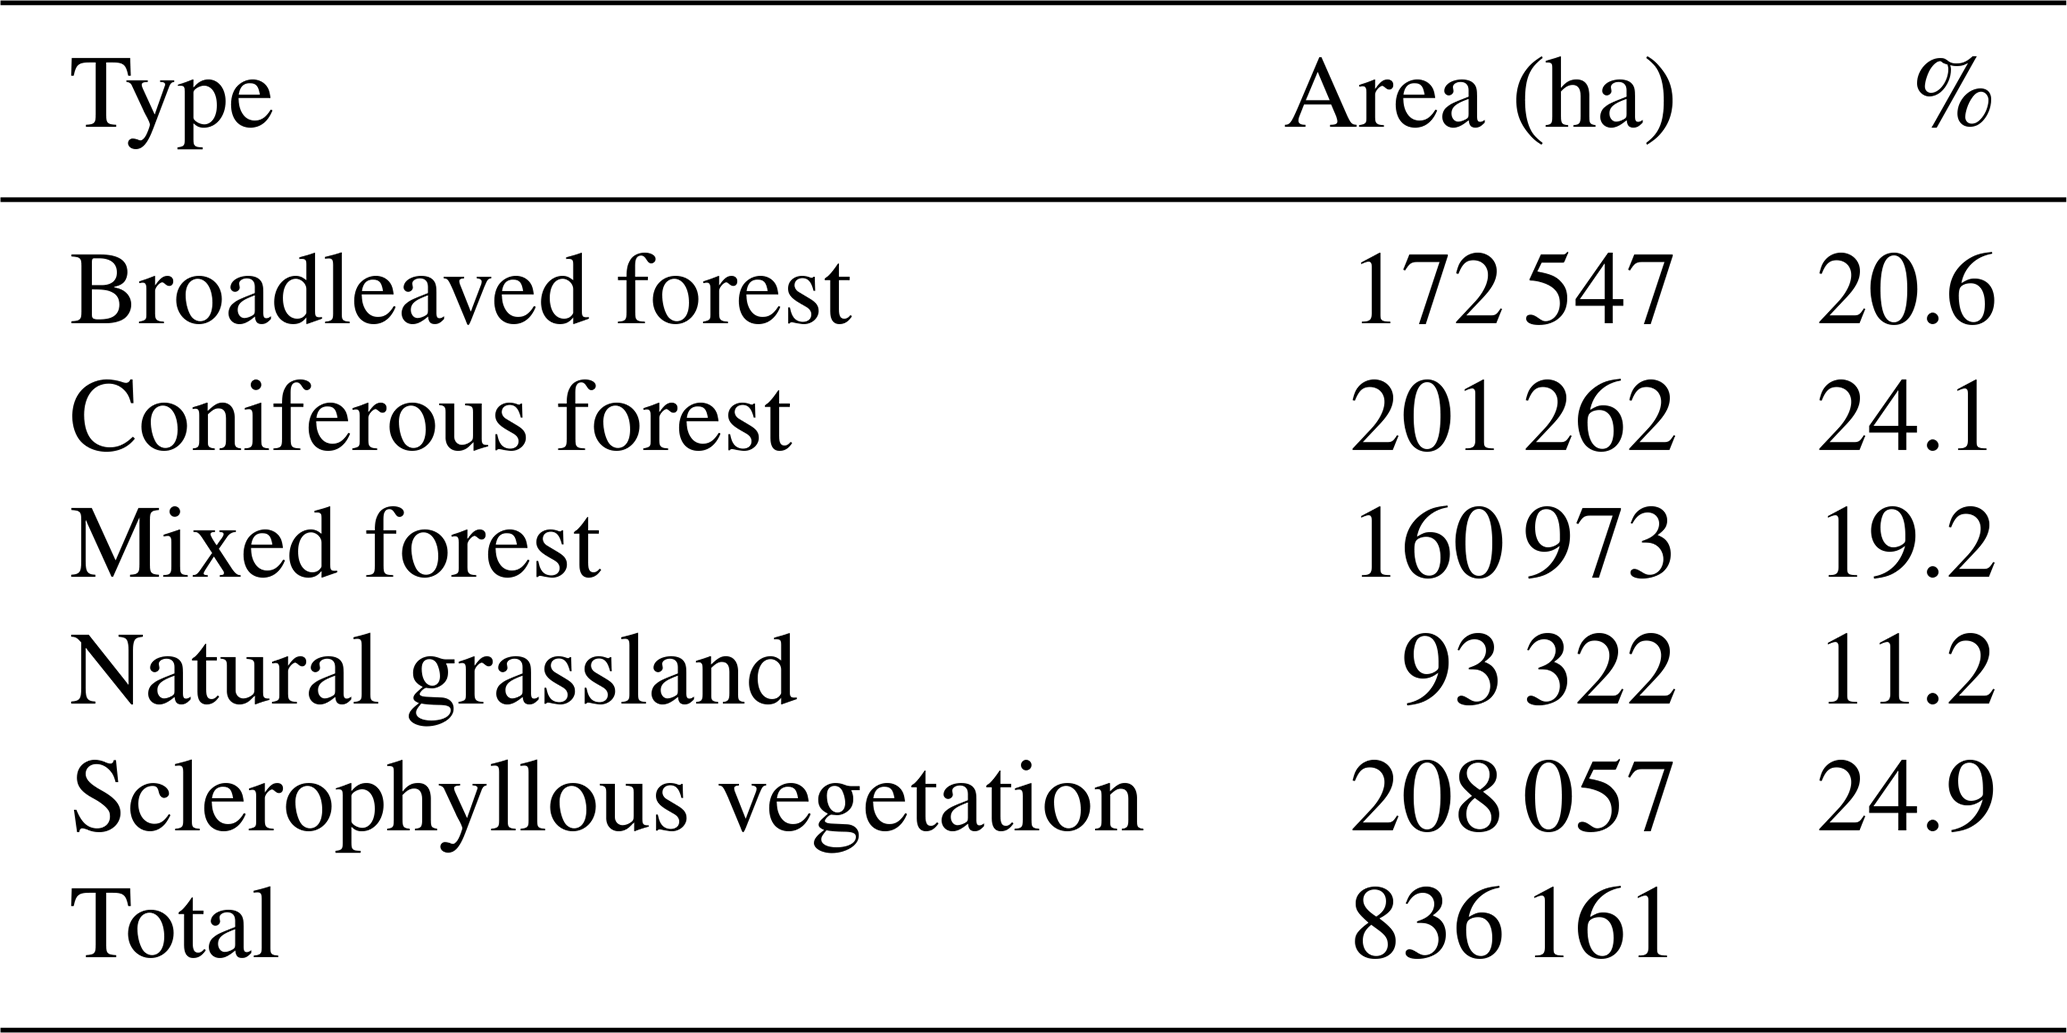
The vegetation types that were used in the current study follow the CLC nomenclature, i.e., broadleaved forest, coniferous forest, mixed forest, natural grasslands, and sclerophyllous vegetation (Fig. 3; Table 3). Although natural grasslands and sclerophyllous vegetation are not forests, the categories will be referred to collectively as wildland or forested areas indiscriminately for the sake of brevity.
Table 3Average and relative forested areas according to vegetation type between 1970 to 2019.
Forest layer projection
Although most urban growth occurred on agricultural land (Roy et al., 2015) and forest cover changed little, the Land Change Modeler (LCM) module of TerrSet (Eastman, 2020) was used to predict vegetation cover in 1972 and 1980. The LCM is programmed to forecast change from an earlier to a later date, so going back in time (a backcast) required the temporal inversion of the filenames for the 1990 (renamed to 2000) and 2000 (renamed to 1990) CLC layers; in this way, the land cover was simulated for 1980 and 1972. Land cover categories were simplified from the original CLC categories to the following: built, broadleaved forest (broad), coniferous forest (conifer), mixed forest, natural grasslands (grass), sclerophyllous vegetation (bush), other, and water. Only transitions greater than 0.05 % of the landscape (14.3 km2) were modeled, and these included the following: bush → grass, bush → other, built → other, grass → other, broad → bush, other → grass, bush → conifer, other → bush, bush → broad, bush → mixed, mixed → bush, other → conifer, mixed → broad, mixed → other, other → broad, other → mixed, broad → other, grass → bush, mixed → conifer, built → mixed, built → bush, and conifer → mixed. Note that these are the inverse of historical trends, so the built–mixed transition actually backcasts the historical transition of mixed forest to built area. The explanatory variables used to predict land cover change were the following: altitude, slope inclination, distance from built area, distance from broad, distance from conifer, distance from mixed, distance from grass, distance from bush, distance from other, and distance from water. According to Eastman (2020), Cramer's V values of ≥ 0.15 for explanatory variables are useful and should be kept in the model, and all explanatory variables used here met this criterion. Accuracy rates to model transitions ranged from 65 % to 90 %, with mean and median values of 78 % and 80 %, respectively.
2.4 Fire history 1970–2019
A 500 × 500 m grid (25 ha) was created and overlain on the study area in order to measure the percentage of each cell that was burned each year between 1970 and 2019 (50 years) (Fig. 4). These percentage values were then summed to produce the cumulative percentage of BA for each cell. This approach facilitated the effort to identify clusters of cells/areas that have been burned multiple times and to give an overview of the spatial distribution of BA in the region. To better illustrate the impact of suppression strategies on fire occurrence, the method was applied to two 25-year subsets of the fire dataset (i) 1970–1994, and (ii) 1995–2019 as the mid-point break corresponds to the major shift in firefighting strategy and allocated resources in France.
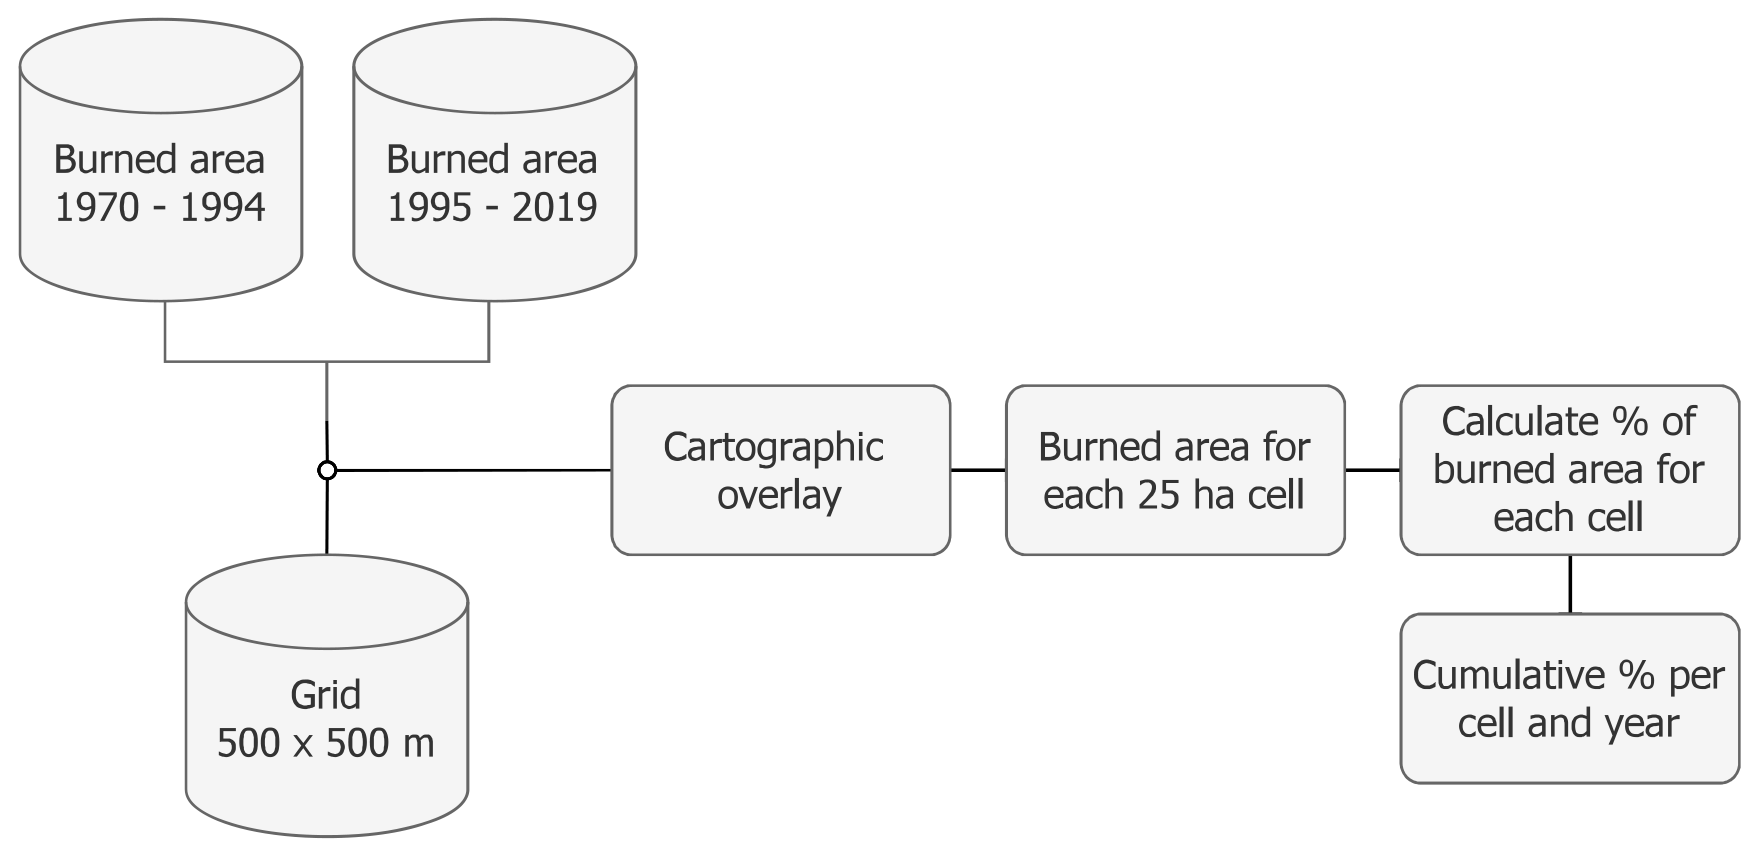
Figure 4Flowchart depicting the processing steps for generating the cumulative percentage of forested burned area per cell.
2.5 Spatiotemporal analysis – contextual Mann–Kendall
In order to identify spatiotemporal trends within the entire time period (1970–2019), a modified version of the Mann–Kendall test was applied (Kendall, 1975; Mann, 1945). The Mann–Kendall test is a non-parametric test which is used to statistically assess monotonic upward or downward trends for a variable through time. In this study, we used the contextual Mann–Kendall (CMK) test which was introduced by Neeti and Eastman (2011), and it differs from the original test by evaluating trends at a 3 × 3 cell neighborhood for each cell in a grid. The specific method has been used to assess trends in BA with satisfactory outcomes (Silva et al., 2019; Catarino et al., 2020; Otón et al., 2021). The CMK method was devised from Tobler's first law of geography, which states that “everything is related to everything else, but near things are more related than distant things” (Tobler, 1970). By assuming that trends show signs of spatial autocorrelation between adjacent cells, the CMK test allows for greater confidence in identifying the presence of a trend (Neeti and Eastman, 2011). However, it requires observations to be a set of independent random variables and, thus, applying the test on data that are temporally autocorrelated may lead to a false rejection of the null hypothesis of no trend (Douglas et al., 2000). To assess the temporal autocorrelation in our dataset, we applied the Durbin–Watson test (Durbin and Watson, 1950), and to remove it, the prewhitening procedure by Wang and Swail (2001), which preserves the same temporal trend but without the autocorrelation, was used (Fig. 5).

Figure 5Flowchart depicting the processing steps for estimating the trend significance using the contextual Mann–Kendall method.
2.6 Fire selectivity (Jacobs' index)
In order to examine the fire proneness of the environmental variables considered in this study (slope aspect and inclination and vegetation type), a resource selection index was calculated for each 25-year interval (Fig. 7). Resource selection is based primarily on wildlife ecology (Manly et al., 2002), but its use has been extended to include fire selectivity (Bajocco and Ricotta, 2008; Barros and Pereira, 2014; Moreira et al., 2001, 2009; Moreno et al., 2011; Nunes et al., 2005; Oliveira et al., 2014a). The rationale behind fire selectivity is that fires burn selectively when the proportion of a class (e.g., type of vegetation) within a burned area is higher than the proportion of the available area to burn. The opposite applies when a specific class of variable is burned proportionally less than the available area (fire avoidance).
In our work, we used Jacobs' selectivity index (Jacobs, 1974) which is defined as follows:
r stands for the proportion of resource class i used by fire, and p is the proportion of resource class i available to fire. Jacobs' index values range between −1 and 1. Positive values indicate fire preference, and negative values indicate fire avoidance. The index was calculated for each class of the environmental factors (described in the subsequent sections) for each year. Similar to other studies (Barros and Pereira, 2014; Nunes et al., 2005), the available area for each fire to burn is defined as twice the amount of area burned by each fire (Fig. 6).
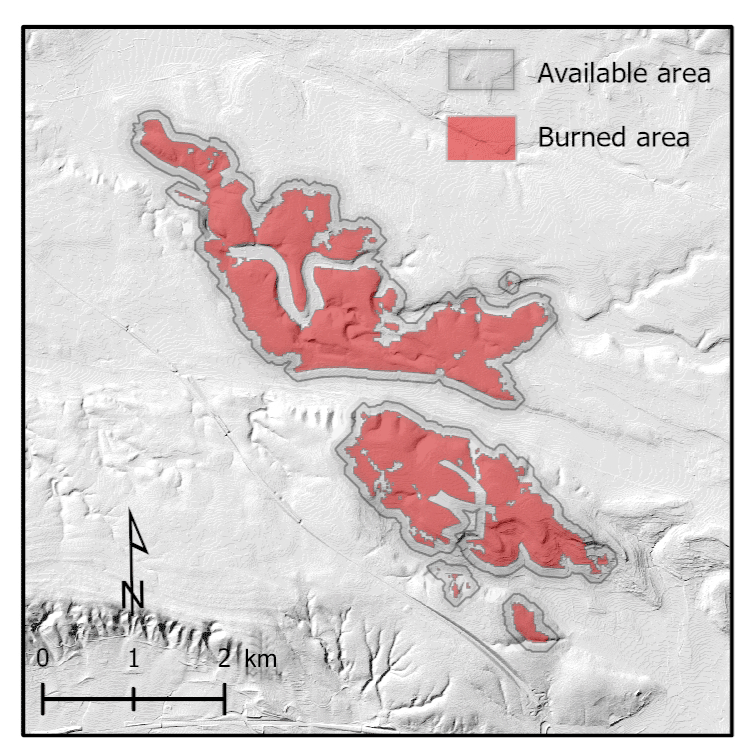
Figure 6Illustration of the burned area (r) and available area (p) to be used by a fire. The available area (the sum of the burned area plus buffer zone) around each fire corresponds to twice the burned area.
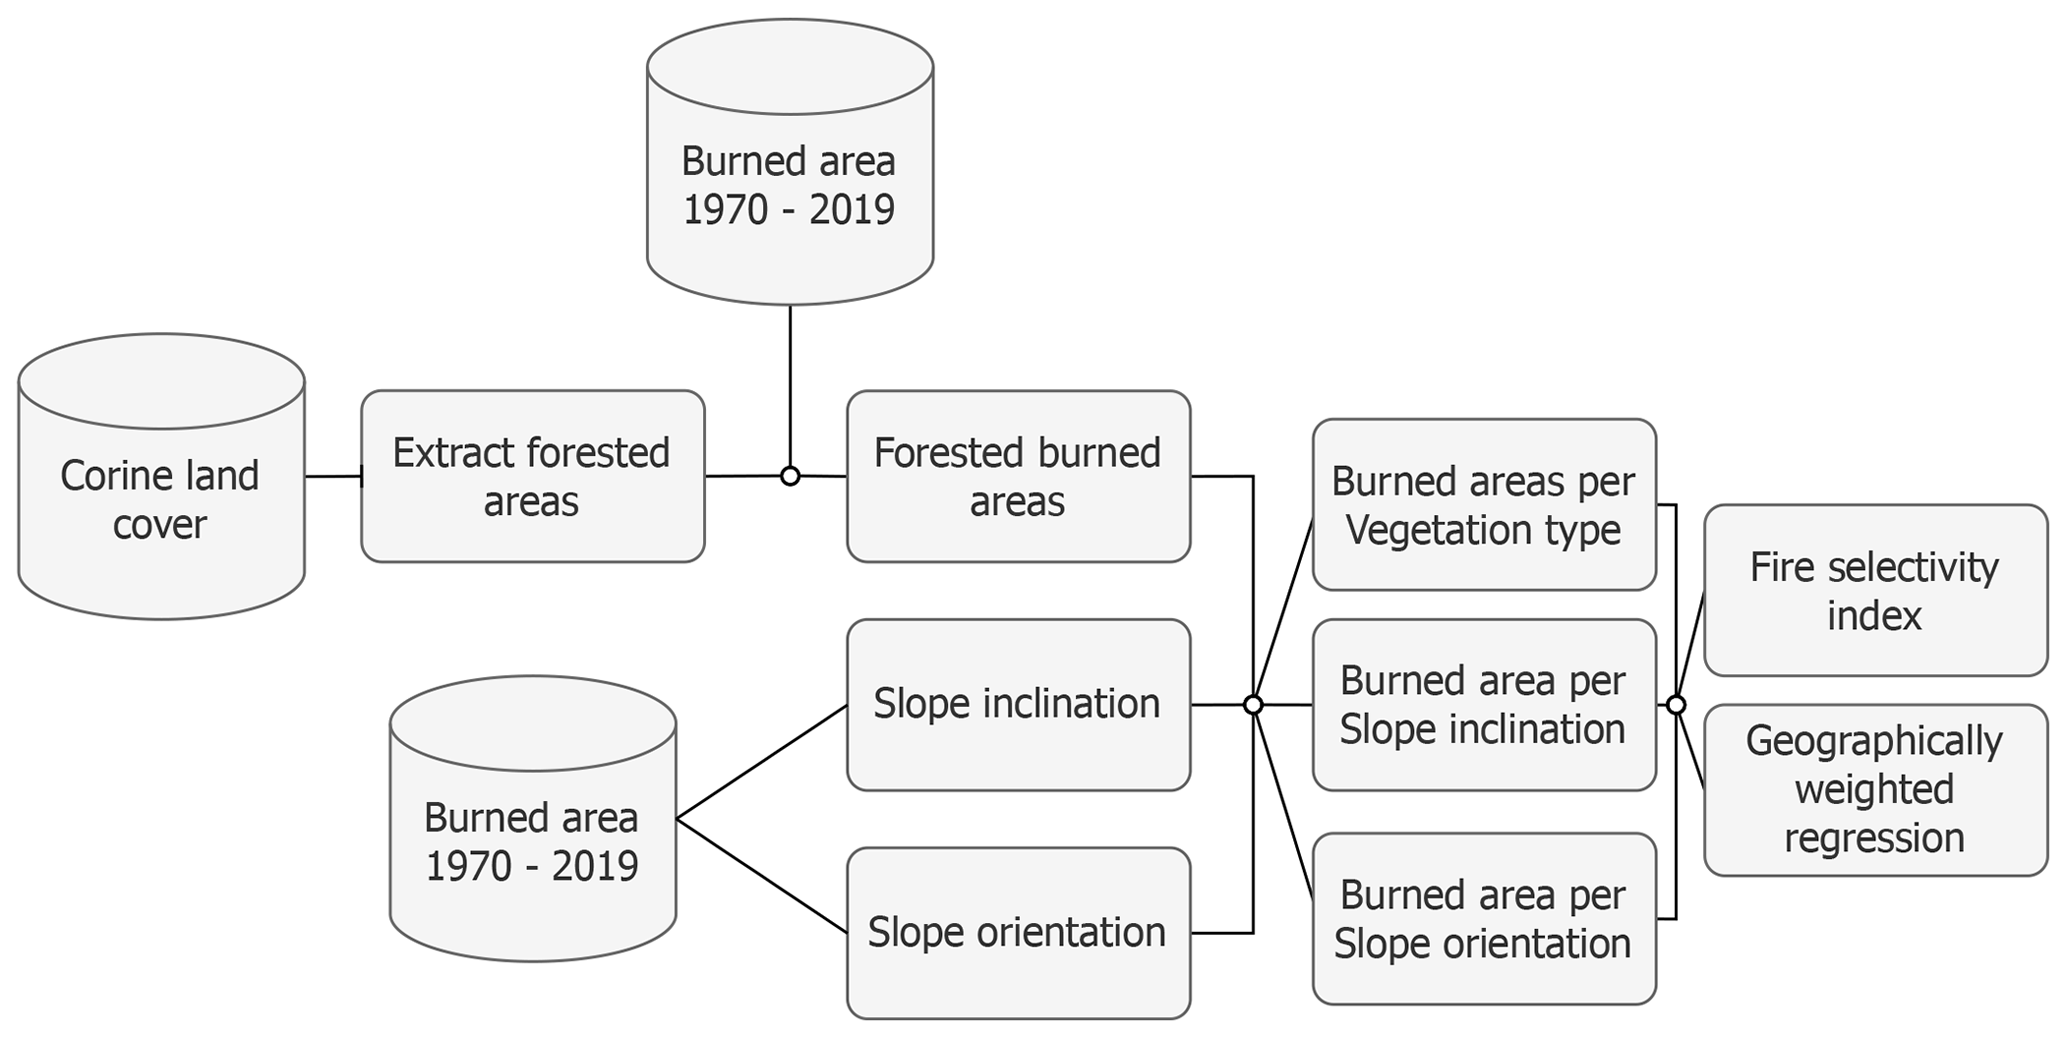
Figure 7Flowchart depicting the processing steps and data used to relate the burned area to the vegetation type, slope inclination, and orientation.
2.7 Geographically weighted regression
A geographically weighted regression (GWR) was used to quantify the impact of the change in the firefighting strategy on the relative importance of the environmental factors. GWR is applied in wide range of interdisciplinary fields, including forest fires (Koutsias et al., 2010; Martínez-Fernández et al., 2013; Nunes et al., 2016; Rodrigues et al., 2016; Kolanek et al., 2021). GWR is a local non-parametric regression method (Fotheringham et al., 2003) that allows the relationships between dependent and explanatory variables to vary over space. The basic form of a GWR model, provided by Fotheringham et al. (1998, 2003) is defined as follows:
where yi is the dependent variable at location i, βi0 is the intercept parameter at location i,j is the number of explanatory variables, biz is the local regression coefficient for the zth explanatory variable at location i, xiz represents the zth explanatory variable at location i, and εi denotes the random error at location i. Since GWR allows coefficients to be spatially heterogeneous, a sub-model for the location of each observation is created that considers only a subsample of the total observations, where observations in closer proximity have a greater effect in determining the local set of coefficients than observations located at further distances (Fotheringham et al., 1998). This neighborhood is called a kernel, and the maximum distance from a regression point at a location i is defined as the bandwidth. The bandwidth is an important parameter than can be defined in the following two different ways: (i) fixed bandwidth (fixed distance for each regression point) and (ii) adaptive bandwidth (fixed number of nearest neighbors for each regression point). The first type of neighborhood is more appropriate when data are regularly distributed across space, whereas the second type is more appropriate for data that form spatial clusters. In the current work, the adaptive bandwidth approach was utilized to fit the GWR model which was optimized based on the value of Akaike information criterion (Akaike, 1974). For each of the three environmental variables described above, a univariate GWR model was used to explore the relationship with the dependent variable (percent of BA) for the two 25-year periods of (i) 1970–1994 and (ii) 1995–2019.
Results presented below will first describe the fire history for the entire time interval (1970–2019) and then analyze the spatiotemporal evolution of the BA split according to the two 25-year periods. Finally, it will explore the relationship of BA to topography (slope aspect and inclination) and vegetation type. Factor-specific results will be discussed, as they are presented in the following sections, while broader considerations will be explained in the Sect. 4.
3.1 Fire history
In total, 3382 fires burned 296 820 ha in 1970–2019. The mean and median areas of BA are 87.7 and 4.2 ha, respectively; these values reflect the typical positively skewed distribution of fire size, where the vast majority of fires are small, and a few fires, accounting for most of the burned area, are very large. The number of fires equal to or greater than 100, 500, and 1000 ha is 378 (11.2 %), 123 (3.6 %), and 65 (1.9 %), respectively. Of the total number of fires, 2424 (88.2 %) occurred in forested landscapes, and these burned an area of 263 645 ha (88.8 % of total BA).
Mean and median values for forested landscape fires are slightly greater than for all fires at 111.7 and 6.5 ha, respectively. The number of fires equal to or greater than 100, 500, and 1,000 ha is 314 (13.0 %), 106 (4.4 %), and 60 (2.5 %), respectively. As stated above, the results presented below will deal exclusively with the forested BA that was occupied by one of the vegetation types mentioned in Sect. 2.3.2, since the trends with respect to vegetation and topography for all fires and forested landscapes are nearly identical.
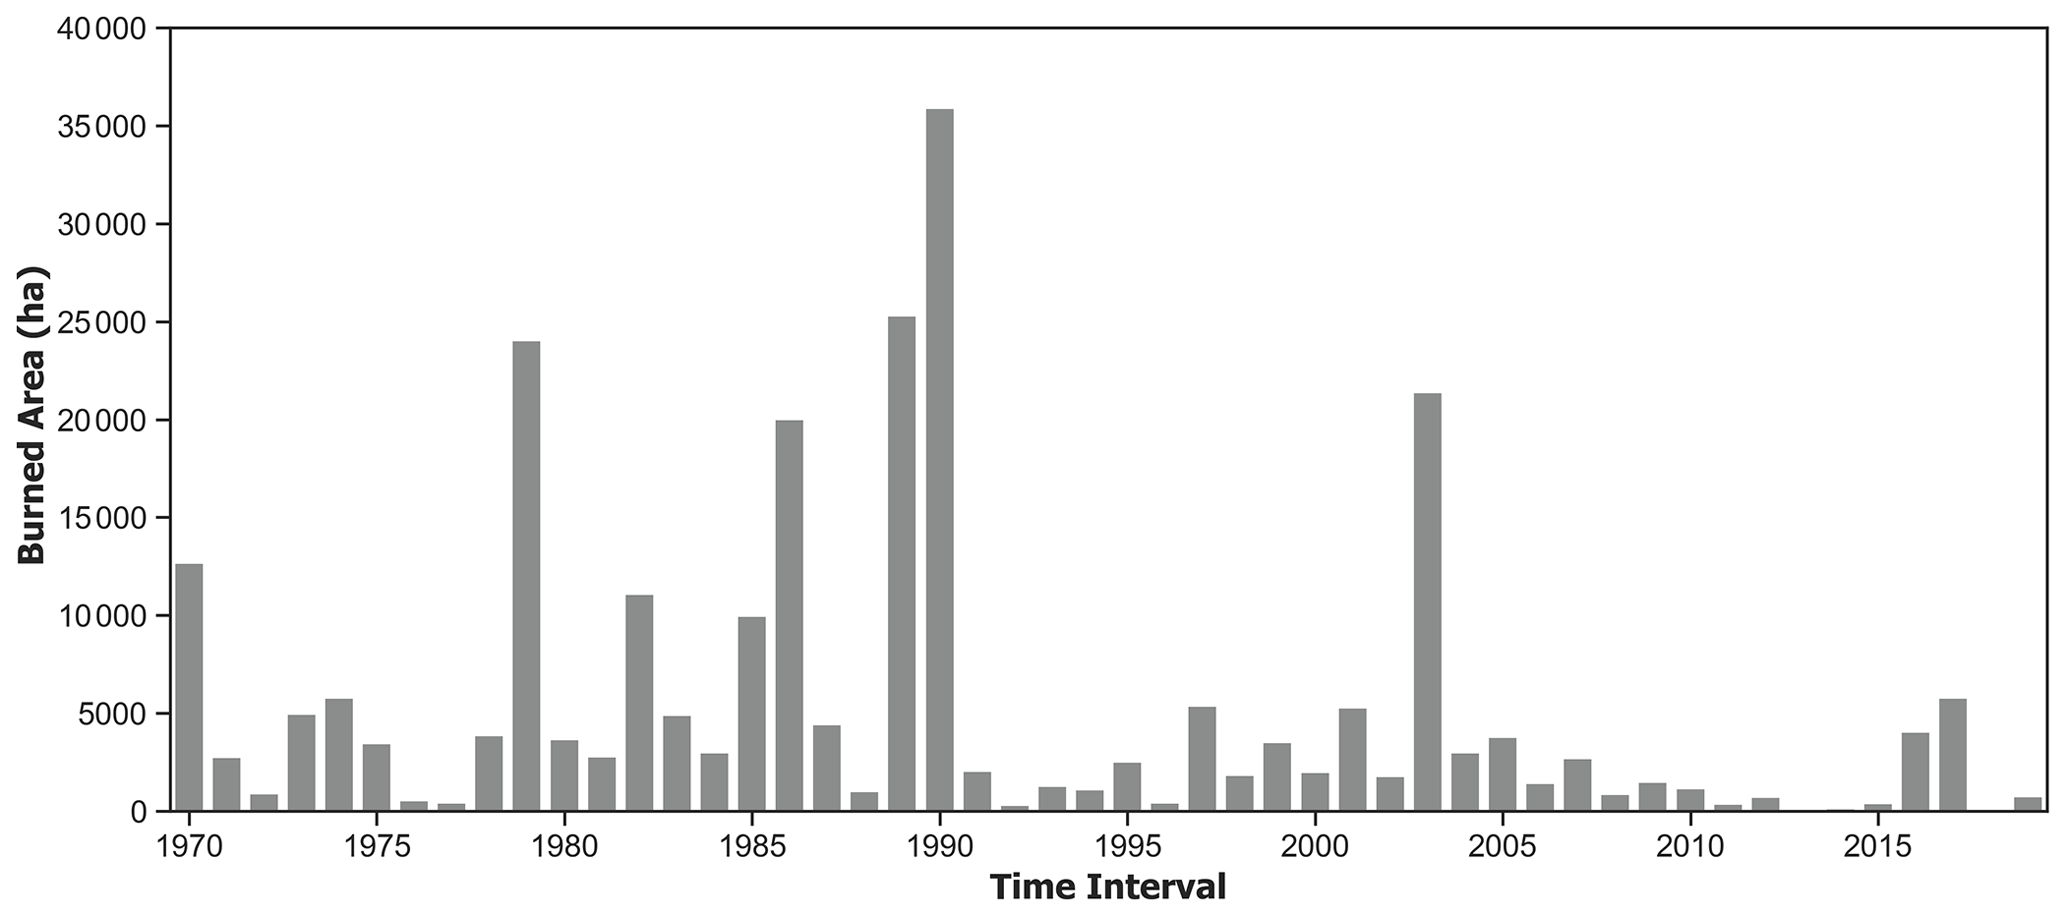
Annual forested BA varies significantly from year to year (Fig. 8), although there are clear differences between the first 2 decades (1970–1990) and the last 3 decades (1991–2019). The mean and median annual BA are 5156.4 and 2746.1 ha, respectively. Several big fires occurred in the 1980s, followed by a sharp decrease in the early 1990s. Similar to the rest of southern Mediterranean Europe, most of the forested BA is related to a small number of large fires (Turco et al., 2016). Only 5 years (1979, 1986, 1989, 1990, and 2003) of the 50-year record account for almost half of the total forested BA (126 700 ha). The forested BA for each of these years surpasses 20 000 ha, attaining nearly 36 000 ha in 1989. Of the 5 years cited above, only 2003 is found in the second 25-year interval. As described by Fox et al. (2015) for the Alpes-Maritimes, the decrease in BA corresponds to an improvement in firefighting strategy, since the latter period had some of the hottest summers on record; the same explanation appears to hold for the neighboring administrative divisions studied here.
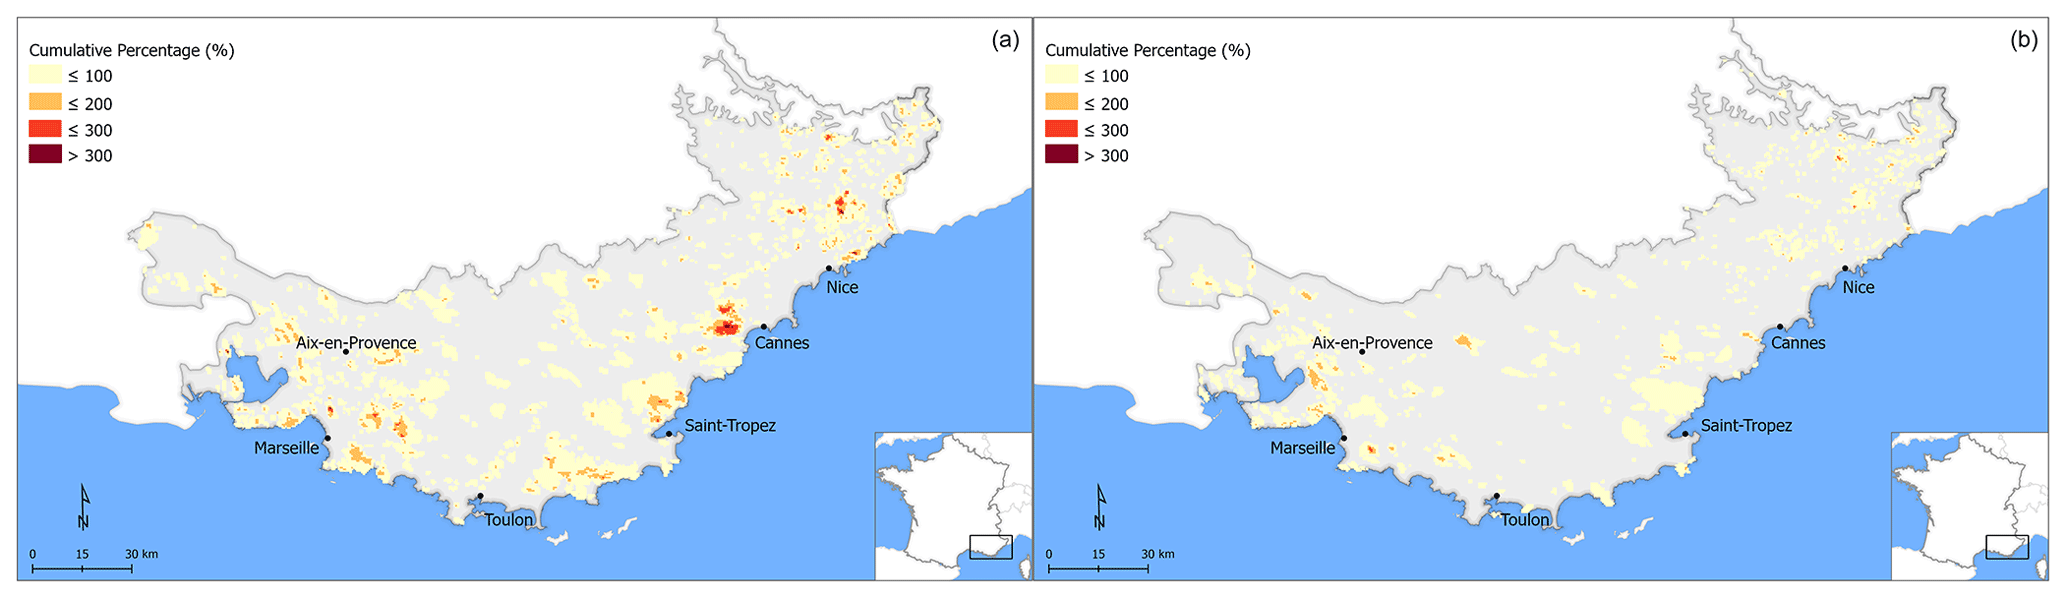
Figure 9Cumulative percentage of the forested burned areas in the 1970–1994 interval (a) and in the 1995–2019 interval (b) over a 500 × 500 m grid.
Figure 9 maps the cumulative percentage area burned inside each 25 ha cell for 1970–1994 and 1995–2019, respectively. Generally, most fires occur in the WUI north of the large coastal cities since densely developed areas have too little vegetation to burn, and relatively remote areas have too few ignition sources. Although we did not treat wind direction or speed, BA shapes in both periods tend to align themselves with known wind patterns in the region. They have a NW–SE orientation throughout most of the western and central sections (Bouches-du-Rhône and Var administrative divisions) but show little preferential orientation in the eastern administrative division of Alpes-Maritimes where wind speeds are lower than the mistral winds in the Rhône valley. There is a clear difference between the two periods, with the second one having significantly fewer burned cells which are also slightly more spatially dispersed. In addition, cumulative percentage values are noticeably lower, with a small number of cells (302) exceeding 100 % and very few (9) reaching 200 %. All major hotspots disappear in the second interval, apart from some located mainly in the western area of study zone near Aix-Marseille.
The largest patches in both intervals are found in the central part of the study zone in the Var administrative division, which combines continuous forest cover and a lower population density that is distributed more evenly throughout the administrative division. The two largest continuous BA clusters are found here, with one being north of Saint-Tropez and one east of Toulon. In the 1995–2019 time interval, the first cluster shrunk, whereas the second one completely disappeared. In the western section of the study area (Bouches-du-Rhône), burned patches are located in constrained areas between densely built zones (Aix-en-Provence and Marseille), with several cells displaying high fire recurrence. In the eastern section of the study area (Alpes-Maritimes), where population is particularly dense along the coast (Cannes–Nice), BA cells are concentrated inland along the periphery of the coastal built-up area. A major hotspot with the highest cumulative percentage burned area is found just west of Cannes, and this patch almost disappears in the second period. In comparison to the rest of the study area, patches in the eastern administrative division of the Alpes-Maritimes are smaller and more numerous, with high to very high recurrence, even at higher altitudes.
Spatiotemporal analysis
Results of the CMK method depict areas of increasing and decreasing trends in terms of mean annual BA over the study area (Fig. 10). Positive Z scores (colored in red) correspond to areas with increasing trends, and negative Z scores (colored in blue) correspond to areas with decreasing trends. Overall, a general decreasing trend of BA throughout most of the study area can be observed, with approximately 60 % of the cells corresponding to a negative value. The largest clusters of negative Z scores are located predominately in the central areas of the region, north of Toulon, north of Saint-Tropez, and west of Cannes, with small negative patches northeast of Marseille and north of Nice. Positive Z score clusters are more constrained in terms of size and are generally dispersed. Significant decreasing trends are relatively limited and can be spotted in areas such as to the east of Marseille, west of Cannes, and north of Nice. Significant positive trends are detected in several locations (although limited in area) such as between Aix-en-Provence and Marseille and in the northeastern part (Alpes-Maritimes administrative division) of the study area. Although contrasting negative–positive trends co-exist in close proximity near Marseille and Aix-en-Provence, the greatest speckled pattern is found in the Alpes-Maritimes administrative division, where fires are smaller and more randomly distributed.

Figure 10Trends of mean annual burned area between 1970 and 2019, based on the contextual Mann–Kendall method. Areas with positive Z scores depict increasing trends in the burned area, while negative Z scores show decreasing trends.
3.2 Fire selectivity and topography
Topographic effects studied here include the slope aspect and inclination. Since some areas may have greater BA values simply because a given topographic class is more frequent in the landscape, Jacobs' selectivity index was calculated in order to identify potential classes of aspect and inclination that are preferred by fire between two periods of (i) 1970–1994 and (ii) 1995–2019.

Figure 11Box plot representing the distribution of the Jacobs' index (ranging from −1 to +1) for 1970–1994 (left) and 1995–2019 (right) according to the slope aspect. The (i) median value (50th percentile; bar within the box), (ii) first quartile (25th percentile; bottom part of the box), and (iii) third quartile (75th percentile; top part of the box) are shown. Whiskers represent observations outside the middle 50 %, and points represent outliers.
Figure 11 shows fire preference (Jacobs' index > 0) and fire avoidance (Jacobs' index < 0) for the two 25-year periods under study. Between 1970–1994, S-facing slopes have a weak positive median value (0.02), while the others are all negative. Values become increasingly negative in the following order: W (−0.08), E (−0.12), N (−0.18), and flat (−0.38). In the second period (1995–2019), the median fire selectivity of S-facing slopes (0.1) increases and presents a clear difference with other trends which either remain the same (flat) or decrease. N-facing (−0.33) slopes appear to be even less prone to fire in the 1995-2019 interval, and flat surfaces continue to show the greatest aversion to fire.
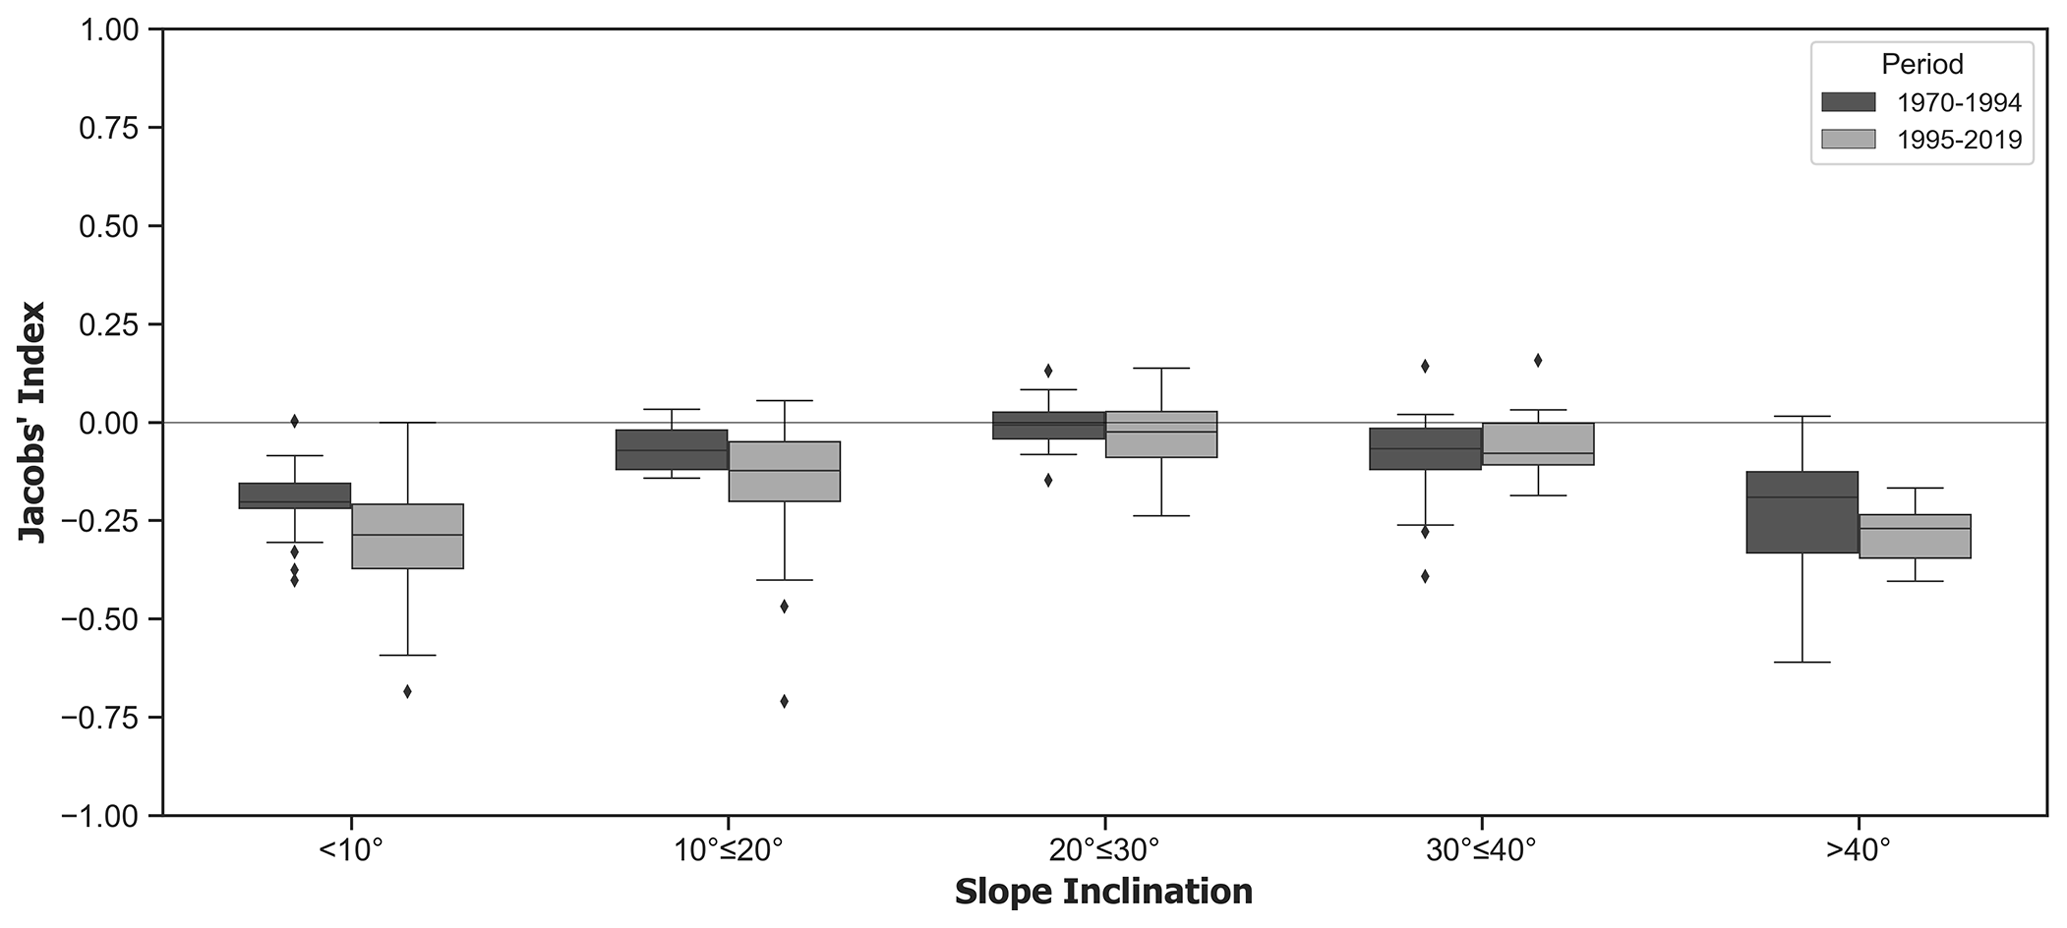
Figure 12Box plot representing the distribution of the Jacobs' index (ranging from −1 to +1) for 1970–1994 (left) and 1995–2019 (right), according to slope inclination. The (i) median value (50th percentile; bar within the box), (ii) first quartile (25th percentile; bottom part of the box), and (iii) third quartile (75th percentile; top part of the box) are shown. Whiskers represent observations outside the middle 50 %, and points represent outliers.
As for aspect, Fig. 12 shows fire selectivity for each of the two periods based on Jacobs' selectivity index according to slope inclination. Overall, fire is not selective with regards to inclination; in the first period, the gentlest (≤ 10∘) and steepest (> 40∘) inclination categories tend to be avoided by fire (values of −0.20 and −0.19, respectively). In the second period, median fire selectivity for gentlest slopes (≤ 10∘) show slightly stronger avoidance, shifting from −0.2 to −0.29, while steepest (> 40∘) slopes, located mainly in the eastern segment of the study area, exhibit a similar change, shifting from −0.19 to −0.27. Intermediate slope categories (10–40∘), which account for a high percentage of BA in the western (Bouches-du-Rhône) and central (Var) study area, do not exhibit any clear fire selectivity pattern.
3.3 Fire selectivity and vegetation type
Forested and semi-natural vegetation is distributed between five categories, of which natural grasslands and sclerophyllous vegetation have the lowest and the highest 50-year average covers, respectively, as the following values show: broadleaved forest (20.6 %), coniferous forest (24.1 %), mixed forest (19.2 %), natural grasslands (11.2 %), and sclerophyllous vegetation (24.9 %). Over the 50-year study period, mixed and broadleaved forests maintain roughly the same area, whereas conifers present a slight but decreasing trend. Sclerophyllous vegetation expanded in the study area (≈ 6 % increase), becoming the most common type in the last 3 decades. Finally, natural grassland is by far the least common type and shrunk slightly (≈ 3.5 % decrease) over time.
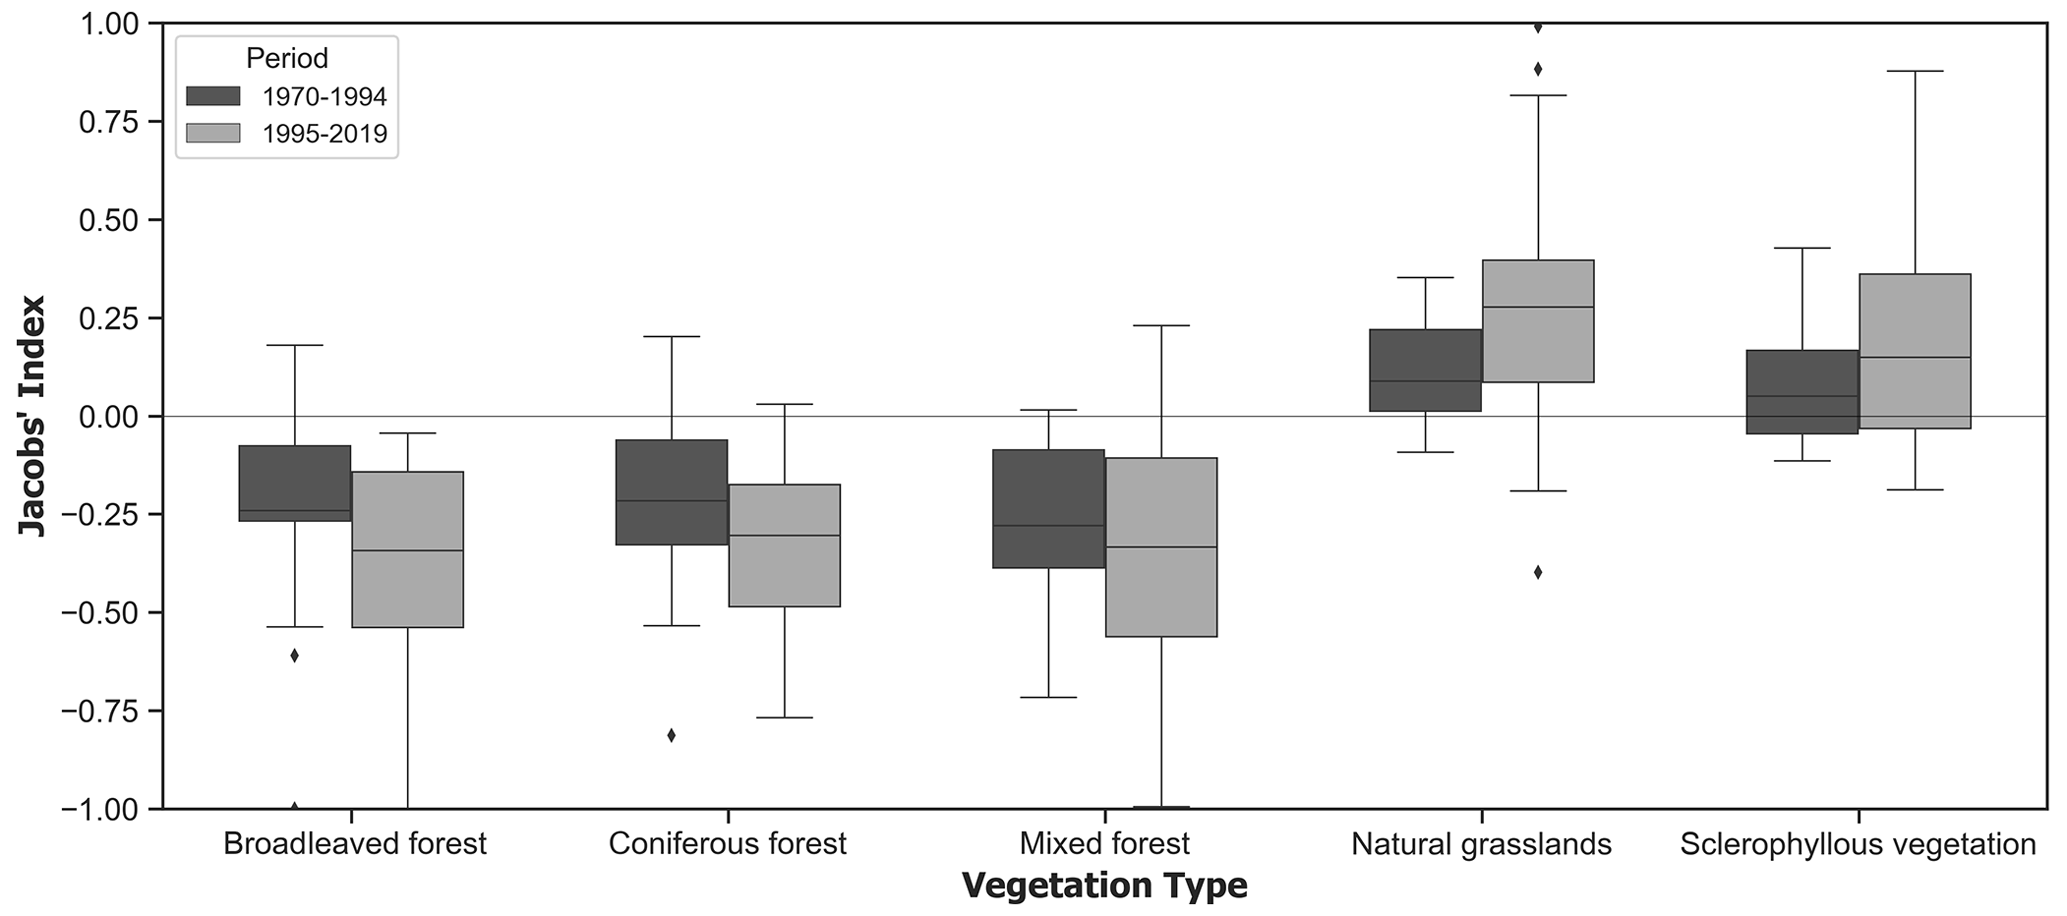
Figure 13Box plot representing the distribution of the Jacobs' index (ranging from −1 to +1) for 1970–1994 (left) and 1995–2019 (right) according to vegetation type. The (i) median value (50th percentile; bar within the box), (ii) first quartile (25th percentile; bottom part of the box), and (iii) third quartile (75th percentile; top part of the box) are shown. Whiskers represent observations outside the middle 50 %, and points represent outliers.
Fire selectivity with regards to vegetation type is presented in Fig. 13. In the first period, three types of vegetation show signs of fire avoidance, namely mixed (−0.28), broadleaved (−0.24), and coniferous (−0.21). Natural grasslands and sclerophyllous vegetation display a weak preference for fire, with median values of 0.09 and 0.05, respectively.
Even though the order changes slightly in the second period, the effects of the fire suppression strategy on vegetation types are more evident than for the topographic factors. On the one hand, all three forest types are more clearly avoided by fire, while, on the other hand, natural grasslands and sclerophyllous vegetation show even stronger fire preference in the second period, shifting from 0.08 to 0.28 and from 0.05 to 0.15, respectively.
3.4 Geographically weighted regression
There is considerable spatiotemporal variability in the strength of the correlation between the BA and environmental variables throughout the study area. The coefficient of determination R2 values range spatially from 0.00 to 0.68 (slope inclination), depending on the variable and time interval (Table 4). The explanatory power for all values tends to be weak, and topographic factors and sclerophyllous vegetation show the strongest correlations with BA. The remaining vegetation types display a weak fit that is similar in both periods.
Table 4Descriptive statistics of local R2 per environmental factor for 1970–1994 (P1) and for 1995–2019 (P2).
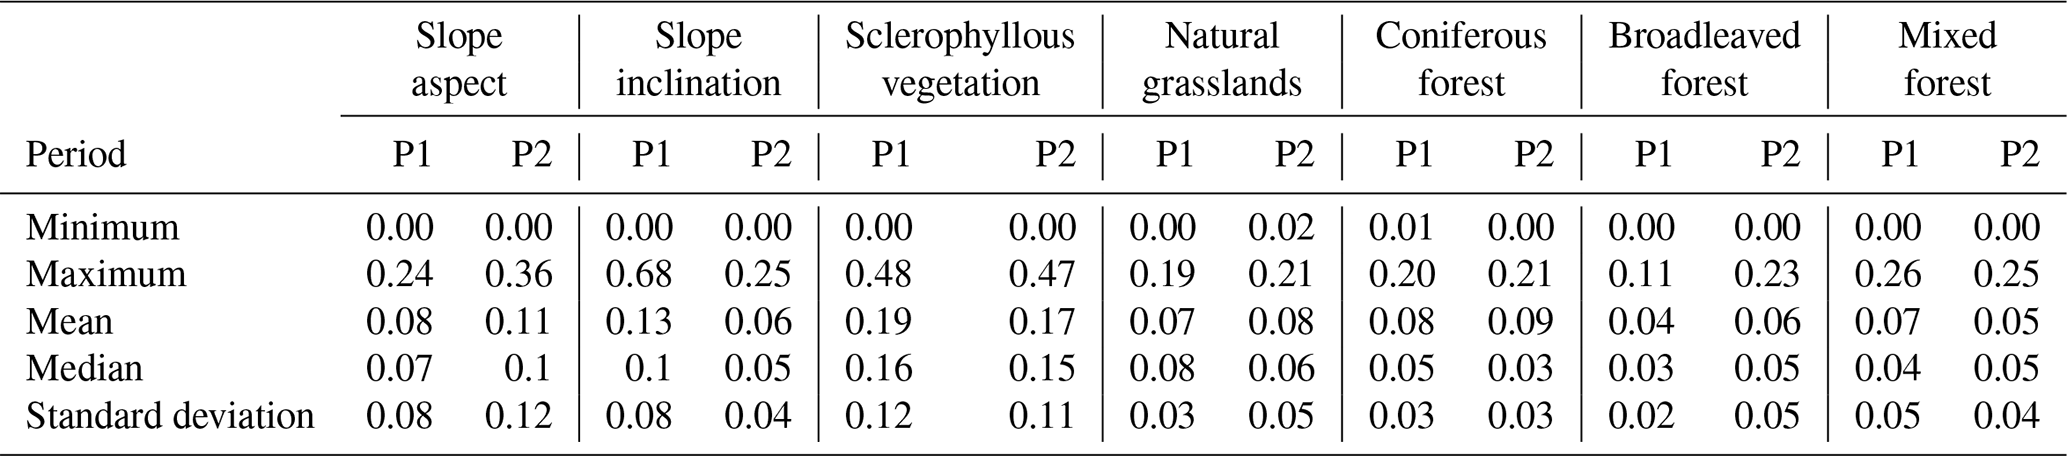

Figure 14Spatial distribution of local R2 between the burned area and slope aspect for 1970–1994 (a) and 1995–2019 (b).
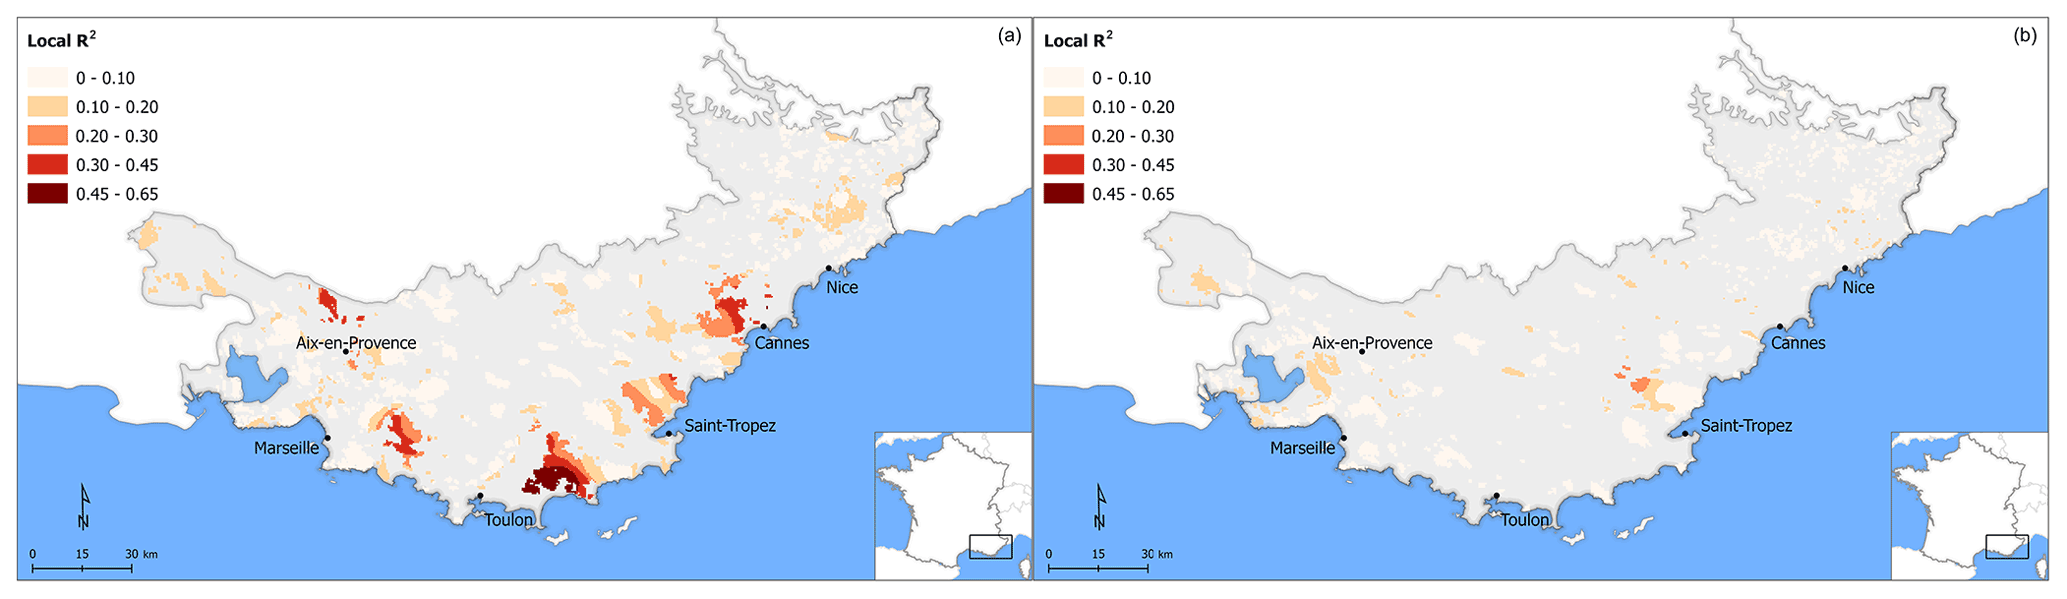
Figure 15Spatial distribution of local R2 between the burned area and slope inclination for 1970–1994 (a) and 1995–2019 (b).
Figures 14 and 15 depict local R2 results of the application of GWR between the percentage of BA and topographic factors. Overall, the highest values are concentrated mainly in the western and central parts (closer to the coastline) of the study area for both slope aspect and inclination. The proportion of variance explained by aspect is slightly greater in the second period, with several cells being in the highest class (0.25–0.35). Despite having a strong local fit in the first period, both distribution and variability changed drastically for slope inclination in the second period.

Figure 16Spatial distribution of local R2 between the burned area and percent cover of the sclerophyllous vegetation for 1970–1994 (a) and 1995–2019 (b).

Figure 17Spatial distribution of local R2 between burned area and percent cover of natural grasslands for 1970–1994 (a) and 1995–2019 (b).

Figure 18Spatial distribution of local R2 between the burned area and percent cover of the coniferous forest for 1970–1994 (a) and 1995–2019 (b).
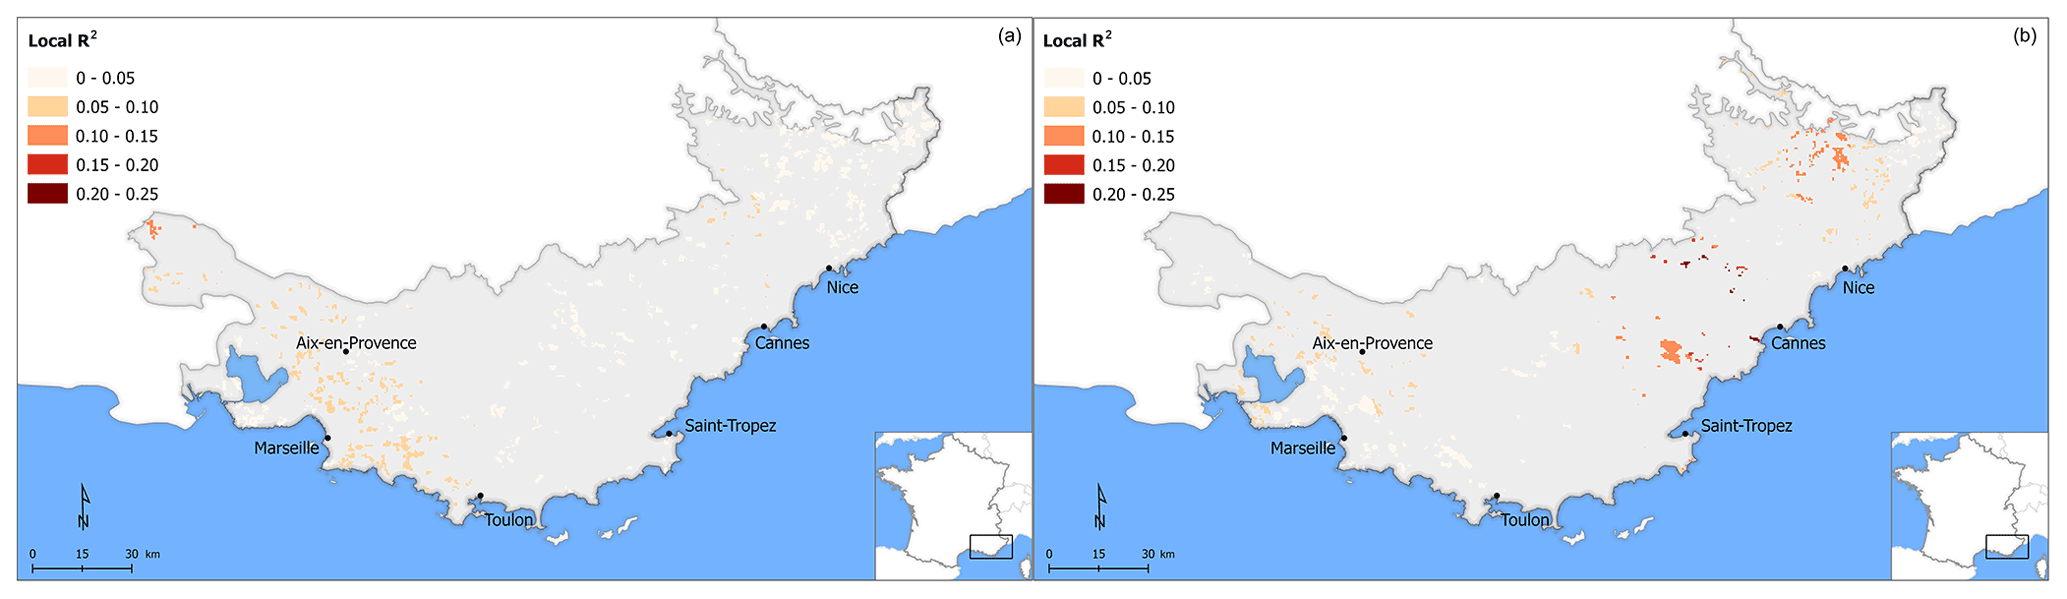
Figure 19Spatial distribution of local R2 between the burned area and percent cover of the broadleaved forest for 1970–1994 (a) and 1995–2019 (b).
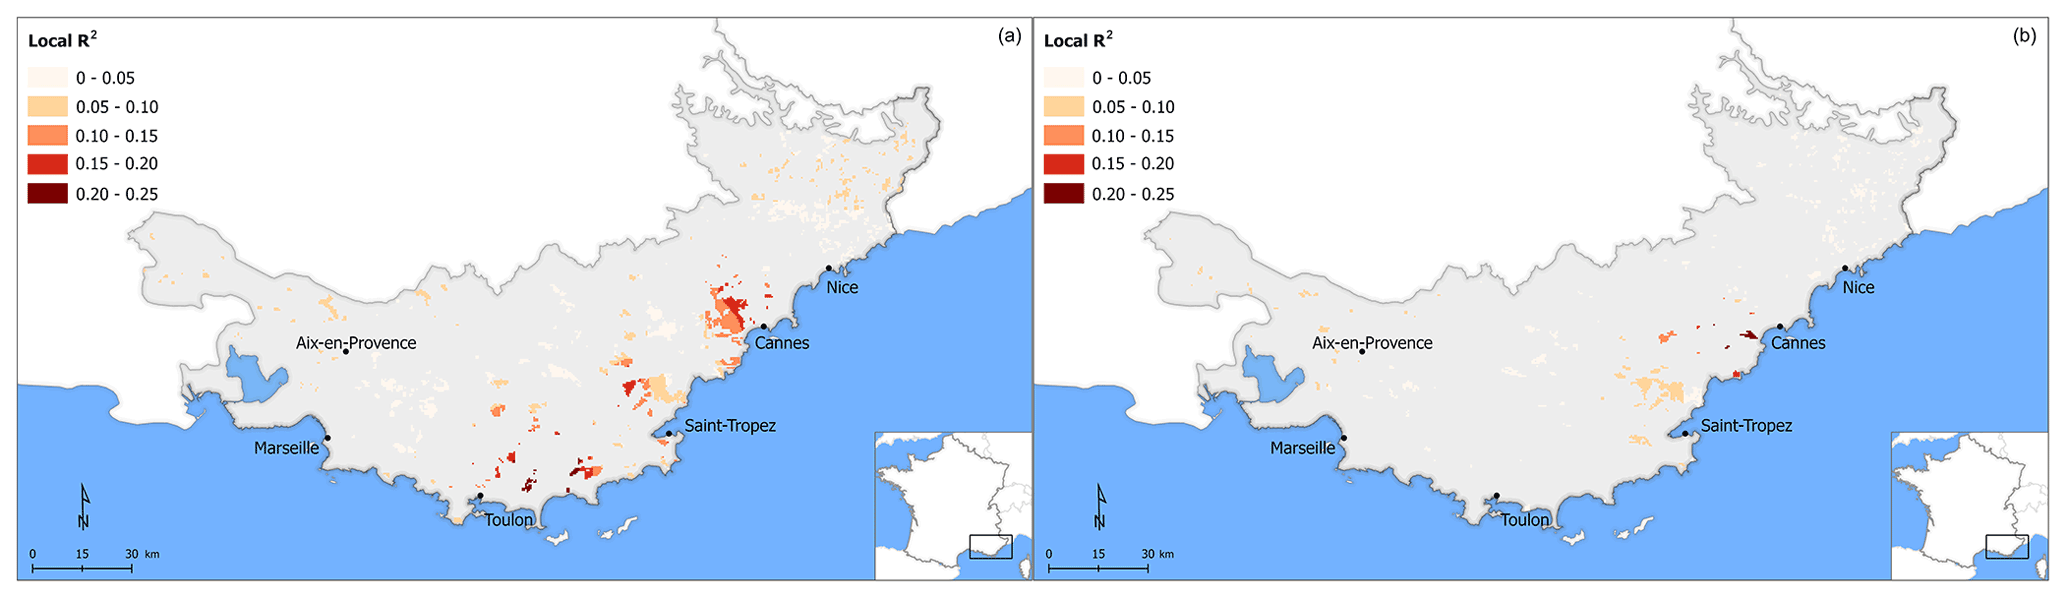
Figure 20Spatial distribution of local R2 between the burned area and percent cover of the mixed forest for 1970–1994 (a) and 1995–2019 (b).
Figures 16 to 20 display local R2 results of the application of GWR between the percentage of BA and the percentage of each vegetation type. Similar to topographic variables, sclerophyllous vegetation exhibits the same spatial pattern of high R2 values. A clear increase in local R2 can be observed when moving towards the western part of the region, which is more evident in the first period. Low fits are found for both periods in the higher altitude areas, located mainly in northeastern segments of the area. R2 values for natural grasslands are generally low and display small differences both in terms of space and variance. Explanatory variables related to forest categories show a very weak fit in the relationship with BA. In addition, the general clustering patterns are quite different between the two periods.
4.1 Fire history
BA in southeastern France has undergone substantial changes over the last 50 years. Annually, BA varies considerably, but clear declining trends are observed in the second part of the temporal interval under study. Around half of the total BA (126,700 ha) was recorded in 5 years, i.e., 1979, 1986, 1989, 1990, and 2003. Due to particularly catastrophic fires in the 1980s, a new fire suppression policy (Vulcain) was initiated that came fully into effect in 1994 (Battesti, 1997). This new strategy focused on aggressively suppressing fire ignitions under any weather conditions in order to avoid fire propagation to the extent where suppression would become both more difficult and more expensive. Although the fire weather index values were not calculated here for the three administrative divisions, Fox et al. (2015) noted a general increase in summer temperatures between about 1980 and 2010, so the firefighting policy had a major impact on the decrease in total BA after 1994. Only 2003 stands out as a big fire year in the 1995–2019 interval, and although it was the hottest/driest year on record in the Alpes-Maritimes, it remained within the range of BA values of the big 1980s fires (Fox et al., 2015). Nonetheless, it raises doubts about the sustainability of rapid suppression in extreme conditions when resources are spread thinly over a greater number of ignitions (Curt and Frejaville, 2018).
Spatiotemporal analysis
The effect of the new firefighting strategy can also be viewed spatially. In general, fire patches are less large and are distributed over smaller geographic proximities with one another, and the fire recurrence is lower. Spatiotemporal trends, however, vary from west to east, according to the specific population and environmental contexts of each administrative division. In the western part of the study zone, around Aix-en-Provence and Marseille, hotspots, in the form of positive Z scores, remain, and the new firefighting strategy had less effect since fires were already limited in size by vegetation continuity. Although limited in area, multiple clusters of positive trends are found in closer proximity to the built-up areas near Marseille and Aix-en-Provence in comparison to overall decreasing trends. Increased human activity is known to affect fire ignition (Badia et al., 2011; Chas-Amil et al., 2013; Jiménez-Ruano et al., 2017; Lampin-Maillet et al., 2011), and in our context that can be potentially linked to the high number of arson activities found in the area (Curt et al., 2016). On the contrary, in the central part of the study area, where most of the big fires occur, the new fire policy effectively limited fire propagation over the continuous vegetated cover that defines the region. This zone displays the largest clusters of negative Z scores, thereby decreasing BA with very few positive values and low fire recurrence. Ganteaume and Barbero (2019) provided evidence that large fires (> 100 ha) declined sharply in the central segment of the study area after the introduction of the fire management policy, and our results, using different methods, are coherent with their findings. Finally, in the eastern segment of the study area, frequent small dispersed fire patches are found. Fire shapes are not elongated by wind direction compared to polygons in the western and central administrative divisions, and although negative fire occurrence trends dominate, particularly in the WUI band, there is a greater number of small positive patches compared to other zones.
4.2 Burned area and topography
S-facing slopes have the greatest BA, burn more frequently (Mouillot et al., 2003), and are more exposed to forest fires than other slopes due to both environmental factors (greater insolation and evapotranspiration) and WUI characteristics since S-facing slopes in southern France have more houses and therefore more potential ignition sources (Fox et al., 2018). S-facing (sum of SW, S, and SE) slopes play an increasingly important role over time, and this could be linked to a combination of hotter summers and an increasing number of human dwellings on these slopes, as growth rates on S-facing slopes in the Alpes-Maritimes were 4–5 times greater than on N-facing slopes in 1990–2012.
Slope inclination favors fire propagation directly through more efficient radiative heat transfer (Rothermel, 1983) and increases the rate of spread and fire intensity (Csontos and Cseresnyés, 2015; Capra et al., 2018). In addition, slope inclination influences fire ignition and suppression indirectly through accessibility, solar radiation variations, fuel moisture, and fuel density, which in turn influence flammability (Holden et al., 2009). In this study, flat areas are most avoided by fire for several independent reason. Radiative heat transfer is less efficient on these slopes, which are more densely inhabited and more easily accessible with denser road networks, so lower fire preference probably depends as much or more on early suppression as on physical processes. The fire avoidance of low slope inclinations strengthens over time, and this is coherent with more rapid suppression in this interval. The BA in intermediate slope inclinations is not affected significantly by the change in firefighting strategy, potentially due to factors that counter rapid suppression like more efficient radiative heat transfer, more difficult accessibility, and the presence of isolated or diffuse housing.
4.3 Burned area and vegetation type
The role of vegetation in fire frequency and BA patches located in the Bouches-du-Rhône and Var administrative divisions was studied by Curt et al. (2013). Their case study reflects patterns observed here at a larger scale, namely that vegetation flammability is secondary to landscape organization. Large open patches of continuous fuel, as are found in the Var administrative division, favor larger fires with longer return intervals than the small patchy wildland distribution in the Bouches-du-Rhône (Ganteaume and Barbero, 2019). Burned vegetation patterns observed here highlight the frequently cited role of sclerophyllous vegetation (shrubland) (Ganteaume and Jappiot, 2013; Moreira et al., 2011; Oliveira et al., 2014a; Tessler et al., 2016). Shrublands both favor fire propagation in dry conditions (Baeza et al., 2002) and result from recurrent fires (Tessler et al., 2016). As Mermoz et al. (2005) suggested, the fire proneness of sclerophyllous vegetation is connected to its ability to regenerate faster and generate quicker fuel accumulation; this also applies in our case, since sclerophyllous vegetation covers the greatest area, has the greatest BA and greatest explained variance in the GWR analysis, and is one of two vegetation categories (with natural grasslands) that has positive resource index values. These results are coherent with the findings of others working in Mediterranean environments where large fires tend to occur in landscapes with dense shrublands (Moreira et al., 2011; Ruffault and Mouillot, 2017). In a context where initial suppression is crucial to fire extinction, sclerophyllous vegetation may resist early suppression better than other covers, where initial propagation is perhaps slower. Moreover, firefighting assets appear to prioritize other types of vegetation during fire suppression, since fire selectivity remains unchanged for bushlands, possibly due to the low cost of restoration (Oehler et al., 2012).
As other studies have concluded (Oliveira et al., 2014a), natural grasslands display a high fire susceptibility. Despite the change in the firefighting policy, grasslands are over-represented in BA in both time intervals, and this may be due to faster initial propagation or accessibility issues as, for example, in certain mid- to high-altitude areas over the eastern section of the study area, where burned clusters of this vegetation type are found. Sheep grazing is a common practice in high alpine pastures of the Alpes-Maritimes administrative division, and natural grassland fires may be due to bush clearing operations by shepherds which resulted in uncontrolled wildfires that affected much larger areas than originally intended. All three forest types (broadleaved, coniferous, and mixed) display a similar pattern characterized by fire avoidance that is even more evident after the fire management policy change. This does not necessarily reflect a higher priority for suppression by firefighting assets over other vegetation types but may indicated that fires in these vegetation types initially take more time to spread than in bushland, so they are suppressed before becoming large fires.
In this study, the results provide a coherent picture of the impact of a shift in firefighting strategy on fire occurrence and environmental characteristics. The burned area decreased sharply in the SE of France after 1994 with the introduction of the new firefighting strategy. Rapid fire extinction was particularly effective in limiting big fires in the region. Large fire hotspots found mainly in the central parts disappear after the policy change, while new clusters of high fire recurrence appear in closer proximity to areas with increased human activity.
S-facing aspects have an increasingly bigger impact over time, and this may be linked to both environmental conditions and increased human presence on those slopes. Fire avoids low slope inclinations and even more so after the shift in fire suppression, as flat areas are easier to access and more densely inhabited, so lower fire preference is probably determined as much or more by early suppression as by physical processes (reduced radiative heat transfer).
Over half of the total BA in the last 50 years concerned sclerophyllous vegetation, thus confirming its strong association with high fire susceptibility and recurrence. Considering that sclerophyllous vegetation regenerates and expands faster than other vegetation types in the region, this may lead to an increase in fire risk in the future. Natural grasslands, even though they cover limited area and decline with time, are also preferred by fire which may be due to pastoral fires. On the contrary, broadleaved, coniferous, and mixed forest are avoided by fire, especially after the change in fire management policy.
Further ongoing exploitation of the fire GIS database in conjunction with WUI characteristics will likely further improve our understanding on the driving forces of BA and the impacts of firefighting strategies in the region.
Python packages seaborn (Waskom, 2021), pandas (McKinney, 2010), and matplotlib (Hunter, 2007) were used to process the data and produce the figures. The code is available upon request from the corresponding author.
The use of the fire database is subject to specific authorization from the National Forestry Office (Office National des Forêts – ONF) and the Delegation for the Protection of the Mediterranean Forest (Délégation à la Protection de la Forêt Méditerranéenne – DPFM).
CB established the fire geodatabase, carried out the data processing, analyses, visualization, and wrote the initial draft. DMF performed the land cover modeling, contributed to the interpretation of the results, and reviewed the paper. EDB provided expertise for the data analyses and reviewed the paper.
The contact author has declared that neither they nor their co-authors have any competing interests.
Publisher's note: Copernicus Publications remains neutral with regard to jurisdictional claims in published maps and institutional affiliations.
The authors wish to thank the National Forestry Office (Office National des Forêts, ONF), for providing the fire geo-database. We would also like to thank the two reviewers, for their constructive feedback that helped to improve the quality of the paper.
This research has been supported by the French government through the 3IA Côte d'Azur and UCAJEDI Investments in the Future project managed by the National Research Agency (grant nos. ANR-19-P3IA-0002 and ANR-15-IDEX-01).
This paper was edited by Ricardo Trigo and reviewed by Julien Ruffault and Olga Viedma.
Akaike, H.: A new look at the statistical model identification, IEEE Trans. Automat. Contr., 19, 716–723, https://doi.org/10.1109/TAC.1974.1100705, 1974.
Alexander, J. D., Seavy, N. E., Ralph, C. J., and Hogoboom, B.: Vegetation and topographical correlates of fire severity from two fires in the Klamath-Siskiyou region of Oregon and California, Int. J. Wildl. Fire, 15, 237–245, https://doi.org/10.1071/WF05053, 2006.
Badia, A., Serra, P., and Modugno, S.: Identifying dynamics of fire ignition probabilities in two representative Mediterranean wildland-urban interface areas, Appl. Geogr., 31, 930–940, https://doi.org/10.1016/j.apgeog.2011.01.016, 2011.
Baeza, M. J., De Luís, M., Raventós, J., and Escarré, A.: Factors influencing fire behaviour in shrublands of different stand ages and the implications for using prescribed burning to reduce wildfire risk, J. Environ. Manage., 65, 199–208, https://doi.org/10.1006/jema.2002.0545, 2002.
Bajocco, S. and Ricotta, C.: Evidence of selective burning in Sardinia (Italy): Which land-cover classes do wildfires prefer?, Landsc. Ecol., 23, 241–248, https://doi.org/10.1007/s10980-007-9176-5, 2008.
Barros, A. M. G. and Pereira, J. M. C.: Wildfire selectivity for land cover type: Does size matter?, PLoS One, 9, e84760, https://doi.org/10.1371/journal.pone.0084760, 2014.
Battesti, A.: Vulcain ou l'histoire d'une tentative pour commencer à changer les choses dans le système “Feux de Forêts”, par la transparence et la convivialité, Forêt Méditerranéenne, XVIII, 143–145, hal-03558006, 1997.
Birch, D. S., Morgan, P., Kolden, C. A., Abatzoglou, J. T., Dillon, G. K., Hudak, A. T., and Smith, A. M. S.: Vegetation, topography and daily weather influenced burn severity in central Idaho and western Montana forests, Ecosphere, 6, 1–23, https://doi.org/10.1890/ES14-00213.1, 2015.
Bond, W. J. and Keeley, J. E.: Fire as a global “herbivore”: the ecology and evolution of flammable ecosystems, Trends Ecol. Evol., 20, 387–394, 2005.
Bowman, D. M. J. S., Williamson, G. J., Abatzoglou, J. T., Kolden, C. A., Cochrane, M. A., and Smith, A. M. S.: Human exposure and sensitivity to globally extreme wildfire events, Nat. Ecol. Evol., 1, 0058, https://doi.org/10.1038/s41559-016-0058, 2017.
Broncano, M. J. and Retana, J.: Topography and forest composition affecting the variability in fire severity and post-fire regeneration occurring after a large fire in the Mediterranean basin, Int. J. Wildl. Fire, 13, 209–216, https://doi.org/10.1071/WF03036, 2004.
Capra, G. F., Tidu, S., Lovreglio, R., Certini, G., Salis, M., Bacciu, V., Ganga, A., and Filzmoser, P.: The impact of wildland fires on calcareous Mediterranean pedosystems (Sardinia, Italy) – An integrated multiple approach, Sci. Total Environ., 624, 1152–1162, https://doi.org/10.1016/j.scitotenv.2017.12.099, 2018.
Carmo, M., Moreira, F., Casimiro, P., and Vaz, P.: Land use and topography influences on wildfire occurrence in northern Portugal, Landsc. Urban Plan., 100, 169–176, https://doi.org/10.1016/j.landurbplan.2010.11.017, 2011.
Catarino, S., Romeiras, M. M., Figueira, R., Aubard, V., Silva, J. M. N., and Pereira, J. M. C.: Spatial and temporal trends of burnt area in angola: Implications for natural vegetation and protected area management, Diversity, 12, 307, https://doi.org/10.3390/D12080307, 2020.
Chas-Amil, M. L., Touza, J., and García-Martínez, E.: Forest fires in the wildland-urban interface: A spatial analysis of forest fragmentation and human impacts, Appl. Geogr., 43, 127–137, https://doi.org/10.1016/j.apgeog.2013.06.010, 2013.
Csontos, P. and Cseresnyés, I.: Fire-risk evaluation of austrian pine stands in Hungary - Effects of drought conditions and slope aspect on fire spread and fire behaviour, Carpathian J. Earth Environ. Sci., 10, 247–254, 2015.
Curt, T. and Frejaville, T.: Wildfire Policy in Mediterranean France: How Far is it Efficient and Sustainable?, Risk Anal., 38, 472–488, https://doi.org/10.1111/risa.12855, 2018.
Curt, T., Borgniet, L., and Bouillon, C.: Wildfire frequency varies with the size and shape of fuel types in southeastern France: Implications for environmental management, J. Environ. Manage., 117, 150–161, https://doi.org/10.1016/j.jenvman.2012.12.006, 2013.
Curt, T., Fréjaville, T., and Lahaye, S.: Modelling the spatial patterns of ignition causes and fire regime features in southern France: Implications for fire prevention policy, Int. J. Wildl. Fire, 25, 785–796, https://doi.org/10.1071/WF15205, 2016.
Dickson, B. G., Prather, J. W., Xu, Y., Hampton, H. M., Aumack, E. N., and Sisk, T. D.: Mapping the probability of large fire occurrence in northern Arizona, USA, Landsc. Ecol., 21, 747–761, https://doi.org/10.1007/s10980-005-5475-x, 2006.
Douglas, E. M., Vogel, R. M., and Kroll, C. N.: Trends in floods and low flows in the United States: Impact of spatial correlation, J. Hydrol., 240, 90–105, https://doi.org/10.1016/S0022-1694(00)00336-X, 2000.
Duane, A., Piqué, M., Castellnou, M., and Brotons, L.: Predictive modelling of fire occurrences from different fire spread patterns in Mediterranean landscapes, Int. J. Wildl. Fire, 24, 407-418, https://doi.org/10.1071/WF14040, 2015.
Durbin, J. and Watson, G. S.: Testing for Serial Correlation in Least Squares Regression: I., Biometrika, 37, 409–428, https://doi.org/10.2307/2332391, 1950.
Eastman, J., R.: TerrSet 2020 Help System, Accessed in TerrSet version 19, Clark University, 394 pp., 2020.
Elia, M., Giannico, V., Lafortezza, R., and Sanesi, G.: Modeling fire ignition patterns in Mediterranean urban interfaces, Stoch. Environ. Res. Risk Assess., 33, 169–181, https://doi.org/10.1007/s00477-018-1558-5, 2019.
Estes, B. L., Knapp, E. E., Skinner, C. N., Miller, J. D., and Preisler, H. K.: Factors influencing fire severity under moderate burning conditions in the Klamath Mountains, northern California, USA, Ecosphere, 8, e01794, https://doi.org/10.1002/ecs2.1794, 2017.
Evin, G., Curt, T., and Eckert, N.: Has fire policy decreased the return period of the largest wildfire events in France? A Bayesian assessment based on extreme value theory, Nat. Hazards Earth Syst. Sci., 18, 2641–2651, https://doi.org/10.5194/nhess-18-2641-2018, 2018.
Fernandes, P. M., Monteiro-Henriques, T., Guiomar, N., Loureiro, C., and Barros, A. M. G.: Bottom-Up Variables Govern Large-Fire Size in Portugal, Ecosystems, 19, 1362–1375, https://doi.org/10.1007/s10021-016-0010-2, 2016.
Fotheringham, A. S., Charlton, M. E., and Brunsdon, C.: Geographically weighted regression: a natural evolution of the expansion method for spatial data analysis, Environ. Plan. A, 30, 1905–1927, https://doi.org/10.1068/a301905, 1998.
Fotheringham, A. S., Brunsdon, C., and Martin, C.: Geographically Weighted Regression: The Analysis of Spatially Varying Relationships, John Wiley & Sons, ISBN 0-471-49616-2, 2003.
Fox, D. M., Martin, N., Carrega, P., Andrieu, J., Adnès, C., Emsellem, K., Ganga, O., Moebius, F., Tortorollo, N., and Fox, E. A.: Increases in fire risk due to warmer summer temperatures and wildland urban interface changes do not necessarily lead to more fires, Appl. Geogr., 56, 1–12, https://doi.org/10.1016/j.apgeog.2014.10.001, 2015.
Fox, D. M., Carrega, P., Ren, Y., Caillouet, P., Bouillon, C., and Robert, S.: How wildfire risk is related to urban planning and Fire Weather Index in SE France (1990–2013), Sci. Total Environ., 621, 120–129, https://doi.org/10.1016/J.SCITOTENV.2017.11.174, 2018.
Ganteaume, A. and Barbero, R.: Contrasting large fire activity in the French Mediterranean, Nat. Hazards Earth Syst. Sci., 19, 1055–1066, https://doi.org/10.5194/nhess-19-1055-2019, 2019.
Ganteaume, A. and Jappiot, M.: What causes large fires in Southern France, For. Ecol. Manage., 294, 76–85, https://doi.org/10.1016/j.foreco.2012.06.055, 2013.
Ganteaume, A., Camia, A., Jappiot, M., San-Miguel-Ayanz, J., Long-Fournel, M., and Lampin, C.: A review of the main driving factors of forest fire ignition over Europe, Environ. Manage., 51, 651–662, https://doi.org/10.1007/s00267-012-9961-z, 2013.
Holden, Z. A., Morgan, P., and Evans, J. S.: A predictive model of burn severity based on 20-year satellite-inferred burn severity data in a large southwestern US wilderness area, For. Ecol. Manage., 258, 2399–2406, https://doi.org/10.1016/j.foreco.2009.08.017, 2009.
Hunter, J. D.: Matplotlib: A 2D Graphics Environment, Comput. Sci. Eng., 9, 90–95, https://doi.org/10.1109/MCSE.2007.55, 2007.
Jacobs, J.: Quantitative Measurement of Food Selection, Oecologia, 14, 413–417, https://doi.org/10.1385/1-59259-055-1:51, 1974.
Jiménez-Ruano, A., Rodrigues Mimbrero, M., and de la Riva Fernández, J.: Exploring spatial–temporal dynamics of fire regime features in mainland Spain, Nat. Hazards Earth Syst. Sci., 17, 1697–1711, https://doi.org/10.5194/nhess-17-1697-2017, 2017.
Kendall, M. G.: Rank Correlation Methods, 4th edn., Griffin, London, ISBN 9780852641996, 1975.
Kolanek, A., Szymanowski, M., and Raczyk, A.: Human Activity Affects Forest Fires: The Impact of Anthropogenic Factors on the Density of Forest Fires in Poland, Forests, 12, 728, https://doi.org/10.3390/f12060728, 2021.
Koutsias, N., Martínez-Fernández, J., and Allgöwer, B.: Do factors causing wildfires vary in space? evidence from geographically weighted regression, GIScience Remote Sens., 47, 221–240, https://doi.org/10.2747/1548-1603.47.2.221, 2010.
Lampin-Maillet, C., Long-Fournel, M., Ganteaume, A., Jappiot, M., and Ferrier, J. P.: Land cover analysis in wildland-urban interfaces according to wildfire risk: A case study in the South of France, For. Ecol. Manage., 261, 2200–2213, https://doi.org/10.1016/j.foreco.2010.11.022, 2011.
Manly, B., McDonald, L., Thomas, D., McDonald, T., and Erickson, W.: Resource Selection by Animals Statistical Design and Analysis for Field Studies, Second Edition, Kluwer Acad. Publ., ISBN 1-4020-0677-2, 2002.
Mann, H. B.: Nonparametric Tests Against Trend, Econometrica, 13, 245–259, https://doi.org/10.2307/1907187, 1945.
Martínez-Fernández, J., Chuvieco, E., and Koutsias, N.: Modelling long-term fire occurrence factors in Spain by accounting for local variations with geographically weighted regression, Nat. Hazards Earth Syst. Sci., 13, 311–327, https://doi.org/10.5194/nhess-13-311-2013, 2013.
McKinney, W.: Data Structures for Statistical Computing in Python, in: Proceedings of the 9th Python in Science Conference, Austin, Texas, USA, 28 June–3 July 2010, edited by: van der Walt, S. and Millman, J., 56–61, https://doi.org/10.25080/Majora-92bf1922-00a, 2010.
Mermoz, M., Kitzberger, T., and Veblen, T. T.: Landscape influences on occurrence and spread of wildfires in Patagonian forests and shrublands, Ecology, 86, 2705–2715, https://doi.org/10.1890/04-1850, 2005.
Mhawej, M., Faour, G., and Adjizian-Gerard, J.: Wildfire Likelihood's Elements: A Literature Review, Challenges, 6, 282–293, https://doi.org/10.3390/challe6020282, 2015.
Michelaki, C., Fyllas, N. M., Galanidis, A., Aloupi, M., Evangelou, E., Arianoutsou, M., and Dimitrakopoulos, P. G.: Adaptive flammability syndromes in thermo-Mediterranean vegetation, captured by alternative resource-use strategies, Sci. Total Environ., 718, 137437, https://doi.org/10.1016/j.scitotenv.2020.137437, 2020.
Miller, J. D., Safford, H. D., Crimmins, M., and Thode, A. E.: Quantitative Evidence for Increasing Forest Fire Severity in the Sierra Nevada and Southern Cascade Mountains, California and Nevada, USA, Ecosystems, 12, 16–32, https://doi.org/10.1007/s10021-008-9201-9, 2009.
Molina, J. R., Martín, T., Rodríguez Y Silva, F., and Herrera, M. Á.: The ignition index based on flammability of vegetation improves planning in the wildland-urban interface: A case study in Southern Spain, Landsc. Urban Plan., 158, 129–138, https://doi.org/10.1016/j.landurbplan.2016.11.003, 2017.
Molina-Terrén, D. M., Xanthopoulos, G., Diakakis, M., Ribeiro, L., Caballero, D., Delogu, G. M., Viegas, D. X., Silva, C. A., and Cardil, A.: Analysis of forest fire fatalities in Southern Europe: Spain, Portugal, Greece and Sardinia (Italy), Int. J. Wildl. Fire, 28, 85–98, https://doi.org/10.1071/WF18004, 2019.
Moreira, F., Rego, F. C., and Ferreira, P. G.: Temporal (1958–1995) pattern of change in a cultural landscape of northwestern Portugal: Implications for fire occurrence, Landsc. Ecol., 16, 557–567, https://doi.org/10.1023/A:1013130528470, 2001.
Moreira, F., Vaz, P., Catry, F., and Silva, J. S.: Regional variations in wildfire susceptibility of land-cover types in Portugal: implications for landscape management to minimize fire hazard, Int. J. Wildl. Fire, 18, 563–574, https://doi.org/10.1071/WF07098, 2009.
Moreira, F., Viedma, O., Arianoutsou, M., Curt, T., Koutsias, N., Rigolot, E., Barbati, A., Corona, P., Vaz, P., Xanthopoulos, G., Mouillot, F., and Bilgili, E.: Landscape – wildfire interactions in southern Europe: Implications for landscape management, J. Environ. Manage., 92, 2389–2402, https://doi.org/10.1016/j.jenvman.2011.06.028, 2011.
Moreno, J. M., Viedma, O., Zavala, G., and Luna, B.: Landscape variables influencing forest fires in central Spain, Int. J. Wildl. Fire, 20, 678–689, https://doi.org/10.1071/WF10005, 2011.
Mouillot, F., Ratte, J. P., Joffre, R., Moreno, J. M., and Rambal, S.: Some determinants of the spatio-temporal fire cycle in a mediterranean landscape (Corsica, France), Landsc. Ecol., 18, 665–674, https://doi.org/10.1023/B:LAND.0000004182.22525.a9, 2003.
Narayanaraj, G. and Wimberly, M. C.: Influences of forest roads on the spatial patterns of human- and lightning-caused wildfire ignitions, Appl. Geogr., 32, 878–888, https://doi.org/10.1016/j.apgeog.2011.09.004, 2012.
Neeti, N. and Eastman, J. R.: A Contextual Mann-Kendall Approach for the Assessment of Trend Significance in Image Time Series, Trans. GIS, 15, 599–611, https://doi.org/10.1111/j.1467-9671.2011.01280.x, 2011.
Nunes, A. N., Lourenço, L., and Meira, A. C. C.: Exploring spatial patterns and drivers of forest fires in Portugal (1980–2014), Sci. Total Environ., 573, 1190–1202, https://doi.org/10.1016/j.scitotenv.2016.03.121, 2016.
Nunes, M. C. S., Vasconcelos, M. J., Pereira, J. M. C., Dasgupta, N., Alldredge, R. J., and Rego, F. C.: Land Cover Type and Fire in Portugal: Do Fires Burn Land Cover Selectively?, Landsc. Ecol., 20, 661–673, https://doi.org/10.1007/s10980-005-0070-8, 2005.
Oehler, F., Oliveira, S., Barredo, J., Camia, A., San-Miguel-Ayanz, J., Pettenella, D., and Mavsar, R.: Assessing European wild fire vulnerability Assessing European wild fire vulnerability, Geophysical Research Abstracts, EGU General Assembly, 22–27 April 2012, Vienna, Austria, 14, EGU2012-9452, 2012.
Oliveira, S., Moreira, F., Boca, R., San-Miguel-Ayanz, J., and Pereira, J. M. C.: Assessment of fire selectivity in relation to land cover and topography: A comparison between Southern European countries, Int. J. Wildl. Fire, 23, 620–630, https://doi.org/10.1071/WF12053, 2014a.
Oliveira, S., Pereira, J. M. C., San-Miguel-Ayanz, J., and Lourenço, L.: Exploring the spatial patterns of fire density in Southern Europe using Geographically Weighted Regression, Appl. Geogr., 51, 143–157, https://doi.org/10.1016/j.apgeog.2014.04.002, 2014b.
Oliveras, I., Gracia, M., Moŕ, G., and Retana, J.: Factors influencing the pattern of fire severities in a large wildfire under extreme meteorological conditions in the Mediterranean basin, Int. J. Wildl. Fire, 18, 755–764, https://doi.org/10.1071/WF08070, 2009.
Otón, G., Pereira, J. M. C., Silva, J. M. N., and Chuvieco, E.: Analysis of trends in the firecci global long term burned area product (1982–2018), Fire, 4, 74, https://doi.org/10.3390/fire4040074, 2021.
Padilla, M. and Vega-García, C.: On the comparative importance of fire danger rating indices and their integration with spatial and temporal variables for predicting daily human-caused fire occurrences in Spain, Int. J. Wildl. Fire, 20, 46–58, https://doi.org/10.1071/WF09139, 2011.
Parks, S. A., Holsinger, L. M., Panunto, M. H., Jolly, W. M., Dobrowski, S. Z., and Dillon, G. K.: High-severity fire: evaluating its key drivers and mapping its probability across western US forests, Environ. Res. Lett., 13, 044037, https://doi.org/10.1088/1748-9326/aab791, 2018.
Pereira, M. G., Aranha, J., and Amraoui, M.: Land cover fire proneness in Europe, For. Syst., 23, 598–610, https://doi.org/10.5424/fs/2014233-06115, 2014.
Pokorná, L., Kučerová, M., and Huth, R.: Annual cycle of temperature trends in Europe, 1961–2000, Glob. Planet. Change, 170, 146–162, https://doi.org/10.1016/j.gloplacha.2018.08.015, 2018.
Rodrigues, M., Jiménez, A., and de la Riva, J.: Analysis of recent spatial–temporal evolution of human driving factors of wildfires in Spain, Nat. Hazards, 84, 2049–2070, https://doi.org/10.1007/s11069-016-2533-4, 2016.
Rodrigues, M., Jiménez-Ruano, A., and de la Riva, J.: Fire regime dynamics in mainland Spain. Part 1: Drivers of change, Sci. Total Environ., 721, 135841, https://doi.org/10.1016/j.scitotenv.2019.135841, 2020.
Rothermel, R. C.: How to predict the spread and intensity of forest and range fires, US Dep. Agric. For. Serv. Gen. Tech. Rep., INT-143, https://doi.org/10.2737/INT-GTR-143, 1983.
Roy, H. G., Fox, D. M., and Emsellem, K.: Spatial dynamics of land cover change in a Euro-Mediterranean catchment (1950–2008), J. Land Use Sci., 10, 277–297, https://doi.org/10.1080/1747423X.2014.898105, 2015.
Ruffault, J. and Mouillot, F.: How a new fire-suppression policy can abruptly reshape the fire-weather relationship, Ecosphere, 6, 1–19, https://doi.org/10.1890/ES15-00182.1, 2015.
Ruffault, J. and Mouillot, F.: Contribution of human and biophysical factors to the spatial distribution of forest fire ignitions and large wildfires in a French Mediterranean region, Int. J. Wildl. Fire, 26, 498–508, https://doi.org/10.1071/WF16181, 2017.
San-Miguel-Ayanz, J., Moreno, J. M., and Camia, A.: Analysis of large fires in European Mediterranean landscapes: Lessons learned and perspectives, For. Ecol. Manage., 294, 11–22, https://doi.org/10.1016/j.foreco.2012.10.050, 2013.
San-Miguel-Ayanz, J., Durrant, T., Boca, R., Maianti, P., Libertà, G., Artes Vivancos, T., Jacome Felix Oom, D., Branco, A., De Rigo, D., Ferrari, D., Pfeiffer, H., Grecchi, R., Nuijten, D., and Leray, T.: Forest Fires in Europe, Middle East and North Africa 2019, Publications Office of the European Union, Luxembourg, https://doi.org/10.2760/893, 2020.
Silva, J. M. N., Moreno, M. V., Le Page, Y., Oom, D., Bistinas, I., and Pereira, J. M. C.: Spatiotemporal trends of area burnt in the Iberian Peninsula, 1975–2013, Reg. Environ. Chang., 19, 515–527, https://doi.org/10.1007/s10113-018-1415-6, 2019.
Tessler, N., Wittenberg, L., and Greenbaum, N.: Vegetation cover and species richness after recurrent forest fires in the Eastern Mediterranean ecosystem of Mount Carmel, Israel, Sci. Total Environ., 572, 1395–1402, https://doi.org/10.1016/j.scitotenv.2016.02.113, 2016.
Tobler, W. R.: A Computer Movie Simulating Urban Growth in the Detroit Region, Econ. Geogr., 46, 234–240, https://doi.org/10.2307/143141, 1970.
Turco, M., Bedia, J., Di Liberto, F., Fiorucci, P., Von Hardenberg, J., Koutsias, N., Llasat, M. C., Xystrakis, F., and Provenzale, A.: Decreasing fires in mediterranean Europe, PLoS One, 11, e0150663, https://doi.org/10.1371/journal.pone.0150663, 2016.
Urbieta, I. R., Franquesa, M., Viedma, O., and Moreno, J. M.: Fire activity and burned forest lands decreased during the last three decades in Spain, Ann. For. Sci., 76, 90, https://doi.org/10.1007/s13595-019-0874-3, 2019.
Viedma, O., Urbieta, I. R., and Moreno, J. M.: Wildfires and the role of their drivers are changing over time in a large rural area of west-central Spain, Sci. Rep., 8, 17797, https://doi.org/10.1038/s41598-018-36134-4, 2018.
Wang, X. L. and Swail, V. R.: Changes of extreme Wave Heights in northern Hemisphere Oceans and related atmospheric circulation regimes, J. Climate, 14, 2204–2221, https://doi.org/10.1175/1520-0442(2001)014<2204:COEWHI>2.0.CO;2, 2001.
Waskom, M. L.: seaborn: statistical data visualization, Journal of Open Source Software, 6, 3021, https://doi.org/10.21105/joss.03021, 2021.