the Creative Commons Attribution 4.0 License.
the Creative Commons Attribution 4.0 License.
 | 04 Feb 2021
A model for interpreting the deformation mechanism of reservoir landslides in the Three Gorges Reservoir area, China
Zongxing Zou
Huiming Tang
Robert E. Criss
Xinli Hu
Chengren Xiong
Qiong Wu
Yi Yuan
Landslides whose slide surface is gentle near the toe and relatively steep in the middle and rear part are common in the Three Gorges Reservoir area, China. The mass that overlies the steep part of the slide surface is termed the “driving section”, and that which overlies the gentle part of the slide surface is termed the “resisting section”. A driving–resisting model is presented to elucidate the deformation mechanism of reservoir landslides of this type, as exemplified by Shuping landslide. More than 13 years of field observations that include rainfall, reservoir level, and deformation show that the displacement velocity of Shuping landslide depends strongly on the reservoir level but only slightly on rainfall. Seepage modeling shows that the landslide was destabilized shortly after the reservoir was first impounded to 135 m, which initiated a period of steady deformation from 2003 to 2006 that was driven by buoyancy forces on the resisting section. Cyclical water level fluctuations in subsequent years also affected slope stability, with annual “jumps” in displacement coinciding with drawdown periods that produce outward seepage forces. In contrast, the inward seepage force that results from rising reservoir levels stabilizes the slope, as indicated by decreased displacement velocity. Corrective transfer of earth mass from the driving section to the resisting section successfully reduced the deformation of Shuping landslide and is a feasible treatment for huge reservoir landslides in similar geological settings.
- Article
(16073 KB) - Full-text XML
- BibTeX
- EndNote


Reservoir landslides attract wide attention as they can cause huge surge waves and other disastrous consequences (Huang et al., 2017; Wen et al., 2017; Froude and Petley, 2018). The surge wave produced by the 1963 Vajont landslide in Italy destroyed Longarone village and caused nearly 2000 fatalities (Paronuzzi and Bolla, 2012). A similar surge associated with the 2003 Qianjiangping landslide, which slipped shortly after the Three Gorges Reservoir (TGR) in China was first impounded, capsized 22 fishing boats and took 24 lives (Xiao et al., 2007; Tang et al., 2019). However, reinforcement structures are costly and difficult to construct, and thus many huge reservoir landslides have not been treated (Wang and Xu, 2013). Many remain in a state of continuous deformation, such that cumulative monitored displacements of several meters are now documented at the Huangtupo (Tang et al., 2015; Zou et al., 2020; Dumperth et al., 2016), Outang (Yin et al., 2016), and Baishuihe (Li et al., 2010; Du et al., 2013) landslides. Additional study of the deformation and failure mechanisms and risk reduction strategies of these huge reservoir landslides is of great significance.
Most research on the deformation or failure mechanism of reservoir landslides involves numerical modeling, physical model testing, or field observation. Many numerical simulations have studied how landslide geometry, material permeability, variation rate of water level, and pressure variation influence the stability of reservoir landslides (Rinaldi and Casagli, 1999; Lane and Griffiths, 2000; Liao et al., 2005; Cojean and Cai, 2011; Song et al., 2015). Both small-scale (Junfeng et al., 2004; Hu et al., 2005; Miao et al., 2018) and large-scale physical model experiments (Jia et al., 2009) have been conducted to investigate the deformation features of reservoir landslides related to water level change. Casagli et al. (1999) and Rinaldi et al. (2004) monitored the pore water pressure in riverbanks to determine its effect on bank stability.
Since the impoundment of TGR, monitoring systems have been installed on or within many reservoir landslides (Ren et al., 2015; Huang and Gu, 2017; Song et al., 2018; Wu et al., 2019), which provide valuable data for the study of their deformation features. Many studies show that reservoir water level variations and rainfall are the most critical factors that govern the stability and displacement velocities of reservoir landslides in TGR (Li et al., 2010; Tang et al., 2015; Ma et al., 2017; Wang et al., 2014). These phenomena are more obvious in the landslides with lower permeability and in the situations of rapid drawdown and heavy rainfall. In the low-permeability landslide, the groundwater is not easy to be discharged from the slope in the process of rapid drawdown and rainfall infiltration, which results in the formation of pressure difference between inside and outside of the landslide and reduces the stability of the landslide. However, the effects of rainfall and reservoir level are difficult to distinguish because the period of TGR drawdown is managed to coincide with the rainy season. Detailed deformation studies that incorporate long-term continuous monitoring data are needed to quantify how periodic water level variations affect reservoir landslides. Moreover, the evolutionary trend of these deforming landslides and feasible treatments for these huge reservoir landslides are rarely studied.
Many researchers have noticed that different parts of the slide mass play different roles in the landslide stability. Terzaghi et al. (1996) and Sultan and Seed (1967) presented the wedge method for analyzing landslides consisting of an active driving wedge and resisting block. Hutchinson (1984) presented an “influence-line” approach for assessing effectiveness of cuts and fills in stabilizing slopes. Baum and Fleming (1991) derived expressions for the boundary between driving and resisting elements of landslides for a shallow landslide. Iverson (1986), McKean and Roering (2004), Guerriero et al. (2014), Prokesova et al. (2014), and Handwerger et al. (2015) have further explored the influence of slip surface and landslide geometry on landslide deformation, force distribution, and landslide dynamics. These works provide a new perspective for the study of reservoir landslides.
This study presents a model combined with seepage simulations to elucidate how reservoir landslides deform, using the Shuping landslide as an example. The new environmental and deformation data provided here extend the observational period for this landslide to more than 13 years and include results that confirm the effectiveness of a control strategy that have been implemented.
2.1 Typical reservoir-induced landslides in the Three Gorges Reservoir
Figures 1 and 2 summarize the reservoir landslides of most concern in the TGR plus the world famous Vajont landslide. These landslides have many common features. First, all these landslides have large volumes, ranging from millions of cubic meters to tens of millions of cubic meters, and all are difficult to reinforce by conventional structures such as an anti-slide pile, retaining wall, etc. Second, the front part of the slide mass is always thicker than the rear part, with a maximum thickness from 40 m to over 100 m. Another important feature of these profiles (Fig. 1) is that the slope of the slide surface decreases gradually from the rear to the front and may become horizontal or even create an anti-dip in the front. Last, these landslides were reactivated after the reservoir impoundment, with large observed deformations indicating their metastable situation. All these features are relevant to the deformation behavior of reservoir landslides, as discussed below.

Figure 1Geological profiles for typical reservoir landslides, all in the TGR except Vajont in Italy (I). (a) Jiuxianping landslide (Wang, 2013); (b) Xicheng landslide (Song, 2011); (c) Outang landslide (Yin et al., 2016); (d) no. 1 riverside slump of Huangtupo landslide (Wang et al., 2014); (e) Muyubao landslide (Lu, 2012); (f) Baishuihe landslide (Lu, 2012); (g) Qianjiangping landslide (Xiao et al., 2007); (h) Ganjuyuan landslide (Qin, 2011); (i) Vajont landslide, the world-famous reservoir-induced landslide in Italy (Paronuzzi and Bolla, 2012). See Fig. 2 for locations.
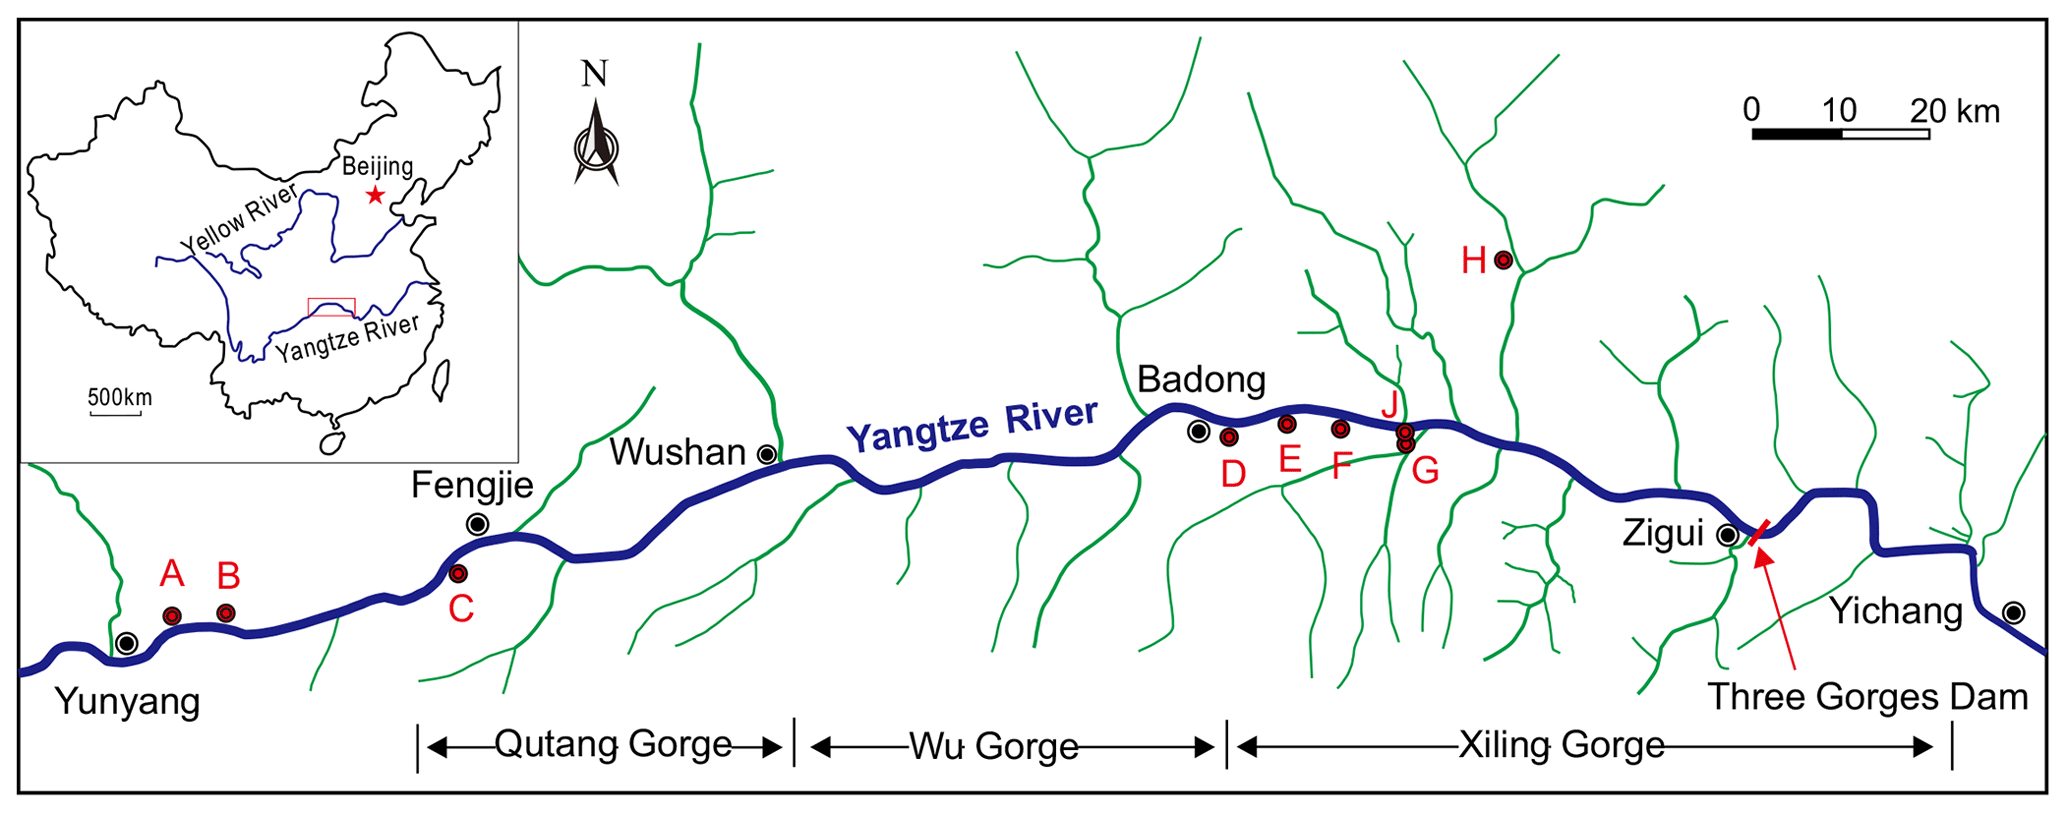
Figure 2Location map for important landslides in TGR. Jiuxianping landslide (a), Xicheng landslide (b), Outang landslide (c), Huangtupo landslide (d), Muyubao landslide (e), Baishuihe landslide (f), Qianjiangping landslide (g), Ganjuyuan landslide (h), Shuping landslide case study (j).
2.2 Driving–resisting model
Due to the relatively high slope of the slide surface in the middle and rear part, the slide force exceeds the resistance force on the proximal slide surface, producing extra thrust on the lower-front slide mass. Consequently, the rear-upper slide mass is termed the “driving section” (Fig. 3). In contrast, the potential slide surface underlying the lower-front part of the slide mass provides more resistance due to the relatively gentle slide surface slope and greater thickness of the slide mass. The lower-front part of the slide mass is termed the “resisting section” (Fig. 3) as it provides the main resistance force for the whole slide mass, thereby playing a critical role in landslide stability (Tang et al., 2015).

The resisting section is defined as the lower-front part of the slide mass, where each unit vertical slice (Fig. 3) can be self-stabilized under its own weight. According to the limit equilibrium method and the definition of the resisting section, the sliding force of each vertical slice is the component of its gravitational force along the slide surface, which cannot exceed the shear resistance provided by the base. The special position where the sliding force of the vertical slice equals the resistance force provided by the slide surface is regarded as the boundary between the driving and resisting sections. In the unit vertical slice of the resisting section, the difference between the forces on the two vertical sides is very tiny because the width of the unit vertical slice is very small, and the slide surface underlying the lower-front part of the slide mass is relatively gentle; so the interslice forces were ignored for the convenience of analysis. Force balance along the sliding direction for this special vertical slice can be written as
where w is the weight of the unit vertical slice; θ1 is the slope angle of the slide surface at the boundary between the driving and resisting sections; ΔL is the length of the slice base (see Fig. 3); and c and φ are the cohesion and internal-friction angle of the slide surface, respectively.
The weight of the slice w=γhΔx, where γ is the unit weight of the slide mass, h is the vertical distance from the center of the base of the slice to the ground surface, Δx is the unit width of the slice, and (Fig. 3). Thus Eq. (1) can be rewritten as
where f= tanφ, .
The solution to Eq. (2) provides the slope angle θ1 of the slide surface:
where .
According to the range of the shear strength parameters of the slip zone soil presented in the Engineering Geology Manual (Chang et al., 2007), empirical values for the cohesion of the slide surface are commonly less than 40 kPa, while the internal-friction angle of the slide surface commonly varies between 10 and 25∘, and the unit weight of the soil is typically about 20 kN/m3. In order to further elucidate the effect of various parameters on the length of the resisting section, contour maps of θ1 under different shear strength parameters c and φ and the thickness of the slide mass h are plotted (Fig. 4), as derived from Eq. (3).
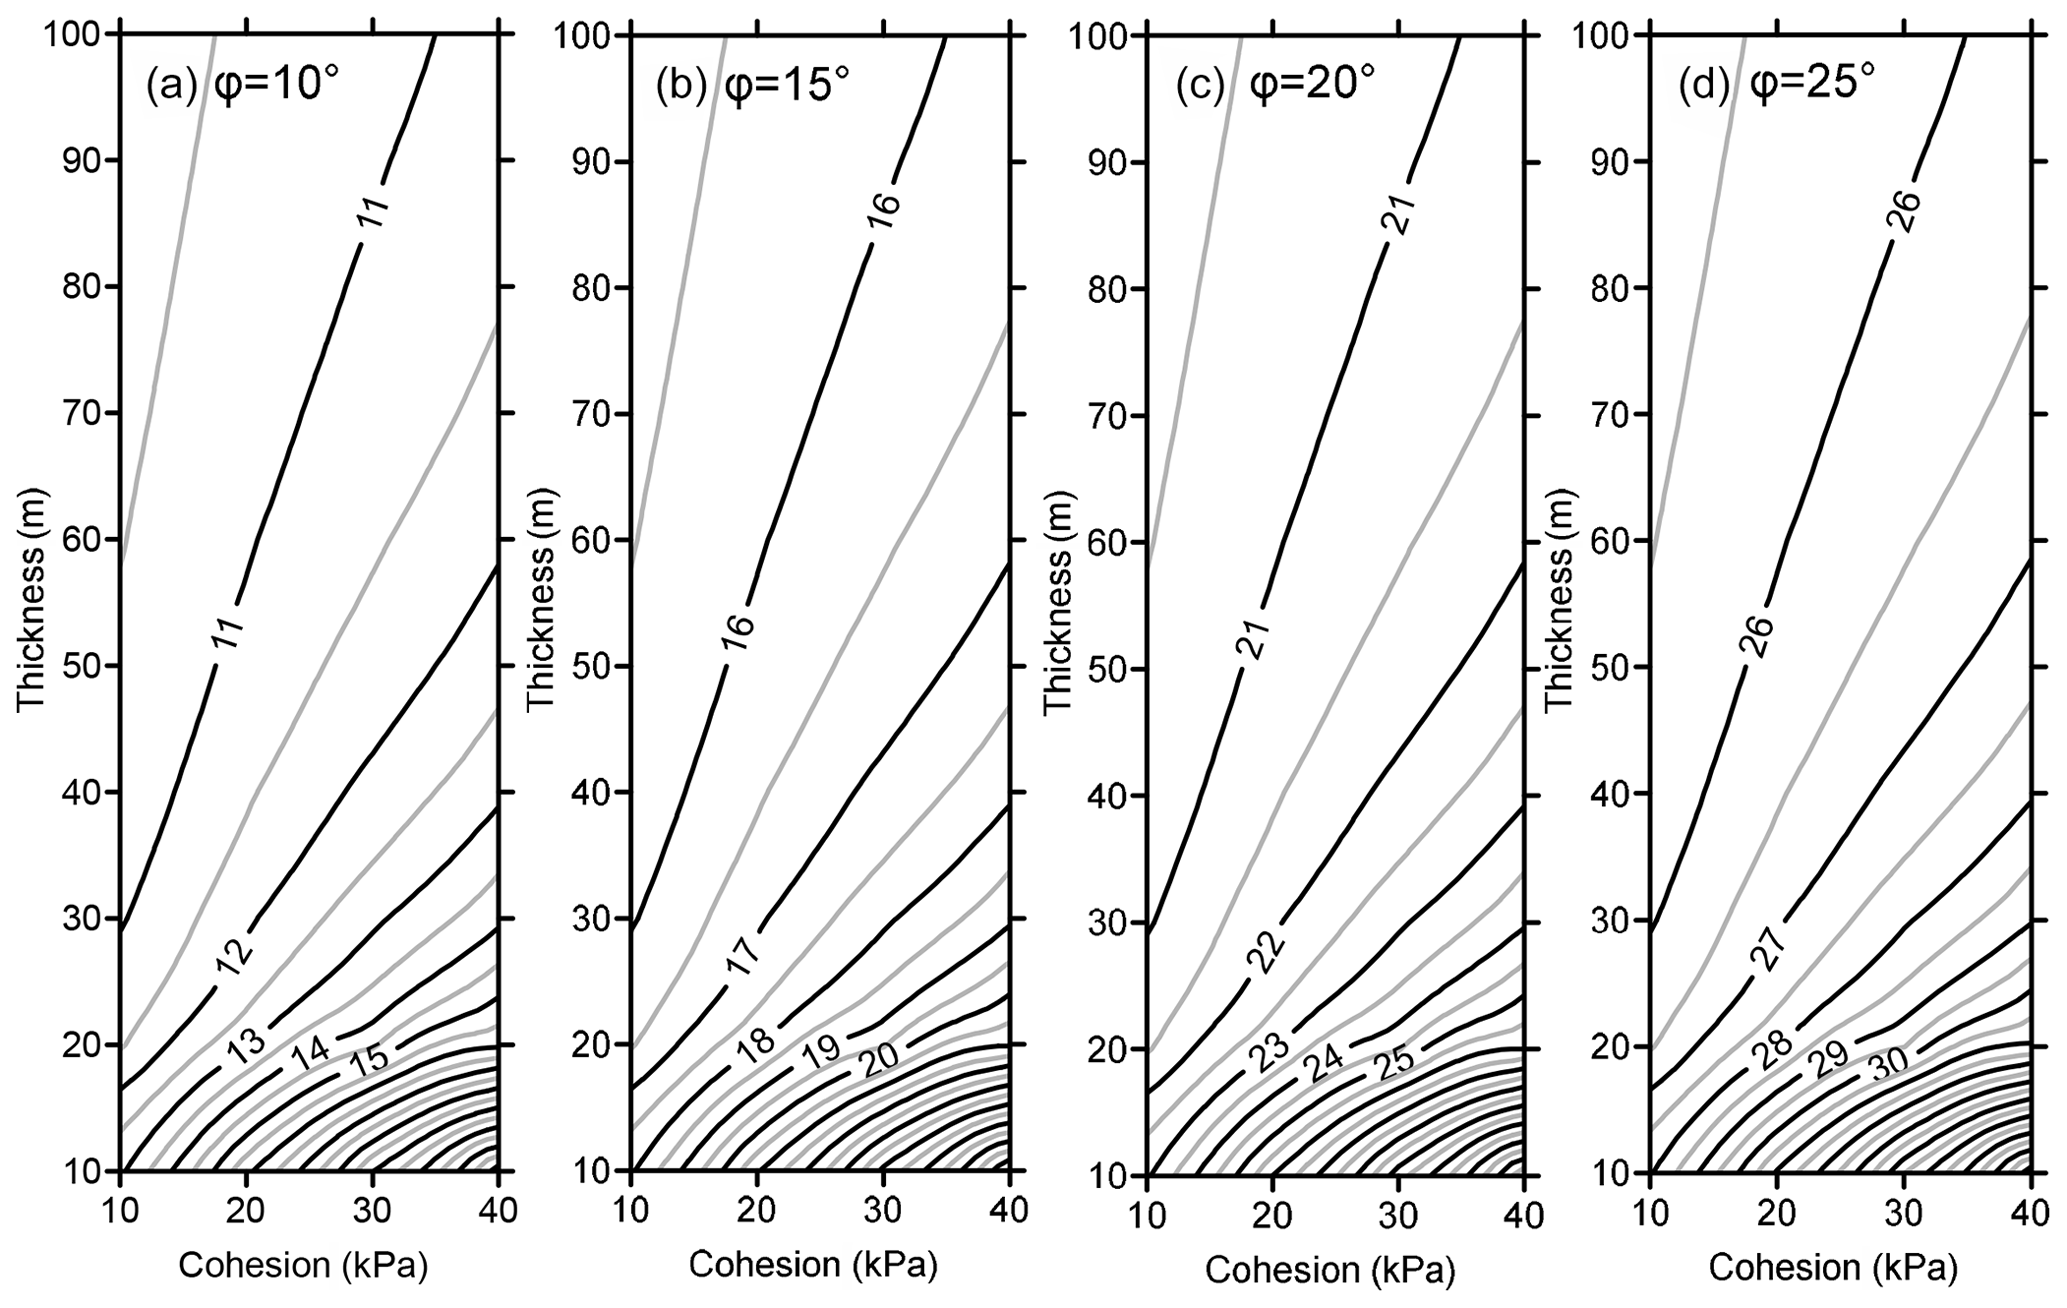
Figure 4Contour maps for the slope angle θ1 of slide surface that denotes the boundary between the driving and resisting sections under various shear strength parameters and slide mass thickness.
Figure 4 shows that θ1 increases as the internal-friction angle φ increases; however, by comparison of the pattern and the values of the contour in the four sub-figures, the difference between θ1 and φ has little relationship to φ. Due to the effect of cohesion, θ1 is always larger than φ, as shown in Fig. 4. As the cohesion c decreases, the difference between θ1 and φ decreases, and for cohesionless material with c= 0, θ1 is equal to φ. Figure 4 also shows that when the thickness of the slide mass reaches about 40 m, the difference between θ1 and φ is very small (less than 3∘), which becomes even less as the thickness increases. These results indicate that for the thick slide mass (up to 40 m), the boundary between the resisting and driving sections can be approximated as the position where the slope angle θ1 equals the internal-friction angle φ.
2.3 Effect of water force on the resisting and driving sections
The impacts of the water level change on the reservoir slope stability can be quantified by analyzing the changes in water force on the slope. Lambe and Whitman (2008) have demonstrated that the water forces acting on an element of the slope can be equivalently expressed either by the ambient pore water pressure (Fig. 5a) or by seepage and buoyancy forces (Fig. 5b). The latter form, i.e., seepage and buoyancy forces, is employed here to clarify the mechanical mechanism of water force on the reservoir bank.
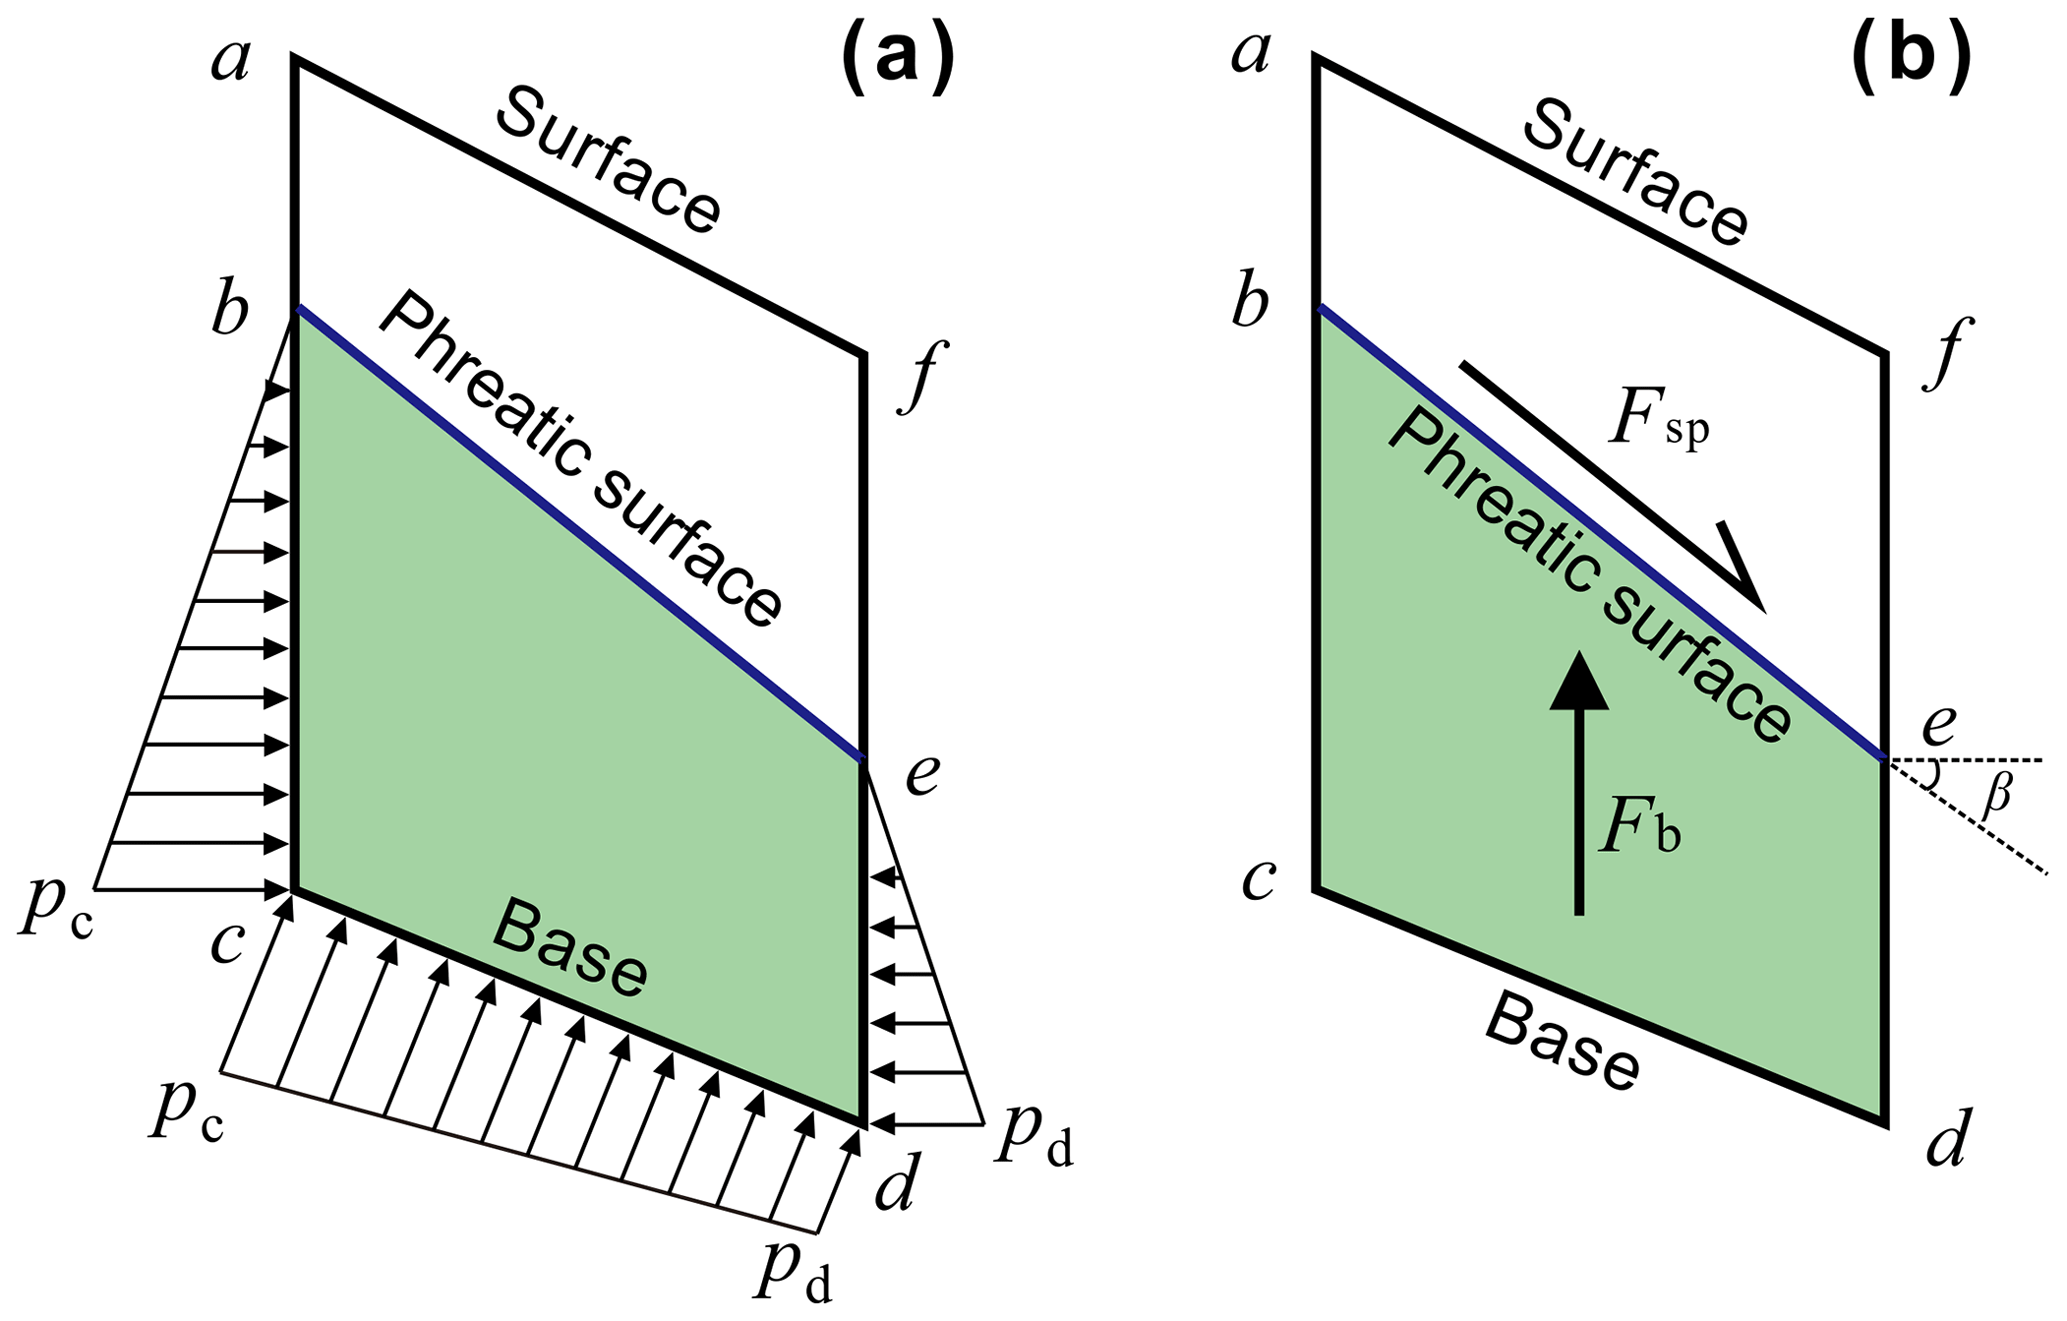
Figure 5Two equivalent ways to display the water force acting on a slice of the slide mass. (a) Expressed by pore water pressure, (b) expressed by the seepage force Fsp and the buoyancy force Fb.
The seepage force (Fsp) represents the frictional drag of water flowing through voids that is proportional to the hydraulic gradient and acts in the direction of flow (Lambe and Whitman, 2008). It can be expressed as
where γw is the unit weight of water; i is the hydraulic gradient and equals sinβ, where β is the slope angle of the phreatic surface; and V is the submerged volume of the analyzed element as the trapezoid area enclosed by points bcde in Fig. 5.
When the groundwater flows outwards as occurs during reservoir level drops, the corresponding outward seepage force decreases the slope stability. In contrast, the seepage force will be directed inward during reservoir level rise, increasing slope stability.
The buoyancy force (Fb) of the water exerted on the element can be expressed as
The factor of safety (Fos) used to quantify the slope stability can be defined as the ratio of the shear strength (resistance, Fr) along the potential failure surface to the sliding force (Fs) by the Mohr–Coulomb failure criterion (Wang et al., 2014):
where n is the total number of slices, N is the normal force on the base of each slice, and the other symbols are as above. Suppose that the variation in the effective weight of the slide mass in a slice is Δw due to the change in buoyancy force, which thereby modifies the resistance and sliding forces by ΔFr and ΔFs, respectively. The corresponding change in the factor of safety ΔFos is
The ratio of ΔFr to ΔFs for a vertical slice due to the change in its effective weight Δw is approximately
Suppose that , where the change in the vertical slice weight has no influence on the current stability (ΔFos = 0). If θ < θ2, and Δw > 0, then ΔFos > 0, indicating that increase in the weight of the lower-front part of the slide mass where its slope angle of the slide surface θ is less than θ2 will improve the stability of the whole slide mass; conversely, decrease in the weight of the lower-front part would decrease stability. In contrast, the upper-rear part has a contrary tendency. As mentioned above, continuously deformed reservoir landslides are metastable, and their corresponding Fos is around 1; hence θ2≈φ. Consequently, in the cases that reservoir landslide is in a metastable state and has a thickness up to 40 m, , the resisting section and driving section have the same mechanical behavior as described above. Either an increase in the weight of the resisting section or a decrease in the weight of the driving section will improve the stability of the slope and vice versa.
In summary, the effect of groundwater on the slope or landslide stability can be resolved into a seepage force and a buoyancy force. The effect of the seepage force on slope stability depends on the direction and magnitude of flow. Buoyant forces change the effective weight of the slide mass and have contrary effect on the resisting and driving sections. On the basis of these rules, the mechanical mechanism for reservoir-induced landslide can be illustrated as Fig. 6.

Figure 6Mechanical mechanism for reservoir-induced landslide. (a) Water level rise, (b) water level drop, (c) effects of various mechanisms on the landslide stability during water level rise and drop.
Shuping landslide is located in Shazhenxi Town, Zigui County, Hubei Province, on the south bank of the Yangtze River, 47 km upstream from the Three Gorges dam (Fig. 2). After the first impoundment of the reservoir in 2003, serious deformation was observed that endangered 580 inhabitants and navigation on the Yangtze River (Wang et al., 2007). Previous studies of the Shuping landslide utilized GPS extensometers (Wang et al., 2007) or field surveys (Lu et al., 2014) to clarify the deformation. This study provides a detailed geomechanical model that includes seepage and buoyancy effects to clarify the deformation mechanism of this landslide, which is calibrated by long-term monitoring data.
3.1 Geological setting
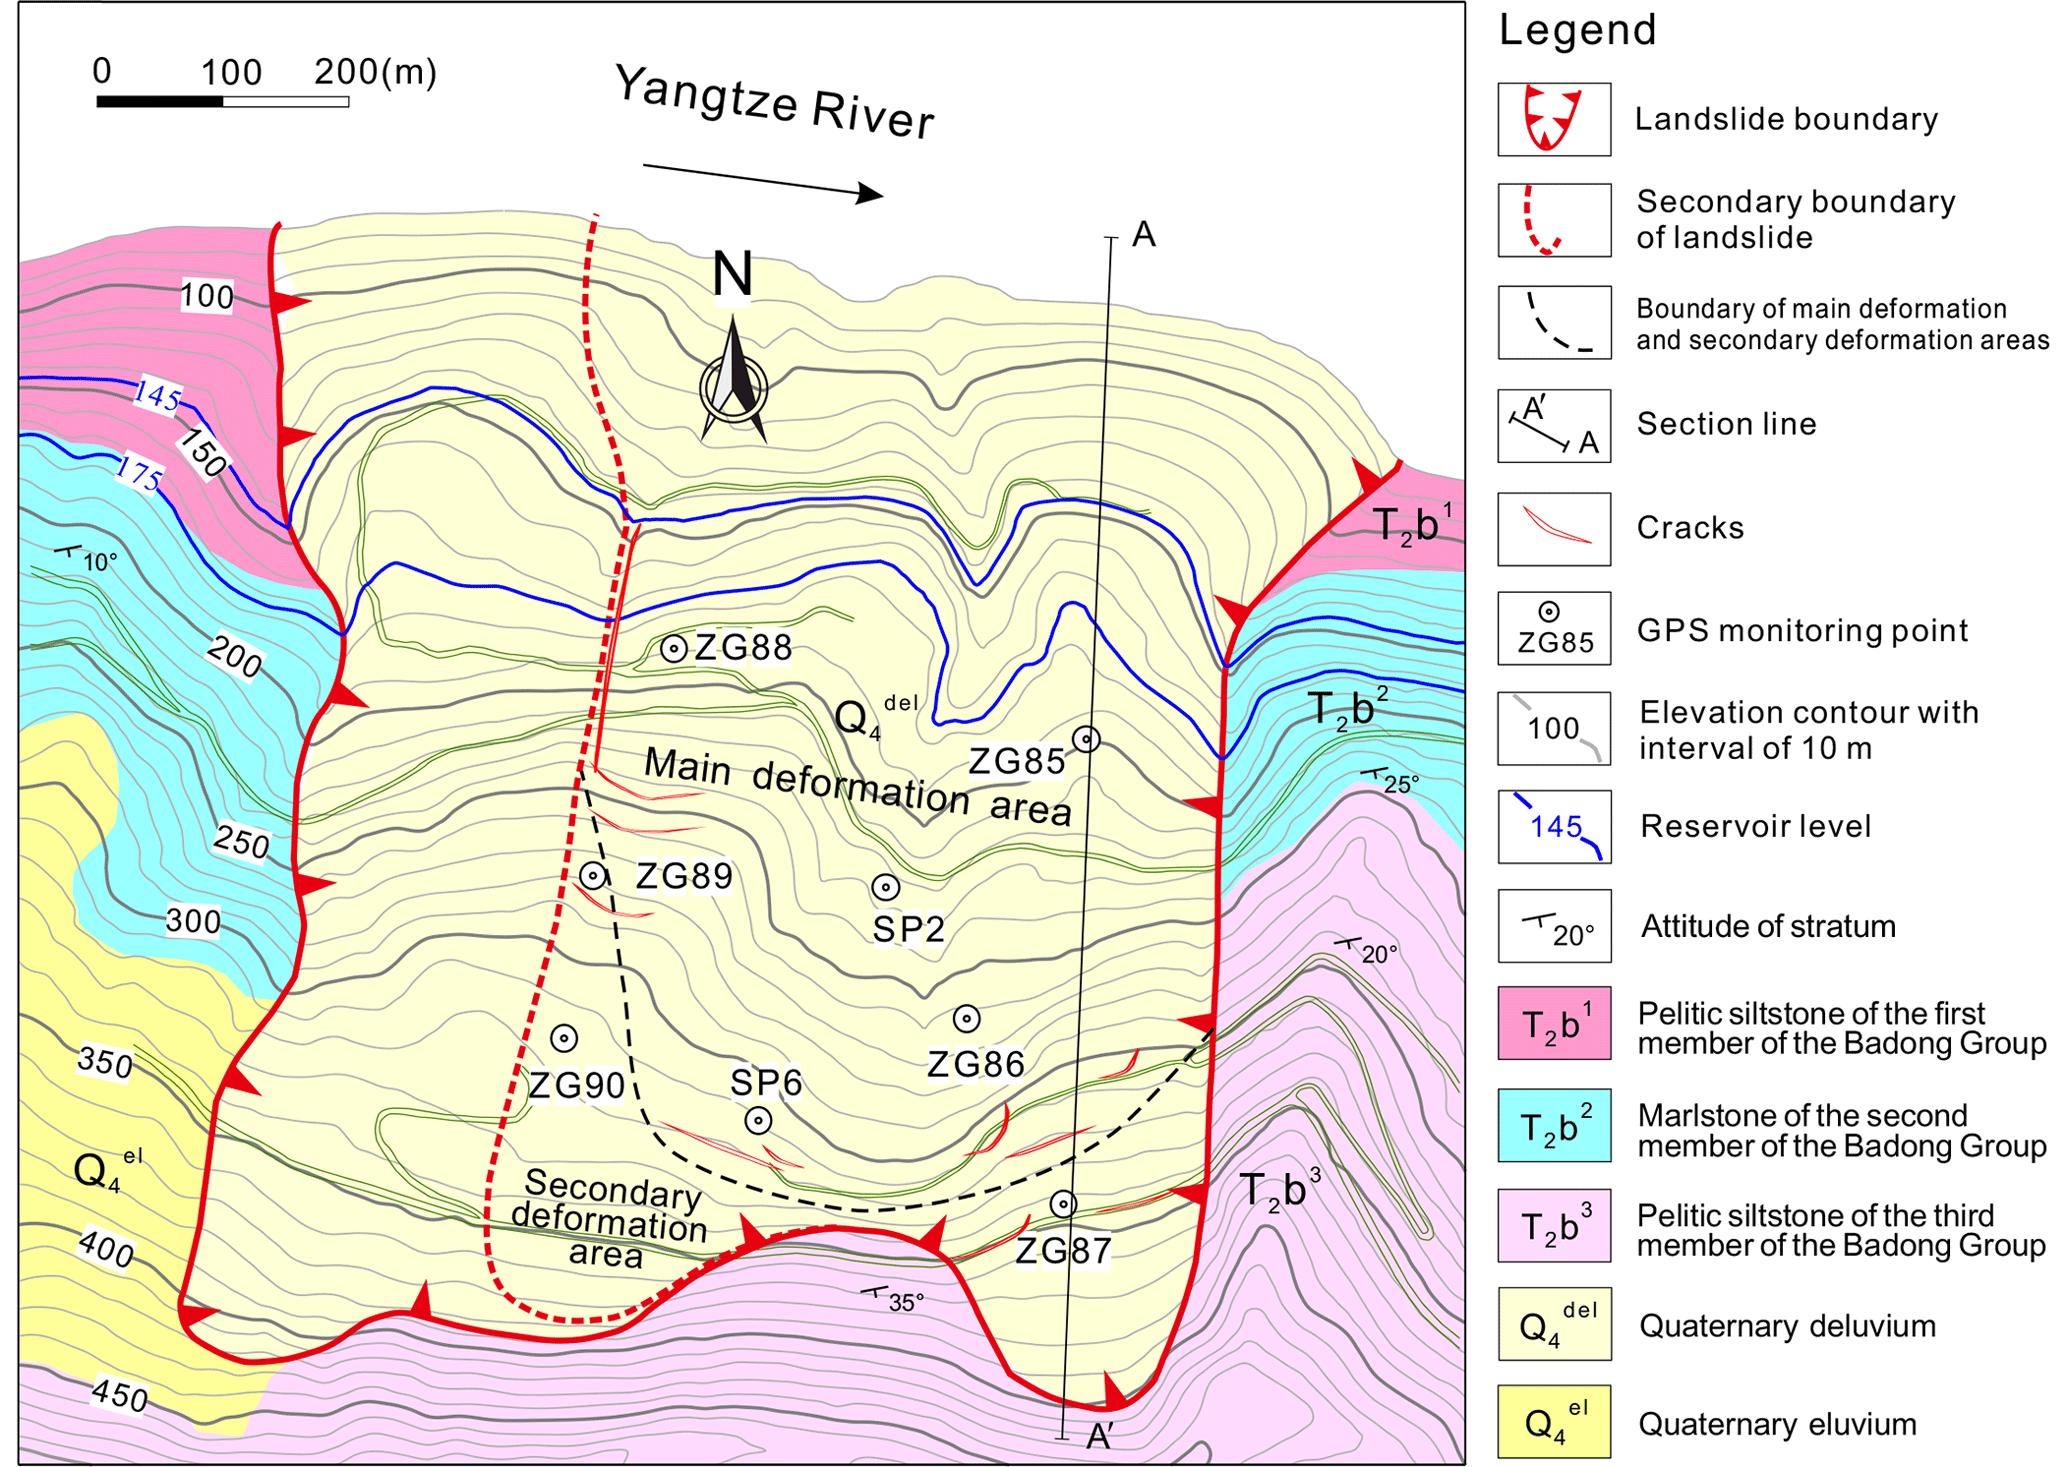
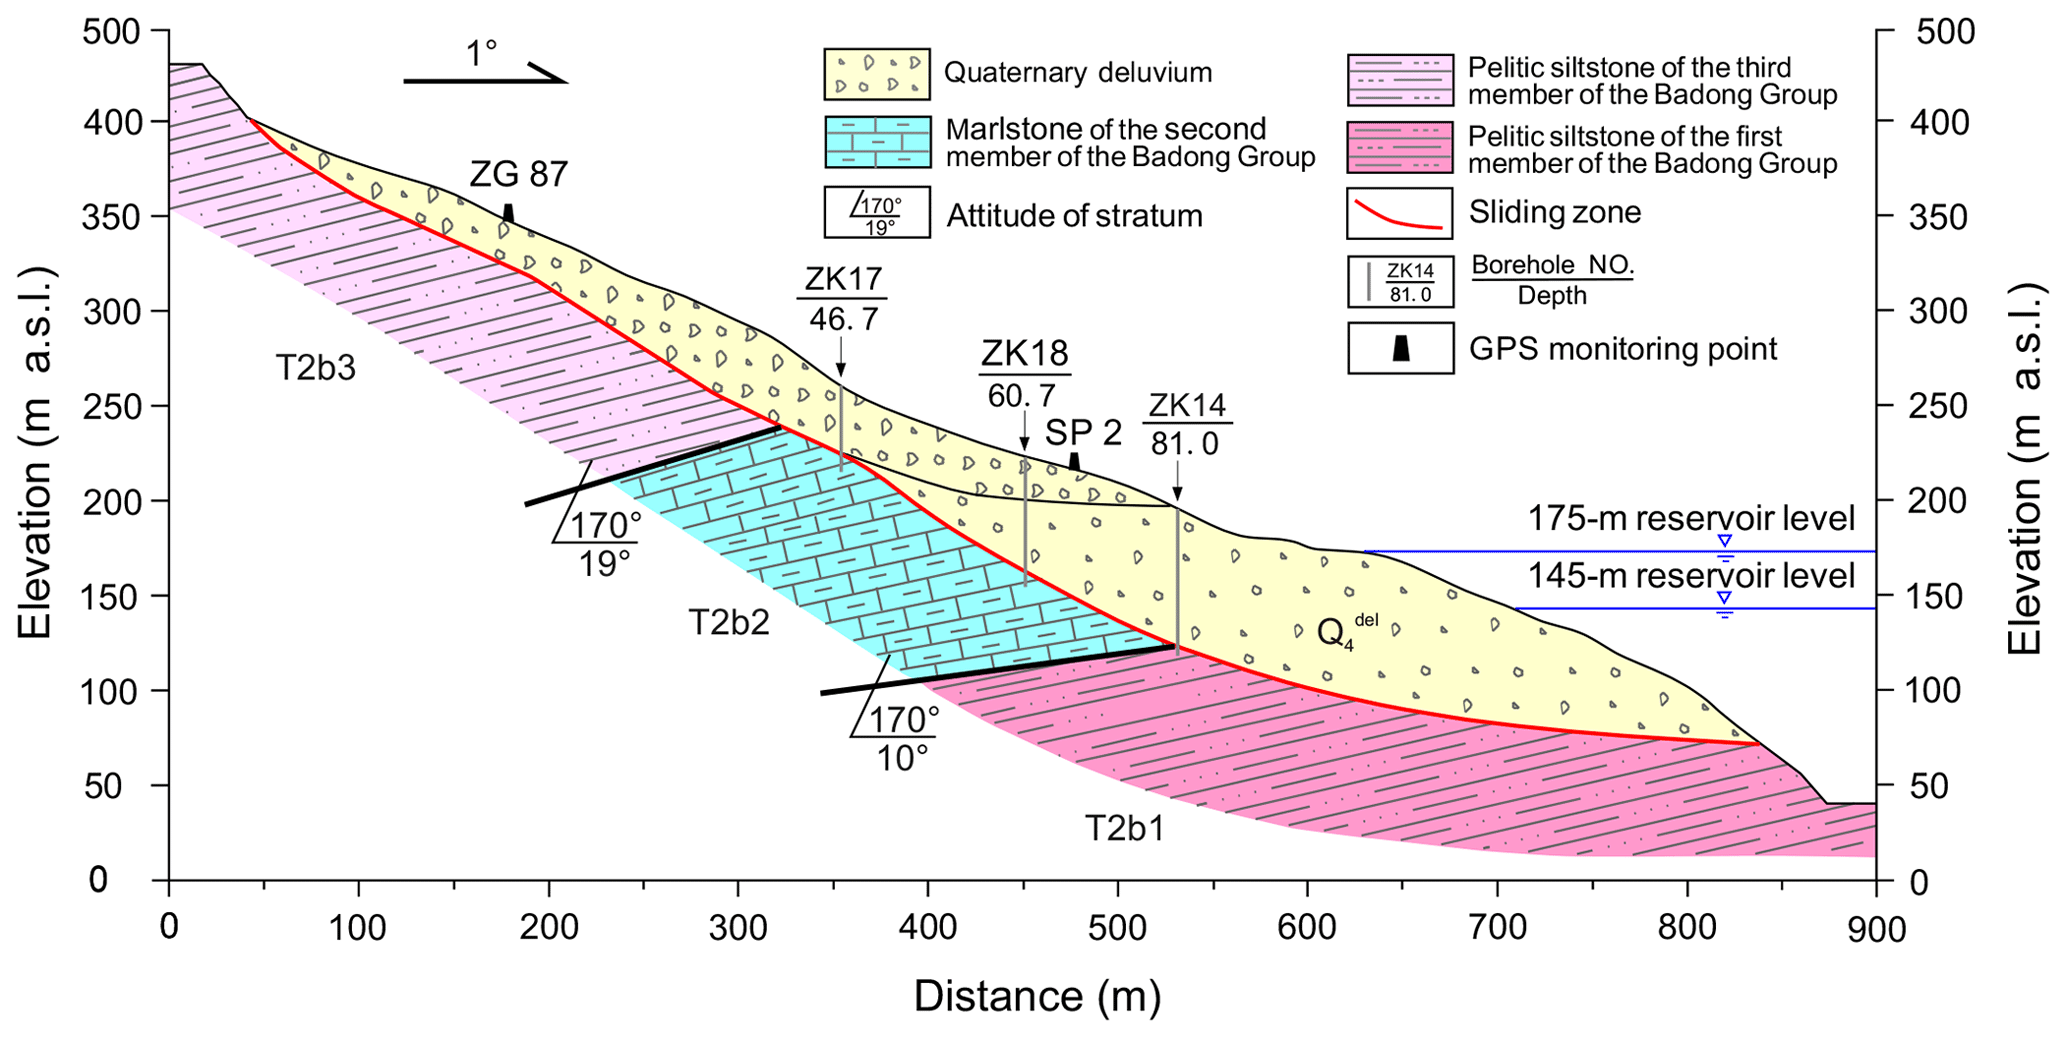
The Shuping landslide is a chair-shaped slope that dips 20 to 30∘ to the north, toward the Yangtze River. The landslide is bounded on the east and west by two topographic gutters. The altitude of its crown is 400 m above sea level (a.s.l.), while its toe is about 70 m a.s.l., which is now submerged by the reservoir, the level of which varies annually between 145 and 175 m a.s.l. (Fig. 7). Borehole and inclinometer data (Lu et al., 2014) indicate that there are two major slide surfaces within the west part of the slope, and the upper rupture zone divides the slide mass into two parts (see Fig. 7). The whole slide mass has a thickness of 30–70 m, a N–S length of about 800 m, and a W–E width of approximately 700 m, constituting a total volume of ∼27.5 million m3, of which 15.8 million m3 represents the main slide mass.
Shuping landslide is situated on an anti-dip bedrock of marlstone and pelitic siltstone of the Triassic Badong Group (T2b) (Fig. 8). The upper part of the slide mass is mainly composed of yellow and brown silty clay with blocks and gravels, while the lower part of the slide mass mainly consists of dense clay and silty clay with gravels, with a thickness of about 50 m on average. The deep rupture zone is a 0.6–1.7 m layer that extends along the surface of bedrock and consists of yellowish-brown to steel gray silty clay. The upper rupture zone in the west part has a similar composition and has an average thickness of 1.0–1.2 m. The dip angle of the slide surface decreases gradually from the rear to the front (Fig. 8), so the driving–resisting model is appropriate for Shuping landslide. Before reservoir impoundment, boreholes ZK17 and ZK18 were dry, but borehole ZK14 contained groundwater near the rupture zone.
3.2 Monitoring instrumentation
The displacement monitoring system of Shuping landslide consists of 11 global positioning system (GPS) survey points, three of which are datum marks that were installed on stable ground outside the landslide area, with the remainder being on the main slide mass (Fig. 7). Seven of the GPS monitoring points (SP2, ZG85, ZG86, ZG87, ZG88, ZG89, and ZG90) were set in June 2003, and GPS monitoring point SP6 was set in August 2007. All the GPS monitoring points were surveyed every half month, and the system was upgraded to automatic, real-time monitoring in June 2012. The daily rainfall records are obtained from the Meteorological Station near the Shuping landslide. Daily reservoir level is measured by the China Three Gorges Corporation (source: https://www.ctg.com.cn/sxjt/sqqk, last access: 15 December 2019).
3.3 Engineering activity
The evolution of Shuping landslide is related to four stages of human activity (Fig. 9). The first stage was the 139 m a.s.l. trial reservoir impoundment (from April 2003 to September 2006). The reservoir water level was lifted from 69 to 135 m a.s.l. and then changed between 135 and 139 m a.s.l. The second stage was 156 m a.s.l. trial reservoir impoundment (from September 2006 to September 2008). The reservoir water level was raised from 139 to 156 m a.s.l. and then varied annually between 145 and 156 m a.s.l. The third stage was 175 m a.s.l. trial reservoir impoundment. This stage began when the reservoir water level was raised to 175 m a.s.l. and thereafter managed to annually vary between 145 and 175 m a.s.l. (Tang et al., 2019). During the fourth stage, an engineering project for controlling the deformation of Shuping landslide was conducted in September 2014 and completed in June 2015 (see Sect. 6 for detailed description).
4.1 Overall deformation feature
According to the deformation features revealed by the GPS monitoring system (Figs. 9, 10) and field investigations, the main slide mass can be divided into a main deformation area and a secondary-deformation area (Fig. 7). The main deformation area underlies most of the area and has a cumulative displacement up to 4–5 m, as measured at sites ZG85, ZG86, ZG88, SP2, and SP6. During the 13-year monitoring period, point SP2 underwent the largest cumulative displacement (5.168 m), followed by ZG86 and ZG88, which recorded 5.039 and 4.919 m, respectively. Deformations were essentially synchronous at the monitoring sites as indicated by the similar shape of their cumulative-displacement curves, which typically show steady rises in the first impoundment stage, step-like trends in the second and third impoundment stages, and flat trends after the engineering treatment. Deformations were smaller and steadier in the secondary-deformation area, as indicated by gentle cumulative-displacement curves at ZG89, ZG90, and ZG87, which recorded cumulative displacements of 0.5–2 m during 2003 to 2016.


Figure 10Time series of reservoir level, rainfall, and landslide displacement from 2003 to 2016. (a) Reservoir water levels and variation rates (positive for level rise, negative for level drop), (b) displacement velocity of the GPS points in the main deformation area and monthly rainfall, (c) displacement velocity of the GPS points in the secondary-deformation area and monthly rainfall.
4.2 Deformation feature in different stages
After the reservoir level first rose to 135 m a.s.l. in June 2003, the main deformation area deformed at an average velocity of 15.6 mm/month until September 2006, with each site recording rather steady displacement curves whose tiny or nonexistent steps correspond to the small annual variations in reservoir level. In contrast, no obvious deformation occurred during Stage 1 at ZG89 and ZG90 in the secondary-deformation area.
During the earliest 2 months of Stage 2 (September, October 2006), when the reservoir level first rose to 156 m a.s.l., displacement velocities of the main deformation area decreased to 13.4 and 9.7 mm/month, respectively, indicating that slide mass stability had improved. For the next 2 months (November, December), the velocity increased to 11.5 and 14.3 mm/month as the reservoir level was steady at 156 m a.s.l. During the subsequent drawdown period, when the reservoir level dropped to 145 m a.s.l. in 2007, the displacement velocity increased to a maximum of about 100 mm/month (Fig. 10), resulting in an average “jump” of 458 mm in the cumulative-displacement curve, which then became flat, while the reservoir remained at 145 m (Fig. 9).
During the beginning of Stage 3, when the reservoir first rose to nearly 175 m in October 2008, the displacement velocity of the main deformation area decreased to 12.7 mm/month compared to 65, 74, and 32 mm/month in the previous 3 months. Shortly after the reservoir rose to its highest level, the level underwent a gradual decline, and the displacement velocity increased steadily. The maximum displacement velocity reached 378.6 mm/month at ZG88 in May 2009, when the water level declined rapidly, a rate almost 4 times higher than when the reservoir dropped from 156 to 145 m a.s.l. in 2007. Then the displacement velocity decreased to a relatively low value when the water level was steady at 145 m a.s.l. (Fig. 10b).
In the subsequent 6 years of Stage 3, the reservoir level underwent a series of similar annual variations, and the slide mass responded with a series of deformation “jumps”. During these cycles, the displacement velocity decreased as the reservoir rose, maintained low values when the reservoir remained high, began to increase as drawdown began, and attained values up to 165 mm/month when drawdown was rapid. The corresponding cumulative-displacement curves featured obvious “jumps” during drawdown periods, then became relatively flat as the reservoir was maintained at the low level of 145 m a.s.l.. Clearly, these results show that displacement velocity is high during reservoir drawdown and low during reservoir rise.
After the engineering treatment was completed in June 2015, the “jumps” in the cumulative-displacement curves disappeared, and the curves became very flat (Fig. 9). The deformation was reduced to a low level of 4.1 mm/month in the main deformation area, demonstrating effective treatment.
4.3 Effect of water level fluctuation and rainfall on the deformation of Shuping landslide
The largest “jump” in the cumulative-displacement curves averaged 479 mm and occurred in May to June 2012, while the second was the jump of 458 mm in May to June 2009. These periods corresponded with the two highest drawdown rates of 9.67 and 9.38 m/month, respectively (Fig. 10a). During these 2 years, rainfall amounts were relatively low, with monthly maxima of 180 mm/month in 2009 and 190 mm/month in 2012 (Fig. 10). These data clearly demonstrate that the deformation of Shuping landslide is primarily driven by reservoir level variations and not by rainfall. This relationship is also confirmed by the low displacement velocities and flat cumulative-displacement curves during the July and August peak of the rainy season, when the reservoir is held at its lowest level.

Figure 11Monitoring data of GPS point SP2 on the middle part of slide mass, from December 2013 to September 2014.
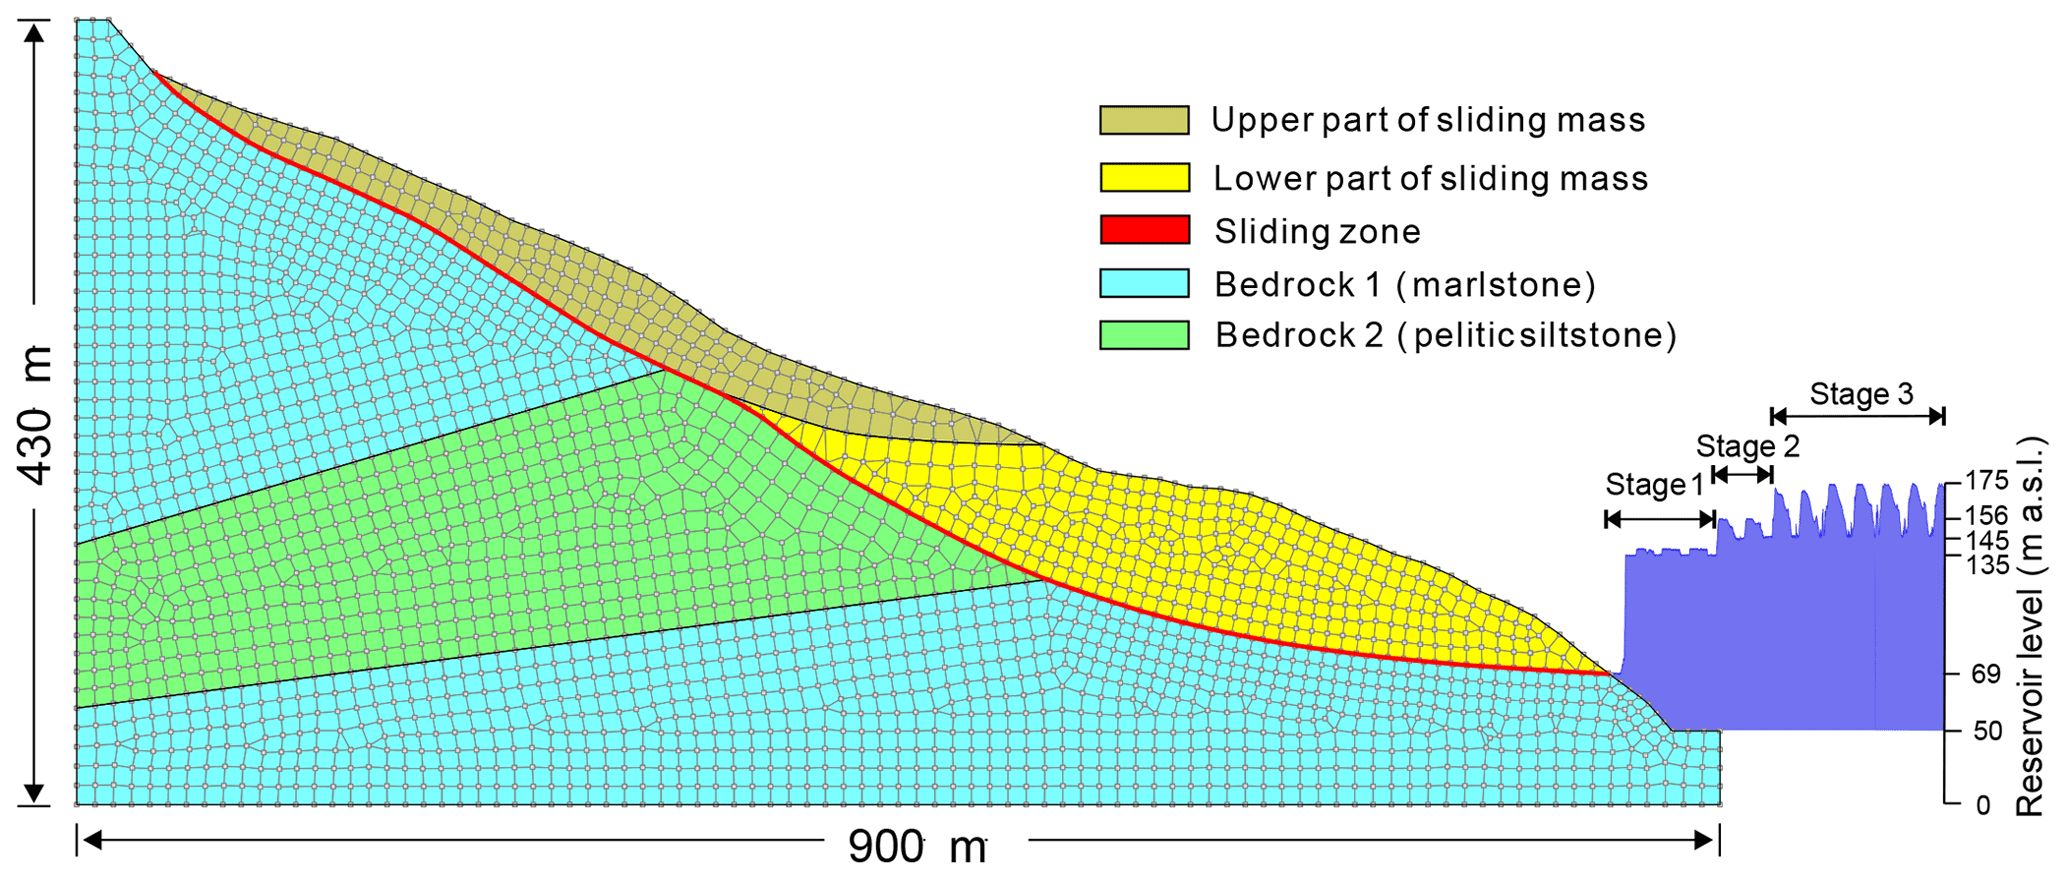
Figure 11 clarifies the influence of reservoir level and rainfall on landslide deformation. In December 2013, the reservoir level dropped at an average rate of 0.041 m/d, and the corresponding displacement velocity was 0.22 mm/d. In the subsequent 3 months, the drawdown rate of the reservoir level increased to 0.147 m/d, and the displacement velocity rose to 0.54 mm/d. During March 2014, the displacement velocity decreased as the water level increased, even though intense rainfalls were recorded during this period (up to 27.5 mm/d). In the following rapid-drawdown period (0.419 m/d) from May to June, the displacement velocity increased to about 5 mm/d. Subsequently, the displacement velocity decreased to less than 1.2 mm/d as the water level remained low, although rainfall was abundant. These details confirm that the displacement velocity of the Shuping landslide is positively related to the drop rate of the reservoir, with rainfall having little effect.
Unlike the flat displacement curves and low displacement velocity in other years when the reservoir level was steady at the lowest annual level in July and August, displacement velocities were large in 2008 and 2010 (65.0 and 73.8 mm/month in July and August 2008; 58.4 mm/month in July 2010; about half of the average highest monthly displacement velocity, 165 mm/month, during rapid-drawdown period). Very heavy rainfall was recorded during those periods, up to 300 mm/month. However, August 2011 had the next heaviest rainfall of 250 mm/month, yet the cumulative-displacement curve remained flat, and the displacement velocity was low (22.2 mm/month). These data illustrate that heavy rainfall can decrease landslide stability and accelerate deformation but nevertheless is a secondary factor. The difference in the displacement velocity between the months with the highest (2008, 2010) and the second-highest (2011) levels of rainfall suggests that a threshold exists, with rainfall exceeding this value having a significant effect but rainfall below this value having little significance. This threshold appears to be about 250–300 mm/month.
In this section, groundwater flow in the Shuping slope under the variation in the reservoir level is simulated to assist the driving–resisting model to explain the deformation process of Shuping landslide. Seepage simulation is performed by the SEEP/W module of the GEOSTUDIO software (see http://www.geoslope.com, last access: 15 September 2017). The deformation state of the landslide is usually regarded as the performance of the landslide stability state (Wang et al., 2014; Huang et al., 2017). Thus, the Fos (factor of safety) of the Shuping landslide is calculated with the simulated groundwater level to evaluate the stability of the Shuping landslide under various impoundment scenarios. In this study, the Fos of the Shuping landslide is calculated by the Morgenstern–Price method using the SLOPE/W module of the GEOSTUDIO software. The external impoundment load affect is considered by this software. A different evaluation method for landslide stability will lead to a different value of Fos; thus we only employ the calculated values of Fos to investigate the variation trend of the landslide stability.
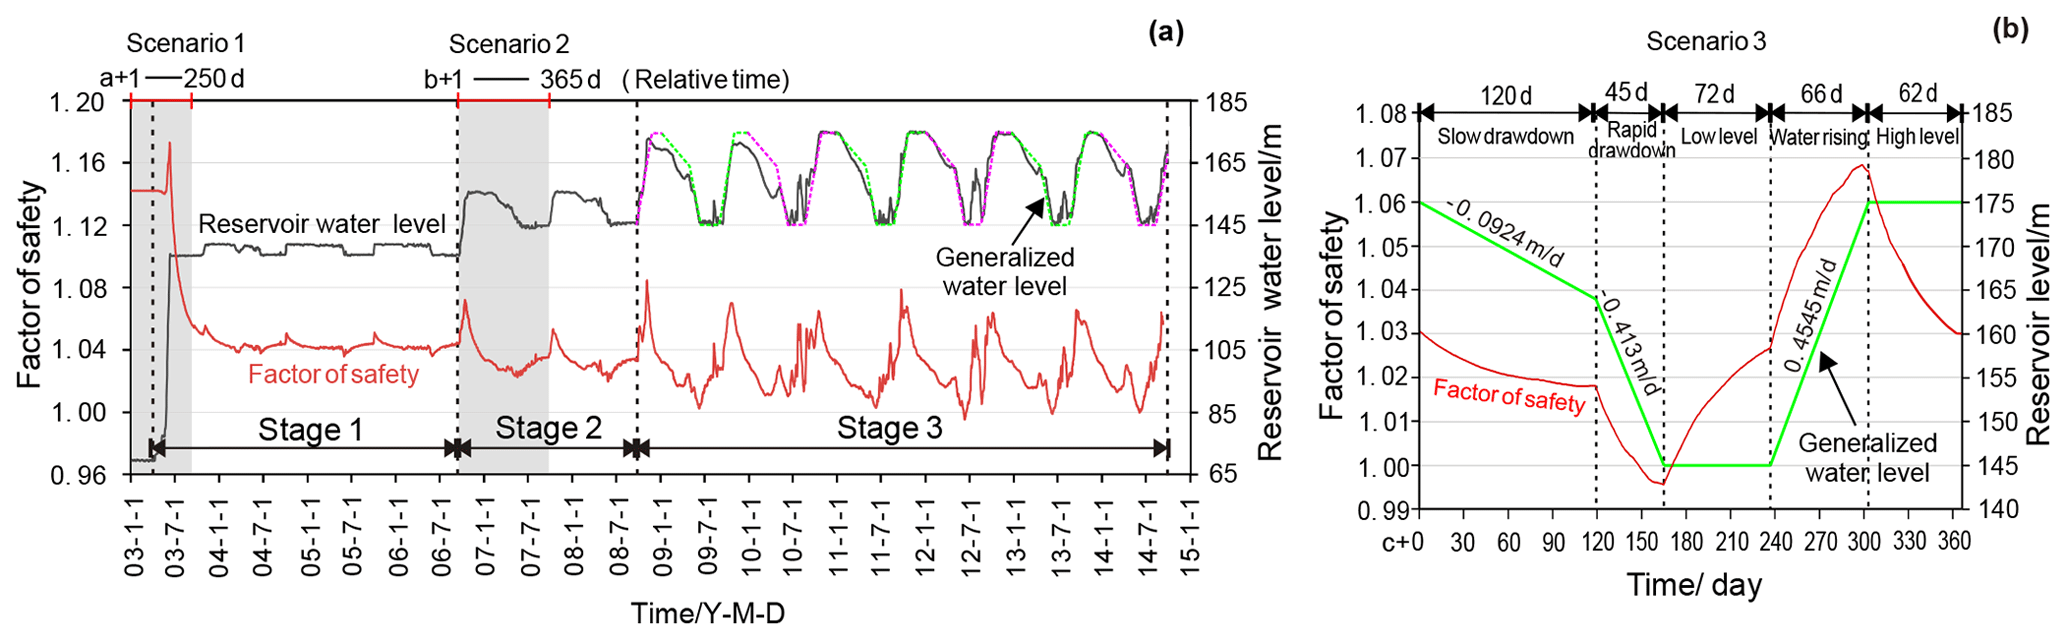
Figure 13(a) Time series of reservoir level and corresponding calculated Fos of Shuping landslide from 1 January 2003 to 10 September 2014. (b) Generalized annual variation curve of the reservoir level obtained by fitting the real water level from 2008 to 2014 (Stage 3) and the corresponding time series of the calculated Fos of Shuping landslide.
Figure 12 shows the numerical simulation model of the Shuping landslide, whose framework is based on the geological profile map in Fig. 8. The slope was divided into six regions composed of five materials with different properties (Table 1). Zero-flux boundary conditions were assigned along the bottom horizontal and the right vertical boundaries. A constant water head was applied at the left vertical boundary according to the water table in the borehole. The optimum water head at the left boundary is 230 m a.s.l. The hydrograph of TGR from 1 January 2003 to 10 September 2014 (Fig. 13a) and generalized hydrograph of the trial impoundment at 175 m a.s.l. (Fig. 13b) were used to define the right boundary adjacent to the reservoir. Initial conditions were defined using the water tables revealed by boreholes.
Table 1Hydrologic and mechanical properties of Shuping landslide.

a Provided by Hubei Province Geological Environment Terminus (2013). b Values of similar material from the literature (Hu et al., 2015).
5.1 Scenario 1: first trial impoundment at 139 m a.s.l.
From 10 April to 11 June 2003 (a+100–162 d), the reservoir level rose rapidly from 69 to 135 m a.s.l. Figure 14 shows that, during this period, groundwater storage increased in the toe of the slide mass and within the lower part of the resisting section, increasing buoyancy forces that destabilized the slope. In contrast, the inwardly directed flow created a seepage force directed towards the slope (Fig. 14b), increasing stability. Owing to the high hydraulic gradient, the stabilizing effect of the seepage force on the slope prevails over the destabilization due to increased buoyancy, so slope stability was improved during this phase, as indicated by the increase in Fos up to 1.17 (Fig. 13).
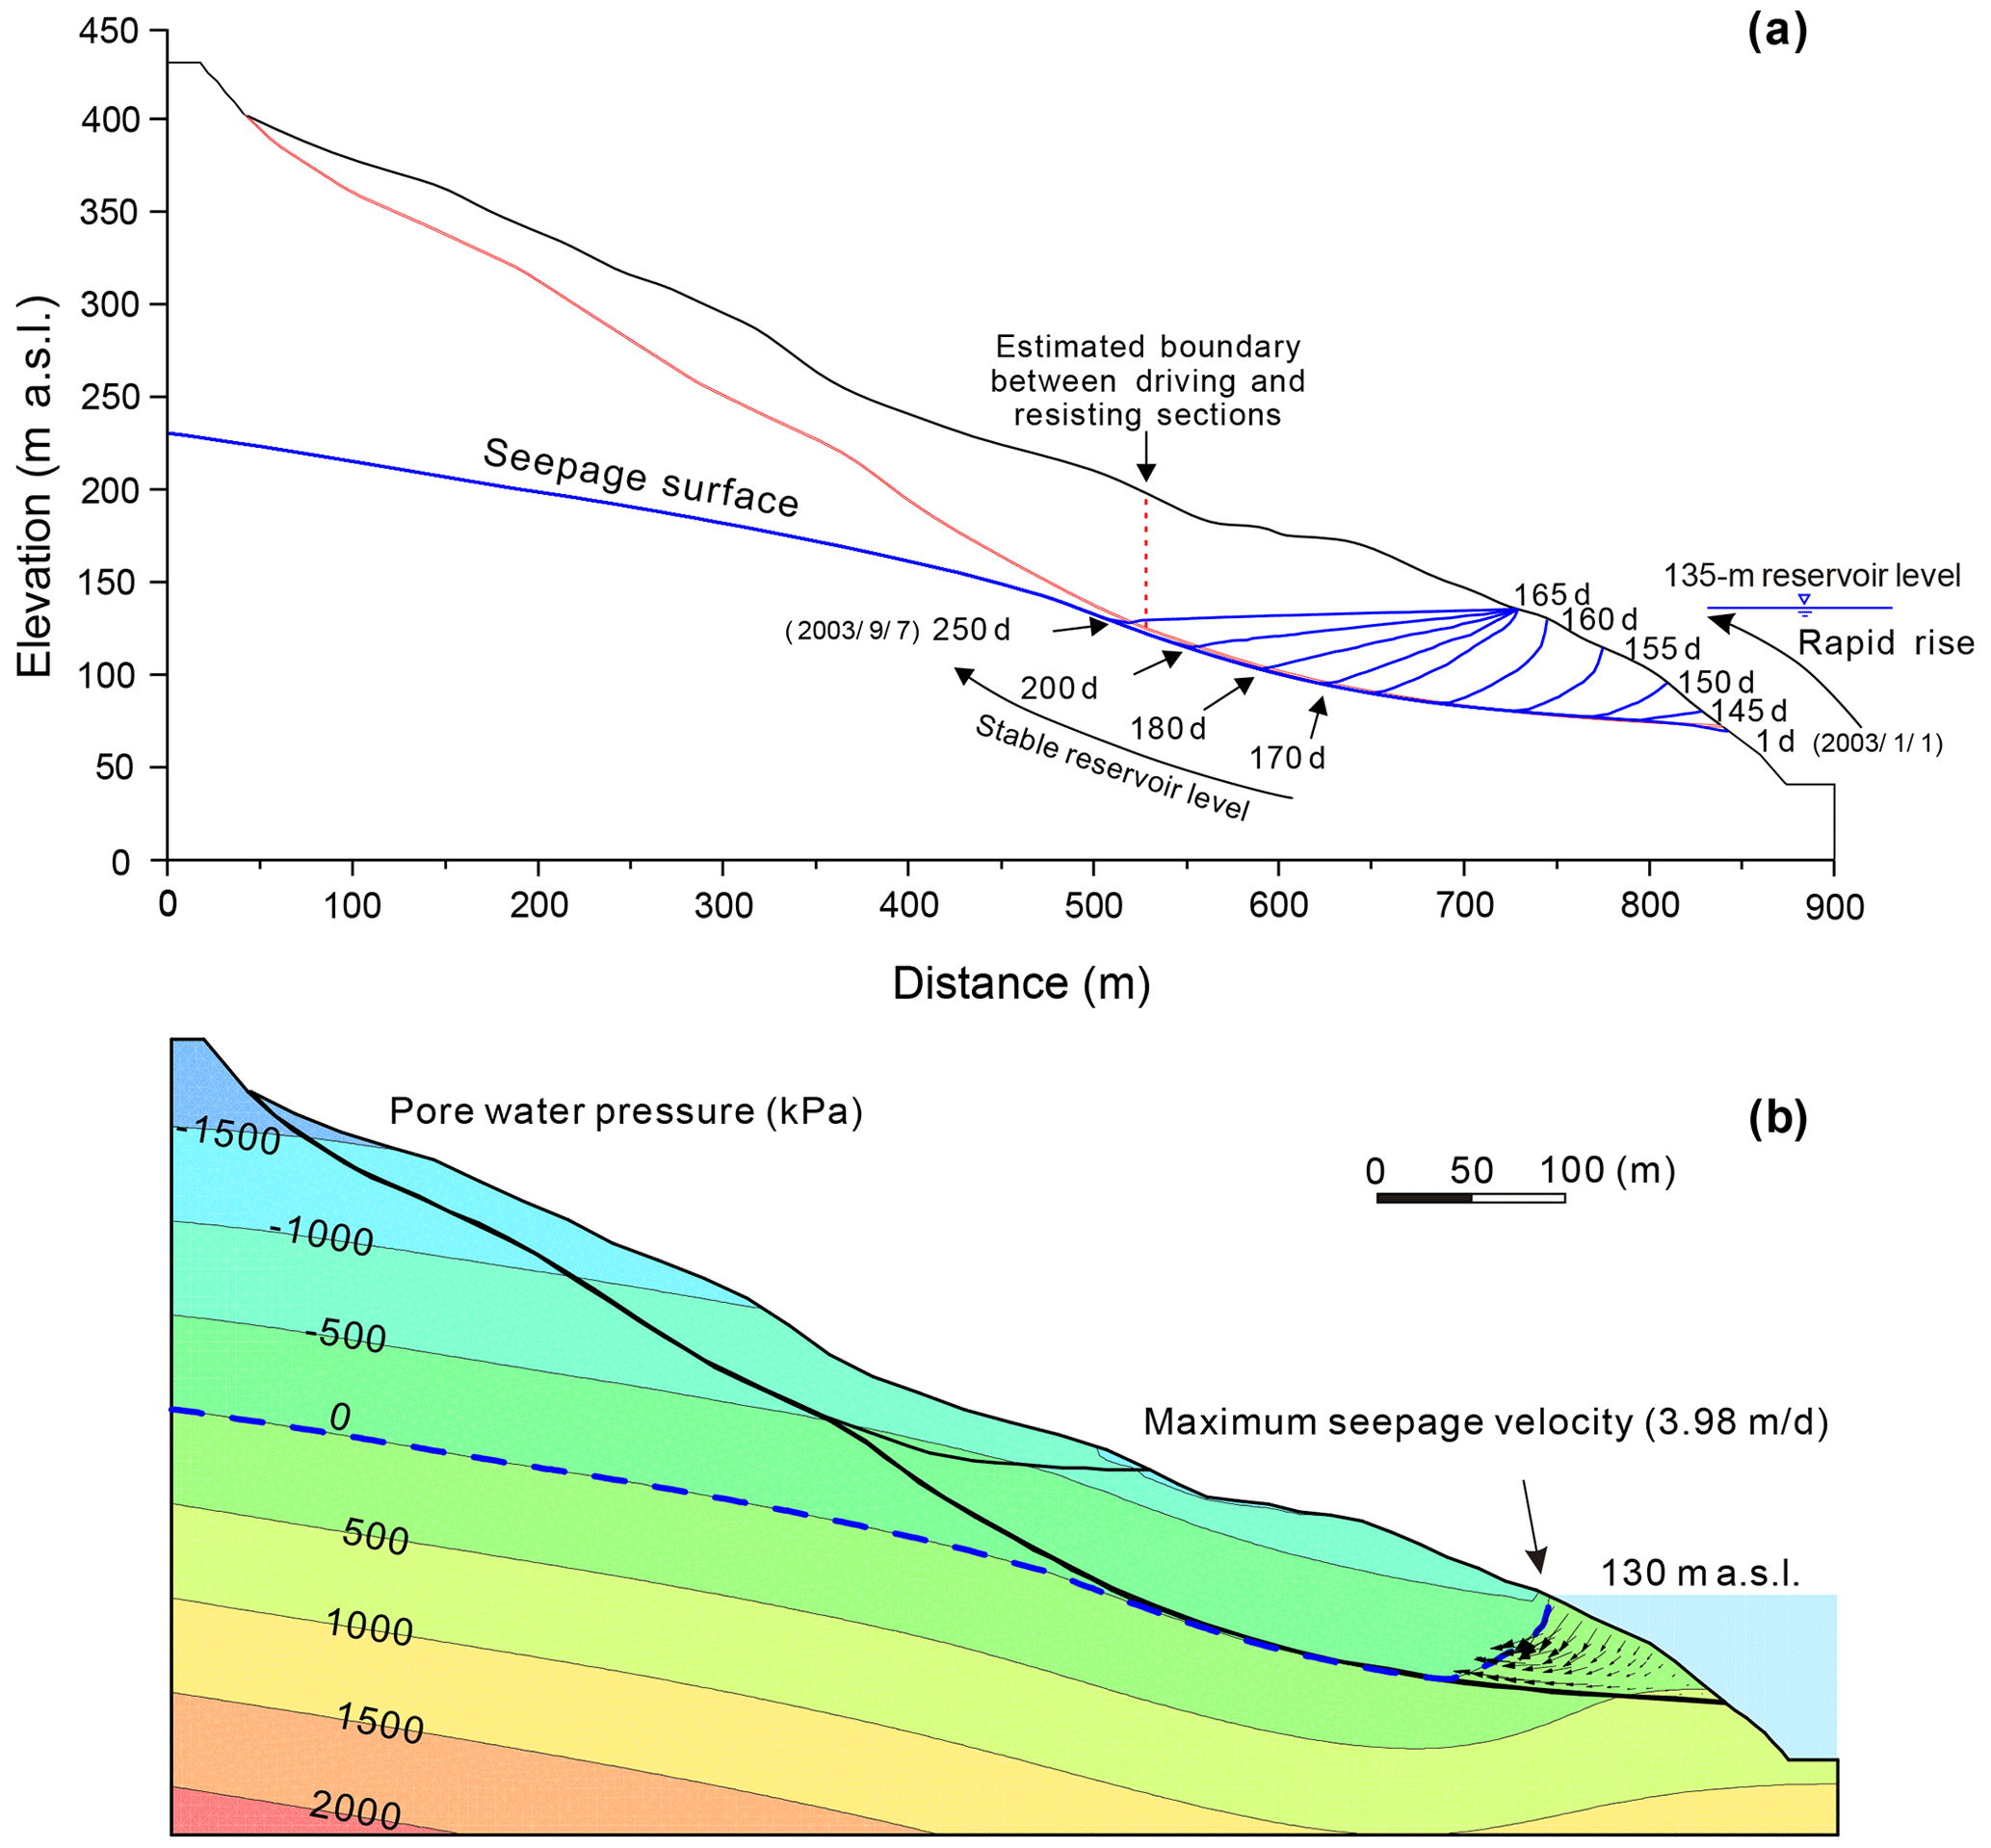
Figure 14(a) Simulated groundwater tables during the period of rapid reservoir rise from 1 January 2003 to 7 September 2003, (b) simulated pressure contours and flow vector on 19 June 2003 (a + 170 d) during first impoundment period.
In the following period (a + 163 d–), the reservoir level was maintained around 135 m a.s.l. The water table progressively rose until it approximated the reservoir level. During this period, the slope of the water table front decreased gradually (Fig. 14a), leading to the decrease in the seepage force in the slope. At the same time, the buoyancy uplift effect increased steadily in the resisting section as the groundwater table rose. The combination of a decreased seepage force and the increased buoyancy led to a decrease in slope stability during this phase, so the Fos dropped below its initial value of 1.142. Afterwards, the slope stability continued to decrease until the new but temporary state of equilibrium was reached. The safety factor was around 1.045 as the reservoir level was maintained around 135 m a.s.l.
The delay between the reservoir impoundment and the decrease in stability is consistent with the creation of obvious cracks after the reservoir rose to 135 m a.s.l. (Wang et al., 2007). The famous Qianjiangping landslide (Fig. 2), which is located near the Shuping landslide and has a similar geological setting, occurred 1 month (13 July 2003) after the reservoir first rose to 135 m a.s.l. (Xiao et al., 2007).
5.2 Scenario 2: first trial impoundment at 156 m a.s.l.
During the periods when the water level rose from 135 to 156 m a.s.l. (b + 1–30 d) (Fig. 15) and stayed stable at 156 m a.s.l. (b + 30–138 d), the effects of groundwater level change on the stability of Shuping landslide were similar to the effects in Scenario 1. When the reservoir level dropped from 156 to 145 m a.s.l. during the drawdown period of February to June (b + 138–260 d), groundwater flowed towards the reservoir (Fig. 15b), thus creating an outward, destabilizing seepage force on the slope. The computed factor of safety decreased gradually from 1.070 to 1.025, in agreement with the observed increase in displacement velocity during this period. As the reservoir level was then maintained at 145 m a.s.l. (b + 260–365 d), the transient seepage gradually transitioned to steady-state seepage, accompanied by a progressive decline in the water table in the inside part of the fluctuation zone, a weakening of the destabilizing effect of the seepage force, and an increase in slope stability (Fos = 1.035).
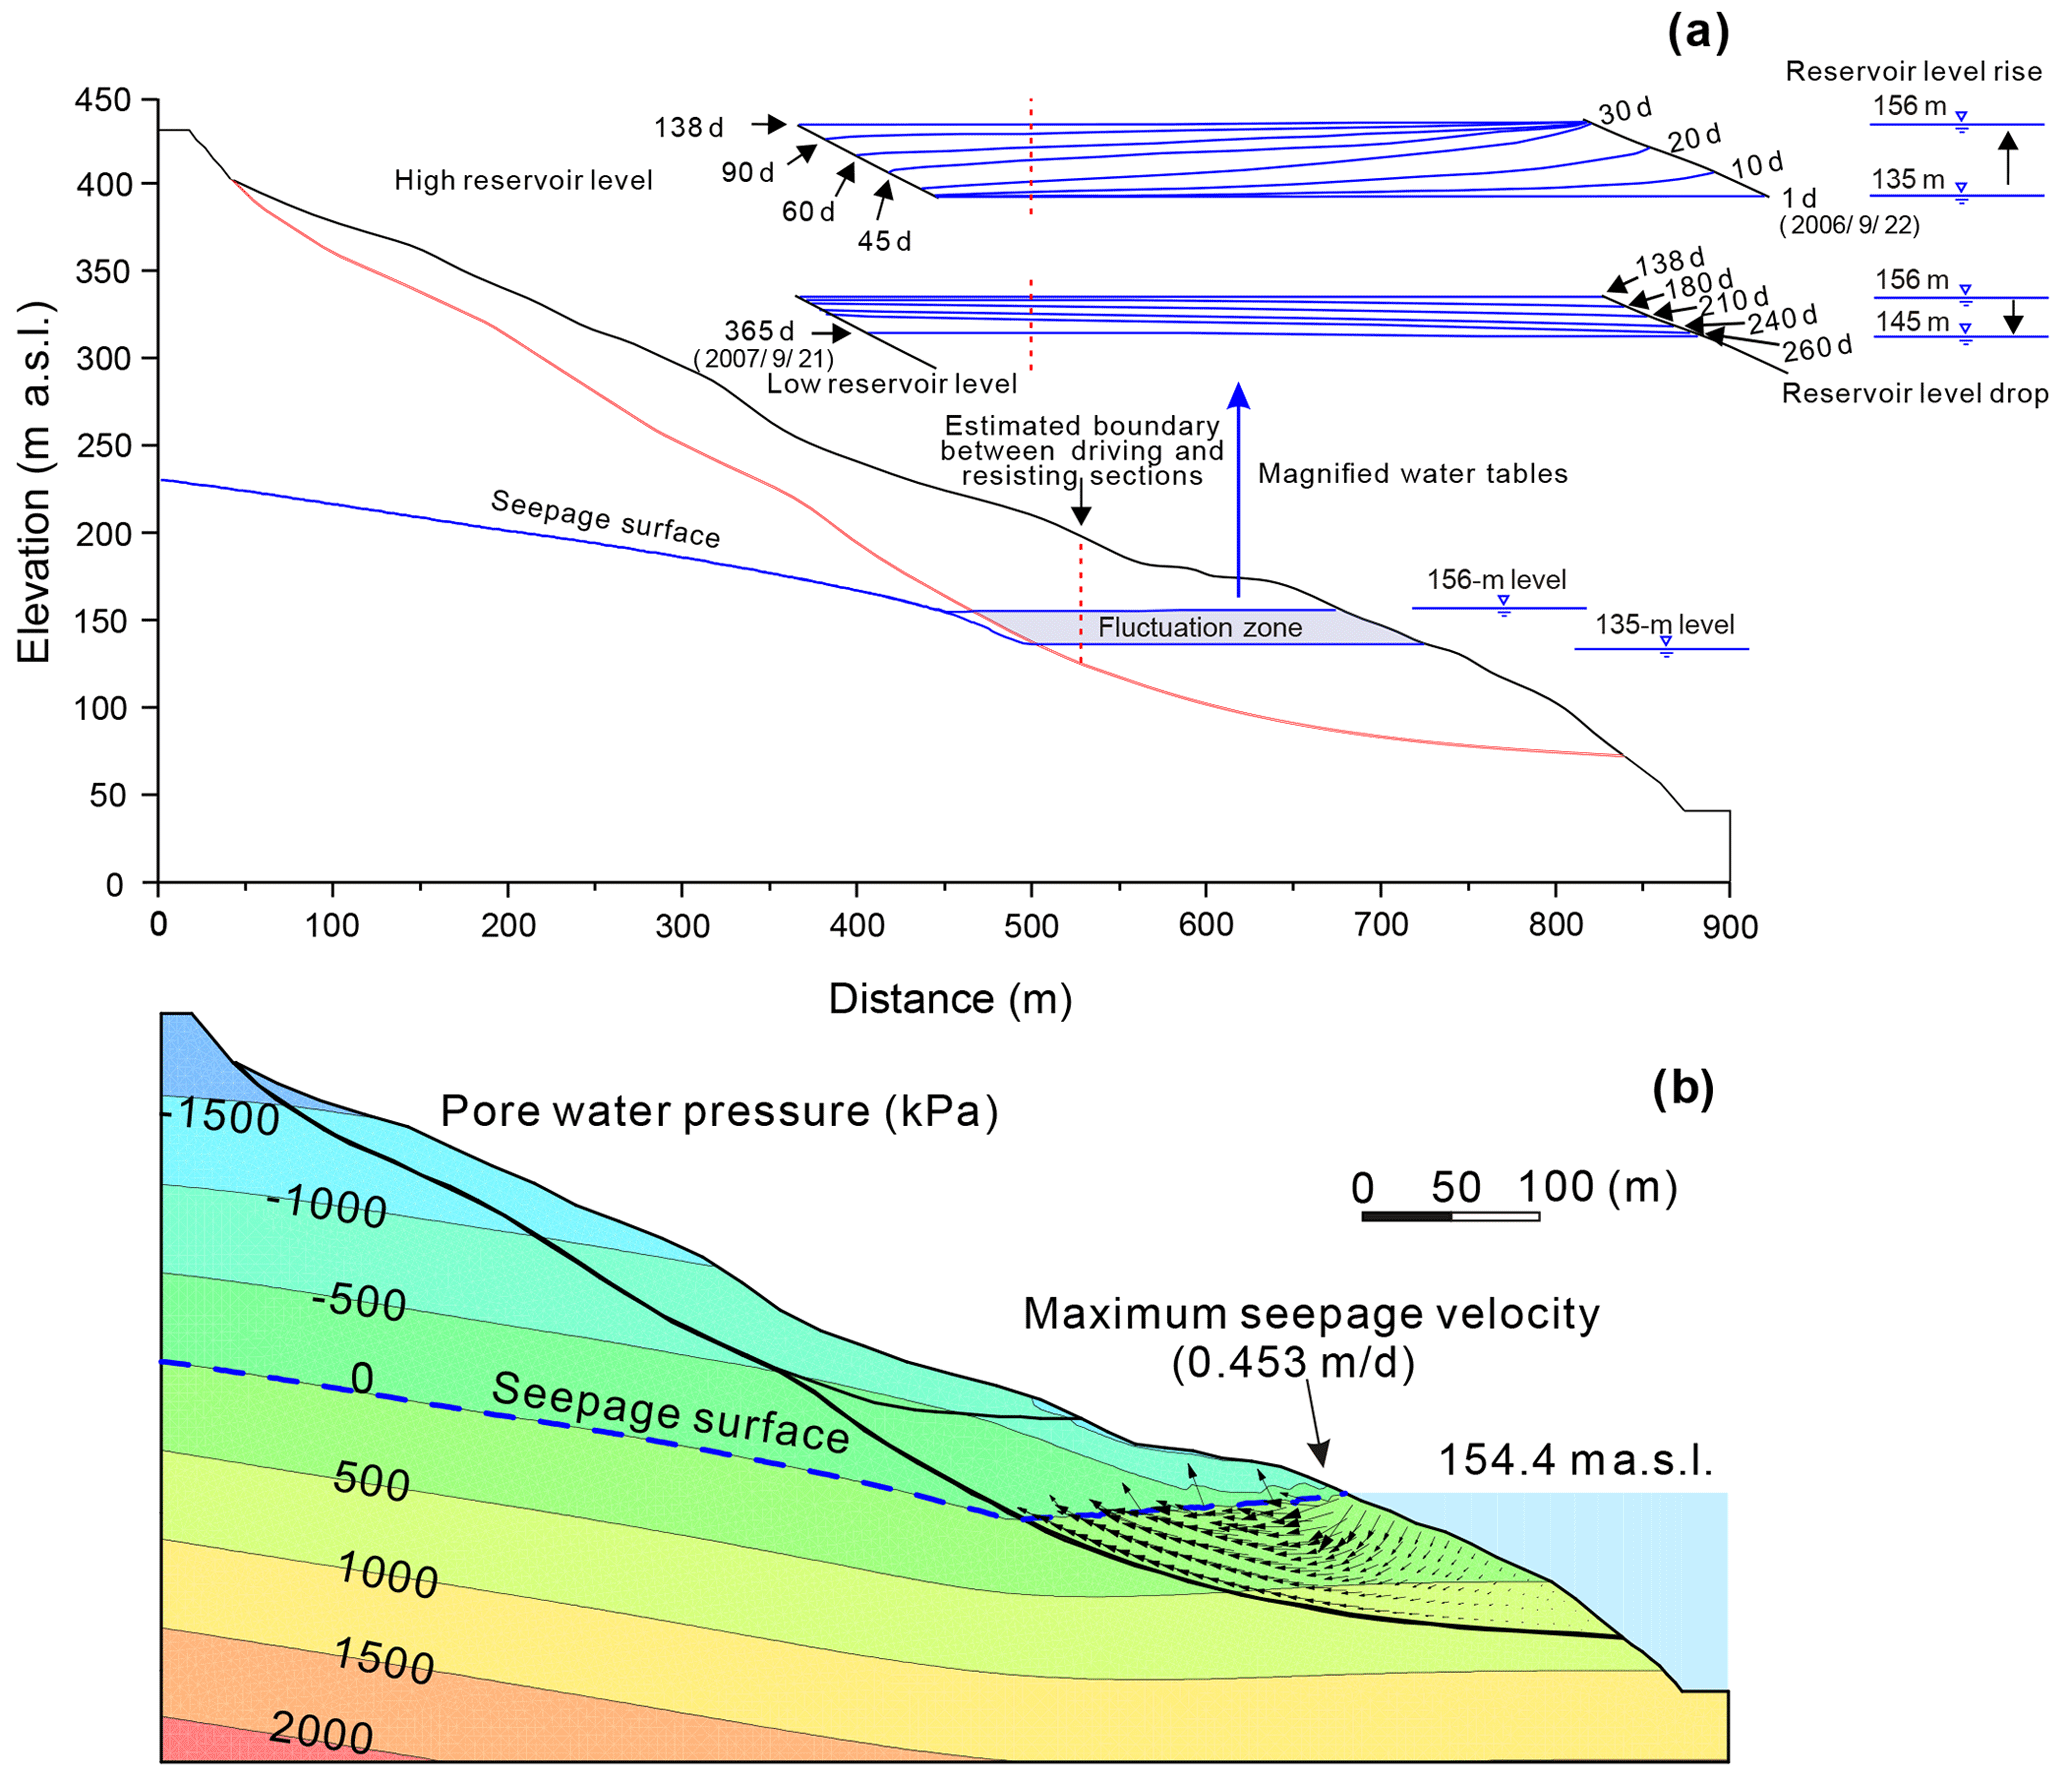
Figure 15(a) Simulated groundwater tables as the variation in reservoir water level from 22 September 2006 to 21 September 2007, (b) simulated pressure contours and flow vector on 11 July 2007 (day b + 260) during drawdown period.
5.3 Scenario 3: trial impoundment at 175 m a.s.l.
During 2008 to 2014 the reservoir level periodically fluctuated between 145 and 175 m a.s.l. (Stage 3), in accordance with a generalized annual water level variation curve that consists of five phases (Fig. 13b).
During the slow drawdown period, the groundwater storage in the driving section is reduced by an amount that approximately matches the reduction in the resisting section (Fig. 16a), so the effect of buoyancy forces on slope stability is small. Moreover, because drawdown is slow, groundwater gradients are also low, limiting the magnitude of destabilizing seepage forces. Thus, the safety factor of the slope decreases from 1.031 to 1.018 with only a modest amount (Fig. 13b).
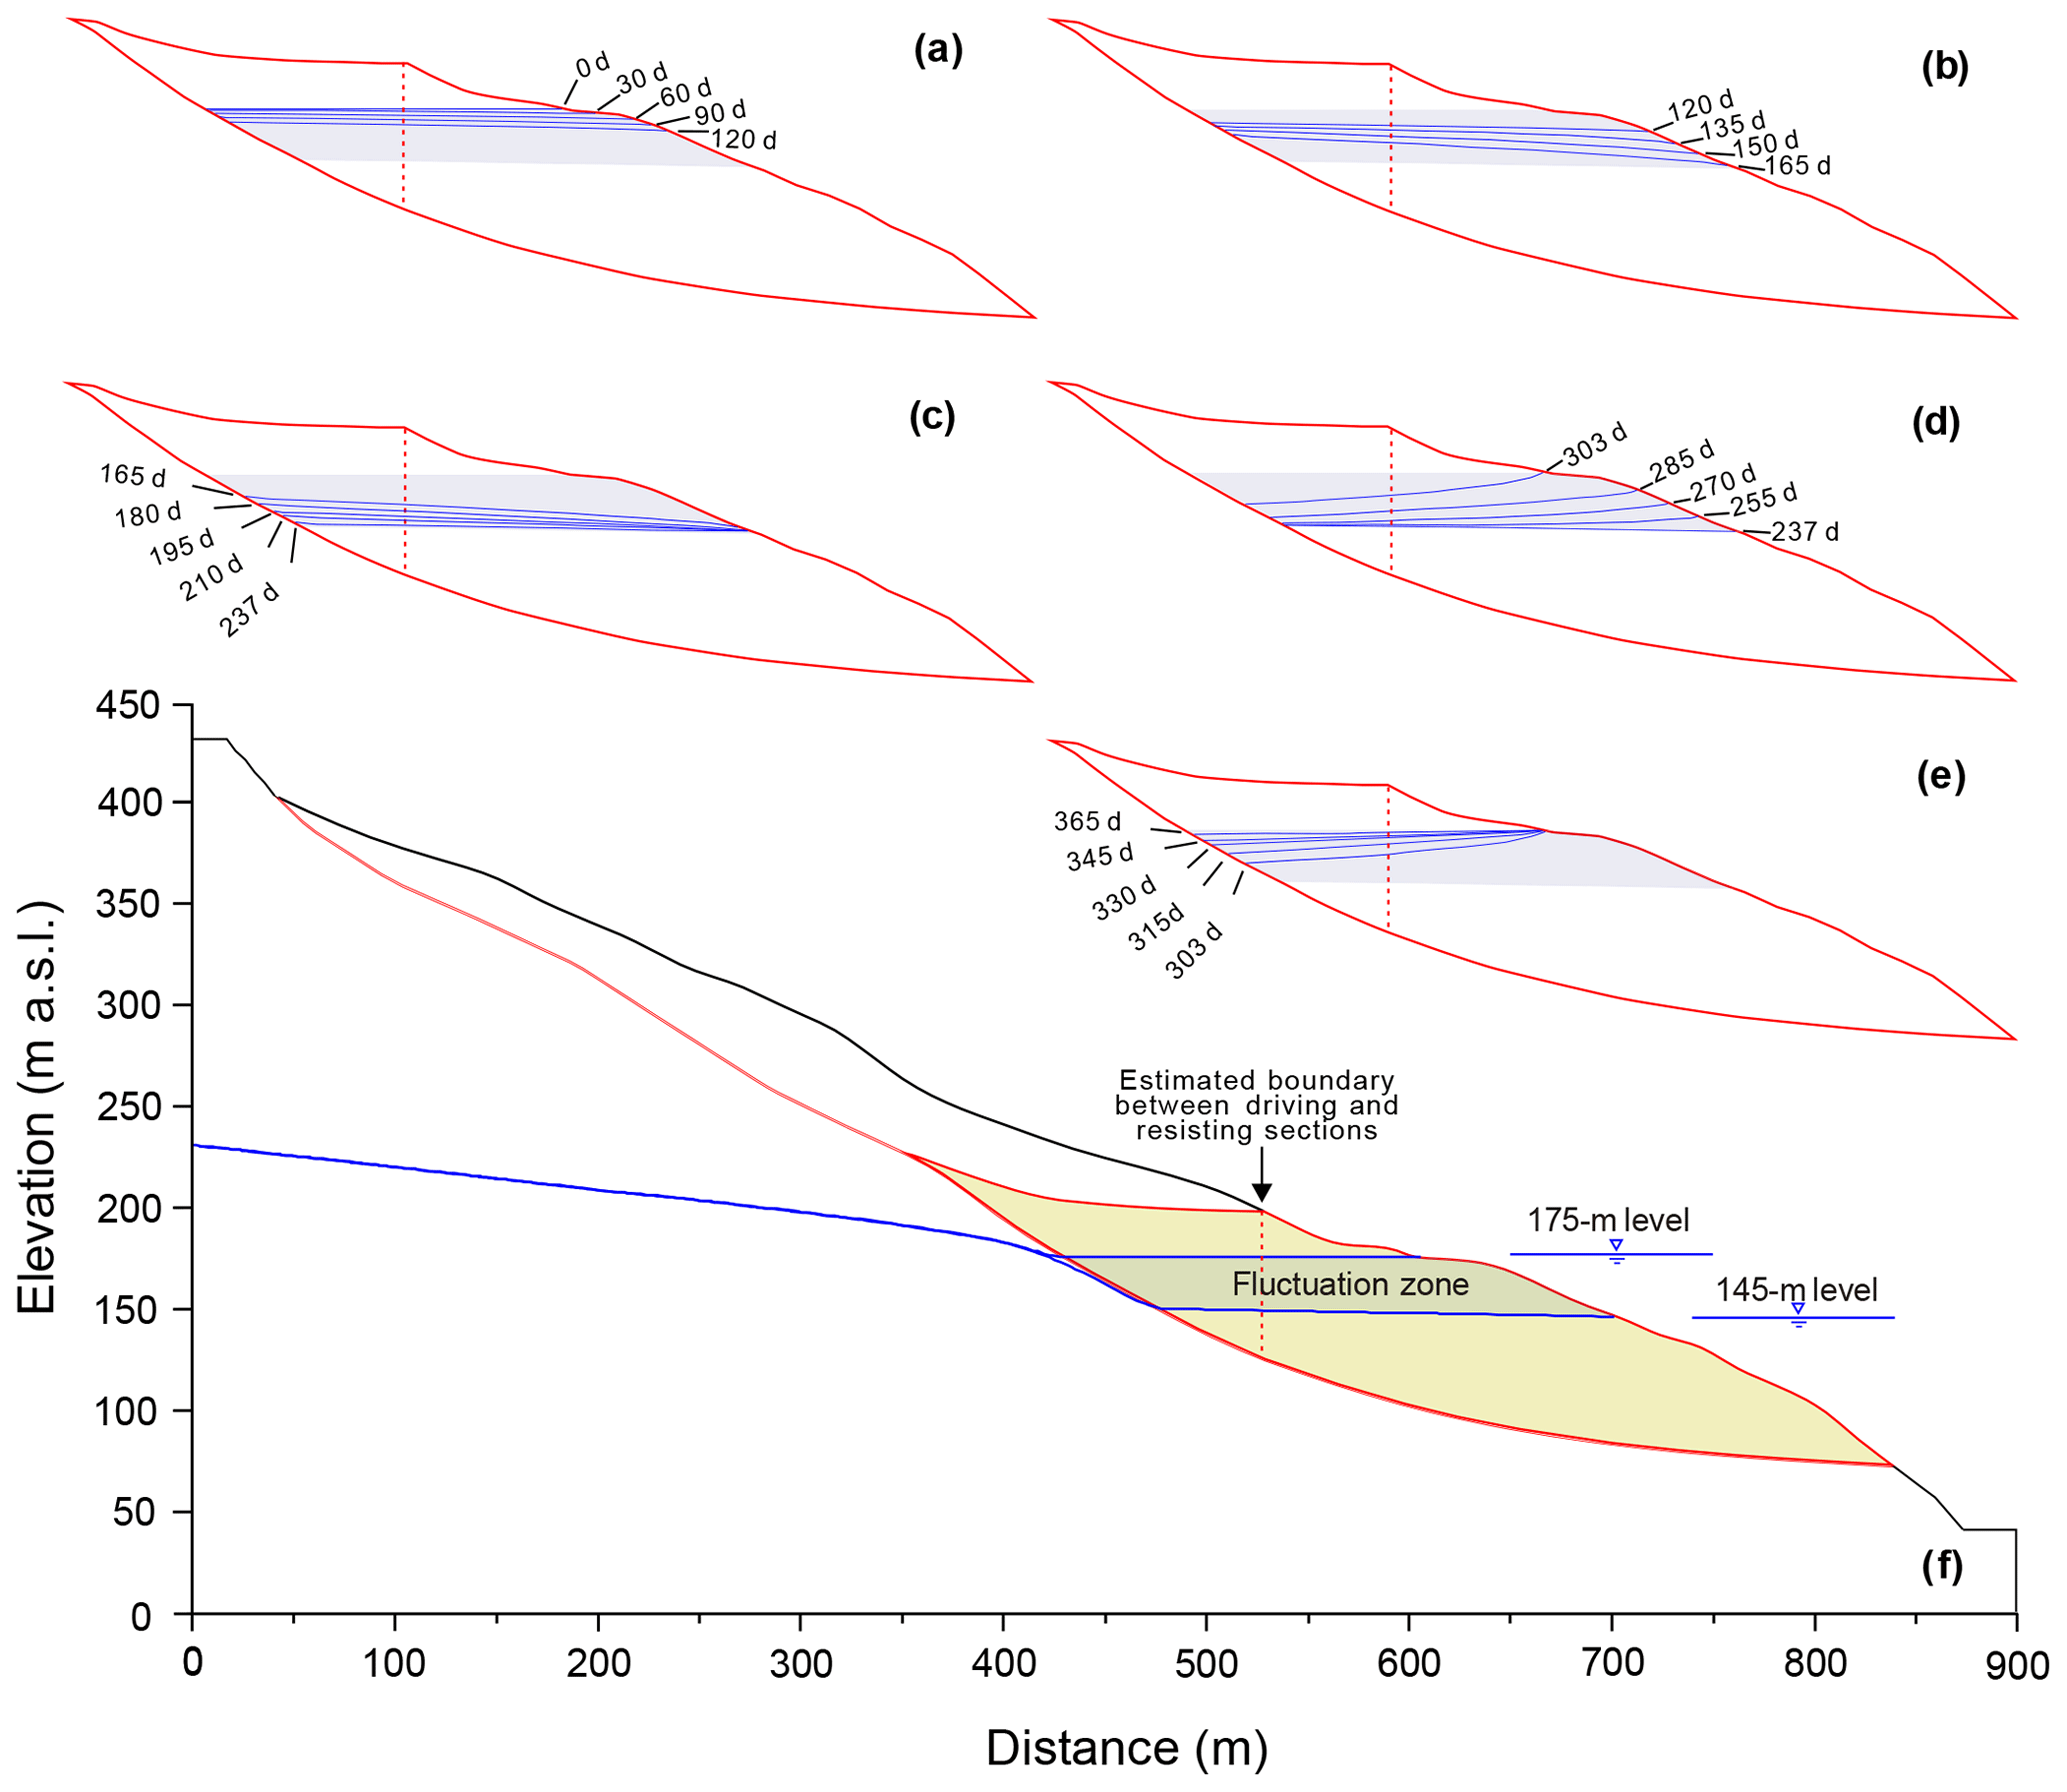
Figure 16Simulated groundwater tables over the period of generalized annual variation in reservoir water level in Stage 3. Gray shaded zone depicts the 145 to 175 m elevation interval. (a) Slow-drawdown phase, (b) rapid-drawdown phase, (c) low-level phase, (d) water-level-rising phase, (e) high-water-level phase.
During the rapid-drawdown phase, groundwater gradients are steeper and produce large, destabilizing seepage forces on the slope (Fig. 17a). The sharp decline in slope stability (Fig. 16b) is consistent with the observed high displacement velocity during this phase. The slope stability becomes the least (Fos = 0.995) as the reservoir declines to its lowest level of 145 m a.s.l., when a maximum difference of 14 m is computed for groundwater levels in the slide mass (Fig. 16b). Although the decreased buoyancy of the resisting section makes an offsetting contribution to slope stability, its magnitude is small compared to that of destabilizing seepage forces.
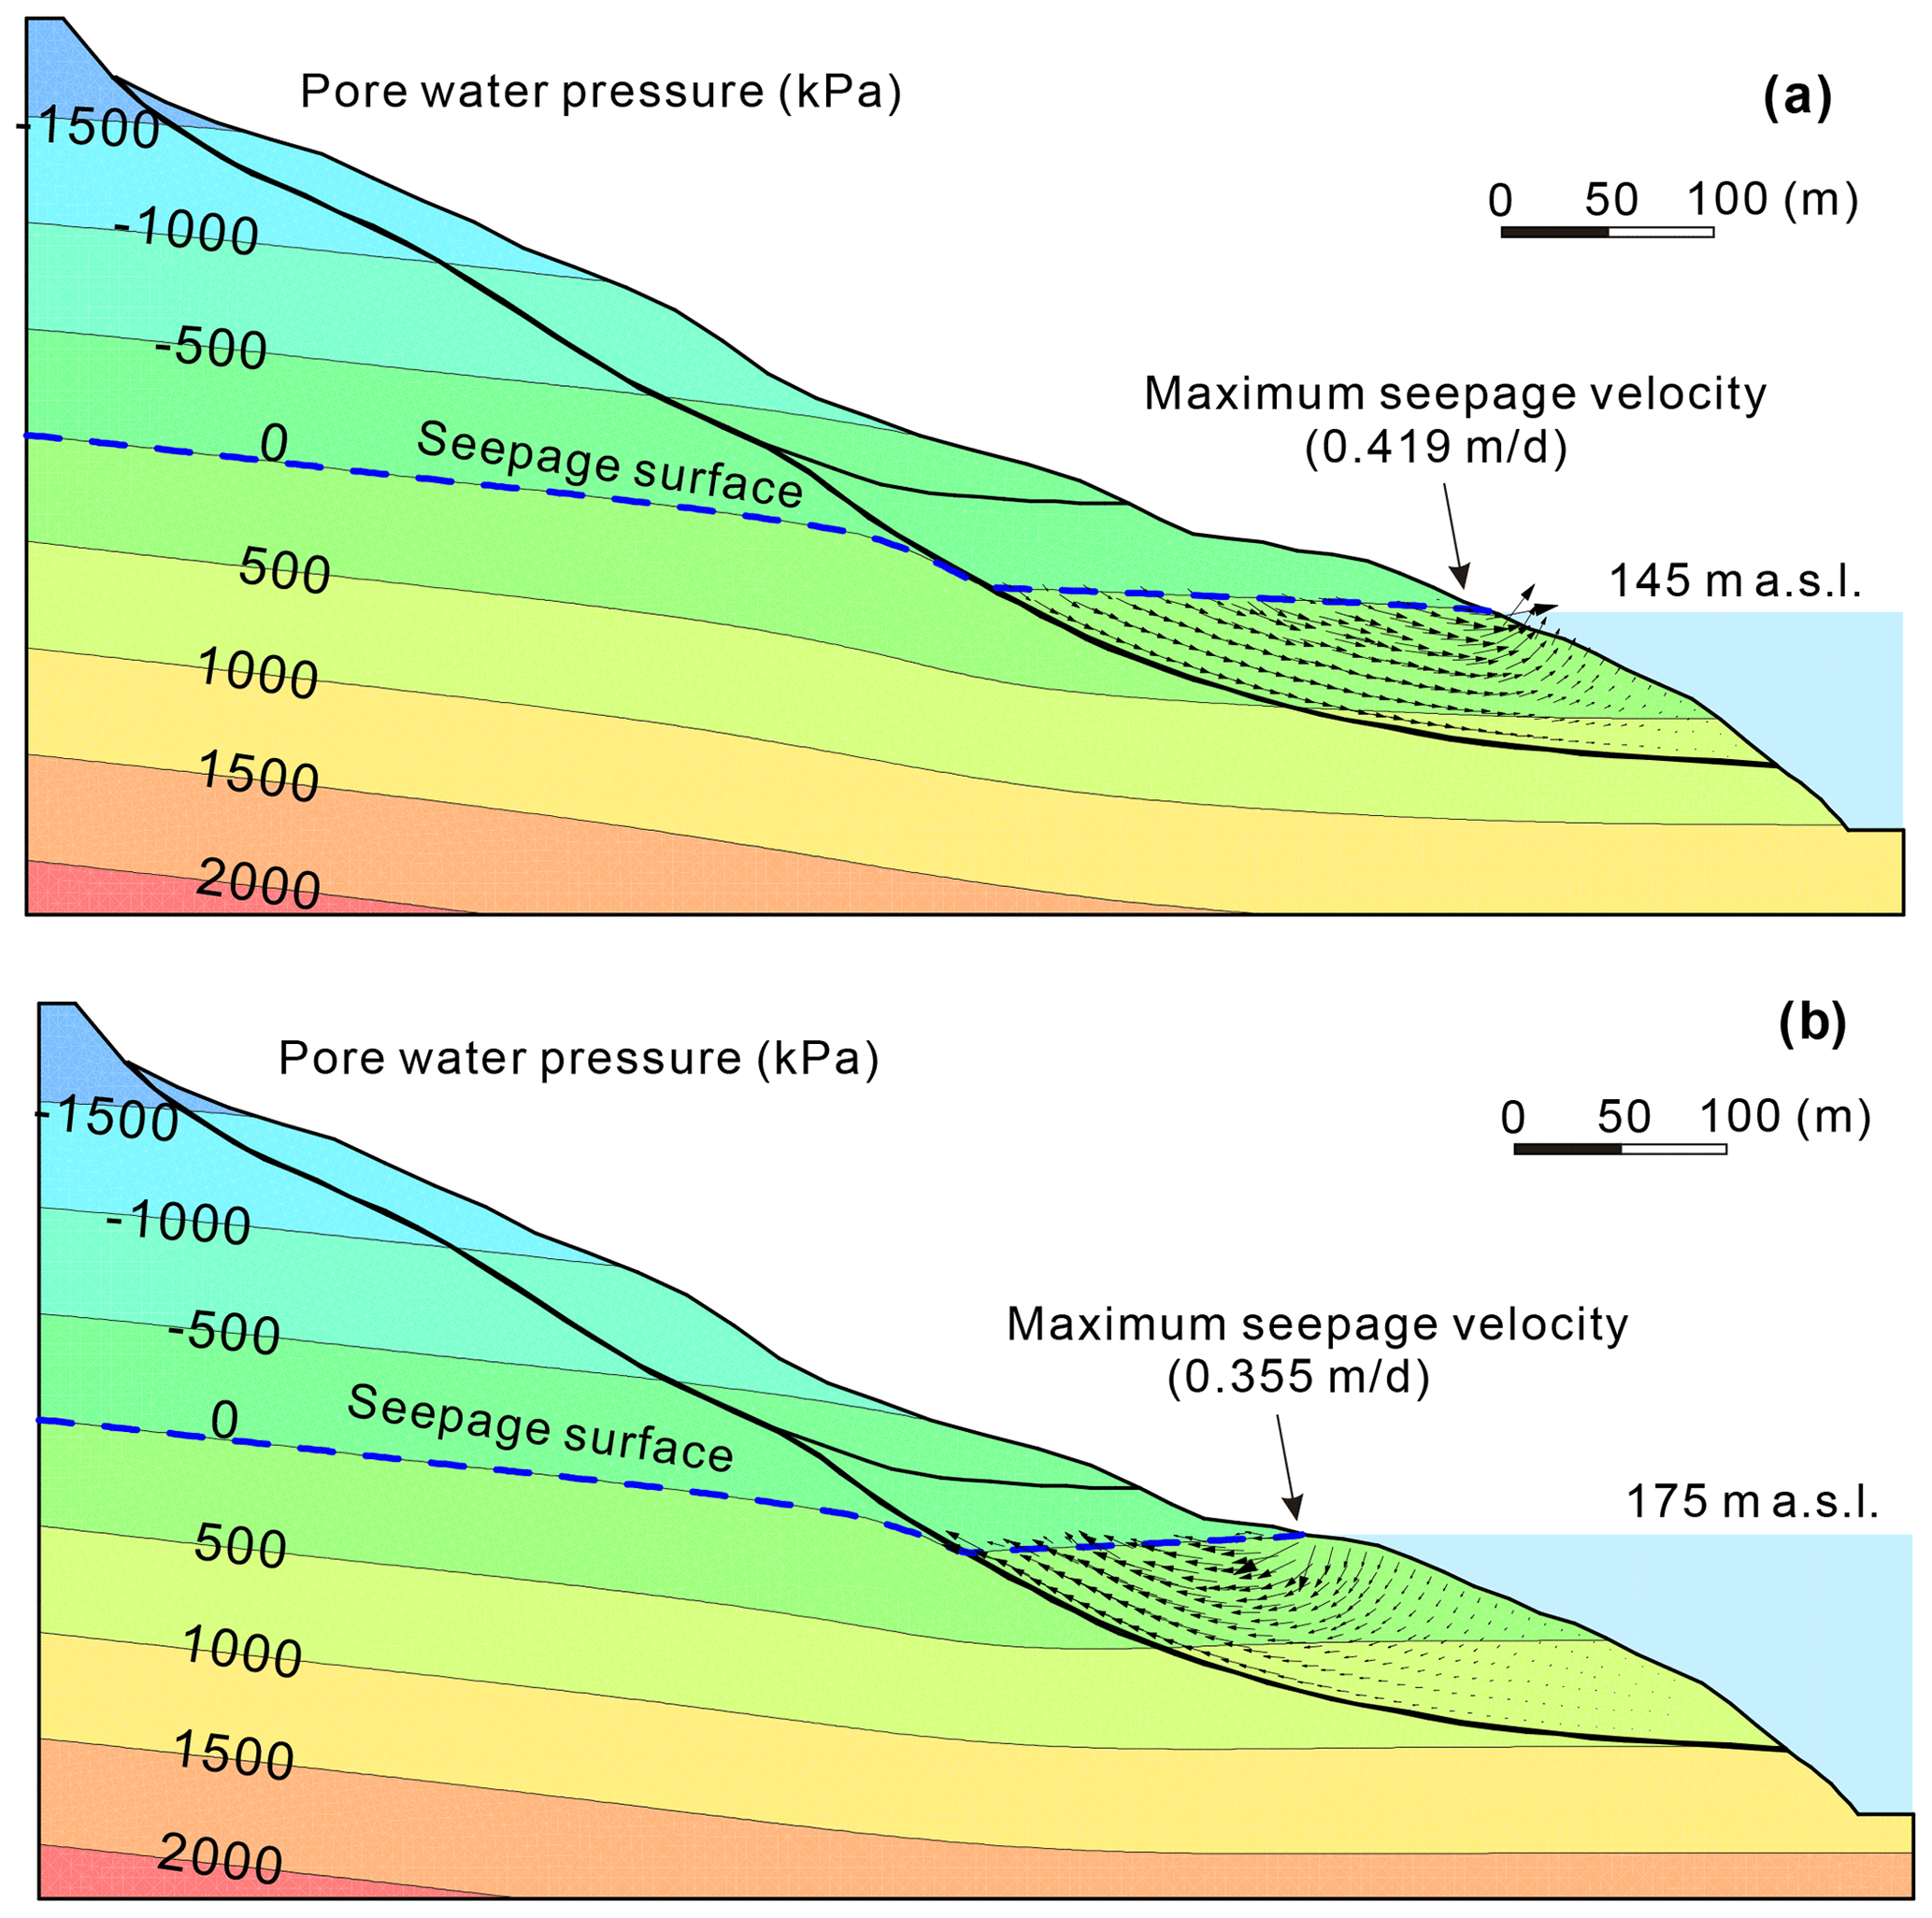
Figure 17(a) Simulated pressure contours and flow vector at the end of the rapid-drawdown period (day 165 in Fig. 16), (b) simulated pressure contours and flow vector at the begin of the high-level period (day 303 in Fig. 16).
In the following three phases, representing the low-water and rising- and high-water phases, the characteristics of the slope vary in a manner similar to those modeled in Scenario 2. The stability of the landslide (see Fig. 13b) recovers gradually from 0.995 to 1.027 in the low-water-level phase due to the dissipation of destabilizing seepage forces (Fig. 16c). Slope stability then increases rapidly as the reservoir level rises rapidly, when the seepage force reverses to become directed into the slope (Figs. 16d, 17b). The slope obtains the highest stability, with an Fos value of 1.067, when the water level rises to the highest level of 175 m a.s.l. Slope stability then decreases gradually as that seepage force declines (Fig. 16e). All these results agree with the observed variations in displacement velocity of the Shuping landslide (Sect. 4.2).
In summary, during periods of reservoir drawdown and rise, the seepage force plays a dominant role in the stability of Shuping landslide but is negative in the drawdown period and positive in the rising period. In contrast, buoyancy effects become increasingly important during periods of steady reservoir levels as seepage forces steadily decrease.
The deformation of the Shuping landslide is a function of reservoir levels but probably also depends on the hydraulic character of its constituent material. The lower part of the slide mass that is subject to reservoir level fluctuation is mainly composed of dense silty soil with very low hydraulic conductivity. During periods of rapid change in reservoir level, large differences in groundwater head can be formed in such material, generating large seepage pressures that can either destabilize or stabilize the mass, depending on whether the reservoir is rising or falling. On the other hand, low-permeability materials impede rainfall infiltration, rendering the landslide largely unaffected by rainfall. Consequently, variations in the reservoir level and their attendant seepage forces dominate the deformation of Shuping landslide.
Based on this observation and on the results of the driving–resisting model, two approaches are recommended to control the deformation of huge reservoir landslides where the reinforcement structures are difficult to construct. One method to improve stability is to transfer earth mass from the driving section to the resisting section of the slide mass. The other is to use drains or pumps to lower the water levels inside the slope in order to reduce differences in groundwater head during periods of reservoir drawdown. The first approach has in fact been adopted to enhance the stability of Shuping landslide, which was conducted in September 2014 and completed in June 2015. Figure 18a presents the layout of the engineering treatment, and Fig. 18b is the subsequent photo of Shuping landslide. Zones I and II are the areas of load reduction, located in the driving section of the slide mass. The earth mass of Zone I ( m3) and Zone II ( m3) was transferred to Zones III and IV, respectively, which are located in the resisting section that is mostly below reservoir level in the photo (Fig. 18b). Monitoring data show that the displacement velocity was significantly reduced to low values (about 4.1 mm/month in the main deformation area), demonstrating the effectiveness of the engineering treatment. These approaches are more economical and require a shorter construction period than many commonly used remediation methods such as the construction of stabilizing piles. Most importantly, these treatments are feasible for many other large reservoir landslides.
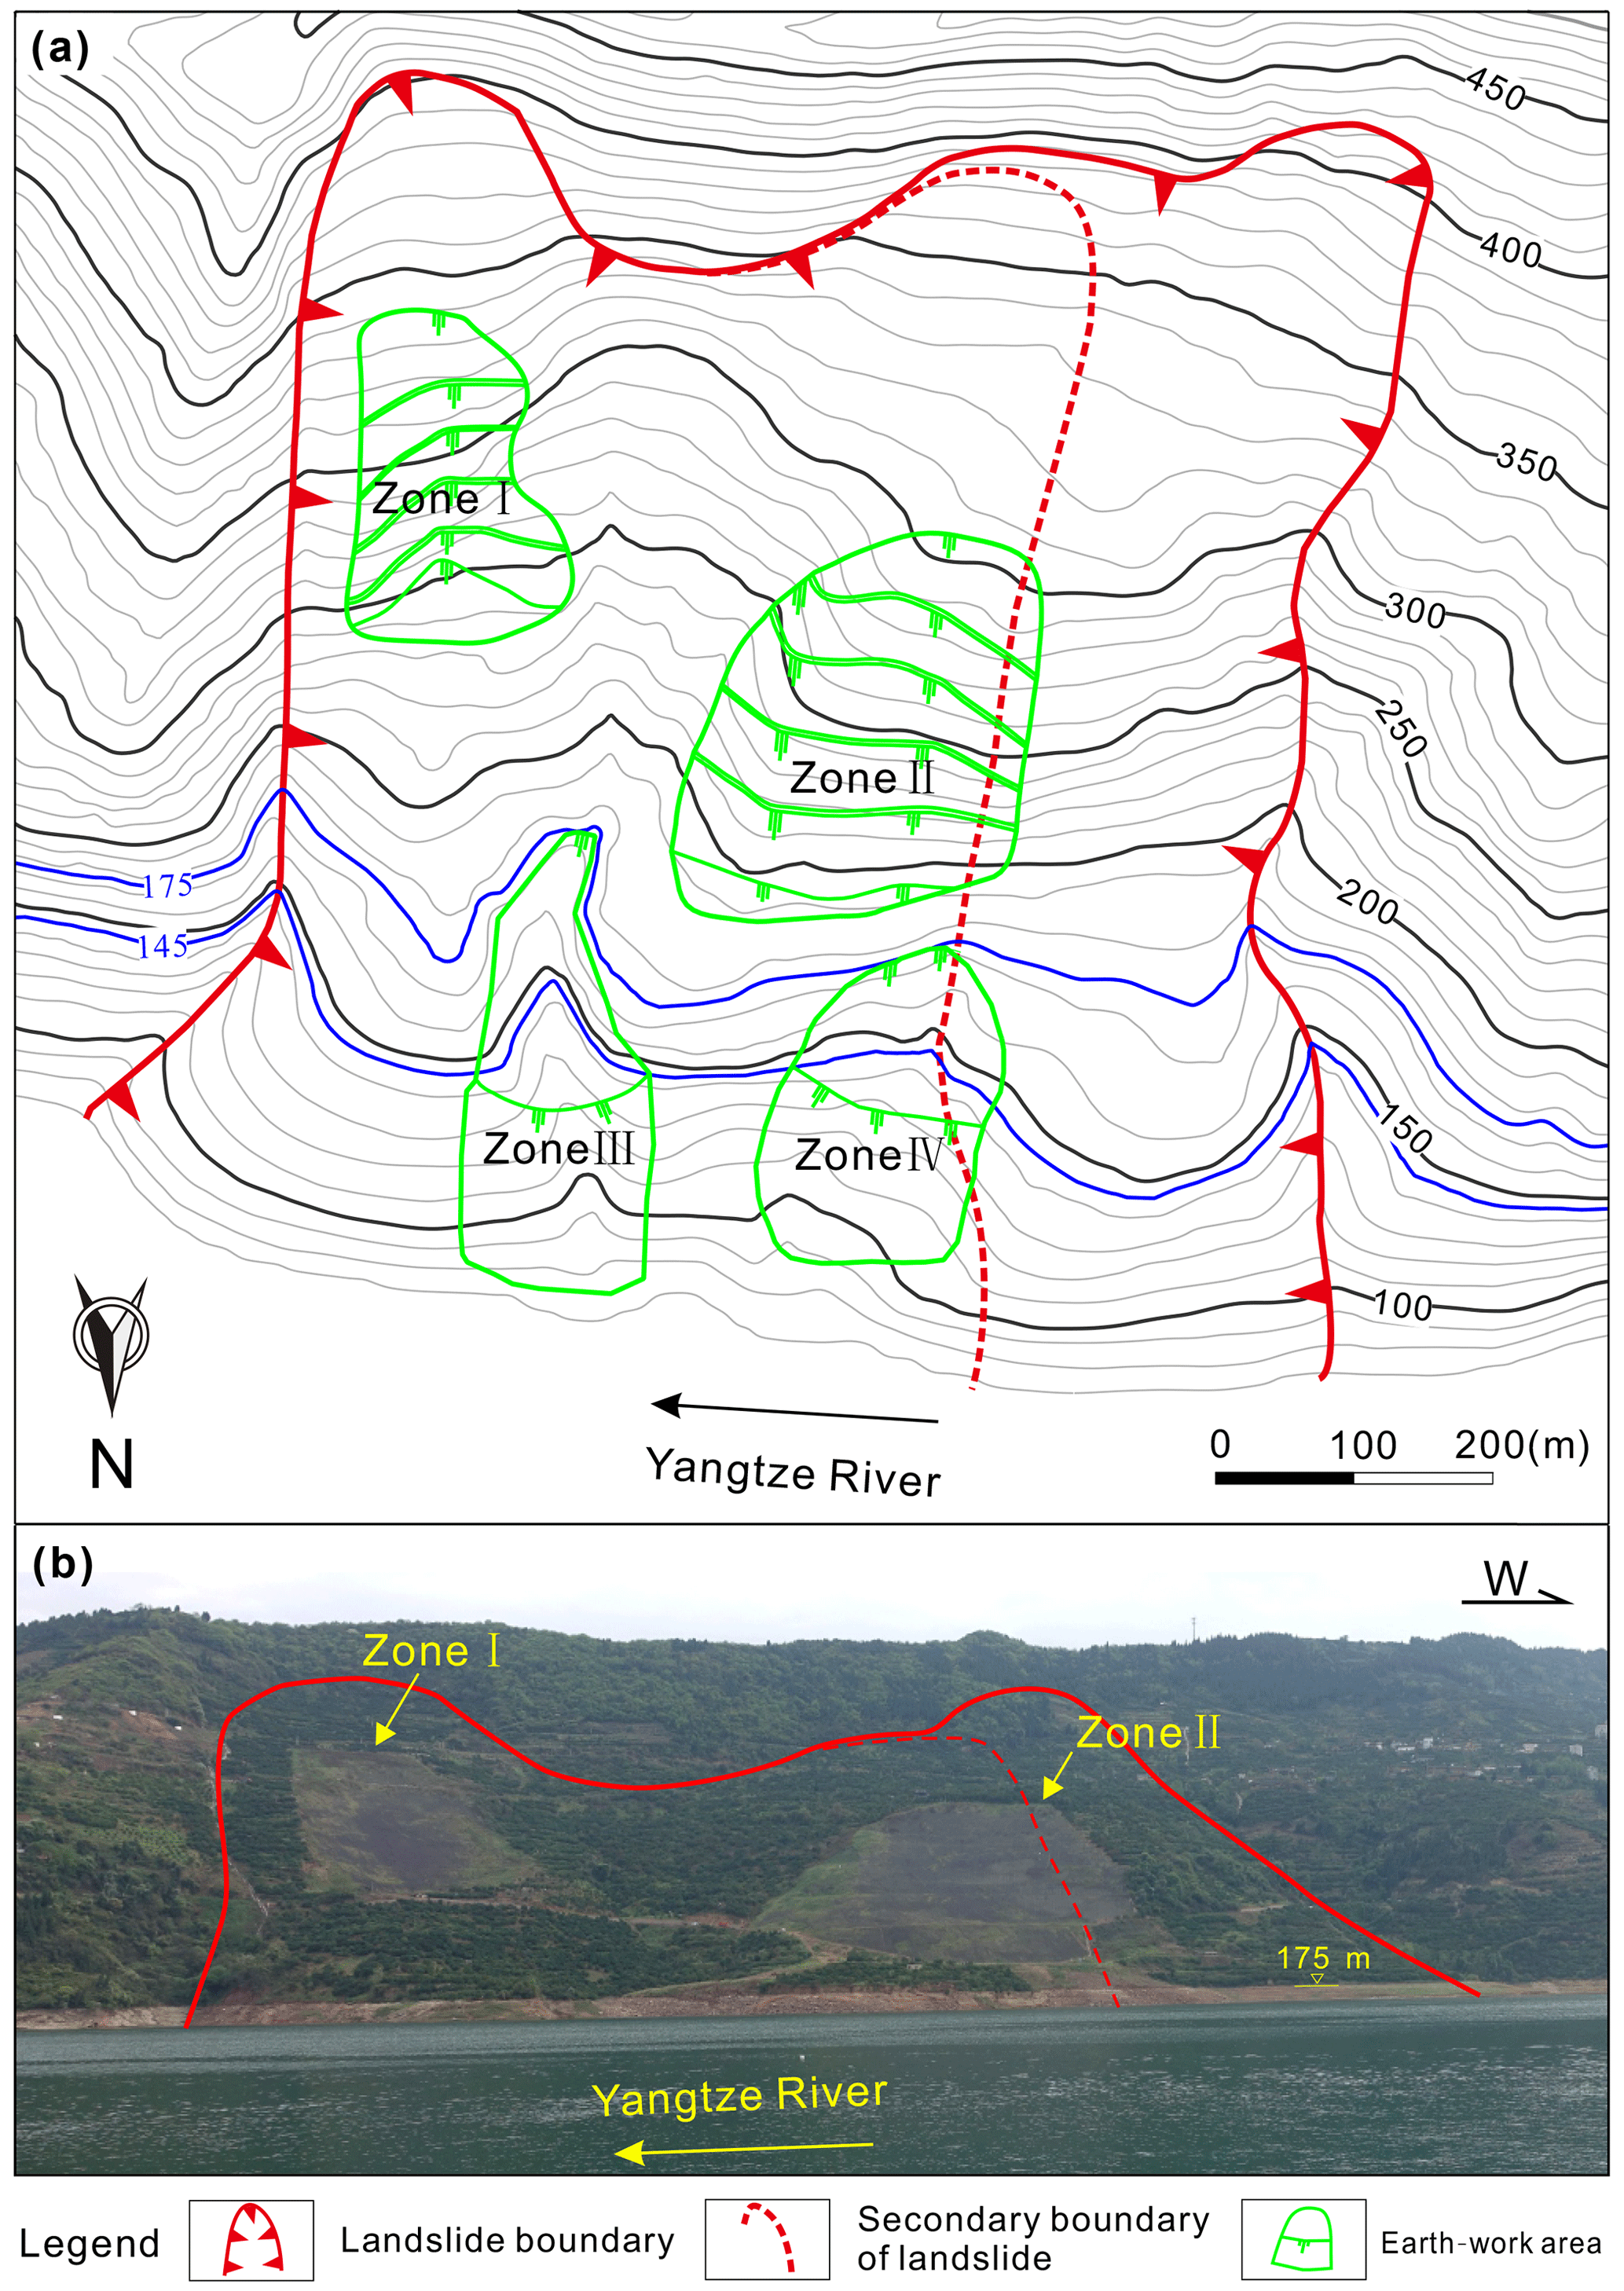
Figure 18Topography of Shuping landslide before (a) and after (b) engineering treatment, which involved the transfer of earth from Zones I and II to Zones III and IV.
The determination of the position of the boundary between driving and resisting sections is very complicated as it is related to many factors. As the reservoir level varies, the stress of the landslide changes, which can affect the position of the boundary, and the position is dynamic. In this study, we proposed a static criterion to estimate the boundary position; that is, the boundary between the resisting and driving sections can be approximated as the position where the slope angle of the slide surface equals the internal-friction angle φ of the slide surface (Sect. 2.2). This criterion was effectively adopted to interpret the deformation process of the Shuping landslide.
The frictional property of the sliding surface is an important factor affecting the landslide stability and the position of the boundary of the driving and resisting sections. The slip zone soil commonly displays a strain-softening behavior, indicating that the soil strength generally evolves into peak strength and the residual strength after large deformations (Skempton, 1985). Many researchers (Liu, 2009; Tang et al., 2015) are also aware that the frictional property of the slip surface varies in space. For example, in retrogressive landslides, such as Zhujiadian landslide in the TGR area (Hu et al., 2015), the front part has larger displacement than the rear part, leading to the resisting shear strength being less than that in the rear part (Tan et al., 2016), and the resisting section is unlikely to have been formed in these landslides. In the progressive landslides, such as Jiweishan landslide (Tang et al., 2015), the front part experiences less deformation than the rear part, and the front part has relatively high shear strength, forming the resisting section. In some landslides, such as the Huangtupo landslide, Baishuihe landslide, and Ganjuyuan landslide (see Fig. 1), the sliding surfaces are irregular, which definitely increases the overall friction of the slip surface and increases the resisting section. In the case that the sliding surface is irregular, and the shear strength of the sliding surface varies obviously in space, a more rigorous method is required to determine the boundary position.
A driving–resisting model is presented to elucidate the deformation mechanism of reservoir landslides, as exemplified by Shuping landslide. The displacement velocity of Shuping landslide is closely related to the variations in the level of the Three Gorges Reservoir. Rainfall effects are limited in comparison, perhaps due to the low hydraulic conductivity of the slide material. Rapid reservoir drawdown produces large, destabilizing seepage forces in the slope of the slide mass, as evidenced by large increases in its displacement velocity. In contrast, rising reservoir levels reverse the direction of the seepage force, improving slope stability and decreasing the displacement velocity. The buoyancy effect on the resisting section decreased the slope stability when the reservoir first rose to 135 m a.s.l., but this effect has diminished as the reservoir has attained higher levels that buoy both the driving and resisting sections.
Monitoring data, the driving–resisting model, and a successful engineering treatment suggest two means to increase the stability of landslides in the TGR area. Recommended approaches are (1) transferring earth mass from the driving section to the resisting section and (2) lowering the groundwater levels inside the slope by drains or by pumping during periods of reservoir drawdown. The first approach was successfully applied to the Shuping landslide and could be used to treat many other huge landslides in the Three Gorges Reservoir area.
The study relied on the observation data from the Department of Land and Resources of Hubei Province, China.
This work was carried out as a collaboration among all the authors. ZZ and HT developed the conception and designed the details of this study. ZZ and REC wrote the first draft of the paper. XH and CX edited and reviewed the manuscript. QW and YY collected the data for this study.
The authors declare that they have no conflict of interest.
This work was supported by the National Key R&D Program of China (grant no. 2017YFC1501305); the National Natural Science Foundation of China (grant nos. 42077268, 42020104006, 41630643, and 41827808); and the Fundamental Research Funds for the Central Universities, China University of Geosciences (grant no. CUGCJ1701).
This research has been supported by the National Key R&D Program of China (grant no. 2017YFC1501305); the National Natural Science Foundation of China (grant nos. 42077268, 42020104006, 41630643, and 41827808); and the Fundamental Research Funds for the Central Universities, China University of Geosciences (grant no. CUGCJ1701).
This paper was edited by Daniele Giordan and reviewed by Shintaro Yamasaki and three anonymous referees.
Baum, R. L. and Fleming, R. W.: Use of longitudinal strain in identifying driving and resisting elements of landslides, Geol. Soc. Am. Bull. 103, 1121–1132, 1991
Casagli, N., Rinaldi, M., Gargini, A., and Curini, A.: Monitoring of pore water pressure and stability of streambanks: results from an experimental site on the Sieve River, Italy, Earth Surf. Proc. Land., 24, 1095–1114, https://doi.org/10.1002/(SICI)1096-9837(199911)24:12<1095::AID-ESP37>3.0.CO;2-F, 1999.
Chang, S. B., Zhang, S. M., and Xiang B.: Engineering geology manual, China Architecture & Building Press, Beijing, 2007 (in Chinese).
Cojean, R. and Cai, Y. J.: Analysis and modeling of slope stability in the Three-Gorges Dam reservoir (China) – The case of Huangtupo landslide, J. Mt. Sc., 8, 166–175, https://doi.org/10.1007/s11629-011-2100-0, 2011.
Du, J., Yin, K., and Lacasse, S.: Displacement prediction in colluvial landslides, three Gorges reservoir, China, Landslides, 10, 203–218, https://doi.org/10.1007/s10346-012-0326-8, 2013.
Dumperth, C., Rohn, J., Fleer, A., and Xiang, W.: Local-scale assessment of the displacement pattern of a densely populated landslide, utilizing finite element software and terrestrial radar interferometry: a case study on Huangtupo landslide (PR China), Environ. Earth Sci., 75, 880, https://doi.org/10.1007/s12665-016-5475-y, 2016.
Froude, M. J. and Petley, D. N.: Global fatal landslide occurrence from 2004 to 2016, Nat. Hazards Earth Syst. Sci., 18, 2161–2181, https://doi.org/10.5194/nhess-18-2161-2018, 2018.
Guerriero, L., Coe, J. A., Revellino, P., Grelle, G., Pinto, F., and Guadagno, F. M.: Influence of slip-surface geometry on earth-flow deformation, Montaguto earth flow, southern Italy, Geomorphology, 219, 285–305, https://doi.org/10.1016/j.geomorph.2014.04.039, 2014.
Handwerger, A. L., Roering, J., Schmidt, D. A., and Rempel, A. W.: Kinematics of earthflows in the Northern California Coast Ranges using satellite interferometry, Geomorphology, 246, 321–333, https://doi.org/10.1016/j.geomorph.2015.06.003, 2015.
Hu, X. L., Zhang, M., Sun, M. J., Huang, K. X., and Song, Y. J.: Deformation characteristics and failure mode of the Zhujiadian landslide in the Three Gorges Reservoir, China, B. Eng. Geol. Environ., 74, 1–12, https://doi.org/10.1007/s10064-013-0552-x, 2015.
Hu, X. W., Tang, H. M., and Liu, Y. R.: Physical model studies on stability of Zhaoshuling landslide in area of Three Gorges Reservoir, Ch. J. Rock Mechanics Eng., 24, 2089–2095, 2005 (in Chinese).
Huang, B., Yin, Y., Wang, S., Tan, J., and Liu, G.: Analysis of the Tangjiaxi landslide-generated waves in the Zhexi Reservoir, China, by a granular flow coupling model, Nat. Hazards Earth Syst. Sci., 17, 657–670, https://doi.org/10.5194/nhess-17-657-2017, 2017.
Huang, D. and Gu, D. M.: Influence of filling-drawdown cycles of the Three Gorges reservoir on deformation and failure behaviors of anaclinal rock slopes in the Wu Gorge, Geomorphology, 295, 489–506, https://doi.org/10.1016/j.geomorph.2017.07.028, 2017.
Huang, F. M., Huang, J. S., Jiang, S. H., and Zhou, C. B.: Landslide displacement prediction based on multivariate chaotic model and extreme learning machine, Eng. Geol., 218, 173–186, https://doi.org/10.1016/j.enggeo.2017.01.016, 2017.
Hubei Province Geological Environment Terminus: Survey report of Shuping landslide in Three Gorges Reservoir area, Zigui, Hubei Province, China, 2013 (in Chinese).
Hutchinson, J. N.: An influence line approach to the stabilization of slopes by cuts and fills, Can. Geotech. J., 21, 363–370, https://doi.org/10.1139/t84-036, 1984.
Iverson, R. M.: Unsteady, nonuniform landslide motion: 2. Linearized theory and the kinematics of transient response, J. Geol., 94, 349–364, https://doi.org/10.1086/629034, 1986.
Jia, G. W., Zhan, T. L., Chen, Y. M., and Fredlund, D. G.: Performance of a large-scale slope model subjected to rising and lowering water levels, Eng. Geol., 106, 92–103, https://doi.org/10.1016/j.enggeo.2009.03.003, 2009.
Junfeng Z., Xiangyue M., and Erqian Z.: Testing study on landslide of layered slope induced by fluctuation of water level, Ch. J. Rock Mechanics Eng., 23, 2676–2680, 2004 (in Chinese).
Lambe, T. W. and Whitman, R. V.: Soil mechanics SI version, John Wiley & Sons, Hoboken, 2008.
Lane, P. A. and Griffiths, D. V.: Assessment of stability of slopes under drawdown conditions, J. Geotech. Geoenviron., 126, 443–450, https://doi.org/10.1061/(ASCE)1090-0241(2000)126:5(443), 2000.
Li, D., Yin, K. and Leo, C.: Analysis of Baishuihe landslide influenced by the effects of reservoir water and rainfall, Environ. Earth Sci., 60, 677–687, https://doi.org/10.1007/s12665-009-0206-2, 2010.
Liao, H. J., Sheng, Q., Gao, S. H., and Xu, Z. P.: Influence of drawdown of reservoir water level on landslide stability, Ch. J. Rock Mechanics Eng., 24, 3454–3458, 2005 (in Chinese).
Liu, C. N.: Progressive failure mechanism in one-dimensional stability analysis of shallow slope failures, Landslides, 6, 129–137, https://doi.org/10.1007/s10346-009-0153-8, 2009.
Lu, S. Q., Yi, Q. L., Yi, W., Huang, H. F., and Zhang, G. D.: Analysis of deformation and failure mechanism of Shuping landslide in Three Gorges reservoir area, Rock Soil Mechanics, 35, 1123–1130, 2014 (in Chinese).
Lu, T.: Study of Formation Mechanism and Later Trend Prediction of Fanjiaping Landslide and Baishuihe Landslide, PhD thesis, China Three Gorges University, Yichang, 2012 (in Chinese).
Ma, J. W., Tang, H. M., Hu, X. L., Bobet A., Zhang, M., Zhu, T. W., Song, Y. J., and Eldin M. A. E.: Identification of causal factors for the Majiagou landslide using modern data mining methods, Landslides, 14, 311–322, https://doi.org/10.1007/s10346-016-0693-7, 2017.
McKean, J. and Roering, J.: Objective landslide detection and surface morphology mapping using high-resolution airborne laser altimetry, Geomorphology, 57, 331–351, https://doi.org/10.1016/S0169-555X(03)00164-8, 2004.
Miao, F. S., Wu, Y. P., Li, L. W., Tang, H. M., and Li, Y. N.: Centrifuge model test on the retrogressive landslide subjected to reservoir water level fluctuation, Eng. Geol., 245, 169–179, https://doi.org/10.1016/j.enggeo.2018.08.016, 2018.
Paronuzzi, P. and Bolla, A.: The prehistoric Vajont rockslide: an updated geological model, Geomorphology, 169, 165–191, https://doi.org/10.1016/j.geomorph.2012.04.021, 2012.
Prokešová, R., Kardoš, M., Tábork, P., Medvedová, A., Stacke, V., and Chudy, F.: Kinematic behaviour of a large earthflow defined by surface displacement monitoring, dem differencing, and ERT imaging, Geomorphology, 224, 86–101, https://doi.org/10.1016/j.geomorph.2014.06.029, 2014.
Qin, H. B.: The Mechanism of Landslide Influenced by Rainfall and Reservoir Water Level Fluctuation and Renewed Criterion Research in Three-Gorges Reservoir, PhD thesis, China Three Gorges University, Yichang, 2011 (in Chinese).
Ren, F., Wu, X. L., Zhang, K. X., and Niu, R. Q.: Application of wavelet analysis and a particle swarm-optimized support vector machine to predict the displacement of the Shuping landslide in the Three Gorges, China, Environ. Earth Sci., 73, 4791–4804, https://doi.org/10.1007/s12665-014-3764-x, 2015.
Rinaldi, M. and Casagli, N.: Stability of streambanks formed in partially saturated soils and effects of negative pore water pressures: the Sieve River (Italy), Geomorphology, 26, 253–277, https://doi.org/10.1007/s12665-014-3764-x, 1999.
Rinaldi, M., Casagli, N., Dapporto, S., and Gargini, A.: Monitoring and modelling of pore water pressure changes and riverbank stability during flow events, Earth Surf. Proc. Land., 29, 237–254, https://doi.org/10.1002/esp.1042, 2004.
Skempton, A. W.: Residual strength of clay in landslide, folded strata and the laboratory test, Geotechnique, 35, 1–18, https://doi.org/10.1680/geot.1985.35.1.3, 1985.
Song, W. P.: The unsaturated seepage and stability analysis on slopes at river banks with the case of Xicheng landslides in Yunyang, PhD thesis, Chengdu University of Technology, Chengdu, 2011 (in Chinese).
Song, K., Wang, F. W., Yi, Q. L., and Lu, S. Q.: Landslide deformation behavior influenced by water level fluctuations of the Three Gorges Reservoir (China), Eng. Geol., 247, 58–68, https://doi.org/10.1016/j.enggeo.2018.10.020, 2018.
Song, K., Yan, E. C., Zhang, G. D., Lu, S. Q., and Yi, Q. L.: Effect of hydraulic properties of soil and fluctuation velocity of reservoir water on landslide stability, Environ. Earth Sci., 74, 5319–5329, https://doi.org/10.1007/s12665-015-4541-1, 2015.
Sultan, H. A. and Seed, H. B.: Stability of sloping core earth dams, Journal of the Soil Mechanics and Foundations Division, 93, 45–68, 1967.
Tan, F. L., Hu, X. L., Zhang, Y. M., He, C. C., and Zhang, H.: Study of progressive failure processes and stabilities of different types of landslides, Rock Soil Mechanics, 37, 597–606, 2016 (in Chinese).
Tang, H. M., Li, C. D., Hu, X. L., Su, A. J., Wang, L. Q., Wu, Y. P., Criss, R. E., Xiong, C. R., and Li, Y. A.: Evolution characteristics of the Huangtupo landslide based on in situ tunneling and monitoring, Landslides, 12, 511–521, https://doi.org/10.1007/s10346-014-0500-2, 2015
Tang, H. M., Wasowski, J., and Juang, C. H.: Geohazards in the three Gorges Reservoir Area, China – Lessons learned from decades of research, Eng. Geol., 261, 105267, https://doi.org/10.1016/j.enggeo.2019.105267, 2019.
Terzaghi, K., Peck, R. B., and Mesri, G.: Soil mechanics in engineering practice, John Wiley & Sons, Hoboken, 1996.
Wang, F.: Deformation prediction of Jiuxianping landslide in Yunyang Country based on numerical simulation, PhD thesis, Chengdu University of Technology, Chengdu, 2013 (in Chinese).
Wang, F., Zhang, Y., Wang, G., Peng, X., Huo, Z., Jin, W., and Zhu, C.: Deformation features of Shuping landslide caused by water level changes in Three Gorges Reservoir area, China, Chinese Journal of Rock Mechanics and Engineering, 26, 509–517, 2007 (in Chinese).
Wang, J. E., Xiang, W., and Lu, N.: Landsliding triggered by reservoir operation: a general conceptual model with a case study at Three Gorges Reservoir, Acta Geotech., 9, 771–788, https://doi.org/10.1007/s11440-014-0315-2, 2014.
Wang, H. L. and Xu, W. Y.: Stability of Liangshuijing landslide under variation water levels of Three Gorges Reservoir, Eur. J. Environ. Civ. En., 17, s158–s177, https://doi.org/10.1080/19648189.2013.834592, 2013.
Wen, T., Tang, H., Wang, Y., Lin, C., and Xiong, C.: Landslide displacement prediction using the GA-LSSVM model and time series analysis: a case study of Three Gorges Reservoir, China, Nat. Hazards Earth Syst. Sci., 17, 2181–2198, https://doi.org/10.5194/nhess-17-2181-2017, 2017.
Wu, Q., Tang, H. M., Ma, X. H., Wu, Y. P., Hu, X. L., Wang, L. Q., Criss, R. E., Yuan, Y., and Xu, Y. J.: Identification of movement characteristics and causal factors of the Shuping landslide based on monitored displacements, B. Eng. Geol. Environ., 78, 2093–2106, https://doi.org/10.1007/s10064-018-1237-2, 2019.
Xiao, S. R., Liu, D. F., and Hu, Z. Y.: Study on geomechanical model of Qianjiangping landslide, Three Gorges Reservoir, Rock Soil Mechanics, 28, 1459–1464, 2007 (in Chinese).
Yin, Y., Huang, B., Wang, W., Wei, Y., Ma, X., Ma, F., and Zhao, C.: Reservoir-induced landslides and risk control in Three Gorges Project on Yangtze River, China, J. Rock Mechanics Geotech. Eng., 8, 577–595, https://doi.org/10.1016/j.jrmge.2016.08.001, 2016.
Zou, Z., Yan, J., Tang, H., Wang, S., Xiong, C., and Hu, X.: A shear constitutive model for describing the full process of the deformation and failure of slip zone soil, Eng. Geol., https://doi.org/10.1016/j.enggeo.2020.105766, 2020.