the Creative Commons Attribution 4.0 License.
the Creative Commons Attribution 4.0 License.
 | 25 Jan 2021
Comparing an insurer's perspective on building damages with modelled damages from pan-European winter windstorm event sets: a case study from Zurich, Switzerland
Christoph Welker
Thomas Röösli
David N. Bresch
With access to claims, insurers have a long tradition of being knowledge leaders on damages caused by windstorms. However, new opportunities have arisen to better assess the risks of winter windstorms in Europe through the availability of historic footprints provided by the Windstorm Information Service (Copernicus WISC). In this study, we compare how modelling of building damages complements claims-based risk assessment. We describe and use two windstorm risk models: an insurer's proprietary model and the open source CLIMADA platform. Both use the historic WISC dataset and a purposefully built, probabilistic hazard event set of winter windstorms across Europe to model building damages in the canton of Zurich, Switzerland. These approaches project a considerably lower estimate for the annual average damage (CHF 1.4 million), compared to claims (CHF 2.3 million), which originates mainly from a different assessment of the return period of the most damaging historic event Lothar–Martin. Additionally, the probabilistic modelling approach allows assessment of rare events, such as a 250-year-return-period windstorm causing CHF 75 million in damages, including an evaluation of the uncertainties. Our study emphasizes the importance of complementing a claims-based perspective with a probabilistic risk modelling approach to better understand windstorm risks. The presented open-source model provides a straightforward entry point for small insurance companies.
- Article
(4956 KB) - Full-text XML
- BibTeX
- EndNote


Severe windstorms are responsible for widespread socio-economic impacts such as damage to buildings, structures, transport networks, forests, and even loss of lives. Windstorms represent one of the most damaging natural hazards in many parts of the world, not least in Switzerland (Imhof, 2011). In the densely populated canton of Zurich, which is located in north-eastern Switzerland, windstorms are among the most destructive natural hazards: building damage due to windstorms amount to 30 % of the total amount of building damage from natural hazards in this region. For comparison, damage due to hailstorms and flooding amount to 41 % and 28 %, respectively (all numbers from 2018; GVZ, 2018; VKG, 2020).
In general, the impact of a windstorm in terms of building damages depends on the severity of associated surface winds and gusts as well as on the exposed values and the respective vulnerability (i.e. damage susceptibility) of the buildings being subject to the hazard – with both building stock and vulnerability changing over time. High wind speeds cause large pressure and suction effects, which in turn are responsible for damage to the roof and the building facade. Damaging winds and violent gusts in the canton of Zurich are mainly due to the passage of large-scale extratropical cyclones and their associated fronts during autumn and winter as well as due to mostly local convective storms during summer. Winter windstorms typically cause widespread minor building damages summing up to large amounts, whereas it is not unusual that summer convective storms cause major damage of only a few buildings due to locally very high wind speeds.
The cantonal building insurance GVZ compulsorily insures all buildings in the canton of Zurich (with a few exceptions) against damage due to natural hazards and fire: i.e. in total around 300 000 buildings with a total sum insured of around CHF 500 billion (Swiss Francs) (in 2018). GVZ is an independent institution of the canton of Zurich under public law (GVZ, 2020).
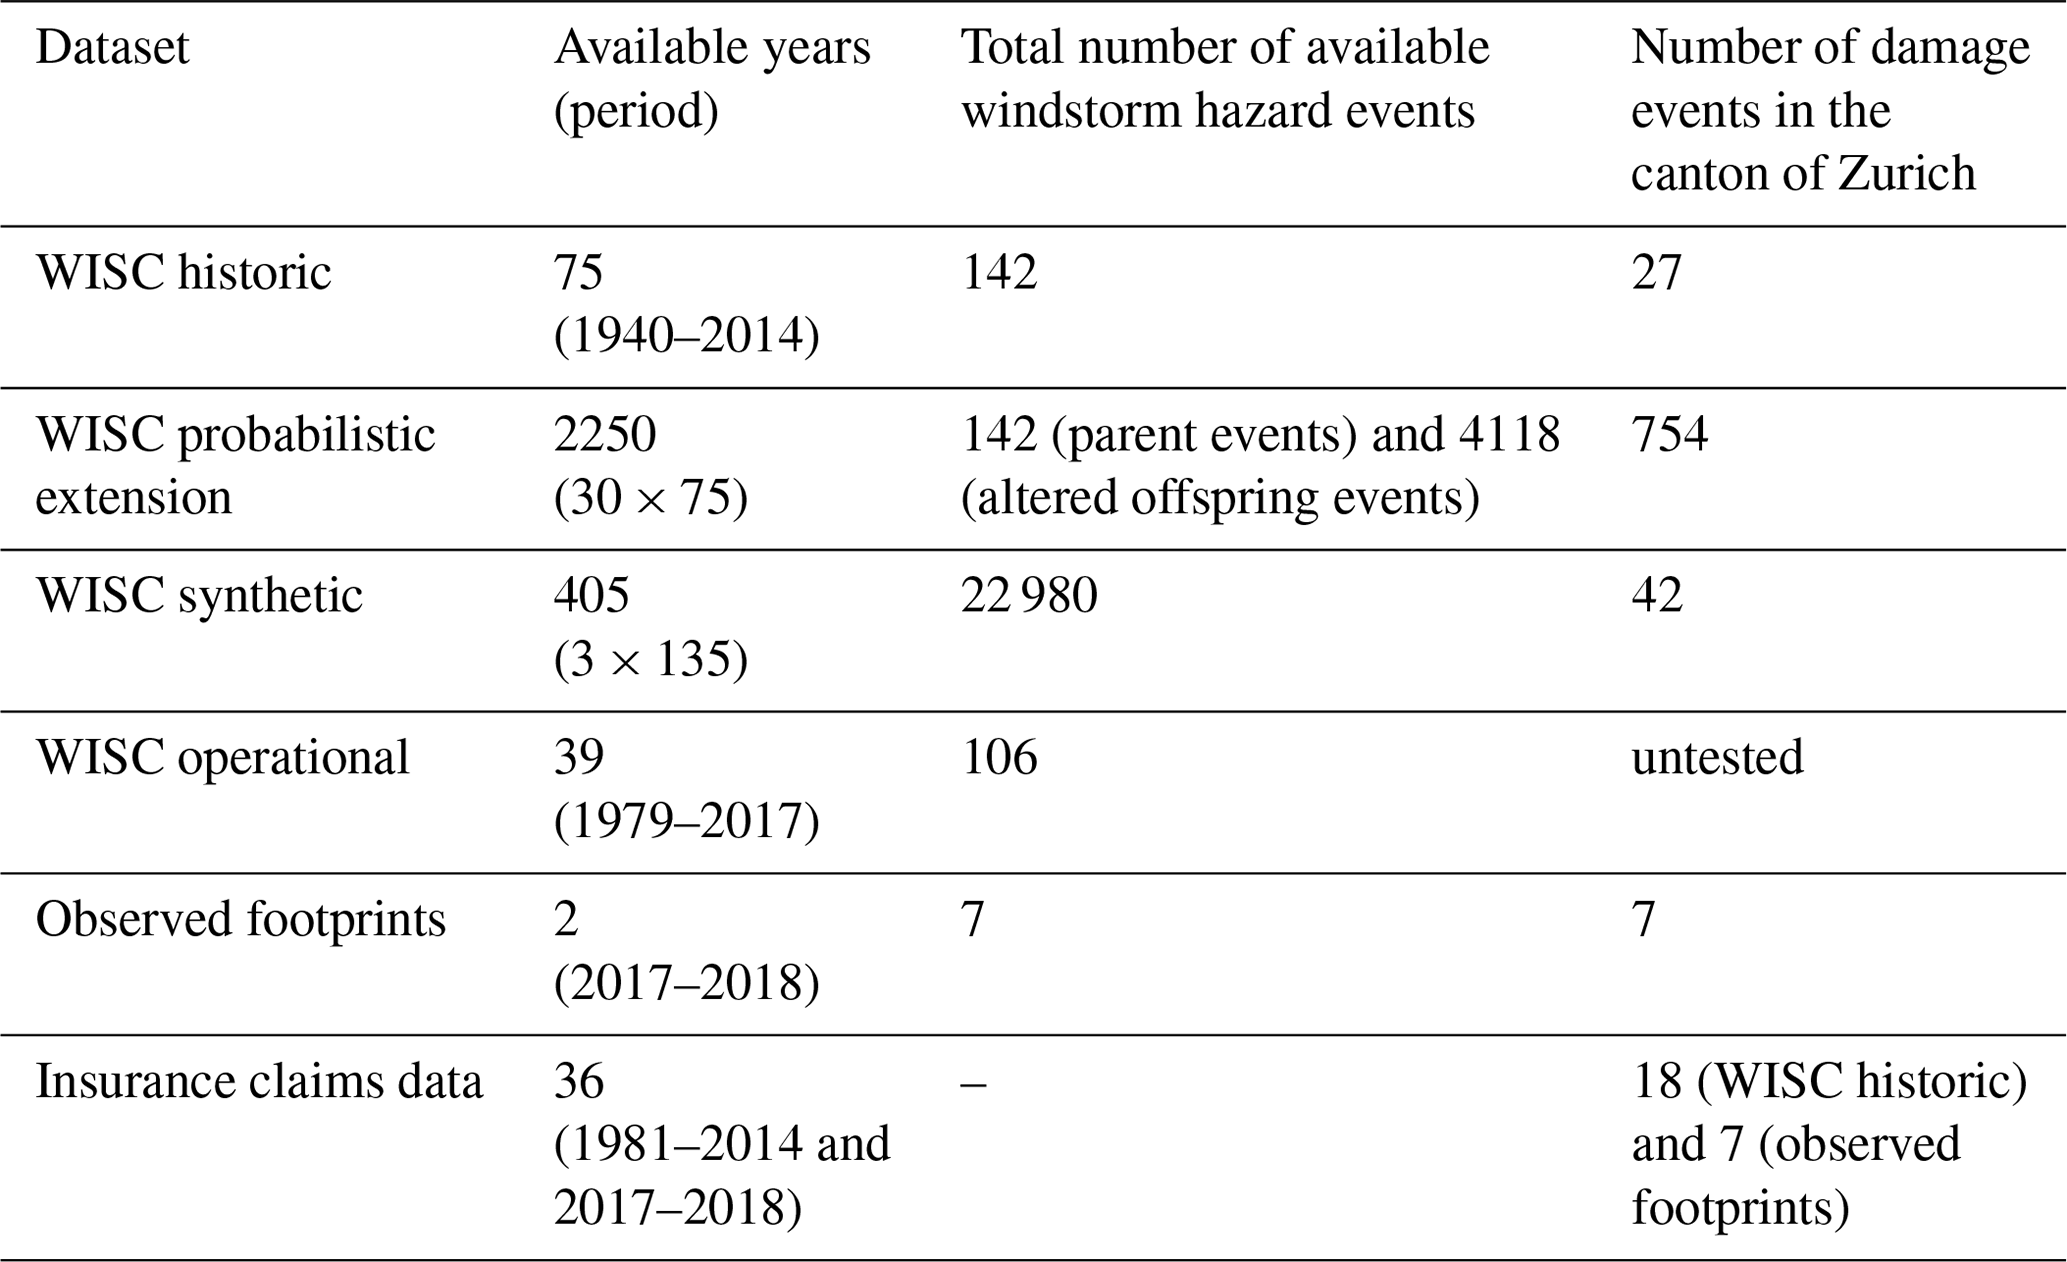
Windstorm damage events in the canton of Zurich have been recorded in GVZ's database since 1981. For example, the windstorm Lothar on 26 December 1999 caused total insured building damages of around CHF 60 million and is by far the most extreme windstorm event in the database. Second largest is the windstorm Burglind on 3 January 2018 (Scherrer et al., 2018), which caused total insured building damages of more than CHF 14 million. The most extreme summer damage event in GVZ's record was due to a very local, but extremely intense convective storm on 2 August 2017 with measured maximum gusts of more than 180 km h−1 in the lowlands, which caused total insured building damages of approximately CHF 4 million. Even though small-scale convective storm events are potentially hazardous, in this study we focus on large-scale winter windstorms only, which have been responsible for around three-quarters of all insured windstorm damages in the canton of Zurich since 1981.
Extreme damage events such as those caused by Lothar or even stronger windstorms are rare by definition. For risk assessment, solid estimates of the probability of occurrence of such events are absolutely essential and GVZ's claims data of almost 40 years provide a too short observational period which leads to a large sampling uncertainty. A larger sample of events is needed for which at least quantitative meteorological data and if possible damage data at ideally high spatiotemporal resolution are available (e.g. Haas and Pinto, 2012). Observational damage data are generally sparse and incomplete for historic windstorms in Switzerland (Stucki et al., 2014). Instead, societal actors often use modelled impacts to manage their risk. Insurance and reinsurance companies apply impact models for their pricing, and governments use modelled risk for option appraisal (e.g. The Economics of Climate Adaptation Working Group, 2009; Bresch, 2016). Additionally, the information is needed for climate-related financial disclosure (Westcott et al., 2020). However, only very few impact models are available as open source with free access for users in both the scientific and public or private domain.
Typically, risk is modelled as a combination of hazard, vulnerability, and exposure (IPCC, 2014). The hazard part is the best understood, and research culminated in open datasets of historic windstorm events (Roberts et al., 2014; WISC, 2019), whereas maximum wind gust speeds are frequently used as the hazard component to assess windstorm risk (e.g. Klawa and Ulbrich, 2003). Vulnerability has been covered by many studies and reviews (e.g. Della-Marta et al., 2010; Schwierz et al., 2010; Feuerstein et al., 2011; Prahl et al., 2015; Koks and Haer, 2020). There are many theoretical learnings from these studies, but an implementation in a comprehensive open-source and easy-access risk assessment model is still missing. Detailed exposure data are generally not publicly available and many societal actors have their own detailed view on exposure and do not need to rely on a publicly available dataset. There are open, spatially explicit datasets available based on the distribution of nightlight and population (Eberenz et al., 2020), based on the gross domestic product (GDP; Geiger et al. 2018), or on building data from OpenStreetMap (Koks and Haer, 2020). The sparse availability is why in some research studies loss ratios were used instead of information on exposure (Donat et al., 2011).
Using the modelling approach for Switzerland, Welker et al. (2016) applied the methods presented first by Stucki et al. (2015) to a sample of more than 80 high-impact winter windstorms that affected Switzerland in 1871–2011. The approach involves the dynamical downscaling of the Twentieth Century Reanalysis (20CR) using the Weather Research and Forecasting (WRF) model. The calculated windstorm footprints served as input for the modelling of economic damages using a precursor of the open-source impact model CLIMADA (CLIMate ADAptation; Aznar-Siguan and Bresch, 2019a). CLIMADA was successfully applied in several other studies for the purpose of risk assessment and quantification of socio-economic impacts (e.g. Della-Marta et al., 2010; Schwierz et al., 2010; Raible et al., 2012; Reguero et al., 2014; Gettelman et al., 2018; Walz and Leckebusch, 2019).
To increase the sample of windstorm footprints available for risk assessment, insurance and reinsurance companies often combine observed windstorm footprints as far as available with synthetic footprints generated by stochastic or dynamic atmospheric models. In this way, they obtain a more comprehensive view on risk.
The Windstorm Information Service (WISC) of the Copernicus Climate Change Service aims to provide a consistent and open database of hazard data to assess the risk of windstorms in Europe for all kinds of players in the insurance sector and beyond. The centrepiece of the WISC dataset is wind gust footprints at high spatial resolution of approximately 4.4 km for, on the one hand, a historic hazard event set of around 140 European winter windstorms in 1940–2014 and, on the other hand, a synthetic hazard event set of around 23 000 events. Similar to the predecessor project Extreme Windstorms Catalogue (XWS; Roberts et al., 2014), the WISC historic hazard event set contains windstorms that hit Europe, but it provides the corresponding wind gust footprints at improved spatial resolution and covers more windstorms over a period longer than the claims database available to most insurance companies. This makes it possible to reduce the sampling uncertainty of the risk assessment. The windstorm hazard event sets as provided by WISC form an independent database to validate and further develop existing European winter windstorm models. The dataset can be used for both pan-European analyses and local analyses, as shown in this study.
Using the WISC historic hazard event set allows GVZ in a way to “re-check” historic events. By means of the synthetic hazard event set, the tail of the hazard and damage distributions should be investigated. However, Röösli et al. (2018) found that the synthetic hazard event set is not suitable for this purpose. Therefore, we instead propose a probabilistic windstorm hazard event set based on a method described in Schwierz et al. (2010) to overcome the shortcomings of the WISC synthetic hazard event set. This new probabilistic hazard event set of around 4300 events contains windstorms from the WISC historic hazard event set altered by various perturbations. As discussed in this study, such a statistical perturbation is based on the same observational period as the WISC historic hazard event set and therefore cannot reduce the sampling uncertainty.
This study shows how GVZ uses both the WISC dataset and the new probabilistic hazard event set for assessing the potential building damage and risk due to extreme windstorm events, including an evaluation of the uncertainties of such assessments. A relationship between wind gust speed in the affected region of the canton of Zurich and associated building damages is found, which allows for a rapid, straightforward estimation of damage directly after the occurrence of extreme, unprecedented windstorms. This study further shows how GVZ was able to improve its windstorm risk assessment on the basis of the WISC dataset and the new probabilistic hazard event set and could serve as an example for other players in the insurance sector or other societal actors in Switzerland and in the rest of Europe. At the same time, this study also illustrates selected limitations of the WISC dataset.
After a description of the insurance claims data (Sect. 2.1) and the windstorm hazard event sets used (Sect. 2.2), we introduce the GVZ and the CLIMADA risk assessment models applied for damage modelling (Sect. 2.3) and conclude this section with a brief recapitulation of the risk assessment metrics employed in this study (Sect. 2.4).
2.1 Insurance claims data
The windstorm damages of past events are recorded in a proprietary database of GVZ. It consists of almost 40 years of insurance claims data, in total more than 84 000 single wind damage records. From this database all the events relevant for this study were selected by following the event definition of the windstorm event set “WISC historic” (Sect. 2.2.1). In total, 18 events are associated with WISC windstorms based on that definition (see also Table 1). Due to the nature of the database, only the damage reports actually insured by GVZ were considered. The insurance claims data allow GVZ to assess the risk for its own portfolio by analysing frequency and severity of past damages, i.e. to assess its risk due to winter windstorm events with a return period smaller than 40 years. Additional information can help GVZ to put their recorded damages into reference and to get a better estimate of the risk of events with a return period larger than the 40 years of experience.
Table 1Summary statistics for the windstorm hazard event sets and insurance claims data used in this study.
For the sake of comparability, the insured damages had to be normalized to present-day exposure levels. In this study, the applied normalization considers the general inflation on the basis of the Zurich construction price index (City of Zurich, 2020). Hereinafter, both insured and modelled windstorm damages are including occasional deductibles – so-called “gross damages” – to ease comparison.
2.2 Windstorm hazard event sets
Atmospheric models provide information about winter windstorm events that can be used as a hazard component in a risk assessment model. WISC published several hazard datasets each containing a set of windstorm events and providing the maximum wind gust per geographic location per event. We used the historic windstorm footprints (Sect. 2.2.1) and constructed a probabilistic extension based on it (Sect. 2.2.3). In addition, we derived wind gust footprints from measurements for a selection of present windstorm events (Sect. 2.2.4). The additional windstorm hazard event sets published by WISC, that are however not considered in this study, are briefly summarized in Sect. 2.2.2.
2.2.1 Historic windstorm hazard event set
The historic windstorm hazard event set – denoted WISC historic – contains wind gust footprints for around 140 winter windstorm events in Europe in 1940–2014 (i.e. 75 modelled years in total). The events were selected, on the one hand, based on the high damage they caused and, on the other hand, because of their high intensity in meteorological terms (i.e. high vorticity). Because of this pan-European perspective, the dataset is not necessarily specific to windstorms in the canton of Zurich. Nevertheless, the high-impact windstorms Lothar–Martin (26–28 December 1999) and other intense windstorms such as Vivian–Wiebke (26 February–1 March 1990) are included.
The windstorm footprints were computed by running the UK Met Office Unified Model (MetUM; Davies et al., 2005) at approximately 4.4 km resolution with ERA-20C reanalysis (Poli et al., 2016) and ERA-Interim reanalysis (Dee et al., 2011) as boundary conditions, covering Europe and parts of the North Atlantic. ERA-20C was used for all windstorm events in 1940–1979 and ERA-Interim for all events in 1979–2014.
Each of the footprints is composed of gridded maximum 3 s gusts, with maxima determined for a 72 h time window. This relatively long time window was chosen, because it is widely used in the insurance sector (WISC, 2019). However, it also implies that the footprints of directly successive events (i.e. with a time difference of less than 72 h) such as Lothar (26 December 1999) and Martin (27–28 December 1999) are combinations of the footprints of both successive events. In this study, the WISC windstorm footprints for events that have overlapping time windows are combined to represent one event – as insurance claims data do not often represent the exact time and date of damage either (for various reasons, a key one being reporting uncertainties). This combination is necessary to make sure that a maximum that occurred only once (e.g. the wind gusts reached during Lothar) is only represented once in the hazard event set (as event Lothar–Martin) and is not represented twice (once as Lothar and once as Martin). There are five pairs of windstorms with overlapping time windows in the original dataset that were combined by taking the maximum wind gust of both footprints at each location, giving in total 142 windstorm events (Table 1). The problem of overlapping windstorm footprints and the resulting combination of events could have been prevented by incorporating the geographical information into the event definition. For example, Roberts et al. (2014) aggregated only the wind gusts within a certain radius around the windstorm centre into a footprint to avoid this problem.
The wind gust speeds from WISC historic are considered to be realistic compared to observations for areas at sea level (WISC, 2019). However, with regard to the hilly topography of the canton of Zurich the question arises as to how realistic the underlying model topography is in comparison to the real topography and, as a result, how good the height-dependent wind gust speeds are compared to observational data. Even though this could not be finally clarified in this study since available wind measurements are generally too sparse for historic windstorms in the canton of Zurich, a correction of all the WISC wind gusts in the form of simple correction factors does not seem reasonable and was therefore not applied.
2.2.2 Other WISC hazard event sets
There are two additional windstorm hazard event sets published by WISC that are however not analysed in detail in this study.
-
The operational windstorm hazard event set – denoted “WISC operational” – contains around 110 windstorm events in 1979–2017 and thus more recent events than the windstorm hazard event set WISC historic used in this study, which contains windstorm events until 2014 only. WISC operational is based on a new generation of atmospheric reanalysis, the ERA5 reanalysis (Hersbach and Dee, 2016). As it does not cover the time range 1940–1979 (compared to WISC historic), it does not complement the recorded damages by providing information about historic events not covered by GVZ's claims database.
-
The synthetic windstorm hazard event set – denoted “WISC synthetic” – was created within the UPSCALE (UK on PRACE – weather-resolving Simulations of Climate for globAL Environmental risk; UPSCALE, 2020) modelling framework and is a physically realistic set of plausible winter windstorm events in the period 1985–2011 based on the climatic conditions of that period. The modelling framework developed five ensembles. The dataset contains wind gust footprints for around 23 000 synthetic windstorms: i.e. three sets of 7660 events each. Each of the three sets covers 135 modelled years. The original idea of the hazard event set WISC synthetic was to use wind information from climate models to provide wind gust footprints for winter windstorms in Europe with a return period of 250 years or even higher. However, this hazard event set was not considered because the findings of Röösli et al. (2018) could be replicated in this study, showing that the dataset does not contain the maximum wind gust speeds we would expect from the distribution of the historic windstorm hazard events (Fig. A1) nor the high intensities we would expect from very rare, high-impact windstorm events (Fig. 1).
For a detailed description of all unused windstorm hazard event sets provided by WISC, we refer to the documentations available online at WISC products (2019) and WISC hazard event set description (2019).
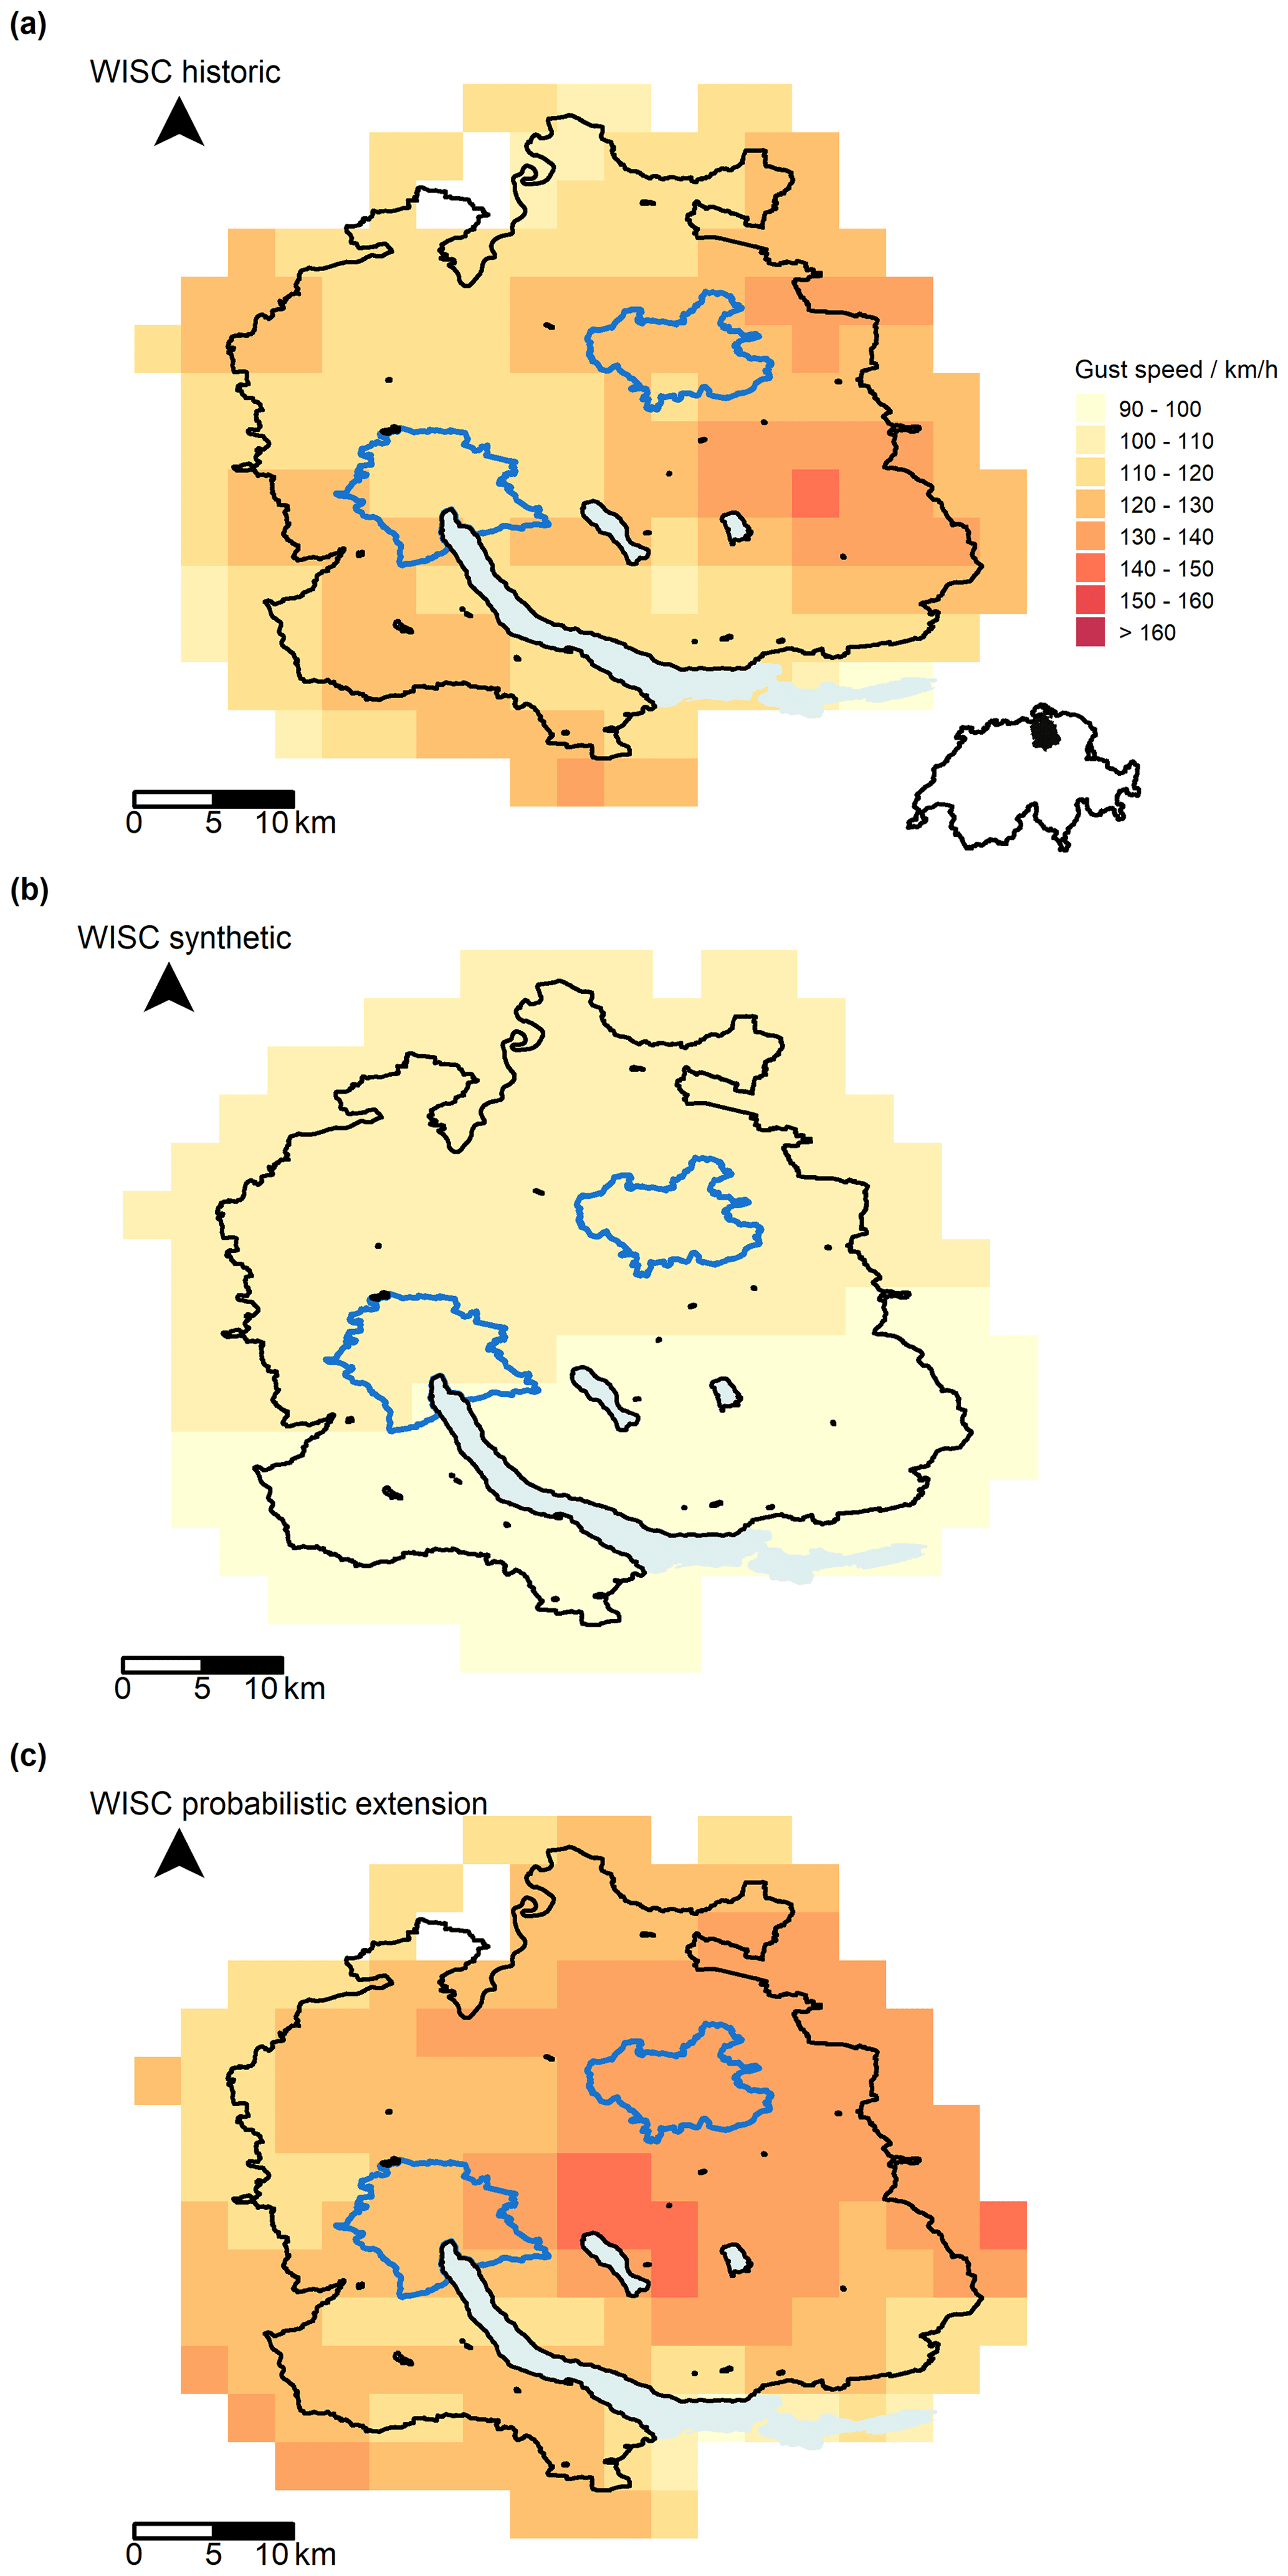
Figure 1Maximum wind gusts for every grid cell in the canton of Zurich (i.e. windstorm footprints) for the most damaging events in (a) WISC historic, (b) WISC synthetic, and (c) WISC probabilistic extension. The urban areas of the two main cities Zurich (left) and Winterthur (right) are marked in blue.
2.2.3 Probabilistic windstorm hazard extension
Based on WISC historic, we generated an additional probabilistic windstorm hazard event set – denoted “WISC probabilistic extension”. By applying a method described in Schwierz et al. (2010), the individual windstorm events in WISC historic (parent events) were altered to create 29 altered offspring events by various perturbations: e.g. spatial displacement and by weakening or intensifying the wind speeds (non-altered wind speeds are spatially displaced only). The spatial displacement was undertaken by shifting the respective windstorm footprint by about 20 km to the north, south, west, or east. The wind gust speeds were intensified and weakened by no more than 3 m s−1 (normally much less) according to the probabilistic alteration of wind speeds in Eq. (1), with a scale parameter α=0.0225 and a power parameter β=1.15 (choice explained further below):
These newly created “probabilistic” footprints can be viewed as scenarios of plausible windstorms as they only differ slightly from historic events, retaining both the spatial extent and general structure. In countries close to the sea or with a pronounced and high topography, the methodology for creating the probabilistic events might need adaptation to better incorporate the difference in surface roughness and altitude.
For using the scenarios in a qualitative risk assessment framework, the probabilistic windstorm footprints can be used as they are, but for a quantitative risk assessment the frequencies of the windstorm footprints need to be estimated. In an effort to assign reasonable frequency estimates to the probabilistic windstorm footprints, we considered the distribution of the historic, pan-European Storm Severity Index (SSI; formula used by Dawkins et al., 2016; further information in Lamb and Frydendahl, 1991; Leckebusch et al., 2008). Similar to in Schwierz et al. (2010), the algorithm of creating the probabilistic windstorm footprints was configured to recreate the cumulative distribution function of a generalized extreme value (GEV) distribution fitted to the historic SSI values. We defined the frequency of all probabilistic windstorm footprints to be equal and to sum up to the frequency of the parent windstorm. We then selected a set of parameters for weakening and intensifying the wind speeds (parameters α and β in Eq. 1) that resulted in a similar probabilistic distribution of SSI as the extrapolated distribution from the historic SSI values. For the probabilistic hazard event set to best represent the tail of the historic distribution, we determined a combination of α and β that minimizes the difference in the cumulative distribution functions for events that have a return period of > 75 years.
WISC probabilistic extension includes footprints for 4118 probabilistic windstorm events, along with the 142 original windstorm events in WISC historic (Table 1), and provides a basis of an event-based risk assessment for winter windstorms with return periods of around 250 years, a scenario relevant for regulatory requirements in the insurance sector. It is important to note that this method incorporates a lot of uncertainty, including but not limited to the sampling uncertainty of rare events in a relatively short time range (i.e. 75 years in the case of WISC historic).
Encouragingly, the hazard event set WISC probabilistic extension shows considerably higher wind gust speeds in the canton of Zurich compared with WISC synthetic (Fig. 1). Nonetheless, the maximum wind gust speeds of the most extreme event in WISC probabilistic extension are not considerably higher than those of Lothar–Martin, the most extreme event in both WISC historic and the insurance claims data.
2.2.4 Observed footprints for current windstorms
Real-time wind gust observations can serve as the hazard part of the damage model for a rapid damage estimation directly after the occurrence of an extreme windstorm event. Such “observed” windstorm footprints can also be used for further validation of GVZ's damage modelling approach (Sect. 2.3). To create such footprints, we used interpolated wind gust measurements in the canton of Zurich based on the Common Information Platform for Natural Hazards (GIN; GIN, 2019) for a selection of seven winter windstorms in the years 2017 and 2018. With the exception of winter windstorm Burglind hitting Switzerland on 3 January 2018, the windstorms considered caused only minor damages in the canton of Zurich. The individual windstorm footprints are based on a total of around 110 measurement stations in the canton of Zurich and in the immediate vicinity (i.e. buffer zone with a distance of 20 km around the polyline of the canton). For spatial interpolation, we applied an inverse distance weighting (IDW) interpolation with the Shepard method used for weight calculation. In this study, the gridded wind gust footprints derived from measurements have a horizontal resolution of 2 km. The topography of the canton of Zurich is not considered in the applied interpolation method and unquestionably the quality of the derived windstorm footprints could be improved by using a more elaborate interpolation method, which takes account of the topography.
2.3 Damage modelling approaches
The windstorm footprints of the different hazard event sets described in the previous section were used as input for damage modelling, and GVZ's proprietary windstorm damage model was applied for this (Sect. 2.3.1). In addition, the CLIMADA impact model was used to be able to publish the method used in this study with open data and open-source code (Sect. 2.3.2).
In both damage models, the extent of damage results from the intensity of the windstorm event (i.e. hazard), the value of the asset (i.e. exposure), and the susceptibility of the asset to damage (i.e. vulnerability). This concept is broadly used and is explained in more detail in Aznar-Siguan and Bresch (2019a). In this study, the windstorm hazard assessment is based on the winter windstorm footprints described in Sect. 2.2. The exposure is the value of the buildings in the canton of Zurich, and the vulnerability is described by a functional relationship that defines how much the buildings are damaged at a certain wind gust speed. In both damage models, we use the vulnerability curve of Schwierz et al. (2010). This vulnerability curve combines the damage degree and the percentage of assets affected. Only damage to buildings is estimated. The estimate does not include damage to movable property, damage to infrastructure, or business interruption.
2.3.1 GVZ damage model
The damage estimates in this model are computed using a rather conventional modelling framework, and the reduced complexity of the approach allows an interpretable assessment of the model skill. Normally, GVZ uses its damage model directly after the occurrence of a windstorm event to estimate the expected building damage. Furthermore, GVZ applies the damage model to estimate the damage potential and the risk associated with windstorms with regard to solvency considerations and prevention options. The main points of the modelling approach are described in the following.
The initial step is a simple spatial overlay of the gridded maximum wind gust speeds during the respective windstorm event with GVZ's current building stock (from 2018; without sublevel garages, as they are usually not affected by windstorms), where GVZ's proprietary building database with information about the sum insured of each building and the publicly available building footprints (GIS, 2019) were used. GVZ's insurance penetration in the canton of Zurich is almost 100 %. In the damage model, damage is possible from a wind gust speed of more than 90 km h−1, and only buildings affected by such gusts were considered in the following modelling steps.
Figure A2 shows the spatial distribution of all insured buildings in the canton of Zurich as well as of the total sum insured at the municipal level. The aggregated sum insured for all buildings in the two main cities, Zurich and Winterthur (municipal boundaries indicated by blue polygons), accounts for almost 40 % of the total insured value for the entire canton.
To estimate the damage in monetary terms, the value of each individual building (i.e. its insured value) was multiplied by the factor “mean damage degree” (MDD, a number between 0 and 1) calculated from the vulnerability curve of Schwierz et al. (2010), where the gust speeds at building level computed in the first step were converted into the corresponding MDD factors. The MDD factors are a non-linear function of the maximum wind gust speed during a windstorm event and are diagrammed in Welker et al. (2016). The same vulnerability curve of Schwierz et al. (2010) is also implemented in the open-source impact model CLIMADA (Aznar-Siguan and Bresch, 2019a).
In the next step of the damage model, the probability of buildings affected is calculated with a stochastic approach. The respective windstorm event was automatically categorized according to its severity (here, according to the 95th percentile of all gust speeds at building level in the affected region of the canton of Zurich), from which the assumed degree of impact is derived. The degree of impact for the different windstorm categories (i.e. a percentage of total affected buildings for the canton of Zurich, m) was derived from proprietary event damage data from GVZ's database. Then, a random sample of m buildings was selected, with the number m depending on the windstorm's severity. Only buildings with MDD > 0 were considered, i.e. only those buildings with potential damage > 0. For the selected buildings, the amount of damage at building level was summed to obtain the total damage for the entire canton. This procedure of random sampling was repeated 1000 times, giving a total damage range for each windstorm event. Unless otherwise stated, for each windstorm the median of the damage distribution is given hereinafter.
2.3.2 CLIMADA impact model
The windstorm damage model in the open-source risk assessment platform CLIMADA relies on open data only, and that is why it deviates in some aspects from GVZ's approach described above. As the windstorm hazard component is open, it is identical to the hazard input used in the case of the GVZ damage model. The exposure is based on public data instead of GVZ's proprietary portfolio information. CLIMADA uses produced capital for Switzerland published by the World Bank (2018) as the total value of physical assets for Switzerland and further uses a combination of nightlight intensity and population density to create a reliable geographical distribution of the assets (Eberenz et al., 2020). The resulting values are then distributed to building footprints from OpenStreetMap (OpenStreetMap contributors, 2017). Analogous to the GVZ damage model, CLIMADA uses the MDD curve of Schwierz et al. (2010). Instead of a random resampling of affected buildings, the MDD factor is combined with the deterministic factor “percentage of assets affected” (PAA).
As the total value of the exposure is different between the GVZ exposure, the CLIMADA exposure, and the exposure used in Schwierz et al. (2010), the MDD and PAA factors might be wrongly scaled for this study. In the CLIMADA model setup used, we adjusted for this by linearly scaling the MDD and PAA factors to reduce the difference of the modelled damages and the insured damages for matching events (i.e. by minimizing the root-mean-square deviation, RMSD). This adjustment conserved the shape of the original vulnerability curve.
The CLIMADA impact model and the GVZ damage model have a different sensitivity to the hazard intensity: in CLIMADA, damage is possible for a wind gust speed of 72 km h−1 (20 m s−1) and above and in the GVZ damage model for 90 km h−1 (25 m s−1) and above.
2.4 Assessment of potential windstorm damage and risk
Risk is defined here as the product of the extent of damage and the probability of damage. The probability of damage is driven, on the one hand, by the probability that the building is within the area of high wind gust speeds and, on the other hand, by the return period of the windstorm event. The probability that the building is within the area of high wind gust speeds is incorporated in the modelled damage amount by the spatially explicit modelling approach and the vulnerability, which includes the percentage of assets affected (in the case of CLIMADA). The return period or frequency of windstorm events is derived from the hazard event sets. Return periods express the probability of occurrence of windstorm events (e.g. an event with a return period of 250 years is expected on average every 250 years).
There are several risk assessment metrics that can be calculated with a set of event damages, which are the main result from the damage modelling described above.
2.4.1 Average annual damage
The average annual damage (AAD) is an important risk measure in the insurance industry. It describes the risk from all events reported on an annual basis:
2.4.2 Exceedance frequency curve
Using the annual frequencies of the events in a hazard event set, it is possible to determine at what frequency a certain damage amount is exceeded. The largest damage amount is exceeded once in the time range covered by the damage event set, the second largest damage amount is exceeded twice, the third one thrice, and so on. The exceedance frequency curve shows the damage amount as a function of exceedance frequency. For large damage amounts, this matching typically relies on only a few damage events, which increases the sampling uncertainty.
2.4.3 Pareto pricing
In the insurance industry, the concept of “Pareto pricing” is a simple approach to represent and extrapolate the distribution of a damage event set to define the price of insurance contracts (Mitchell-Wallace et al., 2017). We imitated this pricing method by fitting a generalized Pareto distribution (GPD) to damage event sets using a maximum likelihood estimate (MLE). We do this even though some assumptions in statistical theory are not valid for these datasets (e.g. windstorm damage event sets are clustered, which breaks the independence assumption), as we use the GPD only to show the underlying sampling uncertainty. To fit a GPD to a damage event set, only the threshold has to be chosen. We chose a threshold for each damage event set, which results in a parameterized GPD with similar exceedance frequencies for the largest damage amount in the event set. For the insured damages we chose a threshold of CHF 0.4 million and for the modelled damage event set based on WISC historic we chose a threshold of CHF 0.1 million. By using the percent point function (the inverse of a cumulative distribution function) on the fitted distributions, an exceedance frequency curve for the fitted distribution was calculated.
To illustrate the uncertainty of the exceedance frequency curve, we undertook a resampling and thereby show the sampling uncertainty for each damage event set. In the resampling, we generated 200 random samples from the fitted distribution and used the MLE to fit a GPD to each random sample. The exceedance frequency curves of these resampled distributions illustrate the sampling uncertainty, especially for rare events with a high return period. We show the 90 % confidence interval of damage amounts for each exceedance frequency, which spans from the 5th percentile to the 95th percentile of the 200 samples.
In the case of the damage event set computed on the basis of WISC probabilistic extension, the uncertainty is best illustrated by the sampling uncertainty of the damage event set based on WISC historic for the following reasons. The procedure of computing the hazard event set WISC probabilistic extension by statistical perturbation (as described in Sect. 2.2.3) transforms part of the sampling uncertainty of the hazard event set WISC historic into an uncertainty of the parameters α and β in Eq. (1). However, this parameter uncertainty is difficult to illustrate, since no combination of α and β could be found which adequately represents the upper and lower boundaries of the sampling uncertainty of the pan-European SSI distribution. Additionally, the sampling uncertainty of WISC probabilistic extension no longer represents the same uncertainty as in the case of the other damage event sets. Thus, for the purpose of comparing the uncertainties of the different damage event sets, we suggest using the sampling uncertainty of WISC historic as the best illustration of the uncertainty of WISC probabilistic extension.
However, for certain applications in the insurance industry the tail view of WISC probabilistic extension is an important feature of the dataset. The sampling uncertainty of WISC historic is too large to provide, for instance, a comparison criterion between two different exceedance frequency curves from different models. Therefore, we propose illustrating the probabilistic content of WISC probabilistic extension by using bootstrapping of all probabilistic damage events. In this way, a “probabilistic envelope” around the best-guess exceedance frequency curve can be determined (see also Sect. 2.4.2). This way of illustration shows how the problem could be addressed in practice, knowing well that it does not illustrate the full uncertainty. In contrast to the sampling uncertainty, the probabilistic envelope could represent something like the “represented uncertainty”. In the approach applied, we firstly bootstrapped (random sampling with replacement, number of samples is 100) the historic damage events and then used these samples to create an ensemble of probabilistic damage event sets. Secondly, for each new probabilistic damage event set, we randomly bootstrapped (number of samples is 20) the equivalent of 500 years of windstorm events and built an exceedance frequency curve for each sample. From this set of double-bootstrapped damage event sets (total number of samples is 2000), we then calculated the span between the 5th percentile and the 95th percentile for each exceedance frequency to illustrate the envelope of the probabilistic content.
Table 2Annual average damage (AAD) and event damage for different return periods (RP) and the windstorm event Lothar–Martin on the basis of insurance claims data and modelled damages using the GVZ damage model and the hazard event sets WISC historic and WISC probabilistic extension, respectively.

3.1 Single events
The damage due to Lothar–Martin is by far the largest windstorm event damage in GVZ's insurance claims database (Fig. A3a): Lothar–Martin caused insured damages of CHF 62.4 million. Lothar–Martin is the most damaging windstorm event in the canton of Zurich in both the 34-year period of insurance claims data and the 75-year period of WISC historic. The damages modelled with the GVZ damage model range between CHF 58.0 million and CHF 69.0 million, and the median of all modelled damages amounts to CHF 62.7 million (Fig. A3b). For Burglind, the most damaging event of the “observed footprints”, the modelled damages range between CHF 10.4 million and CHF 14.5 million, with a median of CHF 12.0 million. For comparison, the insured damages amount to CHF 14.2 million. Thus, damages associated with intense windstorm events like Lothar–Martin or Burglind are very well modelled with GVZ's damage modelling approach, providing confidence in the methodology. For all recorded windstorm events since 1981 (including the additional seven windstorms in 2017 and 2018), the RMSD between the insured damage and the median modelled damage amounts to CHF 2.4 million. Furthermore, the example of Burglind shows that our methodology of creating windstorm footprints on the basis of interpolated wind gust observations (Sect. 2.2.4) is suitable for present and probably also for future windstorm events.
3.2 Average annual damage
The average annual damage (AAD) calculated based on the insured damages (i.e. the mean damage over the observational period of 34 years) is almost twice as high as the AAD computed on the basis of WISC historic (Table 2). Several factors contribute to the fact that the AAD is higher for the insured damages than for the modelled damages based on WISC historic: (i) the occurrence of the very intense event Lothar–Martin, along with other intense events, in the relatively short available period of insurance claims data (Fig. A3a), (ii) the higher damages of events in the 5-year-return-period range (Table 2), and (iii) the different number of events per year considered. The hazard event set WISC probabilistic extension was created to best represent the low-frequency tail of the pan-European SSI and not the full distribution of (high-frequency) damages in the canton of Zurich. Nevertheless, the modelled AAD based on the GVZ damage model and WISC probabilistic extension is close to the AAD of WISC historic.
3.3 Assessment of risks due to extreme windstorm events
Figure 2 shows GVZ's windstorm risk assessment of building damage, including uncertainty, on the basis of all available data sources. Based on the insurance claims data only, the return period for the extreme windstorm event Lothar–Martin is estimated to be 34 years (blue squares). Based on WISC historic, the return period for Lothar–Martin is estimated to be 75 years (yellow dots). Based on the hazard event set WISC probabilistic extension and using GVZ's approach for damage modelling, the return period for a damage amount due to Lothar–Martin would be around 125 years (red diamonds). These estimates represent the best guess for each damage event set. It is important to note that the quantified sampling uncertainty of the estimate for the return period of Lothar–Martin based on WISC historic (yellow ribbon, 25 to >500 years) incorporates both the estimate for the insurance claims data (blue ribbon) and the estimate based on WISC probabilistic extension.
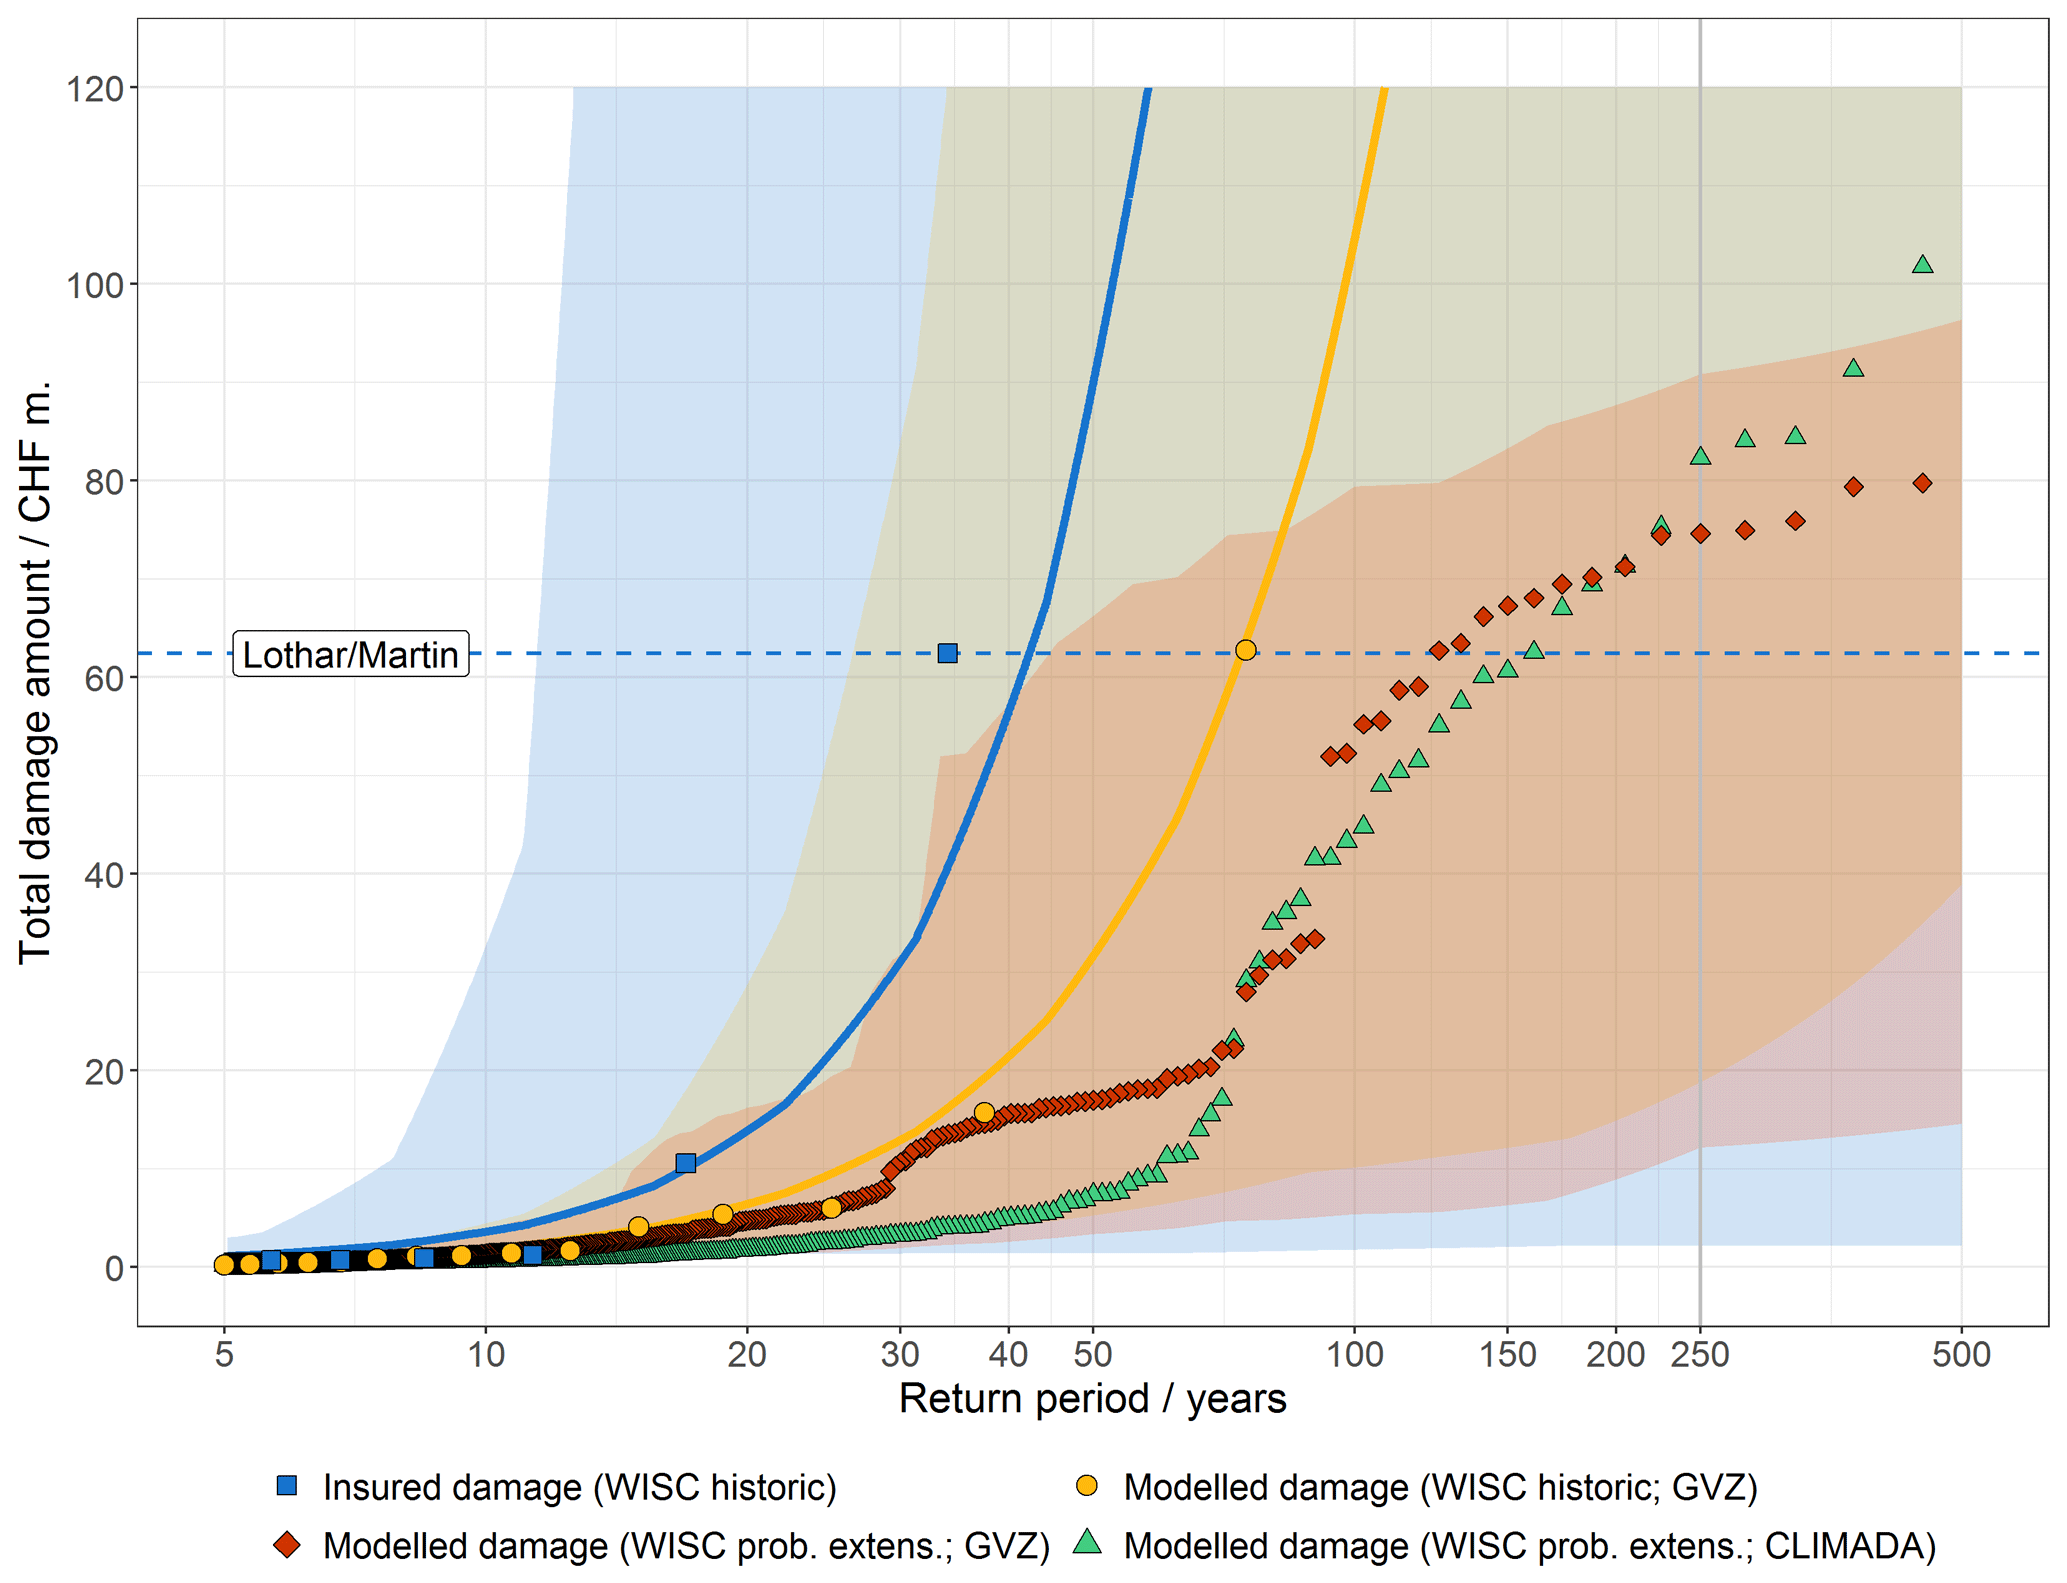
Figure 2Exceedance frequency curves for building damages in the canton of Zurich based on different data sources. The blue squares indicate the insured damages according to GVZ's database (excluding the additional windstorms in 2017 and 2018), the blue solid line represents a GPD fitted to the insured damages, and the blue ribbon is the 90 % confidence interval produced by resampling. The yellow dots, solid line, and ribbon are analogous to the blue, but for the modelled damages based on WISC historic and the GVZ damage model. The red diamonds (green triangles) show the exceedance frequency curve of the modelled damages based on the hazard event set WISC probabilistic extension and the GVZ damage model (CLIMADA). The red ribbon shows the probabilistic envelope for the modelled damages based on WISC probabilistic extension and the GVZ damage model computed by applying a bootstrapping approach as described in Sect. 2.4.3. The insured total damage for Lothar–Martin is shown by a blue dashed horizontal line, and the 250-year return period is indicated by a grey solid vertical line.
The extrapolated event damage with a return period of 250 years amounts to about CHF 500 million for WISC historic, and using the same method for the insured damages the extrapolated 250-year-event damage would be even higher, around CHF 2.4 billion (yellow and blue lines in Fig. 2). Contrary to this, the 250-year-event damage amounts to only about CHF 75 million in the case of the hazard event set WISC probabilistic extension (red diamonds). The 90 % confidence interval, which represents the sampling uncertainty of the extrapolation of the damage exceedance frequency, based on WISC historic provides a range for the 250-year-return-period damage of CHF 19 million to 33 billion (yellow ribbon). As WISC probabilistic extension is based on the same historic information, this sampling uncertainty also applies to its results. At a return period of 250 years, the quantified uncertainty of the estimate based on WISC historic incorporates both the estimate for the insurance claims data and the estimate based on WISC probabilistic extension.
An interesting feature illustrated in Fig. 2 is that at higher return periods the modelled damages on the basis of WISC probabilistic extension increase less strongly compared to the two extrapolations based on the fitted distributions. Evident “jumps” in the modelled damage (e.g. at return periods of approximately 30, 70, and 90 years) result from the discrete categorization of the individual windstorm events and the assumed degrees of impact as applied in GVZ's damage modelling approach (Sect. 2.3.1).
The red ribbon in Fig. 2 shows a possibility of illustrating the probabilistic envelope for the modelled damages based on WISC probabilistic extension and the GVZ damage model, according to a bootstrapping approach as described in Sect. 2.4.3. As expected, the probabilistic envelope for WISC probabilistic extension is much smaller than the range of sampling uncertainty for WISC historic (yellow ribbon).
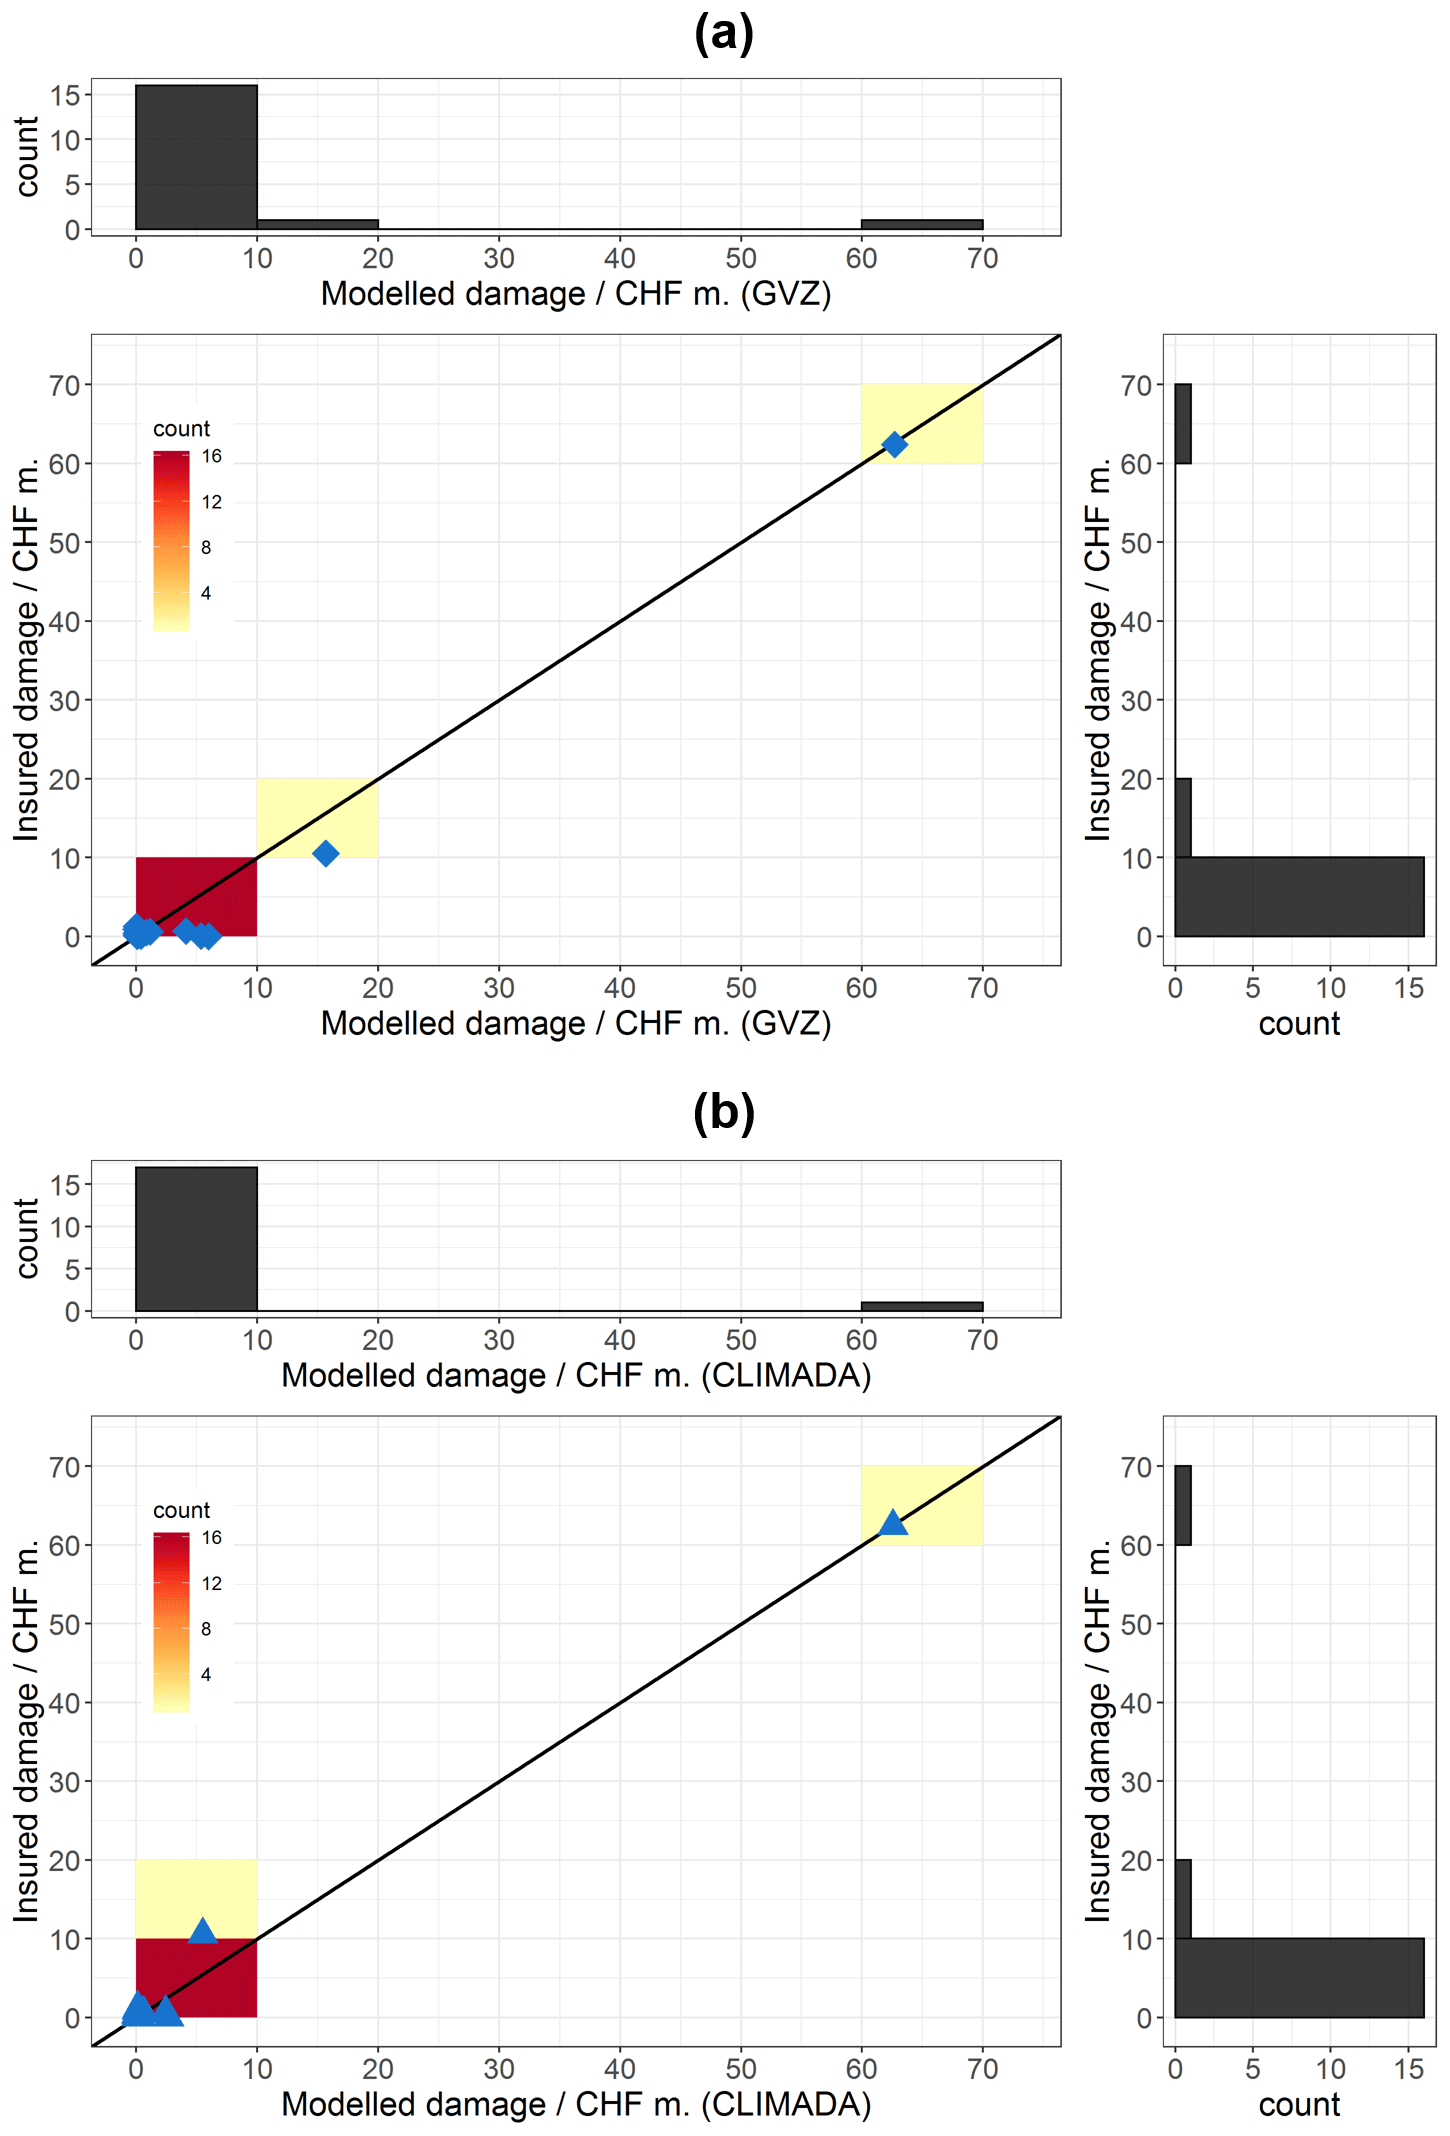
Figure 3The 2D histograms for the normalized insured total damages in the canton of Zurich versus the modelled total damages based on (a) the GVZ damage model (diamonds) and (b) the CLIMADA impact model (triangles), respectively, for all windstorms with damage > 0 in the hazard event set WISC historic. Marginal histograms are shown in the top and right panels of each subfigure.
3.4 Reproducibility of the results using CLIMADA
In general, GVZ's proprietary windstorm damage model is suitable for correctly simulating building damage in the canton of Zurich (see Figs. 3 and A3, and Sect. 3.1). Using the calibrated CLIMADA impact model for windstorm damage modelling is also suitable and the corresponding RMSD amounts to CHF 1.5 million for all recorded windstorm events since 1981 for which WISC wind gust footprints are available (excluding the additional windstorms in 2017 and 2018). The statistics in Table 2 calculated using the GVZ damage model were also calculated using the CLIMADA impact model and the results can be found in Table A1. In summary, it can be stated that the setup of the two damage models applied works well and replicates the order of the events, provides a reasonable modelled damage for historic events (compared to insurance claims data), and both RMSDs are sufficiently good.
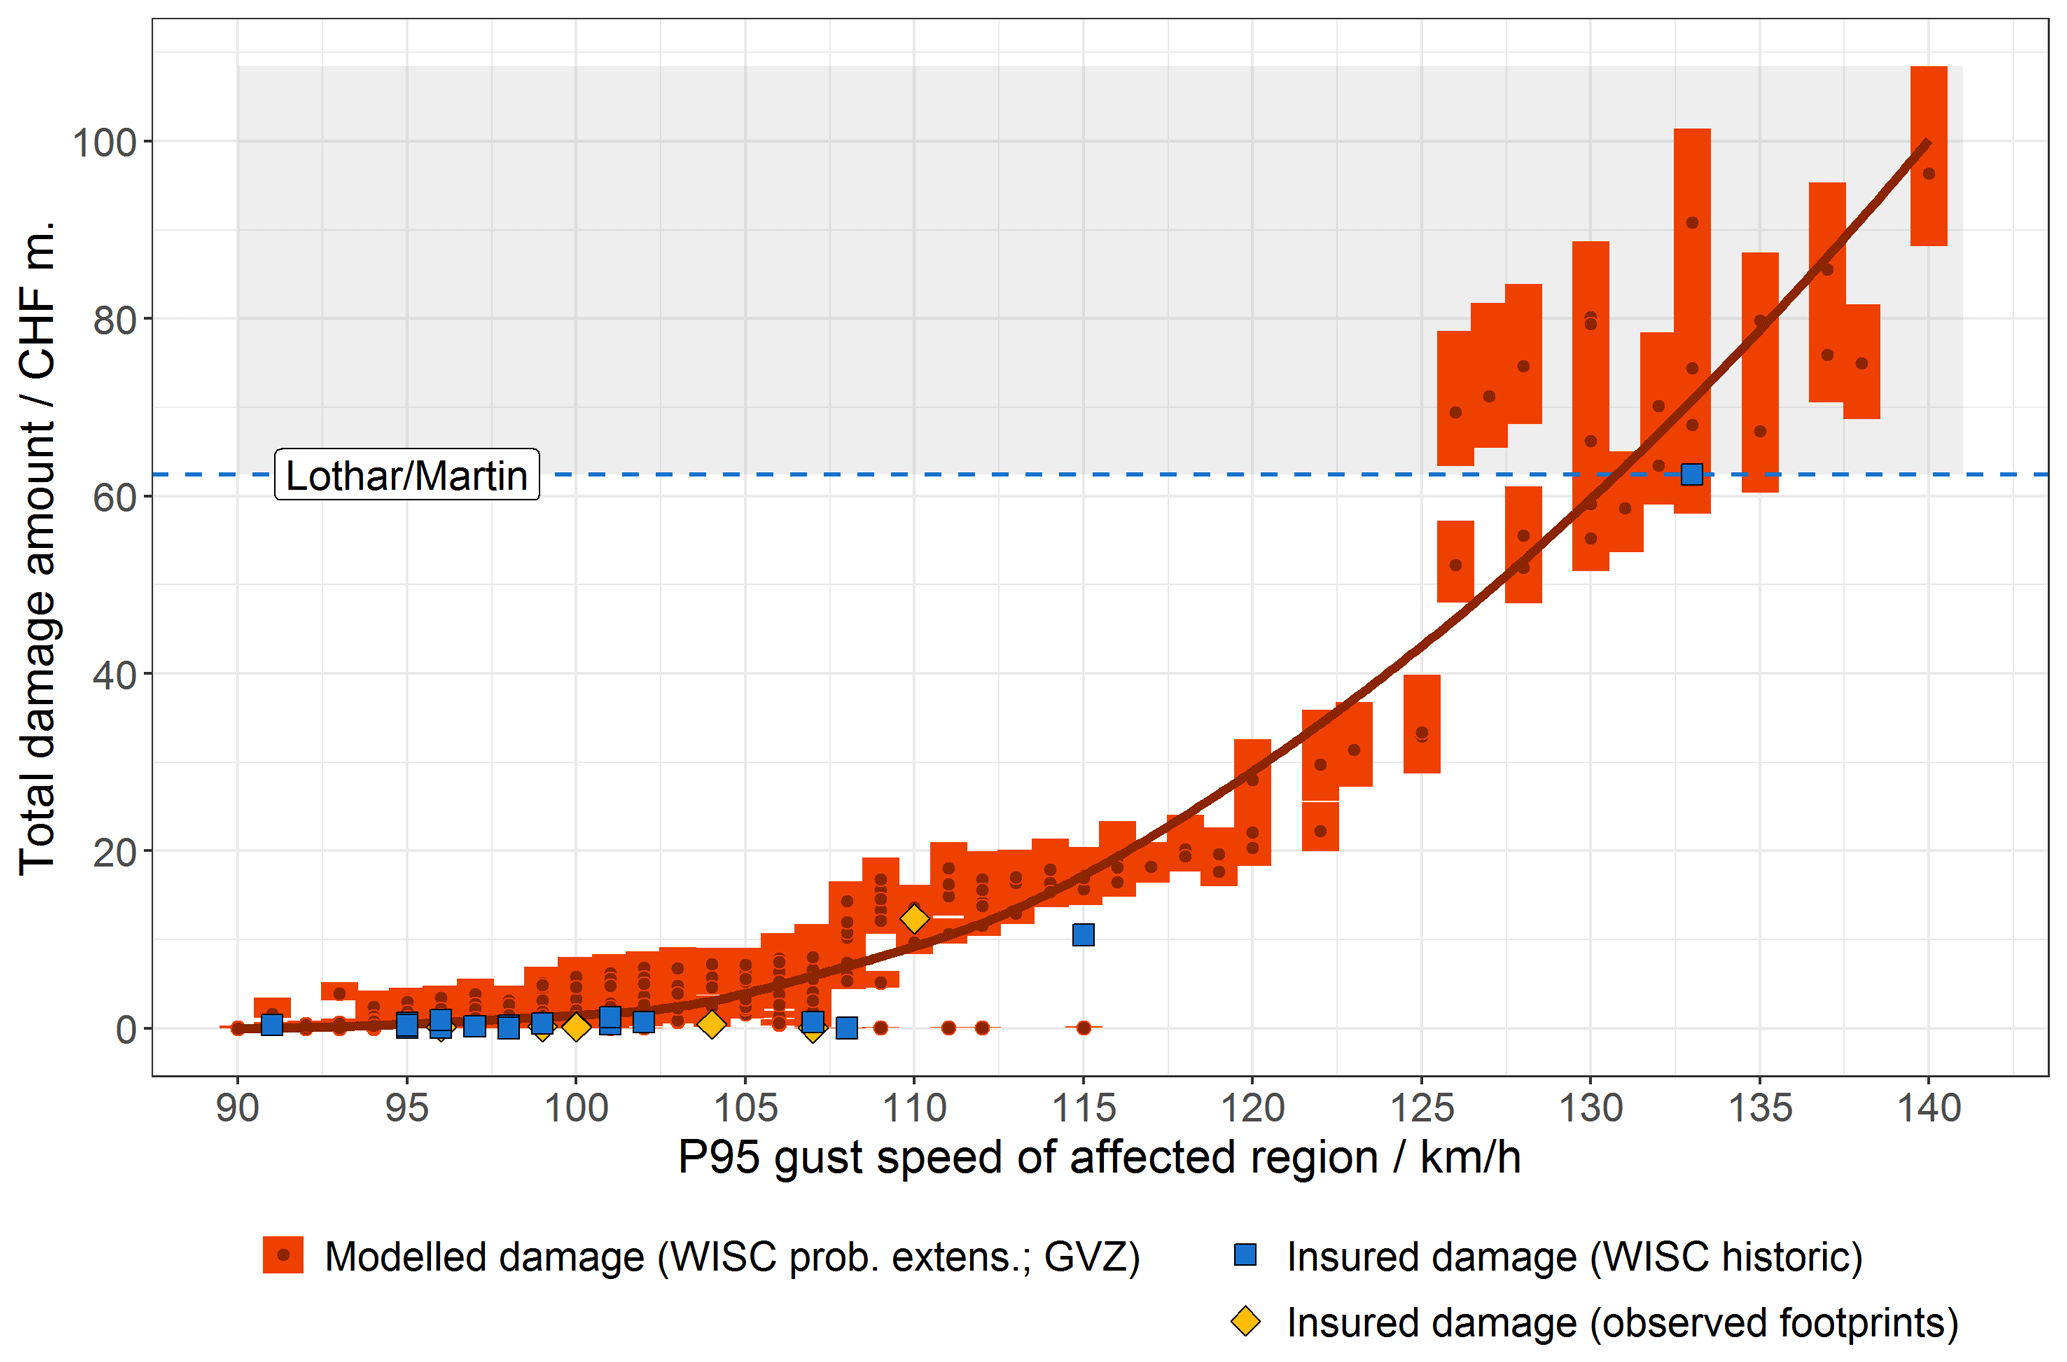
Figure 4Total damage modelled using the GVZ damage model and the hazard event set WISC probabilistic extension versus the 95th percentile of the corresponding gust speeds in the affected region of the canton of Zurich (median of 1000 random damage modelling as red points; range of modelled damages indicated as red bars). The 95th percentile of the gust speeds is shown, because the 95th percentile is used in GVZ's damage model to categorize windstorm events (Sect. 2.3.1). The relationship between wind gust speed and modelled total damage is further approximated by a locally estimated scatterplot smoothing (LOESS) and a bootstrap method (i.e. random resampling with replacement, number of samples is 1000; median of confidence interval given as solid red line). Furthermore, the relationship between gust speeds and normalized insured total damages based on WISC historic and independent, interpolated wind gust observations (selection of windstorms in 2017 and 2018, including winter windstorm Burglind) are given as blue squares and yellow diamonds, respectively. The domain for unprecedented windstorm damages – i.e. beyond Lothar–Martin – is shaded grey.
The exceedance frequency curve of the modelled damages based on WISC probabilistic extension and the CLIMADA impact model (green triangles in Fig. 2) show in general lower values compared to the damage modelling using the GVZ approach (red diamonds), in particular for return periods between 30 and 70 years. This difference is also reflected in the scatter plots in Fig. 3, where in Fig. 3a the GVZ damage model shows an overestimation of the damage amount due to the windstorm event Vivian–Wiebke (with insured damage of approximately CHF 11 million), whereas the CLIMADA impact model shows an underestimation for the same event. The reason for this over- and underestimation of the damage in the case of events such as Vivian–Wiebke could be due to the hazard or exposure part of the respective model but is more likely due to the applied vulnerability curve itself. Apparently, the two damage models perform differently for windstorm events in a medium-intensity category. This difference between the two models also becomes evident regarding the AAD risk metric: the AAD of the CLIMADA impact model with WISC historic amounts to CHF 1.1 million (Table A1) and is thus almost a third smaller than the AAD associated with the GVZ damage model (CHF 1.4 million). In addition, the curve of the modelled damages is much smoother in the case of CLIMADA (Fig. 2), which can be explained by the fact that in CLIMADA the smooth curve of the PAA factors is used. This shows the importance of the applied vulnerability curve in the presented damage modelling approach.
3.5 Rapid damage estimation
Rapid damage estimation directly after a windstorm event is very useful for insurance companies to get a first rapid assessment of the damage to be expected and to assign their staff accordingly. For current windstorm events, the GVZ does this using its damage model and the wind gust footprints based on observed footprints (Sect. 2.2.4). The 95th percentile of the wind gust speeds at building level in the affected region of the canton of Zurich, which is also used in GVZ's damage model to categorize windstorm events (Sect. 2.3.1), is used as a rapid indicator of the range of possible damages. This process is illustrated in Fig. 4. With the help of the dataset WISC probabilistic extension, assessments can also be made about potential damages from unprecedented, extreme windstorm events. The uncertainty of the damage assessment for such extreme events can be visualized by the large number of available (extreme) events. In total, WISC probabilistic extension contains 17 events which are potentially more damaging than Lothar–Martin. A (modelled) total damage amount of more than CHF 96 million is associated with the most extreme windstorm event in WISC probabilistic extension (Fig. 1). Thus, this windstorm is potentially about 1.5 times as damaging as Lothar–Martin.
Figure 4 further shows, by the length of the red bars, the stochastic component in GVZ's damage modelling approach, which tries to approximate the random selection as not every building is equally affected during a windstorm event (Sect. 2.3.1). The range of modelled damages (length of red bars) increases with increasing wind gust speed. On the other hand, the quotient of the range of modelled damages and the median of the damage distribution (red points) generally decreases with increasing wind gust speed. Jumps in the modelled damage (e.g. for wind gust speeds lower than 126 km h−1) again result from the discrete categorization of the individual windstorm events in the GVZ damage model.
The absolute difference between the modelled damage amount and the corresponding value of the regressed relationship (red points and solid red line in Fig. 4) generally increases with increasing wind gust speed. Accordingly, the number of available wind gust footprints decreases with increasing wind gust speed.
Any information about the historic risk of winter windstorms in the canton of Zurich contains the record of the event Lothar–Martin. As this is the most damaging event in the record by far, the general risk assessment is connected to the assessment of the return period of this event damage, which will always be uncertain. We argue that the return period based on the historic windstorm footprints (75 years) is much more reliable than the return period based on the insured damage record (34 years). Well aware of the fact that the two estimates each have overlapping uncertainties, the estimates do not contradict each other. Rather the estimates, as best guesses, can inform varying deterministic risk views. Other information, like the return period of Lothar–Martin's damage amount based on WISC probabilistic extension and an independent catalogue of historic windstorms in Switzerland by Stucki et al. (2014) suggest that the return period of such a damage amount could be even rarer than 75 years. This clearly shows the added value that GVZ achieves in its risk assessment through applying the WISC wind data compared to using insurance claims data only – and, above all, through the additional dataset WISC probabilistic extension. The return period of extreme windstorm events such as Lothar–Martin can now be assessed more reliably.
The windstorms Lothar and Martin affected, in addition to Switzerland, in particular France, Belgium, Luxembourg, and Germany. The original industry damages associated with Lothar and Martin amount to approximately EUR 5.8 billion and 2.5 billion, respectively (PERILS, 2020). The return period for exceeding the damage amount due to Lothar alone in all of Europe was estimated to be 15 years by Munich Re (2002), and the return period for the cluster of the three windstorms in December 1999 of Anatol (3 December 1999), Lothar, and Martin was estimated to be between 22 and 45 years (Renggli and Zimmerli, 2016). This study shows that it is important to make a distinction between the return period of an event like Lothar–Martin in all of Europe and the return period of this event locally, in a relatively small region. The damage modelling shown in this study, using the event set WISC historic and the local exposure information, enables a much more reliable derivation of the return period specific to GVZ than the existing scientific work is able to provide.
Based on WISC historic and the GVZ damage model, the average annual damages for building damage in the canton of Zurich amounts to CHF 1.4 million according to our calculation, and we argue that this is the best available estimate for the AAD. However, this estimation is still uncertain due to the high sampling uncertainty, the uncertainty associated with the assessment of the event Lothar–Martin, and the uncertainty with regard to the damage modelling itself. For comparison, in the last 10 years GVZ has experienced yearly damages from all natural hazards of CHF 16 million and additionally yearly damages by fire of CHF 42 million (all numbers from 2018; GVZ, 2018). Compared to the risk from these hazards, the estimated AAD from winter windstorms of CHF 1.4 million is relatively small. However, the occurrence of windstorm events such as Vivian–Wiebke, Lothar–Martin, and Burglind has shown that single windstorms are able to cause huge damage amounts and they are consequently an important causal element when assessing capital requirements.
Insurance companies undertake their business under a strict regulatory environment, and having enough capital to cover rare events is one of the regulatory requirements. The damage amount reached on average every 250 years is an often-mentioned indicator for such a rare event. However, the insured damages and also the modelled damages based on WISC historic do not span a long enough period by far to make an empirical prediction of a damage amount with a return period of 250 years. All methods of extrapolation from these datasets suffer from sampling uncertainty (shown as confidence intervals in Fig. 2). The hazard event set WISC probabilistic extension uses the distribution of pan-European SSI values to create a set of probable events with higher return periods than WISC historic. The uncertainty of the return periods of such events cannot however considerably be reduced compared to WISC historic, because it relies on the same historic information. The fact that the probabilistic envelope for the modelled damages based on WISC probabilistic extension (red ribbon in Fig. 2) does not cover the full range of the sampling uncertainty for the modelled damages based on WISC historic (yellow ribbon) shows two things: on the one hand, it shows the tail view, which is possible with the help of WISC probabilistic extension for certain applications in the insurance industry for instance; on the other hand, it reveals the limitations of the statistical perturbation, which is used in the generation of WISC probabilistic extension, to fully represent the sampling uncertainty of the underlying historic data. Despite this mismatch, it can nevertheless be important to study the sensitivity of the 250-year-return-period damage to changes in the portfolio (like growth or changed building codes), changes in the deductible, or other changes. WISC probabilistic extension provides windstorm footprints of events with a return period of 250 years (and more) that allow the modelling of damages with changes in the exposure or the vulnerability. In future studies, the information from dynamical models, which are run for many model years, would help to further reduce the sampling uncertainty compared to this study.
It comes as no surprise that the choice of the vulnerability curve in the damage modelling approach applied strongly influences the results of the damage estimation (e.g. Koks and Haer, 2020), and unsurprisingly no optimal “one-size-fits-all” vulnerability curve exists. Every damage model behaves differently, not least because different vulnerability curves are used and each of the damage models has been calibrated differently. The vulnerability curve of Schwierz et al. (2010) is based on movable property and building damages associated with European winter windstorms. The rather general function does not make a distinction between building types, in contrast to other available functions (e.g. Feuerstein et al., 2011). For a modelling setup with focus on the hazard, the vulnerability curve of Schwierz et al. (2010) is however suitable and was successfully applied in earlier studies (e.g. Stucki et al., 2015; Welker et al., 2016). The function does not require detailed information regarding the values at risk, which is certainly an advantage for such insurance and reinsurance companies that do not have detailed exposure data for their damage modelling. A disadvantage of the used vulnerability curve is that it does not implicitly provide a quantification of the uncertainty as a probabilistic vulnerability curve would (e.g. Heneka et al., 2006; Prahl et al., 2012). The quantification of the uncertainty of exposure and vulnerability information was generally omitted in this study to focus on the comparison of the claims and hazard datasets. But of course, for comparison of the presented risk numbers with other studies, the uncertainty of the vulnerability and exposure information play a bigger role. The vulnerability assumed in this study and the corresponding hazard intensity only consider the maximum gust speeds during an event and not the duration of high wind gusts within a windstorm event, which can however have a major impact on the damage to be expected. Taking the windstorm duration into account (e.g. Etienne and Beniston, 2012) could improve our damage modelling, and it is planned to implement this in a future version of GVZ's damage model. Furthermore, it is not considered that buildings are partially adapted to local wind conditions (e.g. multi-storey buildings or exposed buildings located on mountaintops).
Not every building is equally affected during a windstorm event. To take that into account, in the GVZ damage model a random resampling of affected buildings was applied according to an assumed degree of impact (red bars in Fig. 4). The assumed degree of impact was derived according to the respective severity category of the windstorm. This severity categorization and the assumed degrees of impact are inevitably relatively rough in GVZ's current model setup, because the assumptions are based on insurance claims data from only a few past windstorm events in the canton of Zurich. With every further windstorm, these assumptions will however become more reliable in the future. In contrast, the deterministic PAA values (Schwierz et al., 2010), as used in the CLIMADA impact model, are much smoother and thus allow smooth damage modelling (Fig. 2). However, these values are not specific for windstorms in the canton of Zurich and they do not allow a stochastic sampling as in GVZ's damage modelling approach.
The rapid estimate of the damage potential in the event of extreme, unprecedented windstorm events shown in Fig. 4 is just one example of how the WISC data and in particular the additional damage event set WISC probabilistic extension can be used for insurance applications. The idea was to be able to make a statement about the damage to be expected simply based on available wind observations in the area of the canton of Zurich. It is always important for insurance companies to be able to give a damage assessment as rapidly as possible after an event, not least when it comes to media inquiries. However, one should keep in mind that the uncertainty shown does not incorporate the full uncertainty of the damage estimate, but rather the uncertainty that results from the random selection as not all buildings are affected equally during a windstorm event. In a future study, it would be interesting to quantify the full uncertainty of the rapid damage estimate.
Not least, the WISC wind data enable insurance companies to evaluate the variability and long-term changes of winter windstorms and their associated damage since 1940. Besides a marked interannual and decadal-scale variability of windstorms in the canton of Zurich, we find a tendency for more intense windstorms since approximately the middle of the 1980s (Fig. A3d). One possible reason for this positive trend is that WISC historic consists of two “parts” with different databases: until 1979, the ERA-20C reanalysis (Poli et al., 2016) was used for downscaling, followed by the ERA-Interim reanalysis (Dee et al., 2011). Furthermore, a change in the large-scale atmospheric dynamics has been observed in recent decades, which was conducive to increased winter windstorm activity and intensity in Switzerland (Welker and Martius, 2015). This change was accompanied by an atmospheric circulation pattern resembling a southeastwardly displaced winter North Atlantic Oscillation (NAO) pattern. Which of the two reasons is dominant for the found positive tendency in winter windstorm intensity and associated damages in the canton of Zurich could not be finally clarified in the present study. Furthermore, how winter windstorm activity and intensity in mid-latitude Europe will change in a future warmer climate is still uncertain (Catto et al., 2019).
This study is an example of how a regional building insurance company in Switzerland uses the open database of European windstorm event sets provided by WISC in combination with a probabilistic extension for their assessment of potential building damages and risks as a result of extreme winter windstorm events, including an evaluation of the uncertainties. The windstorm event Lothar–Martin in December 1999 is the most damaging event in both the insurance claims data and WISC historic (damage of more than CHF 60 million). The average annual damage for building damages in the canton of Zurich is CHF 1.4 million, computed based on WISC historic and the GVZ damage model.
Both the insurance claims data and the modelled building damages based on WISC historic are rather unsuitable for evaluating rare windstorm damage events with return periods considerably exceeding the observational period. The new hazard event set WISC probabilistic extension projects a damage amount of approximately CHF 75 million for a return period of 250 years, while the uncertainty for an extrapolation to such return periods is still very large. However, the probabilistic hazard event set allows for testing of the sensitivity of the risk to changes in the insurance portfolio or in the insurance condition (e.g. the deductible) for events of a higher intensity than the observed historic events.
Our analysis is implemented in GVZ's proprietary windstorm damage model as well as in the open-source risk assessment platform CLIMADA (Bresch and Aznar-Siguan, 2019a). This guarantees scientific reproducibility and offers insurance companies and other societal actors in Switzerland and the rest of Europe the opportunity to apply the shown methodology to their own portfolio with a low entry threshold. This study illustrates how open climatological data and open-source damage models can be used to assess windstorm risks in Europe and how this approach complements risk assessments based on proprietary insurance claims data only.
There is a growing societal need for physical risk disclosure, not least in the context of the Task Force for Climate-related Financial Disclosure (TCFD; Westcott et al., 2020). The presented methodology, in particular the combination of the WISC hazard data with the open-source CLIMADA platform, can be used for such a disclosure report.
Table A1AAD and event damage for different return periods (RP) and the windstorm event Lothar–Martin on the basis of insurance claims data and modelled damages using the CLIMADA impact model and the hazard event sets WISC historic and WISC probabilistic extension, respectively.
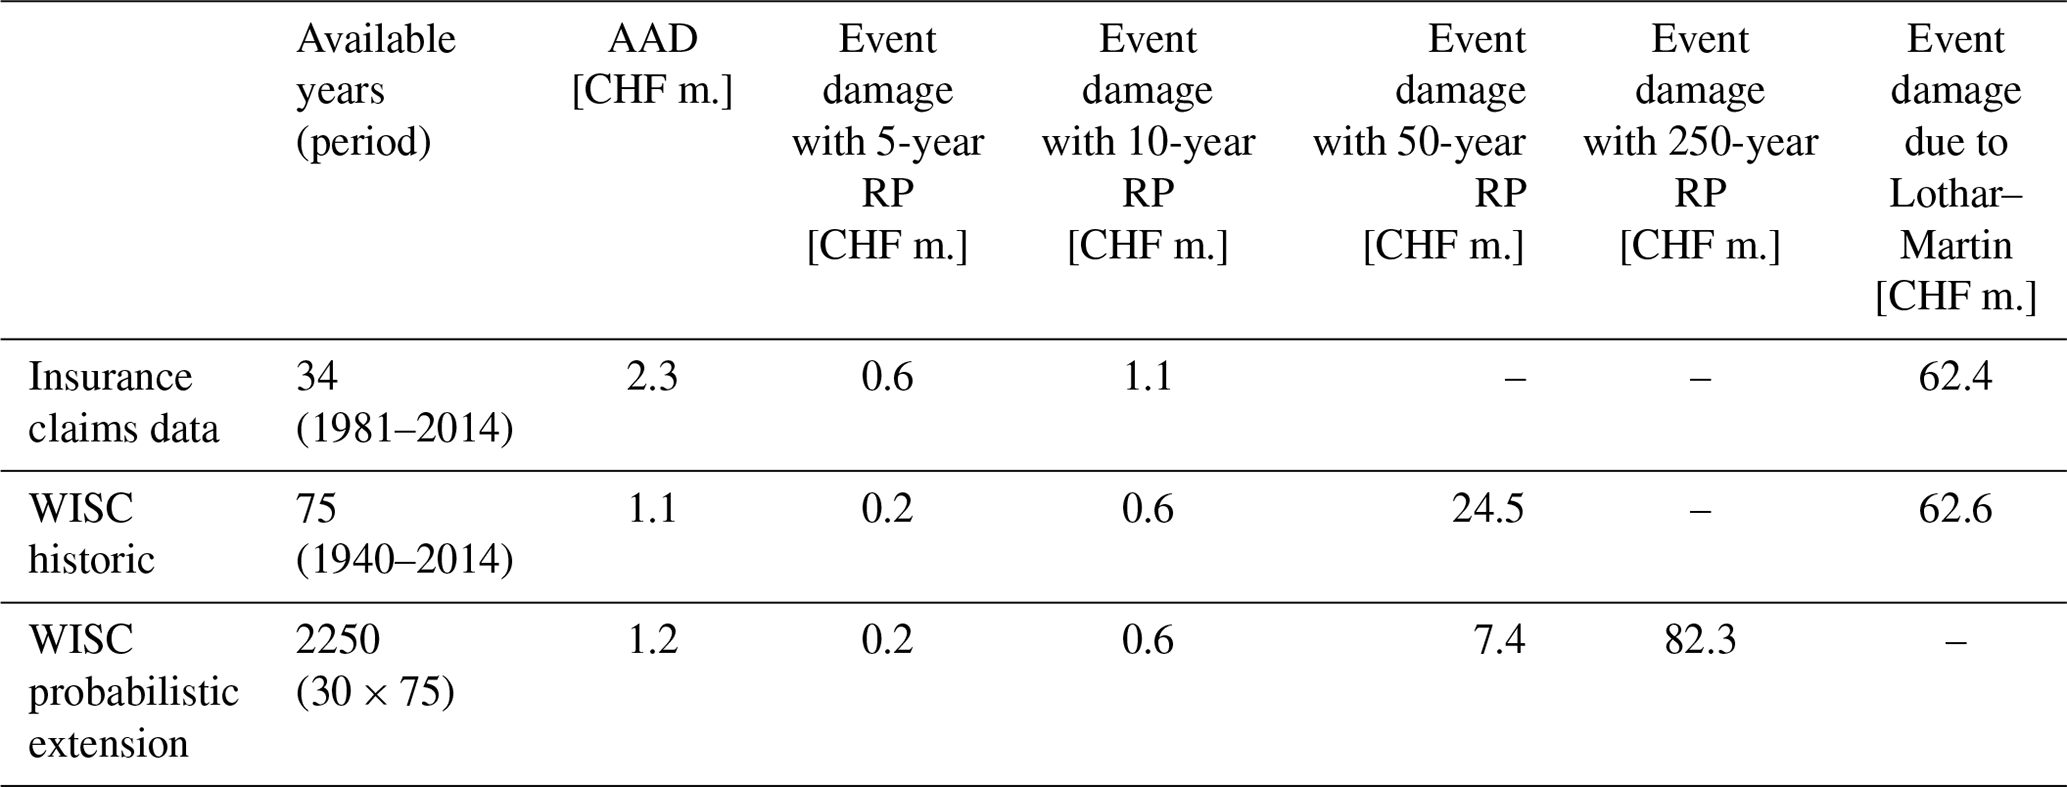
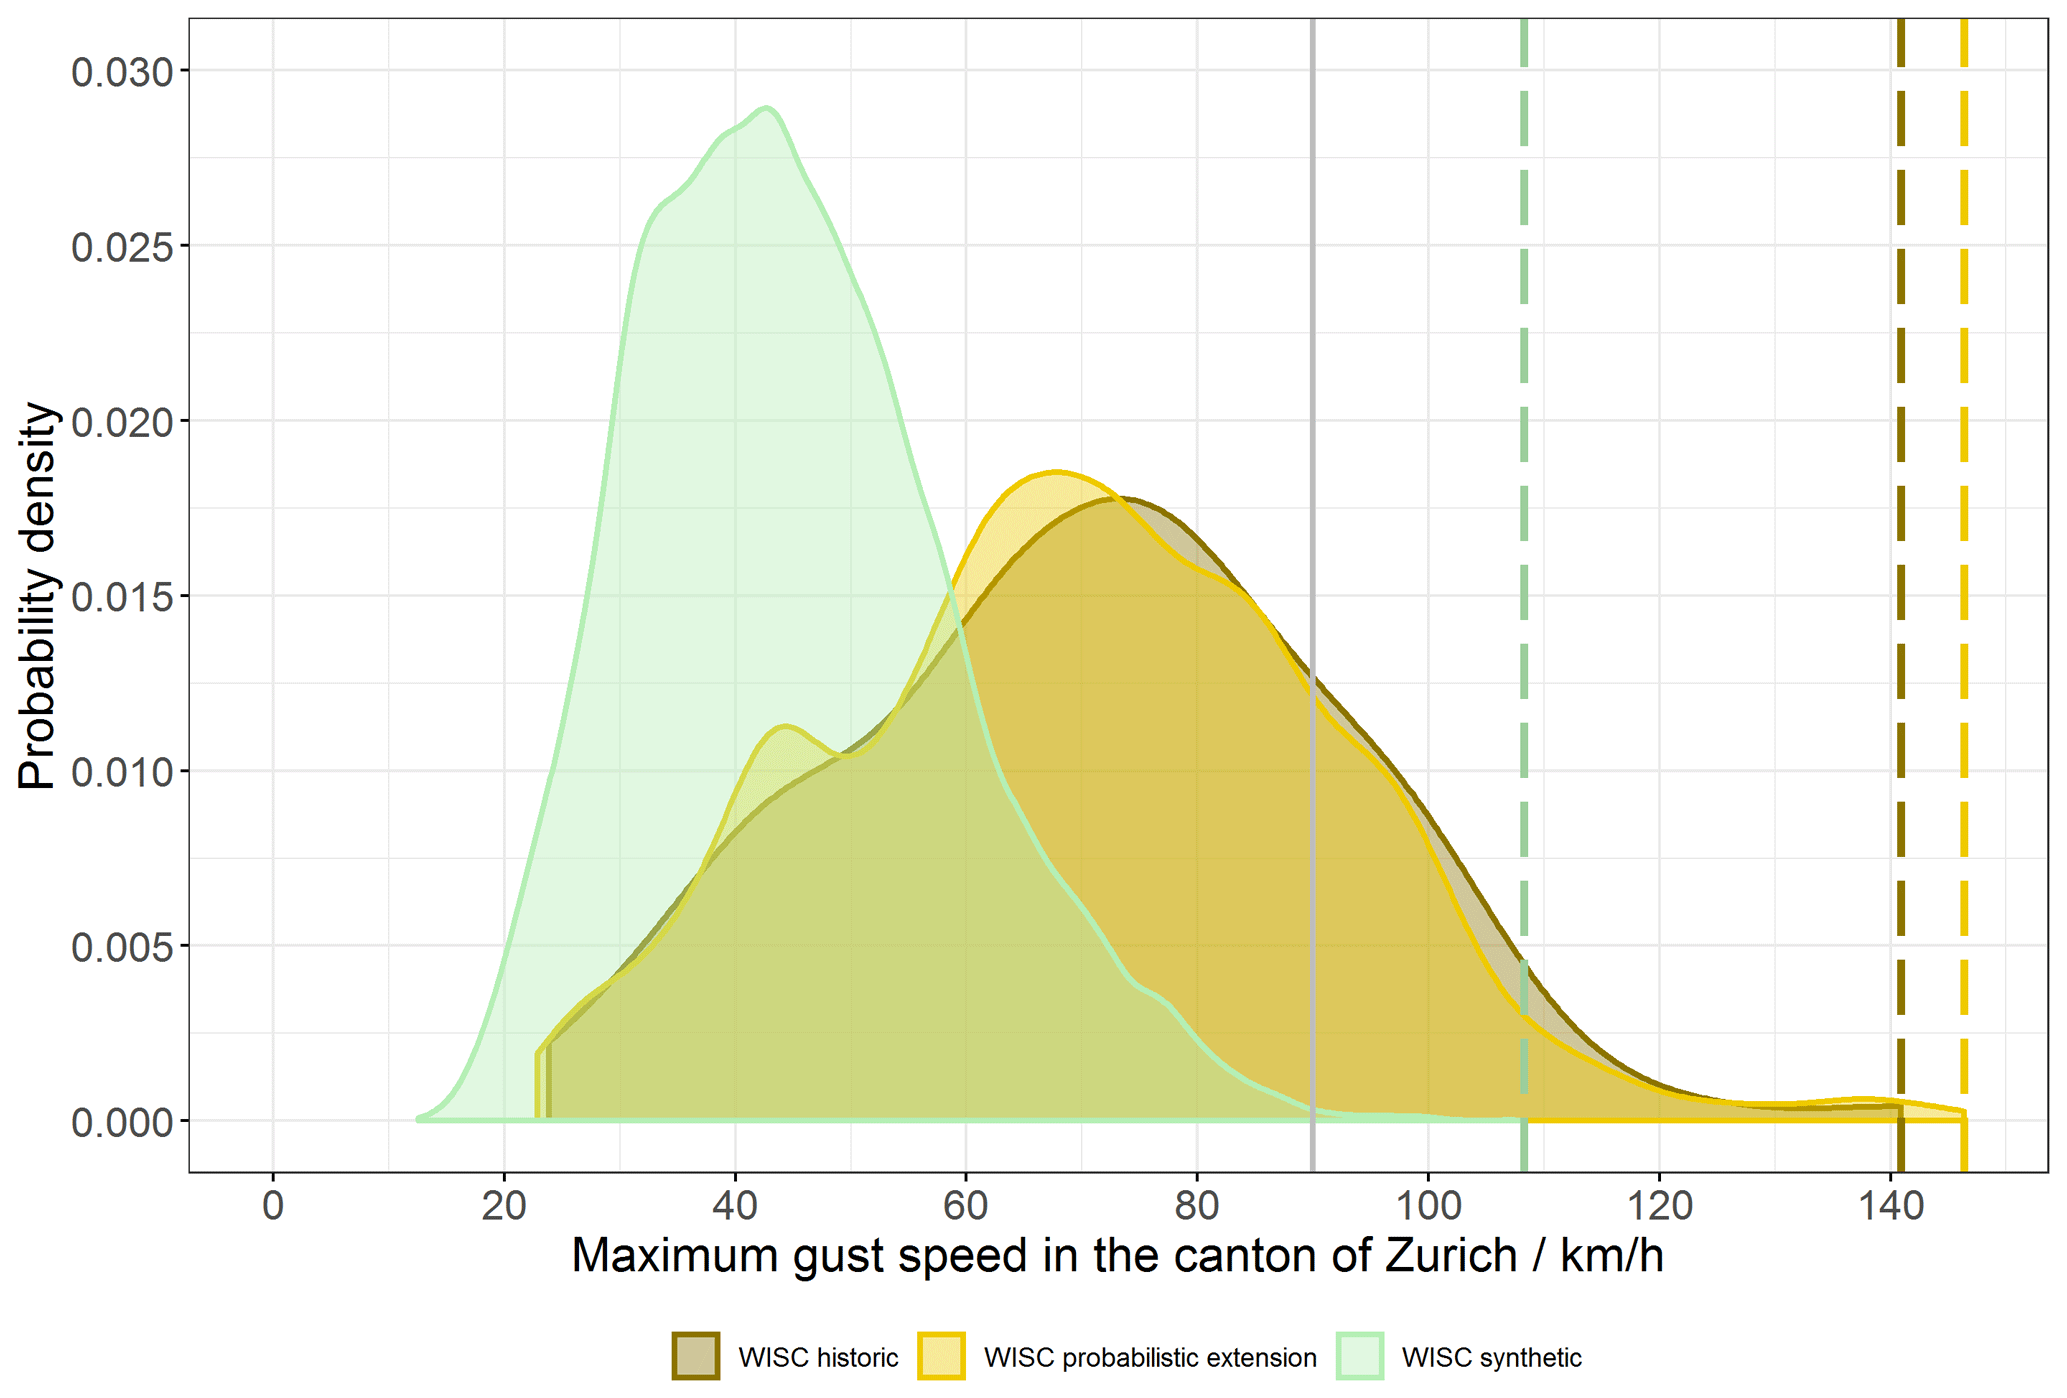
Figure A1Probability density functions of the maximum gust speeds at building level in the canton of Zurich for the three hazard event sets WISC historic (brown), WISC probabilistic extension excluding the parent windstorms (yellow), and WISC synthetic (green). The maxima of the individual distributions are shown as dashed vertical lines. In the GVZ damage model, damage is possible from a wind gust speed of more than 90 km h−1, which is here indicated by a grey solid vertical line.
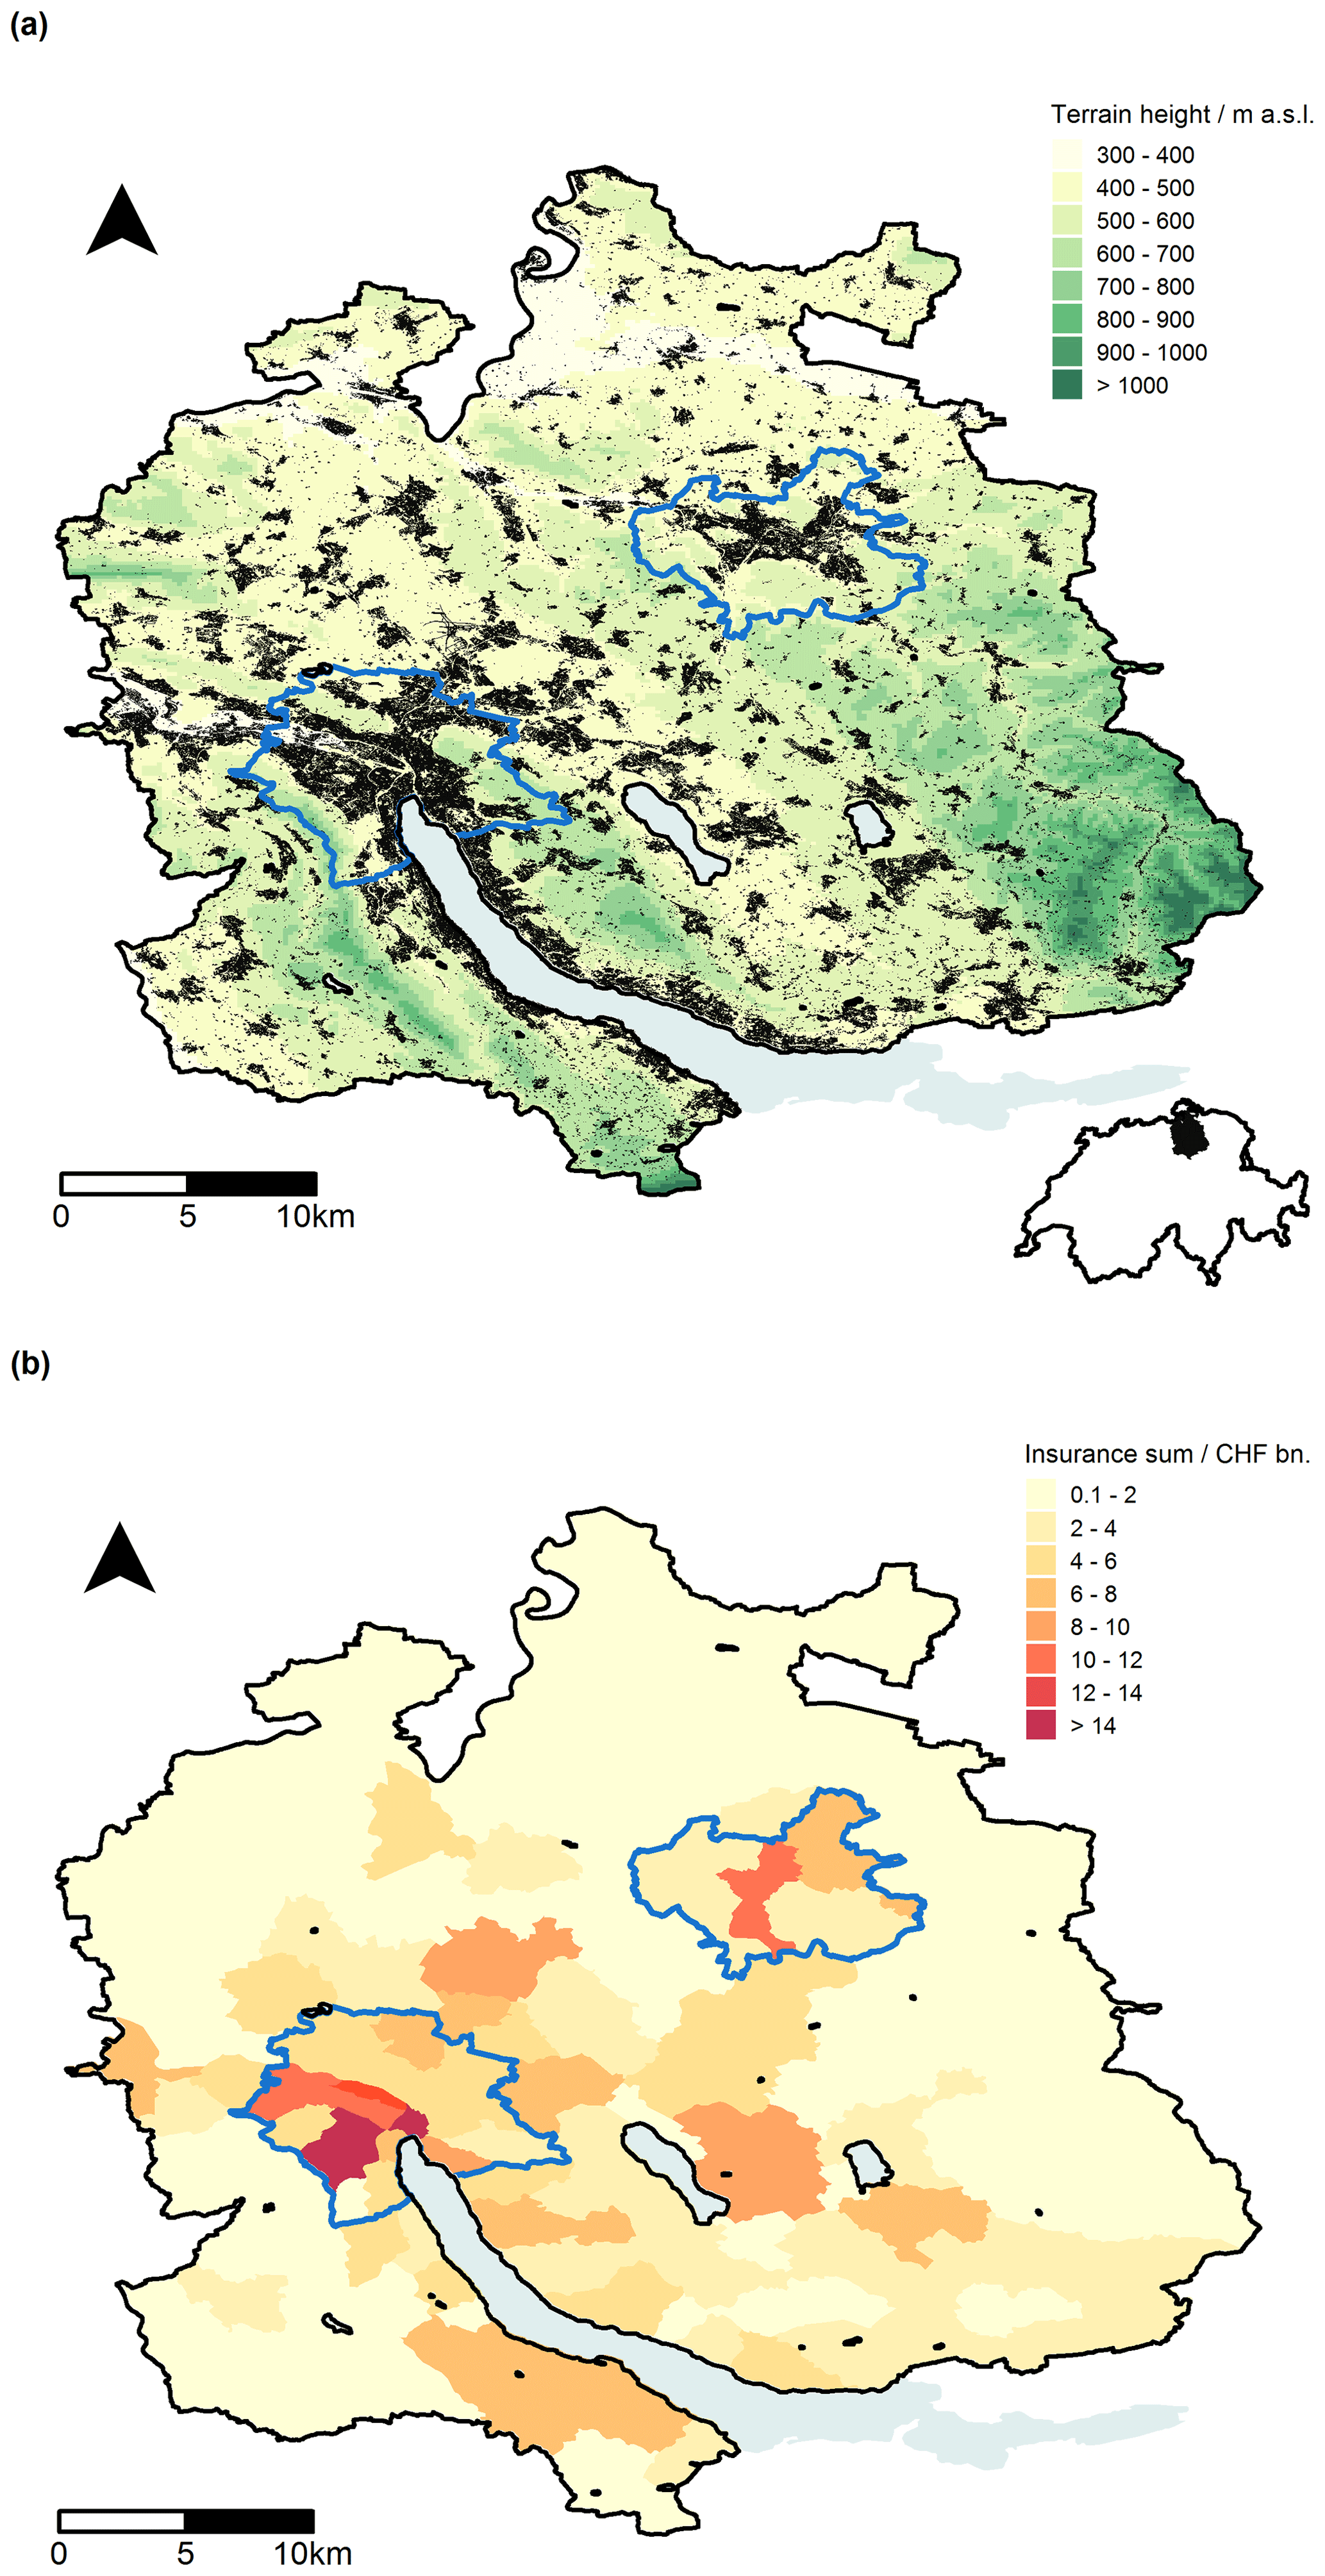
Figure A2(a) Terrain height for the canton of Zurich (colour scheme) according to a digital elevation model with a horizontal grid size of 200 m (source: Swiss Federal Office of Topography; Swisstopo, 2019). In addition, the spatial distribution of all buildings insured by GVZ is indicated and the urban areas of the two main cities, Zurich (left) and Winterthur (right), are marked in blue. (b) Total building sum insured for each municipality (colour scheme).
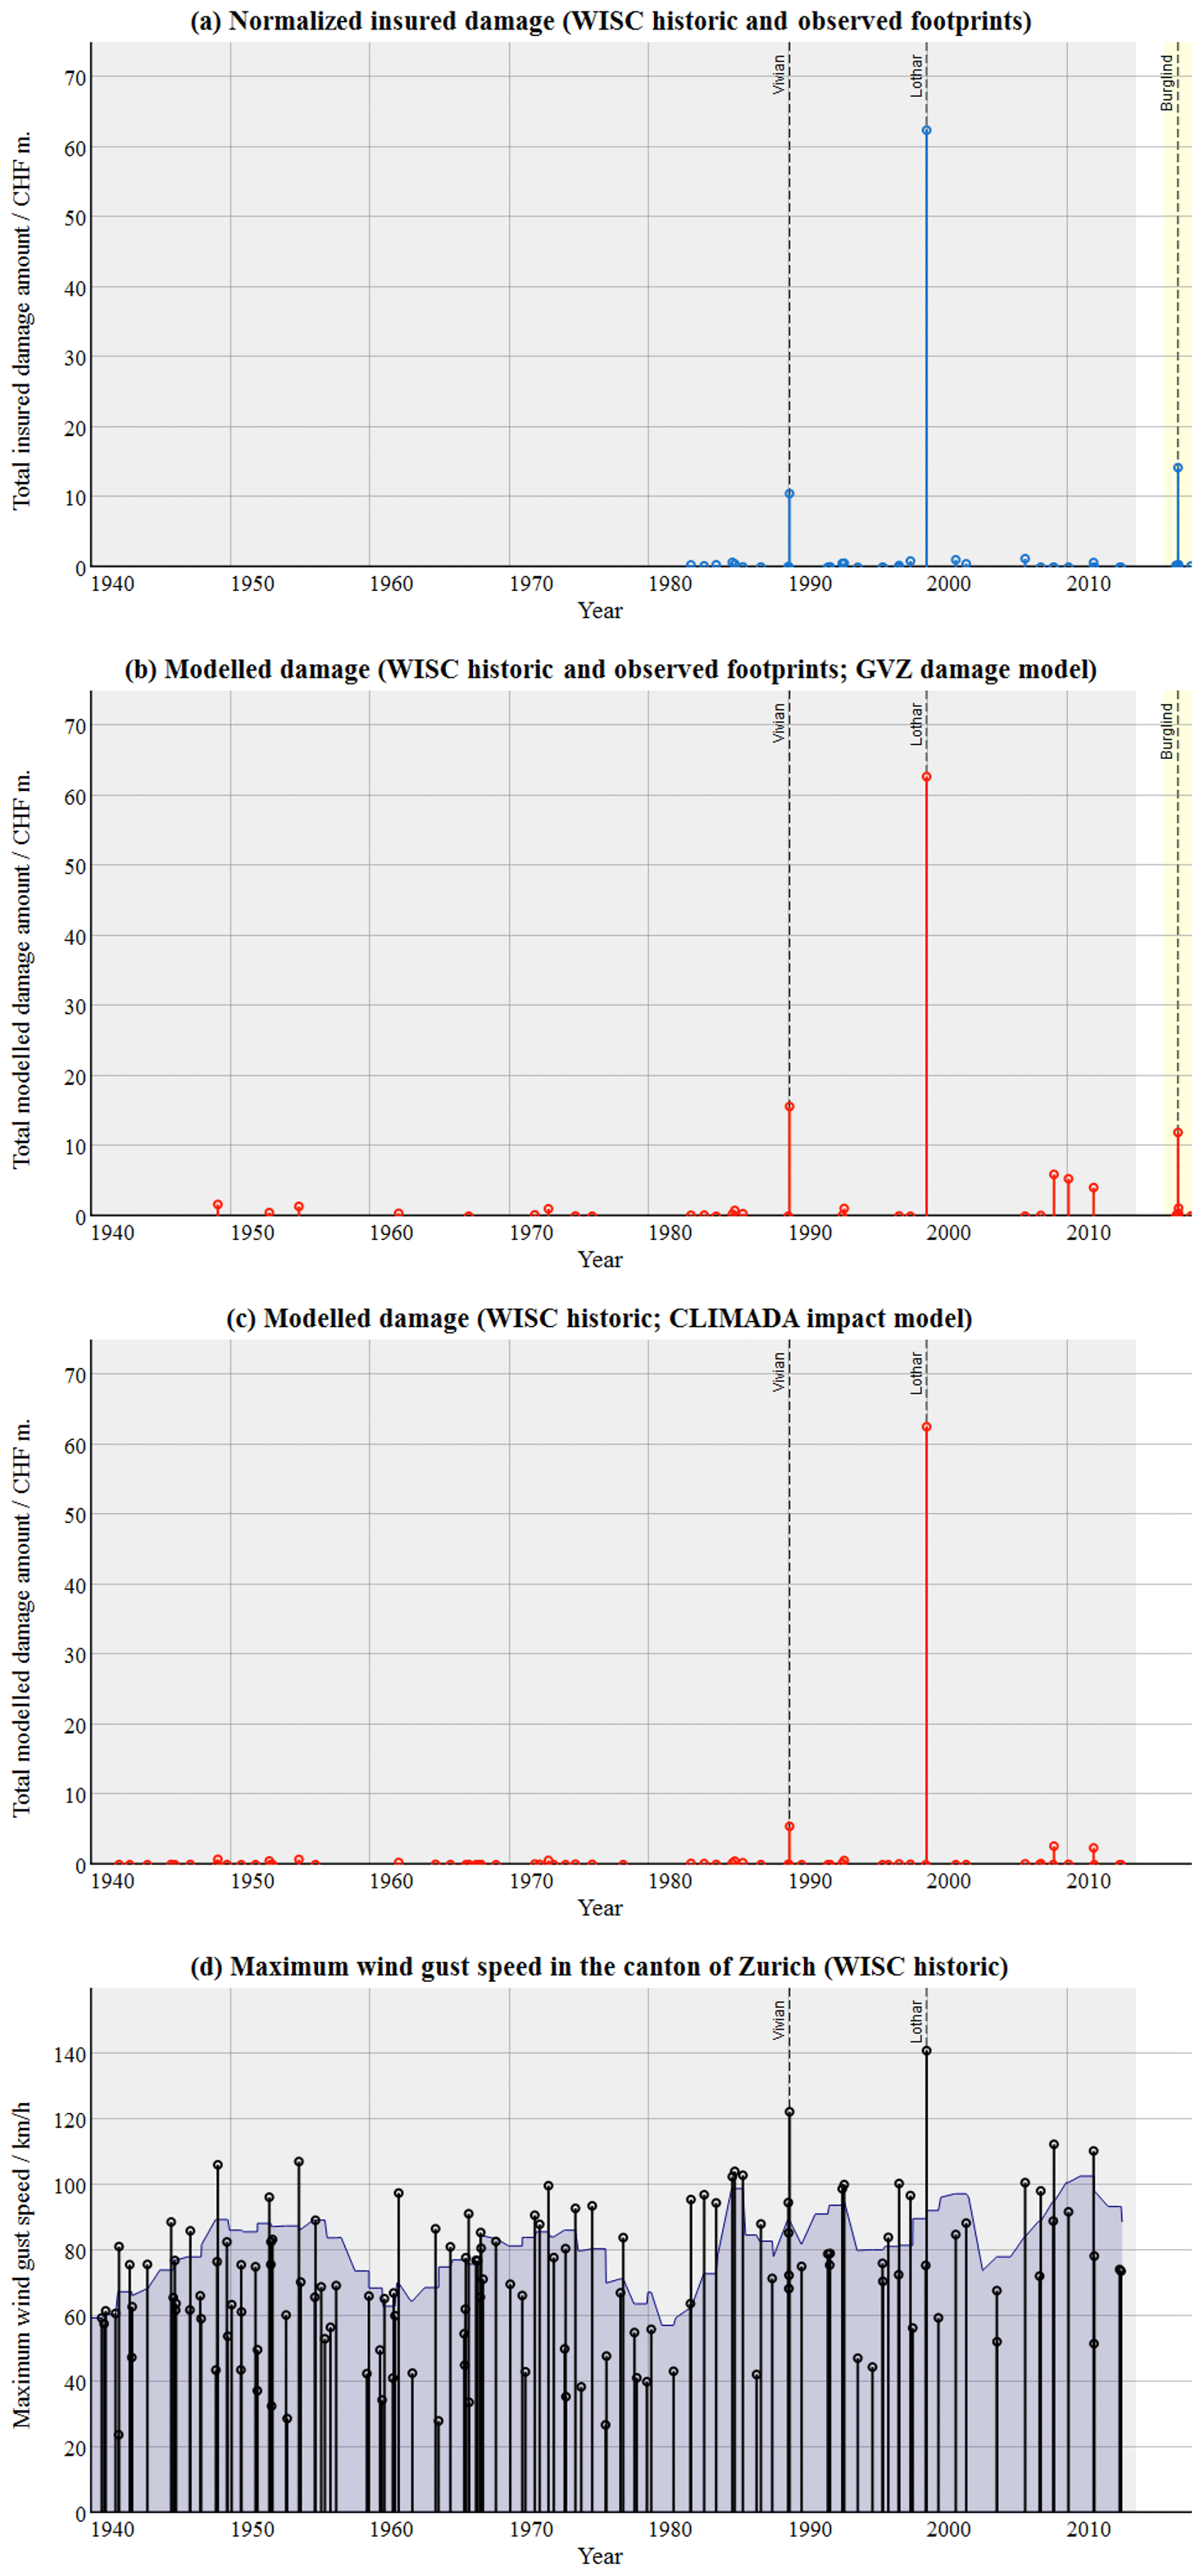
Figure A3Variability of windstorms and associated damages in the canton of Zurich: (a) normalized insured damage, (b) modelled windstorm damage based on the GVZ damage model and the hazard event sets WISC historic and observed footprints, (c) modelled windstorm damage based on the CLIMADA impact model and WISC historic, and (d) maximum gust speeds at building level in the canton of Zurich according to WISC historic (black stem plot). The filled time series in (d) additionally shows the 5-year moving average of the yearly maximum gust speeds in the canton of Zurich. The period for which WISC historic hazard data (observed footprints) is available is shaded grey (yellow) in (a) and (b). The windstorm events Vivian–Wiebke, Lothar–Martin, and Burglind are marked.
The scripts reproducing the main results of the paper and the figures are available under https://doi.org/10.5281/zenodo.4442602 (Röösli et al., 2021). The probabilistic hazard event set WISC probabilistic extension for each European country is made available for download under https://doi.org/10.3929/ethz-b-000406567 (Röösli and Bresch, 2020).
CLIMADA is openly available at GitHub (https://github.com/CLIMADA-project/climada_python, last access: 17 July 2019; Bresch and Aznar-Siguan, 2019a) under the GNU GPL license (GNU operating system, 2007). The documentation is hosted on Read the Docs (https://climada-python.readthedocs.io/en/stable/, last access: 17 July 2019; Aznar-Siguan and Bresch, 2019b) and includes a link to the interactive tutorial of CLIMADA. CLIMADA v1.4.1 was used for this publication, which is permanently available at the ETH Data Archive: https://doi.org/10.5905/ethz-1007-252 (Bresch et al., 2020).
CW and TR share first co-authorship and contributed equally to defining the case study, performing the analyses, writing the article, and participating in the review process. CW developed the GVZ damage model, and TR generated the hazard event set WISC probabilistic extension. DNB contributed to writing the article, conceptualized CLIMADA, and oversaw its implementation in Python, based on his own previous MATLAB implementation.
The authors declare that they have no conflict of interest.
We are very thankful to the WISC consortium and project team for making all the data and documentation available and fully open access. Map data copyrighted OpenStreetMap contributors and available from https://www.openstreetmap.org (last access: 13 January 2021). We want to thank Jan Hartman for his help implementing the Storm Europe hazard module in the Python version of CLIMADA, Evelyn Mühlhofer for implementing the OpenStreetMap exposure module in CLIMADA, and Samuel Eberenz and Maurice Skelton for providing valuable input on the manuscript. Additionally, we would like to thank Alexandros Georgiadis and the anonymous referee for providing valuable input during the review process, which helped to improve the manuscript a lot.
This paper was edited by Joaquim G. Pinto and reviewed by Alexandros Georgiadis and one anonymous referee.
Aznar-Siguan, G. and Bresch, D. N.: CLIMADA v1: a global weather and climate risk assessment platform, Geosci. Model Dev., 12, 3085–3097, https://doi.org/10.5194/gmd-12-3085-2019, 2019a.
Aznar-Siguan, G. and Bresch, D. N.: CLIMADA_python documentation, https://climada-python.readthedocs.io/en/stable/ (last access: 17 July 2019), 2019b.
Bresch, D. N.: Shaping Climate Resilient Development – Economics of Climate Adaptation, in: Climate Change Adaptation Strategies – An Upstream-downstream Perspective, edited by: Salzmann, N., Huggel, C., Nussbaumer, S., and Ziervogel, G., Springer, Cham, 241–254, https://doi.org/10.1007/978-3-319-40773-9_13, 2016.
Bresch, D. N. and Aznar-Siguan, G.: CLIMADA-python, available at: https://github.com/CLIMADA-project/climada_python (last access: 17 July 2019), 2019a.
Bresch, D. N., Aznar Siguan, G., Bozzini, V., Bungener, R., Eberenz, S., Hartman, J., Mühlhofer, E., Pérus, M., Röösli, T., Sauer, I., Schmid, E., Stalhandske, Z., Steinmann C., and Stocker, D.: CLIMADA_python v1.4.1, https://doi.org/10.5905/ethz-1007-252, 2020.
Catto, J. L., Ackerley, D., Booth, J. F., Champion, A. J., Colle, B. A., Pfahl, S., Pinto, J. G., Quinting, J. F., and Seiler, C.: The future of midlatitude cyclones, Curr. Clim. Change Rep., 5, 407–420, https://doi.org/10.1007/s40641-019-00149-4, 2019.
City of Zurich: Zurich construction price index, available at: https://www.stadt-zuerich.ch/prd/de/index/statistik/themen/bauen-wohnen/wohnbaupreise/zuercher-index-der-wohnbaupreise.html, last access: 14 January 2020.
Davies, T., Cullen, M. J. P., Malcolm, A. J., Mawson, M. H., Staniforth, A., White, A. A., and Wood, N.: A new dynamical core for the Met Office's global and regional modelling of the atmosphere, Q. J. Roy. Meteorol. Soc., 131, 1759–1782, https://doi.org/10.1256/qj.04.101, 2005.
Dawkins, L. C., Stephenson, D. B., Lockwood, J. F., and Maisey, P. E.: The 21st century decline in damaging European windstorms, Nat. Hazards Earth Syst. Sci., 16, 1999–2007, https://doi.org/10.5194/nhess-16-1999-2016, 2016.
Dee, D. P., Uppala, S. M., Simmons, A. J., Berrisford, P., Poli, P., Kobayashi, S., Andrae, U., Balmaseda, M. A., Balsamo, G., Bauer, P., Bechtold, P., Beljaars, A. C. M., van de Berg, L., Bidlot, J., Bormann, N., Delsol, C., Dragani, R., Fuentes, M., Geer, A. J., Haimberger, L., Healy, S. B., Hersbach, H., Hólm, E. V., Isaksen, L., Kållberg, P., Köhler, M., Matricardi, M., McNally, A. P., Monge-Sanz, B. M., Morcrette, J.-J. Park, B.-K., Peubey, C., de Rosnay, P., Tavolato, C., Thépaut, J.-N., and Vitart, F.: The ERA-Interim reanalysis: configuration and performance of the data assimilation system, Q. J. Roy. Meteorol. Soc., 137, 553–597, https://doi.org/10.1002/qj.828, 2011.
Della-Marta, P. M., Liniger, M. A., Appenzeller, C., Bresch, D. N., Koellner-Heck, P., and Muccione, V.: Improved estimates of the European winter windstorm climate and the risk of reinsurance loss using climate model data, J. Appl. Meteorol. Clim., 49, 2092–2120, https://doi.org/10.1175/2010JAMC2133.1, 2010.
Donat, M. G., Pardowitz, T., Leckebusch, G. C., Ulbrich, U., and Burghoff, O.: High-resolution refinement of a storm loss model and estimation of return periods of loss-intensive storms over Germany, Nat. Hazards Earth Syst. Sci., 11, 2821–2833, https://doi.org/10.5194/nhess-11-2821-2011, 2011.
Eberenz, S., Stocker, D., Röösli, T., and Bresch, D. N.: Asset exposure data for global physical risk assessment, Earth Syst. Sci. Data, 12, 817–833, https://doi.org/10.5194/essd-12-817-2020, 2020.
Etienne, C. and Beniston, M.: Wind storm loss estimations in the Canton of Vaud (Western Switzerland), Nat. Hazards Earth Syst. Sci., 12, 3789–3798, https://doi.org/10.5194/nhess-12-3789-2012, 2012.
Feuerstein, B., Groenemeijer, P., Dirksen, E., Hubrig, M., Holzer, A. M., and Dotzek, N.: Towards an improved wind speed scale and damage description adapted for Central Europe, Atmos. Res., 100, 547-564, https://doi.org/10.1016/j.atmosres.2010.12.026, 2011.
Geiger, T., Frieler, K., and Bresch, D. N.: A global historical data set of tropical cyclone exposure (TCE-DAT), Earth Syst. Sci. Data, 10, 185–194, https://doi.org/10.5194/essd-10-185-2018, 2018.
Gettelman, A., Bresch, D. N., Chen, C. C., Truesdale, J. E., and Bacmeister, J. T.: Projections of future tropical cyclone damage with a high-resolution global climate model, Climatic Change, 146, 575–585, https://doi.org/10.1007/s10584-017-1902-7, 2018.
GIN: Platform, available at: https://www.info.gin.admin.ch/bafu_gin/en/home/gin/overview.html, last access: 19 November 2019.
GIS: Browser canton of Zurich, available at: http://web.maps.zh.ch/, last access: 18 September 2019.
GNU: Operating system, GNU General Public License, version 3, available at: https://www.gnu.org/licenses/gpl.html (last access: 17 July 2019), 2007.
GVZ: Annual report, available at: https://www.gvz.ch/_file/1228/01111018003-web-gvz-gb2018-210x297-es-anhang.pdf (last access: 21 February 2020), 2018.
GVZ: Homepage, available at: https://www.gvz.ch/, last access: 14 January 2020.
Haas, R. and Pinto, J. G.: A combined statistical and dynamical approach for downscaling large-scale footprints of European windstorms, Geophys. Res. Lett., 39, L23804, https://doi.org/10.1029/2012GL054014, 2012.
Heneka, P., Hofherr, T., Ruck, B., and Kottmeier, C.: Winter storm risk of residential structures – model development and application to the German state of Baden-Württemberg, Nat. Hazards Earth Syst. Sci., 6, 721–733, https://doi.org/10.5194/nhess-6-721-2006, 2006.
Hersbach, H. and Dee, D.: ERA-5 reanalysis is in production, ECMWF Newsletter, Reading, UK, 2016.
Imhof, M.: Analyse langfristiger Gebäudeschadendaten, IRV – Interkantonaler Rückversicherungsverband, Bern, Switzerland, 2011.
IPCC: Climate Change 2014: Impacts, Adaptation and Vulnerability. Part A: Global and Sectoral Aspects, in: Contribution of Working Group II to the Fifth Assessment Report of the Intergovernmental Panel on Climate Change, edited by: Field, C. B., Barros, V. R., Dokken, D. J., Mach, K. J., Mastrandrea, M. D., Bilir, T. E.,Chatterjee, M., Ebi, K. L., Estrada, Y. O., Genova, R. C., Girma, B., Kissel, E. S., Levy, A. N., MacCracken, S., Mastrandrea, P.R., and White, L. L., Cambridge University Press, Cambridge, UK, and New York, USA, 2014.
Klawa, M. and Ulbrich, U.: A model for the estimation of storm losses and the identification of severe winter storms in Germany, Nat. Hazards Earth Syst. Sci., 3, 725–732, https://doi.org/10.5194/nhess-3-725-2003, 2003.
Koks, E. E. and Haer, T.: A high-resolution wind damage model for Europe, Sci. Rep., 10, 6866, https://doi.org/10.1038/s41598-020-63580-w, 2020.
Lamb, H. H. and Frydendahl, K.: Historic storms of the North Sea, British Isles, and Northwest Europe, Cambridge University Press, Cambridge, UK, 1991.
Leckebusch, G. C., Renggli, D., and Ulbrich, U.: Development and application of an objective storm severity measure for the Northeast Atlantic region, Meteorol. Z., 17, 575–587, 2008.
Mitchell-Wallace, K., Jones, M., Hilier, J., and Foote, M.: Natural Catastrophe Risk Management and Modelling: A Practitioners Guide, John Wiley and Sons Ltd, Chichester, UK, 2017.
Munich Re: Winter storms in Europe (II): Analysis of 1999 losses and loss potentials, Munich Re, Munich, Germany, 2002.
OpenStreetMap contributors: Planet dump, available at: https://www.openstreetmap.org (last access: 25 February 2020), 2017.
PERILS: Event loss information, available at: https://www.perils.org/losses?year=1999&classification=&status=#event-losses, last access: 31 January 2020.
Poli, P., Hersbach, H., Dee, D. P., Berrisford, P., Simmons, A. J., Vitart, F., Laloyaux, P., Tan, D. G. H., Peubey, C., Thépaut, J.-N., Trémolet, Y., Hólm, E. V., Bonavita, M., Isaksen, L., and Fisher, M.: ERA-20C: An atmospheric reanalysis of the Twentieth Century, J. Climate, 29, 4083–4097, https://doi.org/10.1175/JCLI-D-15-0556.1, 2016.
Prahl, B. F., Rybski, D., Kropp, J. P., Burghoff, O., and Held, H.: Applying stochastic small-scale damage functions to German winter storms, Geophys. Res. Lett., 39, L06806, https://doi.org/10.1029/2012GL050961, 2012.
Prahl, B. F., Rybski, D., Burghoff, O., and Kropp, J. P.: Comparison of storm damage functions and their performance, Nat. Hazards Earth Syst. Sci., 15, 769–788, https://doi.org/10.5194/nhess-15-769-2015, 2015.
Raible, C. C., Kleppek, S., Wüest, M., Bresch, D. N., Kitoh, A., Murakami, H., and Stocker, T. F.: Atlantic hurricanes and associated insurance loss potentials in future climate scenarios: limitations of high-resolution AGCM simulations, Tellus A, 64, 15672, https://doi.org/10.3402/tellusa.v64i0.15672, 2012.
Reguero, B. G., Bresch, D. N., Beck, M. W., Calil, J., and Meliane, I.: Coastal risks, nature-based defenses and the economics of adaptation: an application in the Gulf of Mexico, USA, Coast. Eng. Pro., 1, 25, https://doi.org/10.9753/icce.v34.management.25, 2014.
Renggli, D. and Zimmerli, P.: Winter storms in Europe: messages from forgotten catastrophes, Swiss Re publication 1507205_16_EN, available at: https://media.swissre.com/documents/Swiss_Re_Winter_storms.pdf (last access: 6 February 2020), 2016.
Roberts, J. F., Champion, A. J., Dawkins, L. C., Hodges, K. I., Shaffrey, L. C., Stephenson, D. B., Stringer, M. A., Thornton, H. E., and Youngman, B. D.: The XWS open access catalogue of extreme European windstorms from 1979 to 2012, Nat. Hazards Earth Syst. Sci., 14, 2487–2501, https://doi.org/10.5194/nhess-14-2487-2014, 2014.
Röösli, T. and Bresch, D. N.: Probabilistic Windstorm Hazard Event Set for Europe, ETH Zurich Research Collection, ETH Zurich, Zurich, https://doi.org/10.3929/ethz-b-000406567, 2020.
Röösli, T., Bresch, D. N., and Wüest, M.: A comparison of the WISC events sets with both industry and research data, WISC Summary Report of Task 5.3 – ETH/Swiss Re Case Study, ETH Zurich, Zurich, https://doi.org/10.3929/ethz-b-000269483, 2018.
Röösli, T., Welker, C., and Bresch, D. N.: ThomasRoosli/climada_papers_winter_windstorms_model: Winter windstorm model, Zenodo, https://doi.org/10.5281/zenodo.4442602, 2021.
Scherrer, S., Salamin, C., Weusthoff, T., Kaufmann, P., Bader, S., Röösli, T., Aemisegger, N., and Gut, M.: Der Wintersturm Burglind/Eleanor in der Schweiz, Tech. Rep., Fachbericht MeteoSchweiz 268, MeteoSchweiz, Zurich, 44 pp., 2018.
Schwierz, C., Köllner-Heck, P., Zenklusen Mutter, E., Bresch, D. N., Vidale, P.-L., Wild, M., Schär, C.: Modelling European winter wind storm losses in current and future climate, Climatic Change, 101, 485–514, https://doi.org/10.1007/s10584-009-9712-1, 2010.
Stucki, P., Brönnimann, S., Martius, O., Welker, C., Imhof, M., von Wattenwyl, N., and Philipp, N.: A catalog of high-impact windstorms in Switzerland since 1859, Nat. Hazards Earth Syst. Sci., 14, 2867–2882, https://doi.org/10.5194/nhess-14-2867-2014, 2014.
Stucki, P., Brönnimann, S., Martius, O., Welker, C., Rickli, R., Dierer, S., Bresch, D. N., Compo, G. P., and Sardeshmukh, P. D.: Dynamical downscaling and loss modeling for the reconstruction of historical weather extremes and their impacts: A severe foehn storm in 1925, B. Am. Meteorol. Soc., 96, 1233–1241, https://doi.org/10.1175/BAMS-D-14-00041.1, 2015.
Swisstopo: Digital height model, available at: https://shop.swisstopo.admin.ch/en/products/height_models/dhm25200, last access: 8 August 2019.
The Economics of Climate Adaptation Working Group: Shaping climate resilient development. A framework for decision-making, joint report by ClimateWorks Foundation, Global Environmental Facility, European Commission, McKinsey & Co., The Rockefeller Foundation, Standard Chartered Banks and SwissRe, available at: https://ethz.ch/content/dam/ethz/special-interest/usys/ied/wcr-dam/documents/Economics_of_Climate_Adaptation_ECA.pdf#page=100 (last access: 13 January 2021), 2009.
UPSCALE: Project overview, available at: http://proj.badc.rl.ac.uk/upscale, last access: 21 February 2020.
VKG: Relative frequency of causes of damage, available at: http://www.vkg.ch/de/versicherung/rueckversicherung, last access: 25 February 2020.
Walz, M. A. and Leckebusch, G. C.: Loss potentials based on an ensemble forecast: How likely are winter windstorm losses similar to 1990?, Atmos. Sci. Lett., 20, e891, https://doi.org/10.1002/asl.891, 2019.
Welker, C. and Martius, O.: Large-scale atmospheric flow conditions and sea surface temperatures associated with hazardous winds in Switzerland, Clim. Dynam., 44, 1857–1869, https://doi.org/10.1007/s00382-014-2404-1, 2015.
Welker, C., Martius, O., Stucki, P., Bresch, D. N., Dierer, S., and Brönnimann, S.: Modelling economic losses of historic and present-day high-impact winter windstorms in Switzerland, Tellus A, 68, 29546, https://doi.org/10.3402/tellusa.v68.29546, 2016.
Westcott, M., Ward, J., Surminski, S., Sayers, P., Bresch, D. N., and Claire, B.: Be Prepared: Exploring Future Climate-Related Risk for Residential and Commercial Real Estate Portfolios, J. Alternat. Invest., 23, 24–34, https://doi.org/10.3905/jai.2020.1.100, 2020.
WISC: Products, available at: https://wisc.climate.copernicus.eu/wisc/#/help/products, last access: 26 July 2019.
WISC: Hazard event set description, available at: https://wisc.climate.copernicus.eu/wisc/documents/shared/C3S_WISC_Event Set_Description_v1.0.pdf, last access: 26 July 2019.
World Bank: Building the World Bank's Wealth Accounts: Methods and Data, Environment and Natural Resources Global Practice, World Bank, available at: https://development-data-hub-s3-public.s3.amazonaws.com/ddhfiles/94641/wealth-methodology-january-30-2018_4_0.pdf (last access: 14 January 2019), 2018.