the Creative Commons Attribution 4.0 License.
the Creative Commons Attribution 4.0 License.
 | 19 Jul 2021
Attribution of the role of climate change in the forest fires in Sweden 2018
Folmer Krikken
Flavio Lehner
Karsten Haustein
Igor Drobyshev
Geert Jan van Oldenborgh
In this study, we analyse the role of climate change in the forest fires that raged through large parts of Sweden in the summer of 2018 from a meteorological perspective. This is done by studying the Canadian Fire Weather Index (FWI) based on sub-daily data, both in reanalysis data sets (ERA-Interim, ERA5, the Japanese 55 year Reanalysis, JRA-55, and Modern-Era Retrospective analysis for Research and Applications version 2, MERRA-2) and three large-ensemble climate models (EC-Earth, weather@home, W@H, and Community Earth System Model, CESM) simulations. The FWI, based on reanalysis, correlates well with the observed burnt area in summer (r=0.6 to 0.8). We find that the maximum FWI in July 2018 had return times of ∼24 years (90 % CI, confidence interval, > 10 years) for southern and northern Sweden. Furthermore, we find a negative trend of the FWI for southern Sweden over the 1979 to 2017 time period in the reanalyses, yielding a non-significant reduced probability of such an event. However, the short observational record, large uncertainty between the reanalysis products and large natural variability of the FWI give a large confidence interval around this number that easily includes no change, so we cannot draw robust conclusions from reanalysis data.
The three large-ensembles with climate models point to a roughly 1.1 (0.9 to 1.4) times increased probability (non-significant) for such events in the current climate relative to preindustrial climate. For a future climate (2 ∘C warming), we find a roughly 2 (1.5 to 3) times increased probability for such events relative to the preindustrial climate. The increased fire weather risk is mainly attributed to the increase in temperature. The other main factor, i.e. precipitation during summer months, is projected to increase for northern Sweden and decrease for southern Sweden. We, however, do not find a clear change in prolonged dry periods in summer months that could explain the increased fire weather risk in the climate models.
In summary, we find a (non-significant) reduced probability of such events based on reanalyses, a small (non-significant) increased probability due to global warming up to now and a more robust (significant) increase in the risk for such events in the future based on the climate models.
- Article
(609 KB) - Full-text XML
- BibTeX
- EndNote


The summer of 2018 in Sweden was characterized by numerous large forest fires spread over large parts of the country. Though forest fires are common in Sweden (Drobyshev et al., 2012), the number of fires and total burnt area in 2018 were much higher than observed over recent years (2008–2017; Fig. 1). Spring and summer weather conditions in 2018 were anomalously dry and warm. This was caused by very persistent atmospheric blocking, especially in May and July. In July, the high surface pressure (Fig. 2a) caused high temperatures (Fig. 2b) and, anomalously, little precipitation (Fig. 2c) over northwestern Europe. The high temperature and lack of precipitation resulted in high forest fire risk over the whole of Scandinavia. Especially in Sweden, this gave rise to numerous forest fires, with a total burnt area of more than 20 000 ha.
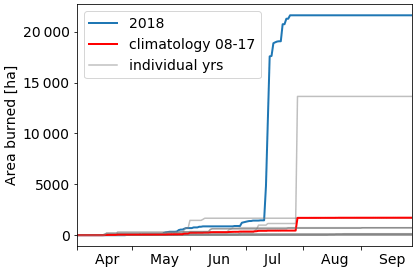
Figure 1Burnt area in Sweden. Cumulative values for 2018, average cumulative values (climatology) over 2008–2017 and the cumulative values for each individual year over the same time period (source: EFFIS).
An often-raised question during and after such extreme events concerns the possible influence of climate change, i.e. has climate change made such an event more or less likely? Hence, climate attribution studies of extreme weather events is a rapidly increasing field of research, with analysis on, for example, extreme precipitation events (van Oldenborgh et al., 2017), heat waves (Sippel et al., 2016), droughts (Hauser et al., 2017) and storms (Vautard et al., 2019) where, in many cases, there was indeed evidence of an increased risk of extreme weather due to climate change (Schiermeier, 2018). For forest fires, the first attribution of climate change on forest fires in Canada was already found by Gillett et al. (2004) based on the CGCM2 model. Abatzoglou and Williams (2016) found that, for the western United States, human-caused climate change more than halved the humidity of forest fuels since the 1970s and doubled the cumulative area of forest fires since 1984. A recent study by Kirchmeier-Young et al. (2018) found a strong influence of climate change on the 2017 British Columbia wildfires, with such events being 2–4 times more likely with climate change in the Canadian Earth System Model (CanESM2) model. Williams et al. (2019) found a strong influence between the recent increase in forest fires in California and the positive trend in evapotranspiration caused by anthropogenic climate change. Abatzoglou et al. (2019) found that increases in extreme fire weather days due to anthropogenic climate change are evident on 22 % of burnable land area globally. Taufik et al. (2017) found a strong link between a substantial hydrological drying trend since the early 20th century and the increased burnt area in the humid tropics. For the severe 2018 forest fires in Queensland, Australia, Lewis et al. (2020) found an anthropogenic influence on the recorded high temperatures. Over the Mediterranean region however, Turco et al. (2016) found a decreasing trend in forest fires (except for Portugal) using observational data.
For Sweden specifically, Yang et al. (2015) found that in a future climate there is an increased risk of forest fires in southern Sweden but a decreased risk in northern Sweden using the downscaled and bias-corrected ECHAM5 climate model. Also, for the neighbouring country of Finland, climate model projections point to an increased risk of forest fires (Lehtonen et al., 2016).
Here we analyse the connection between the 2018 extreme forest fire season and climate change using large ensembles of multiple climate models. As characteristics of regional precipitation and droughts can be highly model dependent (Hauser et al., 2017), it is crucial to use multiple climate models for this analysis. To the best of our knowledge, this is the first multi-model framework applied to such an attribution study of an extreme forest fire event.
Note that we only analyse the meteorological aspect of this event, and no other aspects relevant for such extreme events, such as the sources of ignition and the influence of fire mitigation strategies. Hence, in our analysis, we take forest fire risk to be equivalent to fire weather risk. We do investigate to what extent the fire risk corresponds to actual area burnt.
2.1 Fire weather risk
The metric used to quantify forest fire risk is the Canadian Fire Weather Index (FWI; Van Wagner, 1987). This is a weather-based system that models soil moisture at three different depths and, based on the upper soil moisture content and wind speed, creates an estimate for the initial spread rate of fire. It is based on four meteorological variables, namely local noon temperature (T2M), relative humidity (RH), surface wind speed and 24 h cumulative precipitation. Though this metric was developed and tuned for the Canadian boreal region, it also performs well over Sweden (Gardelin, 1997; Yang et al., 2015).
2.2 Statistical methods
In event attribution studies, the first step is to define the event in such a way that is best reflects the impact of the event. In Sect. 3, we will discuss how we define this event in more detail. The second step, in order to assess the rarity of this event, is to fit a generalized extreme value (GEV) distribution function on a sample of block (yearly) maxima extracted from a FWI time series. The GEV function is described by three parameters, i.e. the position parameter μ, the scale parameter σ and the shape parameter ξ.
In order to assess the probabilities of certain events during previous climate based on the trend in observations and reanalysis products, we fit the observed FWI to a GEV that depends on the smoothed (4-year running mean) global mean surface temperature (GMST). Here, GMST is taken from the National Aeronautics and Space Administration (NASA) Goddard Institute for Space Science (GISS) surface temperature analysis (GISTEMP; Hansen et al., 2010). This results in a distribution that varies continuously with GMST. This distribution can be evaluated for a GMST in the past (e.g. 1950 or 1900) and for the current GMST. A 1000-member non-parametric bootstrapping procedure is used to estimate confidence intervals for the fit.
For the FWI, we choose the dependence of the smoothed GMST in the same way as for precipitation (described fully in van der Wiel et al., 2017); the position and scale parameters (μ; σ) have the same dependence on GMST so that their ratio (also called the dispersion parameter) is constant. The dependence is exponential for extreme precipitation, where and ; we use the same here to keep the FWI positive definite.
We use the probability ratio to quantify the impact of climate change on the FWI. This ratio, calculated as the probability of an event occurring during the current or future climate divided by the probability of an event occurring during preindustrial climate conditions, indicates how much more or less likely a certain event is relative to preindustrial climate. Thus, a probability ratio of 2 means an event is 2 times more likely relative to preindustrial climate.
2.3 Reanalysis
We use multiple reanalysis data sets as an estimate of the observed state, namely ERA-Interim (ERA-I, Dee et al., 2011), ERA5 (Copernicus Climate Change Service, 2017), the Japanese 55-year Reanalysis (JRA-55; Kobayashi et al., 2015) and the Modern-Era Retrospective analysis for Research and Applications version 2 (MERRA-2; Gelaro et al., 2017). The advantage of using reanalysis data sets compared to in situ observations is that they provide observationally constrained, continuously gridded data sets, enabling direct comparison to climate model output. The orography of Sweden is such that the relatively low-resolution models used to generate the reanalysis can represent the weather well in this area. We use multiple reanalysis products in order to sample the uncertainty in these products. All products provide a continuous data set from 1979–1980 to the present, with the exception of JRA-55, which spans the period from 1955 to the present.
2.4 Models
We use climate model simulations from three different coupled climate models with large ensembles, i.e. EC-Earth v2.3 (Hazeleger et al., 2010, 2011), the Community Earth System Model version 1 (CESM1; Kay et al., 2014) and weather@home (W@H; Guillod et al., 2017; Massey et al., 2015; Table 1). The EC-Earth and CESM1 are large ensembles of transient climate simulations with historical forcing prior to 2006 and the RCP8.5 forcing (Riahi et al., 2011) from 2006 onwards. The W@H climate simulations are two different simulations, namely one with the actual observed forcing to represent current climate and one with natural forcing only (i.e. no anthropogenic forcing) to represent preindustrial climate. From EC-Earth and CESM1, we select three periods that describe (1) the unperturbed climate (i.e. preindustrial climate), (2) the current climate and (3) the 2 ∘C warming threshold (future climate). The preindustrial, current and future climate states are hereafter referred to as PI, 1C and 2C, respectively. Note that current climate, or 1C, is chosen in a way to best compare to reanalysis (which covers the years 1979–2018) as described below.
Table 1Overview of the climate models and the years used to represent the different climate states.
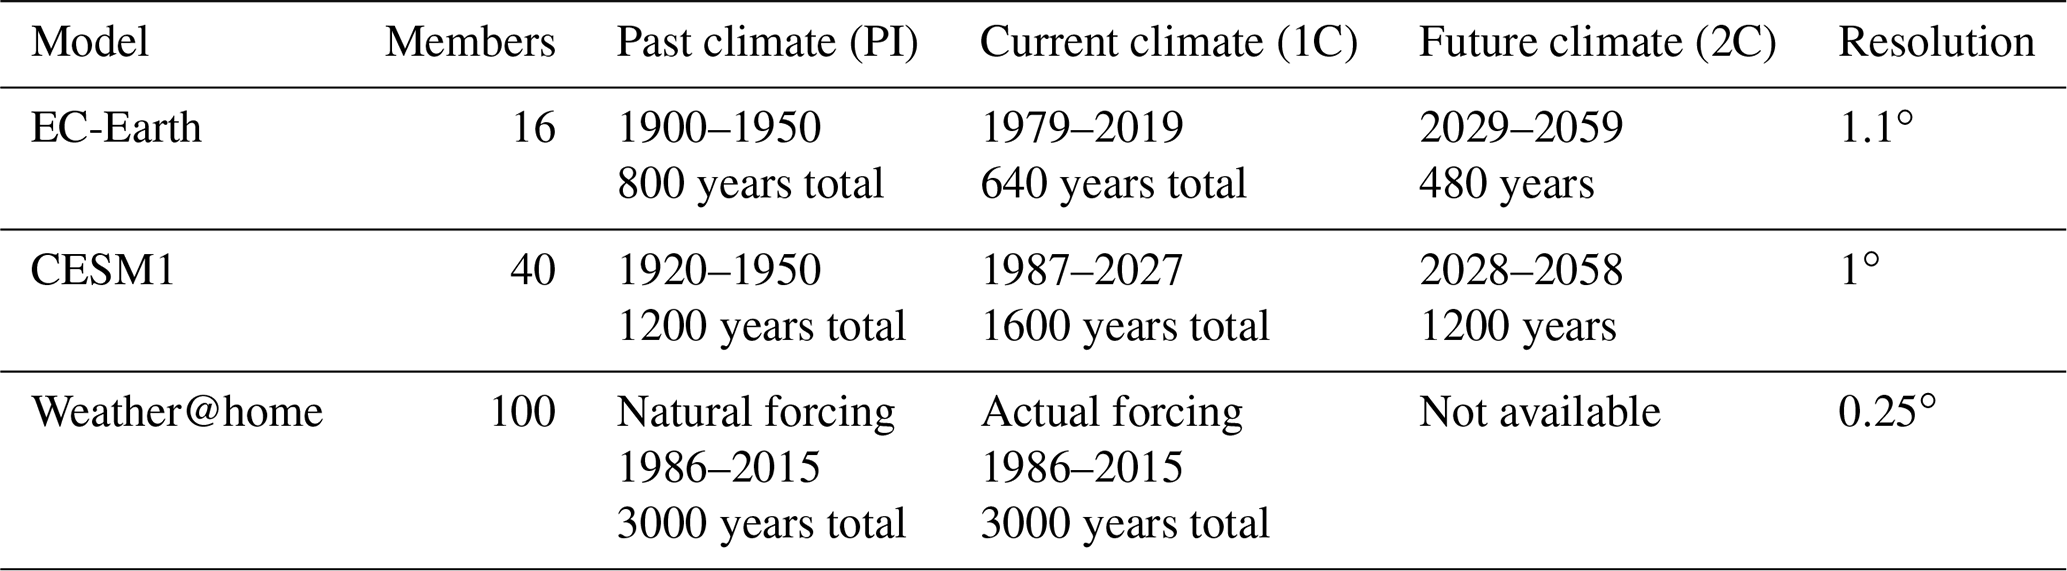
First, we select the time periods from EC-Earth and CESM1 that represent the same incremental global warming from PI to 1C as in the observations; in GISTEMP, GMST increases by 0.67 ∘C between 1900–1950 and 1979–2018. Finding the same warming increment in EC-Earth and CESM1 results in the time periods listed in Table 1 for the two models. For the 2C climate, we select a 30-year window with a 2 ∘C warming relative to PI (Table 1). For the W@H simulations, the GMST increase between the natural forcing simulations and the actual forcing simulations is 0.65 ∘C, which is very close to the observed warming up to 1979–2018.
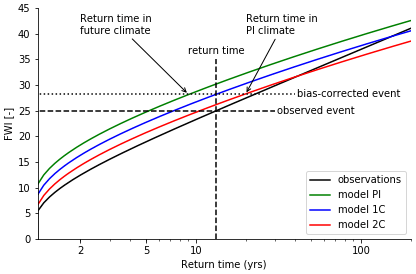
A second bias correction step is performed on the basis of the return times of the specific event and can be seen as a local bias correction in contrast to the first step, which aimed at aligning simulations and observations with regards to the level of global warming. We first calculate the return time of the event from observations or reanalysis (Fig. 3). In the 1C model simulations, we then select the FWI that corresponds to that specific return time. This FWI value is used to estimate return times in the other simulated climate states (PI and 2C). The advantage of this approach is that it preserves the spatiotemporal consistency of the simulated fields and the relation among the meteorological variables, and it makes no assumptions on non-stationarity in bias correction, which are typical issues in (multi-variate) bias correction methods (Ho et al., 2011; Ehret et al., 2012). Note that this bias correction is only a viable method if the probability ratio is not too sensitive to the event return time, which is the case here (not shown).
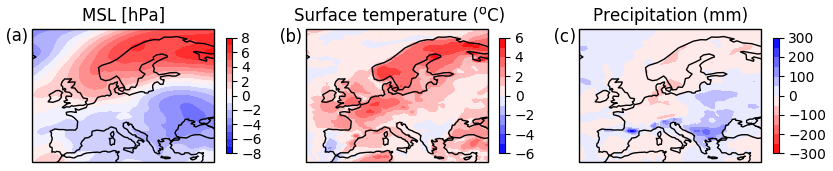
Figure 2ERA-Interim July average anomalies of (a) mean sea level pressure (MSL), (b) surface temperature and (c) precipitation. Anomalies are constructed relative to 1981–2010 climatology.
We calculate the FWI on the original grid of the models and compute spatial averages for northern (Norrland), middle (Svealand) and southern (Götaland), Sweden (Fig. 4a). Division of Sweden into southern and northern parts was justified by the analysis of observational fire statistics (Drobyshev et al., 2012) and dendrochronological reconstruction (Drobyshev et al., 2014) that revealed limited synchrony in the annual fire activity between these two regions. Since high fire weather risk events are mainly associated with large, high-pressure systems, it is important to validate the persistence of high-pressure systems in the climate models by comparing it to reanalysis data. Following the method of Pfleiderer and Coumou (2018), which represents persistence as the number of consecutive warm days, we find that the models are in good agreement with reanalysis with respect to the persistence of high-pressure systems (not shown).
For EC-Earth, we compute the FWI based on local noon data (12:00 UTC, universal co-ordinated time), but for the CESM-LE (CESM Large Ensemble) and W@H sub-daily data are not available. Hence, for these models, we compute the FWI based on daily average wind speed and humidity, daily maximum temperature and daily cumulative precipitation. While this approach is common (Abatzoglou et al., 2019), results can differ between both methods, especially for fire danger extremes (Herrera et al., 2013). In order to assess whether this has an effect on our analysis, we tested the influence of using local noon data or the daily average combined with maximum temperature for EC-Earth. Though the values of the FWI do differ, there are no significant differences for both methods on the calculated probability ratios. Hence, we assume that using daily maximum temperature and daily average values for the other variables for the calculation of the FWI in CESM-LENS (CESM Large Ensemble Numerical Simulation) and W@H does not affect the calculated probability ratios significantly.
The models are also validated by comparing the scale and shape parameter of the GEV fit to the ERA5–GEV fit. All model parameters lie within the uncertainty estimate of the ERA parameters.
We first investigate whether the FWI is a good proxy for actual fires in Sweden. For the event definition, we use ERA-Interim as the observational estimate. The FWI is a physical approximation of climatological fire risk, and it has been found to be a robust proxy for actual fires (Wotton, 2009). However, there can be a strong seasonal dependence on the correlation between the FWI and actual fires (Lehtonen et al., 2016). We test this for Sweden by studying the correlation between the FWI and observed burnt area (MSB, 2017) for the period 1996 to 2012 (Fig. 4b). Note that here we leave out Svealand because there are insufficient fires to compute the relevant statistics. The results show that there is indeed a strong seasonal dependence on the relation between monthly averaged FWI and the burnt area, with generally high correlations from July onwards but lower correlations for April to June for Norrland and May for Götaland. These findings correspond to the findings of Lehtonen et al. (2016), who relate the low correlation in spring to the influence of more human-caused fires, while in summer natural ignitions are a more important ignition source, thus yielding a stronger relation with weather variables.
Next, we analyse the FWI for all three regions using ERA-Interim (Fig. 5) and the observed burnt area (Fig. 1). There were two distinct periods of high FWI (above the 95 % quantile), namely in late May to early June and in July. Interestingly, the values in May were even higher than those observed in July, although the actual burnt area was much higher in July. This indicates a possible pre-conditioning (drying out of the soil) of summer FWI by the occurrence of a dry spring. Note that the pre-conditioning by the dry spring is still included in this event definition because the FWI calculation includes an estimate of the moisture content in the deeper soil layer. This moisture content, estimated by the Drought Code within the FWI calculation, includes memory with a timescale of ∼52 d (Van Wagner, 1987).
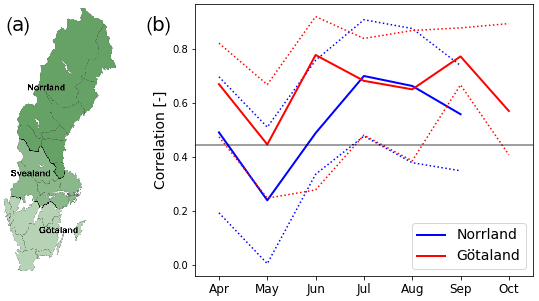
Figure 4(a) Map of Sweden with the three regions used in this study and (b) correlation of FWI (ERA-Interim and monthly maximum value with a 7 d running mean applied) with the observed burnt area for Norrland and Götaland from 1998 to 2017. For Svealand there were not enough forest fires for this analysis. The dotted lines represent the 5 %–95 % bootstrapped confidence intervals, and the grey line indicates the significance threshold of 5 %. The observed burnt area is from Swedish governmental data (MSB, 2017).
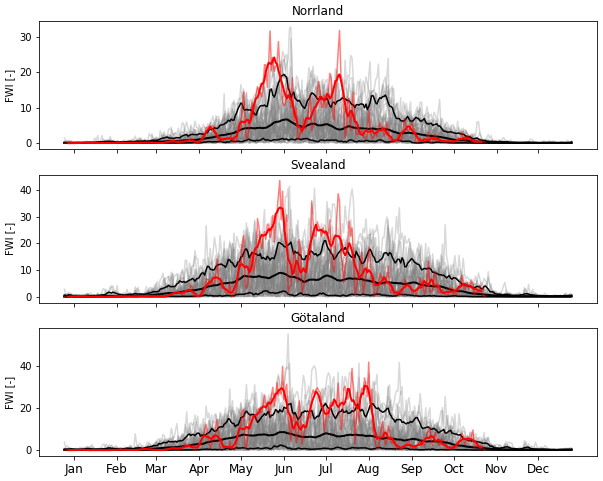
Figure 5Area-averaged FWI for the three regions (defined in Fig. 3). The (thick) red line shows the (7 d running mean) FWI of 2018. The black lines represent the 5 %, 50 % and 95 % quantiles of the 1979–2017 climatology, and the opaque grey lines represent the individual years, all based on ERA-Interim data extended with ECMWF forecast analysis.
Based on the findings from Figs. 1, 4 and 5, we define our event as the maximum 7 d running mean FWI in the months of July and August, disregarding the FWI peak in May due to much lower correlations with burnt area, probably due to lower ignition rates. The 7 d running mean is applied as fires are more likely to happen during prolonged period of high fire weather risk, whilst still holding enough independent samples per year for a robust GEV fit. Though June also shows relative high correlation with observed burnt area, the strong fires were mainly in the summer months.
4.1 Reanalysis
As previously stated, July 2018 was characterized by a large, persistent high-pressure area over northern Europe (Fig. 2), yielding high temperatures, little precipitation and moderate winds. The meteorological conditions for fire weather were, thus, quite extreme. This is quantified by the high return times of such conditions for July 2018 (Fig. 6). These values are based on a GEV fit, based on the maximum value of FWI in July and August for every year, with a 7 d running mean applied. This fit assumes that the climate does not change over time.
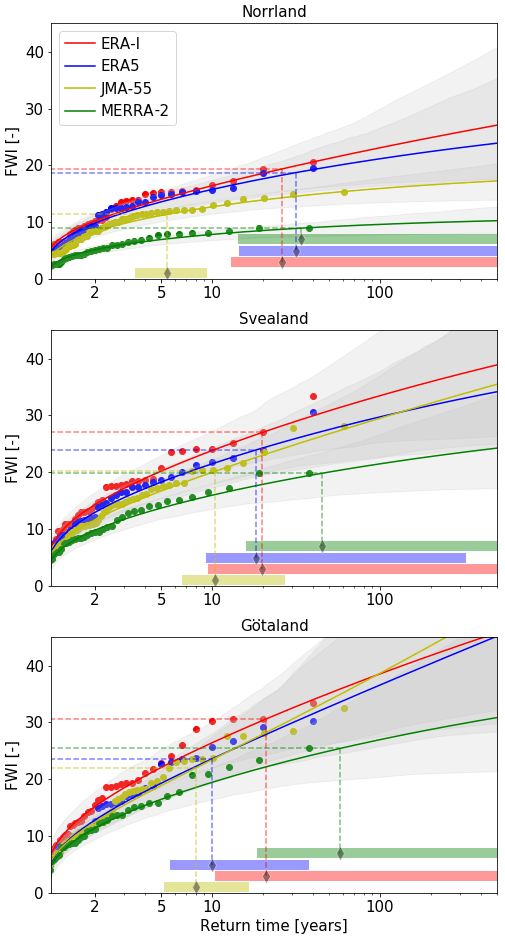
Figure 6Return times of July–August maximum FWI values, for all four reanalysis data sets and the three regions. The dots represent the actual FWI maximum values, and the lines represent the GEV model fit, with a 5 % to 95 % uncertainty band in grey. The dashed horizontal lines represent the 2018 event, while the vertical line represents the associated return time, with the horizontal bars giving the 5 % to 95 % uncertainty estimate (estimated with a non-parametric bootstrap).
It is striking to see that, although all reanalysis products are constrained by observations, there are still quite large differences in the FWI value for the 2018 event and the associated return times. For Norrland, we find large significant differences between JRA-55, with a return time of ∼5 years, and ERA-I, ERA5 and MERRA-2, with return times of ∼30 years. Also, for Svealand, there are rather large differences in return times, with ∼10 years for JRA-55 and ∼20 years for ERA-I and ERA5 and ∼50 years for MERRA-2. In Götaland, we also find differences between the products, but now JRA-55 closely matches ERA5, with return times of ∼8–10 years, and ERA-I has a higher return times of ∼20 years, and MERRA-2 has even higher return times at ∼60 years. Note that the uncertainties of these return times (denoted by the horizontal bars) are large but almost completely correlated across data sets as they derive from the same natural variability (except JRA-55, where the variability is based on a time series that is 25-years longer). An analysis of the meteorological variables used in the FWI reveals that it is mainly precipitation that causes the differences in FWI and return times across products. For MERRA-2, it is also related to a generally lower temperature (not shown).
These results stress the importance of using multiple reanalysis products in order to obtain a better estimate of the observed event and its associated uncertainty. For the bias correction of the climate model data, we use the average of all four return times from the different reanalysis products.
In order to analyse whether such an event has become more or less likely relative to a climate without anthropogenic emissions (preindustrial – PI), we fit the yearly maximum FWI to a GEV that scales with the smoothed GMST (as described in the Sect. 2). We can then evaluate the probability of such an event, conditional on different climate states, as defined by GMST. Figure 7a shows the probability ratios for the reanalysis products. Note that, as stated before, the probability ratio tells us how much more or less likely such an event has become today (1C climate) relative to PI climate. The reanalysis data show a slightly decreased probability of high-FWI events for all three regions for the 1C climate. This is due to a negative trend of July and August FWI over recent decades for these regions. A trend analysis of the FWI input variables during high-FWI events reveals a negative trend in wind speed, a positive trend in local noon surface temperature and a positive trend in 30 d cumulative precipitation prior to high-FWI events (not shown). The resulting net effect on the FWI is a small negative trend. However, the very large uncertainties easily encompass one (no change), indicating that this can also be a spurious trend caused by natural variability. The trend in July and August FWI is largely absent in JRA-55, which has a time span that is 25-years longer than the other reanalysis data sets. Hence, it is difficult to draw robust conclusions from the trends of the reanalysis data set alone.

Figure 7Probability ratios for maximum July–August FWI values as high as observed in 2018 for the different regions for (a) reanalysis and (b) climate models. All probability ratios are relative to PI climate. Note the different scales between (a) and (b) on the x axis.
4.2 Models
With large ensemble climate model output, we can circumvent the problems of undersampled natural variability, allowing us to obtain more robust estimates of whether the likelihood of such an event changes with time. Figure 7b shows the probability ratios of the climate models for present climate (1C) relative to PI climate and future climate (2C) relative to PI climate. First, we will focus on the comparison of 1C to PI.
The model W@H shows a small but significant increased probability of approximately a factor of 1.5 for such events for all three regions. EC-Earth shows no clear change in probability for such an event, with probability ratios close to 1, whereas CESM1 does show a small increase in probability, though not significant. On average, we find a small (not significant) increase in probability for all three regions, a factor 1.1 with a 90 % CI (confidence interval) of 0.9 to 1.4. In the 2C climate, the probability ratios increase more strongly relative to the PI climate. CESM1 shows significant increased probability ratios of ∼3, with the largest increase in probability in Norrland. EC-Earth also shows an increased probability, though not as large as CESM1. On average, for all three regions, we find a probability ratio of ∼2, with a 90 % CI of 1.5 to 3.
In general, we find a factor of 1.1 (0.9 to 1.4) of increased probability for such events for current climate relative to PI climate and a significant increase in the probability of factor of 2 (1.5 to 3) for a 2 ∘C warmer climate relative to PI climate. To better understand why there is an increased probability of such events, we investigate the individual meteorological variables at the time of the maximum July and August FWI in models (Fig. 8).

Figure 8Meteorological values associated with the yearly maximum FWI in July and August, with a 7 d rolling average applied, for all three climate states in all three regions. Precipitation is calculated as 30 d cumulative value prior to the yearly maximum FWI. The box plot shows the quartiles of the distribution, the whiskers the rest of the distribution and the dots are outliers. The circles indicate all values in the distribution associated with FWI higher than the observed 2018 event.
All models show a clear trend towards higher temperatures, which is unsurprising as present-day and future climate are chosen as ∼1 ∘C and 2 ∘C warmer climates. The increase in temperature between 1C and 2C climate is generally much larger than 1 ∘C in Sweden, especially in CESM-LE under 2 ∘C, because the land heats up faster than the global mean. This can partly explain the relatively strong increase in fire risk in CESM-LE for future climate. In EC-Earth, the relative humidity seems to reflect the changes in precipitation, where it increases from PI to 1C and then decreases slightly in the 2C climate. In CESM-LE, we find no clear change in 1C but a decrease of RH in 2C. W@H also shows a small decrease in RH relative to PI climate. For the wind speed, the differences between the climate states are very small and do not affect changes in the FWI appreciably. We further subset the model values by focusing on FWI events larger than the 2018 observed event (circles in Fig. 8) to investigate whether certain variables are predominantly affecting extreme FWI. We find no relationship between wind and extreme FWI values, indicating that wind is not an important explanatory variable for extreme FWI events over Sweden.
For precipitation, we generally find an increase from the PI to 1C for all regions and climate models, with the exception of W@H which has a small decrease in precipitation. For 2C, however, there are strong differences between the regions, where, in Norrland, precipitation further increases, while, for Svealand and Götaland, it decreases towards PI values (EC-Earth) or stays constant with present climate values (CESM-LE). Note, however, that the precipitation values associated with high-FWI values (circles in Fig. 8) do not show this upward trend for Norrland. Hence, changes in mean precipitation do not necessarily reflect the changes in prolonged dry periods. An analysis of the trends in the lower (dry periods) and middle quantiles of 30 d precipitation in summer shows clear changes in the median but no clear changes in the lower quantiles (not shown). This is also demonstrated by Pendergrass et al. (2017), who find that the precipitation variability generally increases in a warmer climate.
The changes in FWI between the different climates relate mostly to changes in precipitation and temperature, as RH follows the changes of these variables. The higher temperatures for present and future climate relative to PI climate yield an increase of FWI. However, the increase in precipitation can counteract this increase. The fact that FWI increases even in models with mean increases in precipitation shows that temperature increases dominate future increases in FWI.
A dynamic factor that is projected to come into play over the next few decades is the development of a heat low over the Mediterranean area. This would increase the possibility of easterly wind over northern Europe and, hence, dry weather, offsetting the trend towards wetter summer weather up to now (Haarsma et al., 2009).
Our results mostly agree with previous research. The work of Flannigan et al. (2013) points to an increased risk of forest fires over the whole of Sweden for multiple climate projections. Findings from Yang et al. (2015) point to an increased risk of forest fires in the southern part of Sweden but not for the northern part, where they point to increased precipitation which reduces fire risk. This difference can be caused by the undersampling of extreme events, since Yang et al. (2015) use a single, 30-year time slice of future (2071–2100) climate. It must also be noted that local future precipitation trends are highly uncertain (Lehtonen et al., 2016), implying that using only one climate model for future projection leads to highly uncertain results (as in Yang et al., 2015; Hauser et al., 2017). Even the three climate models in this study will likely underestimate the model uncertainty in the precipitation trends. Other important aspects that could impact projections of fire weather risk are the chosen bias correction method and the specific fire weather index used. Hence, future work should focus on using more large-ensemble climate models in order to better sample the uncertainty in the future climate projections and to test the sensitivity to different bias correction methods and fire weather indices.
Note that we assume that FWI remains a skilful predictor of the burnt area (Fig. 4), even in a future climate. This assumption is, however, highly uncertain due to factors not accounted for in the analysis here, such as possible changes in forest management (Moreira and Pe'er, 2018; Hudson, 2018), a possible increase or decrease of human-caused forest fires (Balch et al., 2017) and feedback mechanisms between forest fires and ecology (Balch et al., 2008).
In our analysis of the forest fires in Sweden of 2018, we have looked at the risk of fire weather solely on the basis of the Canadian FWI, with the novel approach of using multiple reanalysis data sets and multiple large ensembles with climate models. Using the FWI, we have only attributed meteorological aspects of this event but acknowledge that there are additional aspects important for determining forest fire risk not considered here, such as ignition sources, forest management and ecology.
We find that the maximum FWI in July 2018 had return times of ∼24 years in Götaland, ∼23 years in Svealand and ∼24 years in Norrland, with a large uncertainty in the reanalysis data sets (the 90 % confidence interval starts at ∼10 years). Due to the relatively short observational record, large uncertainty in the reanalysis data sets and large natural variability of the FWI, we cannot infer a robust trend from the reanalysis data alone.
The climate models point to an insignificantly small increase in probability for such an event at the present day compared to preindustrial conditions for all three regions of about a factor of 1.1 (0.9 to 1.4). In a future climate (a 2 ∘C warmer climate relative to the preindustrial era) the probability of such events occurring may increase more robustly by a factor of ∼2 (1.5 to 3) relative to preindustrial climate according to our model analysis.
The increased fire risk is mostly driven by increased temperature. Though we do find clear changes in precipitation for the warmer climates, we do not see a clear change in prolonged dry periods during summer, which have historically driven, and will likely continue to drive, high fire risk events. Our results show the importance of using multiple large ensembles with climate models for attribution studies in order to adequately sample the natural variability and model uncertainties in climate projections.
The Python code used to compute the FWI and for the analysis can be obtained by contacting Folmer Krikken (folmer.krikken@knmi.nl).
EC-Earth data can be obtained by contacting Folmer Krikken (folmer.krikken@knmi.nl), CESM1 data can be obtained by contacting Flavio Lehner (flehner@ucar.edu) and W@H data can be obtained by contacting Karsten Haustein (karsten.haustein@ouce.ox.ac.uk).
GJvO and FK conceived and planned the analysis. FK provided the EC-Earth data. FL provided the CESM1 data. KH provided the W@H data. FK performed the main analysis and wrote the main paper with support from all authors at all stages.
The authors declare that they have no conflict of interests
We thank Guilherme S. J. Pinto for providing the Swedish forest fire data from the MSB.
This research has been supported by the Belmont Forum Project PREREAL (grant no. 292-2015-11-30-13-43-09), the Canadian National Research Council – Canada through Discovery (grant no. DDG-2015-00026), the Swedish Research Council FORMAS (grant no. 239-2014-1866), the Swedish Institute networks of CLIMECO and BalticFire (grant nos. 10066-2017-13 and 24474/2018). Additional support has been given by the ERA4CS project SERV_FORFIRE, NSF (grant no. AGS-0856145; amendment 87), the Bureau of Reclamation (grant no. R16AC00039) and the Regional and Global Model Analysis (RGMA) component of the Earth and Environmental System Modelling Program of the U.S. Department of Energy's Office of Biological and Environmental Research (BER; grant no. DE-FC02-97ER62402). The study was conducted within the framework of the NordicProxy network, which is supported by the Nordic Forest Research (SNS) and the consortium GDRI Cold Forests.
This paper was edited by Maria-Carmen Llasat and reviewed by three anonymous referees.
Abatzoglou, J. T. and Williams, A. P.: Impact of anthropogenic climate change on wildfire across western US forests, P. Natl. Acad. Sci. USA, 113, 11770–11775, https://doi.org/10.1073/pnas.1607171113, 2016.
Abatzoglou, J. T., Williams, A. P., and Barbero, R.: Global Emergence of Anthropogenic Climate Change in Fire Weather Indices, Geophys. Res. Lett., 46, 326–336, https://doi.org/10.1029/2018GL080959, 2019.
Balch, J. K., Nepstad, D. C., Brando, P. M., Curran, L. M., Portela, O., Carvalho, O. D., and Lefebvre, P.: Negative fire feedback in a transitional forest of southeastern Amazonia, Glob. Change Biol., 14, 2276–2287, https://doi.org/10.1111/j.1365-2486.2008.01655.x, 2008.
Balch, J. K., Bradley, B. A., Abatzoglou, J. T., Nagy, R. C., Fusco, E. J., and Mahood, A. L.: Human-started wildfires expand the fire niche across the United States, P. Natl. Acad. Sci. USA, 114, 2946–2951, https://doi.org/10.1073/pnas.1617394114, 2017.
Copernicus Climate Change Service (C3S): ERA5: Fifth generation of ECMWF atmospheric reanalyses of the global climate, Copernicus Climate Change Service Climate Data Store (CDS), available at: https://cds.climate.copernicus.eu/cdsapp#!/home (last access: 15 March 2019), 2017.
Dee, D. P., Uppala, S. M., Simmons, A. J., Berrisford, P., Poli, P., Kobayashi, S., Andrae, U., Balmaseda, M. A., Balsamo, G., Bauer, P., Bechtold, P., Beljaars, A. C. M., van de Berg, L., Bidlot, J., Bormann, N., Delsol, C., Dragani, R., Fuentes, M., Geer, A. J., Haimberger, L., Healy, S. B., Hersbach, H., Hólm, E. V., Isaksen, L., Kållberg, P., Köhler, M., Matricardi, M., McNally, A. P., Monge-Sanz, B. M., Morcrette, J.-J., Park, B.-K., Peubey, C., de Rosnay, P., Tavolato, C., Thépaut, J.-N., and Vitart, F.: The ERA-Interim reanalysis: configuration and performance of the data assimilation system, Q. J. Roy. Meteor. Soc., 137, 553–597, https://doi.org/10.1002/qj.828, 2011.
Drobyshev, I., Niklasson, M., and Linderholm, H. W.: Forest fire activity in Sweden: Climatic controls and geographical patterns in 20th century, Agric. For. Meteorol., 154–155, 174–186, https://doi.org/10.1016/j.agrformet.2011.11.002, 2012.
Drobyshev, I., Granström, A., Linderholm, H. W., Hellberg, E., Bergeron, Y., and Niklasson, M.: Multi-century reconstruction of fire activity in Northern European boreal forest suggests differences in regional fire regimes and their sensitivity to climate, J. Ecol., 102, 738–748, https://doi.org/10.1111/1365-2745.12235, 2014.
Ehret, U., Zehe, E., Wulfmeyer, V., Warrach-Sagi, K., and Liebert, J.: HESS Opinions ”Should we apply bias correction to global and regional climate model data?”, Hydrol. Earth Syst. Sci., 16, 3391–3404, https://doi.org/10.5194/hess-16-3391-2012, 2012.
Flannigan, M., Cantin, A. S., de Groot, W. J., Wotton, M., Newbery, A., and Gowman, L. M.: Global wildland fire season severity in the 21st century, Forest Ecol. Manag., 294, 54–61, https://doi.org/10.1016/j.foreco.2012.10.022, 2013.
Gardelin, M.: Brandriskprognoser med hjälp av en kanadensisk skogsbrandsmodell, Räddningsverket Report, Myndigheten för samhällsskydd och Beredskap (MSB), Sweden, 1997.
Gelaro, R., McCarty, W., Suárez, M. J., Todling, R., Molod, A., Takacs, L., Randles, C. A., Darmenov, A., Bosilovich, M. G., Reichle, R., Wargan, K., Coy, L., Cullather, R., Draper, C., Akella, S., Buchard, V., Conaty, A., Silva, A. M. da, Gu, W., Kim, G.-K., Koster, R., Lucchesi, R., Merkova, D., Nielsen, J. E., Partyka, G., Pawson, S., Putman, W., Rienecker, M., Schubert, S. D., Sienkiewicz, M., and Zhao, B.: The Modern-Era Retrospective Analysis for Research and Applications, Version 2 (MERRA-2), J. Climate, 30, 5419–5454, https://doi.org/10.1175/JCLI-D-16-0758.1, 2017.
Gillett, N. P., Weaver, A. J., Zwiers, F. W., and Flannigan, M. D.: Detecting the effect of climate change on Canadian forest fires, Geophys. Res. Lett., 31, L18211, https://doi.org/10.1029/2004GL020876, 2004.
Guillod, B. P., Jones, R. G., Bowery, A., Haustein, K., Massey, N. R., Mitchell, D. M., Otto, F. E. L., Sparrow, S. N., Uhe, P., Wallom, D. C. H., Wilson, S., and Allen, M. R.: weather@home 2: validation of an improved global–regional climate modelling system, Geosci. Model Dev., 10, 1849–1872, https://doi.org/10.5194/gmd-10-1849-2017, 2017.
Haarsma, R. J., Selten, F., Hurk, B. vd, Hazeleger, W., and Wang, X.: Drier Mediterranean soils due to greenhouse warming bring easterly winds over summertime central Europe, Geophys. Res. Lett., 36, L04705, https://doi.org/10.1029/2008GL036617, 2009.
Hansen, J., Ruedy, R., Sato, M., and Lo, K.: Global Surface Temperature Change, Rev. Geophys., 48, RG4004, https://doi.org/10.1029/2010RG000345, 2010.
Hauser, M., Gudmundsson, L., Orth, R., Jézéquel, A., Haustein, K., Vautard, R., Oldenborgh, G. J. van, Wilcox, L., and Seneviratne, S. I.: Methods and Model Dependency of Extreme Event Attribution: The 2015 European Drought, Earths Future, 5, 1034–1043, https://doi.org/10.1002/2017EF000612, 2017.
Hazeleger, W., Severijns, C., Semmler, T., Ştefănescu, S., Yang, S., Wang, X., Wyser, K., Dutra, E., Baldasano, J. M., Bintanja, R., Bougeault, P., Caballero, R., Ekman, A. M. L., Christensen, J. H., van den Hurk, B., Jimenez, P., Jones, C., Kållberg, P., Koenigk, T., McGrath, R., Miranda, P., Van Noije, T., Palmer, T., Parodi, J. A., Schmith, T., Selten, F., Storelvmo, T., Sterl, A., Tapamo, H., Vancoppenolle, M., Viterbo, P., and Willén, U.: EC-Earth: A Seamless Earth-System Prediction Approach in Action, B. Am. Meteorol. Soc., 91, 1357–1363, https://doi.org/10.1175/2010BAMS2877.1, 2010.
Hazeleger, W., Wang, X., Severijns, C., Ştefănescu, S., Bintanja, R., Sterl, A., Wyser, K., Semmler, T., Yang, S., Hurk, B. van den, Noije, T. van, Linden, E. van der, and Wiel, K. van der: EC-Earth V2.2: description and validation of a new seamless earth system prediction model, Clim. Dynam., 39, 2611–2629, https://doi.org/10.1007/s00382-011-1228-5, 2011.
Herrera, S., Bedia, J., Gutiérrez, J. M., Fernández, J., and Moreno, J. M.: On the projection of future fire danger conditions with various instantaneous/mean-daily data sources, Clim. Change, 118, 827–840, https://doi.org/10.1007/s10584-012-0667-2, 2013.
Ho, C. K., Stephenson, D. B., Collins, M., Ferro, C. A. T., and Brown, S. J.: Calibration Strategies: A Source of Additional Uncertainty in Climate Change Projections, B. Am. Meteorol. Soc., 93, 21–26, https://doi.org/10.1175/2011BAMS3110.1, 2011.
Hudson, B.: Fighting Fire with Fire? Adjusting Regulatory Regimes and Forest Product Markets to Mitigate Southern United States Wildfire Risk, Social Science Research Network, Rochester, NY, 2018.
Kay, J. E., Deser, C., Phillips, A., Mai, A., Hannay, C., Strand, G., Arblaster, J. M., Bates, S. C., Danabasoglu, G., Edwards, J., Holland, M., Kushner, P., Lamarque, J.-F., Lawrence, D., Lindsay, K., Middleton, A., Munoz, E., Neale, R., Oleson, K., Polvani, L., and Vertenstein, M.: The Community Earth System Model (CESM) Large Ensemble Project: A Community Resource for Studying Climate Change in the Presence of Internal Climate Variability, B. Am. Meteorol. Soc., 96, 1333–1349, https://doi.org/10.1175/BAMS-D-13-00255.1, 2014.
Kirchmeier-Young, M. C., Gillett, N. P., Zwiers, F. W., Cannon, A. J., and Anslow, F. S.: Attribution of the Influence of Human-Induced Climate Change on an Extreme Fire Season, Earths Future, 7, 2–10, https://doi.org/10.1029/2018EF001050, 2018.
Kobayashi, S., Ota, Y., Harada, Y., Ebita, A., Moriya, M., Onoda, H., Onogi, K., Kamahori, H., Kobayashi, C., Endo, H., Miyaoka, K., and Takahashi, K.: The JRA-55 Reanalysis: General Specifications and Basic Characteristics, J. Meteorol. Soc. Jpn. Ser II, 93, 5–48, https://doi.org/10.2151/jmsj.2015-001, 2015.
Lehtonen, I., Venäläinen, A., Kämäräinen, M., Peltola, H., and Gregow, H.: Risk of large-scale fires in boreal forests of Finland under changing climate, Nat. Hazards Earth Syst. Sci., 16, 239–253, https://doi.org/10.5194/nhess-16-239-2016, 2016.
Lewis, S. C., Blake, S. A. P., Trewin, B., Black, M. T., Dowdy, A. J., Perkins-Kirkpatrick, S. E., King, A. D., and Sharples, J. J.: Deconstructing Factors Contributing to the 2018 Fire Weather in Queensland, Australia, B. Am. Meteorol. Soc., 101, S115–S122, https://doi.org/10.1175/BAMS-D-19-0144.1, 2020.
Massey, N., Jones, R., Otto, F. E. L., Aina, T., Wilson, S., Murphy, J. M., Hassell, D., Yamazaki, Y. H., and Allen, M. R.: weather@home – development and validation of a very large ensemble modelling system for probabilistic event attribution, Q. J. Roy. Meteorol. Soc., 141, 1528–1545, https://doi.org/10.1002/qj.2455, 2015.
Moreira, F. and Pe'er, G.: Agricultural policy can reduce wildfires, Science, 359, 1001–1001, https://doi.org/10.1126/science.aat1359, 2018.
MSB: Incident reports from municipal fire brigades, Swedish Civ. Conting. Agency (Myndigheten för samhällsskydd och Beredsk in Swedish), available at: https://www.msb.se/ (last access: 3 February 2019), 2017.
Oldenborgh, G. J. van, Wiel, K. van der, Sebastian, A., Singh, R., Arrighi, J., Otto, F., Haustein, K., Li, S., Vecchi, G., and Cullen, H.: Attribution of extreme rainfall from Hurricane Harvey, August 2017, Environ. Res. Lett., 12, 124009, https://doi.org/10.1088/1748-9326/aa9ef2, 2017.
Pendergrass, A. G., Knutti, R., Lehner, F., Deser, C., and Sanderson, B. M.: Precipitation variability increases in a warmer climate, Sci. Rep., 7, 17966, https://doi.org/10.1038/s41598-017-17966-y, 2017.
Pfleiderer, P. and Coumou, D.: Quantification of temperature persistence over the Northern Hemisphere land-area, Clim. Dyn., 51, 627–637, https://doi.org/10.1007/s00382-017-3945-x, 2018.
Riahi, K., Rao, S., Krey, V., Cho, C., Chirkov, V., Fischer, G., Kindermann, G., Nakicenovic, N., and Rafaj, P.: RCP 8.5 – A scenario of comparatively high greenhouse gas emissions, Clim. Change, 109, 33, https://doi.org/10.1007/s10584-011-0149-y, 2011.
Schiermeier, Q.: Droughts, heatwaves and floods: How to tell when climate change is to blame, Nature, 560, 20–22, https://doi.org/10.1038/d41586-018-05849-9, 2018.
Sippel, S., Otto, F. E. L., Flach, M., and van Oldenborgh, G. J.: The Role of Anthropogenic Warming in 2015 Central European Heat Waves, B. Am. Meteorol. Soc., 97, S51–S56, https://doi.org/10.1175/BAMS-D-16-0150.1, 2016.
Taufik, M., Torfs, P. J. J. F., Uijlenhoet, R., Jones, P. D., Murdiyarso, D., and Van Lanen, H. A. J.: Amplification of wildfire area burnt by hydrological drought in the humid tropics, Nat. Clim. Change, 7, 428–431, https://doi.org/10.1038/nclimate3280, 2017.
Turco, M., Bedia, J., Liberto, F. D., Fiorucci, P., Hardenberg, J. von, Koutsias, N., Llasat, M.-C., Xystrakis, F., and Provenzale, A.: Decreasing Fires in Mediterranean Europe, PLOS ONE, 11, e0150663, https://doi.org/10.1371/journal.pone.0150663, 2016.
Van Wagner, C. E.: Development and structure of the Canadian forest fire index system, Forestry Technical Report, Canadian Forestry Service Headquarters, Ottawa, 1987.
Vautard, R., van Oldenborgh, G. J., Otto, F. E. L., Yiou, P., de Vries, H., van Meijgaard, E., Stepek, A., Soubeyroux, J.-M., Philip, S., Kew, S. F., Costella, C., Singh, R., and Tebaldi, C.: Human influence on European winter wind storms such as those of January 2018, Earth Syst. Dynam., 10, 271–286, https://doi.org/10.5194/esd-10-271-2019, 2019.
van der Wiel, K., Kapnick, S. B., van Oldenborgh, G. J., Whan, K., Philip, S., Vecchi, G. A., Singh, R. K., Arrighi, J., and Cullen, H.: Rapid attribution of the August 2016 flood-inducing extreme precipitation in south Louisiana to climate change, Hydrol. Earth Syst. Sci., 21, 897–921, https://doi.org/10.5194/hess-21-897-2017, 2017.
Williams, A. P., Abatzoglou, J. T., Gershunov, A., Guzman-Morales, J., Bishop, D. A., Balch, J. K., and Lettenmaier, D. P.: Observed Impacts of Anthropogenic Climate Change on Wildfire in California, Earths Future, 7, 892–910, https://doi.org/10.1029/2019EF001210, 2019.
Wotton, B. M.: Interpreting and using outputs from the Canadian Forest Fire Danger Rating System in research applications, Environ. Ecol. Stat., 16, 107–131, https://doi.org/10.1007/s10651-007-0084-2, 2009.
Yang, W., Gardelin, M., Olsson, J., and Bosshard, T.: Multi-variable bias correction: application of forest fire risk in present and future climate in Sweden, Nat. Hazards Earth Syst. Sci., 15, 2037–2057, https://doi.org/10.5194/nhess-15-2037-2015, 2015.