the Creative Commons Attribution 4.0 License.
the Creative Commons Attribution 4.0 License.
 | 24 Feb 2020
The 22 December 2018 Mount Anak Krakatau volcanogenic tsunami on Sunda Strait coasts, Indonesia: tsunami and damage characteristics
Benazir
Mumtaz Luthfi
Anawat Suppasri
Louise K. Comfort
On 22 December 2018, a tsunami was generated from the Mount Anak Krakatau area that was caused by volcanic flank failures. The tsunami had severe impacts on the western coast of Banten and the southern coasts of Lampung in Indonesia. A series of surveys to measure the impacts of the tsunami was started 3 d after the tsunami and lasted for 10 d. Immediate investigations allowed the collection of relatively authentic images of the tsunami impacts before the clearing process started. This article investigates the impacts of the 2018 Sunda Strait tsunami on the affected areas and presents an analysis of the impacts of pure hydrodynamic tsunami forces on buildings. Impacts of the tsunami were expected to exhibit different characteristics than those found following the 2004 Indian Ocean tsunami in Aceh. Data were collected from 117 flow depths along the Banten and Lampung coasts. Furthermore, 98 buildings or houses were assessed for damage. Results of this study revealed that the flow depths were higher in Banten than in Lampung. Directions of the tsunami arrays created by the complex bathymetry around the strait caused these differences. Tsunami-induced damage to buildings was mostly the result of impact forces and drag forces. Damping forces could not be associated with the damage. The tsunami warning system in Indonesia should be extended to anticipate non-seismic tsunamis, such as landslides and volcanic processes driven by tsunamis. The lack of a tsunami warning during the first few minutes after the generation of the first wave led to a significant number of human casualties in both of the affected areas.
- Article
(13462 KB) - Full-text XML
- BibTeX
- EndNote


In 2018, there were two important tsunami disasters that drew the attention of disaster researchers, namely the 28 September 2018 Palu tsunami and the 22 December 2018 Sunda Strait tsunami. The latter was generated by the Mount Anak Krakatau volcanic eruption. The official number of human casualties reported was 437 dead, 31 942 injured, and 10 still missing as of completion of this report (BNPB, 2019). Local communities received no warning of the 22 December 2018 tsunami that was generated by Mount Anak Krakatau. This was one reason for the large number of human casualties on both sides of the affected area. What made this tsunami of particular interest was the rare process that led to its generation and the fact that it occurred at night, hindering any direct visual anticipation and interaction by local communities.
In some cases, people living around the volcano were not well prepared to face a potential tsunami that can be generated by eruptions. This was the case for those communities around the Thyrrenian coast of Italy (Gravina et al., 2019). Sustained public engagement is necessary, as in the Mount Zaō case in Japan (Donovan et al., 2018). As the volcanogenic tsunami is a low-frequency event, effective countermeasures specifically performed to mitigate impacts of non-tectonic tsunamis are difficult to see in actual practice.
Volcanic-eruption-induced tsunamis have been recorded at several locations, including one that occurred in 1883 due to the Mount Krakatau eruption. This tsunami caused between 30 000 and 70 000 deaths and affected not only the surrounding coasts along the Sunda Strait but also Madagascar on the western edge of the Indian Ocean basin, located about 3000 km from the Mount Krakatau complex (Choi et al., 2003). The highest wave reported due to the eruption was 40 m (Spicak et al., 2008). The 1883 eruption deformed the main dome of the Krakatau into four parts, i.e. the islands of Rakata, Sertung, Lang and Anak Krakatau. The crater of Krakatau was flattened under water due to the 1883 eruption; it emerged to the surface in 1930 and was named Mount Anak Krakatau, which literally means “the child of Krakatau” (Bani et al., 2015; Zen, 1970). Mount Anak Krakatau is considered among the most active volcanos in the world. Before the 2018 eruption, it erupted 40 times over the past 85 years (GVP, 2019). Nonetheless, only the 2018 eruption caused a tsunami wave that affected the southern coast of Sumatra (Lampung province) and the western coast of the island of Java (Banten province). In 2012, Giachetti et al. (2012) identified an active zone at the southwestern flank of Mount Anak Krakatau that expanded from time to time. They also revealed that the southwestern flank failure could generate a 45 m wave toward the small islands surrounding the volcano complex that could reach the Banten area with 1.5 m wave heights within 35–45 min after the collapse (Giachetti et al., 2012). The growth of Mount Anak Krakatau was observed toward the southwest, based on a survey in 1994 (Deblus et al., 1995). This made the slope of the southwestern flank significantly steep, inclined at about 0.9 as of 1995. The southwestern flank failure could also be associated with the tsunami that occurred in 1981 (Sigurdsson et al., 1991) despite no record of human casualties. Despite the long record of Anak Krakatau events, the 2018 tsunami in Sunda Strait still caused a significant number of human casualties, and impacts on the coastal settlement area were severe. The 22 December 2018 Mount Anak Krakatau tsunami was caused by a small volume of southwestern flank failure (<0.25 km3) of the volcano (Williams et al., 2019). Prior to this tsunami, the government of Indonesia released a status of the activities of Mount Anak Krakatau that has been active since June 2018 (PVMBG, 2018).
This study investigates the impacts of volcanogenic tsunamis, generated by Mount Anak Krakatau, on Lampung and Banten, located around Sunda Strait, Indonesia. A series of measurements were performed at the affected area from 24 December 2018 to 3 January 2019. Data collected in this research were compiled in a database that is stored at the Mendeley database (Syamsidik et al., 2019b). Some locations with measured flow depths, damaged buildings and tsunami boulders can be referenced by the database. In this article, reported impacts of the tsunami on buildings provide novel findings where field tsunami impact data have mostly been based on tectonic tsunamis. Here we present results of an analysis of the damage to buildings due purely to tsunami hydrodynamic forces. Notwithstanding the presented findings, we acknowledge some limitations of the study as elucidated in Sect. 5, “Discussions”. This article is expected to contribute to tsunami engineering studies and to a better understanding of tsunami mitigation efforts especially in the analysis of damage to buildings due to tsunamis.
The tsunami-affected area was largely reported to be from the southern coasts of Lampung and western coasts of Banten. In this study, we investigated five areas, as shown in Fig. 1. Two areas were the districts of Pandeglang and Serang on the western coasts of Banten. The other three areas were the districts of South Lampung and Tanggamus of the Lampung province. The district of Serang has a total population of about 1.56 million as of 2017, while Pandeglang has a total population about 1.21 million as of 2017. Serang is famous for its industrial areas; a large steel company is located at its coast. Pandeglang is known for tourism, as a number of hotels and resorts, located along its coast, are heavily occupied during the long holiday season. Some areas in Pandeglang were difficult to assess using land transportation due to road damage, and some routes have still not been constructed. The damage caused by the tsunami on transportation lines created difficulties for the investigation team to reach the most southern part of the tsunami-affected area in Banten. In total, this team managed to investigate about 112 km of coastline along the province of Banten.
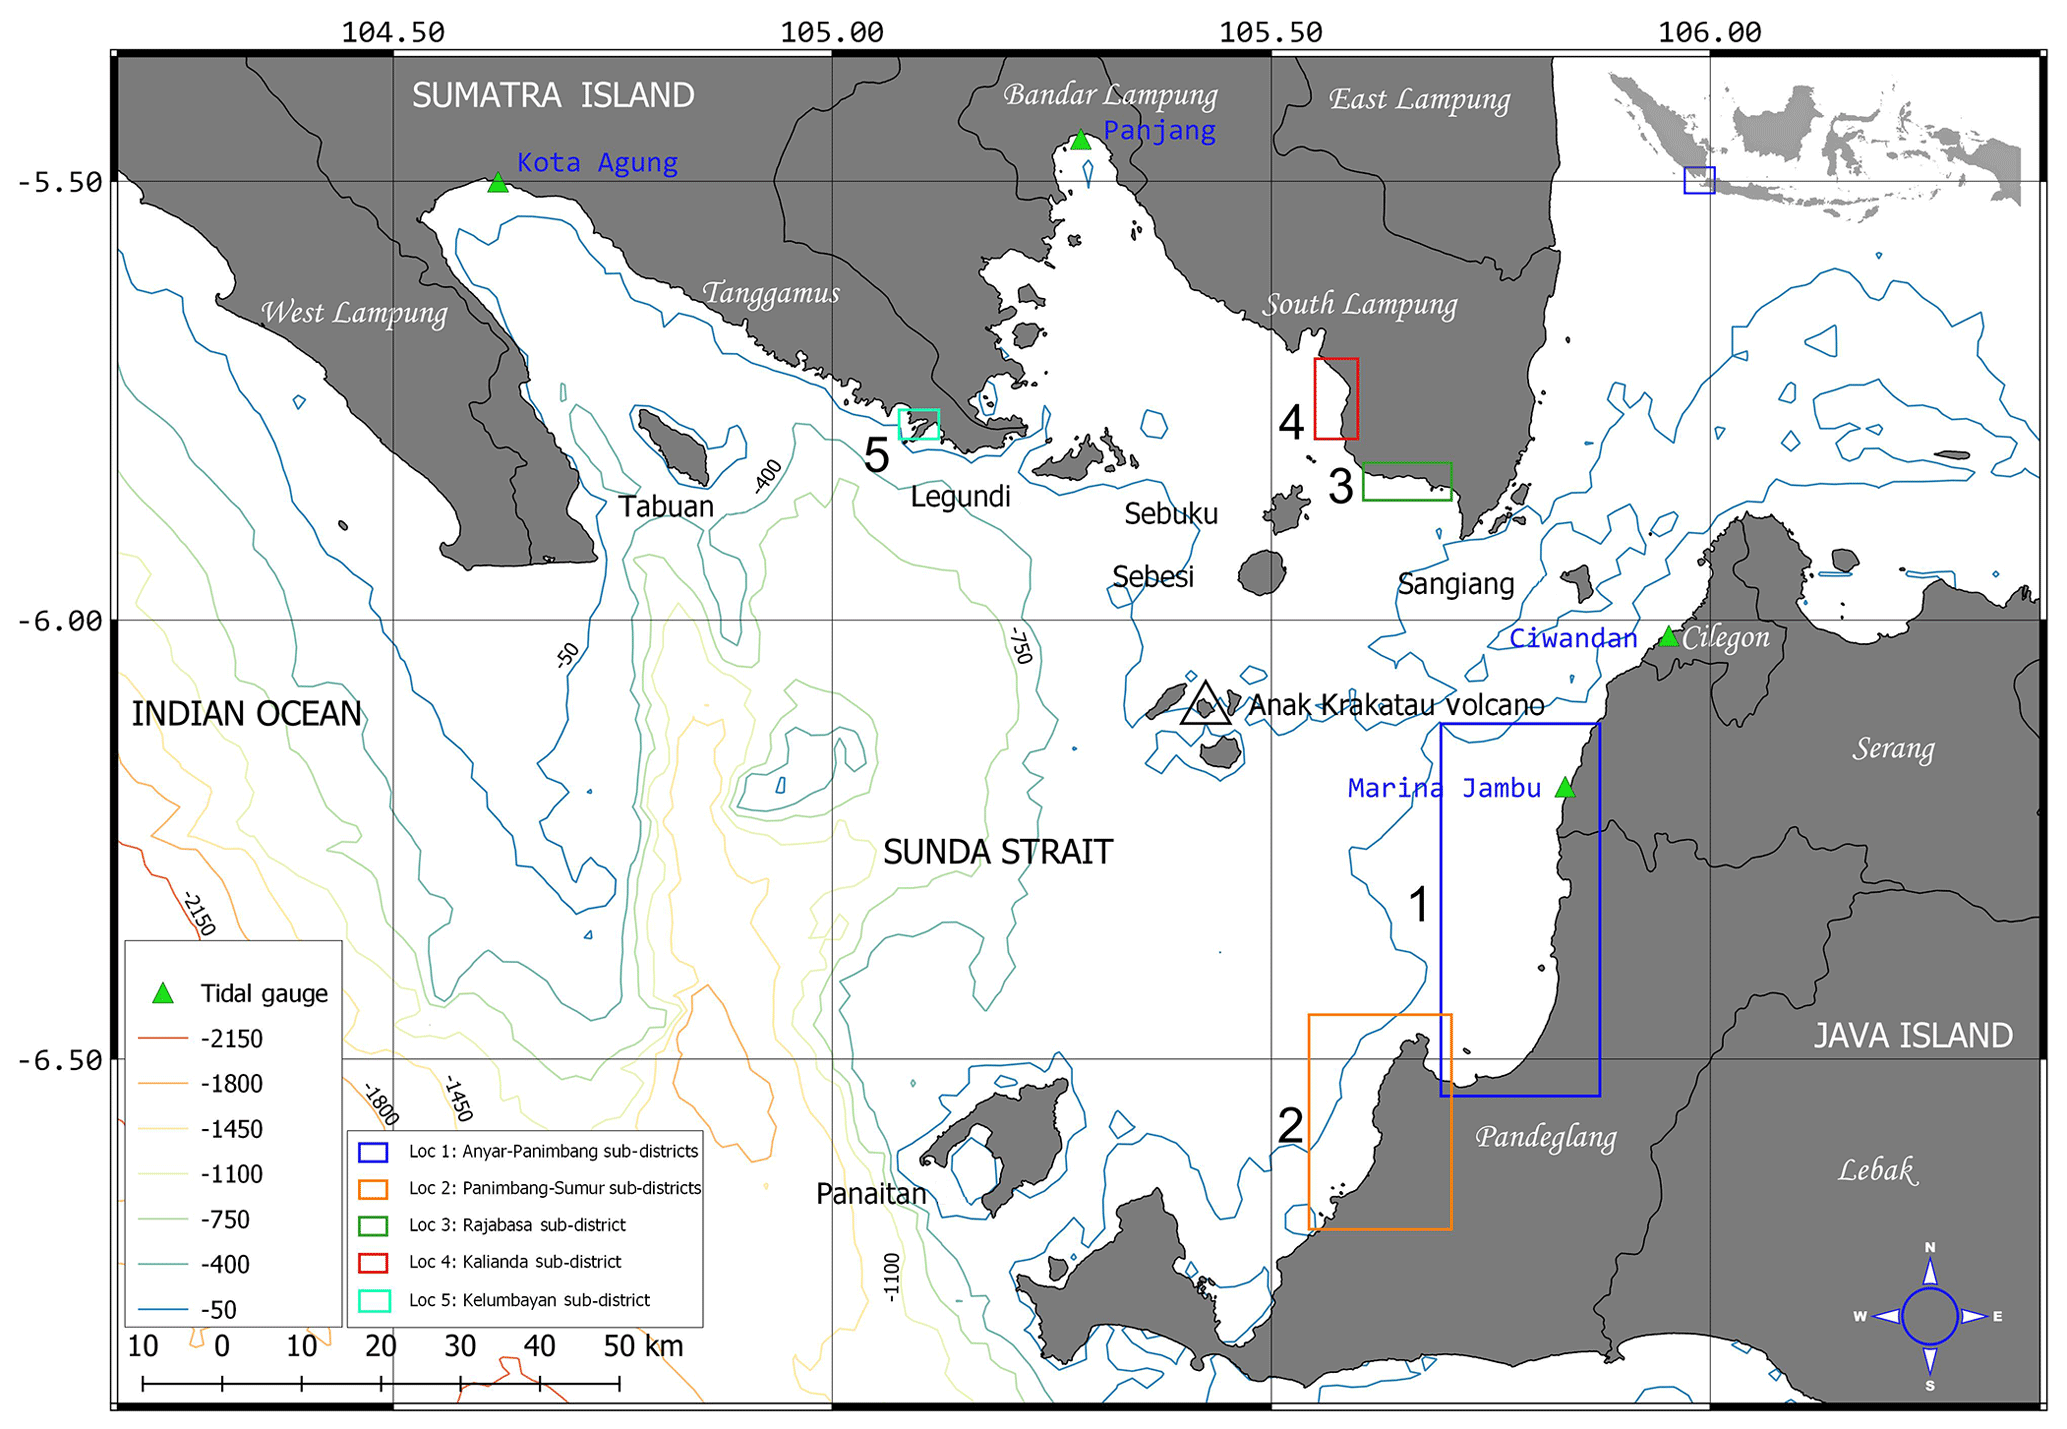
Figure 1The surveyed area following the 22 December 2018 Mount Anak Krakatau volcanogenic tsunami. Five areas of the survey are marked by blue rectangles. Tide-gauge stations are marked by green triangles. Bathymetry data were adapted from Topex (2019).
In Lampung, about 57 km of coastline was investigated, covering the two districts at the southern part of the province. South Lampung has a population of about 980 000 people, most of whom reside at the coastal area. Kalianda is the capital city of the district, which was also affected by the 2018 Sunda Strait tsunami. Another area in the district that was affected by the tsunami is Rajabasa. People in the two areas are mainly farmers and fishermen. A large ferry port accommodating a number of ferry lanes servicing Banten and Lampung is located in this district. Fortunately, there was no major impact on the port. The other district in Lampung investigated in this study is Tanggamus. Here, only one victim reportedly died from the tsunami. We investigated a small bay where human casualties were reported in this district.
3.1 Survey method
A series of surveys was conducted at the five affected areas explained in the previous section from 24 December 2018 to 3 January 2019. The 10 d survey was initiated to measure the impacts of the tsunami on Banten area. In this area, the team spent 6 d measuring tsunami flow depths, tsunami boulders, and damage to housing or buildings in the affected area. Another 4 d of the survey were spent in Lampung measuring the same data. Measurement of flow depths was done using a levelling staff and water pass to measure water marks, broken twigs, or stranded tsunami debris. A handheld GPS was used to locate the coordinates of the measured flow depths. The GPS was also used to measure limit of tsunami inundation. Some previous post-tsunami impact surveys also applied a similar method to this study, collecting flow depths, tsunami inundations, and building damage (see Fryer, 2011; Borrero et al., 2006; and Syamsidik et al., 2019a). A drone was also utilized in this survey to capture images from the tsunami-affected area. In total, we managed to measure 117 flow depths from both sides of the affected area. All data were stored in the Mendeley dataset (Syamsidik et al., 2019b). The survey was not performed at offshore islands around Mount Anak Krakatau, as the area was restricted by the government for any activity due to the threat of volcanic activity and the tsunamis.
The tsunami arrival at the coastal area was analysed based on water elevations measured at four tidal-gauge stations. The locations of the tidal-gauge stations can be seen in Fig. 1. To separate the tsunami wave data from the high-frequency data influenced by astronomical components, a low-pass filter was applied. Threshold frequency for the filtering was 0.0805 cycles per hour (cycle h−1), as suggested by Emery and Thomson (2001). Arrival times were interpreted based on the first peak of the wave recorded at the tidal-gauge stations. To confirm the conditions around the arrival times of the tsunami, we also performed a number of interviews in the local community. Three main questions were asked, i.e. regarding indications or some sign before the tsunami arrived, the number of waves, and the evacuation process. Ten people were interviewed on the Banten coasts and five in Lampung. Since the number of interviewees was limited, results of the interviews were meant to confirm the conditions before the tsunami arrival qualitatively. Furthermore, interviews were also conducted to identify locations of onshore boulders before the tsunami.
3.2 Velocity-inferred tsunami boulders
Velocity data were inferred from tsunami boulder transportation. Types of boulders were classified based on size and material composition. During the survey, they were dominated by two kinds of boulder materials, namely coral and rubble mound material from revetment structures. A description of the analytical solutions for inferring tsunami boulder transportation was given by Noormets et al. (2004). Tsunami boulders were measured for their dimensions, original locations (based on interviews and materials), and distance of transport. Tsunami boulder transportation velocities were inferred using Eq. (1), as suggested by Paris et al. (2010):
where umin is minimum estimated velocity (m s−1), μ is the friction coefficient, which is 0.7, as suggested by Noormets et al. (2004), g is gravitational acceleration (m s−2), Cd is the drag coefficient, which was considered to be 1.95, An is the areal of the boulder perpendicular to the tsunami flow direction, and ρw is water density (1027 kg m−3).
Distance travelled by the tsunami boulder depended on tsunami velocity, size of the boulder, and boulder material. The range of seawall material transported as a tsunami boulder was 3–4 m s−1 for sliding or rolling movement and 11–12 m s−1 if the boulder moved in the saltation mode (Nandasena et al., 2011; Paris et al., 2009).
3.3 Building damage observations
An assessment of building damage was performed on 98 buildings; most of them were houses. Among the assessed buildings, 73 were confined masonry-brick-infill houses. This type of house used smooth bars as structural components and masonry fill for walls. The walls were strengthened by tie columns and tie beams at the tops. Most of walls had a thickness of 15 cm. The bricks were bound by about 2–3 cm mortars. Plain bars were used to connect the walls with windows and door elements. This type of house predominated in Banten and Lampung. A similar type of house was found to be the majority of houses in the 2004 Indian Ocean tsunami-affected area in Aceh. Around 70 % of the houses in Aceh were confined-masonry-brick-infill houses (Boen, 2005; Brzev, 2007). This study compared the tsunami fragility curve produced based on the 2004 Indian Ocean tsunami in Banda Aceh to a fragility curve composed based on the 2018 Sunda Strait tsunami, as the types of houses in both areas are similar.
Table 1Damage states of buildings due to tsunami as suggested by Suppasri et al. (2011) and Macabuag et al. (2016).
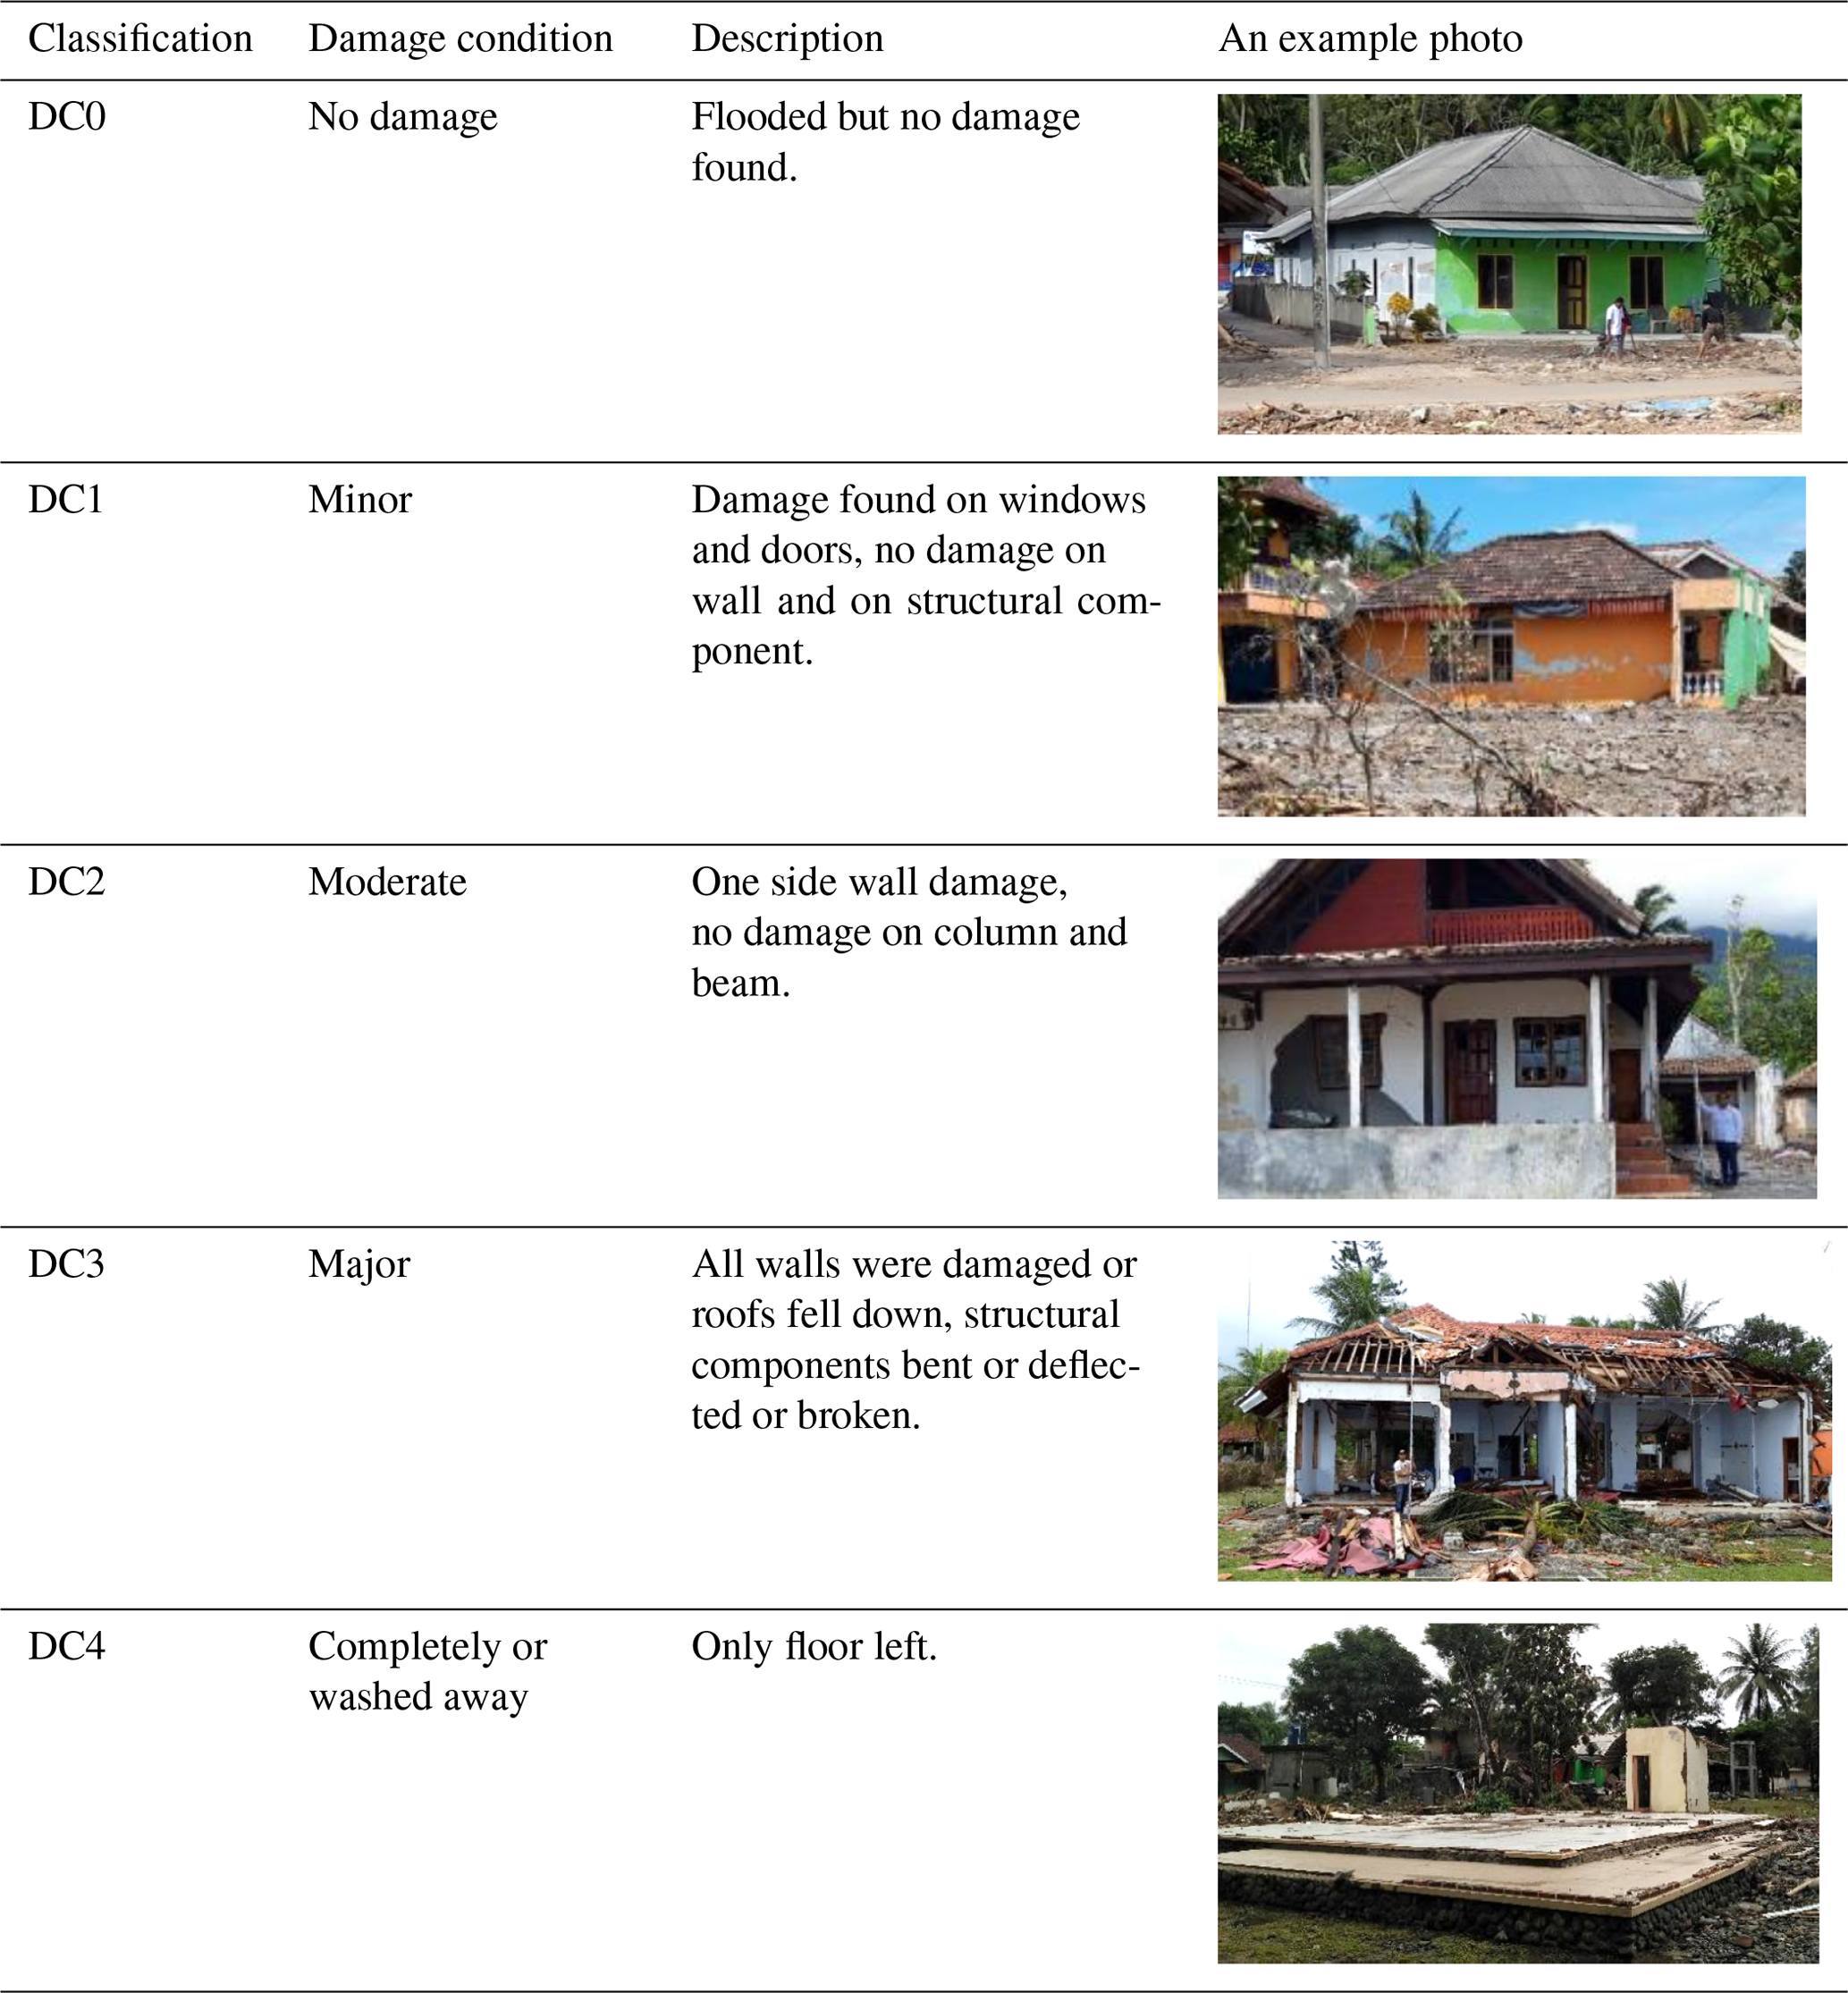
The types of damage were classified into five damage states (DSs), as suggested by Suppasri et al. (2011) and Macabuag et al. (2016). The list of DS classifications can be seen in Table 1. To exclude houses altered due to clearing processes, the assessment was limited to the confined masonry-brick infill buildings (CM) and wooden houses. Types of houses in the Banten and Lampung affected areas were relatively similar. Most of the buildings located near the coastal areas functioned as residences, villas, or cottages.
Data collected were analysed using fragility functions to produce cumulative probabilities of damage caused by the tsunami. Equation (2) was used to calculate the fragility functions:
where P is the cumulative probability of damage, ϕ is the standardized normal distribution function, x is the hydrodynamic feature analysed for damage (in this case, flow depth), and μ and σ are the mean and standard deviations of x, respectively.
The fragility function was developed to estimate the future impacts of a tsunami. In previous cases, the function was developed based on tectonic tsunamis (Koshimura et al., 2009; Suppasri et al., 2015). In this study, as there was no earthquake preceding the tsunami, analysis of the damage was based purely on tsunami wave propagation.
4.1 Tsunami arrival times
Tsunami arrivals were determined based on water elevations monitored at four tidal-gauge stations located around the Sunda Strait. The stations were Marina Jambu, Ciwandan, Panjang and Kota Agung. The tidal-gauge stations are operated by Indonesia Geospatial Information Agency (BIG, 2018). Each of the stations recorded 1 min interval water levels and are available online. Figure 2 shows the filtered tidal data from all four stations. The first detected tsunami wave arrival was recorded at Marina Jambu station at 14:30 UTC (at 21:30 local time). The time of generation of the tsunami from the source was not clear, since no tidal station was located around the volcano. Thirteen minutes later (14:43 UTC), the tsunami wave was recorded at the Ciwandan station, near Cilegon, Banten. The first tsunami wave was recorded at 14:40 UTC at the Kota Agung station, which was almost simultaneous with the Ciwandan station. Although Panjang is closer to the Mount Krakatau complex than Kota Agung, due to tsunami wave arrays that caused diffraction and refraction, the arrival time at Kota Agung was 10 min earlier than at Panjang stations (at 14:50 UTC). The landslide area at the southern part of Mount Anak Krakatau also contributed to arrival times.

Figure 2Filtered water elevation fluctuations measured at four tide-gauge stations around Sunda Strait, indicating the tsunami wave at arrival.
4.2 Flow depths and inundation area
Comparing the two main affected areas, a significant flow depth decay on both sides of the study areas was found. The highest flow depth was found at Cipenyu, Banten, where the tsunami wave hit directly from the area around the Krakatau complex. In the southern and the northern parts of this location, flow depth decreased. This was also found to be true in Lampung. Detailed findings from both of these areas are elucidated as follows.
4.2.1 Banten
Serang district
Impacts of the tsunami in Banten were found to be more severe than in Lampung. Along the western coast of Banten, impacts were visible but not seen to be continuous. Figure 3 shows tsunami flow depth distribution and run-up limits measured at Banten coasts. There were some areas where evidence of tsunami waves could not be identified based on physical observations and eyewitness interviews. It is important to note that the interviewees' expressions were not meant to clarify the tidal-gauge data, as this was difficult to do. Tide elevation data reported from the tide stations were 1 min average data. The northernmost extent of the tsunami effects was located at the Anyar coast. The northernmost point of the tsunami depth was identified at Villa A Pahmi, located in the village of Karang Suraga. Here, the tsunami depth was 2.80 m (F02), identified from gazebo roof damage in the backyard of the villa. Around this village, the maximum tsunami depth was 3.00 m (F01), based on a broken twig. Around Villa A Pahmi, a number of tsunami boulders were also found. Boulder materials came from a revetment structure protecting the coastline from erosion. The location of the revetment made determination of the travel distance of the transported boulders more facile. The farthest point of the transported boulder was 28 m from the revetment structure (Bo-1). Based on interviews with two tsunami survivors in this village, there were two significant wave attacks in this area; the second wave was the largest and the most destructive. A similar account was also revealed by another survivor at Villa Karang Bolong of Serang. Tsunami waves damaged some houses and villas in this area. To the south of this area, impacts of the tsunami were more visible, as they were seen in the Cinangka sub-district.
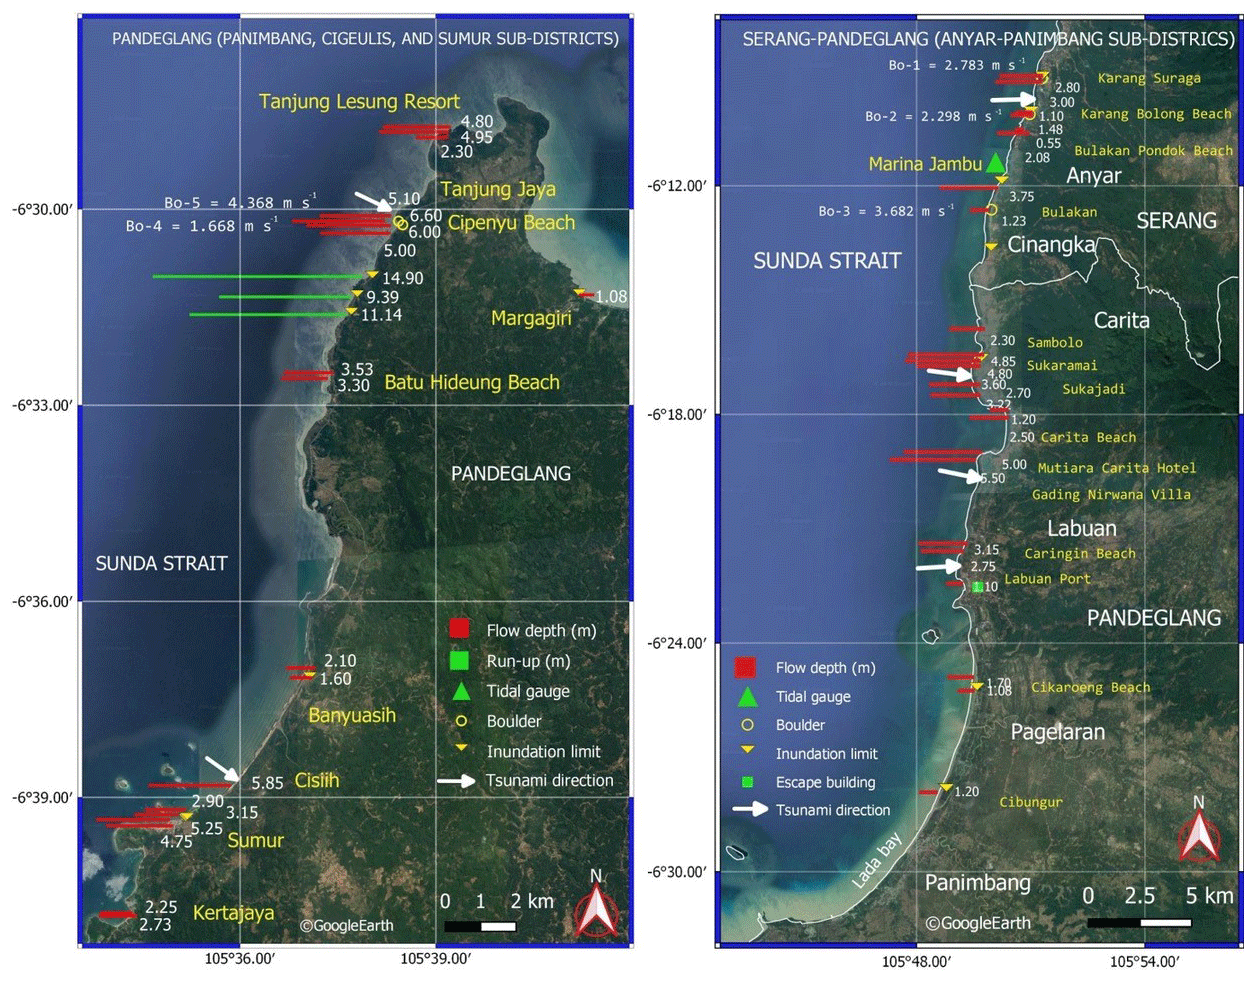
Figure 3Tsunami flow depth distribution around Serang, the northern area of Pandeglang (a) and around southern Pandeglang (Panimbang–Sumur; b). Flow depths are drawn in red bars. Green bars represent run-up heights. The green rectangle represents the location of a tsunami escape building at Labuan. (The map is adapted from Google Earth.)
At the Cinangka sub-district, maximum tsunami flow depth was measured at 3.75 m (F25). This was identified from the peeled bark of a tree in the village of Bulakan. At the Bulakan Pondok coast, in the same sub-district, flow depth was measured at 2.08 m (F10), identified by a thick tsunami deposit at the stairway of a villa located about 12 m from coastline (see Fig. 4).
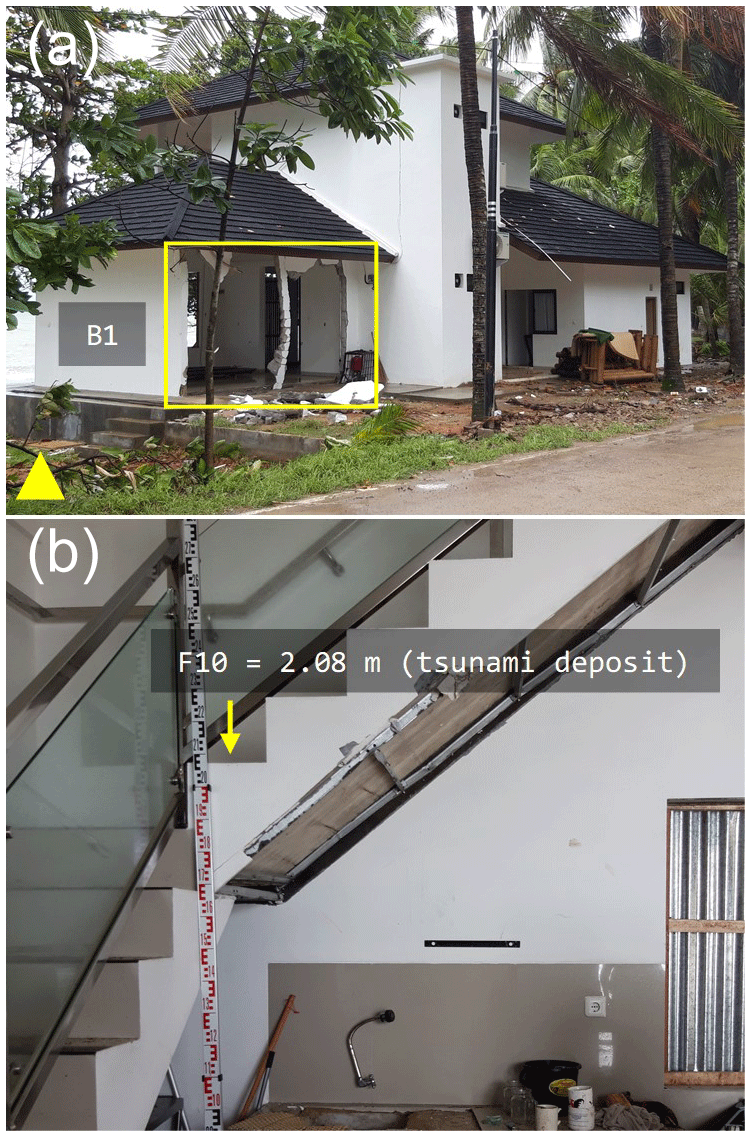
Figure 4A villa's wall destroyed by tsunami on Bulakan Pondok beach (a) and a 2.08 m of flow depth recorded on the stair inside the villa (b). One-storey house had a major damage; meanwhile the two-storey house was moderate.
Pandeglang
Unlike Serang, where most of the coastal area is dominated by villas for tourism, Pandeglang's coastal area is mostly residential. The village of Suka Ramai, located at Sambolo Bay, was severely affected by the tsunami, as can be seen from a cross profile of tsunami height and aerial images in Figs. 5 and 6. Tsunami wave direction is marked with a white arrow in the figure. Direction was identified from the direction of the fallen trees, swept away by the tsunami wave. At this location, tsunami flow depth was at 4.10 m (F16) based on a broken tree branch. A higher flow depth was at 4.85 m at point F20 (see the data in Syamsidik et al., 2019b).
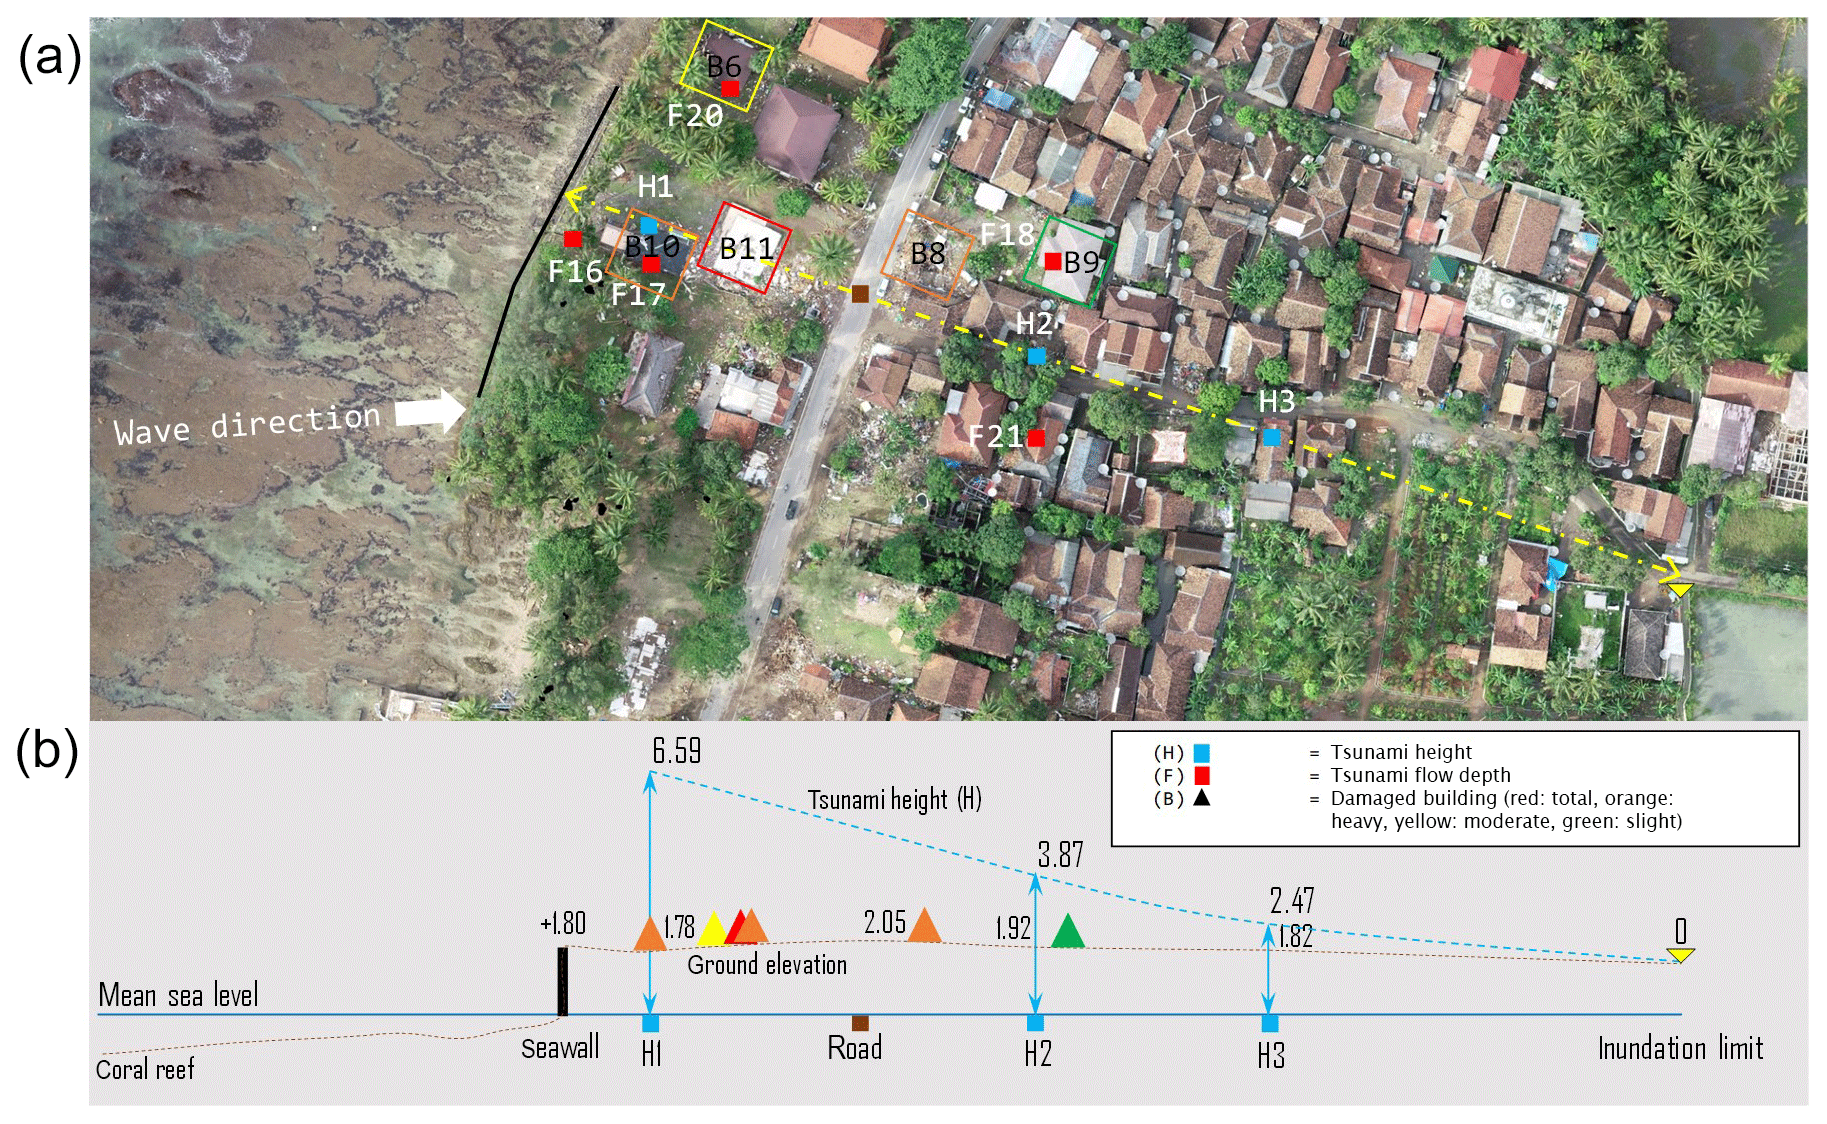
Figure 5A cross profile of tsunami height in Suka Ramai, Carita, Banten. Panel (a) is the location of the transect plotted on an aerial image captured on 28 December 2018.
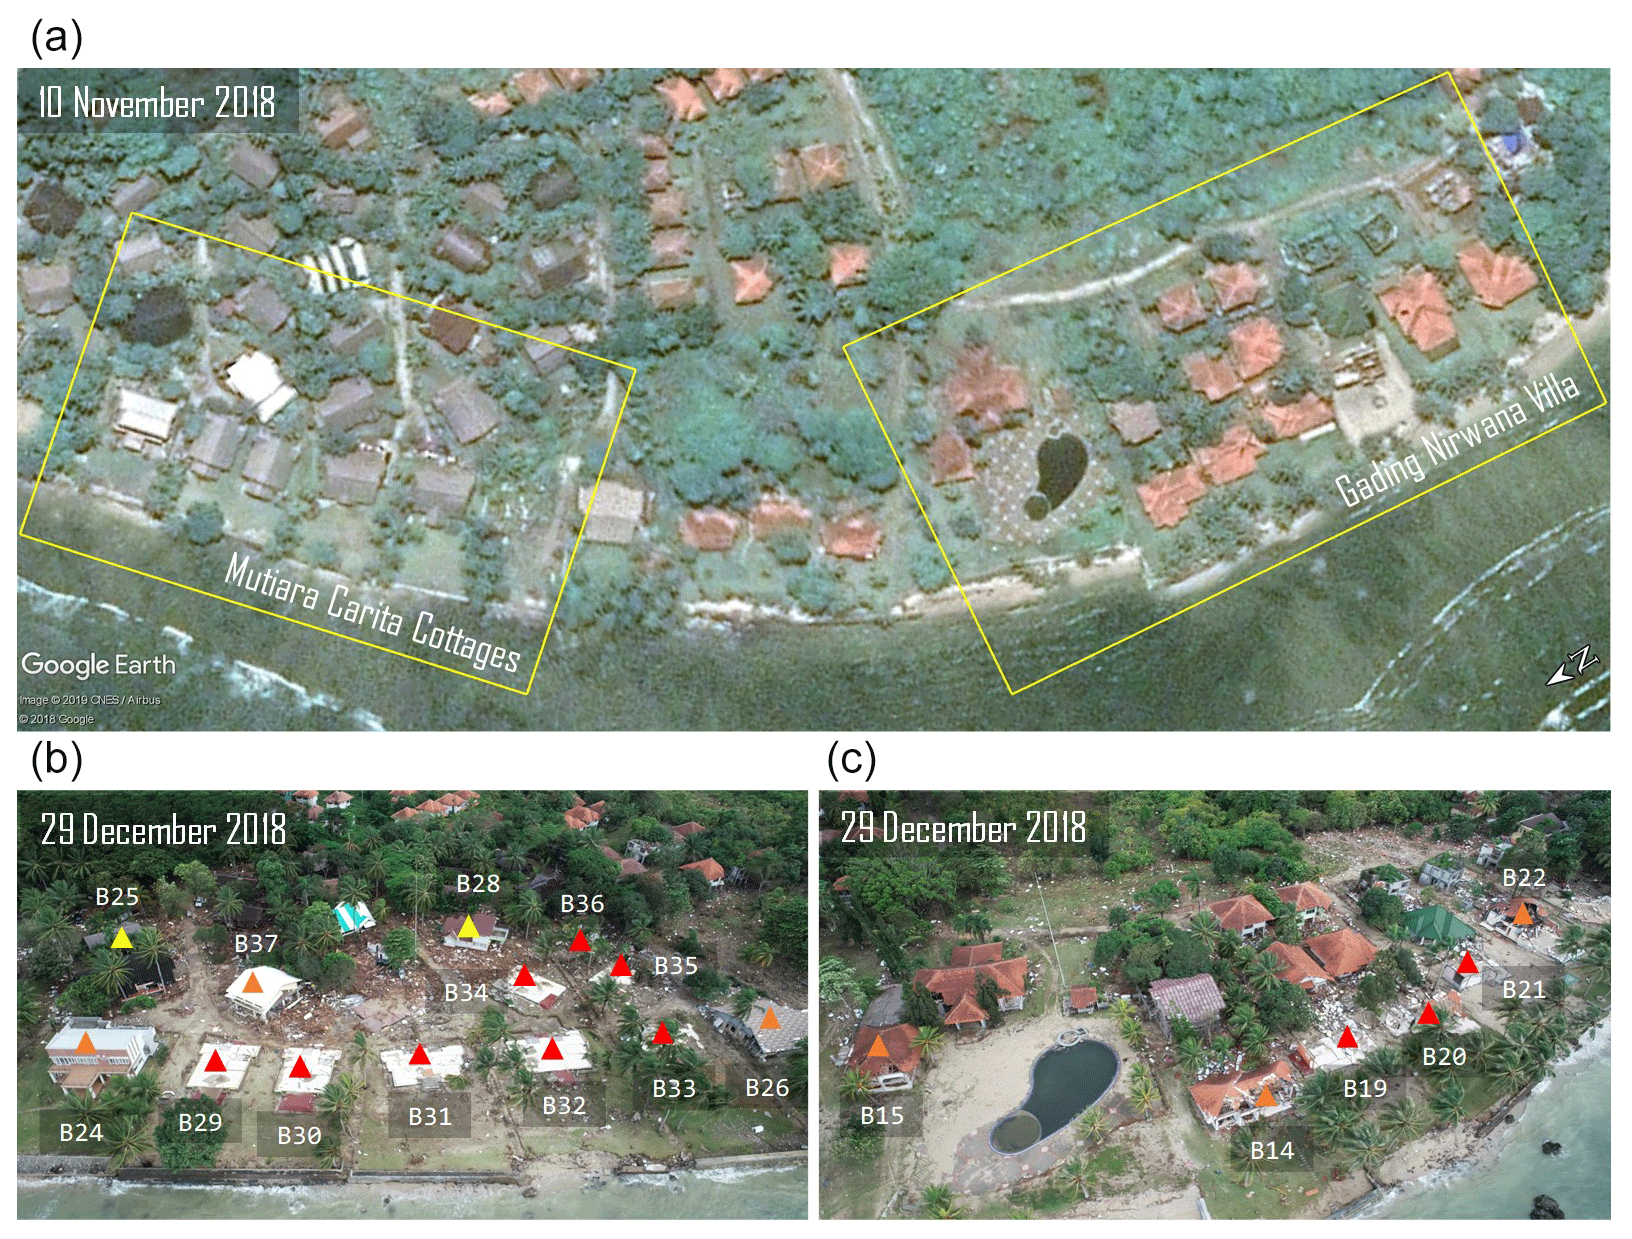
Figure 6Aerial view of land destruction at Mutiara Carita Cottages and Gading Nirwana Villa, Banten. Panel (a) was adapted from Google Earth.
At this location, a transect was performed to measure tsunami height. Figure 5 also shows the profile of tsunami flow heights, ground elevations and house damage type. Height was calibrated with local tide data. Here, the tsunami flow's height was 6.59 m (H1). As the crown of a seawall along this coastline was 1.80 m a.s.l., the tsunami wave was considered large enough to destroy houses and other types of buildings in the area. The tsunami inundation distance reached 249 m, passing over a dense residential area.
Further damage was identified in the Carita region of Pandeglang. The survey team investigated Mutiara Carita Cottage and Gading Nirwana Villa. The two resort complexes are situated close to the coastline, and some of the buildings directly face the sea. Most of the buildings in this area were located about 15 m from the coastline and apparently were not constructed for mitigating any waves coming from the strait. Most of the buildings were flattened by the tsunami wave, leaving only floors. Based on a wall clock found at an inundated house, the clock stopped at 21:45 local time (14:45 UTC). At Mutiara Carita, measured tsunami flow depth was 3.50 m, identified by a broken tree branch, and 3.34 m, which was identified from a broken roof element of the cottage. These are points F33 and F34 in data of this survey (Syamsidik et al., 2019b). A higher tsunami flow depth was found at Gading Nirwana Villa, which was 5.50 m (Syamsidik et al., 2019b). Flow depth was identified from a broken roof at the villa. An aerial view of the cottage captured on 25 December 2019 can be seen in Fig. 6.
To the south of Carita, tsunami impacts were inconsistent in terms of distribution and depth. This was shown at Labuan, a fisherman's village, where the highest tsunami flow depth was 1.10 m, measured at Labuan fishing port (PPP Labuan, which is point F39 in Syamsidik et al., 2019b). A lower flow depth was also measured at Teluk Lada of the Panimbang sub-district, where the tsunami wave only overtopped a seawall structure and flooded a road behind the seawall. The crest of the seawall was about 1.50 m a.g.l.
Interestingly, tsunami flow depths were found to be higher at the village of Tanjung Jaya than at Labuan. The village is located to the south of Labuan. In this village, there is also a special economic zone (KEK), where some industrial complexes are situated along with a resort (Tanjung Lesung Resort). At this resort, a significant number of human casualties were identified. This was because there was a company gathering where a popular musical band was performing at the time of the tsunami. According to an interview with the resort manager, the first tsunami wave hit this resort at 21:30 local time (14:30 UTC). The first wave destroyed the performance stage, captured by amateur video recorded by a party attendant. When this survey was conducted in this area, the broken stage was still visible and scattered. Here, flow depths were measured at 4.80 and 4.95 m around the stage (points F44 and F45, in Syamsidik et al., 2019b, respectively). Further landward, a flow depth as high as 2.30 m (F46) was still identified at about 120 m from the stage.
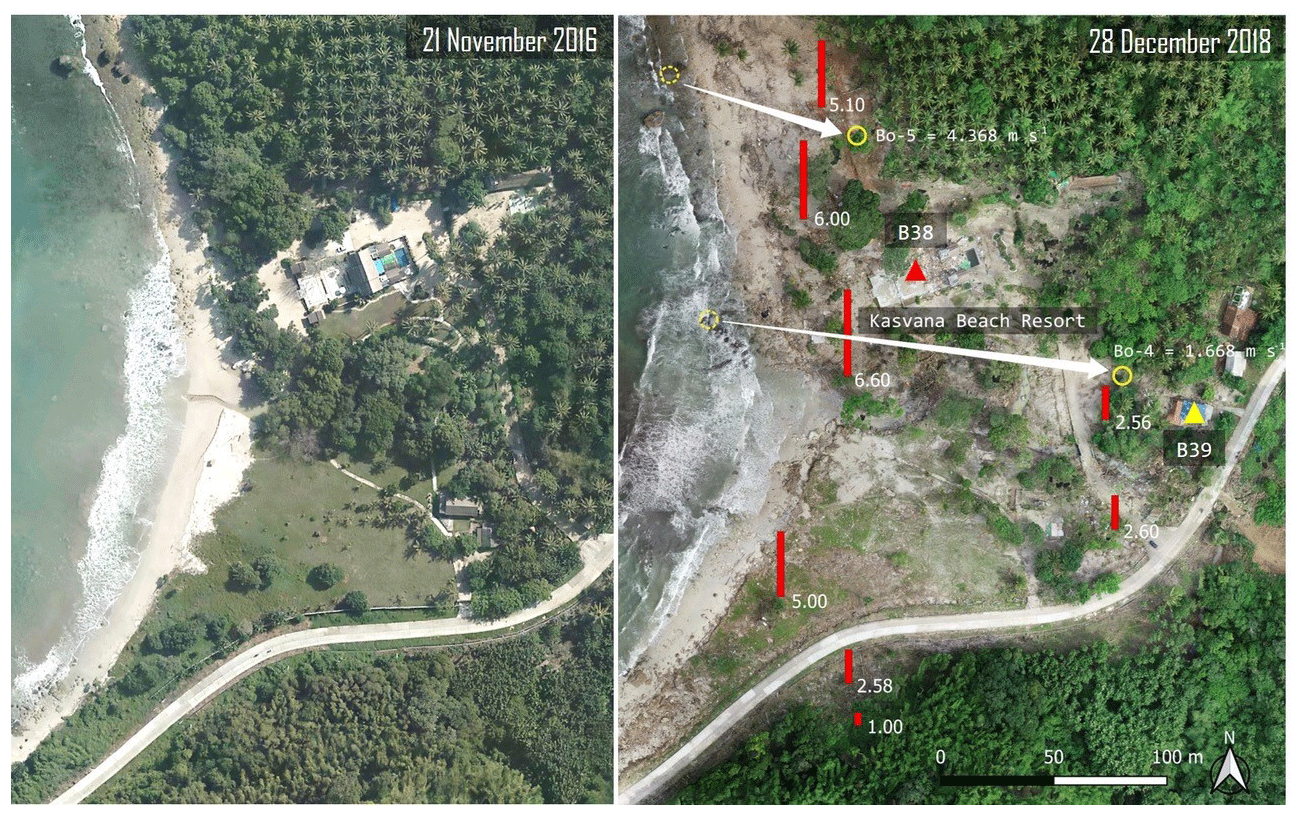
Figure 7The land destruction and flow depth distribution at Cipenyu Beach, Banten. Panel (a) is an image captured before the tsunami (from Google Earth). Panel (b) is an aerial view captured by drone on 29 December 2018.
Figure 7 shows conditions at Cipenyu Beach, located west of the Tanjung Lesung resort, comparing scenes before and after the tsunami. The figure also shows the distribution of tsunami flow depths. Although no significant residential area was found here, traces of the massive impacts of the tsunami could be identified at the Kasvana Beach Resort. Maximum flow depths around this resort were at 6.60 m (F47), identified from a broken branch of a Pandanus odorifer sp. tree. According to an interview with the resort staff, seven people died. They were guests and staff of the resort. Severe erosion was also seen along the coastline near the resort. The deadly force of the tsunami wave was also revealed by a large tsunami boulder (Bo-5), which was found around 87 m from its initial source (see Fig. 8). The boulder's origin was based on eyewitness interviews stating that the boulder was at the beach area close to the resort before the tsunami. Another tsunami flow depth mark close to the boulder was measured at 5.10 m (point F54 in Syamsidik et al., 2019b). The topography around the area was relatively flat. Based on Eq. (1), it is inferred that the minimum velocity that transported the boulder was about 4.37 m s−1.

Figure 8The largest boulder found in Cipenyu Beach of Banten was transported about 87 m from its original place. An arrow shows the estimated transport direction of the boulder with an estimated velocity of 4.37 m s−1, captured on 28 December 2018.
At Sumur, to the southwest of Cipenyu, another zone of significant damage was observed. Although the population is lower than it is to the north of this area, visible tsunami traces could be identified from uprooted trees and fallen electrical poles. A steep coastal slope made it easier to locate tsunami flow depths and the limit of the tsunami inundation. Maximum run-up in this area was measured at 14.90 m from mean sea level. Maximum run-up was identified from debris apparently carried by the tsunami flow. At the village of Cisiih, the flow depth was measured at 5.85 m (point F59 in Syamsidik et al., 2019b).
The Sumur sub-district was the most affected sub-district at the southern part of Banten coast. This sub-district was isolated for about 3 d after the tsunami due to massive damage to roads and bridges connecting the sub-district to other areas. According to interviews with eyewitnesses, they experienced two tsunami waves, where the second wave was the largest and the most destructive one. Before the first wave, residents heard a roaring sound from the sea that motivated most of the them to evacuate to higher ground. The residential area in this sub-district is situated very close to the sea. Some of the houses were located immediately behind a seawall. Tsunami flow depth was measured at 4.75 m a.g.l. (metres above ground level; point F60 in Syamsidik et al., 2019b). This point is located about 40 m from the seawall. A higher tsunami flow depth, measured at 5.25 m (F61), was also found in this sub-district. Most houses in this area were semi-permanent-type houses, where impacts of the tsunami waves on the houses were severe. The tsunami inundation limit was measured at 155 m from the coastline.
After Sumur, a survey was performed at the Kertajaya sub-district, which was the last survey area in Banten. Tsunami impacts were investigated carefully at the Cinibung Resort. Here, flow depths were between 2.25 and 3.15 m. The survey in Banten was completed on 30 December 2018, 8 d after the tsunami.
4.2.2 Lampung
South Lampung district
Impacts of the tsunami generated by the Mount Anak Krakatau eruption in Lampung were measured three locations, i.e. two areas in South Lampung and one area in the district of Tanggamus. South Lampung was the most tsunami-affected area at the Lampung coasts. In South Lampung, impacts of the tsunami were found to be significant in the Kalianda and Rajabasa sub-districts. Three villages in Kalianda were selected for detailed investigations, namely Waykiayi, Wayurang and Maja. Distributions of tsunami flow depths in Kalianda can be seen in Fig. 9.
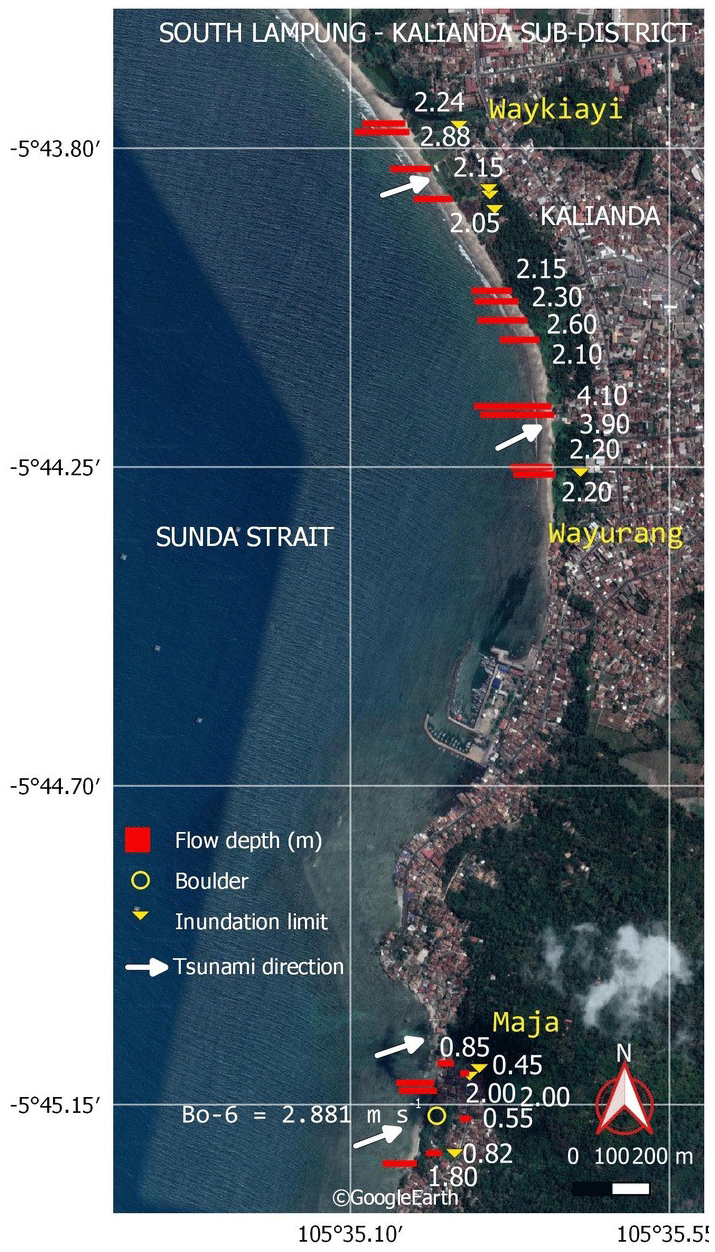
Figure 9Flow depth distribution and run-up limits in Kalianda, South Lampung. Green bars and yellow triangles represent flow heights and inundation limits measured at the locations, respectively. (The base map was adapted from Google Earth.)
Impacts of the tsunami on Rajabasa were worse than those on Kalianda. We surveyed three villages in this sub-district, namely the villages of Waymuli, Kunyir and Batu Balak. Measured tsunami flow depths in this area were between 2.0 and 4.5 m, as can be seen in Fig. 10. This is a fishing community, and the majority of the coastal area is a residential area for the fishermen. Other related buildings, such as a shrimp hatchery, were also damaged by the tsunami.
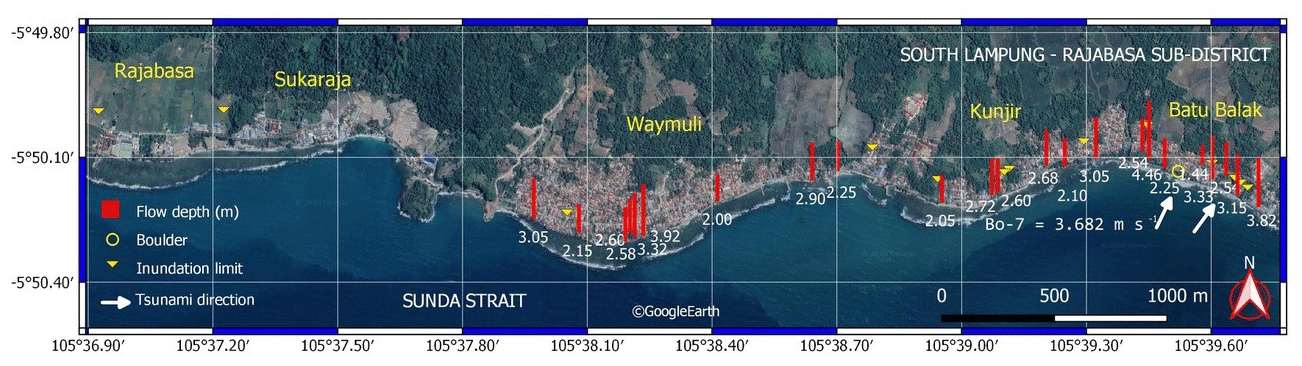
Figure 10Flow depth distribution and run-up limits in Rajabasa, South Lampung. (The map was adapted from Google Earth.)
Figure 11 shows an aerial view of the damage caused by the tsunami in the villages of Batu Balak and Kunyir. At the hatchery plant, tsunami flow depth was measured at 3.82 m a.g.l. (point F88 in Syamsidik et al., 2019b). An elementary school in Kunyir located close to the coastline sustained massive damage. At this school, tsunami flow depth was measured at 3.33 m (point F91). The tsunami inundation limit was located 160 m from the coastline. Although Kunyir was protected by a revetment structure with a crown 2.5 m a.m.s.l. (metres above mean sea level), it could not protect the area from the tsunami. On the revetment, tsunami flow depth was at 2.10 m, based on a tree mistakenly located on top of the structure. In Waymuli, the highest tsunami flow depth was 3.92 m (point F105).
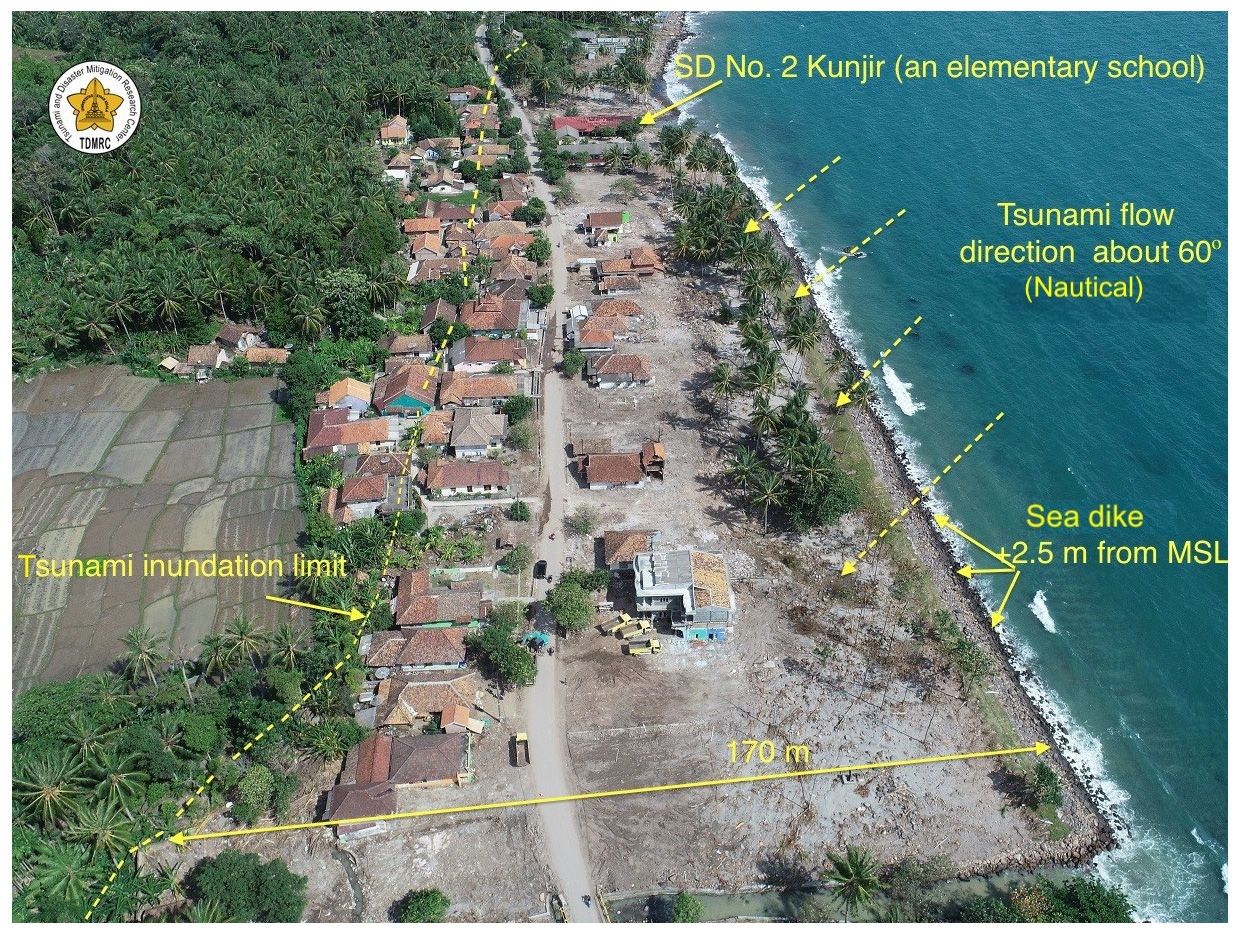
Figure 11An aerial view from tsunami-affected area around the villages of Batu Balak and Kunyir, Lampung, captured on 31 December 2018 (MSL – mean sea level).
In general, the majority of the Waykiayi coastal residential community was deserted. Although tsunami flow depth was as high as 2.00 m and could still be found at an area about 100 m from coastline, not much major damage to buildings was identified. Nonetheless, some houses that were located around the coastal area were demolished by the tsunami wave, leaving floors as the only visible elements of the houses remaining. In the village of Wayurang, some houses were completely destroyed by the tsunami. A tsunami flow depth of 3.90 m was measured by one broken tree branch in the coastal area (point F78 in Syamsidik et al., 2019b).
The coastal area of the village of Maja is a residential fishing village. A seawall was constructed to protect the houses from high waves generated from the Sunda Strait. The highest tsunami flow depth was 2.0 m a.g.l. (F70 and F71), measured at a house close to the seawall.
Tanggamus district
In the district of Tanggamus, Lampung, impacts of the tsunami were less severe. The only place where a casualty was reported was at Teluk Kiluan of the Kelumbayan sub-district. This bay is located about 79 km to the west of Bandar Lampung, the capital city of the province of Lampung. The distribution of flow depths and flow directions at Teluk Kiluan of Tanggamus can be seen in Fig. 12. Along the bay, there are three villages where tsunami impact was measured, namely Sinar Agung, Sinar Maju and Bandung Jaya. Measured tsunami flow depths were 1.46, 1.15 and 1.84 m at the villages of Sinar Agung, Sinar Maju and Bandung Jaya, respectively (see points F114, F111 and F116 in Syamsidik et al., 2019b). The most severe impact in this area was investigated at a wooden elevated house that was transported about 3.5 m from its original location. A lone casualty was found at this location. Here, tsunami flow depth was 1.05 m (point F115). Other damage was found at an elevated wooden house at the northeastern part of the bay. Based on eyewitness interviews, damage was caused by the reflected tsunami wave after hitting the closed end of the bay.

Figure 12Tsunami flow depths distribution in Teluk Kiluan, Lampung. An arrow represents the tsunami wave direction reflected from the close end of the bay. (The map was adapted from Google Earth.)
4.3 Building damage
Most buildings in the surveyed areas can be classified into two types, namely confined masonry and wood. Wall components were brick. Roofs were wooden-framed, with either tiled or zinc roofing. Detailed investigation of building damage was performed at 98 sites, including the remaining houses and one school. Seventy-three of them were non-engineered, lightly reinforced concrete houses or confined masonry (CM), and 25 were wooden timber. There were 16 CM-type houses as classified by DS0. Impacts of tsunami debris were minor at houses near the coastline. Some tsunami debris was found to have contributed to house damage, although most of the CM-type houses were mostly unaffected. Large debris was found at hotel complexes in Banten, where cars were carried by the tsunami flow and stopped by vegetation around the complexes. Damage to CM walls was mostly due to impulse or punching force produced by the tsunami flow. Unlike cases with tectonic events, shear cracks on walls due to lateral forces were not found. Damage to columns was observed as collateral failure of walls combined with impacts of hydrodynamic forces. Figure 13 shows completely destroyed houses (DS4), where their types and material composition were known; these were also directly within tsunami flow depths as measured around the houses. Due to the limited number of surveyed houses, the fragility function was analysed using CM-type houses. A summary of the fragility functions analysis is given in Table 2. Fragility curves for all four types of damage can be seen in Fig. 14.
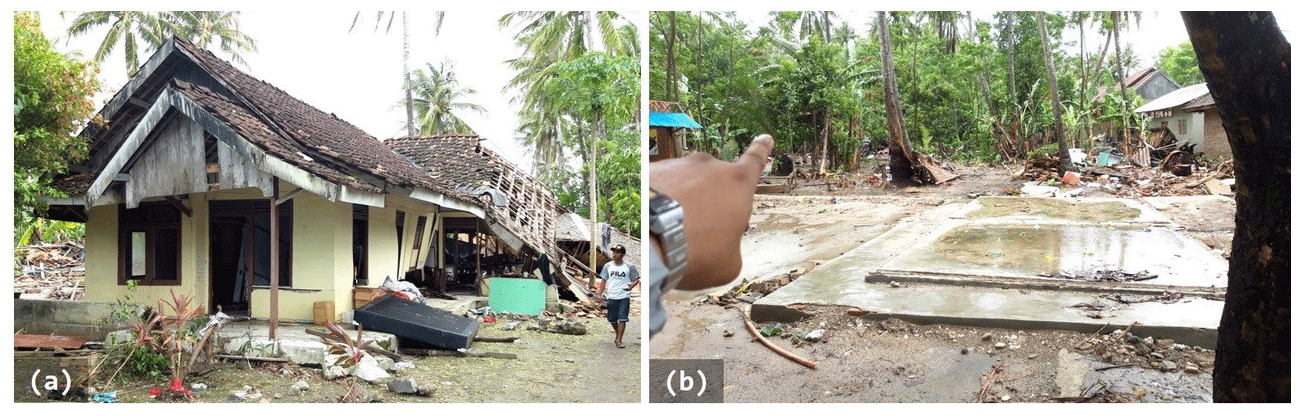
Figure 13Examples of damage at wooden houses: (a) major damage and (b) complete damage or washed away.
Table 2A summary of damage conditions of CM-type houses due to impacts of the 2018 Mount Anak Krakatau tsunami.
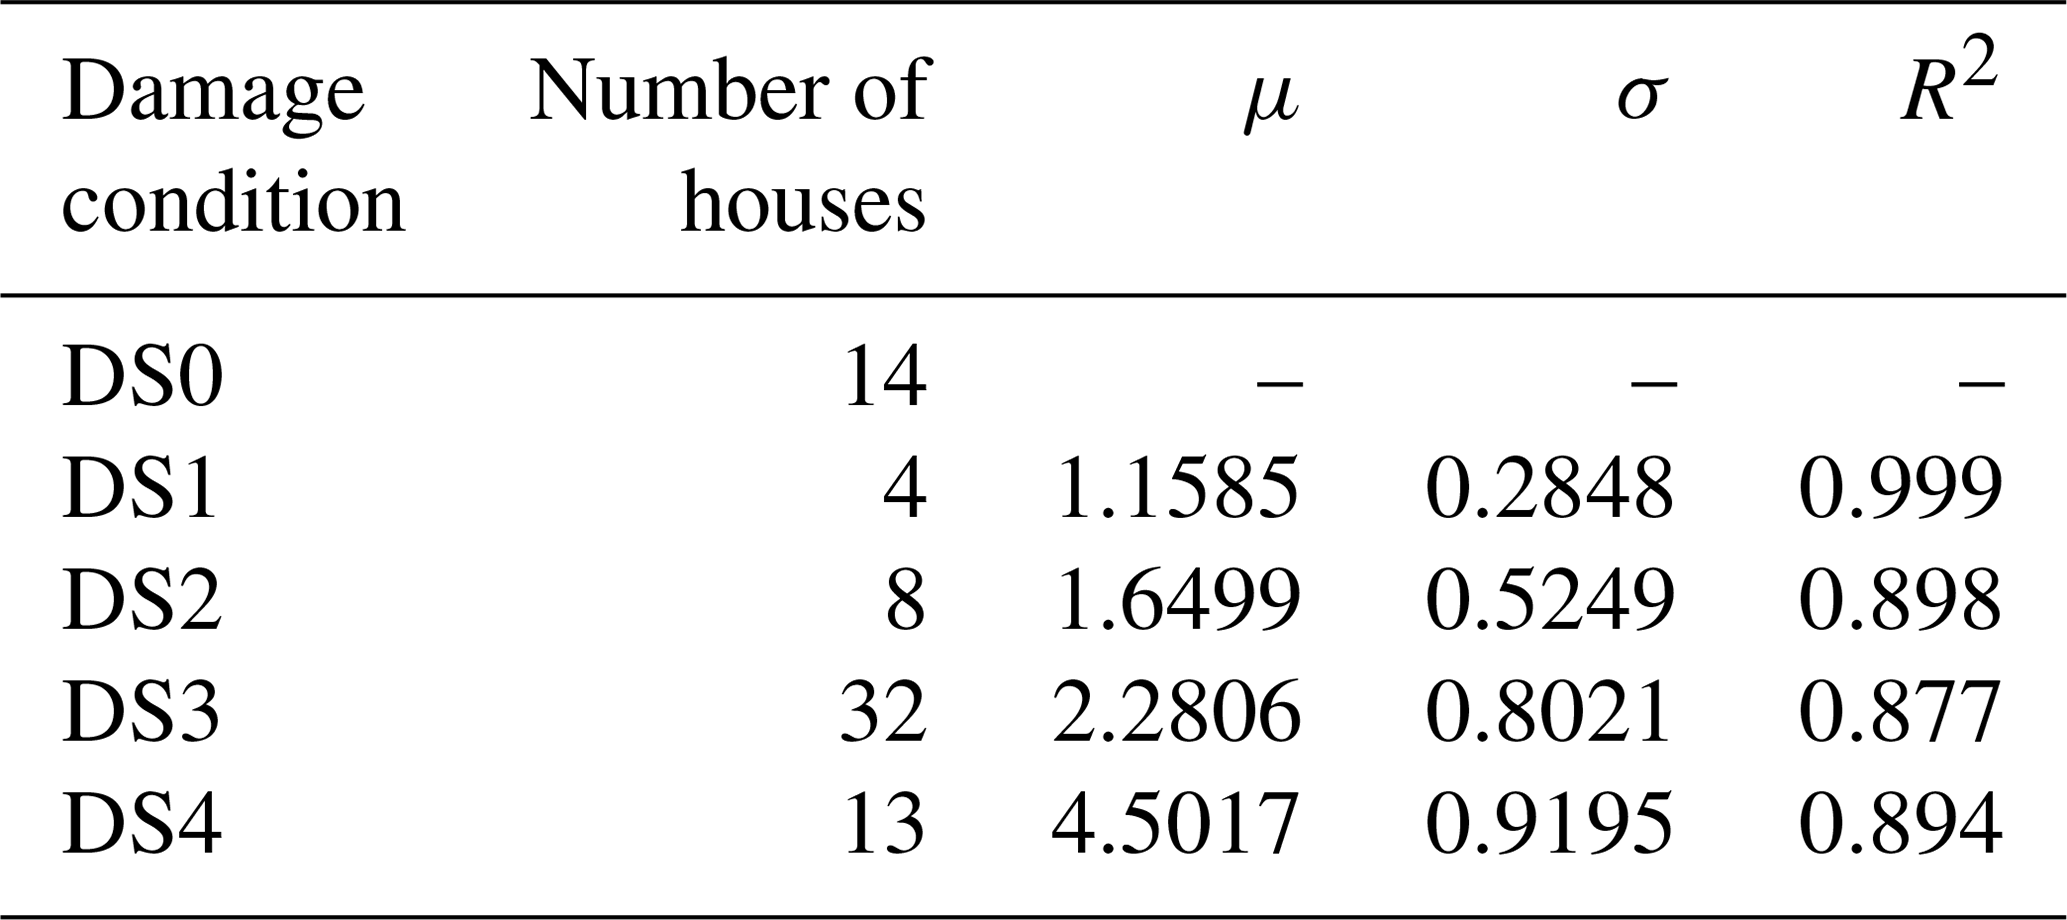
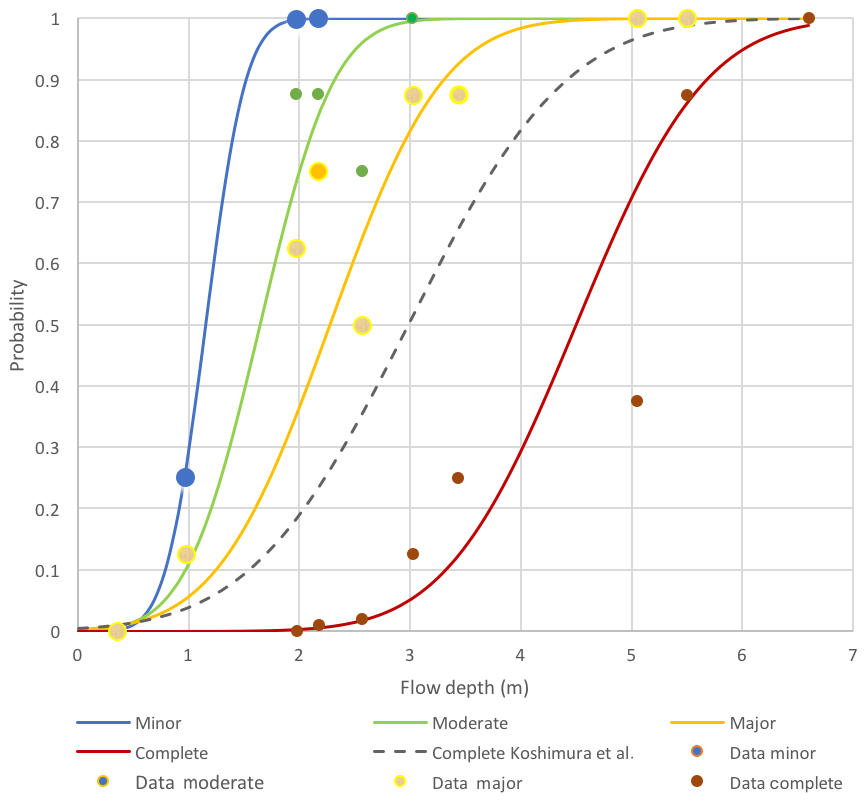
Figure 14Fragility curves of confined-masonry-type houses, as impacts of the 2018 Mount Anak Krakatau volcanogenic tsunami. Dashed line represents a complete damage fragility curve produced by Koshimura et al. (2009).
Fragility curves in Fig. 14 reveal that the absolute damage due to the tsunami waves occurred at a flow depth of 6.5 m. Lower probabilities of complete damage were found in this study compared to the 2004 Indian Ocean tsunami in Banda Aceh (Koshimura et al., 2009). These findings were significantly different from the 2018 Palu tsunami (Paulik et al., 2019), where earthquake and liquefaction (liquefied gravity flows) also contributed to the damage (Sassa and Takagawa, 2019).
There were 25 wooden houses surveyed in the affected area. Due to the limited number of surveyed wooden houses, analysis of the damage was performed by classifying the damage as seen in Table 1. Only three classifications of damage could be identified, namely DS2, DS3 and DS4; 2 houses could be classified as DS2, 7 houses were DS3, and 19 houses were DS4. Examples of the damage found at wooden houses due to tsunami impacts can be seen in Fig. 13. Based on the number of surveyed wooden houses, it was found that a tsunami flow depth higher than 2.0 m could have completely washed away the houses, provided there was no debris in the flow. If the tsunami flow contained debris, the limit of the tsunami flow depth that could wash away a house was lower. In cases where the flow depths were lower than 2.0 m, damage was found to be due to failure of the bottom plates of the walls. Similar investigations of the impacts of tsunami bores on wooden walls were completed by Linton et al. (2013) and Wilson et al. (2009). They revealed that (1) the tsunami flow at the foundations beneath the walls could generate an uplifting force and (2) if the wave broke near the wooden structure, it also increased loading. Although the location of the tsunami breaking wave in the 2018 Mount Anak Krakatau tsunami remains unknown, the pattern of damage to the lower parts of the wooden walls was similar to that in these studies.
5.1 Flow depths and arrival time
In Banten, tsunami flow depths were found to be higher than those measured in Lampung on the Sumatra side. Although Mount Anak Krakatau is nearly equidistant to the Lampung and Banten coasts, flow depths were apparently higher in Banten. Furthermore, impacts of the tsunami were more severe on the Banten coasts. As the event was caused by a non-tectonic process at night, a large number of people fell victim to the unavailability of tsunami warnings that could have anticipated a volcanogenic tsunami. Significant flow depth decay found in this study was similar to that found during the 2002 Stromboli tsunami, as these were typical landslide tsunamis (Tinti et al., 2006; Okal and Synolakis, 2003).
The volcanogenic tsunami is a discernible event. There have been hundreds of tsunami events recorded in Indonesia since the 16th century, with only 11 % generated by a volcanic eruption (Latief et al., 2000; Puspito and Gunawan, 2005; Løvholt et al., 2012; Pribadi et al., 2013). The 22 December 2018 Sunda Strait tsunami was an apparent unanticipated event caused by the southwest flank failure of Mount Anak Krakatau. There was no proper warning released by the authorities, as the present tsunami warning system cannot anticipate non-tectonic tsunamis, as in the case of the 2018 Sunda Strait tsunami. Furthermore, tsunami arrivals were presumably on short notice. As in the case of the 2002 Stromboli volcanogenic tsunami, arrival times were 6 min at a distance similar to that of the 2018 Mount Anak Krakatau tsunami (Bonaccorso et al., 2003). This problem was evident during the 28 September 2018 tsunami event (Syamsidik et al., 2019a; Takagi et al., 2019). Following the 2018 Mount Anak Krakatau tsunami, the government of Indonesia has been planning to install a number of tidal gauges to monitor water elevation around the volcano complex associated with tsunami wave generation. Nonetheless, it should be noted that, despite the installation, it will still be difficult to detect tsunami waves with this method without other supporting sensors. This was proven in the case of Mount Stromboli in Italy (Tinti et al., 2003).
To anticipate tsunamis on the Banten coast, there is one official escape building in Labuan. It is located about 420 m from the coastline. During the 22 December 2018 event, this building was used by the community as a shelter despite being far from the affected area. The port of Labuan was hit by a tsunami wave at 1.10 m. There was no major damage found at this location. The location of the tsunami escape building in Labuan needs to be reconsidered, and further steps are required to properly accommodate the tsunami evacuation process. Lessons learned from tsunami escape buildings in Aceh and coastal settlements after the 2004 Indian Ocean tsunami should be taken into account (see McCaughey et al., 2017; Syamsidik et al., 2017).
5.2 Characteristics of building damage
Damage to buildings and houses was more severe in Banten than in Lampung. Most of the damage was found in wall components. As the majority of buildings in Banten and Lampung were constructed with brick walls, the masonry-infill walls had a 50 % probability of damage when tsunami flow depth reached 2.3 m and would certainly have experienced major damage had the flow depth reached 5.05 m. Unlike damage found in the cases of tectonic tsunamis, diagonal cracks in the buildings resulting from lateral forces were not found. The CM-type house would be completely washed away by the tsunami when flow depth reached 6.6 m. These findings demonstrated a slightly different pattern compared to tectonic tsunamis (Koshimura et al., 2009; Paulik et al., 2019). It is worth noting that the latter two studies examined a combination of tectonic and tsunami forces. Damage could even start when the flow depth has yet to reach its maximum level (Suppasri et al., 2019). A lower flow depth that could cause complete damage to the CM-type house was shown by Shoji et al. (2014). However, this was a non-probabilistic study, with only 25 sample houses observed. In the case of the 2018 Mount Anak Krakatau tsunami, the wavelength could have been shorter, as this was similar to a landslide-driven tsunami. This would have generated a smaller impulsive force on buildings. Therefore, this could also be a further explanation for the difference in fragility curves derived from the 2004 Indian Ocean tsunami compared to the 2018 Mount Anak Krakatau tsunami.
No building was overturned by the tsunami wave as in the case the 2011 Tōhoku earthquake and tsunami (Yeh et al., 2013; Latcharote et al., 2017). This proved that the damage to the buildings was generally due to impact and drag forces. Debris-laden flow forces did not impact most of the damaged houses located close to the coastline. Hydrodynamic forces decreased as the speed of the wave decreased due to the roughness coefficient of the land use types (Saatçioğlu et al., 2006). A specific case was found at the Mutiara Carita Cottages (see Figs. 5 and 6). Here, the force became larger when gaps between buildings were smaller. This was also found in some cases in Banda Aceh during the 2004 Indian Ocean tsunami (Triatmadja and Benazir, 2014). Debris generated mostly by the fronts of buildings facing the tsunami wave caused severe damage to other buildings downstream of the tsunami flow.
5.3 Limitations of the study
Limitations of this study can be attributed to several aspects. The first limitation was that the time of the tsunami generation from the Mount Anak Krakatau was still unknown when this article was submitted. There was no tidal gauge or sensor placed around the volcano complex that could have detected the first generation of the tsunami wave near the source. The second limitation was that the volcanic mechanism that generated the tsunami is still not known. There are four mechanisms that could have potentially generated the tsunami, such as underwater explosion, flank failures (landslide), pyroclastic flow and volcano crest collapse. The most likely process that generated the 2018 Mount Anak Krakatau tsunami was the last one. This is based on aerial images captured before and after the tsunami. However, whether other mechanisms could also have contributed to the tsunami could not be verified at the time of publication. The third limitation was that estimation of the velocity was based on tsunami boulder transport, whereas the calculation was based on experimental formulae. This would result in an estimated tsunami velocity rather than a recorded velocity. Tsunami fragility curves were drawn based on a limited number of tsunami-affected houses. Additional explanation and figures from the surveys can be found in TDMRC (2018, 2019). Notwithstanding these limitations, this study conclusively revealed the impacts of a pure tsunami wave force on buildings and could be useful for further studies in tsunami engineering and mitigation.
The 2018 Mount Anak Krakatau tsunami provided new insights into tsunami damage mitigation. This study was mostly based on a series of field surveys to investigate the impacts of the 2018 Mount Anak Krakatau tsunami on two major affected areas, i.e. Banten and Lampung on the western Java coasts and southern Sumatra coasts, respectively. Starting the 10 d survey just 2 d after the tsunami offered the team a better opportunity to collect undisturbed tsunami evidence. The study's conclusions are as follows.
Tsunami flow depths were found to be higher in Banten than at Lampung. Arrival times were slightly faster in Banten than on the Lampung side, although it is important to note that the initial time of tsunami wave generation from the source is still unknown. Maximum velocity was about 4.37 m s−1, inferred from a tsunami boulder measured at Banten. The highest tsunami flow depth was 6.6 m, also measured on the Banten side.
Impacts of the tsunami on houses were inferred from fragility functions derived from CM-type houses. These houses had a 50 % probability of being washed away by the tsunami if the tsunami flow depth had reached 4.5 m. Furthermore, had the tsunami depth reached 2.3 m, the houses would have had a 50 % probability of sustaining major damage. Wooden houses were likely to be completely damaged by the tsunami if the flow depth were higher than 2.0 m.
Evacuation of the coastal community during the tsunami was difficult, as there was not a proper warning released before the first wave hit the area. The only sound that saved some people in Sumur, Banten, was a roaring sound coming from the Sunda Strait. Modification and enhancement of tsunami early warnings are required in order to anticipate a volcanogenic tsunami in future, as Mount Anak Krakatau should remain active and pose threats to the surrounding area.
As the majority of the houses in the coastal areas of Indonesia are CM-type houses, it is highly recommended to increase the quality of these structures, such as in the bounding strength between walls and tie beams or tie columns. In the case of purely tsunami force, this type of structure would likely perform better if stricter quality standards were met.
Data for this paper are stored at the Mendeley database and can be accessed freely at https://doi.org/10.17632/yyyvmxh8vg.1 (Syamsidik et al., 2019b).
S wrote the whole paper and conducted field surveys in Lampung. B led the survey team in Banten and Lampung and provided the map of the study area and some figures. ML assisted the field survey and helped to analyse drone images. AS provided some analysis on fragility curves and guided the paper writing. LKC was a research collaborator for the PEER research project.
The authors declare that they have no conflict of interest.
We gratefully thank the Partnership Enhanced Engagement in Research (PEER) Cycle 5, sponsored by the United States Agency for International Development (USAID) and National Academies of Sciences, Engineering, and Medicine of United States (NASEM) under research grant no. 5-395, “Incorporating climate change induced sea level rise information into coastal cities' preparedness toward coastal hazards” with sponsor grant award no. AID-OAAA-A-11-00012 and sub-award no. 2000007546. A visit of Anawat Suppasri (co-author of this article) to Banda Aceh and paper fine-tuning activities were performed under the World Class Professor Program (WCP) Scheme B, promoted by the Ministry of Research, Technology and Higher Education of Indonesia (KEMENRISTEKDIKTI) in 2019 (contract no. T/80/D2.3/KK.04.05/2019). At the same time, the first author would like to thank to Fumihiko Imamura, the director of the International Research Institute of Disaster Science (IRIDeS) of Tohoku University, for facilitating the writing residency programme for the completion of this paper. Anawat Suppasri also received financial support from Pacific Consultants Co., Ltd., during the writing of this article.
This research has been supported by USAID (grant no. PEER USAID AID-OAAA-A-11-00012 and sub-award no. 2000007546) and KEMENRISTEKDIKTI Indonesia (grant no. WCP B and no. T/80/D2.3/KK.04.05/2019).
This paper was edited by Ira Didenkulova and reviewed by two anonymous referees.
Bani, P., Normier, A., Bacri, C., Allard, P., Gunawan, H., Hendrasto, M., Surono, and Tsanev, V.: First measurement of the volcanic gas output from Anak Krakatau, Indonesia, J. Volcanol. Geoth. Res., 302, 23–241, 2015.
BIG (Indonesia National Geospatial Information Agency): http://tides.big.go.id:8888/dash/, last access: 23 December 2018.
BNPB (Indonesia Disaster Management Agency): The Sunda Strait Tsunami, update on 13 January 2019, available at: https://bnpb.go.id/publikasi/infografis/tsunami-selat-sunda.html (last access: 20 March 2019.
Boen, T.: Sumatra Earthquke Dec 26 2004. Earthquake Engineering Research Institute. California, USA, available at: https://www.eeri.org/~eeriorg/lfe/clearinghouse/sumatra_tsunami/reports/Boen_Sumatra Earthquake 26 Dec 2004.pdf (last access: 20 June 2019), 2005.
Bonnaccorso, A., Calvary, S., Garfield, G., Lotado, L., and Patane, D.: Dynamics of the December 2002 flank failure and tsunami at Stromboli volcano inferred by volcanological and geophysical observations, Geophys. Res. Lett., 30, 1941, https://doi.org/10.1029/2003GL017702, 2003.
Borrero C. J., Synolakis, C. E., and Fritz, H. M.: Northern Sumatra Field Survey after the December 2004 Great Sumatra Earthquake and Indian Ocean Tsunami, Earthq. Spectra, 22, 93–104, 2006.
Brzev, S.: Earthquake-resistant confined masonry construction. Master Thesis, British Columbia Institute of Technology, Burnaby, Canada, 2007.
Choi, B. H., Pelinovsky, E., Kim, K. O., and Lee, J. S.: Simulation of the trans-oceanic tsunami propagation due to the 1883 Krakatau volcanic eruption, Nat. Hazards Earth Syst. Sci., 3, 321–332, https://doi.org/10.5194/nhess-3-321-2003, 2003.
Deblus, C., Bonvalot,S., Dahrin, D., Diament, M., Harjono, H., and Dubois, J.: Inner structure of the Krakatau volcanic complex (Indonesia) from gravity and bathymetry data, J. Volcanol. Geoth. Res., 64, 23–52, 1995.
Donovan, A., Suppasri, A., Kuri, M., and Torayashiki, T.: The complex consequences of volcanic warnings: Trus, risk perception and experiences of businesses near Mount Zao following the 2015 unrest period, Int. J. Disast. Risk Re., 27, 57–67, 2018.
Emery, W. J. and Thomson, R. E.: Data Analysis Methods in Physical Oceanography, Elsevier, Amsterdam, the Netherlands, https://doi.org/10.1016/B978-0-444-50756-3.X5000-X, 2001.
Fyer, G. J.: Walk the inundation limit: A suggestion for future post-tsunami surveys, Earth-Sci. Rev., 107, 123–127, https://doi.org/10.1016/j.earscirev.2011.03.003, 2011.
Giachetti, T., Paris, R., Kelfoun, K., and Ontowirjo, B.: Tsunami hazard related to a flank collapse of Anak Krakatau Volcano, Sunda Strait, Indonesia, in: Natural Hazards in the Asia–Pacific Region: Recent Advances and Emerging Concepts, edited by: Terry, J. P. and Goff, J., Geological Society, London, Special Publications, 361, 79–90, https://doi.org/10.1144/SP361.7, 2012.
Gravina, T., Nicola, M., Luca, F., and Pierfrancesco, C.: Tsunami risk perception along the Thyrrhenian coasts of Souther Italy: the case of Marsili volcano, Nat. Hazards, 97, 437–454, https://doi.org/10.1007/s11069-019-03652-x, 2019.
GVP (Global Volcanism Program): Krakatau, Eruptive History, available at: http://volcano.si.edu/volcano.cfm?vn=262000, last access: 25 February 2019.
Koshimura, S., Oie, T., Yanagisawa, H., and Imamura, F.: Developing fragility functions for tsunami damage estimation using numerical model and post-tsunami data from Banda Aceh, Indonesia, Coast. Eng. J., 5, 243–273, 2009.
Latcharote, P., Suppasri, A., Yamashita, A., Adriano, B., Koshimura, S., Kai, Y., and Imamura, F.: Possible failure mechanism of buildings overturned during the 2011 Great East Japan tsunami in the town of Onagawa, Front. Built Environ., 3, 16, https://doi.org/10.3389/fbuil.2017.00016, 2017.
Latief, H., Puspito, N. T., and Imamura, F.: Tsunami Catalog and Zones in Indonesia, Natural Disaster Science, 22, 25–43, 2000.
Linton, D., Gupta, R., Cox, D., van de Lindt, J., Oshnack, M. E., and Clauson, M.: Evaluation of tsunami loads on wood-frame walls at full scale. Journal of Structural Engineering, J. Struct. Eng., 2013, 139, 1318–1325, https://doi.org/10.1061/(ASCE)ST.1943-541X.0000644, 2013.
Løvholt, F., Kuhn, D., Bungum, H., Harbitz, C. B., and Glimsdal, S.: Historical Tsunami and Present Tsunami Hazard in Eastern Indonesia and The Southern Philippines, J. Geophys. Res., 117, B09310, https://doi.org/10.1029/2012JB009425, 2012.
Macabuag, J., Rosetto, T., Ioannou, I., Suppasri, A., Sugawara, D., Adriano, B., Imamura, F., Eames, I., and Koshimura, S.: A proposed methodology for deriving tsunami fragility functions for buildings using optimum intensity measures, Nat. Hazards, 84, 1257–1285, https://doi.org/10.1007/s11069-016-2485-8, 2016.
McCaughey, J. W., Mundir, I., Daly, P., Mahdi, S., and Patt, A.: Trust and distrust of tsunami vertical evacuation buildings: extending protection motivation theory to examine choices under social influence, Int. J. Disast. Risk Re., 24, 462–473, https://doi.org/10.1016/j.ijdrr.2017.06.016, 2017.
Nandasena, N. A. K., Paris, R., and Tanaka, N.: Reassessment of hydrodynamic equations: Minimum flow velocity to initiate boulder transport by high energy events (storms, tsunamis), Mar. Geol., 281, 70–84, 2011.
Noormets, R., Crook, K. A. W., and Felton, E. A.: Sedimentology of rocky shorelines: 3. Hydrodynamics of megaclasts emplacement and transport on a shore-platform, Oahu, Hawai, Sediment. Geol., 172, 41–65, 2004.
Okal, E. A. and Synolakis, C. E.: A theoretical comparison of tsunamis from dislocations and landslides, Pure Appl. Geophys., 160, 2177–2188, https://doi.org/10.1007/s00024-003-2425-x, 2003.
Paris, R., Wassmer, P., Sartohadi, J., Lavigne, F., Barthomeuf, B., Desgages, E., Grancher, D., Baumert, P., Vautier, F., Brunstein, D., and Gomez, Ch.:Tsunamis as geomorphic crisis: lessons from the December 26, 2004 tsunami in Lhok Ng, west Banda Aceh (Sumatra, Indonesia), Geomorphology, 104, 59–72, 2009.
Paris, R., Fournier, J., Poizot, E., Etienne, S., Morin, J., Lavigne, F., and Wassmer, P.: Boulder and fine sediment transport and deposition by the 2004 tsunami in Lhok Nga (western Banda Aceh, Sumatra, Indonesia): A coupled offshore-onshore model, Mar. Geol., 268, 43–54, 2010.
Paulik, R., Gusman, A., Williams, J. H., Pratama, G. M., Lin, S.-L., Prawirabhakti, A., Sulendra, K., Zachari, M. Y., Fortuna, E. D., Layuk, N. B. P., and Suwarni, N. I. K.: Tsunami hazard and built environment damage observations from Palu city after the September 28 2018 Sulawesi earthquake and tsunami, Pure Appl. Geophys., 176, 3305–3321, https://doi.org/10.1007/s00024-019-02254-9, 2019.
Pribadi, S., Afnimar, Puspito, N. T., and Ibrahim, G.: Characteristics of Earthquake-Generated Tsunamis in Indonesia based on Source Parameter Analysis, J. Math. Fund. Sci, 45, 189–207, 2013.
Puspito, N. T. and Gunawan, I.: Tsunami Sources in The Sumatra Region, Indonesia and Simulation of The 26 december 2004 Aceh Tsunami, ISET Journal of Earthquake Technology, 42, 111–125, 2005.
PVMBG (Center of Volcanology Survey of Indonesia): A Press Release on Activity of Mount Anak Krakatau, available at: https://www.vsi.esdm.go.id/index.php/kegiatan-pvmbg/kegiatan-diseminasi-informasi/2829-press-release-aktivitas-vulkanik-g-anak-krakatau-31-desember-2019 (last access: 10 January 2019), 2018.
Saatçioğlu, M., Ghobarah, A., and Nistor, I.: Performance of Structures During the 2004 Indian Ocean Tsunami and Tsunami Induced Forces for Structural Design, Earthq. Spectra, 22, S295–S319, 2006.
Sassa, S. and Takagawa, T.: Liquefied gravity flow-induced tsunami: first evidence and comparison from the 2018 Indonesia Sulawesi earthquake and tsunami disasters, Landslide, 16, 195–200, https://doi.org/10.1007/s10346-018-1114-x, 2019.
Shoji, G., Shimizu, H., Koshimura, S., Estrada, M., and Jimenez, C.: Evaluation of tsunami wave loads acting on walls of confined masonry-brick and concrete-block houses, Journal of Disaster Research, 9, 976–983, https://doi.org/10.20965/jdr.2014.p0976, 2014.
Sigurdsson, H., Carey, S., and Mandeville, C.: Sub-marine pyroclastic flows of the 1883 eruption of the Krakatau Volcano, National Geographic Research and Exploration, 7, 310–327, 1991.
Spicak, A., Kozak, J., Vanek, J., and Hanus, V.: The Krakatau volcano 125 years after the catastrophic eruption (August 27, 1883), Stud. Geophys. Geod., 52, 449–454, https://doi.org/10.1007/s11200-008-0031-1, 2008.
Suppasri, A., Koshimura, S., and Imamura, F.: Developing tsunami fragility curves based on the satellite remote sensing and the numerical modeling of the 2004 Indian Ocean tsunami in Thailand, Nat. Hazards Earth Syst. Sci., 11, 173–189, https://doi.org/10.5194/nhess-11-173-2011, 2011.
Suppasri, A., Charvet, I., Imai, K., and Imamura, F.: Fragility curves based on data from the 2011 Great East Japan tsunami in Ishinomaki city with discussion of parameters influencing building damage, Earthq. Spectra, 31, 841–868, 2015.
Suppasri, A., Pakoksung, K., Charvet, I., Chua, C. T., Takahashi, N., Ornthammarath, T., Latcharote, P., Leelawat, N., and Imamura, F.: Load-resistance analysis: an alternative approach to tsunami damage assessment applied to the 2011 Great East Japan tsunami, Nat. Hazards Earth Syst. Sci., 19, 1807–1822, https://doi.org/10.5194/nhess-19-1807-2019, 2019.
Syamsidik, Oktari, R. S., Munadi, K., Arief, S., and Fajri, I. Z.: Changes in coastal land use and the reasons for selecting places to live in Banda Aceh 10 years after the 2004 Indian Ocean tsunami, Nat. Hazards, 88, 1503–1521, https://doi.org/10.1007/s11069-017-2930-3, 2017.
Syamsidik, Benazir, Umar, M., Margaglio, G., and Fitrayansyah, A.: Post tsunami survey of the 28 September 2018 tsunami near Palu bay in Central Sulawesi, Indonesia: Impacts and Challenges to Coastal Communities, Int. J. Disast. Risk Re., 38, 101229, https://doi.org/10.1016/j.ijdrr.2019.101229, 2019a.
Syamsidik, Benazir, and Luthfi, M.: Tsunami Flow Depths, Building Damages, and tsunami boulders Measured from the December 22, 2018 Sunda Strait Tsunami around Western Java and Southern Lampung of Indonesia, Mendeley Data, https://doi.org/10.17632/yyyvmxh8vg.1, 2019b.
Takagi, H., Pratama, M. B., Kurobe, S., Esteban, M., Aranguiz, R., and Ke, B.: Analysis of generation and arrival time of landslide tsunami to Palu city due to the 2018 Sulawesi earthquake, Landslides, 16, 983–991, https://doi.org/10.1007/s10346-019-01166-y, 2019.
TDMRC (Tsunami and Disaster Mitigation Research Center): The 2018 Sunda Strait Tsunami Impacts Assessment. Universitas Syiah Kuala, Banda Aceh-Indonesia, available at: http://tdmrc.unsyiah.ac.id/the-2018-sunda-strait-tsunami-impacts-assessment/, last access: 28 December 2018.
TDMRC (Tsunami and Disaster Mitigation Research Center): The Latest Update from Post-Sunda Strait Tsunami Survey. Universitas Syiah Kuala, Banda Aceh-Indonesia, available at: http://tdmrc.unsyiah.ac.id/the-latest-update-from-post-sunda-strait-tsunami-survey/, last access: 10 January 2019.
Tinti, S., Pagnoni, G., Zaniboni, F., and Bortolucci, E.: Tsunami generation in Stromboli island and impact on the south-east Tyrrhenian coasts, Nat. Hazards Earth Syst. Sci., 3, 299–309, https://doi.org/10.5194/nhess-3-299-2003, 2003.
Tinti, S., Maramai, A., Armigliato, A., Graziani, L., Manucci, A., Pagnoni, G., and Zaniboni F.: Observations of physical effects from tsunamis of December 30, 2002 at Stromboli volcano, southern Italy, B. Volcanol., 68, 450–461, https://doi.org/10.1007/s00445-005-0021-x, 2006.
Topex (Topogaphy Expriment of the Ocean): Extract xyz grid-topography or gravity, available at: https://topex.ucsd.edu/cgi-bin/get_data.cgi, last access: 20 June 2019.
Triatmadja, R. and Benazir: Simulation of tsunami force on rows of buildings in Aceh region after tsunami disaster in 2004, Science of Tsunami Hazard, 33, 156–169, 2014.
Williams, R., Rowley, P., and Garthwaite, M. C.: Reconstructing the Anak Krakatau flank collapse that caused the December 2018 Indonesian tsunami, EarthArXiv, https://doi.org/10.31223/osf.io/u965c, 2019.
Wilson, J. S., Gupta, R. G., van de Lindt, J. W., Clauson, M., and Garcia, R.: Behavior of a one-sixth scale wood-frame residential structure under wave loading, J. Perform. Constr. Fac., 23, 336–345, https://doi.org/10.1061/(ASCE)CF.1943-5509.0000039, 2009.
Yeh, H., Sato, S., and Tajima, Y.: The 11 March 2011 East Japan Earthquake and Tsunami: Tsunami Effects on Coastal Infrastructure and Buildings, Pure Appl. Geophys., 170, 1019–1031, https://doi.org/10.1007/s00024-012-0489-1, 2013.
Zen, M. T.: Growth and state of Anak Krakatau in September 1968, B. Volcanol. , 34, 205–215, https://doi.org/10.1007/BF02597786, 1970.