the Creative Commons Attribution 4.0 License.
the Creative Commons Attribution 4.0 License.
 | 04 Feb 2020
Processes culminating in the 2015 phreatic explosion at Lascar volcano, Chile, evidenced by multiparametric data
Thomas R. Walter
Stefan Bredemeyer
Martin Zimmer
Christian Kujawa
Luis Franco Marin
Juan San Martin
Claudia Bucarey Parra
Small steam-driven volcanic explosions are common at volcanoes worldwide but are rarely documented or monitored; therefore, these events still put residents and tourists at risk every year. Steam-driven explosions also occur frequently (once every 2–5 years on average) at Lascar volcano, Chile, where they are often spontaneous and lack any identifiable precursor activity. Here, for the first time at Lascar, we describe the processes culminating in such a sudden volcanic explosion that occurred on 30 October 2015, which was thoroughly monitored by cameras, a seismic network, and gas and temperature sensors.
Prior to the eruption, we retrospectively identified unrest manifesting as a gradual increase in the number of long-period (LP) seismic events in 2014, indicating an enhanced level of activity at the volcano. Additionally, sulfur dioxide (SO2) flux and thermal anomalies were detected before the eruption. Then, our weather station reported a precipitation event, followed by an increase in steaming and a sudden volcanic explosion at Lascar. The multidisciplinary data exhibited short-term variations associated with the explosion, including (1) an abrupt eruption onset that was seismically identified in the 1–10 Hz frequency band, (2) the detection of a 1.7 km high white-gray eruption column in camera images, and (3) a pronounced spike in SO2 emission rates reaching 55 kg s−1 during the main pulse of the eruption as measured by a mini-differential optical absorption spectroscopy (DOAS) scanner. Continuous carbon dioxide (CO2) and temperature measurements conducted at a fumarole on the southern rim of the Lascar crater revealed a pronounced change in the trend of the relationship between the CO2 mixing ratio and the gas outlet temperature; we speculate that this change was associated with the prior precipitation event. An increased thermal anomaly inside the active crater as observed in Sentinel-2 images and drone overflights performed after the steam-driven explosion revealed the presence of a ∼50 m long fracture truncating the floor of the active crater, which coincides well with the location of the thermal anomaly. This study presents the chronology of events culminating in a steam-driven explosion but also demonstrates that phreatic explosions are difficult to predict, even if the volcano is thoroughly monitored; these findings emphasize why ascending to the summits of Lascar and similar volcanoes is hazardous, particularly after considerable precipitation.
- Article
(16740 KB) - Full-text XML
-
Supplement
(337 KB) - BibTeX
- EndNote


Volcanoes possessing an identified region of shallow magma storage often allow the close monitoring of changes associated with deformation, seismicity and degassing activity, and data on all of these processes are highly beneficial for eruption forecasting or early-warning systems (Sparks, 2003). Nevertheless, many volcanic eruptions still occur without clear precursors, highlighting the need to further investigate the types of volcanoes generating such eruptions. For instance, unexpected and sudden phreatic eruptions occurred in 1979 at the Diëng Plateau (Le Guern et al., 1982) and in 2014 at Mt. Ontake (Oikawa et al., 2016), killing 142 and 64 people, respectively. Approximately 85 % of the phreatic explosions that occur worldwide are not followed by the extrusion of magma (Barberi et al., 1992). Thus, the occurrence of such surprising eruptions implies that the responsible processes and their scales are not easily detectable by conventional geophysical and geochemical instrumentation (Barberi et al., 1992). Volcano monitoring networks are commonly designed to detect precursor activity at depth, where the movement of magma causes detectable gravity changes, seismicity, deformation or degassing. Accordingly, eruptions that are associated with very shallow processes, such as phreatic explosions, are naturally difficult to monitor beforehand, since water steam explosions may occur spontaneously, as was identified during the phreatic eruptions at Bandai volcano (Yamamoto et al., 1999), Mt. Ruapehu (Christenson et al., 2010), Mayon volcano (Newhall et al., 2001), Aso volcano (Kawakatsu et al., 2000) and elsewhere (Barberi et al., 1992; Mastin, 1995). Most of the aforementioned volcanoes exhibit a steep morphology, high elevations and/or hazardous access conditions, and hence establishing conventional monitoring systems close to their craters is a challenging task.
Possible precursory signs of phreatic eruptions, if identified, generally occur with short notice and may manifest as seismic tremors (Martinelli, 1990), very long period (VLP) events (Jolly et al., 2010), inflation (Nakamichi et al., 2009), and/or changes in the gas chemistry and temperature of fumarolic emissions (de Moor et al., 2016) only minutes, hours or days prior to an eruption. The detection of such sudden changes requires monitoring by means of an instrument network close to the summit that combines different geophysical and geochemical techniques (Scarpa and Tilling, 2012).
Lascar, Chile (23∘22′ S, 67∘44′ W, 5590 m), is a steep volcano with relatively easy access that has repeatedly exhibited steam-driven explosions. The explosions at Lascar have scarcely been studied, and therefore little knowledge exists regarding whether these events are characterized by precursor activity. In an effort to better comprehend this hazardous type of eruption, a monitoring network was installed in 2010. A well-monitored volcanic explosion occurred in 2015, which is discussed in detail in this paper.
Lascar volcano, the most active volcano in northern Chile and within the Andean Central Volcanic Zone (Francis and Rothery, 1987; Gardeweg et al., 1998; Tassi et al., 2009), formed in association with the subduction of the Nazca Plate beneath the South American Plate (Jordan et al., 1983). This volcano is located in the Antofagasta region and lies approximately 17 and 34 km from the small towns of Talabre and Toconao, respectively, and 68 km from the touristic city of San Pedro de Atacama. Lascar is an andesitic–dacitic stratovolcano that consists of two overlapping cones, which are aligned ENE–WSW, and hosts five summit craters (Gardeweg et al., 1998) that partially overlap (de Zeeuw-van Dalfsen et al., 2017). Activity of Lascar is characterized by the continuous emission of volcanic gases, smaller steam-driven explosions, the generation of thick lava flows and the expulsion of major ash-loaded clouds during the climax of an eruption (Gardeweg et al., 2011).
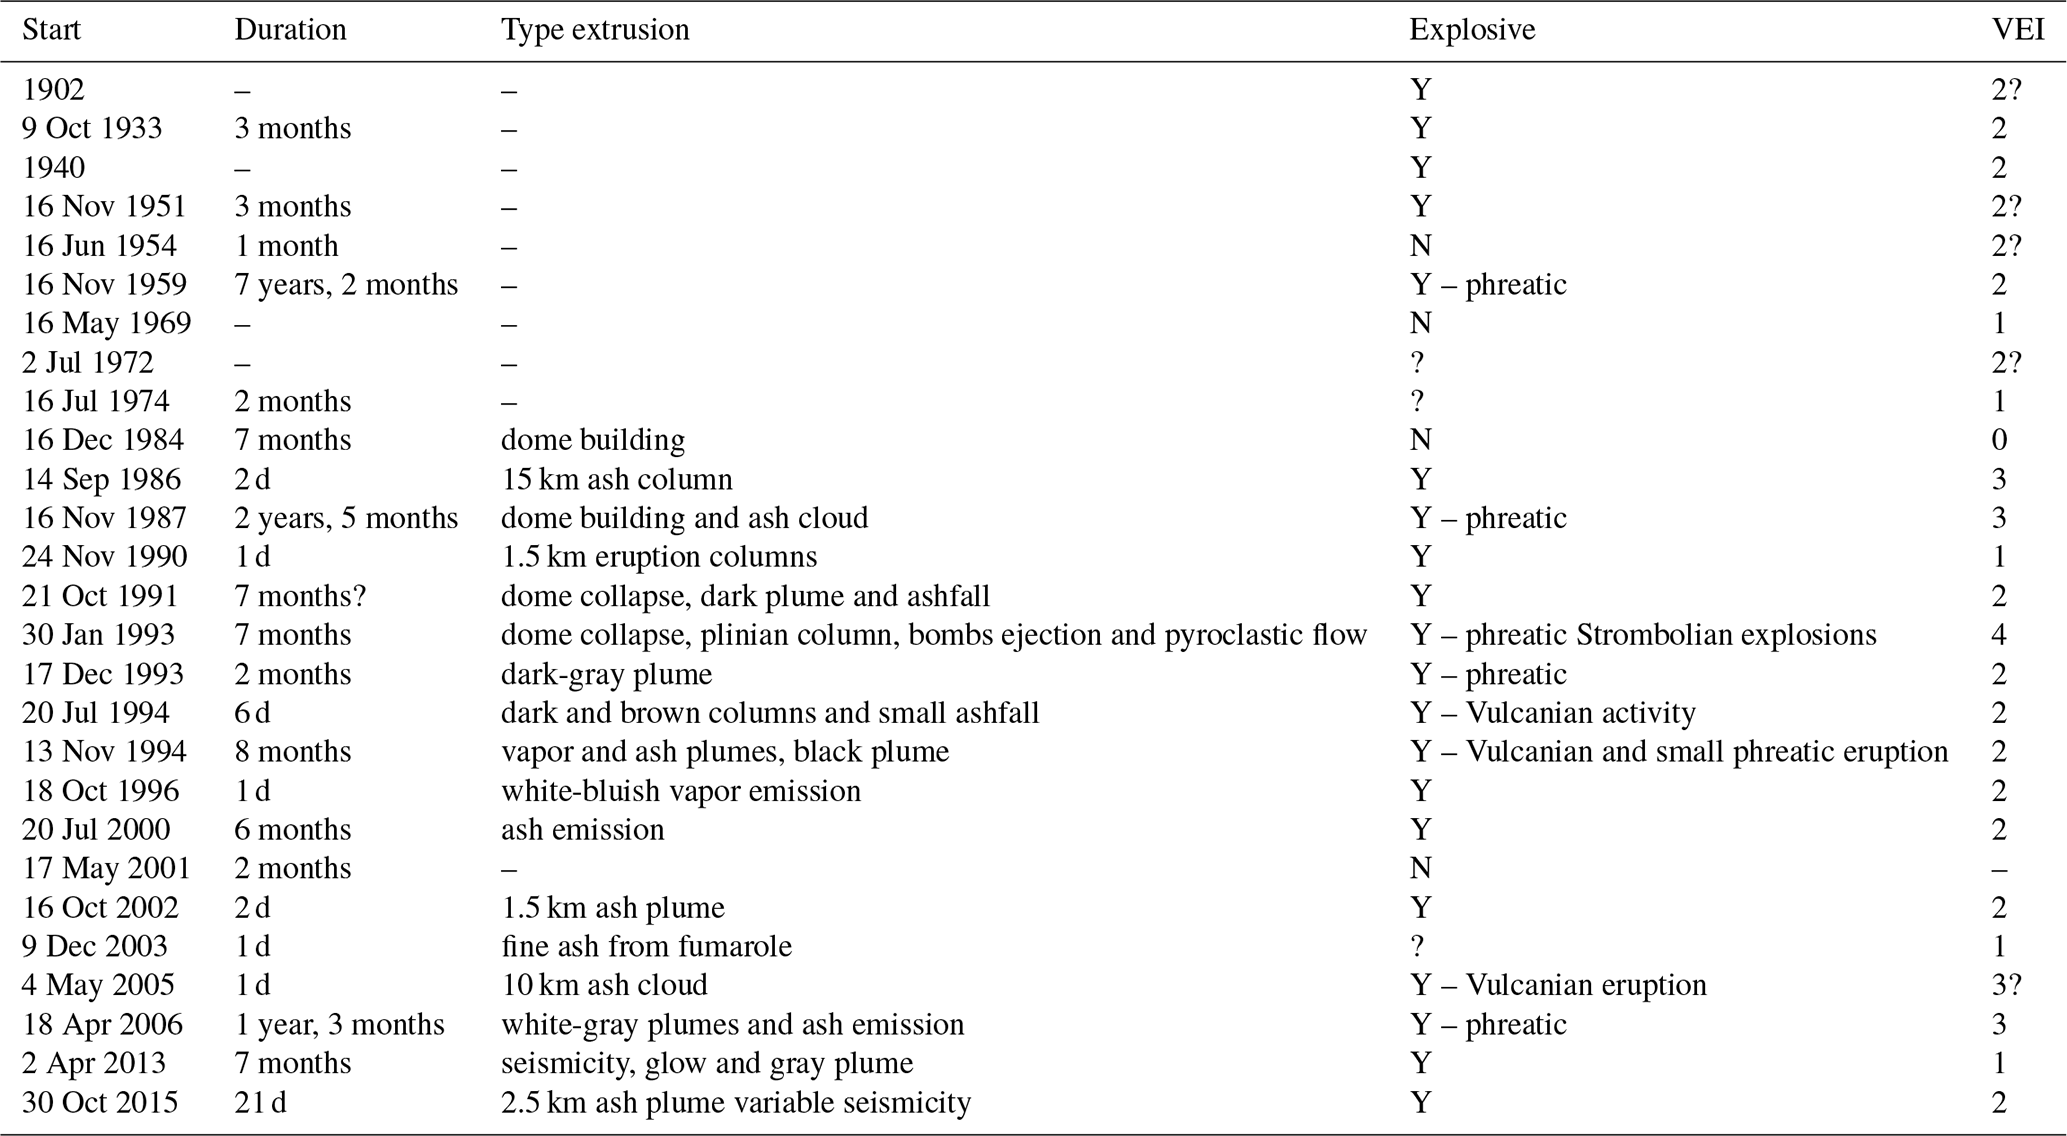
The historical record of Lascar's activity comprises approximately 27 eruptions, almost half of which have occurred in the springtime (mid-September to mid-December; see Table 1). The eruptions range from effusive to explosive events, often with phreatic characteristics and the ejection of gas, ash and debris kilometers high into the atmosphere. Additionally, dome building and collapse have been observed (for further details, see Table 1). The most recent large eruption had a volcanic explosivity index (VEI) of 4 and occurred on 19–20 April 1993 (González-Ferrán, 1995; Matthews et al., 1997; Siebert et al., 2010). The 1993 eruption was identified as the climax of a longer episode characterized by four cycles of activity initiating in 1984; each cycle was separated by explosive Vulcanian eruptions that commenced with minor phreatic activity until the cycle eventually culminated in a large explosion that ejected incandescent material into the air and produced plinian to subplinian eruption clouds (Matthews et al., 1997). By 1992, a lava dome was identified inside the active crater of Lascar; after the 1993 plinian eruption, a new dome with an andesitic–dacitic composition grew inside the crater (González-Ferrán, 1995). Smaller phreatic and Vulcanian eruptions followed in December 1993 and February 1994. The short-lived explosive eruption in December 1993 was accompanied by seismic activity with an intensity of 3 on the Modified Mercalli Intensity Scale (Global Volcanism Program, 1994). In contrast, the seismic activity associated with the other eruptions was only scarcely felt in the nearby village of Talabre at a distance of 17 km from Lascar (Global Volcanism Program, 1994), implying only low-magnitude seismicity. Following the 1993 eruptive cycle, historical reports document explosions every 2–3 years on average (Table 1), with a frequent occurrence of steam-driven explosions. This kind of explosion commonly occurred without any evidence of precursor activity (e.g., seismicity), due to either the lack of precursors or the lack of a sufficiently dense deployment of instrumentation.
Table 1Historical record of activity at Lascar volcano (Global Volcanism Program, 2013; González-Ferrán, 1995; Siebert et al., 2010).
This type of eruption is poorly understood for numerous potential reasons; among them, prior to 2010, ground-based monitoring studies were conducted only sporadically at Lascar and were restricted to only short-term (weeks to months) campaign-based fieldwork. Therefore, the preparation phases and periods preceding steam-driven explosions were not documented with adequate instrumentation. Remote sensing, on the other hand, was able to provide evidence distinguishing some unrest periods preceding notable events, such as the 2000 eruption, which was associated with a short-term reduction of thermal emission and a change in the dimensions of the dome area (Wooster, 2001). Similarly, satellite-based observations were employed to assess the dispersion of eruption products during the 2003 and 2005 unrest periods (Aguilera et al., 2006; Viramonte et al., 2006); unfortunately, these studies lacked the ability to identify precursors. Matthews et al. (1997) proposed a continuous deepening of the crater floor associated with a high rate of degassing from fumaroles within the active crater; this deformation was determined by an InSAR investigation (Pavez et al., 2006). Recent InSAR studies also showed that the deformation rate appeared to be largely unaffected by the most recent explosive eruptions in 2013 and 2015 (Richter et al., 2018).
Retrospectively, other studies have been able to identify precursory activity associated with unrest periods. Wooster (2001) described the rapid cooling behavior of the Lascar dome as precursor activity following the 1993 eruption, while a recent study of the 2013 explosion utilized seismic wave interferometry to depict variations in the seismic velocity and consequently speculated about the pre-eruptive deformation of a magmatic/hydrothermal reservoir (González et al., 2016). A shallow hydrothermal system as depicted by magnetotelluric and seismic data (Díaz et al., 2012; Hellweg, 2000) influences the degassing activity of Lascar (Bredemeyer et al., 2018; Tassi et al., 2009). These degassing processes have been suggested to be the source of the tremors observed during the 1994-1995 period of unrest (Hellweg, 2000), and they are probably associated with the increase in long-period (LP) events preceding an eruption (González et al., 2016).
Since the end of 2010, a volcano monitoring network has been gradually deployed around Lascar, providing a reliable database which allowed us to investigate the 2015 eruption. In an attempt to better understand the most recent and unexpected 2015 eruption, we compiled a multiparametric data set to study the details of the period preceding this eruption and describe the processes associated with this event. Our study also aspires to demonstrate why this type of volcanic hazard is generally so challenging to forecast.
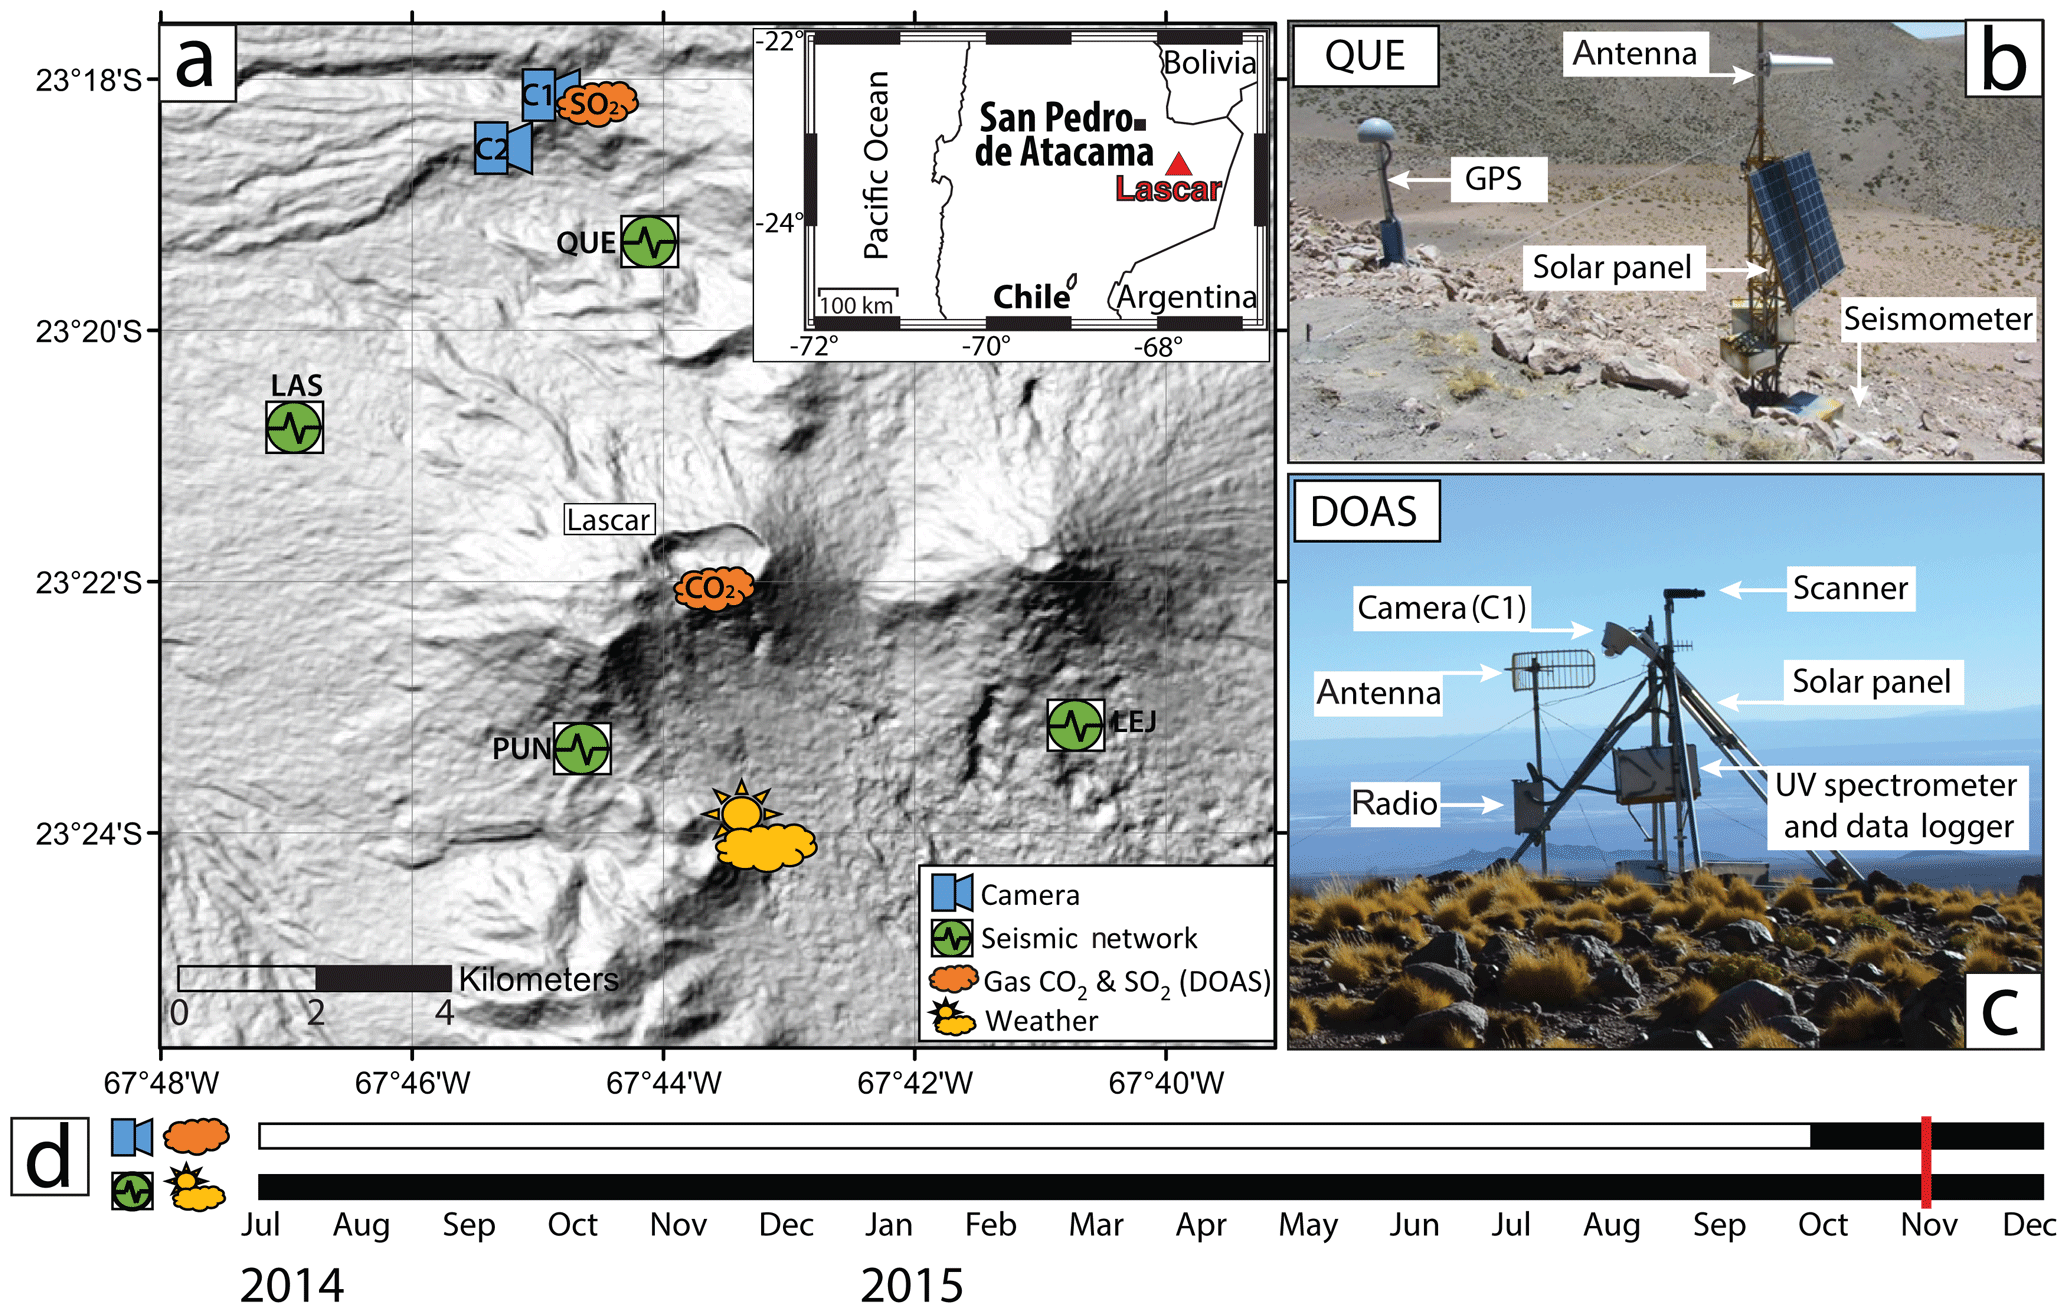
Figure 1(a) Locations of Lascar and the deployed equipment applied in this study. (b) Setup of the seismic station QUE. (c) Setup of the camera (C1) and the mini-DOAS station to measure SO2 emissions. (d) Time bars depicting the period analyzed in this study for each data set (shown in black). The red line indicates the eruption on 30 October.
Lascar has been monitored by a network consisting of broadband seismometers, fixed cameras, permanent gas monitoring equipment and a local weather station. Data from this network have been further complemented by satellite-based infrared observations and images of the crater acquired by an unmanned aerial vehicle (UAV). The locations of all ground-based stations and the period analyzed in this study are illustrated in Fig. 1. The data treatment and analysis methods implemented in this study focused on the temporal evolution of seismic volcano-tectonic (VT) and LP events, SO2 fluxes, CO2 mixing ratios, and temperatures of fumarolic emissions and changes in the brightness of these emissions, thermal changes in the crater, and changes in the surface features of the crater. The instrumentation, data and analysis methods are described in detail below.
3.1 Seismic monitoring
The network consists of five permanent seismic stations operated by the Observatorio Volcanológico de Los Andes del Sur (OVDAS), the national volcano observatory that continuously monitors over 40 active volcanoes in Chile. The OVDAS stations are equipped with broadband REF TEK 151-30A sensors and REF TEK 130B data loggers that record ground motions at a sampling rate of 100 Hz. Four of these five stations were used to study the evolution of seismicity in the period from July 2014 to December 2015, and their locations are illustrated in Fig. 1. However, as three of these stations stopped functioning before October 2015, only one seismic station was operational throughout the month of the eruption and was useful for assessing the timing and characteristics of the explosion, as well as for performing a simple event classification for October 2015 (station QUE; Fig. 1).
To investigate the evolution of seismicity at Lascar, we used the entire available earthquake catalog from the volcano observatory. The catalog was constructed by real-time scanning following Lahr et al. (1994) through visual classification performed by OVDAS analysts. The volcanic signals were classified according to their spectral content, harmonic signature, phase arrival times and event duration into one of six categories of signals observed at Lascar: VT, LP, VLP, volcanic tremor (TR), hybrid (HB) and explosion (EX) signals (Chouet, 1996). For our analysis, we considered VT and LP events because they were the most abundant events that occurred during the pre-eruptive phase. Although QUE was the only operational station during October 2015, it provided clear signal records with a sufficiently high signal-to-noise ratio (Gaete et al., 2019) to distinguish VT and LP signals on the basis of their characteristic spectral contents. Based on these data, we visualized the temporal evolution and characterized the precursor VT events and the eruption signal. This event analysis provided us with a fundamental overview of the stage of activity at Lascar volcano. For a more in-depth seismic analysis, the reader is referred to Gaete et al. (2019).
3.2 Camera data
Solar-powered time-lapse camera stations were installed at two fixed locations to take pictures of the volcanic edifice at regular time intervals. Cameras C1 and C2 look towards the northern flank of Lascar. C1 is a streaming webcam operated by OVDAS and is programmed to capture images at an interval of one image every minute (768 px×576 px resolution). Camera C2 is a high-resolution digital single-lens reflex (DSLR) camera (2048 px×1536 px resolution) installed by the GFZ and takes images at an interval of 60 min. Data from C1 and C2 (see Fig. 1 for their location) were used to assess the height and duration of volcanic plumes using a kymograph in conjunction with pixel brightness analysis, as explained below.
Vision-based techniques have revealed the value of video data in a variety of applications, such as in smoke and fire detection (Çetin et al., 2013; Healey et al., 1993; Verstockt et al., 2009). Camera-based monitoring networks have similarly become useful for observing plumes, lava movement and the ejection of particles during an eruptive episode (Brook and Moore, 1974; Chouet et al., 1974); in particular, the use of camera-based networks has increased dramatically in many fields of volcano research since the image quality and means of data transmission are continuously improving, thereby allowing nearly continuous monitoring (Orr and Hoblitt, 2008; Paskievitch et al., 2006; Salzer et al., 2016; Walter, 2011). Water vapor is the major component of gases emitted from volcanoes, and the brightness of a volcanic plume has been shown to increase with the upwelling of new magma (Girona et al., 2015). To analyze the pixel brightness and variations in gas plumes, we applied a correction using digital image correlation to ameliorate the shaking of the camera due to strong winds. Subsequently, we applied a masking operation to generate an image containing only the gas plume (see Fig. S1). Each of these images was converted to grayscale and then transformed into a matrix, the elements of which represent the intensity values. We summed these matrix elements and normalized the values by the matrix size to compute the total brightness of one image. The results provided a measure of the pixel brightness variations occurring within the gas plume at Lascar volcano. To analyze 2 months of data, we utilized daily images captured at noon, which is when the visibility of the gas plume is the clearest and the position of the sun is constant. To perform a more detailed analysis, we used images produced every hour. The pixel brightness can provide a useful visual constraint on the activity state of a volcano, even though the brightness alone may depend strongly on the position of the sun, presence and strength of condensation, and atmospheric conditions.
We further performed kymograph analysis by extracting the RGB values along a vertical line across the center of the volcano and displaying these values in a time series plot with a data point every minute. The coloration, timing, duration, and height of discrete gas emission pulses and eruption columns can be visualized with kymographs created in this fashion, and thus they have already been extensively used for the analysis of volcano video data in previous investigations (e.g., Munoz-Saez et al., 2015; Witt and Walter, 2017). A geometric conversion from the pixel scale to the meter scale was performed using the high-resolution Pleiades-1 digital elevation model presented by Richter et al. (2018). Due to the large distance from the cameras to the active volcano crater (6.75 and 6.42 km for C1 and C2, respectively), we applied a constant scaling factor to all pixels; thereafter, distortions arising from the lens, camera sensor or field of view were not considered.
3.3 Gas emissions
Measurements of the CO2 concentration and gas temperature were conducted at a low-temperature fumarole on the southeastern crater rim of Lascar volcano (Fig. 1). The gas temperature was monitored by means of thermocouples using an industrial platinum resistance temperature detector (RTD, PT 100, Labfacility, UK), and the CO2 concentration was measured by means of a Vaisala CARBOCAP® Carbon Dioxide Probe (GMP343, Vaisala Oyj, Finland). The data from both sensors were recorded at 1 min intervals with an ADL-MX Advanced Datalogger (Meier-NT GmbH, Germany). The analog digital converter has an accuracy of 0.01 %.
The CO2 sensor, which has an accuracy of ±5 ppm, was successfully used in Chile in a previous study to correlate volcanic activity with atmospheric changes (Zimmer et al., 2017). The temperature sensor, which can be applied in a range between −50 and +450 ∘C at an accuracy of ±0.06 ∘C, was inserted to a depth of ∼35 cm into the fumarole. Residual temperatures were calculated by subtracting the mean temperature from the actual reading.
Additionally, SO2 emission rates were remotely monitored using a scanning mini-differential optical absorption spectroscopy (DOAS) station deployed by OVDAS 6.75 km north of the active crater (Fig. 1); the mini-DOAS station yielded one complete scan across the gas plume every 5–15 min depending on the light conditions.
SO2 slant column densities (SCDs) along the viewing direction of the mini-DOAS scanner were retrieved in the wavelength range of 310–325 nm by means of DOAS (Galle et al., 2010; Platt and Stutz, 2008); the spectra measured inside the gas plume were compared with a gas-free spectrum and the pixel-wavelength-calibrated SO2 absorption spectrum from Vandaele et al. (1994), which was convolved with the slit function of the spectrometer. Furthermore, we incorporated an O3 absorption spectrum (Voigt et al., 2001) and a ring spectrum in the DOAS fit to avoid interference with absorption by ozone and scattering effects. Plume transport velocities and plume altitudes, which are required to calculate the gas flux from SO2 SCD profiles, were estimated using the wind speeds derived from archived weather data provided by the National Oceanic and Atmospheric Administration's (NOAA) Global Forecast System and using information obtained from pictures taken by the time-lapse cameras, respectively. The direction of plume transport was further determined by means of triangulation using the SCD profiles in combination with plume height estimates.
3.4 Thermal anomalies
To investigate thermal anomalies, we used satellite images acquired by Sentinel-2, an Earth-observation satellite from the European Unions (EU) Copernicus program. Sentinel-2 was launched on 23 June 2015 and became operational later in 2015; since August 2015, it has systematically acquired imagery of Lascar volcano at a high spatial resolution (up to 10 m). Sentinel-2 acquires multispectral data comprising 13 bands in the visible, near-infrared and shortwave infrared range of the electromagnetic spectrum. In this study, we utilized bands from the near-infrared part of the spectrum to ascertain the variations in the appearance and dimensions of the thermal anomaly inside the currently active crater of Lascar.
Here, we processed the Sentinel-2 data using the SNAP toolbox (S2TBX), which is freely provided by the European Space Agency (ESA), and we used the 12-11-8A band combination to derive a false-color RGB image representing the apparent temperature of the ground. These bands allow the perimeter of the thermal anomaly located inside the Lascar crater to be mapped and further reveal the presence (or absence) of snow at the volcano summit.
3.5 Aerial photography
UAVs were employed to obtain high-resolution nadir photographs of the Lascar crater, which is partially hidden from the human eye by the rim of the crater. Due to the high elevation of the volcano (>5500 m), the first successful drone flight, that is, the first drone that did not crash, was launched in November 2017. The motivation of this overflight was to determine the morphological features of the active Lascar crater. We used a DJI Mavic Pro Platinum quadcopter drone equipped with a 12 MP cropped-sensor camera (4000 px×3000 px 35 mm focal length, ISO 100), which was programmed to take images at an interval of 2 s, and the flight speed was 5 m s−1. The drone was launched from the southern rim of the active crater at 5502 m a.s.l. (above sea level), after which it was flown to an altitude of 5700 m a.s.l. and then over the crater in a northerly direction. From the 250 drone images acquired during the flight, we constructed a photomosaic and a hillshade using the structure from motion (SfM) workflow implemented in the Agisoft Metashape Professional software package. Over 20 000 tie points were identified for image matching, allowing us to generate a dense cloud consisting of over 7 million points; from this point cloud, a digital elevation model with a 20 cm resolution and an orthomosaic map with a 7 cm resolution were produced. As no ground control could be obtained, we relied on the geolocations of the DJI geotagged camera images only, leading to an apparent image error estimate of 0.6–1.3 m and a total error of 1.25 m.
3.6 Weather data
Hydrometeorological conditions were monitored by a weather station (Vaisala WXT520) located at the base of the volcano (Fig. 1); this station recorded the atmospheric pressure and temperature conditions, wind direction, wind speed, humidity, and intensity and accumulated amount of precipitation at a sampling rate of one measurement per minute. The data acquisition was temporally synchronized by means of a Global Positioning System (GPS) device, and the data were collected in the field by a Wi-Fi network and transmitted both to GFZ in Germany and to OVDAS in Chile.
We considered the intensity and accumulated amount of precipitation measured in a 1 min running average of rain and hail derived from samples acquired every 10 s. The rainfall is measured as the cumulative amount of water impacting on a 60 cm2 collecting area with a measurement range of 0 to 200 mm h−1, whereas hail is measured as the cumulative amount of hits against the collecting surface. This instrument is not designed to measure snowfall. The data were compared with the other observations to identify a rare precipitation event shortly before the 2015 explosion.
First, we describe the gradual changes leading up to the eruption; second, we document the changes associated directly with the eruption; and, finally, we discuss the data retrieved in the aftermath of the eruption.
4.1 Gradual changes prior to the eruption
We analyzed the seismic catalog over the period from July 2014 to December 2015 to obtain an overview of the activity preceding the eruption at Lascar (Fig. 2a). In total, 1654 LP events (purple dots in Fig. 2a) and 47 VT events (green stars in Fig. 2a) were identified during this observation period. A gradual increase in the number of LP events started in October 2014, i.e., approximately 1 year before the eruption. This increase in LP events was not associated with any relevant changes in the VT event rate. The peak in the LP event rate was found during April–July 2015, i.e., approximately 3–6 months before the eruption. In these months, the LP activity declined from ∼11 events to ∼1 event per day. At the same time, the persistent thermal anomaly on the crater floor observed in the Sentinel-2 imagery gradually decreased in both size and intensity (Fig. 3a and c), confirming an apparent decrease in thermal activity.

Figure 2(a) Temporal evolution of seismicity characterized by LP (purple dots) and VT (green stars) events, and precipitation events from July 2014 to December 2015. Cumulative LP events show a permanent increase starting 1 year before the eruption and a slight decrease 3 months before the eruption. VT events do not show any evolution pattern but cluster around the eruption. P1–P3 represent three exceptionally strong precipitation events that occurred during the study period; P3 is the suggested trigger of the eruption. (b) Seismic record from 30 October 2015. The red box indicates the window covered in (c) and shows the VT (i, ii, iii, v green arrows) and LP events (iv purple arrow) preceding the eruption and the eruption signal (vi blue arrow). (c) Spectrogram depicting the frequency band covered by the VT and LP events as well as the eruption tremor. The events that occurred early in the morning outside the red box in (b) are regional tectonic events located more than 100 km away from the volcanic area; therefore, there is no certainty that they could have affected the volcanic system.
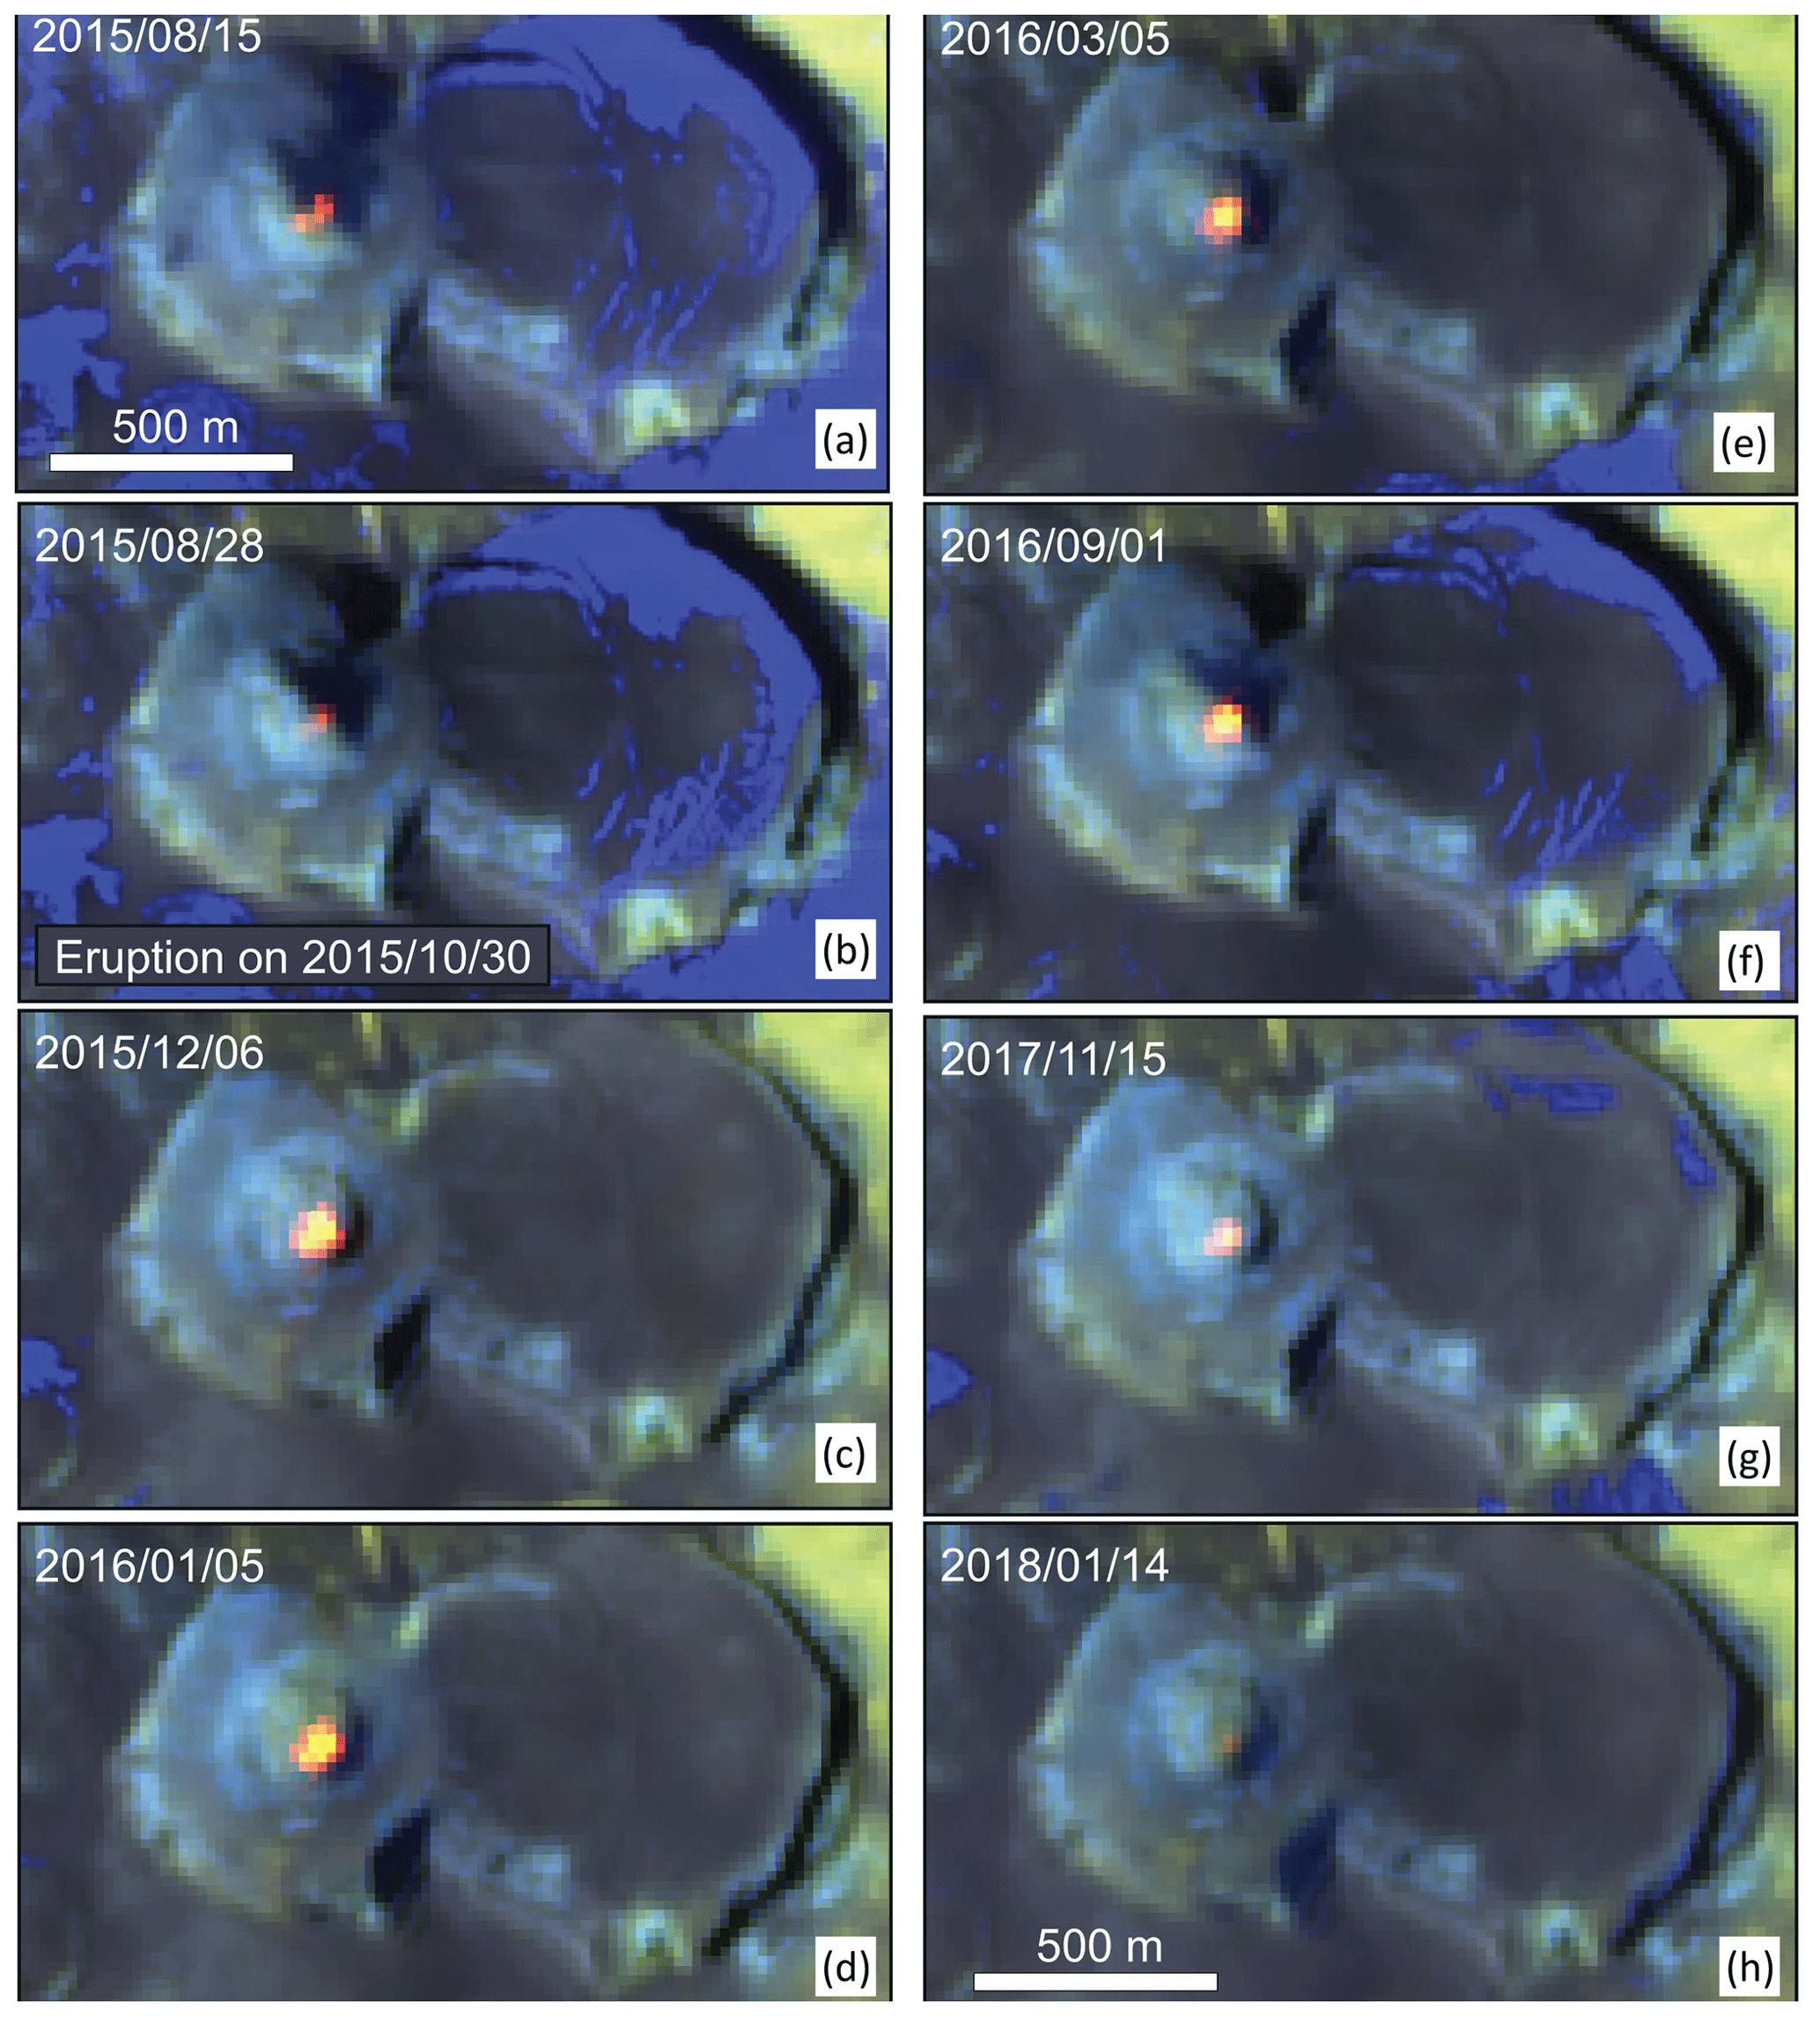
Figure 3Satellite thermal anomalies (high temperatures are shown in red, while cold temperatures and snow are shown in blue) retrieved from Sentinel-2. The availability of data is irregular in 2015, but the data show a gradual decrease in the thermal anomaly in August 2015 and a later increase in the thermal anomaly on 6 December 2015, followed by a gradual decrease. Note that between 28 August 2015 and 6 December 2015 no clear Sentinel-2 images were acquired. (g) shows the thermal anomaly during the time of our UAV field campaign shown in Fig. 7. Data provided by the European Space Agency (ESA).
Precipitation is rare in this desert area with an annual average below 100 mm (Messerli et al., 1993). Nevertheless, from the continuous precipitation records recorded at the weather station situated at the base of the volcano, we observed three precipitation events occurring in the period analyzed in this study (P1–P3, Fig. 2a). All three precipitation events were associated with abundant snowfall as was observed by our cameras. Our weather station detected considerable amounts of precipitation (rain, hail) during events P1 and P2, which occurred in the middle (March 2015) and end (August 2015) of the increasing LP activity phase, respectively. The same was true for event P3, which occurred from 19 to 21 October 2015 with 112 mm of accumulated precipitation and reached 13 mm h−1 on 20 October 2015, only 10 d before the eruption. The latter precipitation event was forecasted by the Chilean meteorology agency, prompting an emergency alert on 18 October from the Chilean National Emergency Office (ONEMI) due to the severe weather warning throughout the entire region of Antofagasta. Indeed the maximum level of precipitation that was recorded in the Andes was observed in the first 12 h of 19 October 2015 (ONEMI, 2015).
Events P1 and P2 did not lead to detectable changes in volcanic activity. In contrast, event P3 entailed a pronounced increase in plume visibility, as reflected by the strongly enhanced pixel brightness in the atmospheric column above the active crater. Thus, focusing our analysis of the daily changes of the plume to 1 month before and after the eruption on 30 October 2015, we observed low pixel brightness variations during the pre-precipitation phase (Fig. 4a). Just after the event P3, the pixel brightness suddenly increased, indicating the presence of abundant condensed water within the gas plume on 21 October 2015 (Fig. 4a), and the maximum pre-eruptive peak was reached on 23 October 2015. These findings were confirmed upon closer inspection of the hourly variations in the brightness (Fig. S2), and the maximum value was revealed to be 4 times the normal state. Figure S2 also displays the daily cyclic fluctuations of the pixel brightness; these fluctuations were confirmed through visual analysis of the height and brightness of the plume in Fig. 5d, in which a stronger signal is observed during the morning hours before transitioning to a slight manifestation of the plume in the afternoon.
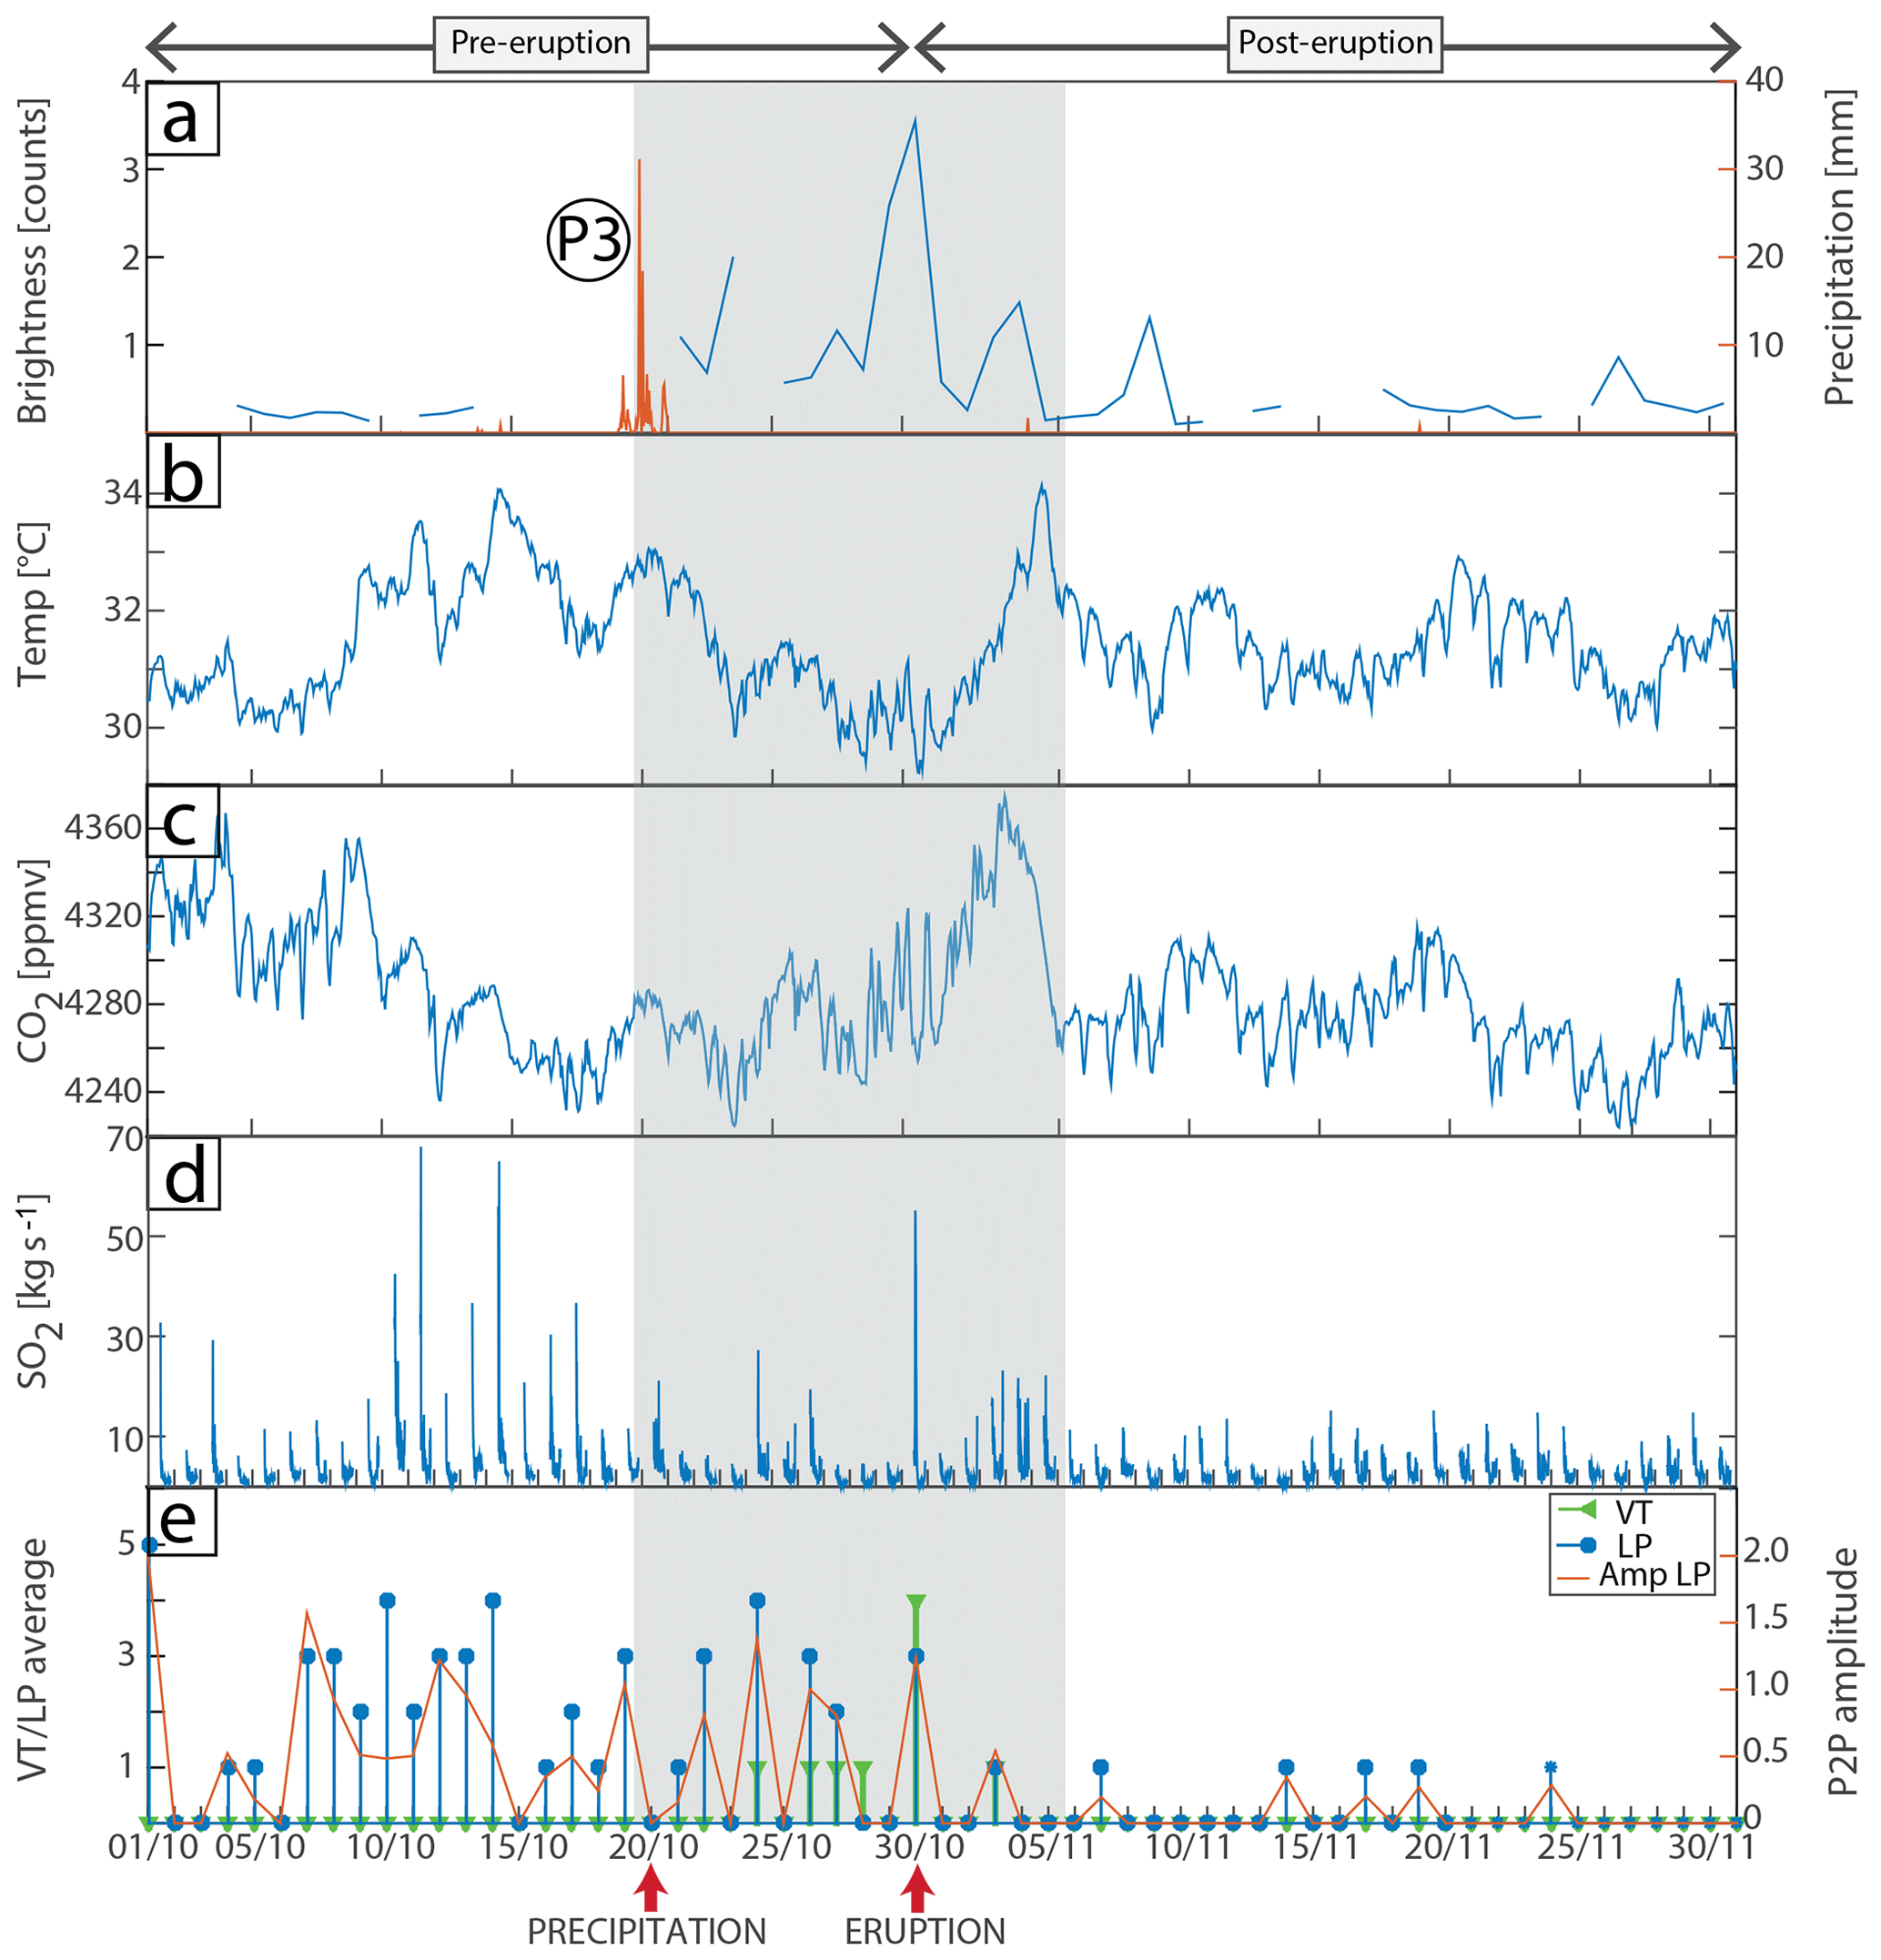
Figure 4Two months of daily variations shown in multiparametric plots of data. (a) Brightness (blue curve) of the fumarole computed at noon and precipitation event P3 (orange curve for P3; see Fig. 2), (b) fumarole (blue) temperature, (c) CO2 mixing ratio, (d) SO2 emission rate (note that the data show a peak during the eruption), and (e) VT and LP seismic-event average and LP peak-to-peak amplitude (orange curve). Precipitation event P3 and day of eruption are indicated with arrows at the bottom. The shaded box indicates the period covered from the onset of precipitation event P3 to a few days after the eruption, during which high variability was observed in the gas plume and seismicity.
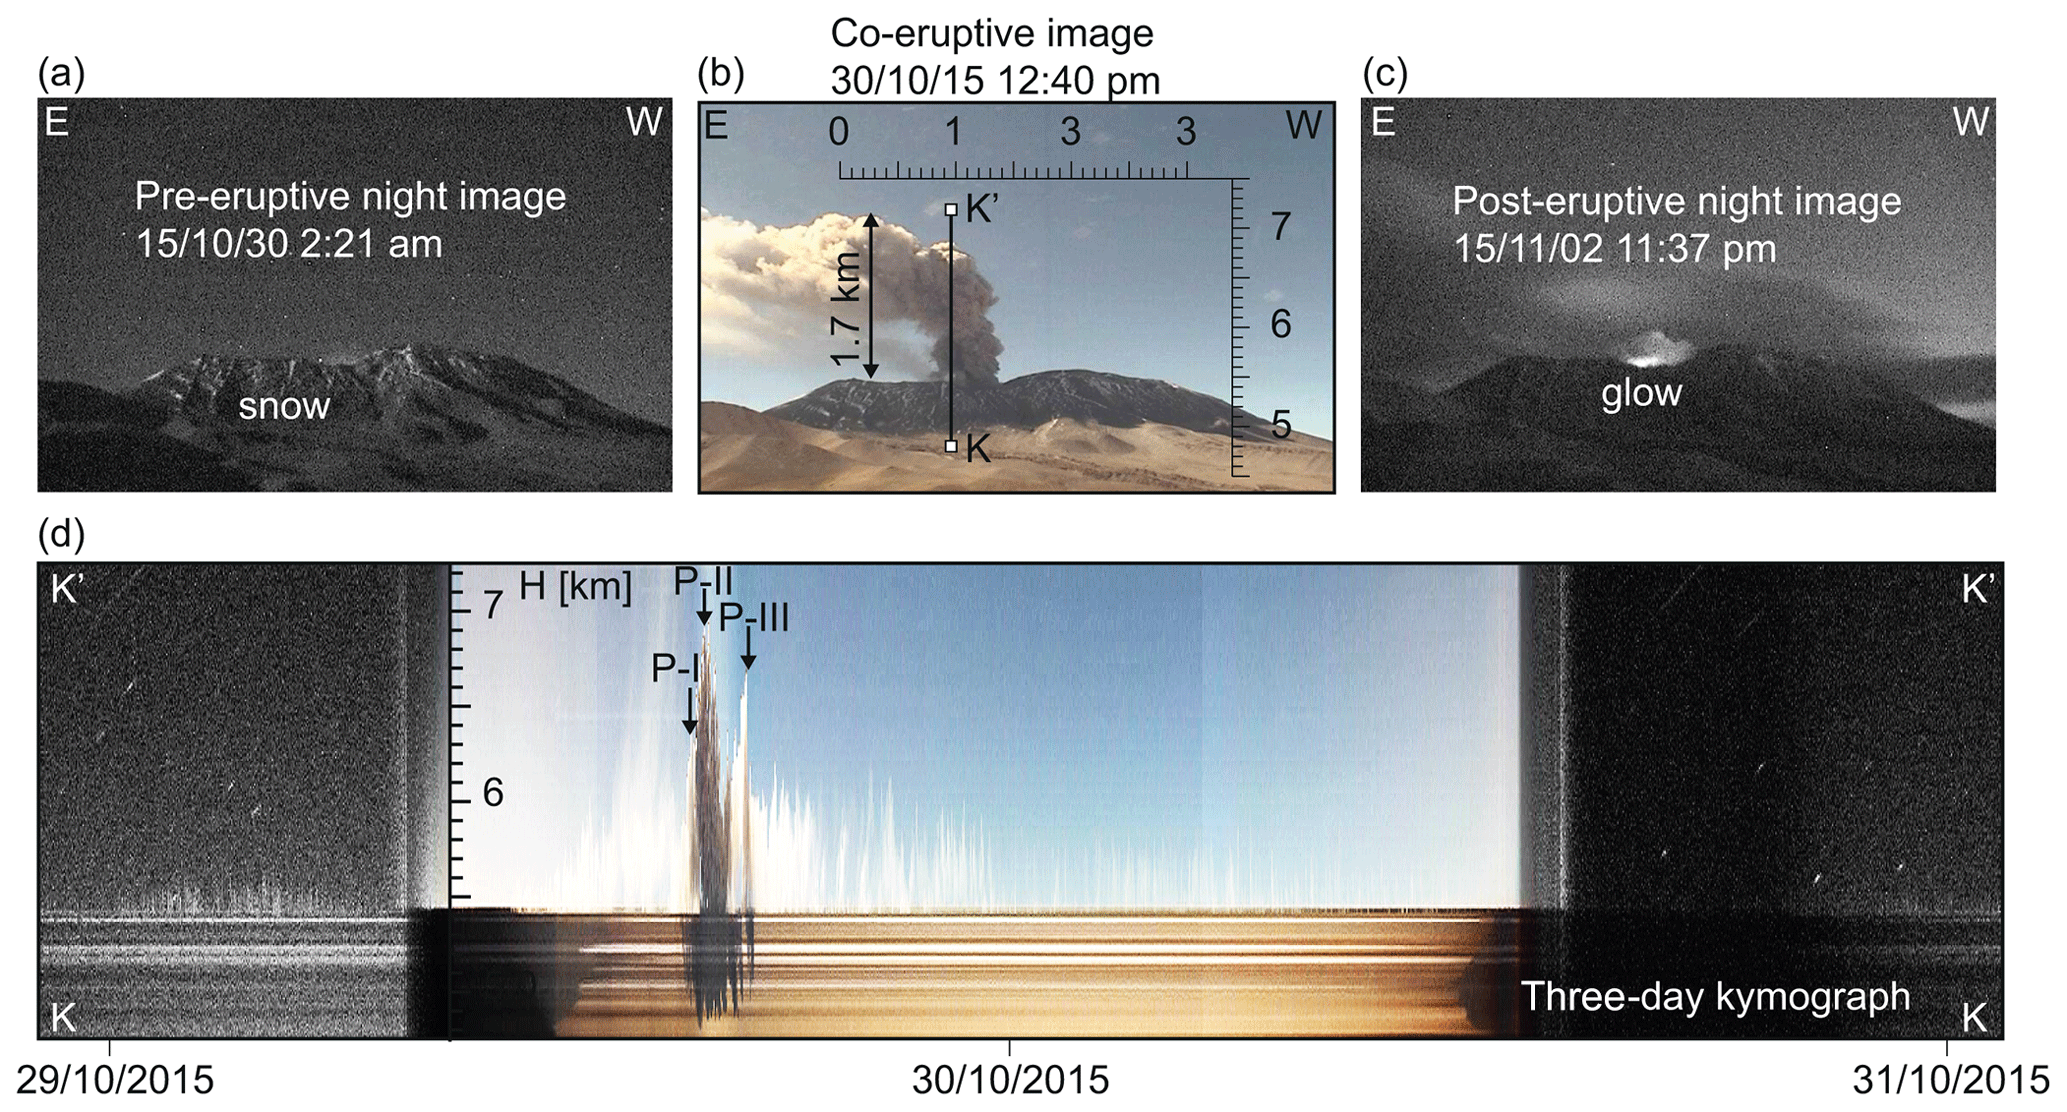
Figure 5Camera data analysis allowing the eruption duration and height to be estimated from a camera looking from north to south (C1; see Fig. 1 for location). (a) Pre-eruptive nighttime image (29 October 2015, at 23:21 UTC) of the snow-covered edifice. Local time is given in the image. (b) Co-eruptive daytime image (30 October 2015, at 15:40 UTC) with a 1.7 km high ash-loaded eruption column. (c) Post-eruptive image (3 November 2015, at 02:37 UTC) showing increased glow. (d) Three-day kymograph extracted from 2880 images along vertical profile (see vertical line in b); the height scale (H) is shown in kilometers above sea level. P-I, P-II and P-III are the three phases exhibited by the eruptive plume.
Furthermore, the temperature of the fumarolic gas emissions clearly dropped from 33 to 29.2 ∘C, and some slight variations were evident in the CO2 concentration after precipitation event P3; both of these trends seemed to be insignificant with respect to the amplitude variations in the long-term trends of their corresponding time series (Fig. 4b and c). Similar to the fumarolic temperature, the SO2 emission rates during October decreased from an average of 4.14 kg s−1 SO2 in the period prior to event P3 to merely 2.33 kg s−1 SO2 in the 8 d following event P3 (Fig. 4d). A renewed pulse of VT events began on 23 October and continued during the following days until the eruption, whereas LP events continued to follow the declining trend observed in the preceding 3 months (Fig. 4e).
4.2 The phreatic eruption on 30 October 2015
The phreatic eruption that occurred on 30 October 2015 was reported at 09:32 LT (local time) (12:32 UTC); the explosion expelled an ash plume that rose to approximately 1.7 km above the crater and then drifted towards the northeast, as revealed by the webcam and kymograph (Fig. 5b).
Approximately 25 min before the explosive eruption, a cluster of four VT events was recorded within a 5 min time window (Fig. 2b). These VT events lasted for less than 10 s each, and the corresponding signals displayed characteristic frequencies in the range from 1 to 30 Hz. The eruption was characterized by the sudden onset of a harmonic tremor signal that lasted for approximately 50 min, with the most energetic phase occurring during the first 20 min (Fig. 2b and c). This signal was characterized by a frequency content between 1 and 10 Hz and a dominant frequency of 4 Hz. The eruption signal featured two parts, and the transition between the two seems to indicate two phases (Fig. 2c). The first part of the eruption signal lasted for 5 min and decreased strongly both in amplitude and in energy during the last 2 min. The second part lasted for approximately 10 min and was characterized by a modulation, i.e., a slowly decreasing amplitude (Fig. 2b and c). Throughout the remaining 30 min of the eruption, the tremor exhibited a low energy and amplitude.
The phreatic eruption was accompanied by a degassing pulse, which was reflected by an 8-fold increase in the SO2 emission rate (Figs. 4d and 5d). The average SO2 emission rate was 6.76 kg s−1 during the morning hours prior to the eruption event, and the first SO2 emission peak of 55.14 kg s−1 was reached at 09:26 LT (12:26 UTC), which was approximately 6 min prior to the onset of the phreatic explosion. The corresponding optical SO2 densities in the plume center (i.e., the SO2 concentrations along the viewing direction of the mini-DOAS scanner) started to increase considerably from 200 to 650 ppmm (parts per million meters) approximately 15 min before the eruption and reached a maximum of 766 ppmm approximately 5 min in advance of the ash emissions (Table S1 in the Supplement). Thus, the four VT events that occurred between 25 and 20 min before the eruption were almost immediately followed by a vigorous increase in degassing activity. Subsequently, the SO2 flux reached a second maximum of 44.38 kg s−1 at 10:05 LT (13:05 UTC), approximately 32 min after the onset of the eruption, and then gradually declined until it eventually returned to its pre-eruptive value of 6.7 kg s−1 at 10:59 LT (13:59 UTC), i.e., approximately 29 min after the eruption tremor ceased. The corresponding SO2 SCDs similarly reached a second maximum of 650 ppmm concurrently with the fluxes before gradually diminishing to usual values. In contrast, the CO2 concentration and temperature of the summit fumarole abruptly decreased from respective values of 4320 ppm CO2 and 31.2 ∘C, in the evening hours of 29 October; reached local minima of 4250 ppm CO2 and 29.2 ∘C throughout the duration of the eruption; and subsequently increased again to 4320 ppm CO2 and 30.8 ∘C in the evening hours of 30 October (Fig. 4b and c). The co-eruptive CO2 minimum was further accompanied by a pixel brightness peak, exhibiting the presence of condensed water in the eruptive plume (Fig. S2); this dynamic is a recurrent feature in the entire period illustrated in Fig. S2.
A strong steam signal was observed in the two cameras beginning early in the morning of 30 October, as was also depicted by kymographic analysis (Fig. 5d). A cyclic daily variation in the steam plume, which decayed in height and intensity from late morning to afternoon, was evident. During the explosion, the plume turned gray and exhibited three phases based on changes in the color and altitude. At the start of the eruption, there was a short lapse when the plume was light gray and reached ∼6.3 km a.s.l. (P-I in Fig. 5d). This phase was followed by the main eruptive phase, during which a dark-gray and taller plume (∼7 km a.s.l.) with a high ash content was expelled (P-II in Fig. 5d). These two pulses were associated with the two parts we observed in the eruptive tremor signal described above. The final phase consisted of an isolated light-gray pulse that reached ∼6.7 km a.s.l. (P-III in Fig. 5d). This third pulse seems to stand alone, and no change in the seismic signal was registered in this regard.
4.3 Post-eruptive observations
The seismic, thermal and degassing anomalies detected shortly before and during the 30 October 2015 eruption very quickly returned to their background levels. For instance, the number of LP seismic events per day decreased to few or no events and displayed a very low peak-to-peak amplitude (Figs. 2a and 4e). The Sentinel-2 data show a hot spot centered in the active crater and that the size and intensity of the surface thermal anomaly on the crater floor had increased in the first acquisition after the eruption (recorded on 6 December 2015; Fig. 3d). This initial high temperature of the crater floor is also reflected by the camera images showing a glow at night after the eruption (Fig. 5c). The dimensions and strength of the thermal anomaly slowly declined during 2016, as observed in the Sentinel-2 data (Fig. 3e–h). By the end of 2017, the thermal anomaly had returned to levels approaching those observed prior to the 2015 eruption (Fig. 3i and k).
The gas data from the monitored fumarole on the crater rim displayed pronounced changes. We first found an increase in the temperature from 29.2 to 34.2 ∘C in the 3 d after the eruption until 2 November 2015 and an increase in the CO2 concentration from 4250 to 4370 ppm until 5 November 2015, both of which gradually approached background levels again ∼5 d after the eruption (Fig. 4b and c). According to an analysis of the camera brightness, the degassing also gradually returned to its background level by 9 November 2015, when it dropped to usual pre-precipitation values (Fig. 4a). The SO2 fluxes during the period of 2–5 November 2015 were measured at an average of 4.42 kg s−1 and were therefore slightly higher than the average (2.32 kg s−1) during the entire post-eruptive period considered here (31 October to 31 November 2015) (Fig. 4d).
Our UAV overflight performed on 27 November 2017 revealed the presence of a circular feature located at the base of the deep crater floor with a diameter of ∼57 m and partly covered by rockfall deposits from the crater walls (Fig. 7a and c). The circular feature on the crater floor may represent the surface expression of the underlying conduit and/or the remnants of a dome-like protrusion of magma, with a mound-like outline, morphology and blocky appearance at the surface. We compared the location of the circular feature to a Sentinel-2 map acquired during the 2015 eruption, and good agreement was observed between the region covered by blocky material and the thermal anomaly region (Fig. 7a and b). Close-up views enabled by high-resolution drone photogrammetry further revealed the presence of a linear structure oriented NE–SW dissecting this circular feature but not dissecting the apparently younger rockfall deposits (Fig. 7d). The explosive dissection of crater floors and lava domes by linear structures has been observed elsewhere following steam-driven explosions (Darmawan et al., 2018a; Walter et al., 2015). Therefore, we speculate that the linear NE–SW-striking structure developed during the 2015 steam-driven explosion of Lascar volcano.
The steam-driven explosive eruption of Lascar on 30 October 2015 was the first to be densely monitored. The eruption was studied by utilizing different data sets, the results of which suggest that (i) no magma movements within a shallow magma reservoir were identifiable immediately prior to the explosion although significant changes in degassing activity were observed and (ii) the spontaneous steam-driven explosion was directly associated with a brief degassing pulse and the development of a fractured circular feature on the crater floor. We ascertained that the volcano was in an elevated stage of activity, as the steam explosion was preceded by ∼1 year of enhanced LP seismic activity, thus favoring a potential gradual pressure buildup within the shallow volcanic system. However, as the seismic activity gradually declined approximately 4 months prior to the explosion (Fig. 2a), a direct and causal relationship is debatable. Nevertheless, similar long-term trends in LP activity have been observed prior to eruptions of Mt. Etna, where variation in the trends was associated with replenishment with gas-rich magma (Patanè et al., 2008). If this was also the case at Lascar, this would imply a considerable input of deep gas/fluid into the system and that the release of this gas/fluid may eventually have been obstructed by a reduction in permeability of the degassing path in response to precipitation (Heap et al., 2019), increasing the pressure in the volcanic system. We noticed that this decline in seismic activity was accompanied by a reduction in the apparent temperature anomaly located inside the active crater (Fig. 3a–c), which was likely associated with a general decline in fumarole activity. Similar decreases in the area and intensity of hot spots have previously been observed preceding certain eruptions, such as those occurring in the periods 1992–1995 and 2000–2004 (see Table 1), which were interpreted to be associated with a sealing of the degassing path due to crater subsidence (González et al., 2015; Wooster and Rothery, 1997). The details of our findings, the limitations and interpretations of this study, and a conceptual model are discussed below.
5.1 Water infiltration into the hydrothermal system of Lascar
Different processes may drive phreatic eruptions; for example, magma may intrude wet sediments and aquifers, lava or pyroclastic flows may interact with surface water, or hydrothermal systems may form during periods of repose (Barberi et al., 1992; Rouwet et al., 2014). Moreover, evidence that precipitation can trigger volcanic activity has also been documented, such as the dome collapse at Soufrière Hills volcano, Montserrat (Carn et al., 2004; Matthews et al., 2002); a seasonal response of seismic velocity (Sens-Schönfelder and Wegler, 2006); the increase in seismicity associated with the precipitation-influenced degassing process at Merapi volcano (Richter et al., 2004); and possible phreatic eruptions that induce dome collapse (Darmawan et al., 2018a).
The hydrothermal system of Lascar has previously been extensively studied (Menard et al., 2014; Tassi et al., 2009). Gas emissions occurring at the crater floor have been previously characterized by the discharge of fluids fed by a deep magmatic source. Lascar hosts an extended hydrothermal system feeding the fumaroles located on the inner crater walls and the upper rim of the crater (González et al., 2015). The gas emissions from these fumaroles show an increasing hydrothermal chemical signature with increasing distance from the magmatic body. Therefore the hydrothermal system encompasses a central magma-dominated system and a peripheral meteorically dominated system which is susceptible to interactions with meteoric water added to the system (Tassi et al., 2009). Our study supports a link between these two systems, as we show evidence that fumarole measurements taken on the outer crater rim display changes related to both the precipitation event and the steam-driven explosion that occurred deep in the crater (see Sect. 5.4). Therefore the outer and inner hydrothermal systems appear to be dynamically linked, either to eruption occurrences or to precipitation events, or to both as our study suggests (see also Fig. 6). This finding has important implications, as monitoring the outer system, which is easy to access, may indirectly reflect the inner hydrothermal system.
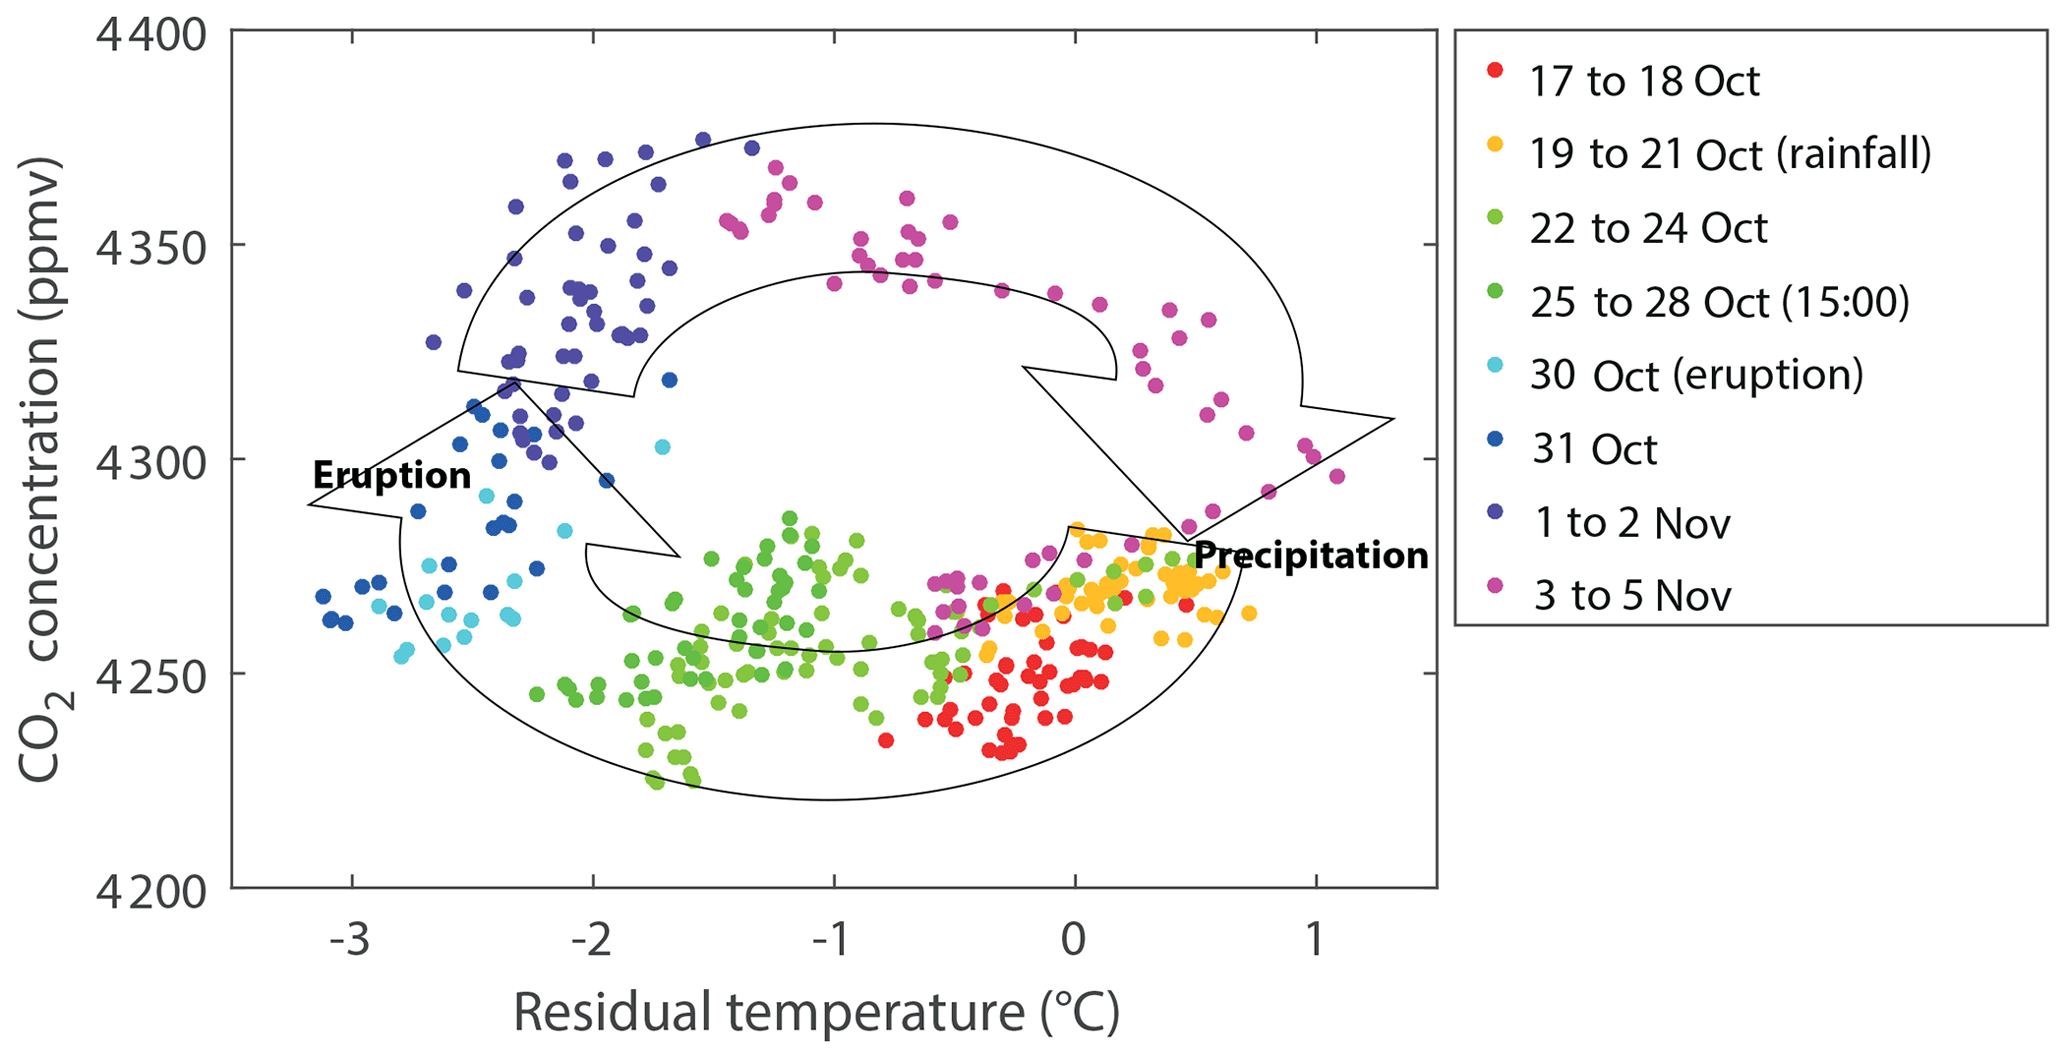
Figure 6Evolution plot of the CO2 mixing ratio versus the gas temperature measured at a Lascar fumarole from 17 October to 5 November 2015. The distinctively colored dots represent key stages in the evolution of these parameters characterized by a clockwise behavior. This cyclic behavior was induced by precipitation event P3 (19–21 October; orange dots), causing (1) the gas outlet temperature to decrease following the rainfall event and (2) the CO2 mixing ratio and outlet temperature to gradually rise after the eruption (30 October; cyan dots). The cycle closes during the period of 3–5 November (magenta dots), during which the CO2 concentration and gas outlet temperature returned to their pre-eruptive values.
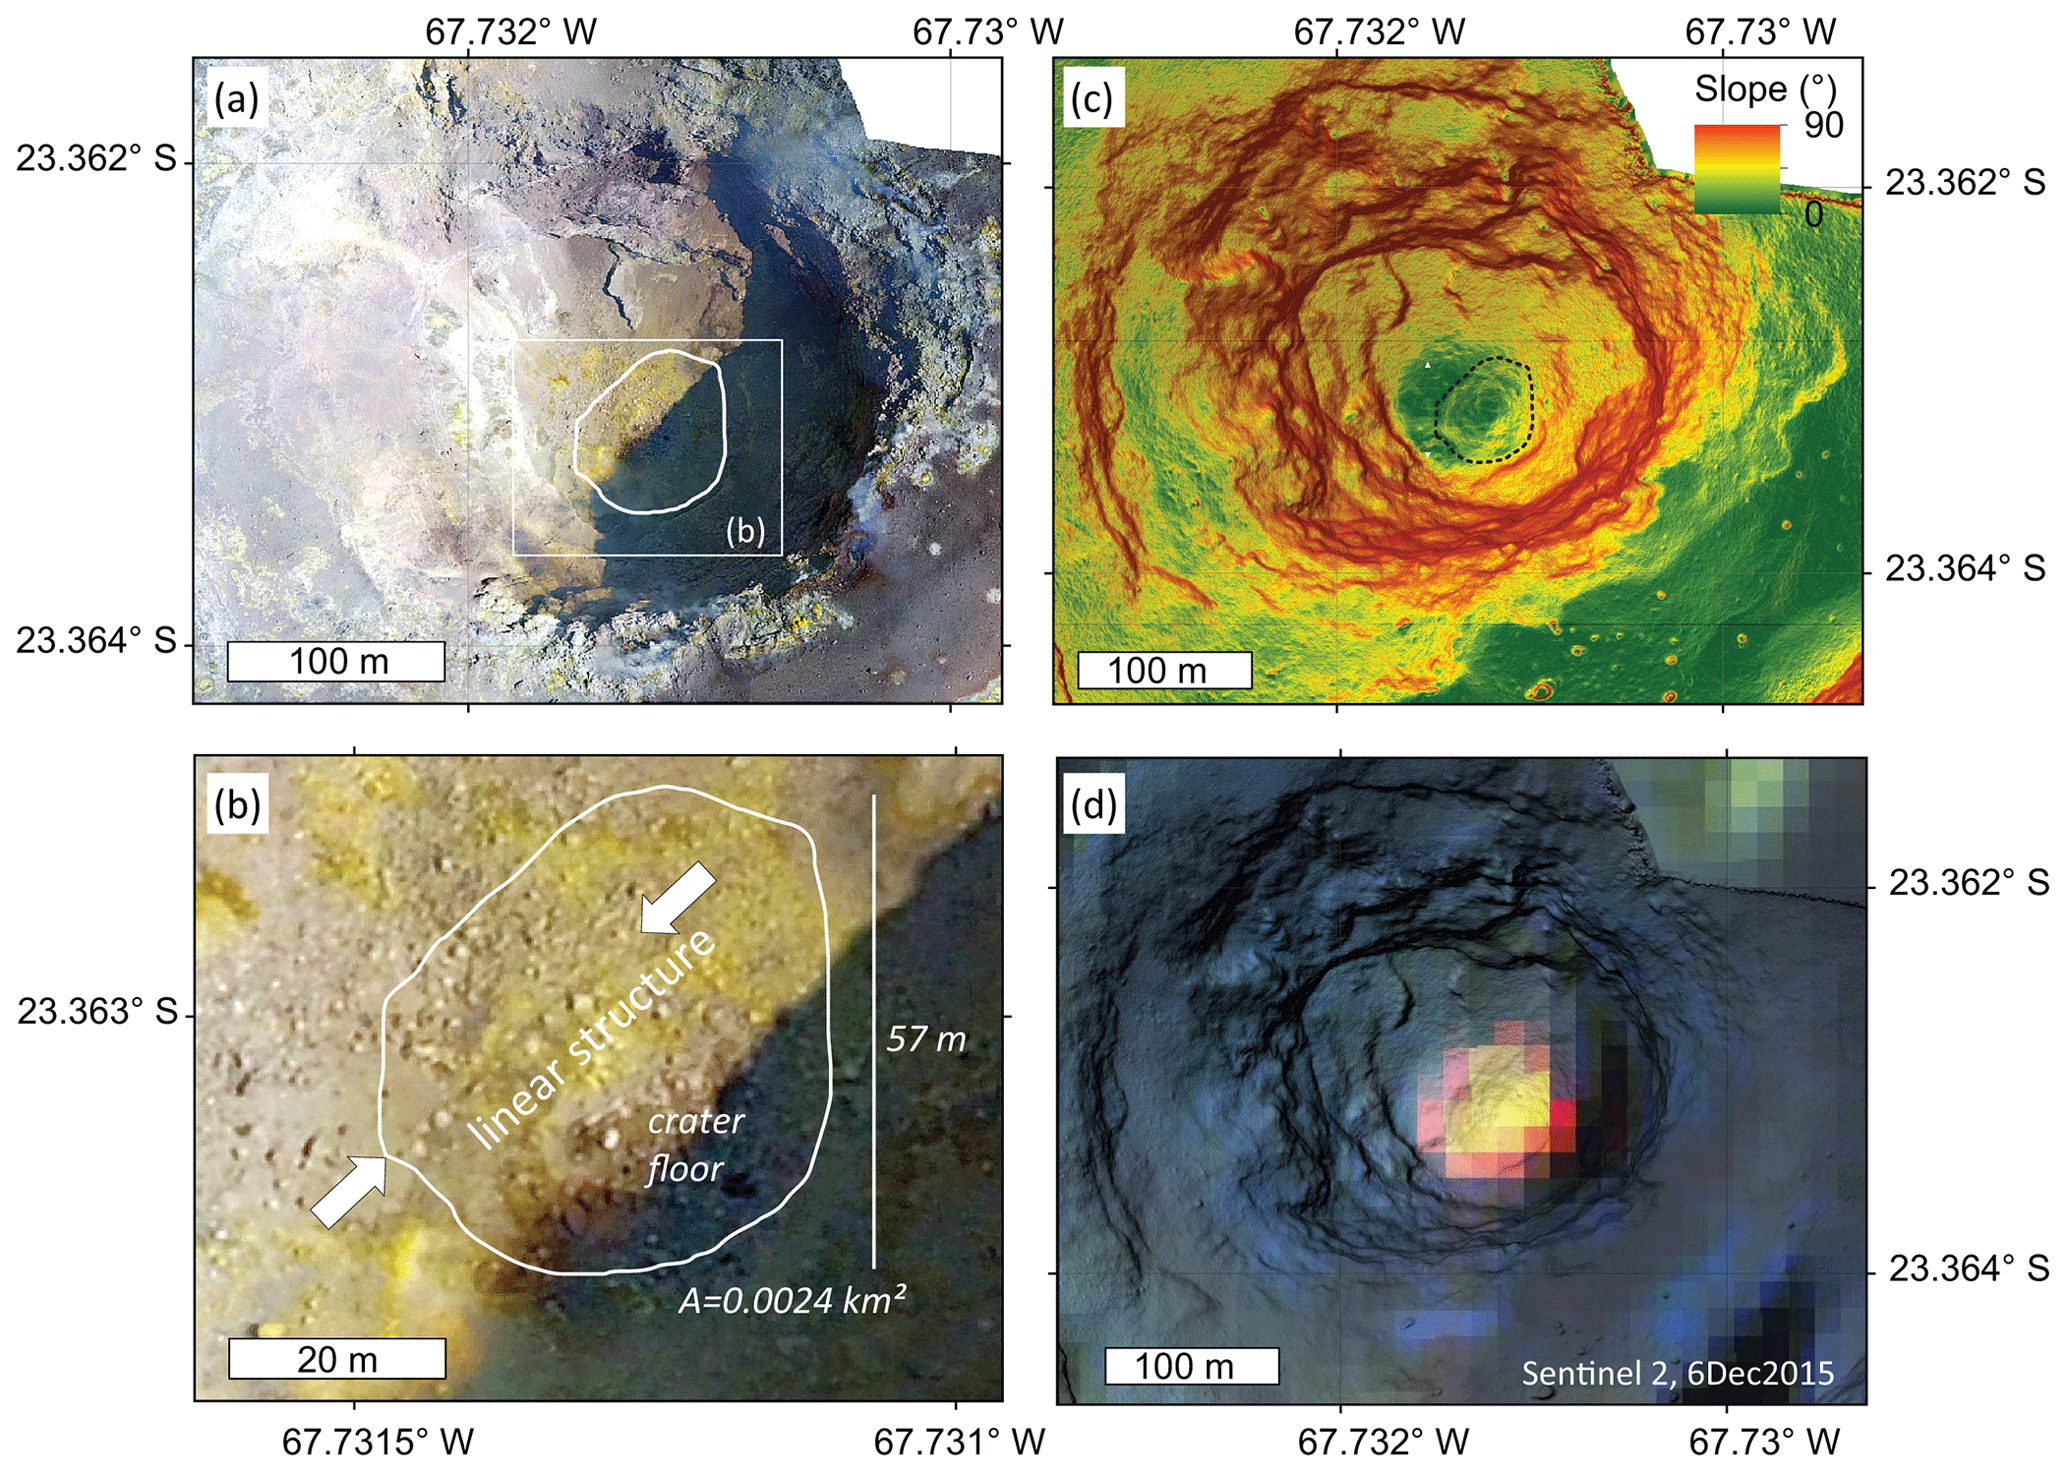
Figure 7Drone overflight results. (a) Photomosaic of the crater region showing the 2017 central elevation of the crater floor with a diameter of 57 m. The white line is the approximate perimeter of the thermal anomaly. (b) Close-up of photomosaic (as indicated in a) showing the blocky central elevation of the crater floor which corresponds to the dimensions of the thermal anomaly. Note the NE–SW-striking linear feature transecting the central elevation. (c) Digital elevation shaded relief model overlaid by a slope map whose values represent the slope in degrees; the central elevation is delineated in the center of the crater. (d) Sentinel-2 thermal anomaly pixels acquired 37 d after the eruption overlain on a shaded relief map to illustrate the location of the central elevation of the deep Lascar crater. Data provided by the European Space Agency (ESA).
Nevertheless, we note that the historic activity of Lascar provides evidence for at least six phreatic eruptions and that approximately 50 % of all recorded eruptions occurred in the period from mid-September to mid-December possibly following precipitation events (Table 1), thereby showing a possible seasonal dependence similar to that observed elsewhere in the Andes (Bredemeyer and Hansteen, 2014; Mason et al., 2004). Likewise, the October 2015 eruption falls within this period and occurred only a few days after a precipitation episode. Another seasonality effect of volcano eruptions was also inferred in Iceland, where most large eruptions occur during spring and summer periods (Albino et al., 2010).
Furthermore, we note that, in our observation period, two other precipitation events occurred in March and August 2015 (P1 and P2, respectively, Fig. 2); event P1 was larger than any other precipitation event in that year and occurred during a period of high (or even peak) seismic activity at Lascar. Why this event with such considerable precipitation did not trigger a phreatic explosion and why it was not associated with any other changes in degassing or VT seismicity remain puzzling. However, our study shows that the explosive eruption at Lascar occurred during a phase of crater floor subsidence that was identified by InSAR (Richter et al., 2018); thus, a possible explanation may lie in the timing of event P3.
Event P3 was associated with 112 mm of accumulated precipitation over 3 d, which is comparable to the average precipitation of 100 mm yr−1 typically observed, for example, at the ALMA observatory (over 5000 m a.s.l. and 40 km north of Lascar volcano). Our IP cameras furthermore showed the occurrence of snow in addition to the rain and hail recorded by our precipitation sensor and that the melting of snow following event P3 was rapid and occurred within 3 d, whereas the melting following events P1 and P2 was much slower, and snow cover was still visible even after 10 d. The precipitation associated with the P3 event likely percolated into the shallow hydrothermal system, triggering a phreatic explosion during a period of low seismic activity. Similarly, major explosive eruptions elsewhere have not necessarily occurred during peak volcanic activity and maximum precipitation but occurred during a period when the deep percolation of water was no longer inhibited by lava extrusion (Darmawan et al., 2018b).
Our analysis of different data sets over the 1 month prior to the eruption and the 1 month after the eruption allowed us to recognize precursory anomalies in the VT seismicity and the brightness of the volcanic plume; these anomalies led us to suggest a relationship with the precipitation of event P3. The maximum pre-eruptive brightness was followed by the reactivation of VT activity, which was delayed by 1 d, and was accompanied by continuous fumarole cooling in response to the infiltration of external water; during this period, the cooling rate and depth of penetration were correlated with the amount of precipitation and soil cracks (Zimmer et al., 2017).
Phreatic volcano explosions typically occur without any precursors (Stix and de Moor, 2018). These types of eruptions are similarly believed to occur without precursors at Lascar, a volcano with frequent and well-documented phreatic explosions. Two different endmembers of phreatic eruptions have been identified by Stix and de Moor (2018): those associated with a deeper hydrothermal system (type 1) and those associated with a near-surface hydrothermal system (type 2) that also includes surface waters. Lascar volcano is known for its lively history of violent hydrothermal explosions, and our observations suggest that the 2015 eruption was a type-2 phreatic explosion according to the Stix and de Moor (2018) classification scheme. Thus, we discuss a possible trigger for this event due to the infiltration of meteoric water through cracks produced by subsidence of the crater floor. This liquid water was stored at shallow levels and vaporized by hot rocks, which led to the explosion.
A short-term increase in VT activity was observed in direct association with the eruption, after which the VT activity rapidly declined. The absence of VT events from the record almost 2 months prior to the eruption suggests that the event that occurred on the 24th and those that occurred throughout the following days were signs of fracturing caused by an increase in pressure following the percolation of meteoric water into Lascar's hydrothermal system. For example, VT events preceded the 2007 phreatic eruption of Mount Ontake, Japan (Kato et al., 2015), which was associated with the infiltration of hot fluids from the hydrothermal system. At Lascar, the short-term increase in VT activity occurred during an increase in the pixel brightness observed by the cameras; both of these phenomena may indicate the formation of new cracks exposing the previously sealed hydrothermal system.
Moreover, the addition of percolating water into the system could have led to a strong dilution or reduction in CO2 emissions in response to an increased groundwater content, resulting in an anticorrelated relationship between the steam brightness and the CO2 concentration (Fig. S2). This dynamics was previously discussed as being the result of an atmospheric pressure reduction governing the boiling temperature of water and consequently increasing the vaporization of water in shallow aquifers (Zimmer et al., 2017). The only comparison in this regard was performed for SO2 (Girona et al., 2015), where a very similar trend was observed in the steam brightness and the SO2 column abundance curves acquired simultaneously during a very short (30 min) passive degassing period at Mount Erebus, Antarctica. The correlation between the SO2 and brightness time series reflects the fact that volcanic water vapor is typically emitted in proportional amounts to the SO2 and CO2 abundances in the plume in the short term and under normal conditions. This concept can provide an idea about the parametric relationship between the water and gas contents in fumaroles. For our results, the most plausible interpretation suggests that the percolating water added to the system needed some time to heat up. Therefore, we observe a gradual increase in vaporized water over the 5 d preceding the eruption, the excess of which is evidenced by the relatively white color of the fumarole steam. The gradual increase observed during the 3 d immediately following precipitation is likely associated with the vaporization of water (Fig. S2).
The rapid fumarole heating after the eruption and the short-lived increase in the CO2 concentration (Fig. 4b and c) may be interpreted as a response to the open conduit resulting from the fracture truncating the central elevation on the crater floor due to the eruption. Previous studies have described rainfall-triggered structural destabilization and lava dome collapse and their thermal–hydraulic mechanisms (Elsworth et al., 2004; Hicks et al., 2010; Matthews and Barclay, 2004). The remaining linear feature observed across the central elevation that we believe formed during the 2015 eruption could provide evidence of a pressure buildup and an explosion of the system (Fig. 7b). This would allow for the existence of a persistent thermal anomaly, as is evidenced from satellite data even after 1 year (Fig. 3), and the appearance of a glow from the crater the night after the eruption (Fig. 5), which was still observable on the night of 2 November according to the kymographic analysis (Fig. S3a). This finding also favors the mechanism in which degassing transports more energy through hot fumarolic gases as a result of a higher magmatic gas flux into the atmosphere. The entire gas pulse accompanying the eruption expelled at least 170 t of SO2 in only 100 min, which is approximately half the amount of SO2 that Lascar volcano usually emits throughout a whole day in a noneruptive period (Bredemeyer et al., 2018; Tamburello et al., 2014). Using the molar ratios of Tamburello et al. (2014), we calculate that at least 5440 t of H2O and 230 t of CO2 were also released during these 100 min.
This large mass of emitted gas detected from the ground was nevertheless dwarfed by the estimated 49 kt of emitted SO2 in the eruption cloud recorded by the Ozone Monitoring Instrument (Global Volcanism Program, 2016). The enormous discrepancy between these two measurements may be attributed to the high aerosol contents (condensed water droplets and ash) that were present in the proximal portion of the volcanic plume but rapidly diminished with increasing distance from the emission source (Fig. 5b) due to the downwind evaporation of water droplets and the gravitational settling of ash. It is thus very likely that the near-field ground-based measurements recorded at a distance of approximately 5 km from the source were significantly more affected by light scattering at the surface of the volcanic cloud than were the far-field satellite observations, leading to a severe underestimation of the light absorbance caused by SO2 in the cloud (Mori et al., 2006). This so-called light dilution effect was also reflected in the fact that the SO2 column densities in the center of the volcanic plume (Table S1) were lower during the ash emission period than they were prior to the eruption.
5.2 Limitations of the used methods
Locating seismic events with a reliable accuracy largely depends on the density of the seismic network and the spatial distribution of the stations. Throughout October 2015 and thus during the eruption, only one seismic station was operational (QUE; see Fig. 1). Hence, a limitation during the analysis of the seismic data was that we could neither constrain the locations of the VT and tremor signals nor characterize the event sources due to a lack of data; moreover, because the events were characterized by a small magnitude, they were strongly affected by noise.
Satellite remote sensing has continuously developed in recent decades to include better sensor technology and higher-accuracy measurements, thereby showing that it is a very useful technique, especially for monitoring remote areas that are difficult to access. Nevertheless, the dependence of obtaining good-quality images and useful information from satellite images on the weather conditions still remains one of the main limitations of this approach, which we have also mentioned as an issue in our observations.
The main limitation of the methods used for computing the brightness and performing kymographic analysis is that they require good atmospheric conditions and a wind direction that favors the visibility of the plume within the image field of interest. In particular, pixel brightness analysis requires a permanently visible volcanic plume (preferentially under blue-sky conditions) to acquire clear and good-quality images. Nevertheless, although our method does not consider the influences of long-term atmospheric variables (e.g., pressure, humidity and temperature) governing the condensation of water vapor in a volcanic plume, the resulting perturbations can be corrected as long as they are well defined. The sun's position and diurnal radiation variations additionally cause cyclic perturbations, which can be either avoided by comparing pictures taken at the same time of day or corrected by analyzing reference regions, as proposed by Girona et al. (2015). The use of this approach implies an advantage with respect to other established gas monitoring methods considering its low cost and its straightforward and valuable implementation for detecting changes in a volcanic plume.
SO2 flux measurements from the mini-DOAS scanner could be conducted only during daylight, when the UV intensity is sufficiently high, and, therefore, as they contain gaps at nighttime, these records are semicontinuous. The measurements at Lascar were further restricted by the fact that only one scanning mini-DOAS station was installed 6.75 km away, with a target on the northern face of the crater, thus limiting the observation range to a northerly direction of plume transport that was confined between WNW and ENE. Thus, we were fortunate that the eruption plume drifted through the field of view of that one station, enabling us to conduct this detailed study of its optical properties. Volcanic plumes that drifted in directions outside this range were not captured by the instrument, causing additional discontinuities in the gas emission time series. Moreover, such measurements are strongly affected if considerable amounts of ash are present in the volcanic plume, leading to a severe underestimation of the emitted gas mass, as discussed above. Likewise, the passage of meteorological clouds during the precipitation period likely introduced larger uncertainty into our observations due to the scattering of light on the water droplets in the cloud, leading to either an underestimation or an overestimation, depending on the locations of those meteorological clouds with respect to the volcanic plume (Kern et al., 2010). Stormy conditions, which were frequently encountered throughout the entire observation period, caused a strong dilution of the gas plume already located in the near-field region of the volcano, which resulted in a reduction in the already very low SO2 SCDs, often hindering the detection of the gas plume. Altogether, these frequently occurring unfavorable weather conditions led to a variable data quality, resulting in standard errors ranging between ±30 % and ±50 %.
On the Andean Plateau, storms and poor weather conditions in general are more often characterized by snowfall than by rainfall or hail, as was observed by the cameras during the three precipitation events that occurred during the study period. However, visual distinction between the types of precipitation (snow, hail and rain) in such field conditions is challenging. Moreover, some precipitation events may have an effect on the volcano, while others do not, since strong winds and dry atmospheric conditions commonly rather promote sublimation of snow and hail instead of melting and thus prevent water from percolating into the volcano, besides other complexities. Therefore, the values registered by our instrument may be an underestimation of the real amount of accumulated precipitation but also do not necessarily reflect changes in soil moisture and water penetration. To understand the occurrence of phreatic eruptions in the Andean Plateau, future monitoring networks should include hydrometeor and soil moisture stations capable of distinguishing between types of precipitation and determining the depth of water penetration.
High-quality and accurate in situ gas and temperature measurements depend on the appropriate placement of the instruments as a consequence of the accessibility of those locations. To this end, measurements of the CO2 variability at Lascar could be carried out only at the fumarole field on the rim of the crater, where magmatic gas emissions are altered following mixing with hydrothermal fluids. Moreover, observations from the crater rim may not be representative of the gas discharge conditions elsewhere throughout the volcano, particularly when the focus of gas emission changes. The gas emissions during the eruption, for example, were strongly focused in the crater area, suggesting that the marginal areas at higher elevations (e.g., our fumarole on the crater rim) were less well supplied with gas because the overpressure was released elsewhere. The co-eruptive CO2 minimum was thus likely a consequence of the location of the CO2 sensor, which is one major limitation of using point-sampling devices. Furthermore, the CO2 mixing ratio and temperature of a fumarole are also strongly susceptible to changes in the weather, which is why the interpretation of these variables is often complicated when observed trends cannot be explicitly attributed to weather conditions or volcanic activity. Monitored together with relevant weather variables, however, measurements of the CO2 mixing ratio and temperature in hydrothermally dominated fumaroles are extremely well suited for studying the influence of weather conditions on volcanic activity. This was particularly true for the hydrothermally dominated low-temperature fumarole on the crater rim studied in this work.
Finally, using drones provides the possibility of attaching equipment to measure different parameters (e.g., thermal anomalies, gas emissions and structural features) during an overflight. However, the successful use of drones is usually limited by complicated access to the remote areas where volcanoes are located. Specifically, Lascar's summit is located at an elevation of almost 6 km a.s.l., and thus climbing to the rim requires a preceding acclimatization phase due to the thin-air conditions. Furthermore, overflights are commonly affected by strong winds, which are very common at such high altitudes, raising the risk that a drone will crash or directly preventing a drone from being launched. This was the main reason for the 2-year delay in our data and why some changes in the crater floor associated with the eruption may have remained undetected.
5.3 Implication for future monitoring instrumentation
Seismic activity often increases before an eruption; hence, it is an essential tool for monitoring volcanic eruptions (Tokarev, 1963). Nevertheless, predicting spontaneous explosive activity remains a challenge either because dense instrumentation is unavailable or because certain eruption types, particularly steam-driven explosions, are not preceded by seismicity, although a few examples suggest that precursors may also exist for this eruption type. A good example is the Aso volcano, where a steam-driven explosion was preceded a few minutes earlier by a LP displacement signal due to the inflation and deflation of the source, which could provide warning for such eruptions based on broadband seismometer measurements (Kawakatsu et al., 2000).
From this perspective, the apparent absence of short-term precursors for the historical activity reported at Lascar could be a consequence of the deployed network. Comparing the observations derived from the complete image data set covering the 2015 eruption, we were able to find evidence of long-term variations in LP seismicity starting with an 8-month increase followed by a 4-month decrease that was accompanied by a constant drop in the thermal anomaly observed in August 2015. Likewise, shorter-term changes were also observed by camera, followed by the occurrence of new VT events, the frequency rate of which increased only a few minutes before the explosion. Overall, these observations allow us to infer a weak preparatory phase preceding the eruption.
Finally, most of the methods discussed in this study have been broadly and successfully used to monitor volcanoes; for instance, drones have been employed to map morphological structures (e.g., Darmawan et al., 2018a), mini-DOAS scanners have been used to measure SO2 emission rates (e.g., Bredemeyer et al., 2018), satellite data have been utilized to detect thermal anomalies (e.g., González et al., 2015), and in situ sensors have been used to record gas concentrations and fumarole temperatures (e.g., Zimmer et al., 2017). In addition, the use of optical images from permanently installed cameras in this study was shown to be an effective way to detect pre-eruptive changes through pixel brightness analysis and to estimate the variations in and the altitude of the eruptive plume using kymographic analysis. Furthermore, the use of drones equipped with different sensors, such as high-resolution optical systems, captured detailed information about changes deep in the crater.

Figure 8Schematic interpretation of the pre-, co- and post-eruptive processes associated with the 30 October 2015 phreatic eruption of Lascar volcano. The light-blue zones represent the approximate location of the hydrothermal system of Lascar. (a) The pre-eruptive phase started approximately 1 year before the eruption, showing a sustained increase in LP activity. (b) Ten days before the eruption, a 20 d phase initiated after being triggered by precipitation on 20 October. This phase developed in four stages: (1) an unusually strong precipitation event occurs; (2) meteoric water percolates into the crater, changes the water content and CO2 concentration in the fumarole, and reactivates VT activity; (3) the volcano is pushed into a steam-driven explosion, producing a 1.7 km high eruption column above the crater that is composed mainly of water, ash, CO2 and SO2, causing the crater floor to fracture; (4) post-eruptive degassing transpires with a hotter fumarole containing more CO2 and less water, and a thermal anomaly is present in the active crater; and (c) the post-eruptive permanent thermal anomaly slowly decreases in temperature for 1 year.
5.4 Conceptual model of the 2015 Lascar phreatic explosion
Our interpretation inferred from the parametric relationship between the CO2 concentration and residual temperature of the fumarole after the percolation of meteoric water into the hydrothermal system is illustrated in Fig. 6. Here, we speculate about the cyclic evolution of the CO2 mixing ratio and residual temperature of the summit fumarole 2 weeks after precipitation event P3. The cycle started with a reduction in the residual temperature of 4 ∘C during the period of 19–30 October 2015 and minor variations in the CO2 content. During the 3 d following the eruption, the CO2 mixing ratio changed from 4240 to 4380 ppmv, and a moderate increase in the residual temperature occurred. During 4–7 November 2015, the residual temperature increased further, whereas the CO2 concentration decreased and slowly returned to the “normal” pre-precipitation values (∼4260 ppmv CO2 and 0 ∘C residual temperature). Figure 6 clearly shows the effects of meteoric water on the evolution of the CO2 concentration and the fluctuations in the fumarole temperature. This result is in agreement with observations of Tassi et al. (2009) regarding the significant influence of meteoric inputs in the southern–outer rim fumaroles. In addition, the 3 d delay in the increase in the pixel brightness seems to be the required time for water to infiltrate into the hydrothermal system and to vaporize.
The apparent anticorrelated behavior of the steam brightness and CO2 concentration (Fig. S2) may suggest that an increase in the water vapor within the plume is directly associated with a lower CO2 concentration at fumaroles. The observed difference between the observed behavior of the SO2 flux and the CO2 concentrations, however, can also be associated with distinct instrument observation ranges. While SO2 fluxes were measured globally from the entire volcano and were largely dominated by gas contributions from the plume emitted mainly from the active crater, the CO2 concentration was measured locally at a fumarole located in the crater periphery. The scrubbing of SO2 emissions is thus less likely to occur at Lascar because the gases emitted by the active crater do not have to pass through the aquifers of the surrounding hydrothermal system (Bredemeyer et al., 2018), whereas the CO2 concentrations on the crater rim may indeed have been affected by water that had infiltrated into the volcanic edifice. In the long term, both parameters (i.e., the SO2 and CO2 concentrations) did not display significant variations that deviated from the normal previously observed behavior.
The previous interpretation and the processes preceding the eruption are conceptualized in Fig. 8. Our conceptual model shows a pre-eruptive phase (Fig. 8a) characterized by a sustained increase in LP seismic activity. We interpret this phase as a sign of sustained fluid injection from depth inducing a long-lasting gradual pressure buildup due to a progressively blocked fluid path. This interpretation is derived from the decrease in LP events and the reduction of the apparent thermal anomaly evidenced in the images acquired by Sentinel-2 months prior to the eruption. The co-eruptive phase spanning 20 d started with precipitation event P3 on 19–20 October, which caused the subsequent percolation of water into the volcanic system (Fig. 8b-1), which in turn reduced the temperature of the fumarole and eventually prevented efficient outgassing, as is evidenced by the slight reduction in the CO2 concentration (Fig. 8b-2). This water was vaporized and released into the atmosphere, increasing the water content of the volcanic plume. The eruption (Fig. 8b-3) principally released water, CO2 and SO2, thereby expelling much of the excess water within the hydrothermal system. Over the following days, an increase in the temperature contributed to a further reduction in the water content in the plume, and the gradual drying of degassing pathways led to the observed increase in the CO2 concentration (Fig. 8b-4). The post-eruptive phase (Fig. 8c) is distinguished by a permanent thermal anomaly that slowly decreased in temperature throughout the following year.
This paper covered the period of unrest associated with the eruption of Lascar volcano on 30 October 2015. We characterize a steam-driven explosion of Lascar and its precursor activity. Based on a multidisciplinary data set, we found that signs of unrest and precursor activity can manifest as spatiotemporal changes on a variety of scales among the measured parameters. In the presented case, long-term changes in LP seismic activity were observed before but not after the eruption, while gas and camera data revealed short-term variations in a time window spanning the eruption. In addition, long-term remote-sensing information allowed us to recognize a thermal anomaly after the eruption that helped to support our short-term observations.
Overall, the multiparametric analysis suggests that the period of unrest began with a 1-year rapid increase in LP seismicity. During a gradual decline in the rate of seismicity, an unusually strong precipitation event occurred that initiated changes in the magmatic–hydrothermal system. Events evolved in four stages over a time window of days as follows: (1) precipitation, (2) enhanced steam formation and VT activation, (3) eruption, and (4) a temporary increase in the CO2 mixing ratio and fumarole temperature. Afterwards, the thermal anomaly in the crater slowly decreased in intensity over approximately 1 year following the eruption (see Fig. 8).
Our analysis has shown that, by combining different techniques and data sets, we can create an efficient monitoring system to perform a successful hazard assessment and establish an early-warning system for volcanoes that seem to show no clear precursor activity. In addition, we have demonstrated that signs of unrest and precursor activity can manifest as spatiotemporal changes in a variety of scales and that analysis of such signals should be promoted for future monitoring at Lascar and other volcanoes exhibiting similar behavior worldwide.
OVDAS seismic data can be obtained on request (luis.franco@sernageomin.cl); GFZ seismic data can be accessed via the GEOFON web page (https://doi.org/10.14470/3R7569753098, Walter et al., 2014); and gas, weather, drone and camera data can be obtained on request from Ayleen Gaete. Copernicus satellite data can be openly accessed through the European Space Agency (ESA), Sentinel Hub services.
The supplement related to this article is available online at: https://doi.org/10.5194/nhess-20-377-2020-supplement.
AG planned and participated in field campaigns and led the writing of the manuscript. TRW performed the camera, drone and satellite data processing. SB performed the SO2 flux analysis. MZ performed the CO2 and temperature analysis. Seismic data were analyzed by AG, together with LFM and JSM. CK also planned the fieldwork and maintained the instruments and data transmission. All authors (AG, TRW, SB, MZ, CK, LFM, JSM, CBP) contributed to the writing of the manuscript.
The authors declare that they have no conflict of interest.
This research was supported by the IPOC of the German Research Centre for Geosciences (GFZ) and by the program Forschungsstipendium für Doktorat from Deutscher Akademischer Austauschdienst (DAAD). This is a contribution to VOLCAPSE, a research project funded by the European Research Council under the European Union's H2020 program/ERC consolidator grant no. ERC-CoG 646858. We thank Stefan Mikulla, Jacqueline Salzer, Mehdi Nikkhoo, Elske de Zeeuw-van Dalfsen and Nicole Richter for their help and for contributing to earlier field activities and preparation. We also thank our colleagues at OVDAS in Temuco and Gabriel Gonzalez at UCN Antofagasta for discussions and the analysts and technicians of the observatory for their laborious efforts to provide a complete seismic-event database. Ayleen Gaete and Stefan Bredemeyer moreover appreciate and thus would like to express their gratefulness for the hospitality and support they experienced throughout their extended stays at the observatory. We additionally thank ESA for providing Sentinel-2 data.
This research has been supported by the European Research Council (grant no. VOLCAPSE (646858)).
The article processing charges for this open-access
publication were covered by a Research
Centre of the Helmholtz Association.
This paper was edited by Giovanni Macedonio and reviewed by Felipe Aguilera Barraza and one anonymous referee.
Aguilera, F., Viramonte, J., Medina, E., Guzmán, K., Becchio, R., Delgado, H., and Arnosio, M.: Recent eruptive activity from lascar volcano (2006), in: 11th Chilean Geological Congress, Universidad Católica del Norte, Antofagasta, Natofagasta, 393–396, 2006.
Albino, F., Pinel, V., and Sigmundsson, F.: Influence of surface load variations on eruption likelihood: Application to two Icelandic subglacial volcanoes, Grímsvötn and Katla, Geophys. J. Int., 181, 1510–1524, https://doi.org/10.1111/j.1365-246X.2010.04603.x, 2010.
Barberi, F., Bertagnini, A., Landi, P., and Principe, C.: A review on phreatic eruptions and their precursors, J. Volcanol. Geoth. Res., 52, 231–246, https://doi.org/10.1016/0377-0273(92)90046-G, 1992.
Bredemeyer, S. and Hansteen, T. H.: Synchronous degassing patterns of the neighbouring volcanoes Llaima and Villarrica in south-central Chile: the influence of tidal forces, Int. J. Earth Sci., 103, 1999–2012, https://doi.org/10.1007/s00531-014-1029-2, 2014.
Bredemeyer, S., Ulmer, F. G., Hansteen, T. H., and Walter, T. R.: Radar path delay effects in volcanic gas plumes: The case of Láscar Volcano, Northern Chile, Remote Sens., 10, 1514, https://doi.org/10.3390/rs10101514, 2018.
Brook, M. and Moore, C. B.: Lightning in volcanic clouds, J. Geophys. Res., 79, 472–475, 1974.
Carn, S. A., Watts, R. B., Thompson, G., and Norton, G. E.: Anatomy of a lava dome collapse: The 20 March 2000 event at Soufrière Hills Volcano, Montserrat, J. Volcanol. Geoth. Res., 131, 241–264, https://doi.org/10.1016/S0377-0273(03)00364-0, 2004.
Çetin, A. E., Dimitropoulos, K., Gouverneur, B., Grammalidis, N., Günay, O., Habiboglu, Y. H., Töreyin, B. U., and Verstockt, S.: Video fire detection – Review, Digit. Signal Process., 23, 1827–1843, https://doi.org/10.1016/J.DSP.2013.07.003, 2013.
Chouet, B., Hamisevicz, N., and McGetchin, T. R.: Photoballistics of volcanic jet activity at Stromboli, Italy, J. Geophys. Res., 79, 4961–4976, https://doi.org/10.1029/jb079i032p04961, 1974.
Chouet, B. A.: Long-period volcano seismicity: its source and use in eruption forecasting, Nature, 380, 309–316, https://doi.org/10.1038/380309a0, 1996.
Christenson, B. W., Reyes, A. G., Young, R., Moebis, A., Sherburn, S., Cole-Baker, J., and Britten, K.: Cyclic processes and factors leading to phreatic eruption events: Insights from the 25 September 2007 eruption through Ruapehu Crater Lake, New Zealand, J. Volcanol. Geoth. Res., 191, 15–32, https://doi.org/10.1016/j.jvolgeores.2010.01.008, 2010.
Darmawan, H., Walter, T. R., and Brotopuspito, K. S.: Subandriyo and I Gusti Made Agung Nandaka: Morphological and structural changes at the Merapi lava dome monitored in 2012–15 using unmanned aerial vehicles (UAVs), J. Volcanol. Geoth. Res., 349, 256–267, https://doi.org/10.1016/j.jvolgeores.2017.11.006, 2018a.
Darmawan, H., Walter, T. R., Troll, V. R., and Budi-Santoso, A.: Structural weakening of the Merapi dome identified by drone photogrammetry after the 2010 eruption, Nat. Hazards Earth Syst. Sci., 18, 3267–3281, https://doi.org/10.5194/nhess-18-3267-2018, 2018b.
de Moor, J. M., Aiuppa, A., Pacheco, J., Avard, G., Kern, C., Liuzzo, M., Martínez, M., Giudice, G., and Fischer, T. P.: Short-period volcanic gas precursors to phreatic eruptions: Insights from Poás Volcano, Costa Rica, Earth Planet. Sc. Lett., 442, 218–227, https://doi.org/10.1016/j.epsl.2016.02.056, 2016.
de Zeeuw-van Dalfsen, E., Richter, N., González, G., and Walter, T. R.: Geomorphology and structural development of the nested summit crater of Láscar Volcano studied with Terrestrial Laser Scanner data and analogue modelling, J. Volcanol. Geoth. Res., 329, 1–12, https://doi.org/10.1016/j.jvolgeores.2016.09.018, 2017.
Díaz, D., Brasse, H., and Ticona, F.: Conductivity distribution beneath Lascar volcano (Northern Chile) and the Puna, inferred from magnetotelluric data, J. Volcanol. Geoth. Res., 217–218, 21–29, https://doi.org/10.1016/j.jvolgeores.2011.12.007, 2012.
Elsworth, D., Voight, B., Thompson, G., and Young, S. R.: Thermal-hydrologic mechanism for rainfall-triggered collapse of lava domes, Geology, 32, 969, https://doi.org/10.1130/G20730.1, 2004.
Francis, P. W. and Rothery, D. A.: Using the Landsat Thematic Mapper to detect and monitor active volcanoes: An example from Lascar volcano, northern Chile, Geology, 15, 614–617, https://doi.org/10.1130/0091-7613(1987)15<614:UTLTMT>2.0.CO;2, 1987.
Gaete, A., Cesca, S., Franco, L., San Martin, J., Cartes, C., and Walter, T. R.: Seismic activity during the 2013–2015 intereruptive phase at Lascar volcano, Chile, Geophys. J. Int., 219, 449–463, https://doi.org/10.1093/gji/ggz297, 2019.
Galle, B., Johansson, M., Rivera, C., Zhang, Y., Kihlman, M., Kern, C., Lehmann, T., Platt, U., Arellano, S., and Hidalgo, S.: Network for Observation of Volcanic and Atmospheric Change (NOVAC) – A global network for volcanic gas monitoring: Network layout and instrument description, J. Geophys. Res.-Atmos., 115, D05304, https://doi.org/10.1029/2009JD011823, 2010.
Gardeweg, M., Amigo, A., Matthews, S., Sparks, R., and Clavero, J.: Geología del volcán Láscar, Región de Antofagasta, Carta Geológica de Chile, Serie Geología Básica 131, p. 43, 1 mapa escala 1:50.000, Servicio Nacional de Geología y Minería, Santiago, 2011.
Gardeweg, M. C., Sparks, R. S. J., and Matthews, S. J.: Evolution of Lascar Volcano, Northern Chile, J. Geol. Soc. Lond., 155, 89–104, https://doi.org/10.1144/gsjgs.155.1.0089, 1998.
Girona, T., Costa, F., Taisne, B., Aggangan, B.m and Ildefonso, S.: Fractal degassing from Erebus and Mayon volcanoes revealed by a new method to monitor H2O emission cycles, J. Geophys. Res.-Solid, 120, 2988–3002, https://doi.org/10.1002/ 2014JB011797, 2015.
Global Volcanism Program: Report on Lascar (Chile), edited by: Wunderman, R., Bulletin of the Global Volcanism Network 19, Smithsonian Institution, https://doi.org/10.5479/si.GVP.BGVN199401-355100, 1994.
Global Volcanism Program: Lascar (355100) in Volcanoes of the World, v. 4.8.5, edited by: Venzke, E., Smithsonian Institution, 2020 https://doi.org/10.5479/si.GVP.VOTW4-2013, 2013.
Global Volcanism Program: Report on Lascar (Chile), edited by: Crafford, A. E. and Venzke, E., Bulletin of the Global Volcanism Network 41, Smithsonian Institution, https://doi.org/10.5479/si.GVP.BGVN201607-355100, 2016.
González, C., Inostroza, M., Aguilera, F., González, R., Viramonte, J., and Menzies, A.: Heat and mass flux measurements using Landsat images from the 2000–2004 period, Lascar volcano, northern Chile, J. Volcanol. Geoth. Res., 301, 277–292, https://doi.org/10.1016/j.jvolgeores.2015.05.009, 2015.
González, D. M., Bataille, K., Eulenfeld, T., and Franco, L. E.: Temporal seismic wave velocity variations at Láscar volcano, Andean Geol., 43, 240–246, https://doi.org/10.5027/andgeoV43n2-a05, 2016.
González-Ferrán, O.: Volcanes de Chile, Instituto Geografico Militar, Santiago, Chile, 1995.
Healey, G., Slater, D., Lin, T., Drda, B., and Goedeke, A. D.: A system for real-time fire detection, Proc. IEEE Conf. Comput. Vis. Pattern Recognit., 93, 15–17, https://doi.org/10.1109/CVPR.1993.341064, 1993.
Heap, M. J., Troll, V. R., Kushnir, A. R. L., Gilg, H. A., Collinson, A. S. D., Deegan, F. M., Darmawan, H., Seraphine, N., Neuberg, J., and Walter, T. R.: Hydrothermal alteration of andesitic lava domes can lead to explosive volcanic behaviour, Nat. Commun., 10, 5063, https://doi.org/10.1038/s41467-019-13102-8, 2019.
Hellweg, M.: Physical models for the source of Lascar's harmonic tremor, J. Volcanol. Geoth. Res., 101, 183–198, https://doi.org/10.1016/S0377-0273(00)00163-3, 2000.
Hicks, P. D., Matthews, A. J., and Cooker, M. J.: Triggering of a volcanic dome collapse by rainwater infiltration, J. Geophys. Res.-Solid, 115, 1–8, https://doi.org/10.1029/2009JB006831, 2010.
Jolly, A. D., Sherburn, S., Jousset, P., and Kilgour, G.: Eruption source processes derived from seismic and acoustic observations of the 25 September 2007 Ruapehu eruption-North Island, New Zealand, J. Volcanol. Geoth. Res., 191, 33–45, https://doi.org/10.1016/j.jvolgeores.2010.01.009, 2010.
Jordan, T. E., Isacks, B. L., Allmendinger, R. W., Brewer, J. A., Ramos, V. A., and Ando, C. J.: Andean tectonics related to geometry of subducted Nazca plate, Geol. Soc. Am. Bull., 94, 341–361, https://doi.org/10.1130/0016-7606(1983)94<341:ATRTGO>2.0.CO;2, 1983.
Kato, A., Terakawa, T., Yamanaka, Y., Maeda, Y., Horikawa, S., Matsuhiro, K., and Okuda, T.: Preparatory and precursory processes leading up to the 2014 phreatic eruption of Mount Ontake, Japan, Earth Planets Space, 67, 1–11, https://doi.org/10.1186/s40623-015-0288-x, 2015.
Kawakatsu, H., Kaneshima, S., Matsubayashi, H., Ohminato, T., Sudo, Y., Tsutsui, T., Uhira, K., Yamasato, H., Ito, H., and Legrand, D.: Aso94: Aso seismic observation with broadband instruments, J. Volcanol. Geoth. Res., 101, 129–154, https://doi.org/10.1016/S0377-0273(00)00166-9, 2000.
Kern, C., Deutschmann, T., Vogel, L., Wöhrbach, M., Wagner, T., and Platt, U.: Radiative transfer corrections for accurate spectroscopic measurements of volcanic gas emissions, Bull. Volcanol., 72, 233–247, https://doi.org/10.1007/s00445-009-0313-7, 2010.
Lahr, J. C., Chouet, B. A., Stephens, C. D., Power, J. A., and Page, R. A.: Earthquake classification, location, and error analysis in a volcanic environment: implications for the magmatic system of the 1989–1990 eruptions at redoubt volcano, Alaska, J. Volcanol. Geoth. Res., 62, 137–151, https://doi.org/10.1016/0377-0273(94)90031-0, 1994.
Le Guern, F., Tazieff, H., and Pierret, R. F.: An example of health hazard: People killed by gas during a phreatic eruption: Diëng plateau (Java, Indonesia), February 20th 1979, Bull. Volcanol., 45, 153–156, https://doi.org/10.1007/BF02600430, 1982.
Martinelli, B.: Analysis of seismic patterns observed at Nevado del Ruiz volcano, Colombia during August–September 1985, J. Volcanol. Geoth. Res., 41, 297–314, https://doi.org/10.1016/0377-0273(90)90093-U, 1990.
Mason, B. G., Pyle, D. M., Dade, W. B., and Jupp, T.: Seasonality of volcanic eruptions, J. Geophys. Res.-Solid, 109, B04206, https://doi.org/10.1029/2002JB002293, 2004.
Mastin, L. G.: Thermodynamics of gas and steam-blast eruptions, Bull. Volcanol., 57, 85–98, https://doi.org/10.1007/BF00301399, 1995.
Matthews, A. J. and Barclay, J.: A thermodynamical model for rainfall-triggered volcanic dome collapse, Geophys. Res. Lett., 31, L05614, https://doi.org/10.1029/2003gl019310, 2004.
Matthews, A. J., Barclay, J., Carn, S., Thompson, G., Alexander, J., Herd, R., and Williams, C.: Rainfall-induced volcanic activity on Montserrat, Geophys. Res. Lett., 29, 1644, https://doi.org/10.1029/2002GL014863, 2002.
Matthews, S. J., Gardeweg, M. C., and Sparks, R. S. J.: The 1984 to 1996 cyclic activity of Lascar Volcano, northern Chile: Cycles of dome growth, dome subsidence, degassing and explosive eruptions, Bull. Volcanol., 59, 72–82, https://doi.org/10.1007/s004450050176, 1997.
Menard, G., Moune, S., Vlastélic, I., Aguilera, F., Valade, S., Bontemps, M. and Gonzáález, R.: Gas and aerosol emissions from Lascar volcano (Northern Chile): Insights into the origin of gases and their links with the volcanic activity, J. Volcanol. Geoth. Res., 287, 51–67, https://doi.org/10.1016/j.jvolgeores.2014.09.004, 2014.
Messerli, B., Grosjean, M., Bonani, G., Burgi, A., Geyh, M. A., Graf, K., Ramseyer, K., Romero, H., Schotterer, U., Schreier, H., and Vuille, M.: Climate Change and Natural Resource Dynamics of the Atacama Altiplano during the Last 18,000 Years: A Preliminary Synthesis, Mt. Res. Dev., 13, 117–127, https://doi.org/10.2307/3673629, 1993.
Mori, T., Mori, T., Kazahaya, K., Ohwada, M., Hirabayashi, J., and Yoshikawa, S.: Effect of UV scattering on SO2 emission rate measurements, Geophys. Res. Lett., 33, L17315, https://doi.org/10.1029/2006GL026285, 2006.
Munoz-Saez, C., Namiki, A., and Manga, M.: Geyser eruption intervals and interactions: Examples from El Tatio, Atacama, Chile, J. Geophys. Res.-Solid, 120, 1–18, https://doi.org/10.1002/2015JB012364, 2015.
Nakamichi, H., Kumagai, H., Nakano, M., Okubo, M., Kimata, F., Ito, Y., and Obara, K.: Source mechanism of a very-long-period event at Mt Ontake, central Japan: Response of a hydrothermal system to magma intrusion beneath the summit, J. Volcanol. Geoth. Res., 187, 167–177, https://doi.org/10.1016/j.jvolgeores.2009.09.006, 2009.
Newhall, C. G., Albano, S. E., Matsumoto, N., and Sandoval, T.: Roles of groundwater in volcanic unrest, J. Geol. Soc. Philipp., 56, 69–84, 2001.
Oikawa, T., Yoshimoto, M., Nakada, S., Maeno, F., Komori, J., Shimano, T., Takeshita, Y., Ishizuka, Y., and Ishimine, Y.: Reconstruction of the 2014 eruption sequence of Ontake Volcano from recorded images and interviews, Earth Planet Space, 68, 79, https://doi.org/10.1186/s40623-016-0458-5, 2016.
ONEMI, O. N. de E.: Se declara Alerta Amarilla para la Región de Antofagasta por nucleo frio en altura, October 18th, 2015, available at: http://www.onemi.cl/alerta/se-declara-alerta-temprana-preventiva-para-la-region-de (last access: 18 March 2019), 2015.
Orr, T. R., and Hoblitt, R. P.: A versatile time-lapse camera system developed by the Hawaiian Volcano Observatory for use at Kilauea Volcano, Hawai'i, US Geological Survey Scientific Investigations Report 2008-5117, US Geological Survey, p. 8, https://doi.org/10.3133/sir20085117, 2008.
OVDAS, O. V. de los A. del S.: Reporte de Actividad Volcánica (RAV) – Región de Antofagasta, Temuco, Servicio Nacional de Geología y Minería (SERNAGEOMIN), Temuco, 2015.
Paskievitch, J., Read, C., and Parker, T.: Remote telemetered and time-lapse cameras at Augustine Volcano: Chapter 12 in The 2006 eruption of Augustine Volcano, Alaska, US Geological Survey Professional Paper 1769-12, US Geological Survey, 285–293, https://doi.org/10.3133/pp176912, 2010.
Patanè, D., Di Grazia, G., Cannata, A., Montalto, P., and Boschi, E.: Shallow magma pathway geometry at Mt. Etna volcano, Geochem. Geophy. Geosy., 9, Q12021, https://doi.org/10.1029/2008GC002131, 2008.
Pavez, A., Remy, D., Bonvalot, S., Diament, M., Gabalda, G., Froger, J. L., Julien, P., Legrand, D., and Moisset, D.: Insight into ground deformations at Lascar volcano (Chile) from SAR interferometry, photogrammetry and GPS data: Implications on volcano dynamics and future space monitoring, Remote Sens. Environ., 100, 307–320, https://doi.org/10.1016/j.rse.2005.10.013, 2006.
Platt, U. and Stutz, J.: Differential Absorption Spectroscopy, in: Differential Optical Absorption Spectroscopy, Springer, Berlin, Heidelberg, 135–174, 2008.
Richter, G., Wassermann, J., Zimmer, M., and Ohrnberger, M.: Correlation of seismic activity and fumarole temperature at the Mt. Merapi volcano (Indonesia) in 2000, J. Volcanol. Geoth. Res., 135, 331–342, https://doi.org/10.1016/j.jvolgeores.2004.03.006, 2004.
Richter, N., Salzer, J. T., de Zeeuw-van Dalfsen, E., Perissin, D., and Walter, T. R.: Constraints on the geomorphological evolution of the nested summit craters of Láscar volcano from high spatio-temporal resolution TerraSAR-X interferometry, Bull. Volcanol., 80, 21, https://doi.org/10.1007/s00445-018-1195-3, 2018.
Rouwet, D., Sandri, L., Marzocchi, W., Gottsmann, J., Selva, J., Tonini, R., and Papale, P.: Recognizing and tracking volcanic hazards related to non-magmatic unrest: A review, J. Appl. Volcanol., 3, 17, https://doi.org/10.1186/s13617-014-0017-3, 2014.
Salzer, J. T., Thelen, W. A., James, M. R., Walter, T. R., Moran, S., and Denlinger, R.: Volcano dome dynamics at Mount St. Helens: Deformation and intermittent subsidence monitored by seismicity and camera imagery pixel offsets, J. Geophys. Res.-Solid, 121, 7882–7902, https://doi.org/10.1002/2016JB013045, 2016.
Scarpa, R. and Tilling, R. I.: Monitoring and Mitigation of Volcano Hazards, Springer, Berlin, Heidelberg, 2012.
Sens-Schönfelder, C. and Wegler, U.: Passive image interferemetry and seasonal variations of seismic velocities at Merapi Volcano, Indonesia, Geophys. Res. Lett., 33, L21302, https://doi.org/10.1029/2006GL027797, 2006.
Siebert, L., Simkin, T., and Kimberly, P.: Volcanoes of the world, Smithsonian Institution, available at: https://www.ucpress.edu/book/9780520268777/volcanoes-of-the-world (last access: 27 May 2019), 2010.
Sparks, R. S. J.: Forecasting volcanic eruptions, Earth Planet. Sc. Lett., 210, 1–15, https://doi.org/10.1016/S0012-821X(03)00124-9, 2003.
Stix, J. and de Moor, J. M.: Understanding and forecasting phreatic eruptions driven by magmatic degassing, Earth Planets Space, 70, 83, https://doi.org/10.1186/s40623-018-0855-z, 2018.
Tamburello, G., Hansteen, T. H., Bredemeyer, S., Aiuppa, A., and Tassi, F.: Gas emissions from five volcanoes in northern Chile and implications for the volatiles budget of the Central Volcanic Zone, Geophys. Res. Lett., 41, 4961–4969, https://doi.org/10.1002/2014GL060653, 2014.
Tassi, F., Aguilera, F., Vaselli, O., Medina, E., Tedesco, D., Delgado Huertas, A., Poreda, R., and Kojima, S.: The magmatic- and hydrothermal-dominated fumarolic system at the Active Crater of Lascar volcano, northern Chile, Bull. Volcanol., 71, 171–183, https://doi.org/10.1007/s00445-008-0216-z, 2009.
Tokarev, P. I.: On a possibility of forecasting of bezymianny volcano eruptions according to seismic data, Bull. Volcanol., 26, 379–386, https://doi.org/10.1007/BF02597299, 1963.
Vandaele, A. C., Simon, P. C., Guilmot, J. M., Carleer, M., and Colin, R.: SO2 absorption cross section measurement in the UV using a Fourier transform spectrometer, J. Geophys. Res., 99, 25599, https://doi.org/10.1029/94jd02187, 1994.
Verstockt, S., Lambert, P., Van De Walle, R., Merci, B., and Sette, B.: State of the art in vision-based fire and smoke detection, Proc. 14th Int. Conf. Autom. Fire Detect., 2, 285–292, 2009.
Viramonte, J., Aguilera, F., Delgado, H., Rodriguez, L., Guzman, K., Jimenez, J., and Becchio, R.: A new eruptive cycle of Lascar Volcano (Chile): the risk for the aeronavigation in northern Argentina, in: Garavolcan 2006, 22–26 May 2006, Tenerife, Spain, 2006.
Voigt, S., Orphal, J., Bogumil, K., and Burrows, J. P.: The temperature dependence (203–293 K) of the absorption cross sections of O3 in the 230–850 nm region measured by Fourier-transform spectroscopy, J. Photochem. Photobiol. A, 143, 1–9, https://doi.org/10.1016/S1010-6030(01)00480-4, 2001.
Walter, T., Gaete, A., Mikulla, S., Kujawa, C., Salzer, J., and Zimmer, M.: Seismic monitoring at Lascar volcano after 2014 Iquique earthquake, GFZ Data Services, Other/Seismic Network, https://doi.org/10.14470/3R7569753098, 2014.
Walter, T. R.: Low cost volcano deformation monitoring: optical strain measurement and application to Mount St. Helens data, Geophys. J. Int., 186, 699–705, https://doi.org/10.1111/j.1365-246X.2011.05051.x, 2011.
Walter, T. R., Subandriyo, J., Kirbani, S., Bathke, H., Suryanto, W., Aisyah, N., Darmawan, H., Jousset, P., Luehr, B. G., and Dahm, T.: Volcano-tectonic control of Merapi's lava dome splitting: The November 2013 fracture observed from high resolution TerraSAR-X data, Tectonophysics, 639, 23–33, https://doi.org/10.1016/j.tecto.2014.11.007, 2015.
Witt, T. and Walter, T. R.: Video monitoring reveals pulsating vents and propagation path of fissure eruption during the March 2011 Pu'u 'Ō'ō eruption, Kilauea volcano, J. Volcanol. Geoth. Res., 330, 43–55, https://doi.org/10.1016/j.jvolgeores.2016.11.012, 2017.
Wooster, M. J.: Long-term infrared surveillance of Lascar Volcano: Contrasting activity cycles and cooling pyroclastics, Geophys. Res. Lett., 28, 847–850, https://doi.org/10.1029/2000GL011904, 2001.
Wooster, M. J. and Rothery, D. A.: Thermal monitoring of Lascar Volcano, Chile, using infrared data from the along-track scanning radiometer: a 1992–1995 time series, Bull. Volcanol., 58, 566–579, https://doi.org/10.1007/s004450050163, 1997.
Yamamoto, T., Nakamura, Y., and Glicken, H.: Pyroclastic density current from the 1888 phreatic eruption of Bandai volcano, NE Japan, J. Volcanol. Geoth. Res., 90, 191–207, https://doi.org/10.1016/S0377-0273(99)00025-6, 1999.
Zimmer, M., Walter, T. R., Kujawa, C., Gaete, A., and Franco-Marin, L.: Thermal and gas dynamic investigations at Lastarria volcano, Northern Chile. The influence of precipitation and atmospheric pressure on the fumarole temperature and the gas velocity, J. Volcanol. Geoth. Res., 346, 134–140, https://doi.org/10.1016/j.jvolgeores.2017.03.013, 2017.