the Creative Commons Attribution 4.0 License.
the Creative Commons Attribution 4.0 License.
 | 28 Jan 2020
Remote sensing in an index-based insurance design for hedging economic impacts on rice cultivation
Omar Roberto Valverde-Arias
Paloma Esteve
Ana María Tarquis
Alberto Garrido
Rice production in Ecuador is steadily affected by extreme climatic events that make it difficult for farmers to cope with production risk, threatening rural livelihoods and food security in the country. Developing agricultural insurance is a policy option that has gained traction in the last decade. Index-based agricultural insurance has become a promising alternative that allows insurance companies to ascertain and quantify losses without verifying a catastrophic event in situ, lowering operative costs and easing implementation. But its development can be hindered by basis risk, which occurs when real losses in farms do not fit accurately with the selected index. Avoiding basis risk requires assessing the variability within the insurance application area and considering it for representative index selection. In this context, we have designed an index-based insurance (IBI) that uses a vegetation index (normalized difference vegetation index – NDVI) as an indicator of drought and flood impact on rice in the canton of Babahoyo (Ecuador). Babahoyo was divided in two agro-ecological homogeneous zones (AHZs) to account for variability, and two NDVI threshold values were defined to consider, first, the event impact on crops (physiological threshold) and, second, its impact on the gross margin (economic threshold). This design allows us to set up accurate insurance premiums and compensation that fit the particular conditions of each AHZ, reducing basis risk.
- Article
(1811 KB) - Full-text XML
- BibTeX
- EndNote


Rice-cropping area in Ecuador has witnessed a reduction trend in recent years (FAO, 2018). From an average cultivated area around 400 000 ha between 2005 and 2015, the annual average decreased to 385 039 ha in 2016 and to 370 406 ha in 2017, falling considerably to 301 853 ha in 2018 (Aguilar et al., 2015, 2018; INEC, 2018; Montaño, 2005). Such a downward trend rises the government's concern, as rice production plays an important role in Ecuadorian food security (Pinstrup-Andersen, 2009) and is central to rural livelihoods in certain areas of the country. Daily rice consumption per person is 115 g (Montaño, 2005), which currently represents an annual demand of 714 000 t. Additionally, rice production in Ecuador offers employment to 22 % of the economically active population, involving around 140 000 families. For these reasons, the Ecuadorian government supports rice producers through technical advice, subsidized inputs, credit lines for farm modernization and minimum support prices (Eymond and Santos, 2013). However, these supporting mechanisms have not efficiently prevented the gradual reduction of rice-cropping area, which is necessary to adopt additional measures that support the stability of farmers' revenues.
The FAO and UN-Habitat (2010) reported that out of the 29 most important disasters in Ecuador in the last 20 years, 59 % had a climatic origin. Additionally, the most common extreme climatic events in Ecuador are flood and drought, according to the CRED (2015). Sivakumar et al. (2005) mentioned that extreme climatic events have increased both in frequency and intensity, making it more difficult for farmers to maintain their crop productions (Cai et al., 2014; Isch, 2011). These climatic phenomena, which are further accentuated by climate change, are key drivers of economic losses that hit especially small rice farmers in the tropics (Harvey et al., 2014) and are one of the main reasons behind rice-cropping area loss in Ecuador (Eymond and Santos, 2013; Poveda and Andrade, 2013). For instance, the 2012 winter impact census of agriculture (MAGAP, 2012) showed that from 140 000 cultivated hectares analysed, 56 562 ha were entirely destroyed by flood and 24 103 ha were partially damaged by the same event. In this context, risk management mechanisms, such as agricultural insurance, can importantly contribute to reducing rice producers' vulnerability and to protecting them from the economic losses driven by climatic extremes.
Agricultural insurance is an effective tool for transferring production risk from farmers to other entities. It allows farmers to meet their credit obligations and minimize the effect of extreme climatic events on their revenue (Xu and Liao, 2014). Moreover, agricultural insurance contributes to keeping farmers in the agricultural business, improving their resilience and preserving food security (Bullock et al., 2017; Patt et al., 2009). In pursuit of these goals, Ecuador started to implement, in 2010, conventional insurance through the Agroseguro system that includes a 60 % subsidy of the insurance's premium cost (MAG, 2018). This is a multi-peril insurance system that covers some crops, including rice, requiring an in situ verification in the case of disaster occurrence. Under the coverage of this insurance, in the case of a generalized extreme event, the insurance company's in situ verification capacity could be exceeded, delaying payouts, and some remote regions could be uncovered. Moreover, Medina (2017) suggests that conventional insurance in Ecuador may be inefficient due to asymmetric information that may increase adverse selection and moral hazard. Therefore, even if the current Agroseguro insurance system has importantly supported farmers along the last decade, it is important for the Ecuadorian government to step forward to the next level in the agricultural insurance field to expand the insurance coverage and reduce transaction costs, resulting in lower premium prices and a more efficient system.
Among different types of agricultural insurance schemes, index-based insurance (IBI) is a promising tool for providing coverage to large agricultural areas around the world (Mobarak and Rosenzweig, 2013), based on the use of an index highly correlated with loss that avoids the need for field loss verification (Carter et al., 2011). The use of such an index as a trigger for indemnity payments significantly reduces the costs for the insurance company in relation to loss verification and payment procedure and reduces fraud, moral hazard and adverse selection (Barnett and Mahul, 2007; de Leeuw et al., 2014), which are frequent drawbacks of conventional insurance. IBI has been underlined as a feasible and efficient risk management tool (Jensen and Barrett, 2017; Jensen et al., 2018; Takahashi et al., 2016), and several studies demonstrated its successful implementation using the weather and vegetation index among small- and medium-sized farms in developing countries (Mcintosh et al., 2013; Mude et al., 2009, among others) that can benefit from lower insurance premiums due to lower implementation costs. In this regard, IBI represents an alternative to conventional insurance in Ecuador, which could be applied by insurance companies and the government to satisfy the risk management needs of rice producers.
However, the technical, economic and administrative hurdles are significant. A major problem that may arise in the implementation of IBI is the lack of proper correlation between the index and the losses experienced by farmers in the index influence area (IIA), which is the area for which a defined index is representative (Elabed et al., 2013). This problem, known as basis risk, occurs when some farmers from the pool of insured agents do not receive any compensation, even when experiencing losses, and some others that are not affected are indemnified (Clarke, 2016; Hellmuth et al., 2009). To avoid this, IBI can only be applied over spatially homogeneous areas because its main principle is based on the use of a single index over the IIA. Nevertheless, these conditions of homogeneity are rarely found because agriculture is practised in heterogeneous areas. To keep basis risk in non-significant levels, index selection and analysis may be crucial, especially with respect to the way variability within the IIA could influence index values.
Among the indices used in IBI design, several authors (e.g. Jensen et al., 2018; Rao, 2010) underlined vegetation indices as options that reduce basis risk and provide reasonably accurate loss estimations and that can significantly profit from recent advances in remote sensing, geographical information systems, and satellite and drone imagery, among others. Particularly, the normalized difference vegetation index (NDVI) or the enhanced vegetation index (EVI) are the ones performing the best in terms of detection of drought and flood impacts and estimating yields, with the NDVI being one of the most used current IBI systems in crop monitoring, as mentioned in much of the literature (e.g. Rhee et al., 2010; Van Tricht et al., 2018; Vroege et al., 2019; Zhang et al., 2017). In line with this, in this research we aim to design an IBI based on the NDVI for rice crops in Ecuador that covers farmers against drought and flood events, accounting for variability within the IIA. For this, we build upon previous work developed by Arias et al. (2018) for the rice-producing coastal region of Ecuador that identified agro-ecological homogeneous zones (AHZs) based on topographic, soil and climatic characteristics using principal components and hierarchical cluster analysis. Within that area, in the canton of Babahoyo, two AHZs (f7 and f15) were located, and their influence on the NDVI in rice cultivation was found to be significant (Valverde-Arias et al., 2019). For the IBI design, two thresholds in the NDVI values will be defined. The physiological threshold evidences the occurrence of an extreme climatic event and its impact over rice crop yield. While the economic threshold is reached when a moderate climatic event occurs, its impact over the rice crop yield is not so deep, letting farmers at least cover the production costs. For these thresholds, two scenarios are investigated; the first one considers a differentiated production cost for each AHZ. The second scenario uses the same average production cost for both zones f7 and f15. Then, the damage compensation and the premium cost are calculated for each threshold, considering the two scenarios and the AHZs.
This section presents the data and methods followed for the development of an IBI. Starting with a description of the study area location (Sect. 2.1) and data used (Sect. 2.2), Sect. 2.3 explains how we assessed the significance of the AHZ impact on the NDVI. Then, we estimate the functional relationship between the NDVI and rice yield (Sect. 2.4), determine the NDVI thresholds (Sect. 2.5), and assess risk in each AHZ (section 2.6). Finally, for the design of the IBI contract, in Sect. 2.7 we explain first how indemnities are calculated and how the insurance premiums are estimated considering different zones and different coverages.
2.1 Location of study area
This study is located in Ecuador, South America (Fig. 1a). Rice production in Ecuador is concentrated in the coastal area of the country (see Fig. 1b), especially in the provinces of Guayas and Los Ríos (55 % and 37 % of rice-cropping area respectively during the rainy season). This study focuses on rice cultivation area in Babahoyo, which is one of the main rice-producing areas in the province of Los Ríos (Fig. 1c), where 84 % of the rural population of Babahoyo is involved in agriculture, with rice being the main crop in the region and having 46 556 ha, which represents 45 % of the total cultivated area in this canton (IEE, 2009; MAGAP, 2014). The location of Babahoyo on an extensive plain of the Ecuadorian coastal region makes it very vulnerable to floods, and as Valverde-Arias et al. (2018) mentioned in their study, this canton is also susceptible to droughts. Therefore, given the importance of rice production in the region's economy and its vulnerability to hazardous climatic events, designing and implementing an IBI that accounts for variability within the area and that provides accurate premium prices and indemnities may importantly contribute to rice producers' welfare and stability.
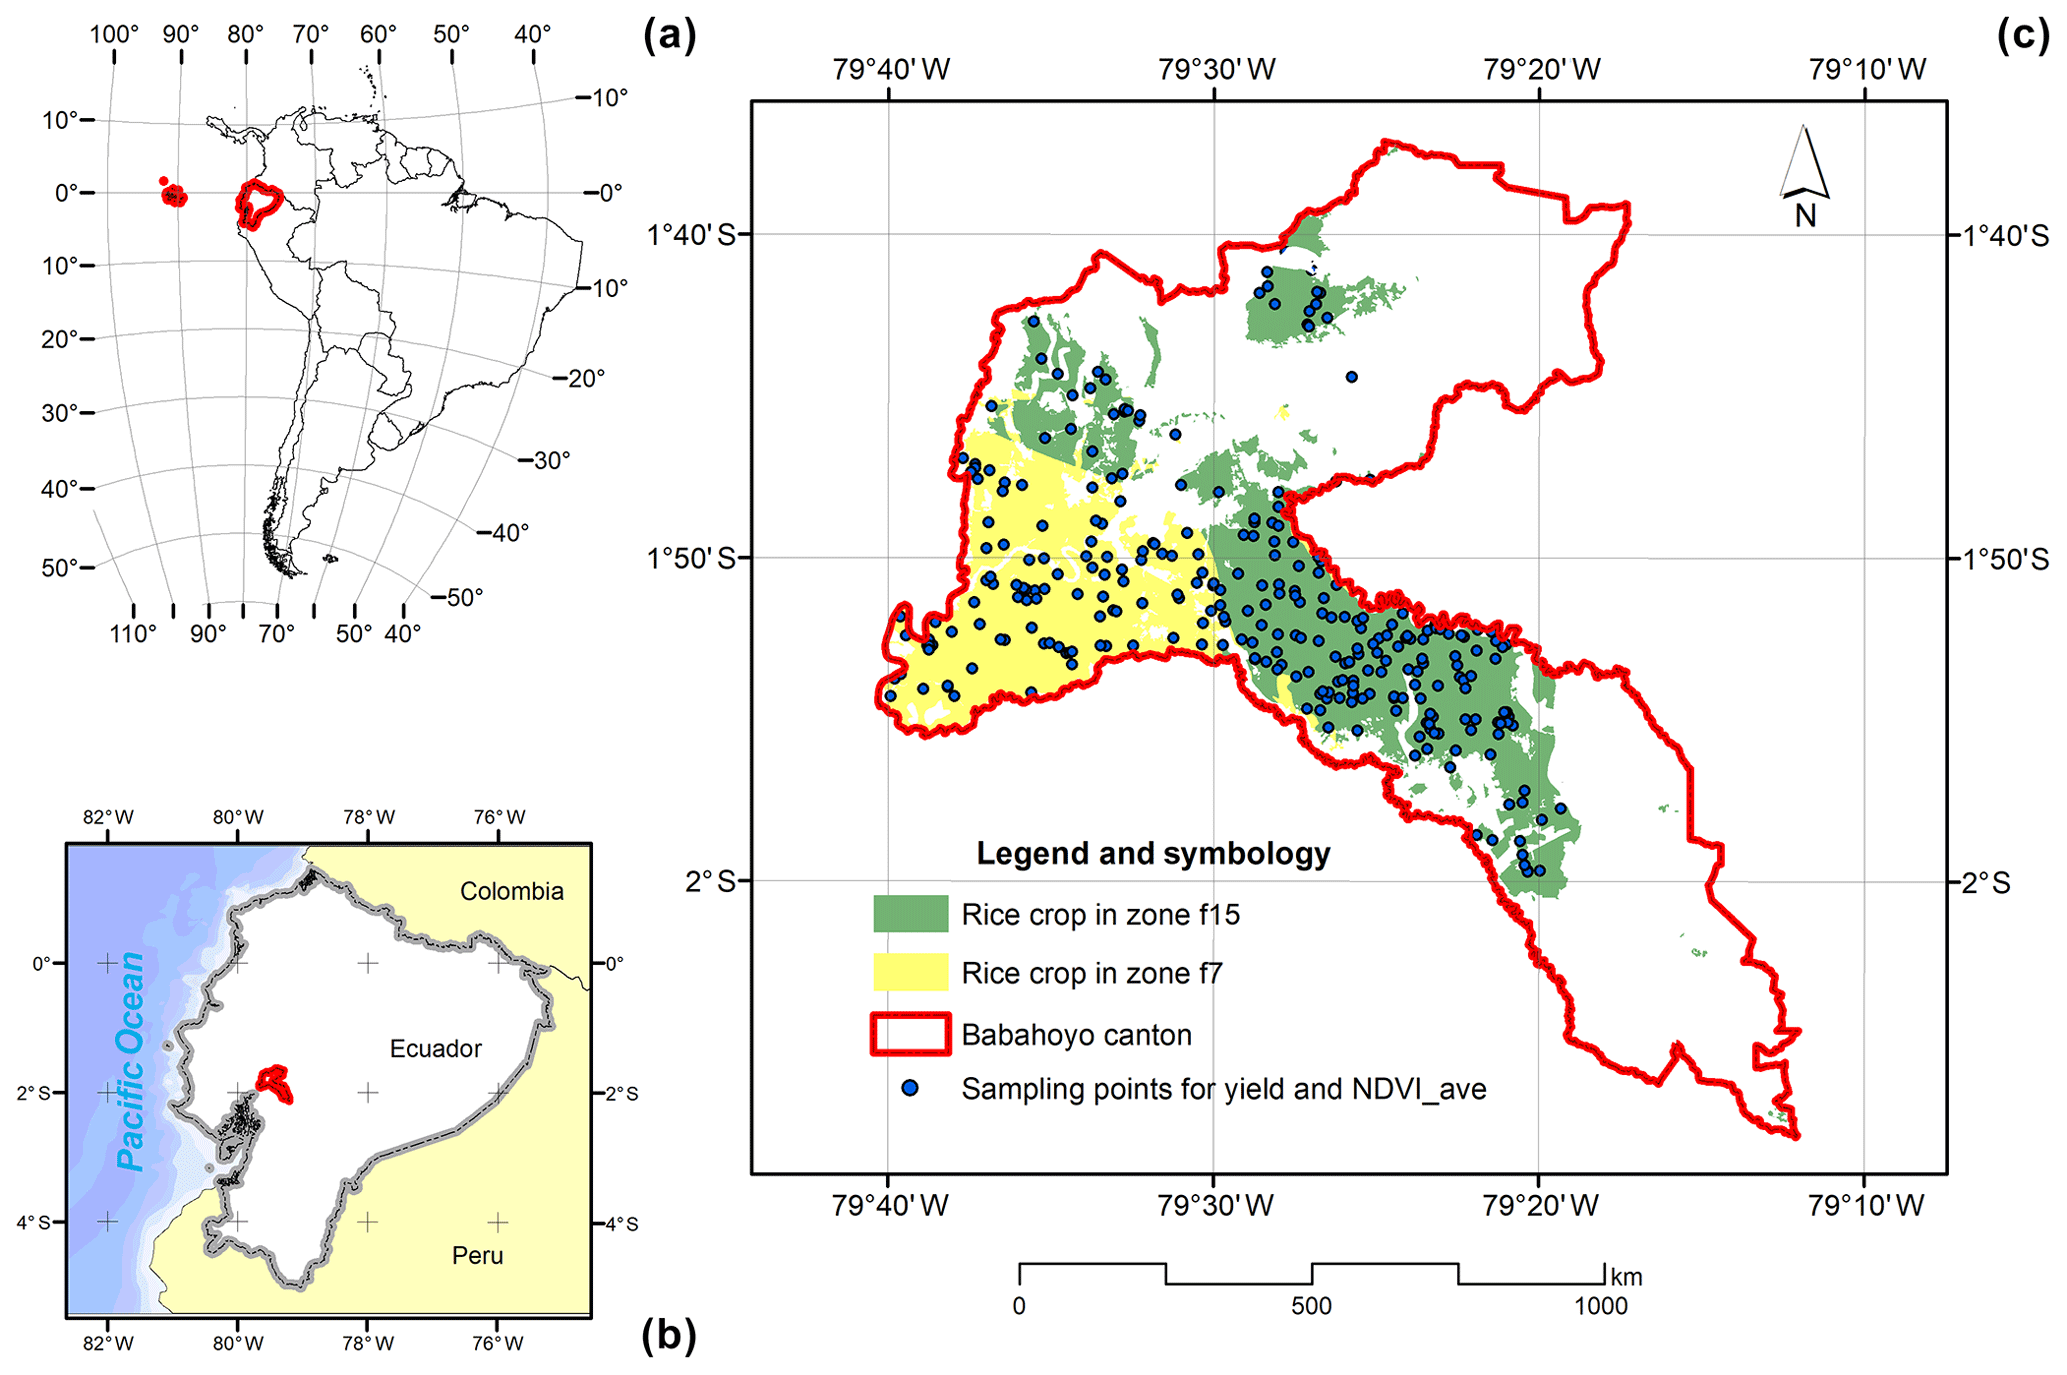
Figure 1(a) Location of Ecuador in South America, (b) location of Babahoyo in Ecuador, and (c) agro-ecological homogeneous zones f7 and f15 over rice cultivation area with yield observations in Babahoyo.
2.2 Cartographic data
2.2.1 Agro-ecological homogeneous zones map
In this research we build on the AHZ map generated for the Ecuadorian coastal region in the study of Arias et al. (2018) that includes our study area (Babahoyo). In this map, portions of land with similar agro-ecological characteristics were grouped in homogeneous zones (AHZs) using a statistical method of principal component analysis and hierarchical cluster analysis. This zoning was evaluated through NDVI imagery in the study of Valverde-Arias et al. (2019), which proved that this zoning is adequate and necessary for designing an efficient IBI, reducing basis risk. According to the map, there are 11 AHZs in Babahoyo, from which seven include rice crop cultivation land. Two of these seven AHZs, f7 and f15, were selected for the study, as they account for more than 90 % of the total rice-cultivated area in Babahoyo (see Fig. 1c; f7 in yellow and f17 in green).
2.2.2 Data from satellite imagery
Satellite imagery data were obtained from the MODIS MOD13Q1V6 product (NASA LP DAAC, 2015; see Didan et al., 2015, for a description of its characteristics). MODIS imagery was selected due to its long temporal coverage (imagery data available since 2001), which is necessary for constructing a historical sequence of the NDVI. MODIS's spatial resolution 250 m is moderate, but for regional applications of crop monitoring this resolution is sufficient (Jiao et al., 2019; Sánchez et al., 2018). Since 2015, Sentinel 2 imagery has been available with a resolution of 10 to 60 m, depending on the bands. Many studies have used Sentinel for monitoring the crop state, with very positive results (Inglada et al., 2015; Van Tricht et al., 2018; Veloso et al., 2017). However, current time data series availability of Sentinel does not allow its use for IBI design, as at least 10 years of historical data are needed for insurance design (Rao, 2010). Despite this, Sentinel will become, in the coming years, an important alternative in the insurance field. Also, Sentinel 1, which is a radar sensor, could be an interesting option for rice monitoring in the zones where the steady presence of clouds represents a problem, as Torbick et al. (2017) mentioned in their study.
The imagery covers the rice cycle during the rainy season (January to May). There is one image for each 16 d period from 2001 to 2017, which makes 170 images in total (17 years × 5 months × two per month). The rice crop cycle in Ecuador takes 120 d. The sowing date starts around 15 January, and sometimes it is delayed, depending on the onset of the rainy season.
The downloaded imagery have a hierarchical data format (HDF), which is a multilayer file (12 layers; Didan, 2015); however, we used the layer HDF:0, which corresponds to NDVI values. Additionally, we used the quality assurance layer (quality layer: 250 m 16 d VI quality) included in the HDF file of NDVI MODIS imagery. In this layer, each pixel has a rank key that identifies the pixel quality, and the rank key of 0 means good data; it should be with confidence. Then, we used only pixels with a rank key of 0 (Didan et al., 2015).
2.3 Statistical analysis
NDVI values over rice along its crop cycle were analysed for the period 2001 to 2017. NDVI_ave is the average of all the NDVI measures of the rice crop cycle (January to May) for each observation point. We sampled 30 % of the total pixels of rice crops in Babahoyo, resulting in 31 756 observations: 13 498 in AHZ f7 and 18 258 in AHZ f15. Following Olofsson et al. (2014) we used Eq. (1) to calculate the minimum size of the sample. The adequate sample size for this stratified design should be above 12.77 % of the total pixels in each stratum (AHZ f7 and f15). Also, Valverde-Arias et al. (2019) demonstrated that a 10 % sample was significantly representative in this case. Therefore, 30 % is an adequate sampling size that ensures representativeness of the sample:
where N is number of the total spatial units in the area of interest (pixels), is the standard error of the overall accuracy that we would like to achieve, Wi is the mapped proportion of area of class i, and Si is the standard deviation of stratum i.
Descriptive statistics were applied to the NDVI_ave dataset, including the normality test of Kolmogorov–Smirnov, which is recommended for more than 50 observations (Razali and Wah, 2011). If the dataset fits a normal distribution, an analysis of variance (ANOVA) will be applied for comparing the means of two variability factors (zones and years). Otherwise, we will determine which distribution this dataset fits, and the test of Kruskal–Wallis will be used for comparing the median of AHZs and years. If significant differences are found among years, the least significant difference (LSD) multiple-rank test for means (Williams and Abdi, 2010) or the Bonferroni test for medians will be applied. Years that are not significantly different will be grouped into five categories based on NDVI_ave values: very low, low, normal, high and very high years.
2.4 Rice yield estimation through NDVI_ave
According to Huang et al. (2013) remote-sensing products can be used for generating yield estimation models that do not require variables, as crop management or fertilizer applications. Robust results are obtained in rice yield prediction even at the province level. Quarmby et al. (1993) mentioned that rice and maize yields could be estimated accurately by simple linear regression between the NDVI and yield; in addition, Son et al. (2014) suggested that the use of multi-temporal NDVI data for estimating rice yield on a large scale should be a possible and accurate alternative. In this research, we used the normal distribution Eq. (2) for estimating rice yield from NDVI_ave values, quantifying in this way the economic losses in rice cultivation caused by extreme climatic events. The estimation of rice yield was based on the relationship with the NDVI_ave and the crop state:
where σ is the standard deviation, σ2 is variance, X is the independent variable (NDVI_ave), Y is the dependent variable (estimated rice yield), and μ is the arithmetical mean of NDVI_ave in the years 2016 and 2017.
The General Coordination of the National Information System (CGSIN – acronym in Spanish) of the Ecuadorian Ministry of Agriculture, Livestock, Aquaculture and Fisheries (MAG) has conducted a rice yield estimation project since 2014, when it began sampling yields across mapped rice areas (Moreno, 2014). Thus, 369 georeferenced rice yield observations (t ha−1) were available for 2014–2017 rain-fed cycles (January to May) in the study area over AHZs f7 and f15 (see Fig. 1c). Therefore, we used these rice yield observations with their corresponding spatial and temporal NDVI_ave values for obtaining the parameters included in Eq. (2) (Valverde-Arias et al., 2019). The robustness of this model was evaluated through the root-mean-square error (RMSE; %) and R2 coefficient.
2.5 Threshold determination
There are three different levels of rice crop loss impacts, caused by drought and flood, that should be evaluated based on the vegetation index selected. In the first one, catastrophic impact, the crops are acutely affected, and the farmers cannot recover any part of their investment. In the second level, physiological impact, the crops are strongly affected but farmers can recover part of their investment. Finally, with economic impact, the crop loss impact still allows farmers to recover their investment to break even or have null profit. To differentiate between these three levels two NDVI_ave thresholds are needed.
According to LSD and Bonferroni multiple-range tests, years with the lowest NDVI_ave means and medians are selected as the more representative physiological threshold. Then, we investigate whether these years have actually been affected by floods or drought through the climatic application of the National Oceanic and Atmospheric Administration (NOAA, 2018). Finally, we verified that these thresholds correspond to the reality, comparing the estimated yield obtained using the NDVI_ave thresholds with the expected yields in each AHZ and cantonal level (at the Babahoyo cantonal level) in normal years.
For the economic threshold, we set an NDVI_ave value that let farmers cover at least their production cost. Thus, we considered the sale price at farm-gate value for a tonne of rice and the production cost in two scenarios: scenario 1 (when we consider differentiated production cost for AHZs f7 and f15) and scenario 2 (non-differentiated production cost for AHZs).
According to CGSIN, there are officially three different rice crop production systems in Ecuador for rain-fed agriculture and two for irrigated agriculture in 2017. Each of them has different production costs, as shown in Table 1, and they depend on the level of farm modernization and whether they are rain-fed or irrigated.
Table 1Official production cost of different rice-production systems in Ecuador in 2017.

Source: MAG (2017).
Since we assessed rice production during the rainy season (January–May), irrigation is not required in normal conditions. For this reason, we use production costs of rain-fed agro-systems. Among rain-fed production systems, we chose the non-technical and semi-technical systems, which are more likely to suffer the impacts of extreme climatic events and therefore are the ones that should acquire insurance. We assigned, to f7, the production cost of a non-technical production system (USD 1022 ha−1), and for f15, we assigned the cost of a semi-technical production system (USD 1629 ha−1) for scenario 1 (see Table 1), as according to Valverde-Arias et al. (2019), f15 has an expected yield higher than f7's yield in regular years, which could be explained by f15's better soil conditions and by having a more technical production system than f7. Then, when we do not consider AHZs, i.e. at the cantonal level, we used a weighted average production cost of these two systems (USD 1259 ha−1). In scenario 2, i.e. when similar costs are assumed for both AHZs, we used the weighted average (USD 1259 ha−1) for all the cases (f7, f15 and cantonal zone).
2.6 Risk assessment in AHZs
Once we found the distribution that fits our data for each AHZ and cantonal zone, we simulated, through these distributions, a determined number of NDVI_ave values. Then, we compared the frequency of observed NDVI_ave values with the estimated ones. The basis risk of the estimation was evaluated through the adjusted R2 coefficient (Vedenov and Barnett, 2004).
Lastly, we calculated the proportion of positive events – that is, the number of events equal to or under each threshold (physiological and economic) for each estimated distribution (f7, f15 and cantonal zone). Finally, we tested whether these proportions of f7 and f15 are significantly different from each other or not. This analysis was performed through the Z test of two independent proportions. It consists of determining whether these two proportions, which came from two different populations, are equal (Pardo et al., 1998; Polasek, 2013).
-
Hypothesis.
-
Postulation. The studied variable (NDVI_ave) is dichotomous (below or equal to or above the threshold) in these two populations (f7 and f15). From these two populations, two random samples were extracted independently with n1 and n2 sizes. These samples had p1 and p2 success probability, which are constant in each extraction. Positive events occur when the observation is equal to or below the threshold.
-
Contrast statistics.
-
Critical ratio.
Bilateral: -
Decision. Reject H0 if contrast statistics falls in critical rate or .
2.7 Insurance contract design
2.7.1 Indemnity calculation
The indemnity is the amount of money that an insured individual receives when a covered hazard occurs. In this case, we have two insurance policy options. The first one is working capital, where the insured amount corresponds to the money necessary for recovering the investment (production cost) that a farmer has spent. The second one is the profit (gross margin), where the insured amount is the money that a farmer would obtain selling their production after covering their production cost in a normal year.
In other words, for the first option the compensation will cover the yield reduction between the economic and physiological threshold. In the second case, the compensation will cover the difference between the expected yield in a normal year and the yield obtained at the economic threshold.
Thus, the indemnity calculation follows the next equation (Maestro et al., 2016):
where Isz is the net income expected per hectare (USD ha−1) in a normal year, differentiated by the s scenario (it could be 1 or 2) and z zone (f7, f15 or cantonal zone). Yz is the expected yield (t ha−1) in normal years for the z zone. P is the price of a tonne of rice at a farm (USD t−1). Pcsz is the production cost per hectare of rice cultivation (USD ha−1), differentiated by the s scenario (it could be 1 or 2) and z zone (f7, f15 or cantonal zone). Yz is obtained by applying Eq. (1), and P was calculated from rice price monthly variation along the last 2 years. This value is assumed to be constant (USD 371 t−1) for both AHZs and cantonal zones and for scenario 1 or 2.
To estimate Pcsz, we evaluated two scenarios: scenario 1, with production costs differentiated for each z zone (f7, f15 or cantonal zone), and scenario 2, with the same production costs for all z zones (f7, f15 or cantonal zone).
2.7.2 Premium determination
The commercial or loaded premium cost CPsz is equal to the net premium multiplied by a factor that covers the insurance company profit and loading cost. The net premium or risk premium NPsz has to cover the expected compensation that an insurance company would have to pay during the analysed period. The net premium is calculated as a percentage of Isz. This percentage corresponds to the probability that the insurance company has to compensate Isz in a period of time (Jasiulewicz, 2001; van de Ven et al., 2000). It was expected that the probability of occurrence would be different for each AHZ (f7 and f15). It is also different when the NDVI_ave measure is made at the cantonal level. Thus, we calculated differentiated premium rates for each one of these cases:
where NPsz is the net premium rate (USD ha−1) for scenario s (scenario 1 or 2) and z zone (f7, f15 and cantonal zone). CPsz is the commercial premium rate (USD ha−1) for scenario s (scenario 1 or 2) and z zone (f7, f15 and cantonal zone). Prsz is the probability of sinister occurrence for the s scenario (scenario 1 or 2) and z zone (f7, f15 and cantonal zone). β1 is the insurance company profit (20 % of NPsz). β2 is the operative cost of the insurance plus taxes (5 % of NPsz).
The commercial premium value CPsz in index-based insurance is generally subsidized by the government by around 60 % to small farmers in developing countries (Höppe, 2007; Ricome et al., 2017).
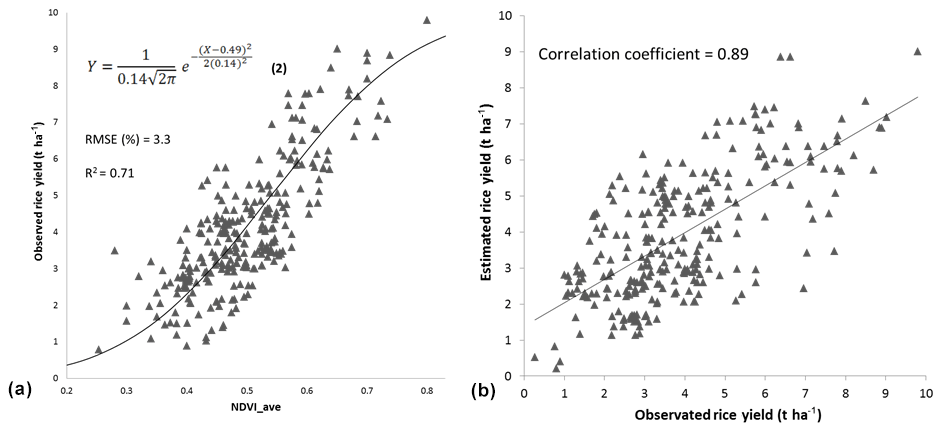
Figure 2(a) Scatter plot of observed rice yield and NDVI_ave, curve of Eq. (1) for estimating yield (Valverde-Arias et al., 2019), and (b) correlation of observed and estimated rice yield.
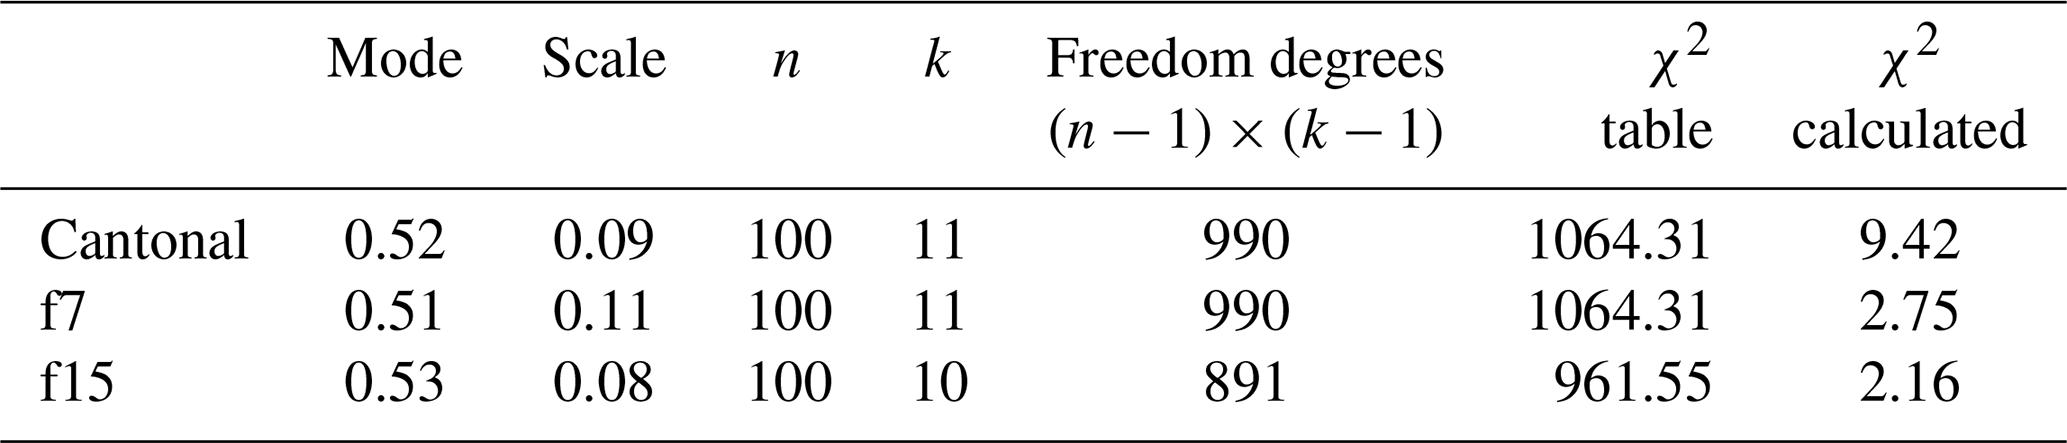
Table 2Parameters of generalized-minimum extreme value (GEVmin) distribution for each AHZ and cantonal zone and distribution adjustment statistic of maximum likelihood.
3.1 Statistical analysis
From descriptive statistical analysis, the kurtosis (0.56) and skewness (−0.78) indicated that the dataset of NDVI_ave fits a normal distribution; however, the Lilliefors (Kolmogorov–Smirnov) normality test showed that D=0.080207 and a p value < lower than 0.05; then we rejected the null hypothesis because the dataset does not come from a normal distribution. We found that our data fit a generalized-minimum extreme value (GEVmin) distribution (Kotz and Nadarajah, 2000) for the cantonal dataset and for the two AHZs (f7 and f15) based on χ2 statistics (Table 2).
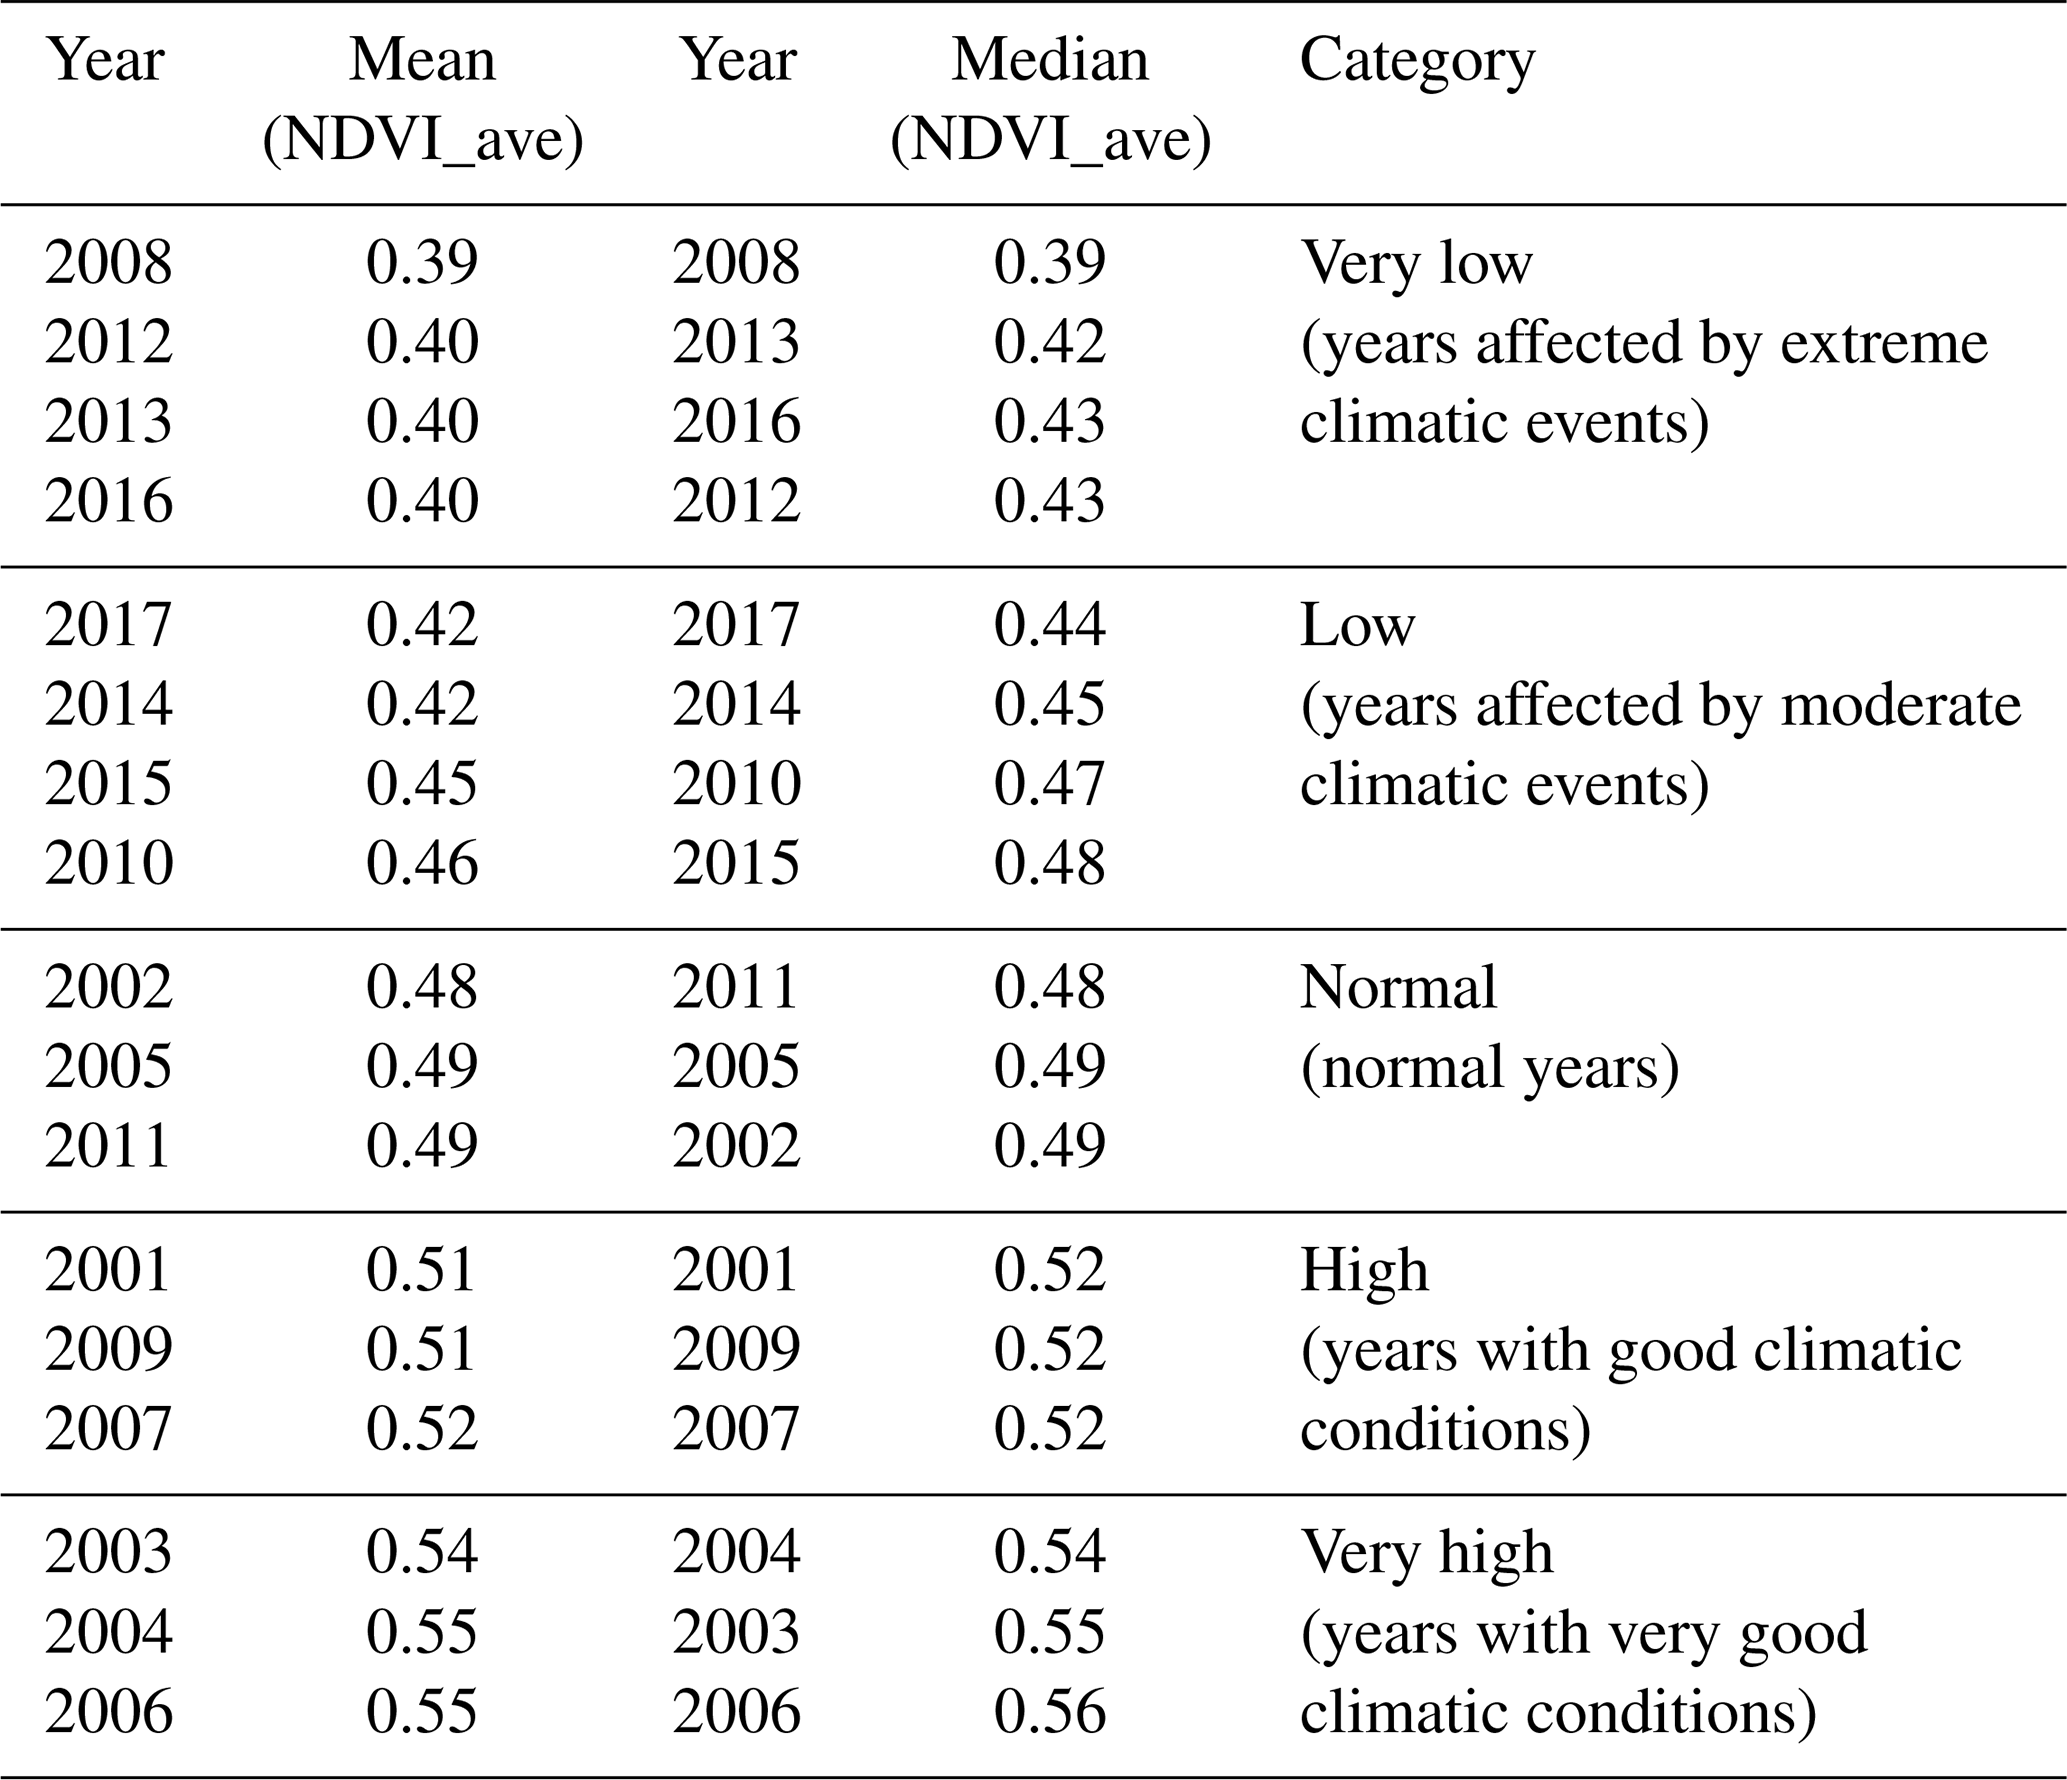
Because the datasets did not fit normal distributions, we used a non-parametric test to determine if NDVI_ave medians in zones f7 and f15 are significantly different. The Kruskal–Wallis test for these zones (χ2=345.48; F.D. = 1; p value < ) shows us that the null hypothesis of f7 and f15 that is equal can be rejected because the p value is lower than 0.05. The same test mentioned before shows us that years are also significant different (χ2=7507.4; F.D. = 16; p value < is also lower than 0.05). Five categories in years are established when the LSD (mean) and Bonferroni (median) test are applied to NDVI_ave values (see Table 3).
Table 3Fisher's least significant difference (LSD) test for comparing means, and Bonferroni test for comparing medians, for years.
3.2 Rice yield estimation
The observed rice yield was plotted versus NDVI_ave in a rice crop cycle. A normal accumulative curve was adjusted (see Eq. 2 in Fig. 2a) to relate both variables; where μ (0.49) is the mean of NDVI_ave measured in yield sampling points of years 2014 through 2017, σ (0.14) is the standard deviation, and X is the NDVI_ave value for which we want to estimate rice yield (Y). The RMSE (%) of 3.3 and an R2 of 0.71 indicate a robust model. This type of curve was selected, instead of a linear regression, to take into account the high values of the NDVI saturation effect on plant biomass (Gu et al., 2013) and the soil saturation effect on low NDVI values (Rondeaux et al., 1996). The correlation coefficient of observed versus estimated rice yield was high (0.89), showing that NDVI_ave is an adequate indicator for assessing the impact of drought and flood over rice crops (Fig. 2b).
3.3 Threshold determination
Since the years have been classified into five categories, we could define the different levels of impact or no impact over rice crops (NDVI_ave), as shown in Table 3. When rice yield is less than 0.5 t ha−1 (NDVI_ave ≤ 0.26), due to damage in rice crops by extreme events, the total loss threshold is neither detectable at the cantonal level nor at the AHZ (f7 and f15) level. Individual NDVI_ave observations equal to or under the total loss threshold can be found but not as a regional measure of NDVI_ave. However, in our IBI design the index measure is an average of all observations within a homogeneous zone, whether cantonal zones or AHZs (f7 and f15).
The physiological threshold represents the maximum rice crop damage that can be detected through NDVI_ave at the regional scale, which has been caused by an extreme climatic event. It is fixed (0.4) for both AHZs (f7 and f15) and cantonal zones (see Table 4). The years when we reached the physiological threshold in our dataset were 2008, 2012, 2013 and 2016. These years belong to the “very low category”, and according to climatic application (NOAA, 2018) these years were affected by extreme climatic events. This application contains and plots historical climatic data. In this case, we analysed the combined precipitation anomalies. Zero represents no precipitation anomaly, i.e. average precipitation; positive anomalies occur in years that precipitation is above the average (floods), and negative anomalies occur when the precipitation is below the average (drought). As we can see in Fig. 3a and b, Babahoyo presented positive anomalies of precipitation (floods) in 2008 and 2012 and negative anomalies of precipitation (drought) for 2013 and 2016 (Fig. 3c and d).
Table 4Different categories of impact thresholds for scenarios of differentiated and non-differentiated production costs.
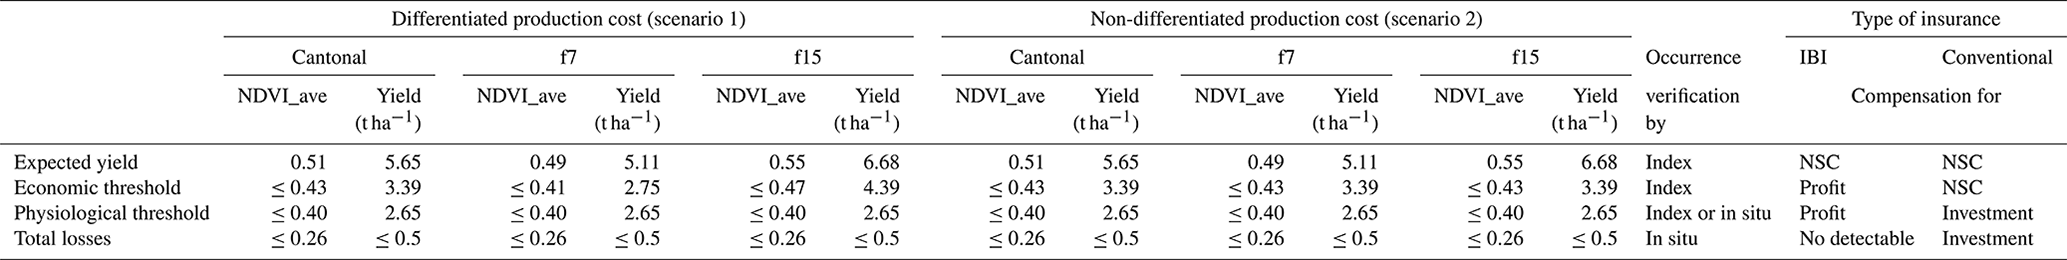
IBI: index-based insurance. NSC: not susceptible to compensation.
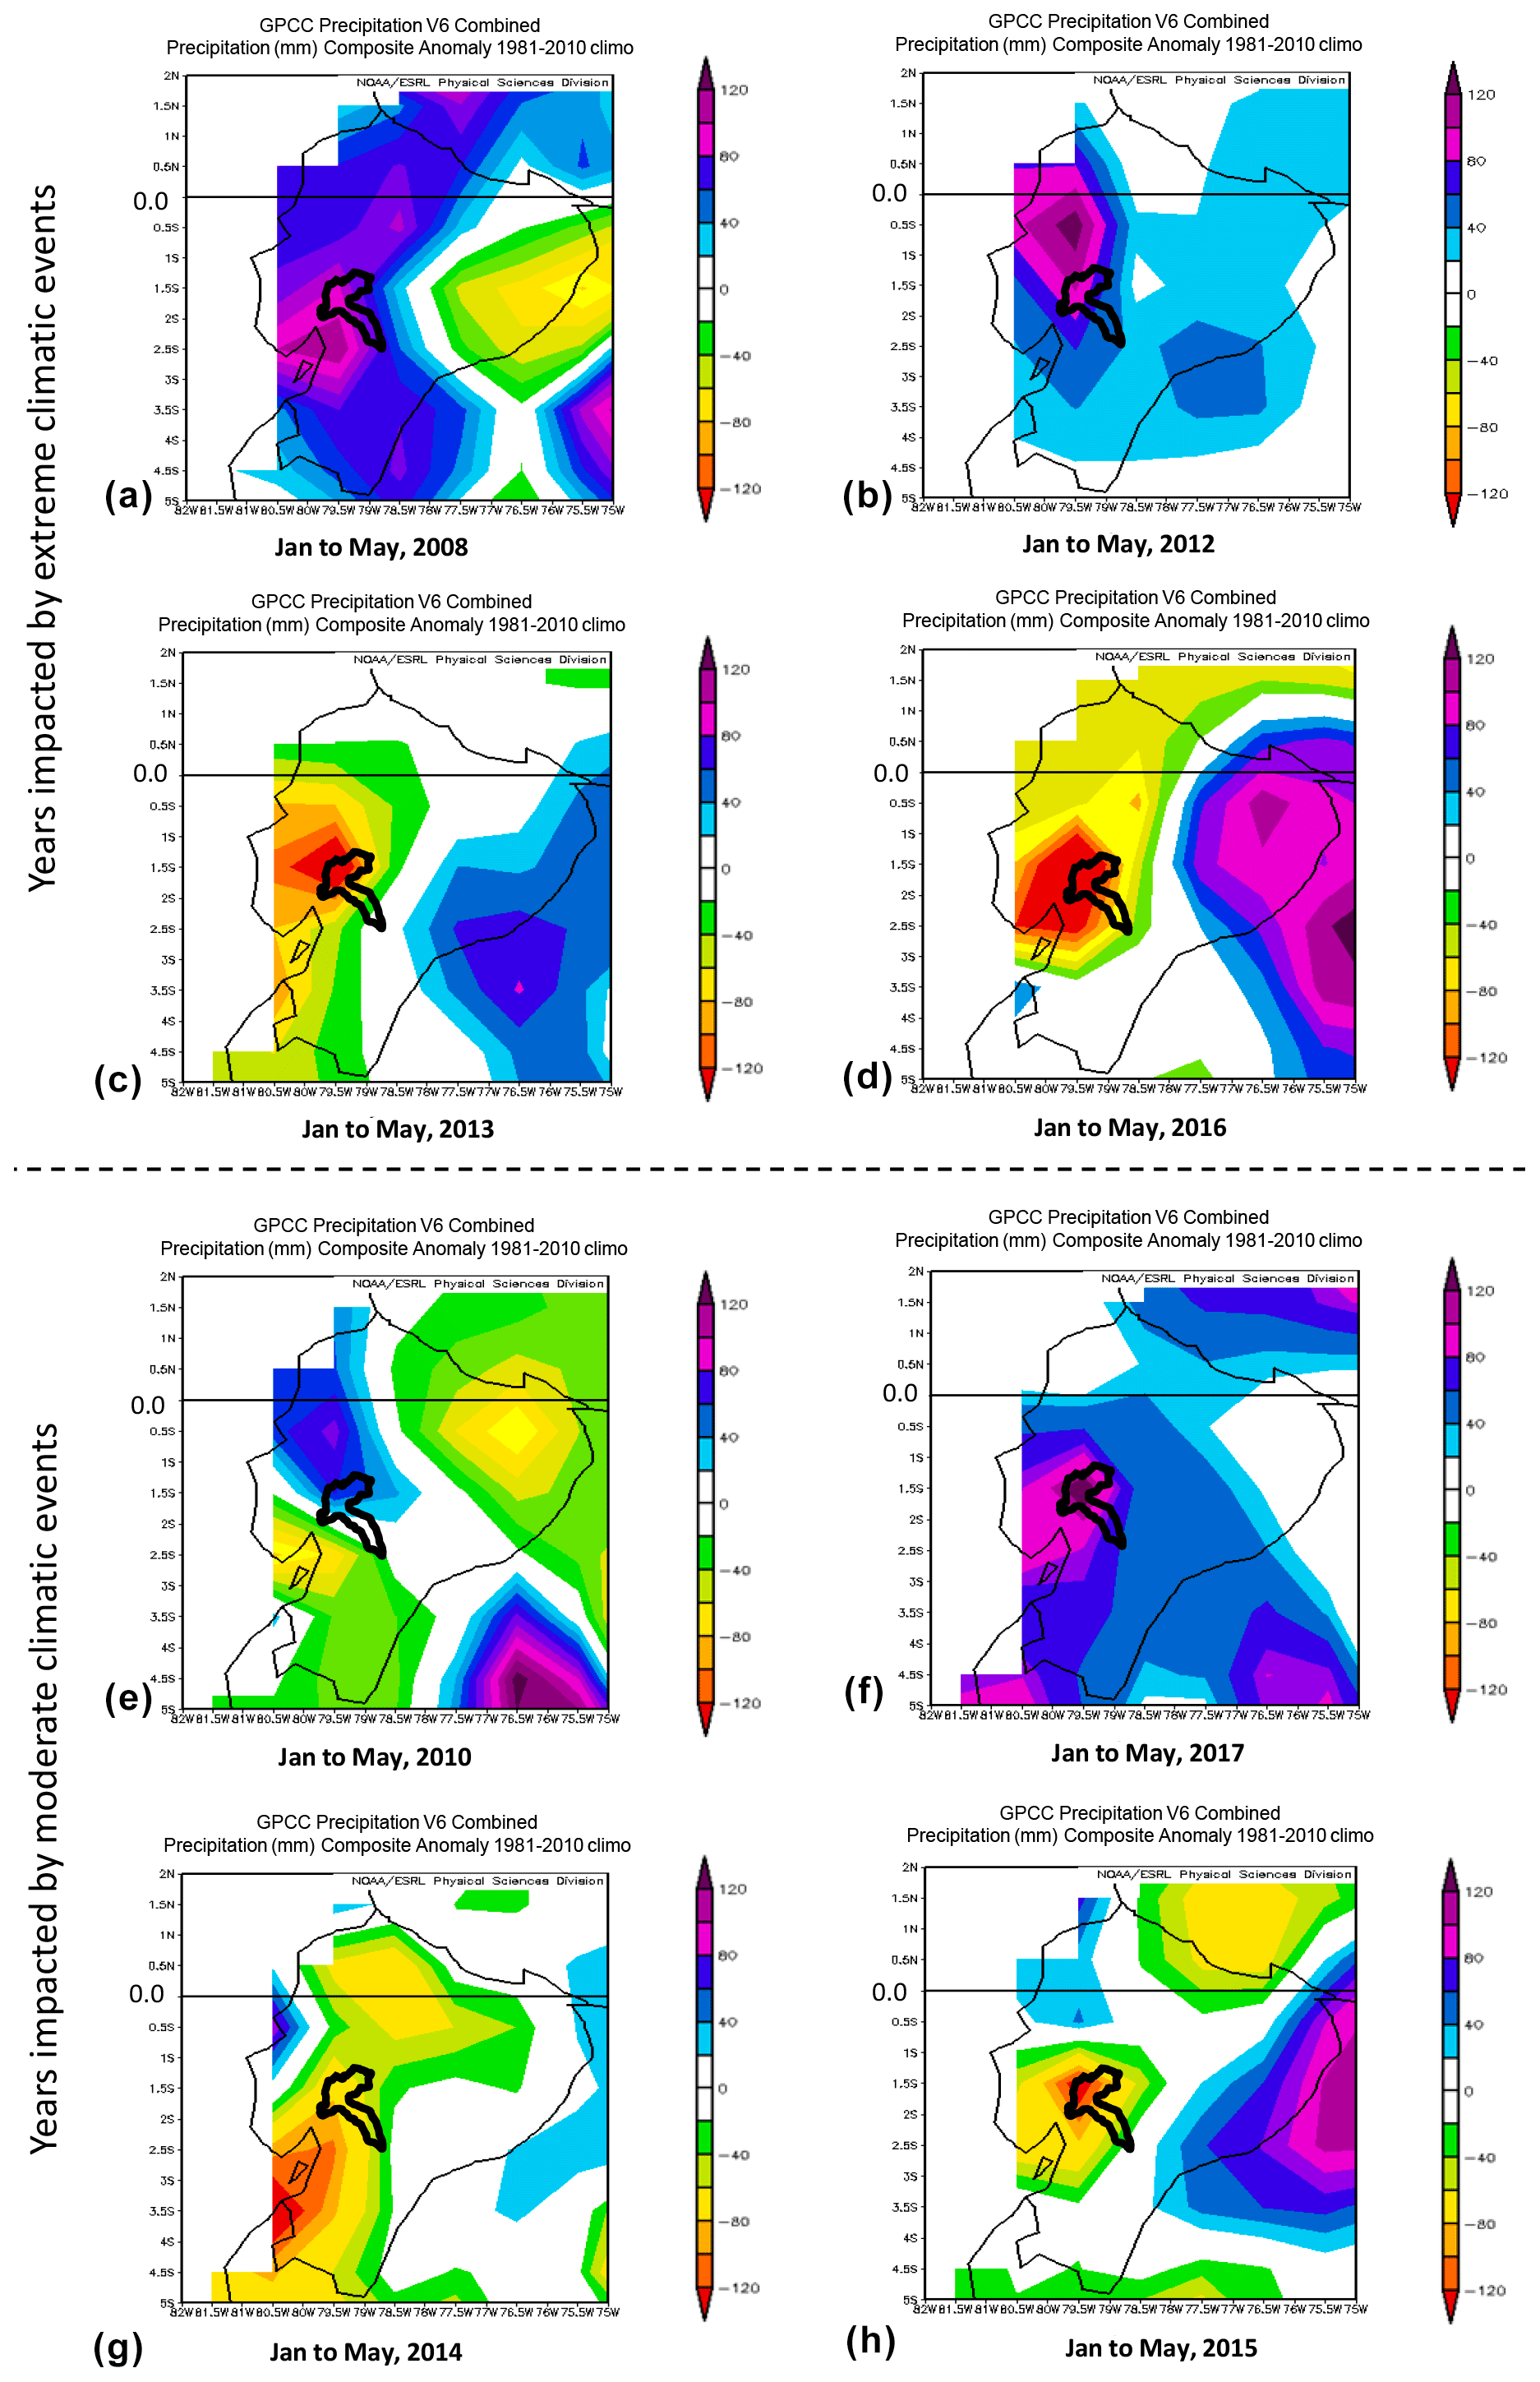
Figure 3Positive anomalies of precipitation (flood) in the year (a) 2008, (b) 2012, (e) 2010 and (f) 2017. Negative anomalies of precipitation (drought) in the year (c) 2013, (d) 2016, (g) 2014 and (h) 2015. Source: NOAA (2018).
On the other hand, the economic threshold depends on economic factors such as the sale rice price and production cost. These are not constant and must be set regarding the necessary yield for covering the farmer's expenses during the rice cultivation campaign, as shown in Table 4.
The economic threshold represents the minimum yield that farmers must reach for covering at least the production cost. It is higher than the physiological threshold, and it varies according to the scenario. In scenario 1, the economic threshold is different for each AHZ (f7 and f15); f7 has a lower production cost (USD 1022 ha−1) than that for f15 (USD 1629 ha−1). Thus, the economic threshold of f7 is 0.41, while for f15, it is 0.47 (see Table 4). The years from our dataset that reached the economic threshold were 2010, 2014, 2015 and 2017. They were impacted by moderate climatic events (flood for 2010 and 2017 and drought for 2014 and 2015) according to the NOAA (2018; see Fig. 3e–h).
For scenario 2, the production cost is a weighted average (USD 1259 ha−1) both for AHZs (f7 and f15) and cantonal zones. Therefore, the economic threshold (0.43) is the same for AHZs and cantonal zones (see Table 4).

Figure 4Physiological threshold (red line) within generalized-minimum extreme value (GEVmin) distribution of NDVI_ave; (a) cantonal and (b) f7 and (c) f15 zones.
3.4 Risk assessment of AHZ and Babahoyo
The risk status of f7 and f15 was found to differ based on the following results. We found that 25 % of events are under the physiological threshold for f7, and 17 % are under the threshold for f15 (see Fig. 4b and c); when we do not consider AHZs (cantonal), this value is 21 % (Fig. 4a). AHZ f7's probability is higher because of its soil conditions (see Table 5). These conditions make the zone more vulnerable to floods due to its very fine texture (>60 % clay), flat lands (0 %–5 % slope), very low altitude (1–12 m) and proximity to river banks that contribute to very poor drainage of this zone. In the same way, these characteristics could give, to f7, better capacity for long-term water retention during a drought. However, when drought is extreme, the f7's soil (vertisol) gets very dry (Soil Survey Staff, 2014); consequently, it becomes very hard and develops deep cracks. This phenomenon physically affects the crop roots and considerably hinders the soil tillage (Valverde-Arias et al., 2019).
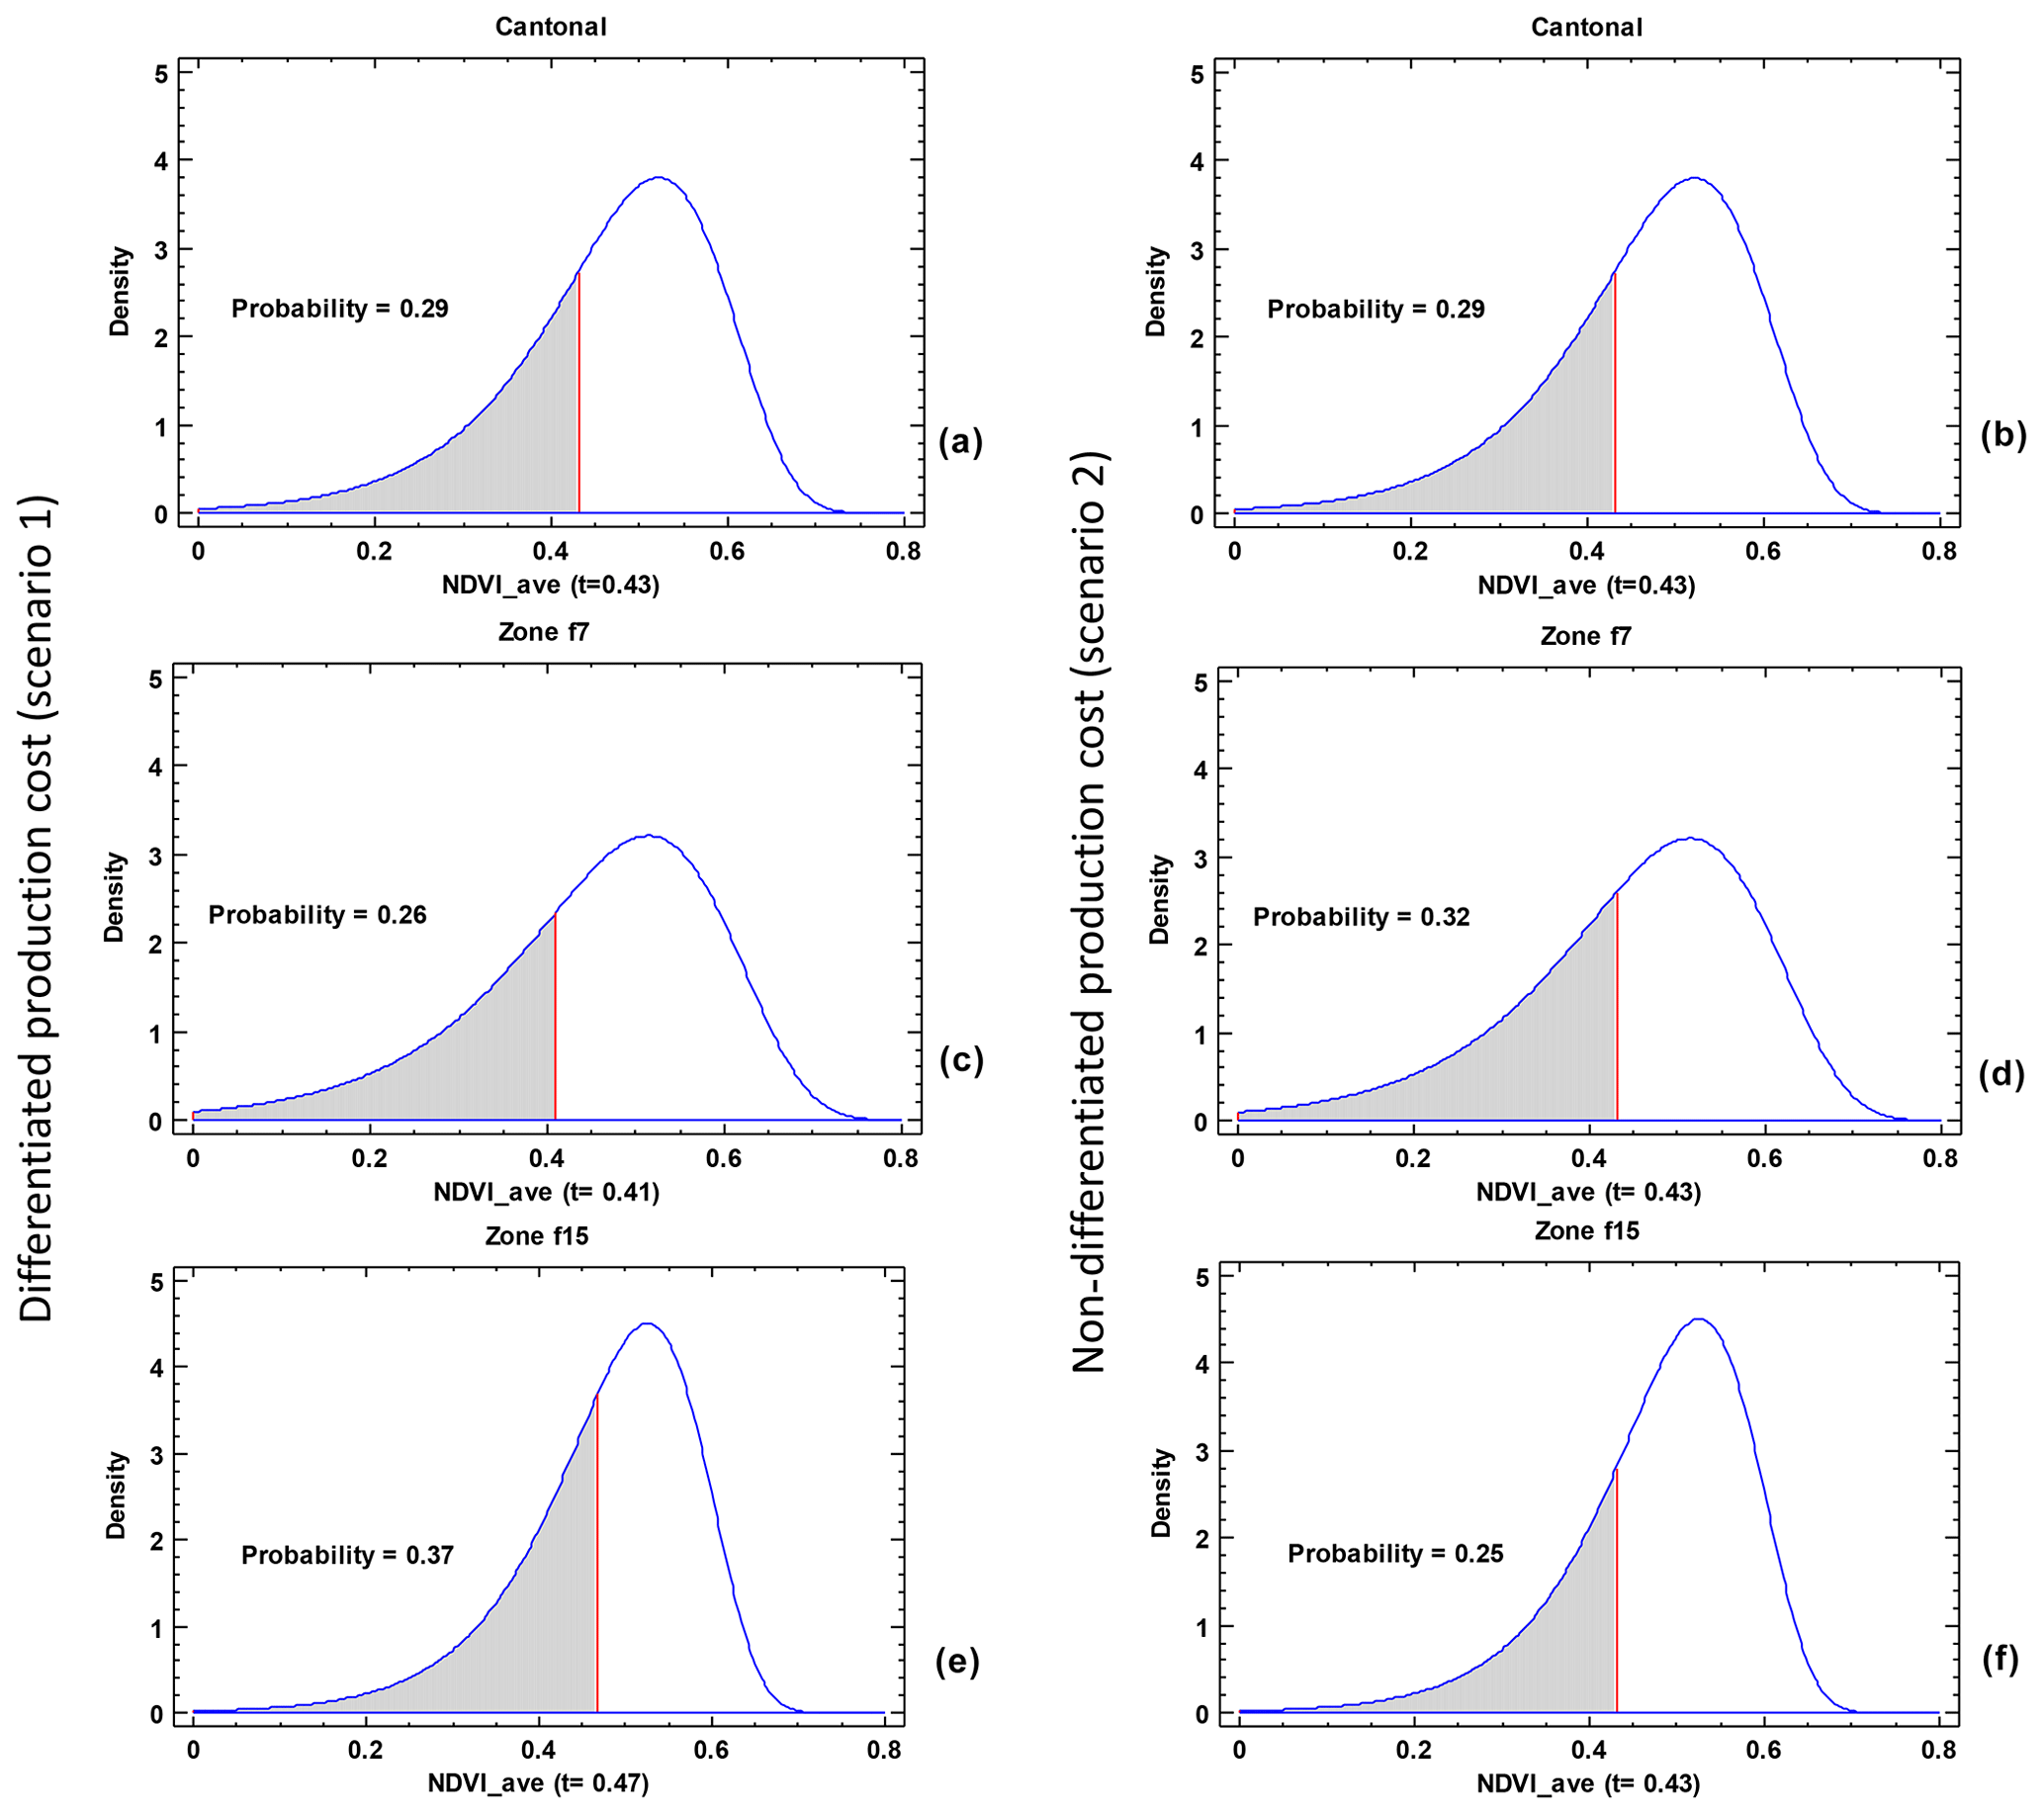
Figure 5Economic threshold (red line) within generalized-minimum extreme value (GEVmin) distribution of NDVI_ave for differentiated production cost (scenario 1) for (a) cantonal and agro-ecological homogeneous zones (c) f7 and (e) f15 and for non-differentiated production cost (scenario 2) for (b) cantonal and agro-ecological homogeneous zones (d) f7 and (f) f15.
Table 5Soil and climatic characteristics of agro-ecological homogeneous zones AHZs in Babahoyo.
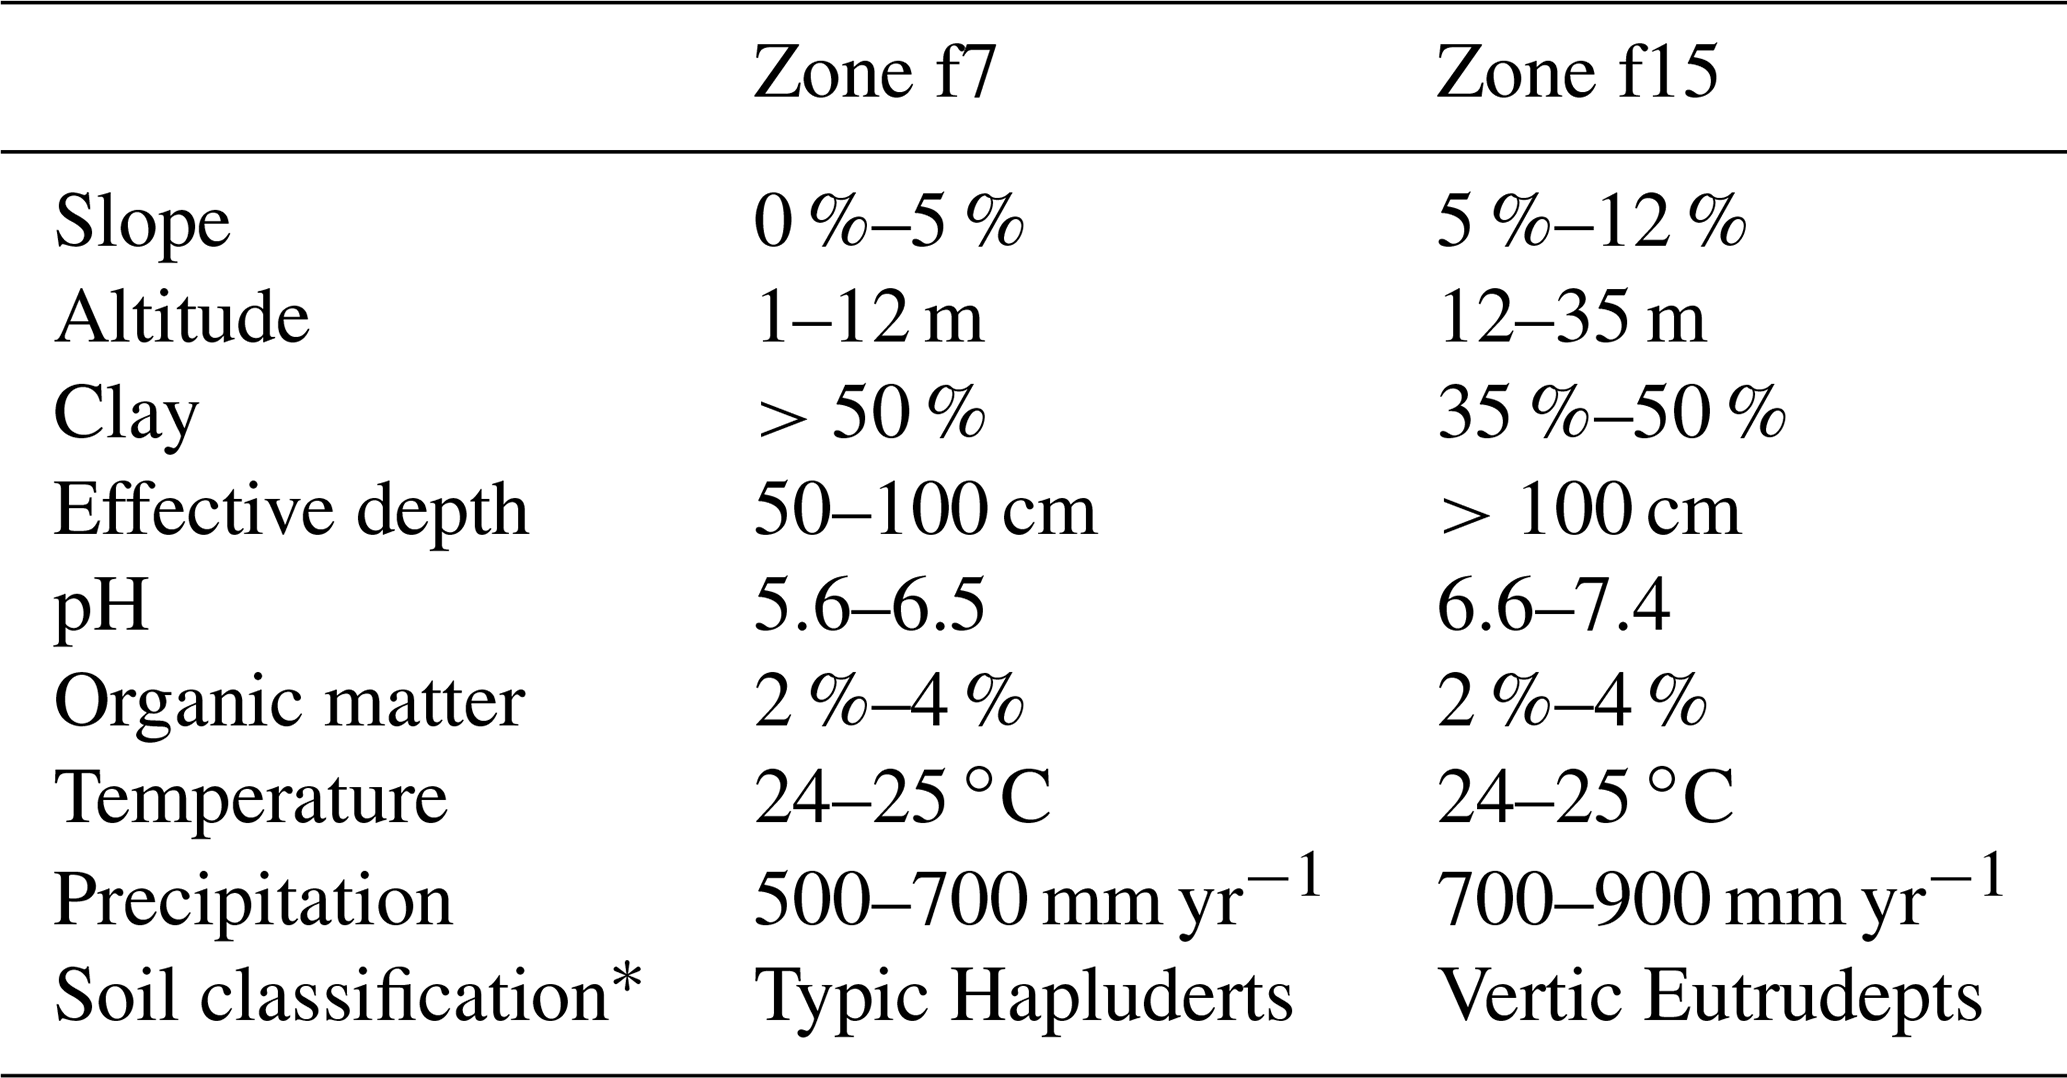
Source: Valverde-Arias et al. (2019). * According to USDA Soil Taxonomy (Soil Survey Staff, 2014).
For economic thresholds, we also found differences between the risk status of AHZs f7 and f15. Furthermore, for scenario 1, the probability of having events equal to or under the economic threshold is higher in f15 (37 %) than in f7 (26 %) and in cantonal zones (29 %), as we can see in Fig. 5a, c and e. The reason for this is that in this scenario, f15's farmers have to cover a higher production cost (which corresponds to a semi-technical production system), and, therefore, they have to reach an economic threshold also higher (0.47) than that in the f7.
In scenario 2, the economic threshold is equal (0.43) for f7, f15 and cantonal zones, but the probability of finding events under the threshold is higher in f7 (32 %) than in f15 (25 %) and in cantonal zones (29 %). Although the economic threshold is the same for both AHZs (f7 and f15) and at the cantonal level, in this scenario, the frequency distributions of NDVI_ave were different for each zone. Consequently, they accumulated different probabilities under the same threshold, as shown in Fig. 5b, d and f.
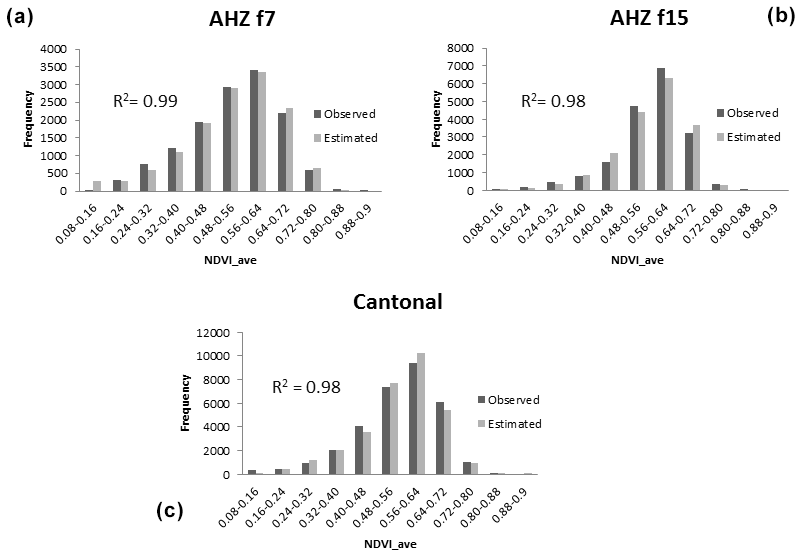
Figure 6Frequency distribution of NDVI_ave values both observed in imagery data and estimated through GEVmin distribution in (a) f7, (b) f15 and (c) cantonal zones.
Table 6Z test for probability of events susceptible to compensation under physiological and economic thresholds in agro-ecological homogeneous zones (f7 and f15) and cantonal zones.
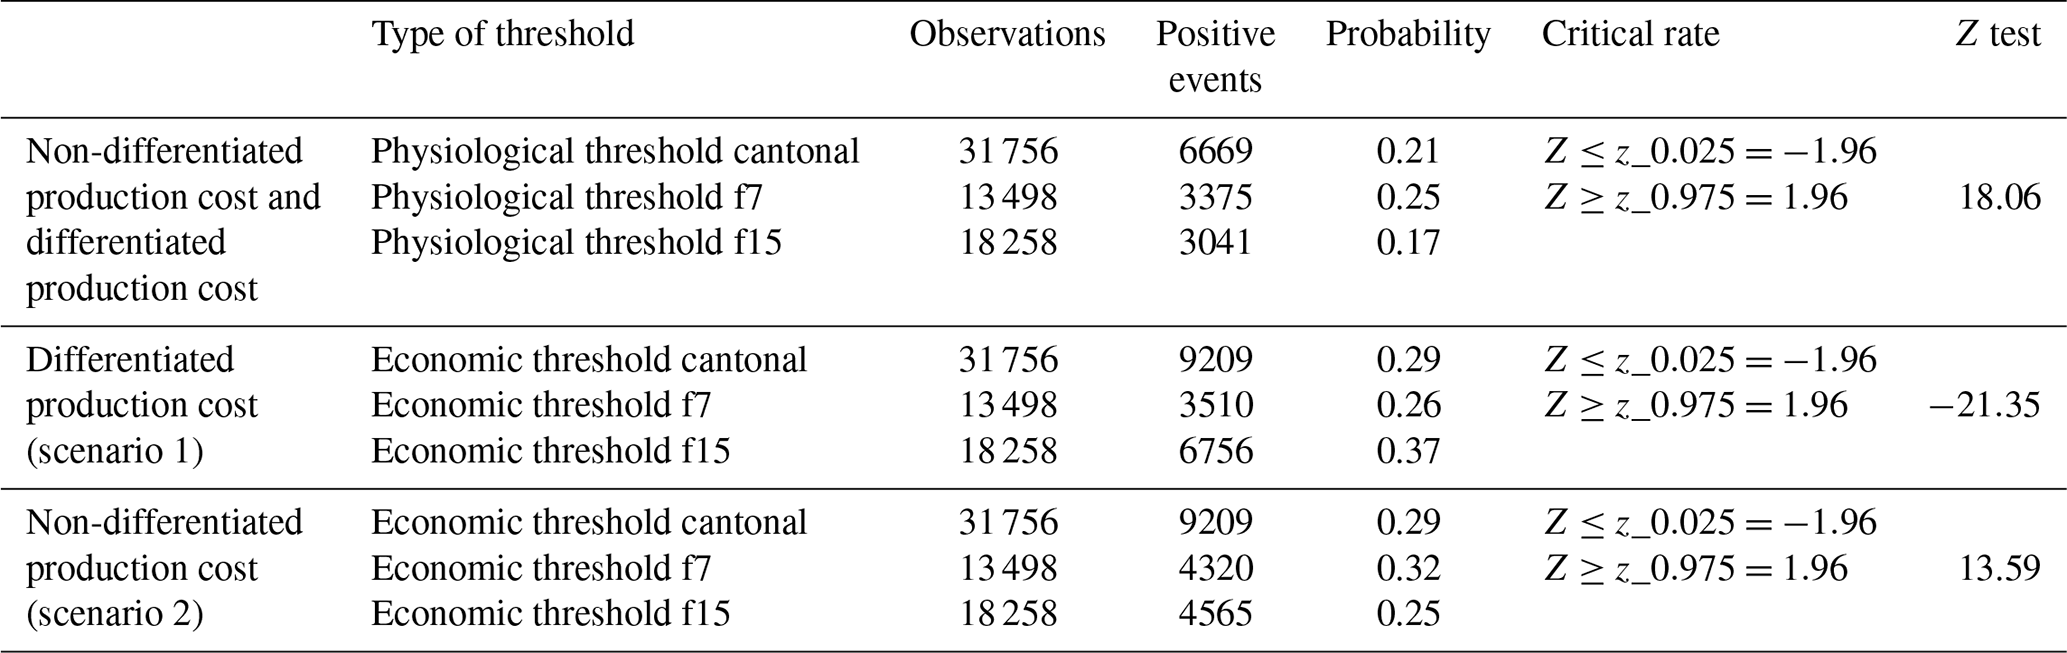
At this point, we evaluated the Z test results for determining if the differences found have statistical significance. Based on the Z test (see Table 6), the null hypothesis () can be rejected in both scenarios 1 and 2, so we can assert that the proportion of positive cases (equal to or under physiological and economic thresholds) in f7 is significantly different from that in f15. For the economic threshold in scenario 1 (differentiated production cost), the calculated Z is negative because in this case the probability in f15 is higher than in f7.
As the NDVI_ave dataset fits a GEVmin distribution, we used this distribution, with its specific parameters (mode and scale; shown in Table 2), for estimating NDVI_ave density frequencies for f7, f15 and cantonal zones. With these distributions, we calculated the positive events under physiological and economic thresholds in scenarios 1 and 2. Then, we estimated the basis risk of these calculations. In this case, basis risk could arise if the estimated distribution does not fit properly with the distribution observed from measured data.
We found that the basis risk for this estimation is negligible, according to the adjusted R2 shown in Fig. 6a–c. Therefore, we can confidently use these estimations for determining the event proportion that reached the physiological and economic thresholds, i.e. the occurrence probability of extreme events that warrant compensation.
Table 7Indemnity calculation for physiological and economic thresholds, for each AHZ (f7 and f15) and cantonal zone, both in scenario 1 and 2.
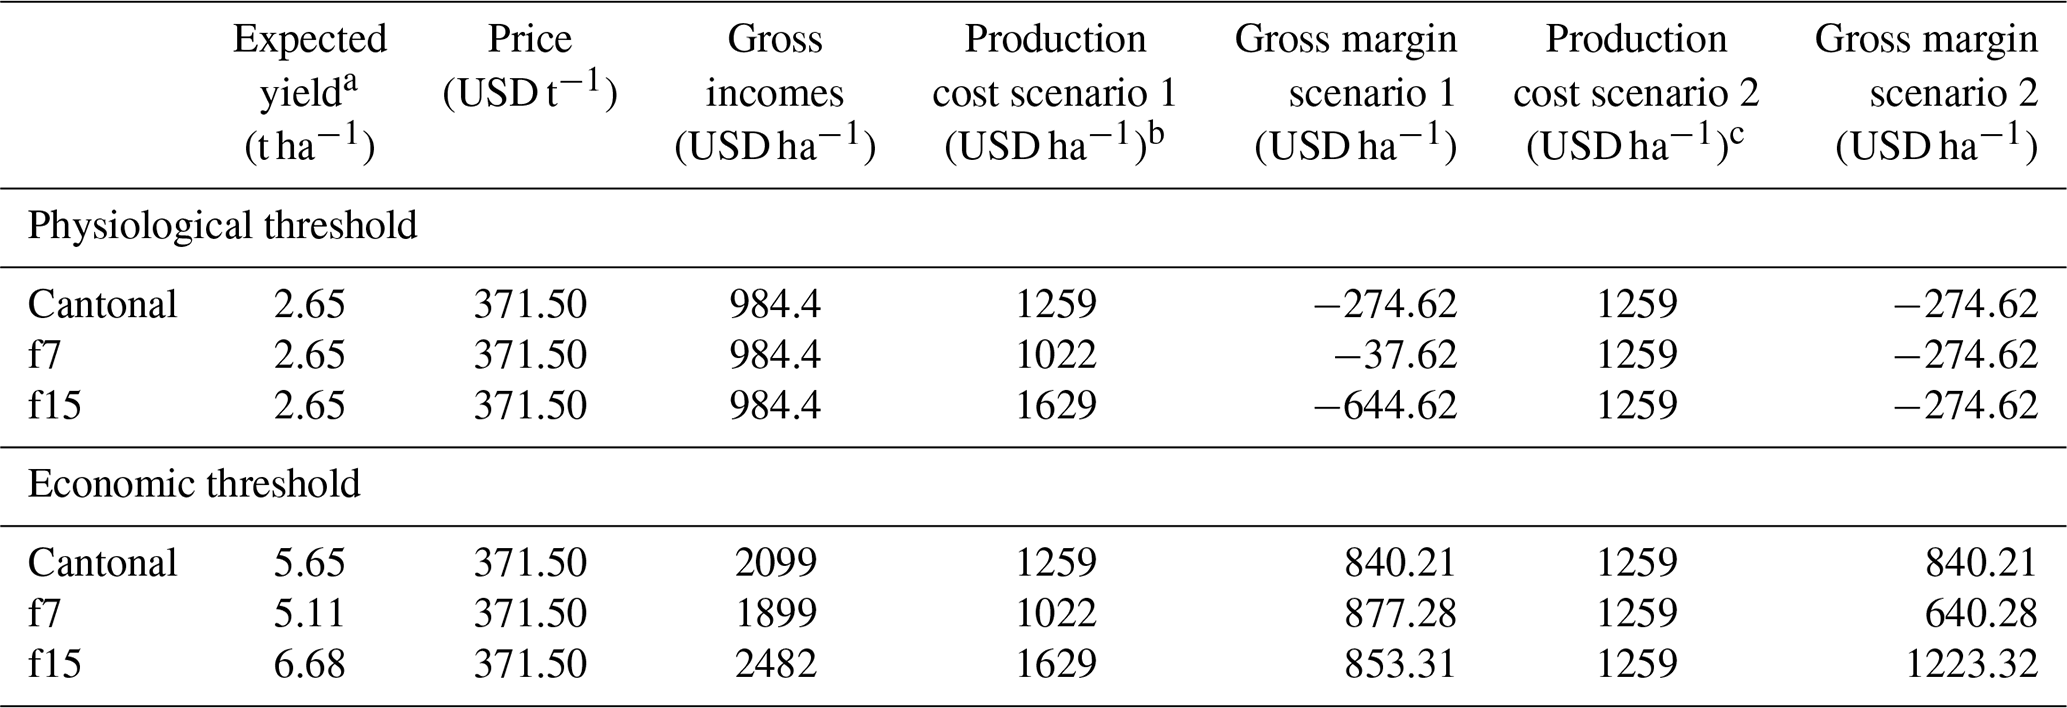
a Yield at physiological threshold; for economic threshold it is the yield reached in regular years. b Differentiated production cost. c Non-differentiated production cost.
3.5 Indemnity calculation
The indemnity for farms that reach the physiological threshold in scenario 1 is reported in Table 7. These values show us the deficit (negative numbers) that farmers face for recovering their production costs when their crop yield falls below the break-even point in each AHZ (f7 and f15) and cantonal zone. The indemnity would make up the difference between crop costs and revenue in the case of an extreme event. In f7 the indemnity would be USD 38 ha−1, meaning that when a farmer reaches the physiological threshold, they only lack USD 38 ha−1 for covering their production cost. A farmer from this scenario could dispense with the insurance contract, because the deficit to hit the break-even point is not representative. On the contrary, when f15 reaches the physiological threshold, its deficit is very high (USD 645 ha−1), which is the money that an f15's policyholder would receive as compensation in the case of an extreme event occurrence.
For scenario 2 of the physiological threshold, the indemnity would be USD 275 ha−1 for all AHZs (f7 and f15) and for cantonal zones, due to having the same production cost (USD 1259 ha−1). As was mentioned before, in Ecuador, currently, agricultural conventional insurance exists that covers the rice growers' working capital; but we included this calculation as an alternative to conventional insurance or for the areas where conventional insurance is not feasible.
When looking at the economic threshold, as we can observe in Table 7, the indemnity (gross margin) in scenario 1 is very similar between AHZs (f7 and f15) and cantonal zones though their expected yields are different. This is because their assigned production cost is compared with their expected yield. For example, since farmers have invested more money in their crops in f15, their expected yield is higher. Moreover, the difference in the premium price of these zones will be determined by the different probability of extreme event occurrence in each AHZ (f7 and f15) and cantonal zone.
In scenario 2, on the other hand, we have assumed the same production cost for f7 and f15; thus, f15 has higher expected yield in normal years than f7. Obviously, in this scenario f15 obtains the highest gross margin (USD 1223 ha−1), having also the highest compensation, which would be reflected in a higher premium cost. However, f7 has the lowest insured amount (USD 640 ha−1), so its premium cost should be low. But we have to consider that premium cost calculation also depends on the occurrence probability of the insured event.
For the economic threshold, the indemnity calculation (USD 840 ha−1) for cantonal zones is equal in both scenarios 1 and 2, as shown in Table 7, because we used the same weighted average as production cost (USD 1259 ha−1). For f7 a higher gross margin is expected in scenario 1 than in scenario 2 due to scenario 2's production cost being higher. On the contrary, for f15 the gross margin is higher in scenario 2 than in scenario 1 because in scenario 2, f15 has a lower production cost than in scenario 1.
3.6 Premium determination
The premium value is related to the insured amount (the indemnity or compensation that insurance company must pay to farmers when an insured extreme event occurs) and the probability of the ensured extreme event occurring in a determined period. Table 8 shows the net and commercial premium calculation for the two different thresholds under both scenario 1 and scenario 2 and for each AHZ and at the cantonal level.
Table 8Calculation of commercial premium rate for physiological and economic thresholds in scenarios 1 and 2 and for AHZs (f7 and f15) and cantonal zones.
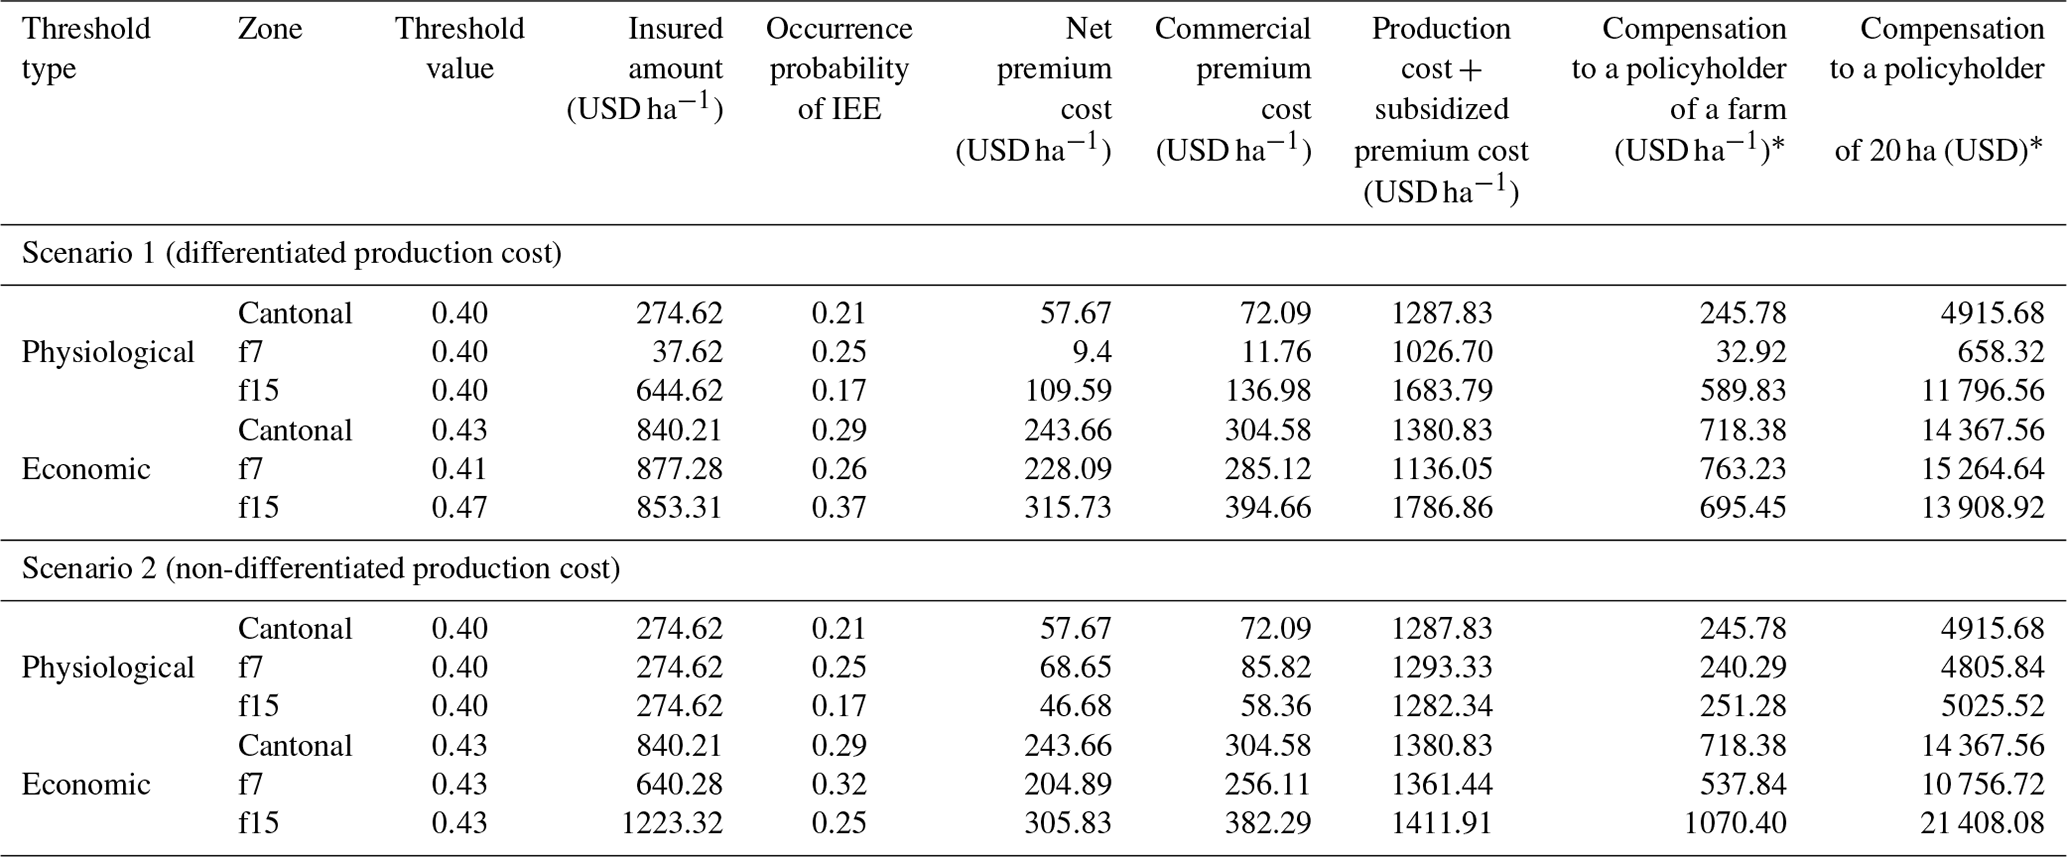
* In a year when an ensured extreme event (drought and flood) occurs, 20 ha is the average size of a rice farm in Ecuador.
In general terms, it can be appreciated that premium cost for economic thresholds are more expensive than that for the physiological threshold in both scenarios (1 and 2). This is because the insured amounts for the economic threshold are higher than those for the physiological threshold. In the first case, the compensation covers the entire lost profit, while in the second one, the compensation covers only the deficit necessary for recovering the investment (production cost).
If the insured amounts are similar among AHZs (f7 and f15) and cantonal zones, the difference among premium costs is determined by the occurrence probability. However, when there are sharp differences among insured amounts of AHZs (f7 and f15) and cantonal zones, these influence the premium cost variation more than the occurrence probability.
Moreover, for the physiological threshold in scenario 1, the premium cost is determined mainly by the insured amount; for instance, for f15 the premium cost is the highest (USD 136.98 ha−1) despite its occurrence probability being the lowest. On the contrary, for f7 the premium cost is very low, despite having the highest occurrence probability, because of having a greater insured amount.
While under the economic threshold in scenario 1, the insured amount of AHZs (f7 and f15) and cantonal zones are similar, the premium cost for f15 is the highest (USD 394.66 ha−1) due to having the highest occurrence probability.
When costs are not differentiated across AHZ (scenario 2), for the physiological threshold the insured amount is equal in all AHZs (f7 and f15) and cantonal zones, and thus their premium cost has been differentiated through the occurrence probability, which is the highest for f7 (USD 85.82 ha−1). In the same scenario, the economic threshold f15 has the highest gross margin and therefore a high insured amount despite its low occurrence probability (0.25). It has a high premium price (USD 382.29 ha−1), but it is lower than in scenario 1 (USD 394.66 ha−1), where the occurrence probability is the highest (0.37).
As it can be seen in Table 8, after we divided the study area through the AHZ map into f7 and f15 zones, we can perform more accurate calculations and reduce basis risk of the premium costs according to the expected yield, insured amount and occurrence probability of each AHZ (f7 and f15). This means that by differentiating the study area through AHZs, we can design an accurate insurance policy where farmers from each zone pay a premium that corresponds to the risk that they are facing. To illustrate this, for the physiological threshold in scenario 1, if we do not divide Babahoyo through AHZs and instead use cantonal zones as IIA, an average Babahoyo producer (≈20 ha) from f15 would pay only USD 72.09 ha−1 as an insurance premium. But if an extreme event occurs, they would receive only USD 4915.68 as compensation, which is less than half of the actual loss in a year that an extreme event occurs (USD 11 796.56). At the same time, for the same threshold and scenario, farms from f7 would pay a much lower premium (USD 11.76 ha−1) and in the case of disaster receive a small compensation which is adjusted to the actual losses experienced by the farmers. This can be of great relevance, as if we assume that farms in f7 are non-technical production systems that achieve lower yields and get lower economic returns, providing access to affordable insurance with fair premium prices may importantly contribute to expanding insurance uptake and reducing socio-economic vulnerability substantially in this area.
Though the price of the premium could be expensive for some farmers, we must consider that this insurance will cover both of the most frequent and intense extreme events that affect Babahoyo (drought and flood). For example, for the economic threshold in scenario 1, the premium cost without subsidy would reach 22 % of the total production cost of a policyholder of f7 and 20 % for f15. This means that subsidizing premium cost may still be necessary in order to incentivise taking the insurance contract (Garrido and Zilberman, 2008; Yuanchang and Jiyu, 2010), and the government subsidy of 60 % of the premium cost that is currently offered in Ecuador with the conventional insurance would still be required.
Furthermore, if the government would apply prevention policies to promote farm modernization, farmer technical training and civil works, the occurrence probability of extreme events could be reduced or at least mitigated. For instance, dams and irrigation infrastructure could improve the risk status of Babahoyo's farmers facing drought and floods. Consequently, it could be reflected in an insurance premium price reduction.
Floods and droughts are a major threat for rice production in Ecuador that undermines food security and endangers the sustainability of rural livelihoods in many areas of the country. Risk management mechanisms, such as agricultural insurance, may play an important role in stabilizing production and contributing to reducing the vulnerability of rice farmers. In this context, IBI is a promising tool that facilitates the implementation of agricultural insurance and reduces operational and transaction costs. However, basis risk may lead to inadequate premium prices and to unfair indemnity calculations and payment. To avoid this, the identification of an adequate index and proper knowledge of variability within the IIA are crucial.
In this research, we developed an IBI based on NDVI_ave that accounts for variability across the insured area. For this, we considered AHZs to be the starting point for risk assessment and indemnity calculation and compared them with the insurance design at the cantonal level. Two levels of climatic impact over rice cultivation have been identified. The first one is the physiological impact that is determined by a physiological threshold in that when a climatic event is extreme, its policy contract will cover losses related to the rice growers' working capital. The second level is the economic impact when the climatic event is moderate, and its policy will cover the crops' gross margin.
The results of the analysis presented evidence that the two AHZs show significantly different risk profiles for physiological and economic thresholds. Therefore, the design of differentiated premium calculation based on the risk status and insured amount of each AHZ (f7 and f15) will facilitate farmers paying a fair insurance premium. This insurance premium would be as consistent as possible with their risk status and would help them receive compensation that effectively covers the totality of their losses.
The basis risk arising from modelling the risk frequency of drought and flood events in Babahoyo (cantonal) and in AHZs (f7 and f15) through GEVmin distribution is negligible. The basis risk associated with the spatial heterogeneity of Babahoyo has been reduced in our IBI design. We have accomplished this by dividing this canton into f7 and f15 homogeneous zones, which have a significant different risk status, have different expected yields and may have also different production costs. Considering that all these factors and the two different impact levels in the IBI design have allowed setting up a fair premium, this reduces, in this way, the possible bias caused by not taking Babahoyo variability into account.
The cost for contracting an insurance policy could be expensive in some cases. However, the fact that this kind of insurance is generally partially subsidized by the government in developing countries (like Ecuador) could make this insurance affordable to farmers. Moreover, even if the premium price may be high, the index design guarantees policyholders that the premium price is fair and proportional to the risk they are facing.
The implementation of IBI for rice crops in Babahoyo could let the Ecuadorian government respond efficiently and rapidly in the case of an extreme climatic event, paying compensation faster than with the conventional insurance. It could stabilize rice-producer incomes and reduce small farmers' vulnerability by providing access to insurance through premium and indemnities adjusted to the specific risk and technology conditions. Consequently, it can incentivise rice cultivation to the desirable levels for covering national demand ensuring food security of Ecuador.
Finally, it is worth mentioning that even if the IBI has been defined for rice crops in a particular area, the methodology applied for developing such an insurance scheme can be applied for other crops and regions if the data for defining AHZs, NDVI distributions, crop yield and cost production are available. This is, therefore, a promising approach for defining IBI schemes that minimizes basis risk, which can importantly profit from current advances in remote sensing, satellite imagery and improved information systems.
Data are freely available upon request by contacting the corresponding author by email.
ORVA developed the research idea and wrote the original draft of the paper and was guided and supervised by AG, AMT and PE. AMT contributed with the imagery and statistical analysis and generation of agro-ecological homogeneous zones. AG contributed with the insurance design and PE with the policy and socio-economic implications of the insurance implementation. AG, AMT and EP reviewed and edited the paper to obtain the final version.
The authors declare that they have no conflict of interest.
This article is part of the special issue “Remote sensing, modelling-based hazard and risk assessment, and management of agro-forested ecosystems”. It is a result of the EGU General Assembly, Vienna, Austria, 8–13 April 2018.
The technical support of the Centro de Estudios e Investigación para la Gestión de Riesgos Agrarios y Mediambientales (CEIGRAM) is highly appreciated. Also, we would like to acknowledge CGSIN and the Agroseguro project of MAG for the data provided.
This research has been supported by the Senescyt-Secretaría de Educación Superior, Ciencia, Tecnología e Innovación (grant Convocatoria Abierta 2013 segunda fase) and the Comunidad de Madrid (Spain) and Structural Funds 2014–2020 (ERDF and ESF; grant no. AGRISOST-CM S2018/BAA-4330).
This paper was edited by Paolo Tarolli and reviewed by Nicolas R. Dalezios and one anonymous referee.
Aguilar, D., Andrade, D., Alava, D., Burbano, J., Díaz, M., Garcés, A. L., Jiménez, W., Leiva, D., Loayza, V., Muyulema, W., Pérez, P., Ruiz, V., Simbaña, B., and Yépez, R.: Estimación de superficie sembrada de arroz (Oryza sativa l.) Y maíz amarillo duro (Zea mays l.) En las épocas de invierno y verano año 2015, en las provincias de Manabí, Los Ríos, Guayas, Santa Elena, Loja y El Oro, Quito, Ecuador, available at: http://sinagap.agricultura.gob.ec/pdf/estudios_agroeconomicos/estimacion_superficie_arroz_maiz-2015.pdf (last access: 11 September 2018), 2015.
Aguilar, D., Alava, D., Burbano, J., Garcés, A. L., Jácome, D., Leiva, D., Simbaña, B., and Yépez, R.: Estimación de superficie sembrada de arroz (Oryza sativa l.), maíz amarillo duro (Zea mays l.) y soya (Glycine max) en las épocas del año 2017, en las provincias de: Guayas, Los Ríos, Manabí, Santa Elena, Loja y El Oro, Quito, Ecuador, 2018.
Arias, O. V., Garrido, A., Villeta, M., and Tarquis, A. M.: Homogenisation of a soil properties map by principal component analysis to define index agricultural insurance policies, Geoderma, 311, 149–158, https://doi.org/10.1016/j.geoderma.2017.01.018, 2018.
Barnett, B. J. and Mahul, O.: Weather Index Insurance for Agriculture and Rural Areas in Lower-Income Countries, Am. J. Agric. Econ., 89, 1241–1247, https://doi.org/10.1111/j.1467-8276.2007.01091.x, 2007.
Bullock, J. M., Dhanjal-Adams, K. L., Milne, A., Oliver, T. H., Todman, L. C., Whitmore, A. P., and Pywell, R. F.: Resilience and food security: rethinking an ecological concept, J. Ecol., 105, 880–884, https://doi.org/10.1111/1365-2745.12791, 2017.
Cai, W., Borlace, S., Lengaigne, M., van Rensch, P., Collins, M., Vecchi, G., Timmermann, A., Santoso, A., McPhaden, M. J., Wu, L., England, M. H., Wang, G., Guilyardi, E., and Jin, F.-F.: Increasing frequency of extreme El Nino events due to greenhouse warming, Nat. Clim. Change, 4, 111–116 https://doi.org/10.1038/nclimate2100, 2014.
Carter, M., Cheng, L., and Sarris, A.: The Impact of Inter-linked Index Insurance and Credit Contracts on Financial Market Deepening and Small Farm Productivity, Unpubl. manuscript, Univ. California, Davis, available at: http://www.aueb.gr/conferences/Crete2012/papers/papers senior/Sarris.pdf (last access: 16 July 2018), 2011.
Clarke, D. J.: A theory of rational demand for index insurance, Am. Econ. J. Microecon., 8, 283–306, https://doi.org/10.1257/mic.20140103, 2016.
CRED – Centre for Research on the Epidemiology of Disasters: EM DAT The International Disaster Database, available at: http://www.emdat.be/database (last access: 26 August 2019), 2015.
de Leeuw, J., Vrieling, A., Shee, A., Atzberger, C., Hadgu, K. M., Biradar, C. M., Keah, H., and Turvey, C.: The potential and uptake of remote sensing in insurance: a review, Remote Sens., 6, 10888–10912, 2014.
Didan, K.: MOD13Q1 MODIS/Terra Vegetation Indices 16-Day L3 Global 250 m SIN Grid V006, NASA EOSDIS Land Processes DAAC, University of Arizona, Tucson, 2015.
Didan, K., Barreto, A., Solano, R., and Huete, A.: MODIS Vegetation Index User's Guide (MOD13 Series) Version 3.00 (Collection 6), available at: https://vip.arizona.edu/documents/MODIS/MODIS_VI_UsersGuide_June_2015_C6.pdf (last access: 20 March 2018), 2015.
Elabed, G., Bellemare, M. F., Carter, M. R., and Guirkinger, C.: Managing basis risk with multiscale index insurance, Agric. Econ., 44, 419–431, https://doi.org/10.1111/agec.12025, 2013.
Eymond, M. and Santos, A.: Asociatividad para el acceso a la comercialización de pequeños arroceros en Ecuador, in: Dinámicas de comercialización para la agricultura familiar campesina: desafíos y alternativas en el escenario ecuatoriano, edited by: Proaño, V. and Lacroix, P., Sistema de Investigación sobre la Problemática Agraria en el Ecuador (SIPAE), Quito, Ecuador, 65–96, available at: https://www.avsf.org/public/posts/1704/dinamicas_comercializacion_avsf_ecuador_2014.pdf#page=66 (last access: 2 January 2019), 2013.
FAO: Seguimiento del mercado del arroz de la FAO, Comer. y mercados, FAO, XXI, 9, https://doi.org/I9243ES/1/05.18, 2018.
FAO and Un-Habitat: On solid ground. Addressing land tenure issues following natural disasters, Rome, 2010.
Garrido, A. and Zilberman, D.: Revisiting the demand for agricultural insurance: the case of Spain, edited by: David, Z., Agric. Financ. Rev., 68, 43–66, https://doi.org/10.1108/00214660880001218, 2008.
Gu, Y., Wylie, B. K., Howard, D. M., Phuyal, K. P., and Ji, L.: NDVI saturation adjustment: A new approach for improving cropland performance estimates in the Greater Platte River Basin, USA, Ecol. Indic., 30, 1–6, https://doi.org/10.1016/j.ecolind.2013.01.041, 2013.
Harvey, C. a, Rakotobe, Z. L., Rao, N. S., Dave, R., Razafimahatratra, H., Rabarijohn, R. H., Rajaofara, H., and Mackinnon, J. L.: Extreme vulnerability of smallholder farmers to agricultural risks and climate change in Madagascar, Philos. T. Roy. Soc. Lond. B, 369, 20130089, https://doi.org/10.1098/rstb.2013.0089, 2014.
Hellmuth, M. E., Osgood, D. E., Hess, U., Moorhead, A., and Bhojwani, H. (Eds.): Index insurance and climate risk: prospects for development and disaster management, Climate and Society No. 2, International Research Institute for Climate and Society (IRI), Columbia University, New York, USA, 2009.
Höppe, P.: Scientific and Economic Rationale for Weather Risk Insurance For Agriculture, in: Managing Weather and Climate Risks in Agriculture, edited by: Sivakumar, M. V. K. and Motha, R. P., Springer, Berlin, Heidelberg, 367–375, 2007.
Huang, J., Wang, X., Li, X., Tian, H., and Pan, Z.: Remotely sensed rice yield prediction using multi-temporal NDVI data derived from NOAA's-AVHRR, PLoS One, 8, e70816, https://doi.org/10.1371/journal.pone.0070816, 2013.
IEE – Instituto Espacial Ecuatoriano: Technical report of production systems in Babahoyo canton, Quito-Ecuador, available at: http://181.211.99.244/geodescargas/babahoyo/mt_babahoyo_sistemas_productivos.pdf (last access: 16 April 2018), 2009.
INEC: Rice-cultivated area. Historical database, Contin. Agric. Prod. Surv. (ESPAC), Ecuador en cifras, available at: http://www.ecuadorencifras.gob.ec/encuesta-de-superficie-y-produccion-agropecuaria-continua-2015 (last access: 2 March 2019), 2018.
Inglada, J., Arias, M., Tardy, B., Hagolle, O., Valero, S., Morin, D., Dedieu, G., Sepulcre, G., Bontemps, S., Defourny, P., and Koetz, B.: Assessment of an Operational System for Crop Type Map Production Using High Temporal and Spatial Resolution Satellite Optical Imagery, Remote Sens., 7, 12356–12379, https://doi.org/10.3390/rs70912356, 2015.
Isch, E.: El cambio climático y el agua: efectos y medidas de adaptación, Quito, Ecuador, available at: http://www.pacc-ecuador.org/wp-content/uploads/2014/01/CapacitacionCC_Modulo_dos.pdf (last access: 18 February 2019), 2011.
Jasiulewicz, H.: Probability of ruin with variable premium rate in a Markovian environment, Insur. Math. Econ., 29, 291–296, https://doi.org/10.1016/S0167-6687(01)00090-7, 2001.
Jensen, N. and Barrett, C.: Agricultural Index Insurance for Development, Appl. Econ. Perspect. Policy, 39, 199–219, https://doi.org/10.1093/aepp/ppw022, 2017.
Jensen, N. D., Mude, A. G., and Barrett, C. B.: How basis risk and spatiotemporal adverse selection influence demand for index insurance: Evidence from northern Kenya, Food Policy, 74, 172–198, https://doi.org/10.1016/j.foodpol.2018.01.002, 2018.
Jiao, W., Tian, C., Chang, Q., Novick, K. A., and Wang, L.: A new multi-sensor integrated index for drought monitoring, Agr. Forest. Meteorol., 268, 74–85, https://doi.org/10.1016/j.agrformet.2019.01.008, 2019.
Kotz, S. and Nadarajah, S.: Extreme Value distribution: Theory and applications, 1st Edn., Imperial College Press, London, 2000.
Maestro, T., Bielza, M., and Garrido, A.: Hydrological drought index insurance for irrigation districts in Spain, Spanish J. Agric. Res., 14, e0105, https://doi.org/10.5424/sjar/2016143-8981, 2016.
MAG: Costos de producción del cultivo de arroz en secano y riego, Quito, Ecuador, available at: http://sinagap.agricultura.gob.ec/ (last access: 25 January 2019), 2017.
MAGAP – Ministerio de Agricultura Ganaderia Acuacultura y Pesca: Censo por Impactos de Invierno 2012, Resultados, Quito, Ecuador, available at: http://sinagap.agricultura.gob.ec/images/flippingbook/censoimpacto2012/files/assets/downloads/publication.pdf (last access: 21 March 2018), 2012.
MAGAP – Ministerio de Agricultura Ganaderia Acuacultura y Pesca: Map of estimated area of rice and maize cultivation in the provinces of Guayas, Santa Elena, Los Rios, Manabí, El Oro and Loja in 2014, Geoportal del Agro Ecuatoriano, available at: http://geoportal.agricultura.gob.ec/catalogo_datos/visualizador.html (last access: 12 November 2018), 2014.
Mcintosh, C., Sarris, A., and Papadopoulos, F.: Productivity, credit, risk, and the demand for weather index insurance in smallholder agriculture in Ethiopia, Agric. Econ., 44, 399–417, https://doi.org/10.1111/agec.12024, 2013.
Medina, N.: Agricultural insurance in Ecuador: Evidence of asymmetric information, J. Account. Tax., 9, 68–87, https://doi.org/10.5897/JAT2017.0262, 2017.
Ministerio de Agricultura y Ganaderia MAG: Ministerial Agreement No. 168, Ministerio de Agricultura y Ganaderia, Ecuador, available at: http://servicios.agricultura.gob.ec/mag01/pdfs/aministerial/2018/2018-168.pdf, last access: 5 June 2018.
Mobarak, A. M. and Rosenzweig, M. R.: Informal risk sharing, index insurance, and risk taking in developing countries, Am. Econ. Rev., 103, 375–380, 2013.
Montaño, M.: Estudio de la aplicación de Azolla Anabaena como bioabono en el cultivo de arroz en el Litoral ecuatoriano, Rev. Tecnológica ESPOL, 18, 147–151, 2005.
Moreno, B.: Yield rice in Ecuador, First quarter 2014, Quito, Ecuador, available at: http://sinagap.agricultura.gob.ec/pdf/estudios_agroeconomicos/rendimiento_arroz_1er_cuatrimestre.pdf (last access: 21 May 2019), 2014.
Mude, A., Barrett, C. B., Carter, M. R., Chantarat, S., Ikegami, M., and McPeak, J. G.: Index based livestock insurance for northern Kenya's arid and semi-arid lands: the Marsabit pilot, SSRN 1844758, ILRI, Nairobi, Kenya, 2009.
NASA LP DAAC: MOD13Q1: MODIS/Terra Vegetation Indices 16-Day L3 Global 250 m Grid SIN V006, USGS Earth Resour. Obs. Sci. Center, Sioux Falls, South Dakota, https://doi.org/10.5067/MODIS/MOD13Q1.006, 2015.
NOAA: Anomalies of GPCC Precipitation, Phys. Sci. Div. Earth Syst. Res. Lab., available at: https://www.esrl.noaa.gov/psd/cgi-bin/data/composites/printpage.pl, last access: 8 February 2018.
Olofsson, P., Foody, G. M., Herold, M., Stehman, S. V, Woodcock, C. E., and Wulder, M. A.: Good practices for estimating area and assessing accuracy of land change, Remote Sens. Environ., 148, 42–57, https://doi.org/10.1016/j.rse.2014.02.015, 2014.
Pardo, A., Merino, A. P., and Castellanos, R. S. M.: Análisis de datos en psicología II, Pirámide, available at: https://books.google.es/books?id=k4OWAAAACAAJ (last access: 13 March 2018), 1998.
Patt, A., Peterson, N., Carter, M., Velez, M., Hess, U., and Suarez, P.: Making index insurance attractive to farmers, Mitig. Adapt. Strateg. Glob. Change, 14, 737–753, https://doi.org/10.1007/s11027-009-9196-3, 2009.
Pinstrup-Andersen, P.: Food security: definition and measurement, Food Secur., 1, 5–7, https://doi.org/10.1007/s12571-008-0002-y, 2009.
Polasek, W.: Multivariate Analysis for the Biobehavioral and Social Sciences: A Graphical Approach by Bruce L. Brown, Suzanne B. Hendrix, Dawson W. Hedges, Timothy B. Smith, Int. Stat. Rev., 81, 463–465, https://doi.org/10.1111/insr.12042_5, 2013.
Poveda, G. and Andrade, C.: Producción Sostenible De Arroz En La Provincia Del Guayas, Rev. Contrib. a las Ciencias Soc., Universidad de Guayaquil, Guayaquil, Ecuador, 2013.
Quarmby, N. A., Milnes, M., Hindel, T. L., and Sileos, N.: The use of multi-temporal NDVI measurements from AVHRR data for crop yield estimation and prediction, Int. J. Remote Sens., 14, 199–210, https://doi.org/10.1080/01431169308904332, 1993.
Rao, K.: International Conference on Agricultural Risk and Food Security 2010, Agric. Agric. Sci. Procedia, 1, 193–203, https://doi.org/10.1016/j.aaspro.2010.09.024, 2010.
Razali, N. M. and Wah, Y. B.: Power comparisons of Shapiro-Wilk, Kolmogorov–Smirnov, Lilliefors and Anderson-Darling tests, J. Stat. Model. Anal., 2, 21–33, 2011.
Rhee, J., Im, J., and Carbone, G. J.: Monitoring agricultural drought for arid and humid regions using multi-sensor remote sensing data, Remote Sens. Environ., 114, 2875–2887, https://doi.org/10.1016/j.rse.2010.07.005, 2010.
Ricome, A., Affholder, F., Gérard, F., Muller, B., Poeydebat, C., Quirion, P., and Sall, M.: Are subsidies to weather-index insurance the best use of public funds? A bio-economic farm model applied to the Senegalese groundnut basin, Agric. Syst., 156, 149–176, https://doi.org/10.1016/j.agsy.2017.05.015, 2017.
Rondeaux, G., Steven, M., and Baret, F.: Optimization of soil-adjusted vegetation indices, Remote Sens. Environ., 55, 95–107, https://doi.org/10.1016/0034-4257(95)00186-7, 1996.
Sánchez, N., González-Zamora, Á., Martínez-Fernández, J., Piles, M., and Pablos, M.: Integrated remote sensing approach to global agricultural drought monitoring, Agr. Forest. Meteorol., 259, 141–153, https://doi.org/10.1016/j.agrformet.2018.04.022, 2018.
Sivakumar, M., Motha, R., and Das, H.: Natural Disasters and Extreme Events in Agriculture, in: Impacts and Mitigation, edited by: Sivakumar, M., Motha, R., and Das, F., Springer, Berlin, 2005.
Soil Survey Staff: Keys to soil taxonomy, 12th Edn., USDA – Natural Resources Conservation Service, Washington, D.C., 2014.
Son, N. T., Chen, C. F., Chen, C. R., Minh, V. Q., and Trung, N. H.: A comparative analysis of multitemporal MODIS EVI and NDVI data for large-scale rice yield estimation, Agr. Forest. Meteorol., 197, 52–64, https://doi.org/10.1016/j.agrformet.2014.06.007, 2014.
Takahashi, K., Ikegami, M., Sheahan, M., and Barrett, C. B.: Experimental Evidence on the Drivers of Index-Based Livestock Insurance Demand in Southern Ethiopia, World Dev., 78, 324–340, https://doi.org/10.1016/j.worlddev.2015.10.039, 2016.
Torbick, N., Chowdhury, D., Salas, W., and Qi, J.: Monitoring rice agriculture across myanmar using time series Sentinel-1 assisted by Landsat-8 and PALSAR-2, Remote Sens., 9, 119, https://doi.org/10.3390/rs9020119, 2017.
Valverde-Arias, O., Garrido, A., Valencia, J. L., and Tarquis, A. M.: Using geographical information system to generate a drought risk map for rice cultivation: Case study in Babahoyo canton (Ecuador), Biosyst. Eng., 168, 26–41, https://doi.org/10.1016/j.biosystemseng.2017.08.007, 2018.
Valverde-Arias, O., Garrido, A., Saa-Requejo, A., Carreño, F., and Tarquis, A. M.: Agro-ecological variability effects on an index-based insurance design for extreme events, Geoderma, 337, 1341–1350, https://doi.org/10.1016/j.geoderma.2018.10.043, 2019.
van de Ven, W. P. M. M., van Vliet, R. C. J. A., Schut, F. T., and van Barneveld, E. M.: Access to coverage for high-risks in a competitive individual health insurance market: via premium rate restrictions or risk-adjusted premium subsidies?, J. Health Econ., 19, 311–339, https://doi.org/10.1016/S0167-6296(99)00028-4, 2000.
Van Tricht, K., Gobin, A., Gilliams, S., and Piccard, I.: Synergistic Use of Radar Sentinel-1 and Optical Sentinel-2 Imagery for Crop Mapping: A Case Study for Belgium, Remote Sens., 10, 1642, https://doi.org/10.3390/rs10101642, 2018.
Vedenov, D. V. and Barnett, B. J.: Efficiency of Weather Derivatives as Primary Crop Insurance Instruments, J. Agric. Resour. Econ., 29, 387–403, 2004.
Veloso, A., Mermoz, S., Bouvet, A., Le Toan, T. , Planells, M., Dejoux, J.-F., and Ceschia, E.: Understanding the temporal behavior of crops using Sentinel-1 and Sentinel-2-like data for agricultural applications, Remote Sens. Environ., 199, 415–426, https://doi.org/10.1016/j.rse.2017.07.015, 2017.
Vroege, W., Dalhaus, T., and Finger, R.: Index insurances for grasslands – A review for Europe and North-America, Agric. Syst., 168, 101–111, https://doi.org/10.1016/j.agsy.2018.10.009, 2019.
Williams, L. J. and Abdi, H.: Fisher's least significant difference (LSD) test, Encycl. Res. Des., 218, 840–853, 2010.
Xu, J. and Liao, P.: Crop Insurance, Premium Subsidy and Agricultural Output, J. Integr. Agric., 13, 2537–2545, https://doi.org/10.1016/S2095-3119(13)60674-7, 2014.
Yuanchang, X. and Jiyu, J.: The optimal boundary of political subsidies for agricultural insurance in welfare economic prospect, Agric. Agric. Sci. Procedia, 1, 163–169, https://doi.org/10.1016/j.aaspro.2010.09.020, 2010.
Zhang, X., Chen, N., Li, J., Chen, Z., and Niyogi, D.: Multi-sensor integrated framework and index for agricultural drought monitoring, Remote Sens. Environ., 188, 141–163, https://doi.org/10.1016/j.rse.2016.10.045, 2017.