the Creative Commons Attribution 4.0 License.
the Creative Commons Attribution 4.0 License.
 | 27 Nov 2020
Detecting precursors of an imminent landslide along the Jinsha River
Wentao Yang
Lianyou Liu
Peijun Shi
Landslides are major hazards that may pose serious threats to mountain communities. Even landslides in remote mountains could have non-negligible impacts on populous regions by blocking large rivers and forming dam-breached mega floods. Usually, there are slope deformations before major landslides occur, and detecting precursors such as slope movement before major landslides is important for preventing possible disasters. In this work, we applied multi-temporal optical remote sensing images (Landsat 7 and Sentinel-2) and an image correlation method to detect subpixel slope deformations of a slope near the town of Mindu in the Tibet Autonomous Region. This slope is located on the right bank of the Jinsha River, ∼80 km downstream from the famous Baige landslide. We used a DEM-derived aspect to restrain background noise in image correlation results. We found the slope remained stable from November 2015 to November 2018 and moved significantly from November 2018. We used more data to analyse slope movement in 2019 and found retrogressive slope movements with increasingly large deformations near the riverbank. We also analysed spatial–temporal patterns of the slope deformation from October 2018 to February 2020 and found seasonal variations in slope deformations. Only the foot of the slope moved in dry seasons, whereas the entire slope was activated in rainy seasons. Until 24 August 2019, the size of the slope with displacements larger than 3 m was similar to that of the Baige landslide. However, the river width at the foot of this slope is much narrower than the river width at the foot of the Baige landslide. We speculate it may continue to slide down and threaten the Jinsha River. Further modelling works should be carried out to check if the imminent landslide could dam the Jinsha River and measures should be taken to mitigate possible dam breach flood disasters. This work illustrates the potential of using optical remote sensing to monitor slope deformations over remote mountain regions.
- Article
(7874 KB) - Full-text XML
- BibTeX
- EndNote


Landslides are major natural hazards in mountain regions and cause widespread disasters every year around the globe (Petley, 2012; Zhang et al., 2020). Major landslides in remote mountain regions may pose serious threats to downstream communities by choking channels, which increases the risks of landslide-dammed-lake outburst floods (Fan et al., 2020; Liu et al., 2019). For example, a hillslope near the Baige village had two landslides, damming the Jinsha River twice in 2018. The outburst floods caused widespread damage along its route and affected areas as far as Yunnan Province, >500 km from the landslides (Fan et al., 2019). In 2000, a super-large landslide dammed the Yigong River in Tibet, and 2 months later the outburst flood caused widespread damage, including to five main bridges, to highways and to communication cables in downstream areas (Shang et al., 2003). The 1786 breach of the landslide-dammed lake in the Dadu River consumed >100 000 lives along its route (Dai et al., 2005). Similar cases could occur in many mountain regions in the world, and detecting precursors (such as slope movement) before major landslides is crucial for preventing such disasters (Intrieri et al., 2018; Carlà et al., 2019).
Remote sensing techniques have been an efficient way to monitor slope movement over large mountain regions (Du et al., 2020; Handwerger et al., 2019). Optical passive and radar remote sensing provides the most frequently used data to detect slope displacements. There are two kinds of mainstream methods to derive slope movement. Synthetic-aperture radar (SAR) interferometry processing uses the difference in phase images to derive subtle slope movement of a few millimetres (Intrieri et al., 2018; Samsonov et al., 2020). However, large ground displacements (e.g. of a few metres), dense vegetation or long time intervals can lead to incoherence in phase images in this type of method (Wasowski and Bovenga, 2014). Image correlation methods (also referred to as pixel offset tracking used in SAR intensity images) constitute another type of approach that uses SAR amplitude or optical images to correlate image patches to measure slope movement and can derive subpixel ground displacements from 1∕10 to 1∕30 of a pixel (Li et al., 2020). The latter type is good at detecting larger slope movements that are visible on images (Bradley et al., 2019; Lacroix et al., 2020). In recent years, image correlation methods have been proposed and widely used to detect subpixel slope displacements in optical images (Bontemps et al., 2018; Lacroix et al., 2018, 2019; Yang et al., 2020).
In this work, using subpixel optical image correlation methods we report a landslide along the Jinsha River. Different from previous retrospective studies, the landslide in this work has not yet collapsed. We used multi-temporal Sentinel-2 images and found the slope is unstable and could pose a threat to downstream areas by blocking the Jinsha River.
2.1 Study area
The reported slope is ∼80 km downstream from the Baige landslide (Fan et al., 2019) along the Jinsha River near the town of Mindu, Tibet Autonomous Region, bordering Sichuan Province (Fig. 1a). The slope is located on the right bank of the Jinsha River. Similar to the Baige landslide, the geomorphology of this section of the Jinsha River is at the bottom of a V-shaped valley. The elevation of the study area ranges from 2660 m at the valley bottom to >4500 m on the mountain ridge. This rough topography indicates strong fluvial incision against the rapid uplift of the Tibetan Plateau. We estimated the mean annual precipitation (MAP) by using the GPM v6 monthly precipitation (from 2001 to 2019) and found the MAP of this area to be ∼665 mm. The region is controlled by a monsoon climate with >90 % of the rain occurring from May to October.
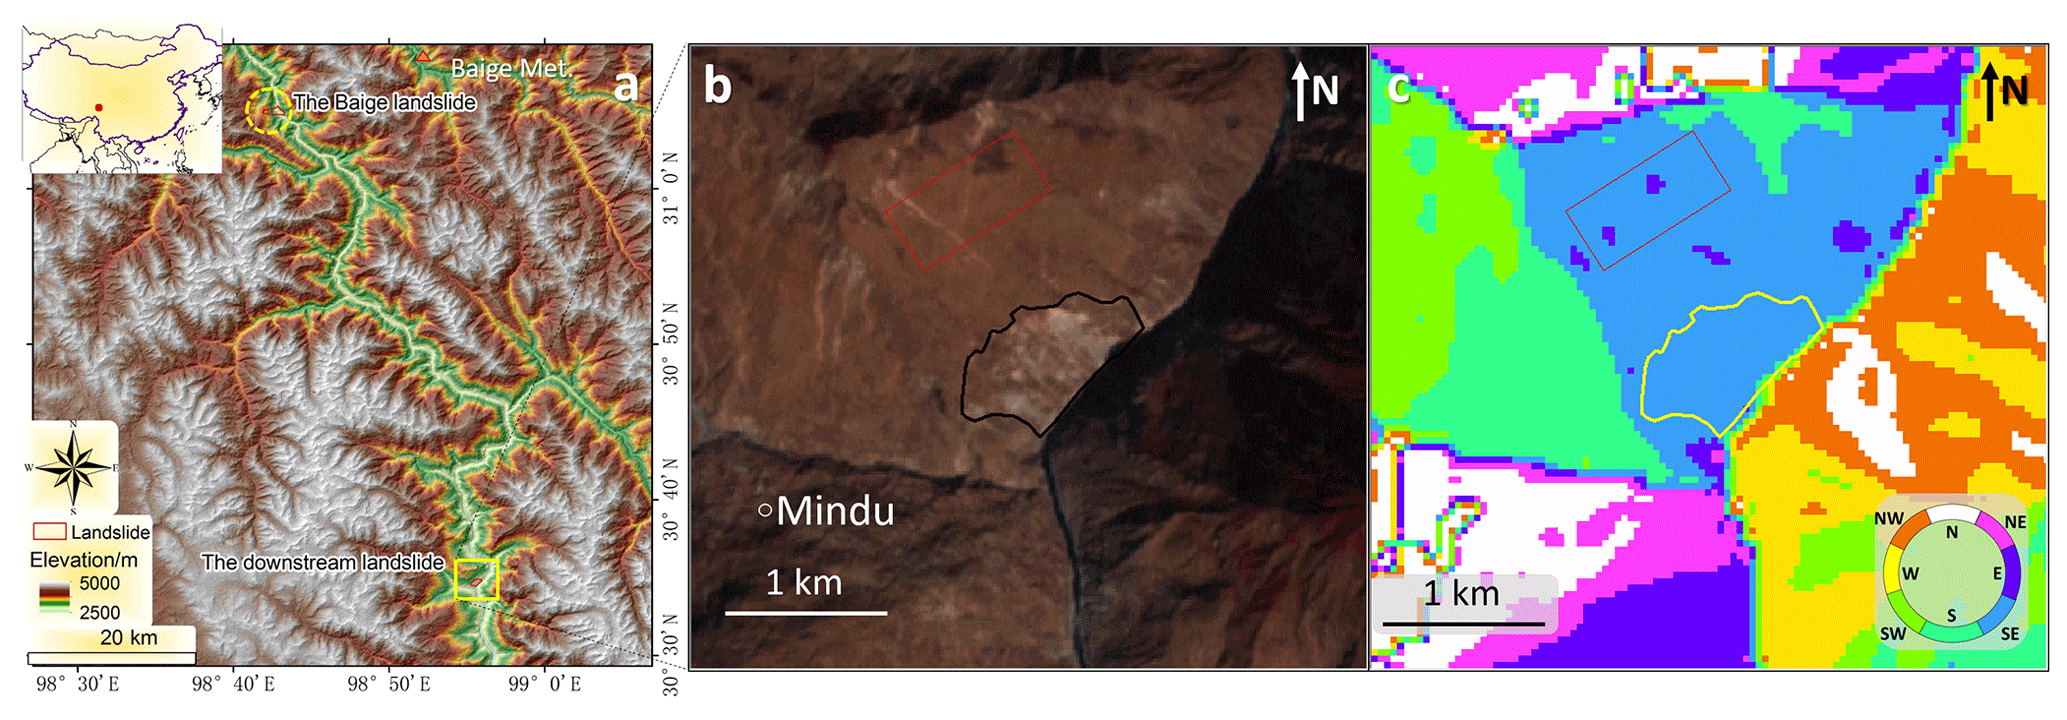
Figure 1Topographic maps of the study area. (a) Geographic locations of the Baige landslide and the downstream landslide around the town of Mindu, Tibet Autonomous Region. (b) A 15 m resolution pan-sharpened Landsat 7 false-colour image on 18 February 2001 and (c) aspect of the study area around the Mindu landslide. The elevation data in (a) are a product of NASA's Shuttle Radar Topography Mission (SRTM), and the aspect in (c) is a derivative of the DEM. The red polygons in (b) and (c) are the selected stable zone. Both the SRTM DEM in (a) and its derivative (c) were downloaded from the Geospatial Data Cloud website (http://www.gscloud.cn/sources, last access: 22 November 2020). The Landsat image in (b) is a joint product of the United States Geological Survey and NASA and was downloaded via the Google Earth Engine (GEE).
This area is tectonically active, and active faults run through this slope from north to south. To the west of the faults are upper Palaeozoic strata and to the east are Mesoproterozoic metamorphic rocks. Cracks and fissures on the slope are visible from a 15 m resolution pan-sharpened false-colour Landsat 7 image acquired in 2001 (Fig. 1b). These cracks and fissures may be relics of historic earthquakes or precipitation. This part of the slope has a percent slope of 45 % and a southeast aspect, with an azimuth between 112.5 and 157.5 ∘ (Fig. 1c). The slope is mainly covered by grass and sparse shrubs and less affected by anthropogenic activities. Field reconnaissance has not been carried out for this slope due to outbreak of the COVID-19 pandemic. Instead, we examined the slope via Google Earth images. Fissure cracks are clearly visible on the uppermost part of the slope, and there are widespread cracks on the lower part of the slope. Evidenced by very high spatial resolution Google Earth images, the landslide in this work is a translational type (Highland and Bobrowsky, 2013).
In this work, we mainly relied on Sentinel-2 optical images to derive slope movement. The European Space Agency's Sentinel-2 mission has two twin satellites in orbit, with a revisit time of less than 5 d. The Sentinel-2 optical imagery has 12 optical bands with wavelengths ranging from 440 to 2200 nm (Gascon et al., 2017). There are 4 bands with a spatial resolution of 10 m: blue, green, red and near-infrared bands. To derive slope movement, we used the red band because its wavelength is longer than those of other visible bands and is less influenced by the atmosphere. Compared to the near infrared, this band is less sensitive to vegetation and is more reliable for measuring slope deformation (Yang et al., 2019). We used the Level-1C product, which is orthorectified before distribution (Gascon et al., 2017).
2.2 The COSI-Corr method
This work used the COSI-Corr method, a correlation method for optical images to detect slope displacements (Leprince et al., 2007). To derive slope movement, two images in a roll should be used to form an image pair, including the base image and the target image. The base image is an earlier image, based on the image correlation algorithm (here we use the COSI-Corr) implemented to detect slope displacements in the target image (Leprince et al., 2007). For detailed parameters to use the COSI-Corr method, please refer to Yang et al. (2020).
In this work, we used three steps to detect slope displacements for the Mindu slope studied. For the first step, we used two image pairs (no. 1–no. 2) to find the stable and moving periods before and after November 2018. For the second step, we used 19 images in the stable period to estimate cumulative slope displacements in 5 target images in the moving period (image pair no. 3–no. 97). For the third step, we used another 9 images to derive displacements for every 2 adjacent images (image pair no. 98–no. 105).
2.2.1 Deriving slope displacements
In the first step, we used three Sentinel-2 images (on 13 November 2015, 12 November 2018 and 12 November 2019) to compose two image pairs (no. 1 and no. 2). The first image pair (no. 1) is composed of a Sentinel-2 image on 13 November 2015 and a Sentinel-2 image on 12 November 2018. Sentinel-2 images of the second pair (no. 2) were acquired on 12 November 2018 and on 12 November 2019.
Table 1List of the 19 base images in early 2018 and 9 targeted images in 2019. Base images were used to detect cumulative slope displacements in targeted images. Image pairs used in this step are no. 3–no. 97.
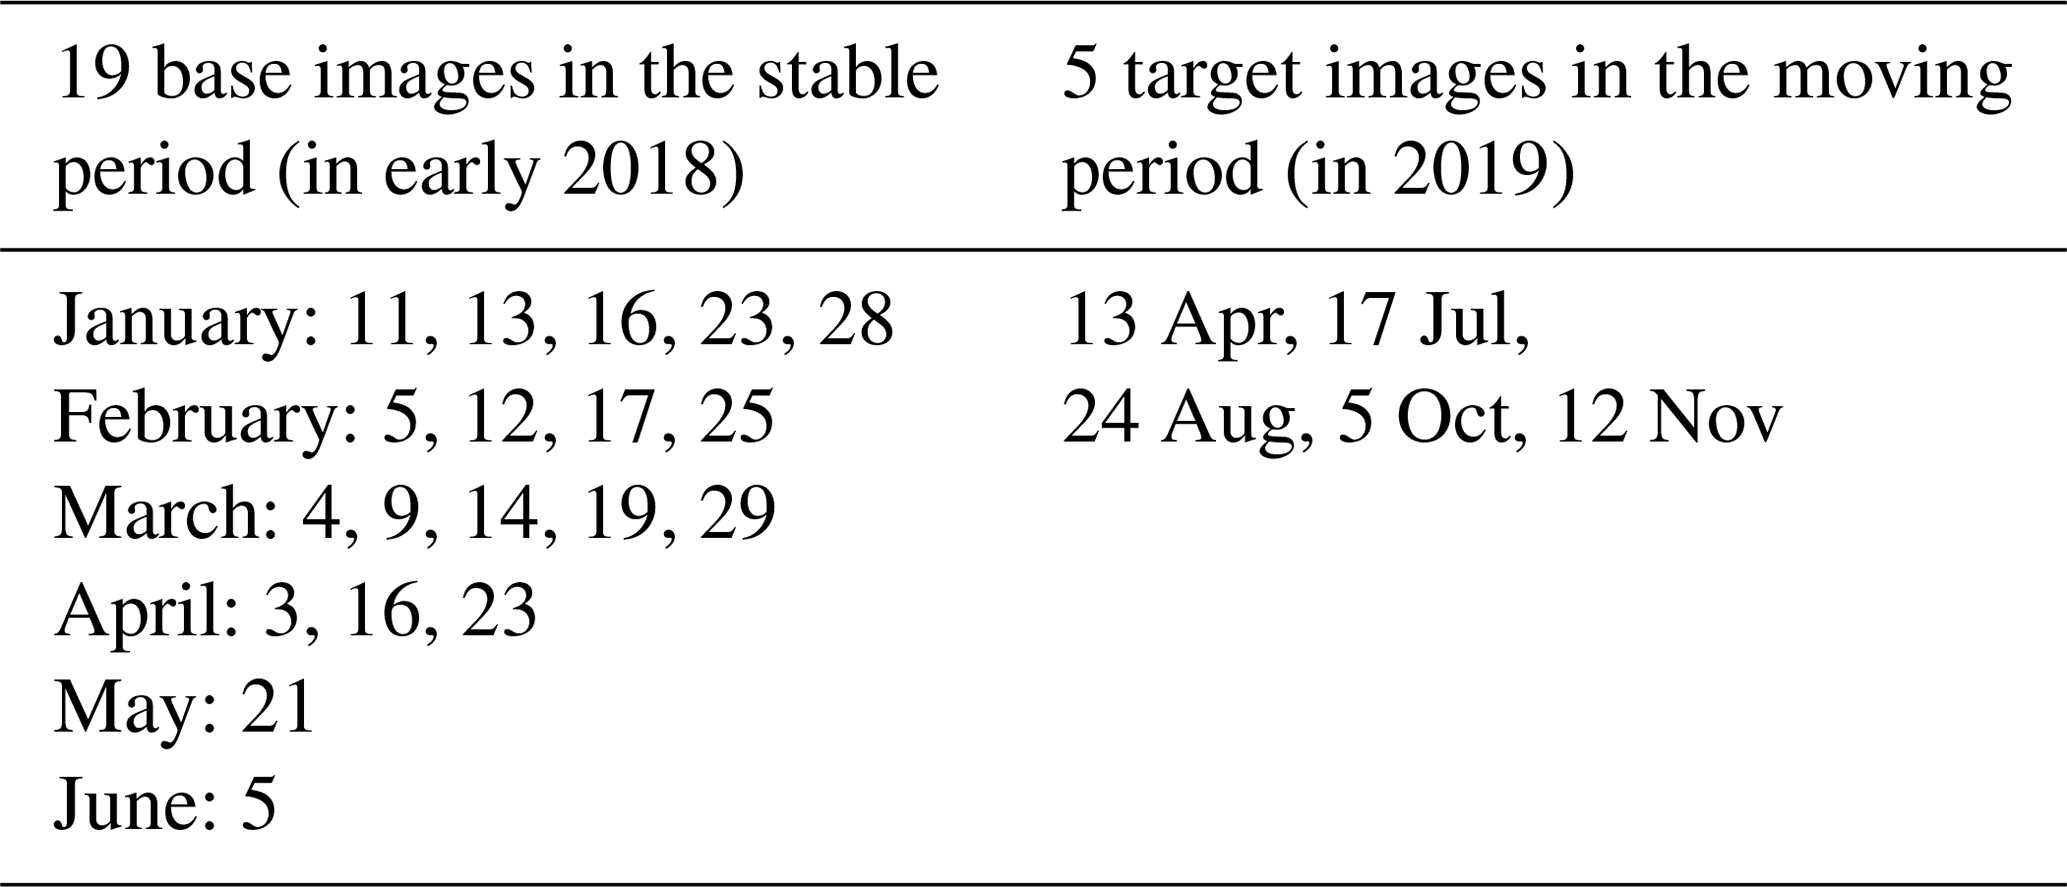
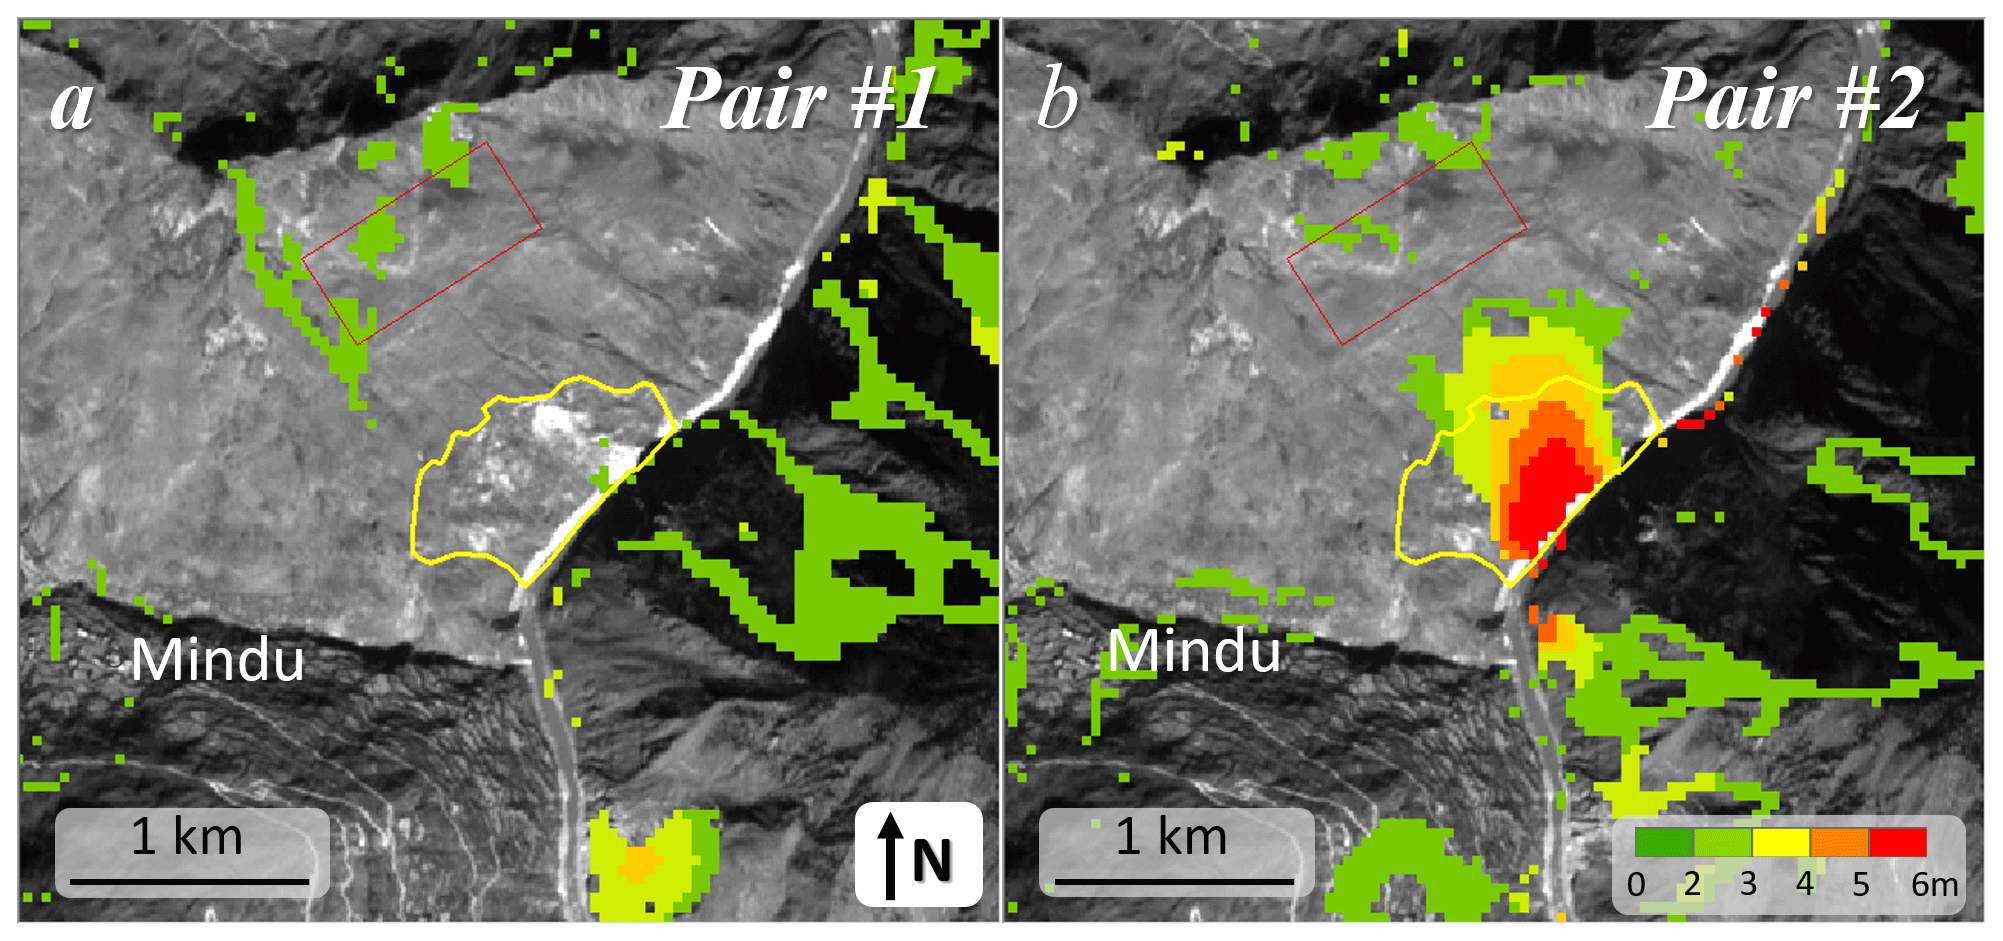
Figure 2Detected slope displacements in image pair no. 1 (a) and no. 2. (b). Background Sentinel-2 images were acquired on 13 November 2015 and 12 November 2018, respectively. Both images were produced by ESA's Sentinel-2 satellites and downloaded via the GEE.
Table 2Eight periods (image pair no. 98–no. 105) were used to derive the Mindu slope movement.
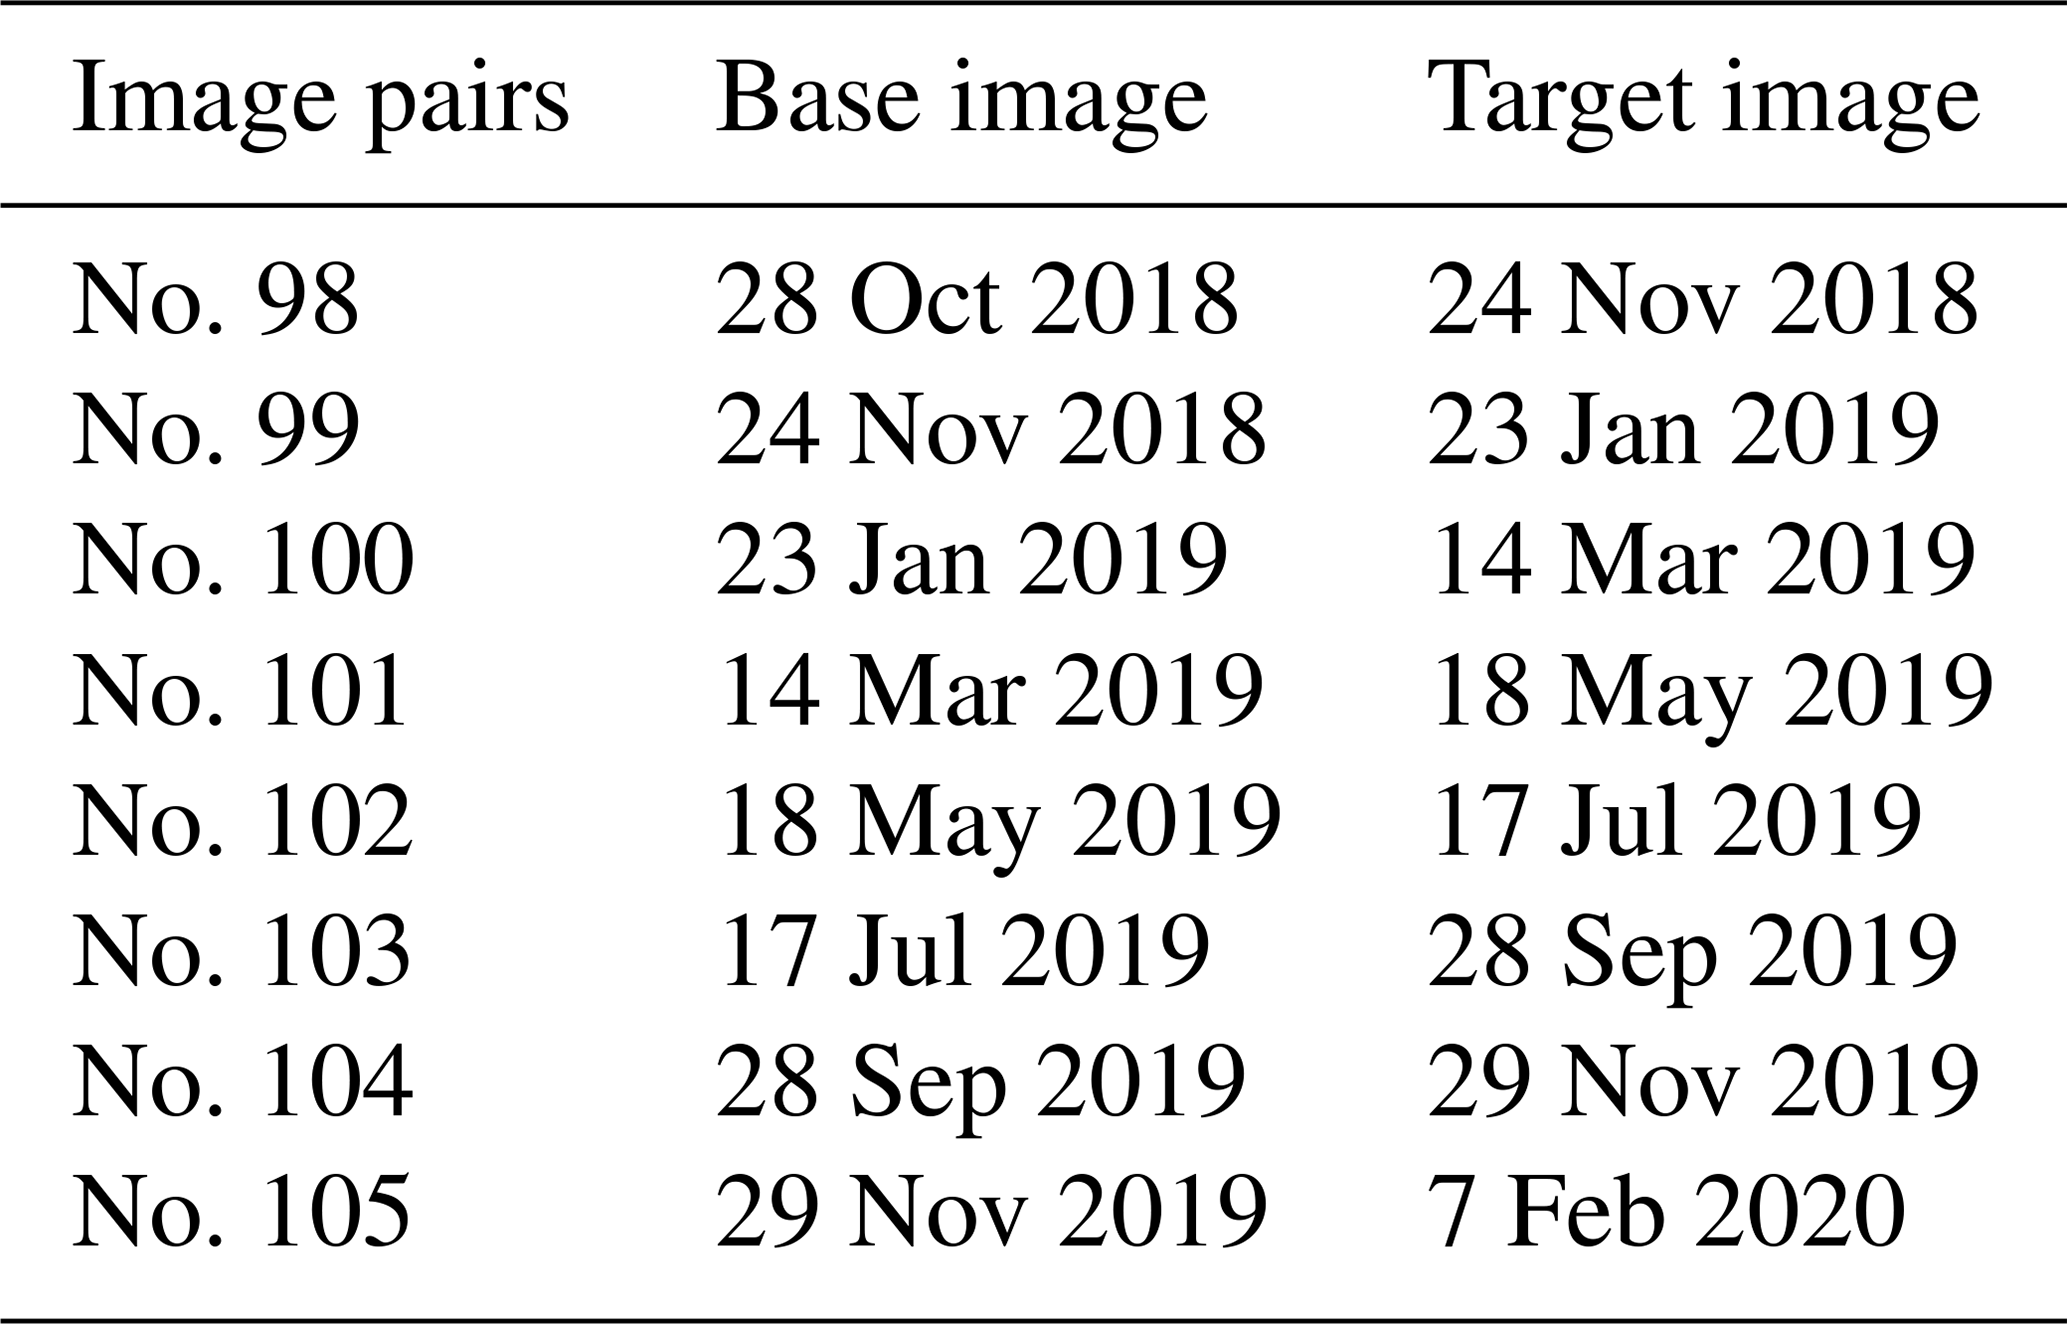
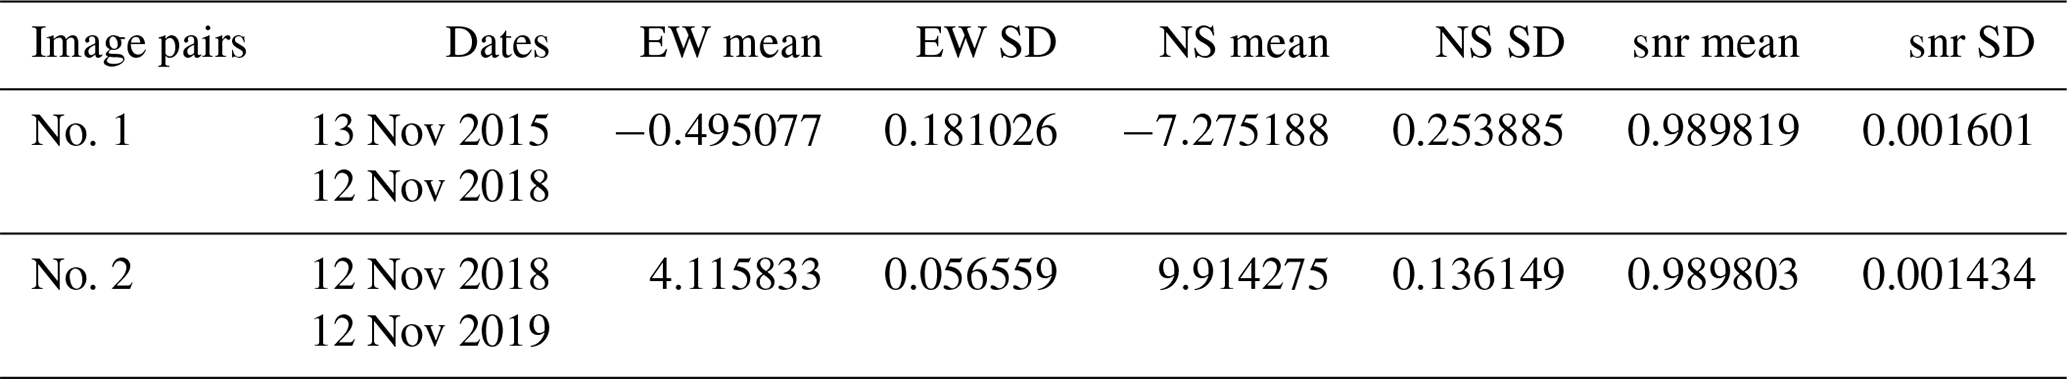
Table 3Detected image shifts (system error) in the stable zone. The EW (east–west) SD and NS (north–south) SD indicate uncertainties in the method, and the EW mean and NS mean were used to derive the final displacements in image pairs no. 1 and no. 2. The signal-to-noise ratio is denoted by snr.
By using the first two image pairs, we found the slope was stable from 13 November 2015 to 12 November 2018 and moved significantly from 12 November 2018 to 12 November 2019. Therefore, in the second step, we used two image groups, a base image group in the stable period and a target image group in the moving period, to detect cumulative slope displacements (Table 1). For the base image group, there are 19 clear images without clouds in 2018. For the target image group, we selected 5 images in 2019 (13 April, 17 July, 24 August, 5 October and 12 November) to detect cumulative displacements. In all, there are 19 × 5 image pairs (no. 3–no. 97) calculated in the second step. In the third step, we used 9 images from 28 September 2018 to 7 February 2020 (Table 2) to form another 8 image pairs (no. 98–no. 105) to derive slope displacements.
2.2.2 Error assessment and postprocessing
Misalignments between images can be estimated by selecting a stable zone (Bontemps et al., 2018; Lacroix et al., 2018; Yang et al., 2019). In this work, the stable zone was selected on the upper part of the landslide (red rectangles in Fig. 1b and c). Mean displacements estimated within the stable zone were used to correct image shifts. SDs of the displacements within the stable zone represent uncertainties, indicating the quality of the derived results for a given image pair. We selected this area because this stable zone is on the same slope as the landslide, which can minimize the influence of illumination and orthorectification errors.
In this work, we cross-validated measured slope displacements for 5 target images in 2019 identified in the second step. Uncertainties in the slope displacements for a given target image were estimated from all 19 base images in the stable periods. Standard deviations of these 19 measurements were used to indicate their reliability. We further filtered out displacements with moving directions that did not agree with the SRTM DEM-derived aspects. If there are 15∘ deviations between the derived slope movement and the aspect, the derived slope movement is defined as invalid and is not used for further analysis.
3.1 Detected stable and unstable periods
In Table 3, the EW mean and NS mean indicate the east–west (EW) and north–south (NS) shifts in images in both image pairs calculated from the stable zone. The EW SD and NS SD are SDs of displacements in the stable zone to indicate image distortions. Low EW SD and NS SD values indicate good performances during image orthorectifications. The derived EW mean and NS mean were used to correct misalignments in image pairs. The base and target images for image pair no. 1 are from 13 November 2015 and 12 November 2018, respectively. The base and target images for image pair no. 2 are from 12 November 2018 and 12 November 2019, respectively. The slope remains stable in the first image pair, whereas detectable slope displacements can be found in the second image pair (Fig. 2). The durations of image pair no. 1 and pair no. 2 span 3 years and 1 year, respectively. In Fig. 2a, we can see that the slope displacement from 2015 to 2018 was less than 2 m, whereas there was >6 m slope displacement from 2018 to 2019 (Fig. 2b). In image pair no. 2, larger displacements were observed near the Jinsha River and smaller displacements were farther away from the river. This increasing displacement magnitude indicates the slope may start to move from its toe.
3.2 Cumulative slope displacements in 2019
As in Fig. 2, we can see that this slope remained stable from November 2015 to November 2018 and moved after November 2018. To derive time series of the Mindu slope displacements after November 2018, we used 19 base images in the stable period and 5 target images in 2019. All 19 base images are from early 2018, during which the slope was stable. Five selected target images were acquired on 13 April 2019, 17 July 2019, 24 August 2019, 5 October 2019 and 12 November 2019. For each target image in 2019, we calculated slope movement by using all base images. Therefore, there are 19 estimated slope displacements for each target image. We calculated the means and SDs of slope displacements for all target images (Fig. 3).
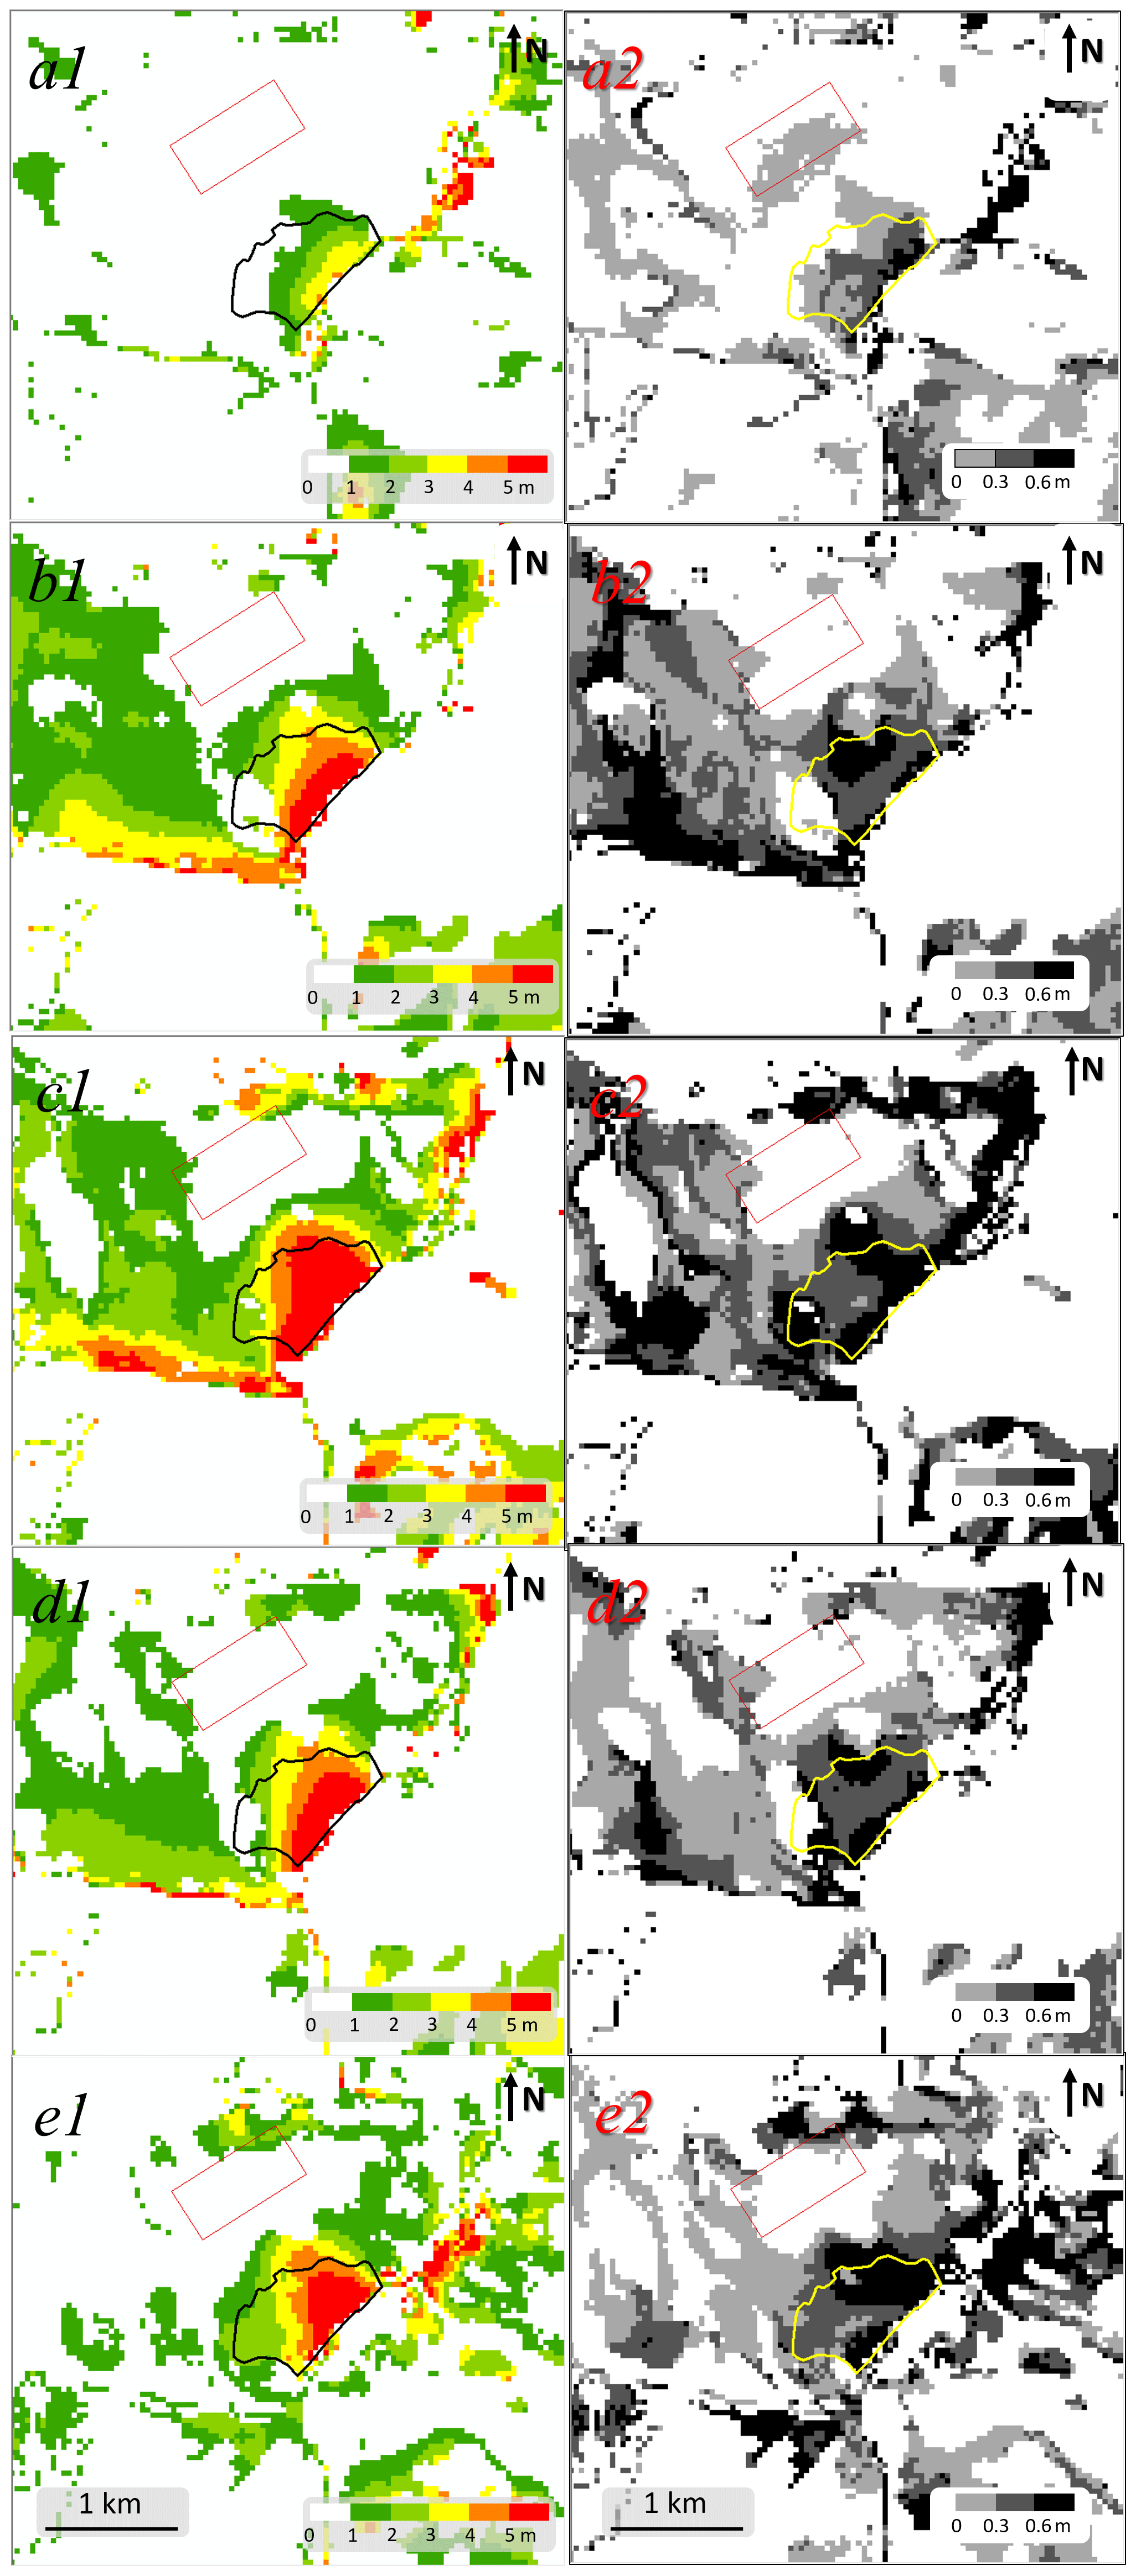
Figure 3Means and standard deviations of the derived slope displacements in the five targeted images (Table 1). Detected means and SDs of slope displacement on 13 April 2019 (a1–a2), 17 July 2019 (b1–b2), 24 August 2019 (c1–c2), 5 October 2019 (d1–d2) and 12 November 2019 (e1–e2).
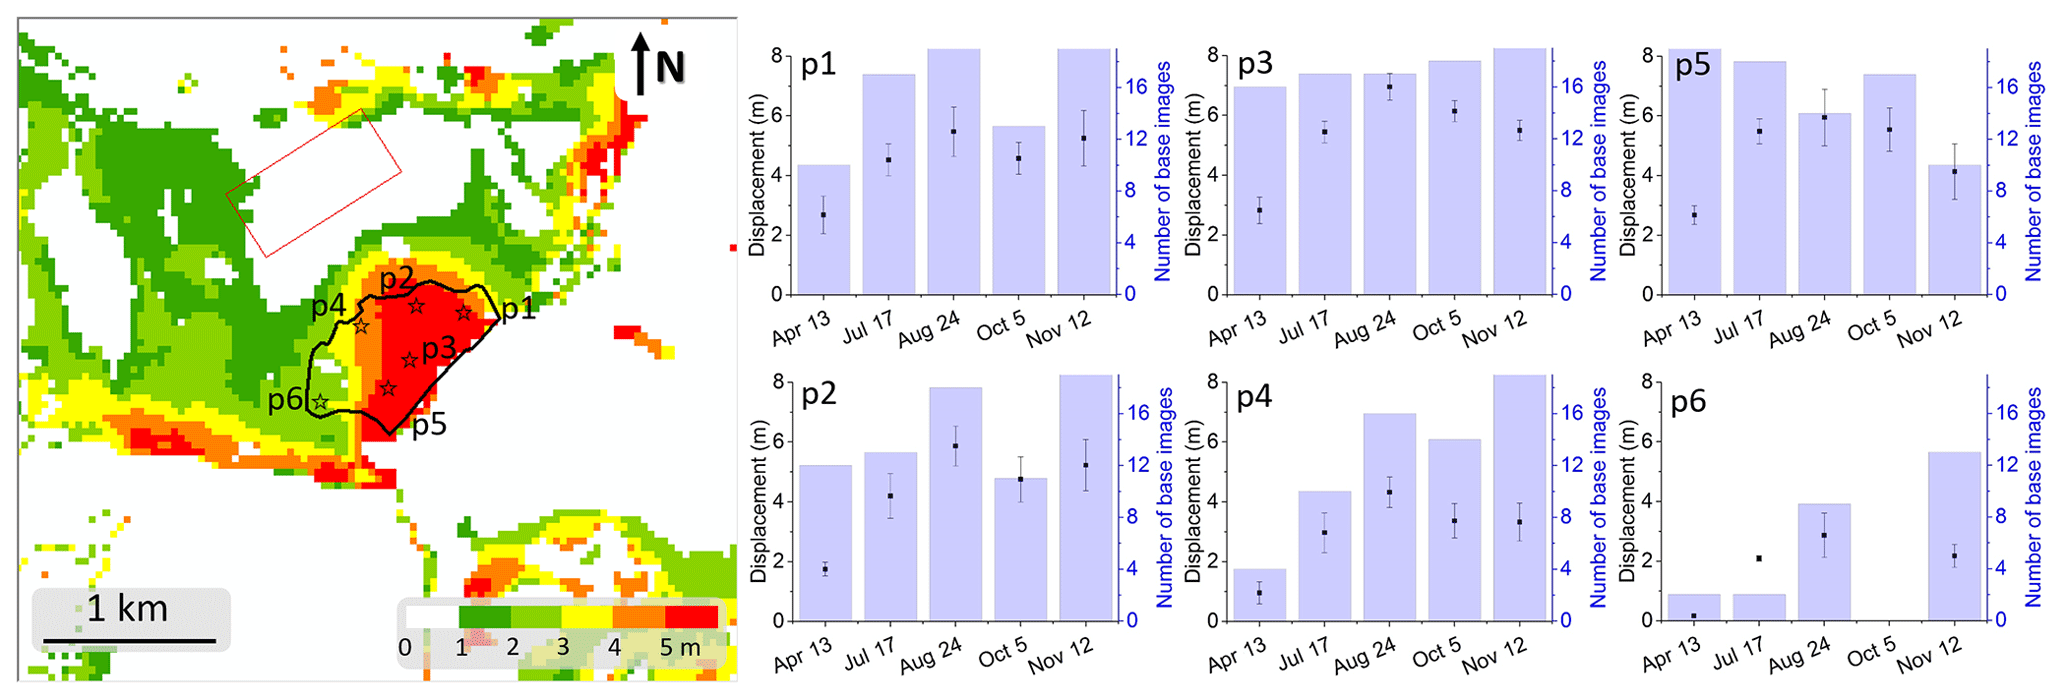
Figure 4Time series of the slope displacements. Image to the left shows the slope displacements on 12 November 2019, and the map colour is shown as a minimum–maximum linear-stretch type. Sub-panels (p1–p6) to the right show means (points), SDs (vertical bars) and valid numbers (histograms) of cumulative displacements between the 19 base and 5 target images for the six selected points (stars) in the left image.
From Fig. 3, we can see that the mean displacements are a magnitude larger than the SDs, which indicates that the displacements derived between each target image and their base images agree with each other quite well. Minor slope displacements were detected until April 2019 (maximum 3–4 m), whereas larger slope displacements can be observed in the later four target images (>5 m). All displacements in the five target images show a similar pattern to results in image pair 2 (Fig. 2b), demonstrated by larger displacements near the river and less movement further from the river.
We further selected six points on the slope to analyse time series of the slope displacements in 2019 (Fig. 4). For most target images for the first five points (p1–p5), most base images could derive >10 valid displacements (2-D columns). For all six points, accumulated displacements show similar growing trends from April 2019 to November 2019. Maximum displacements for all six points occurred on 24 August 2019. These unreasonably large values may be caused by a difference in solar elevation and zenith angles in target images. For example, compared to the August image there are more mountain shadows in the November images in the Northern Hemisphere. Despite abnormal displacements in August 2019, we can see that displacements from July to November 2019 are still larger than displacements in April 2019. Therefore, from the time series of these six points, we can see that major slope displacements occurred from April to August 2019.
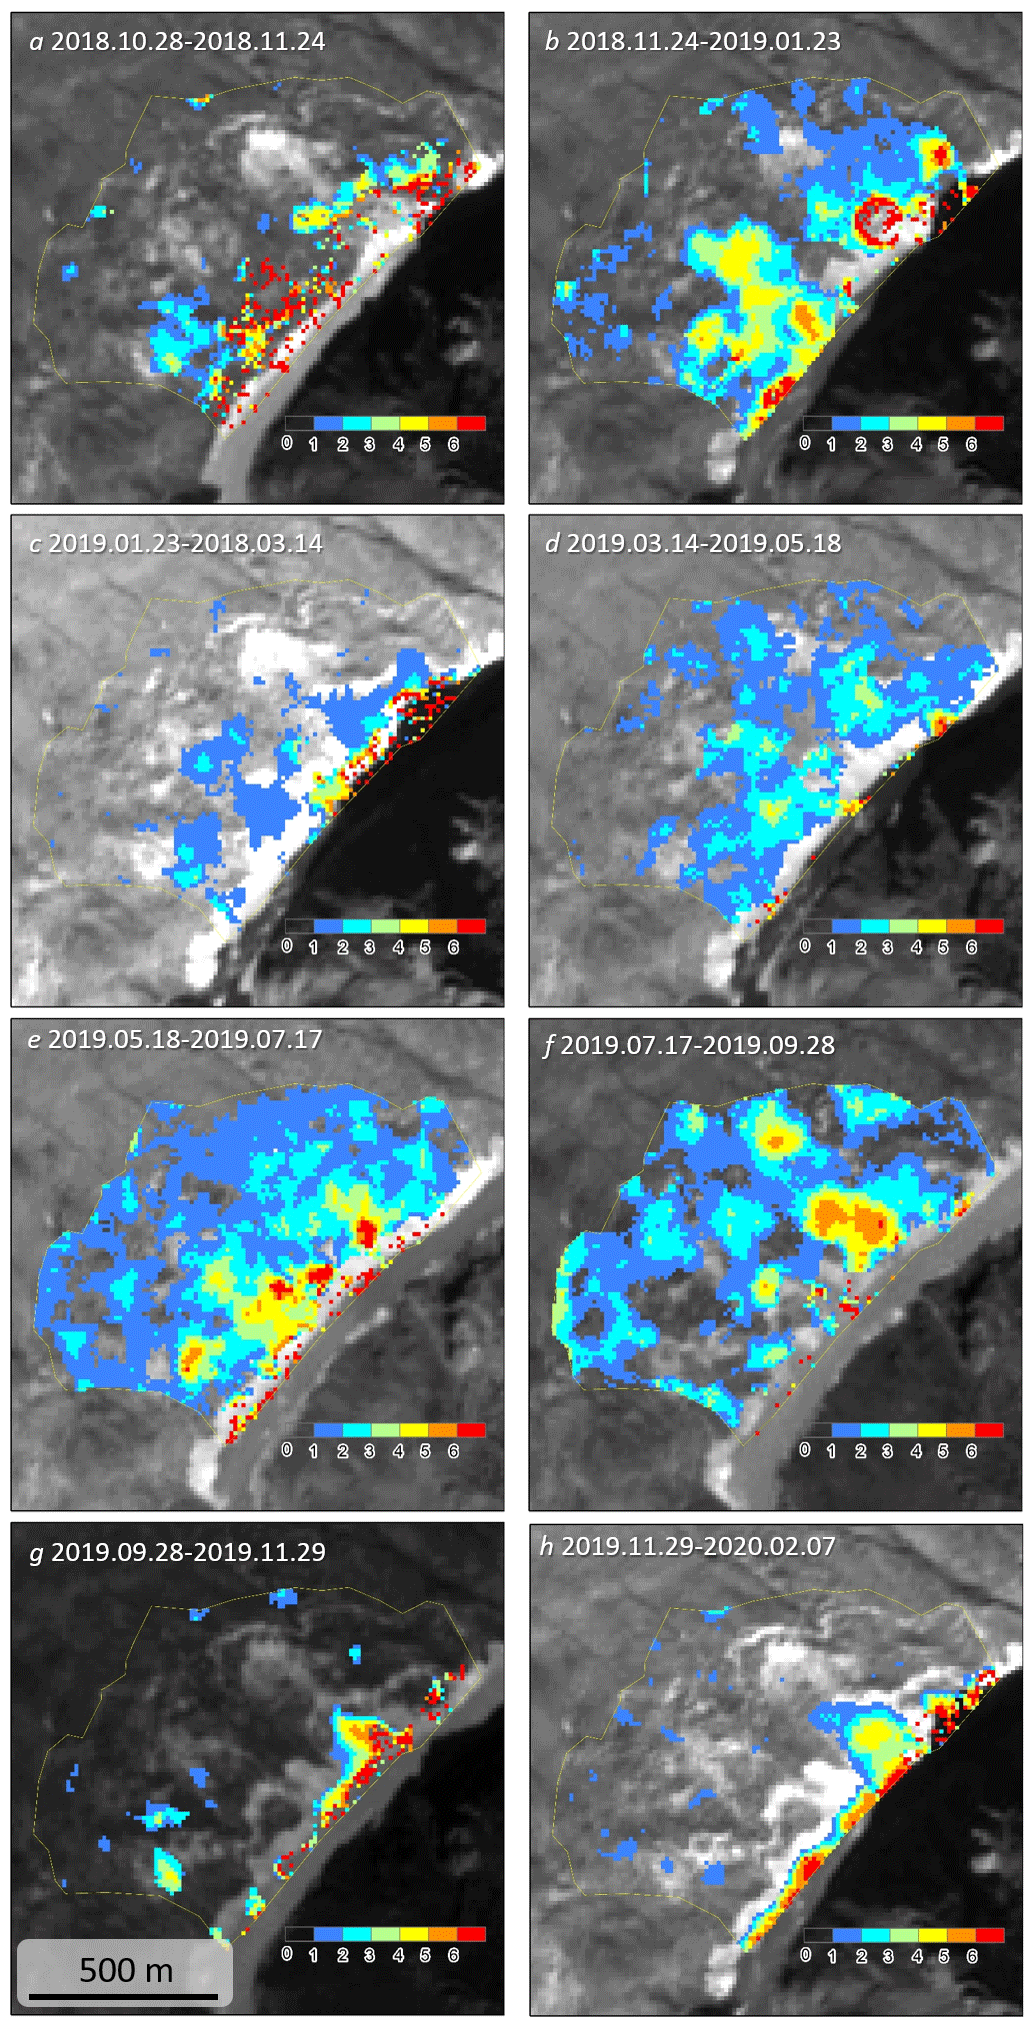
Figure 5Slope displacements in different periods after the Baige floods (background images are Sentinel-2 data produced by ESA's Sentinel-2 satellites and downloaded via the GEE).
3.3 Slope displacements in eight selected periods after November 2018
To analyse spatial deformation patterns in different periods, we selected nine Sentinel-2 images forming eight image pairs (image pair no. 98–no. 105 in Table 2, corresponding to eight periods in ∼2 months). The first two image pairs (Fig. 5a and b, no. 98 and no. 99) show that the middle and lower parts of the slope deformed significantly and 4–6 m of displacement occurred at multiple locations. The study area has a monsoonal climate with most precipitation occurring from May to September (Fig. 6). There are seasonal differences in the deformation of this landslide. In the dry seasons of winter and spring, deformation occurs at the foot of the slope near the Jinsha River and the deformation rate is generally less than 1 m per month (from January to May, Fig. 5c and d and periods 3–4 in Fig. 6, image pairs no. 100–no. 101). In the rainy seasons of summer and autumn, deformation affects the entire slope with some parts at a rate of more than 3 m per month (from May to September, Fig. 5e and f and periods 5–6 in Fig. 6, image pair no. 102–no. 103).
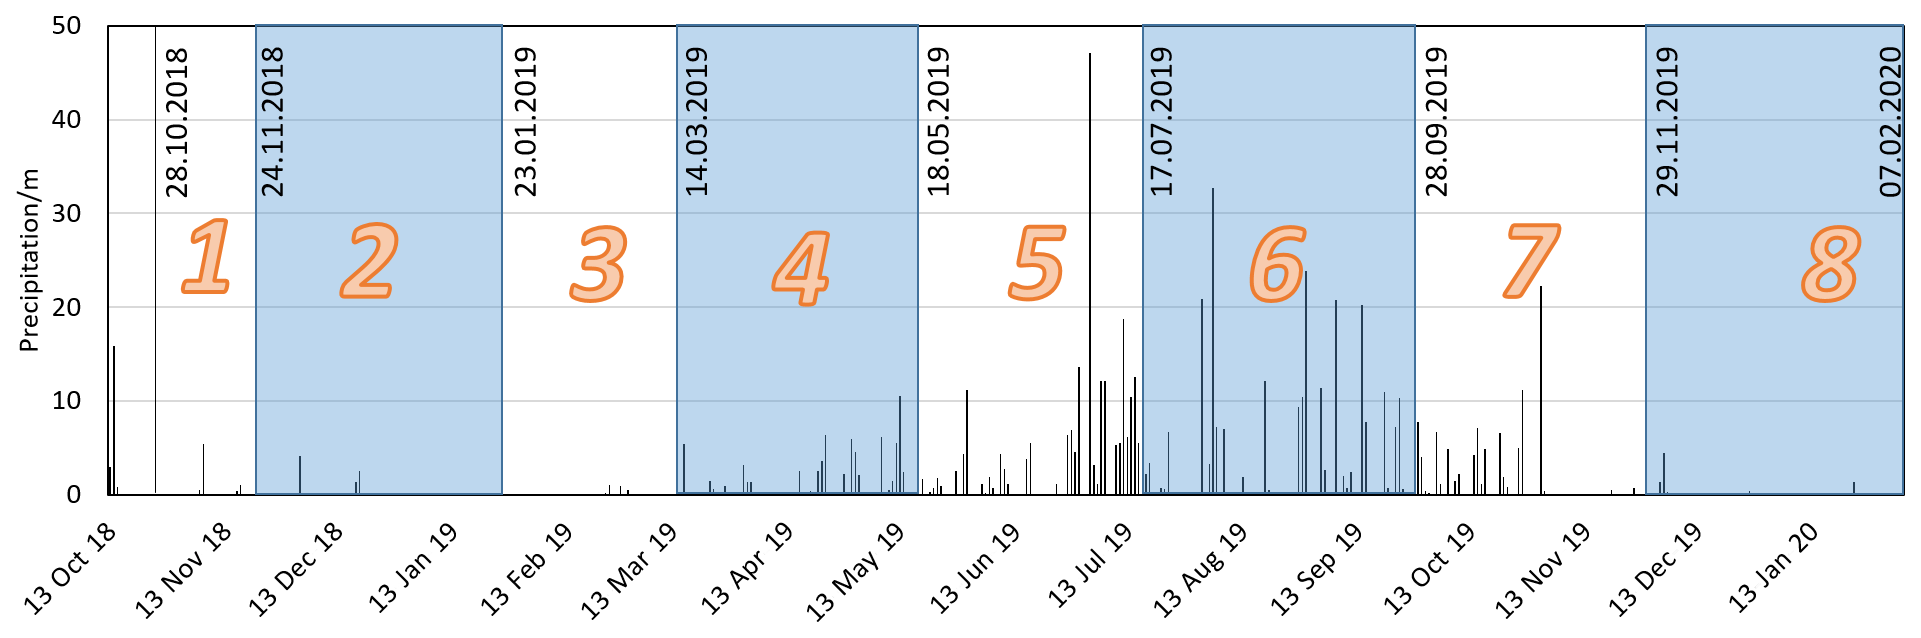
Figure 6Daily precipitation of the Baiyu meteorology station from October 2018 to February 2020.
4.1 Possible impacts of this imminent landslide
Major landslides in mountains may dam river channels forming transient lakes, the breach of which can result in catastrophic floods affecting downstream communities (Dai et al., 2005; Fan et al., 2019; Liu et al., 2019). In this work, we examined a hillslope near the town of Mindu along the Jinsha River. We found the slope had significant movement from November 2018 to November 2019. Despite the area of the detected moving slope (715 577 m2 for displacements larger than 3 m) being similar to the area of the Baige landslide (830 624 m2), the width of the Jinsha River channel below the Mindu slope (∼50) is half that of the Baige (>100 m, in Fig. 7). Considering the similar morphology of both river sections, the collapse of the Mindu slope could pose a threat to downstream communities by blocking the Jinsha River. We call for further frequent monitoring of the hillslope in combination with other tools, such as InSAR (Intrieri et al., 2018; Samsonov et al., 2020).
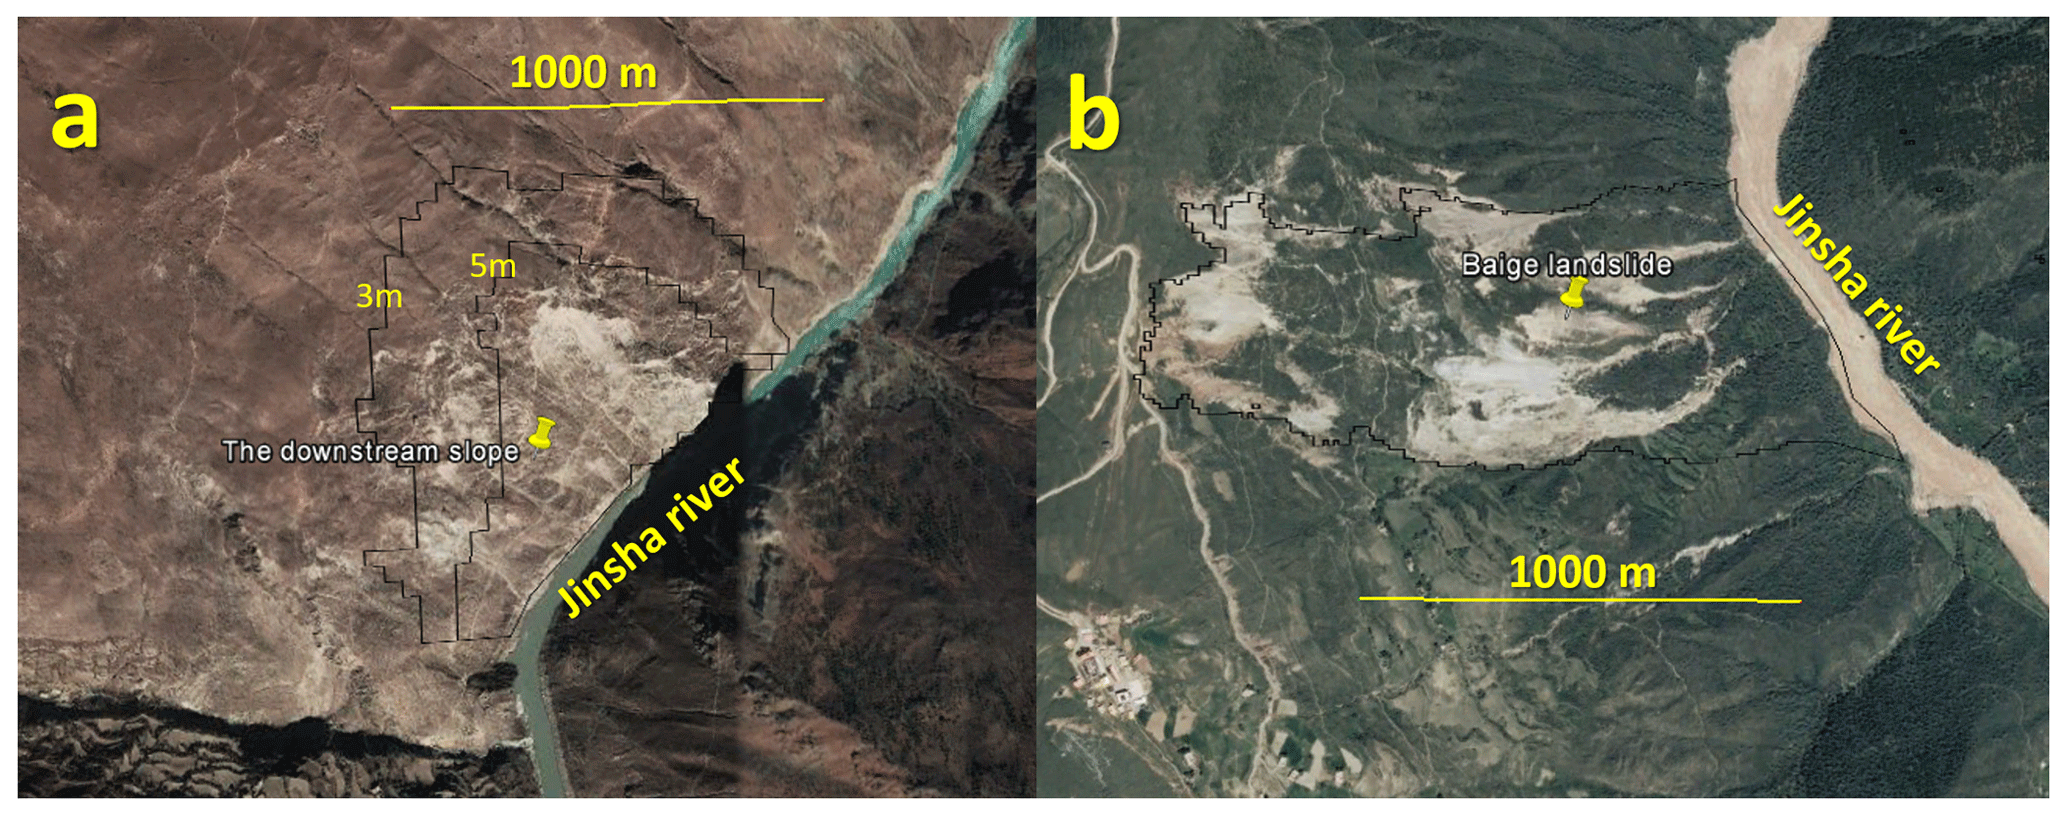
Figure 7High-spatial-resolution images from © Google Earth. The image to the left was acquired on 30 March 2015 for the Mindu slope (a), and the right image was acquired on 18 July 2017 for the Baige slope (b).
4.2 Comparison of image matching and InSAR methods
In this work, we used the COSI-Corr method to derive slope displacements for the Mindu slope along the Jinsha River. The principle of this method is to use a sliding window to find pattern matches to derive displacements in image pairs (Leprince et al., 2007). Compared to the InSAR methods, this method is easier to understand and implement. In addition, image correlation methods favour larger displacements than InSAR methods. Limited by the wavelength of the SAR image, InSAR methods are versed in monitoring ground deformations on a millimetre to centimetre scale (Intrieri et al., 2018), whereas the capability of image correlation methods depends on spatial resolution of images. In general, image correlation methods are more reliable for deriving large ground displacements on a metre scale (Bradley et al., 2019; Lacroix et al., 2020). In this work, it might be quite challenging for InSAR methods to detect such large displacements. Long temporal intervals of a few months could lead to incoherence in SAR images (Li et al., 2019), whereas images (taken in the same season) with long temporal intervals of a few years can be used to derive reliable displacements given a stable land cover (Yang, 2020). Both methods can be affected by the atmosphere. Clear optical images without clouds should be used in image correlation methods. Although SAR images can penetrate thin clouds, the atmosphere could cause phase delay and lead to uncertainties in derived results (Li et al., 2019).
Both methods work well on bare land without vegetation, though dense vegetation could seriously affect InSAR methods (Intrieri et al., 2018). On the contrary, image correlation methods are less affected by vegetation cover as long as images in the pair are from the same season (Yang, 2020). As image correlation methods use pattern matches within an image pair, we speculate that vegetation density may not be a major challenge for the method. The Sentinel-2 images used in this work have four 10 m resolution optical bands (Gascon et al., 2017). In theory, any of these four bands may be used to derive slope displacements. But, an ideal band should not be sensitive to ground cover change unrelated to ground displacements, which could minimize background noise. In general, optical bands with shorter wavelengths are more prone to be affected by moisture in the atmosphere. Considering that the near-infrared band is very sensitive to vegetation, we used the red band in this work.
Both InSAR and image correlation methods can be impacted by complex terrains in mountain regions. Layover and shadow areas in SAR images should not be used in InSAR methods (Li et al., 2019). Similarly, shadows in optical images also influence derived results (Yang et al., 2020). To derive reliable results, optical images acquired during larger solar angles should be prioritized to minimize the influence of mountain shadows. Fortunately, there are algorithms that have been developed to restore information in mountain shadows in optical images (Shahtahmassebi et al., 2013), which may promote the efficacy of optical image correlation methods.
4.3 Measures taken to reduce uncertainties
Many other factors may also influence the accuracy of slope deformation from image correlation methods, which include image orthorectification errors, different viewing angles during image acquisition and different illuminations in images (Stumpf et al., 2016; Yang et al., 2020). This work used the Sentinel-2 Level-1C product, which is orthorectified before distribution (Gascon et al., 2017). To correct for possible misregistration between the base and target images, we used a stable zone to calculate and correct image shifts. To reduce errors caused by different illuminations, all images used for the first two Sentinel-2 image pairs are from similar dates of different years.
The first two image pairs (no. 1 and no. 2) we mentioned above are composed of images of very similar acquisition dates in different years. Images of similar dates have similar zenith and elevation angles, which could minimize the influence of mountain shadows (Yang et al., 2020). To assess and reduce uncertainties in the second step, we first identified a stable period. Then, we used 19 base images in this stable period to derive cumulative displacements for a given target image in the moving period. The mean displacements from these 19 image pairs are expected to be more reliable than results from a single image pair. In addition, these 19 measurements can cross-validate each other and be used to estimate uncertainties by SD (Figs. 3 and 4).
There are a few strategies to suppress background noise in derived results, including selecting results with high signal-to-noise ratios (Lacroix et al., 2018; Yang et al., 2020) and integrating redundant information in time series of images (Bontemps et al., 2018). This work introduced a simple and efficient method by using the slope aspect to filter out slope movement that is different from the aspect. This is reasonable for this translational landslide as the mass moves downhill driven by gravity. This procedure could eliminate false slope movements and reserve true slope movement of the Mindu landslide. By integrating topographic information, this new procedure is expected to work well for ground movement in other regions that is consistent with slope configurations.
4.4 Potential applications of the method in landslide monitoring
As we used orthorectified images, slope displacements derived in this work are horizontal movements. To derive ground movement along the slope, we need to consider local slope configurations. Because image correlation methods use sliding windows to detect similar patterns between the base and target images, precursors with horizontal rather than vertical ground movements can be detected. Landslides that have intact moving surfaces can be detectable by image correlation methods. For translational and rotational landslides, there are more horizontal than vertical ground movements, the former of which constitute the ideal landslide type to use in image correlation methods, whereas precursors of avalanches and rockfalls may be difficult to detect due to limited horizontal ground movement (Highland and Bobrowsky, 2013).
In addition, the smallest displacements that can be detected depend on the spatial resolution of optical images (Li et al., 2020; Stumpf et al., 2016). Although image correlation methods can detect subpixel ground movement, it is very challenging to detect moving surfaces that cover an area of a few pixels, as smaller window sizes could result in more background noise (Yang et al., 2020).
In this work, by using the COSI-Corr method and multi-temporal Sentinel-2 images, we found precursors of a major landslide along the Jinsha River in southwest China. Fissures on the slope probably existed before 2001, but the slope remained stable between November 2015 and November 2018. From November 2018 to August 2019, we detected significant slope displacements. The size of the activated part on the Mindu slope is similar to that of the 2018 Baige landslide, whereas the river width under the Mindu slope is half that of the Baige section. If this landslide continues to slide down and fails completely, it may block the Jinsha River leading to similar consequences to the Baige landslide.
By using an image correlation technique, we can track subpixel slope movement in optical remote sensing images. We also adopted an aspect constraint to pick out downslope movement and significantly reduced background noise. However, optical images, such as the Sentinel-2 images, can only detect slope movements of up to a few metres. To continuously monitor this slope, other data and methods (such as higher-spatial-resolution data or InSAR techniques) should be used. We also call for intensive monitoring of this slope and modelling of landslides that cause river blocking and subsequent flooding.
All Sentinel-2 images and the Landsat 8 image in this work were downloaded from the GEE. The SRTM DEM and its derivative were downloaded from the Geospatial Data Cloud website (http://www.gscloud.cn/sources, Computer Network Information Center and Chinese Academy of Sciences, 2020).
LL and PS discovered the moving slope of this work. WY conducted analysis and drafted the manuscript.
The authors declare that they have no conflict of interest.
This article is part of the special issue “Remote sensing and Earth observation data in natural hazard and risk studies”. It is not associated with a conference.
Wentao Yang would like to express his gratitude to his large family for caring for his 2-year-old daughter while this work was underway.
This research has been supported by the National Science Foundation of China (grant no. 41807500) and the Second Tibetan Plateau Scientific Expedition and Research Program (STEP; grant no. 2019QZKK0606).
This paper was edited by Paolo Tarolli and reviewed by Mihai Ciprian Margarint, Luigi Lombardo, and one anonymous referee.
Bontemps, N., Lacroix, P., and Doin, M.-P.: Inversion of deformation fields time-series from optical images, and application to the long term kinematics of slow-moving landslides in Peru, Remote Sens. Environ., 210, 144–158, https://doi.org/10.1016/j.rse.2018.02.023, 2018.
Bradley, K., Mallick, R., Andikagumi, H., Hubbard, J., Meilianda, E., Switzer, A., Du, N., Brocard, G., Alfian, D., Benazir, B., Feng, G., Yun, S.-H., Majewski, J., Wei, S., and Hill, E. M.: Earthquake-triggered 2018 Palu Valley landslides enabled by wet rice cultivation, Nat. Geosci., 12, 935–939, https://doi.org/10.1038/s41561-019-0444-1, 2019.
Carlà, T., Intrieri, E., Raspini, F., Bardi, F., Farina, P., Ferretti, A., Colombo, D., Novali, F., and Casagli, N.: Perspectives on the prediction of catastrophic slope failures from satellite InSAR, Sci. Rep.-UK, 9, 14137, https://doi.org/10.1038/s41598-019-50792-y, 2019.
Computer Network Information Center and Chinese Academy of Sciences: SRTM DEM, available at: http://www.gscloud.cn/sources, last access: 22 November 2020.
Dai, F., Lee, C., Deng, J., and Tham, L. G.: The 1786 earthquake-triggered landslide dam and subsequent dam-break flood on the Dadu River, southwestern China, Geomorphology, 65, 205–221, https://doi.org/10.1016/j.geomorph.2004.08.011, 2005.
Du, J., Glade, T., Woldai, T., Chai, B., and Zeng, B.: Landslide susceptibility assessment based on an incomplete landslide inventory in the Jilong Valley, Tibet, Chinese Himalayas, Eng. Geol., 270, 105572, https://doi.org/10.1016/j.enggeo.2020.105572, 2020.
Fan, X., Xu, Q., Alonso-Rodriguez, A., Subramanian, S. S., Li, W., Zheng, G., Dong, X., and Huang, R.: Successive landsliding and damming of the Jinsha River in eastern Tibet, China: prime investigation, early warning, and emergency response, Landslides, 16, 1003–1020, https://doi.org/10.1007/s10346-019-01159-x, 2019.
Fan, X., Dufresne, A., Subramanian, S. S., Strom, A., Hermanns, R., Stefanelli, C. T., Hewitt, K., Yunus, A. P., Dunning, S., Capra, L., Geertsema, M., Miller, B., Casagli, N., Jansen, J. D., and Xu, Q.: The formation and impact of landslide dams – State of the art, Earth Sci. Rev., 203, 103116, https://doi.org/10.1016/j.earscirev.2020.103116, 2020.
Gascon, F., Bouzinac, C., Thépaut, O., Jung, M., Francesconi, B., Louis, J., Lonjou, V., Lafrance, B., Massera, S., Gaudel-Vacaresse, A., Languille, F., Alhammoud, B., Viallefont, F., Pflug, B., Bieniarz, J., Clerc, S., Pessiot, L., Trémas, T., Cadau, E., De Bonis, R., Isola, C., Martimort, P., and Fernandez, V.: Copernicus Sentinel-2A Calibration and Products Validation Status, Remote Sens., 9, 584, https://doi.org/10.3390/rs9060584, 2017.
Handwerger, A. L., Fielding, E. J., Huang, M., Bennett, G. L., Liang, C., and Schulz, W. H.: Widespread Initiation, Reactivation, and Acceleration of Landslides in the Northern California Coast Ranges due to Extreme Rainfall, J. Geophys. Res.-Earth, 124, 1782–1797, https://doi.org/10.1029/2019JF005035, 2019
Highland, L. and Bobrowsky, P.: The Landslide Handbook – a Guide to Understanding Landslides: A Landmark Publication for Landslide Education and Preparedness, Springer, Berlin, Heidelberg, 2013.
Intrieri, E., Raspini, F., Fumagalli, A., Lu, P., Del Conte, S., Farina, P., Allievi, J., Ferretti, A., and Casagli, N.: The Maoxian landslide as seen from space: detecting precursors of failure with Sentinel-1 data, Landslides, 15, 123–133, https://doi.org/10.1007/s10346-017-0915-7, 2018.
Lacroix, P., Bièvre, G., Pathier, E., Kniess, U., and Jongmans, D.: Use of Sentinel-2 images for the detection of precursory motions before landslide failures, Remote Sens. Environ., 215, 507–516, https://doi.org/10.1016/j.rse.2018.03.042, 2018.
Lacroix, P., Araujo, G., Hollingsworth, J., and Taipe, E.: Self-Entrainment Motion of a Slow-Moving Landslide Inferred From Landsat-8 Time Series, J. Geophys Res.-Earth, 124, 1201–1216, https://doi.org/10.1029/2018jf004920, 2019.
Lacroix, P., Dehecq, A., and Taipe, E.: Irrigation-triggered landslides in a Peruvian desert caused by modern intensive farming, Nat. Geosci., 13, 56–60, https://doi.org/10.1038/s41561-019-0500-x, 2020.
Leprince, S., Barbot, S., Ayoub, F., and Avouac, J.: Automatic and Precise Orthorectification, Coregistration, and Subpixel Correlation of Satellite Images, Application to Ground Deformation Measurements, IEEE T, Geosci. Remote, 45, 1529–1558, https://doi.org/10.1109/TGRS.2006.888937, 2007.
Li, Z., Song, C., Yu, C., Xiao, R., Chen, L., Luo, H., Dai, K., Ge, D., Ding, Y., Zhang, Y., and Zhang, Q.: Application of satellite radar remote sensing to landslide detection and monitoring: challenges and solutions, Geomatics and Information Science of Wuhan University, 44, 967–979, https://doi.org/10.13203/j.whugis20190098, 2019.
Li, M., Zhang, L., Ding, C., Li, W., Luo, H., Liao, M., and Xu, Q.: Retrieval of historical surface displacements of the Baige landslide from time-series SAR observations for retrospective analysis of the collapse event, Remote Sens. Environ., 240, 111695, https://doi.org/10.1016/j.rse.2020.111695, 2020.
Liu, W., Carling, P., Hu, K., Wang, H., Zhou, Z., Zhou, L., Liu, D., Lai, Z., and Zhang, X.: Outburst floods in China: A review, Earth Sci. Rev., 197, 102895, https://doi.org/10.1016/j.earscirev.2019.102895, 2019.
Petley, D.: Global patterns of loss of life from landslides, Geology, 40, 927–930, https://doi.org/10.1130/G33217.1, 2012.
Samsonov, S., Dille, A., Dewitte, O., Kervyn, F., and d'Oreye, N.: Satellite interferometry for mapping surface deformation time series in one, two and three dimensions: A new method illustrated on a slow-moving landslide, Eng. Geol., 266, 105471, https://doi.org/10.1016/j.enggeo.2019.105471, 2020.
Shahtahmassebi, A., Yang, N., Wang, K., Moore, N., and Shen, Z.: Review of shadow detection and de-shadowing methods in remote sensing, Chin. Geogr. Sci., 23, 403–420, https://doi.org/10.1007/s11769-013-0613-x, 2013.
Shang, Y., Yang, Z., Li, L., Liu, D., Liao, Q., and Wang, Y.: A super-large landslide in Tibet in 2000: background, occurrence, disaster, and origin, Geomorphology, 54, 225–243, https://doi.org/10.1016/S0169-555X(02)00358-6, 2003.
Stumpf, A., Malet, J. P., Puissant, A., and Travelletti, J.: Monitoring of Earth Surface Motion and Geomorphologic Processes by Optical Image Correlation, in: Land Surface Remote Sensing, Environment and Risks, edited by: Baghdadi, N. and Zribi, M., Elsevier, 147–190, https://doi.org/10.1016/B978-1-78548-105-5.50005-0, 2016.
Wasowski, J. and Bovenga, F.: Investigating landslides and unstable slopes with satellite Multi Temporal Interferometry: Current issues and future perspectives, Eng. Geol., 174, 103–138, https://doi.org/10.1016/j.enggeo.2014.03.003, 2014.
Yang, W.: Selecting the Best Image Pairs to Measure Slope Deformation, Sensors, 20, 4721, https://doi.org/10.3390/s20174721, 2020.
Yang, W., Wang, Y., Sun, S., Wang, Y., and Ma, C.: Using Sentinel-2 time series to detect slope movement before the Jinsha River landslide, Landslides, 16, 1313–1324, https://doi.org/10.1007/s10346-019-01178-8, 2019.
Yang, W., Wang, Y., Wang, Y., Ma, C., and Ma, Y.: Retrospective deformation of the Baige landslide using optical remote sensing images, Landslides, 17, 659–668, https://doi.org/10.1007/s10346-019-01311-7, 2020.
Zhang, S., Li, C., Zhang, L., Peng, M., Zhan, L., and Xu, Q.: Quantification of human vulnerability to earthquake-induced landslides using Bayesian network, Eng. Geol., 265, 105436, https://doi.org/10.1016/j.enggeo.2019.105436, 2020.