the Creative Commons Attribution 4.0 License.
the Creative Commons Attribution 4.0 License.
 | 13 Aug 2020
Hydrogeomorphological analysis and modelling for a comprehensive understanding of flash-flood damage processes: the 9 October 2018 event in northeastern Mallorca
Maurici Ruiz-Pérez
Raphael Mutzner
Josep Fortesa
Beatriz Nácher-Rodríguez
Miquel Tomàs-Burguera
Julián García-Comendador
Xavier Peña
Adolfo Calvo-Cases
Francisco J. Vallés-Morán
A flash-flood event hit the northeastern part of Mallorca on 9 October 2018, causing 13 casualties. Mallorca is prone to catastrophic flash floods acting on a scenario of deep landscape transformation caused by Mediterranean tourist resorts. As global change may exacerbate devastating flash floods, analyses of catastrophic events are crucial to support effective prevention and mitigation measures. Field-based remote-sensing and modelling techniques were used in this study to evaluate rainfall–runoff processes at the catchment scale linked to hydrological modelling. Continuous streamflow monitoring data revealed a peak discharge of 442 m3 s−1 with an unprecedented runoff response. This exceptional behaviour triggered the natural disaster as a combination of heavy rainfall (249 mm in 10 h), karstic features and land cover disturbances in the Begura de Salma River catchment (23 km2). Topography-based connectivity indices and geomorphic change detection were used as rapid post-catastrophe decision-making tools, playing a key role during the rescue search. These hydrogeomorphological precision techniques were combined with the Copernicus Emergency Management Service and “ground-based” damage assessment, which showed very accurately the damage-driving factors in the village of Sant Llorenç des Cardassar. The main challenges in the future are to readapt hydrological modelling to global change scenarios, implement an early flash-flood warning system and take adaptive and resilient measures on the catchment scale.
- Article
(38023 KB) - Full-text XML
-
Supplement
(162 KB) - BibTeX
- EndNote


Flash floods are related to high-intensity precipitation, mainly convective in origin and with restricted spatiotemporal occurrence. For this reason, they usually strike basins < 1000 km2 with response times of a few hours or less. These spatial and temporal dimensions of flash-flood events are directly linked to (1) geomorphometric characteristics of the catchments and (2) activation mechanisms of runoff as a combination of intense rainfall, soil moisture and soil hydraulic properties (Versini et al., 2013). Land use modification, urbanisation and recurrent wildfires can alter these activation mechanisms and the potential for flash-flood casualties and damage. In Europe, 40 % of flood-related casualties in the period 1950–2006 are due to flash floods (Barredo, 2007). However, catastrophic flash floods are much more frequent in some parts of the Mediterranean region than in the rest of Europe, due to the interaction between geomorphology, climate, vegetation and the warm sea surface (Cassola et al., 2016), all combining to create a flood-prone environment. The abrupt reliefs surrounding the Mediterranean Sea are very close to the coastline, shaping small and torrential catchments where the convergence of low-level atmospheric flows and the uplift of warm wet air masses drifting from the Mediterranean Sea to the coast generates heavy downpours in very short time spans (Gaume et al., 2009).
Characterising the response of a catchment during an extreme flash-flood event is important because it clarifies flood severity and the activating hydrological processes and their dependency on natural and anthropogenic catchment properties (Borga et al., 2007). Numerous studies have tried to determine these driving factors (Braud et al., 2014) for which geological heterogeneity associated with the presence of karst features is crucial in Mediterranean catchments (Vannier et al., 2016; Wainwright and Thornes, 2004). Likewise, flash floods are closely related to land use: the devastation of plant cover in the Mediterranean may increase the risk of flooding because bare soil leads to larger runoff coefficients (Wainwright and Thornes, 2004). However, the limited spatial and temporal scales of flash floods make these events particularly difficult to monitor and document. In the case of rainfall monitoring, the spatial scales of the events are in general much smaller than the sampling potential offered by apparently dense rain networks (Borga et al., 2008; Amponsah et al., 2016). In the case of streamflow monitoring, there is a lack of flash-flood discharge (Q) data from stream gauge observations (Marchi et al., 2010), although Q data are crucial to obtaining representative hydrometric values and characterising the runoff response of such extreme flash-flood events (Borga et al., 2008). As a result, further field observations and modelling studies are required in order to assess the interdependencies of flash-flood drivers and thus to understand better and reproduce the active hydrological processes (Sofia and Nikolopoulos, 2020).
Earlier flash-flood forecasting systems were based on the flash flood guidance (Georgakakos, 1986), which calculated the a priori amount of rainfall needed to trigger specific Q at the outlet of a catchment, depending on prior wetness conditions. At present, semi-distributed or distributed hydrological models are more widely used for such forecasting purposes (Artinyan et al., 2016; Gourley et al., 2010; Miao et al., 2016; Nguyen et al., 2016), whilst probabilistic and ensemble modelling assess the uncertainty of flash-flood forecasting systems (Hardy et al., 2016). However, uncertainty in hydrological modelling may be great. The main source of uncertainty relates to the spatiotemporal scales of the rainfall pattern. The forecasting of intense thunderstorms by numerical weather prediction systems to provide accurate rainfall information is particularly challenging (Alfieri et al., 2015; Collier, 2007). Another source of uncertainty is related to the hydrological models that often need to be calibrated in order to reduce the uncertainty of the discharge estimate and to understand the physical processes occurring during flash-flood events (Adamovic et al., 2016; Segura-Beltrán et al., 2016; Vannier et al., 2016). Consequently, the reliability of data measuring surface water resources requires temporal continuity and good maintenance of the gauging stations (Fortesa et al., 2019). Flash-flood events are also conditioned by high non-linearity in the hydrological response relating to threshold effects (Braud et al., 2014). Therefore, the predictability of such events remains low.
In the Mediterranean region, the planning and management of flood hazards are hydrosociologically crucial (Gaume et al., 2016), especially in the current global change context. It is clear that the understanding of flash floods requires an integrated scientific approach (Marchi et al., 2010), in which technological advances create opportunities to investigate simultaneously in the areas of Earth and social sciences (Wohl et al., 2019). Firstly, geomorphometric techniques applied to topographic surveys can be valuable planning and decision-making tools for producing flood hazard maps that represent flood-prone areas (Kalantari et al., 2017). Geomorphometry and digital terrain analysis by means of a topography-based connectivity index could also be used to simulate preferential flow paths for high-magnitude events to determine the main erosion and deposition areas, as a tool for better and faster responses to catastrophic flooding events. In addition, post-storm assessments to capture the landform signature of the event are needed. The use of high-resolution field measurements here is critical to understanding the effects of storms on fluvial dynamics (Westoby et al., 2012) and providing input data sets for numerical modelling. These data can be difficult to obtain, as traditional post-storm survey techniques are expensive and time consuming (Duo et al., 2018). In recent years, unmanned aerial vehicles (UAVs) have been used to improve traditional, expensive, or time-consuming mapping approaches in catchment science research. UAVs can be deployed rapidly and achieve accurate high-resolution topographic data for monitoring geomorphic changes (Estrany et al., 2019; Langhammer and Vacková, 2018).
Secondly, the concept of vulnerability relates to the predisposition of certain stakes to damage or malfunction, implying that a multitude of direct and indirect factors, often interacting in a dynamic and complex way, should be integrated in its assessment. Thus, vulnerability particularly relates to the damage to exposed stakes (Defossez and Leone, 2017). Estimations of the elements at risk in flash floods and the damage-driving factors are insufficiently understood in the Mediterranean region, even though assessment of damage processes caused by flash floods have been assessed in several European and national projects and publications (see Llasat et al., 2013; Gaume et al., 2016). Observed spatial distributions of costs and fatalities are the result of complex interplay between different explanatory factors. Useful information may reveal the economic and social impact of floods on our societies, but its interpretation is questionable (Gaume et al., 2016). In addition, the largest public world databases on disaster events that contain flood events do not include all the catastrophic events in the Mediterranean region (Llasat et al., 2013), which underlines the need for further research. Since 2012, the Copernicus Emergency Management Service (Copernicus EMS) has evaluated the intensity and scope of the damage caused by natural disasters, human-made emergency situations and humanitarian crises throughout the world (Copernicus Emergency Management Service, 2019). To understand the damage processes of flash floods better, comprehensive damage assessment that links hydrological process dynamics and intensities to damage and loss is needed (Laudan et al., 2017). In addition, a comparison of “ground-based” assessment and “remote-based” Copernicus EMS may shed light on the accuracy of this rapid and helpful tool for assessing most catastrophic flash floods.
This paper aims at improving understanding of the hydrological and socioeconomic processes of the devastating flash floods that frequently affect Mallorca (Estrany and Grimalt, 2014; Llasat et al., 2013), a paradigmatic Mediterranean flood-prone region under intense human occupation and geologically shaped by karstic features. The study focuses on the catastrophic flash-flood event that hit the northeastern part of the island on 9 October 2018, causing 13 casualties. This was the worst local natural disaster in decades and caused a marked interest among the scientific community, producing early studies of the event. Lorenzo-Lacruz et al. (2019) reconstructed this same flash-flood event through the application of hydrological and hydraulic simulations, with a focus on the meteorological input. The specific objectives of this study are (1) to explain the runoff response and so clarify the dependency of flood severity on catchment properties and human influence, by using the flash-flood Q data from a stream gauge installed in 2015 by the Mediterranean Ecogeomorphological and Hydrological Connectivity (MEDhyCON) research group; (2) to assess the uncertainty of semi-distributed hydrological modelling in such a severe flash flood in a karstic environment; (3) to investigate the socioeconomic and territorial flood damages linked to hydrogeomorphological processes; and (4) to analyse multi-temporal high-resolution digital terrain models (HR-DTMs) for detecting and measuring geomorphic changes by using a UAV and a topography-based connectivity index for rapid response in post-catastrophe search-and-rescue tasks.
To obtain better understanding of the flash-flood and damage processes, a comprehensive and combined analysis of the meteorological synoptic situation, precipitation and discharge was developed through the analysis of the rainfall–runoff processes at a small spatial scale during this extreme event. Likewise, this analysis was linked to hydrological modelling to check the internal consistency of the information gathered by instruments and to flood damage and losses at the village of Sant Llorenç des Cardassar. Finally, HR-DTMs were generated by lidar 2014 data from the Spanish National Geographic Institute and by imagery captured through a low-cost UAV just 6 d after the catastrophe, to calculate a sediment connectivity index (IC) and measure geomorphic changes (Fig. 1).

2.1 Study area
Mallorca is a Mediterranean flood-prone region, historically affected by flash floods. Since the late Middle Ages, devastating flash floods have been systematically documented, particularly in Palma, the capital of the island. In this town, a catastrophic event caused approximately 5000 deaths in 1403 (20 % of its population), showing that floods are the main natural hazard in this type of environment (Petrus et al., 2018). In the rest of the island, the historical distribution patterns of human settlements were related to fluvial systems but avoided the occupation of floodplains until the increase of urban areas in the 19th century during the Industrial Revolution. However, in the second part of the 20th century, this urban expansion became exponential, with many more urban and tourist settlements (Pons Esteva, 2003), often in flood hazard areas.
In such a high-energy environment, Mallorca's eastern (“Llevant” in Catalan) county contains a dramatic combination of physical and human factors that have created a flood-prone environment with a very strong coupling of climate and geomorphology to constant urban expansion since 1850, which has led to more than 10 catastrophic flash-flood events during this period (Estrany and Grimalt, 2014). This county consists of two main relief units (Álvaro et al., 1991): (1) the Llevant ranges occupy the headwaters with altitude ranging from 300 to 500 m a.s.l. They consist of a series of alpine mountains and hills mainly of Jurassic limestones and dolomites and Cretaceous marls; and (2) the Marinas, a reefal Upper Miocene tabular platform composed of calcarenites, calcisiltites and terra-rossa post-reef sediments affected by significant karstic processes on the eastern slopes of the Llevant ranges. A morphometric analysis of the catchments by Estrany and Grimalt (2014) showed differences that depended on both the width of the platform (i.e. the distance between the coast and the base of the Llevant ranges through the Miocene platform) and the hypsometry and geological settings at the headwaters. The torrentiality and clinometric variables were the ones most closely related to the geological settings. Therefore, the catchments with the highest values of torrentiality (i.e. > 30, which is topographically computed as a coefficient between the number of first-order streams and catchment area, multiplied by the drainage density (see Strahler, 1964) have impervious materials (i.e. lower Cretaceous and lower Miocene marls) covering approximately > 40 % of these catchments. These are located at headwaters where the clinometry and connectivity between slopes and channels are the highest.
This study focuses on the Ca n'Amer River catchment (78 km2), due to the storm that struck several urban areas within it, especially the village of Sant Llorenç des Cardassar. Its main headwater tributary is the Begura de Salma River (23.4 km2; Fig. 2c) with altitudes ranging from 71 to 485 m a.s.l. (Fig. 2c). The mean slope of the catchment is 16 % and the length of the main channel is 9.3 km (average gradient of 3 %). Its lithology consists mainly of marls intercalated with limestone (60 % of the area) from the Medium–Upper Jurassic (Dogger), dolomites (22 % of the area) from the Upper Triassic and Lower Jurassic, and pelagic limestone marls (14 % of the area) from the Lower Cretaceous (Fig. 2d). This lithological composition determines the surface water/groundwater interaction. On the one hand, a high degree of fracturing, fissuring and karstification of limestone favours percolation through karstic aquifers. On the other hand, the imperviousness of Dogger and Cretaceous marls (74 % of the area) does not allow percolation, favouring runoff. The main land use in 2012 was agriculture (58 %), mostly located in lowland areas. Forest (26 %) and scrubland (17 %) were predominant at headwaters. Terraced fields still occupied 10 % of the catchment, although most of them were abandoned (Fig. 2e). In 1956, natural vegetation covered 21 % of the catchment. This rose to 42 % in 2012 due to an afforestation process of former agricultural land in the second half of the 20th century. In combination with other factors, afforestation triggered a higher fire risk: two wildfires burned an area of 1.7 km2: 17 % in 1983 and 83 % in 2011 (Balearic Forestry and Soil Conservation Service; http://xarxaforestal.caib.es, last access: 15 May 2020; Fig. 2e). The climate of the area is classified as Mediterranean temperate sub-humid on the Emberger scale (Guijarro, 1986). Mean annual rainfall (1968–2018, B630 Spanish Meteorological Agency (AEMET) station; see Fig. 2c) is 652 mm yr−1. A rainfall amount of 140 mm in 24 h was estimated to have a recurrence period of 25 years (YACU, 2003).
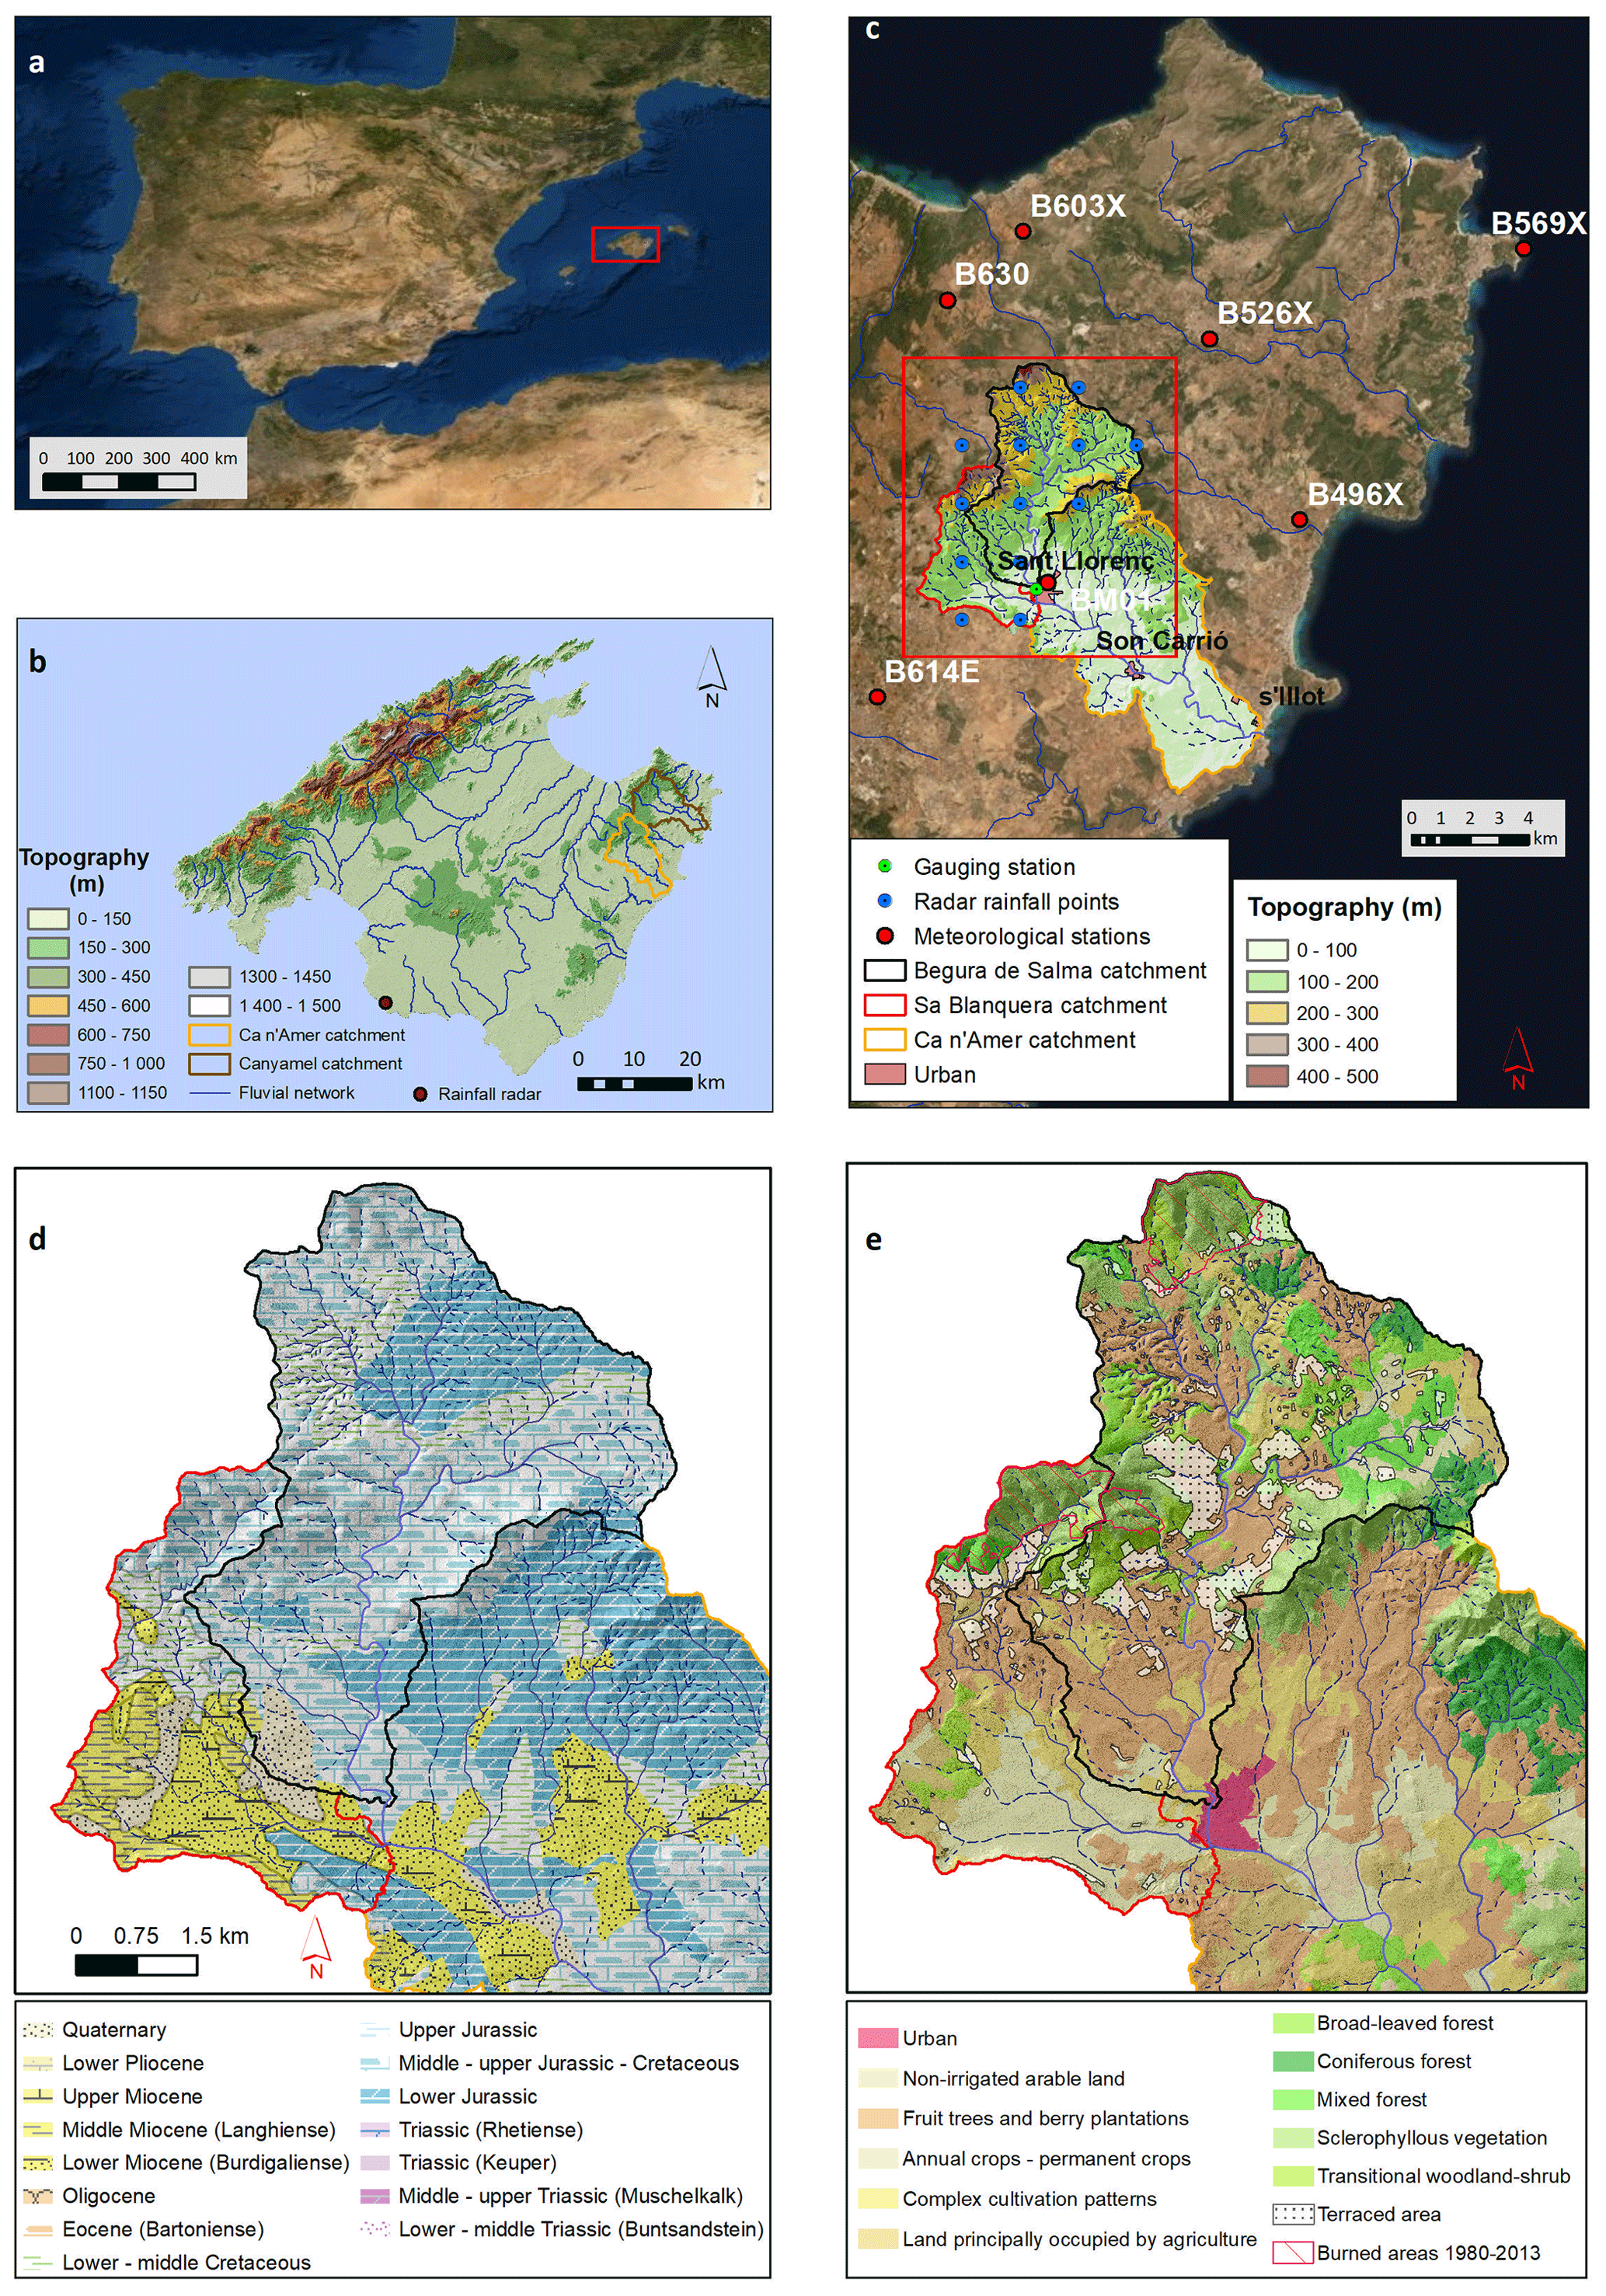
Figure 2Main characteristics of affected basins during the 9 October 2018 flash flood. (a) Location of Mallorca in the western Mediterranean. (b) Topography and fluvial network of Mallorca with the location of the main basins affected: Canyamel and Ca n'Amer rivers. (c) Sa Blanquera and Begura de Salma headwater river catchments within the Ca n'Amer River, with locations of rainfall and hydrometric stations; and radar rainfall points derived from a regular mesh of 1×1 km. Source: https://opendata.aemet.es (last access: 15 May 2020). Background: aerial photography and DTM data (PNOA, 2015). (d) Lithology of both the Sa Blanquera and Begura de Salma catchments. (e) Land use and terraced areas for the same headwater catchments. Source: Corine Land Cover (2018).
2.2 Meteorological context of the 9 October 2018 rain event
The 9 October storm affected the two northernmost catchments of Llevant county, i.e. the Ca n'Amer and Canyamel rivers (Fig. 2) with nine and four casualties, respectively, and significant damage. The synoptic situation was characteristic of flash-flood events in the Western Mediterranean (Fig. 3a). A cut-off low at midlevel was located in the eastern part of the Iberian Peninsula and shallow low-level pressure affected the same region, driving warm and wet air from the Mediterranean Sea to the Balearic Islands and the eastern part of the Iberian Peninsula. This occurred in early October, when the sea surface temperature is close to its annual maximum in the Western Mediterranean, providing high quantities of moisture. Moreover, the cut-off low showed a typical divergence at midlevel on its eastern flank, affecting the Balearic Islands and favouring the development of deep convection. Convection started on the sea between the Balearics and the Iberian Peninsula (Fig. 3b and c) and, due to SW winds at mid-tropospheric levels, the convective cells started to move towards the Balearics, where heavy rainfall triggered the flash-flood event (Fig. 3d and e).
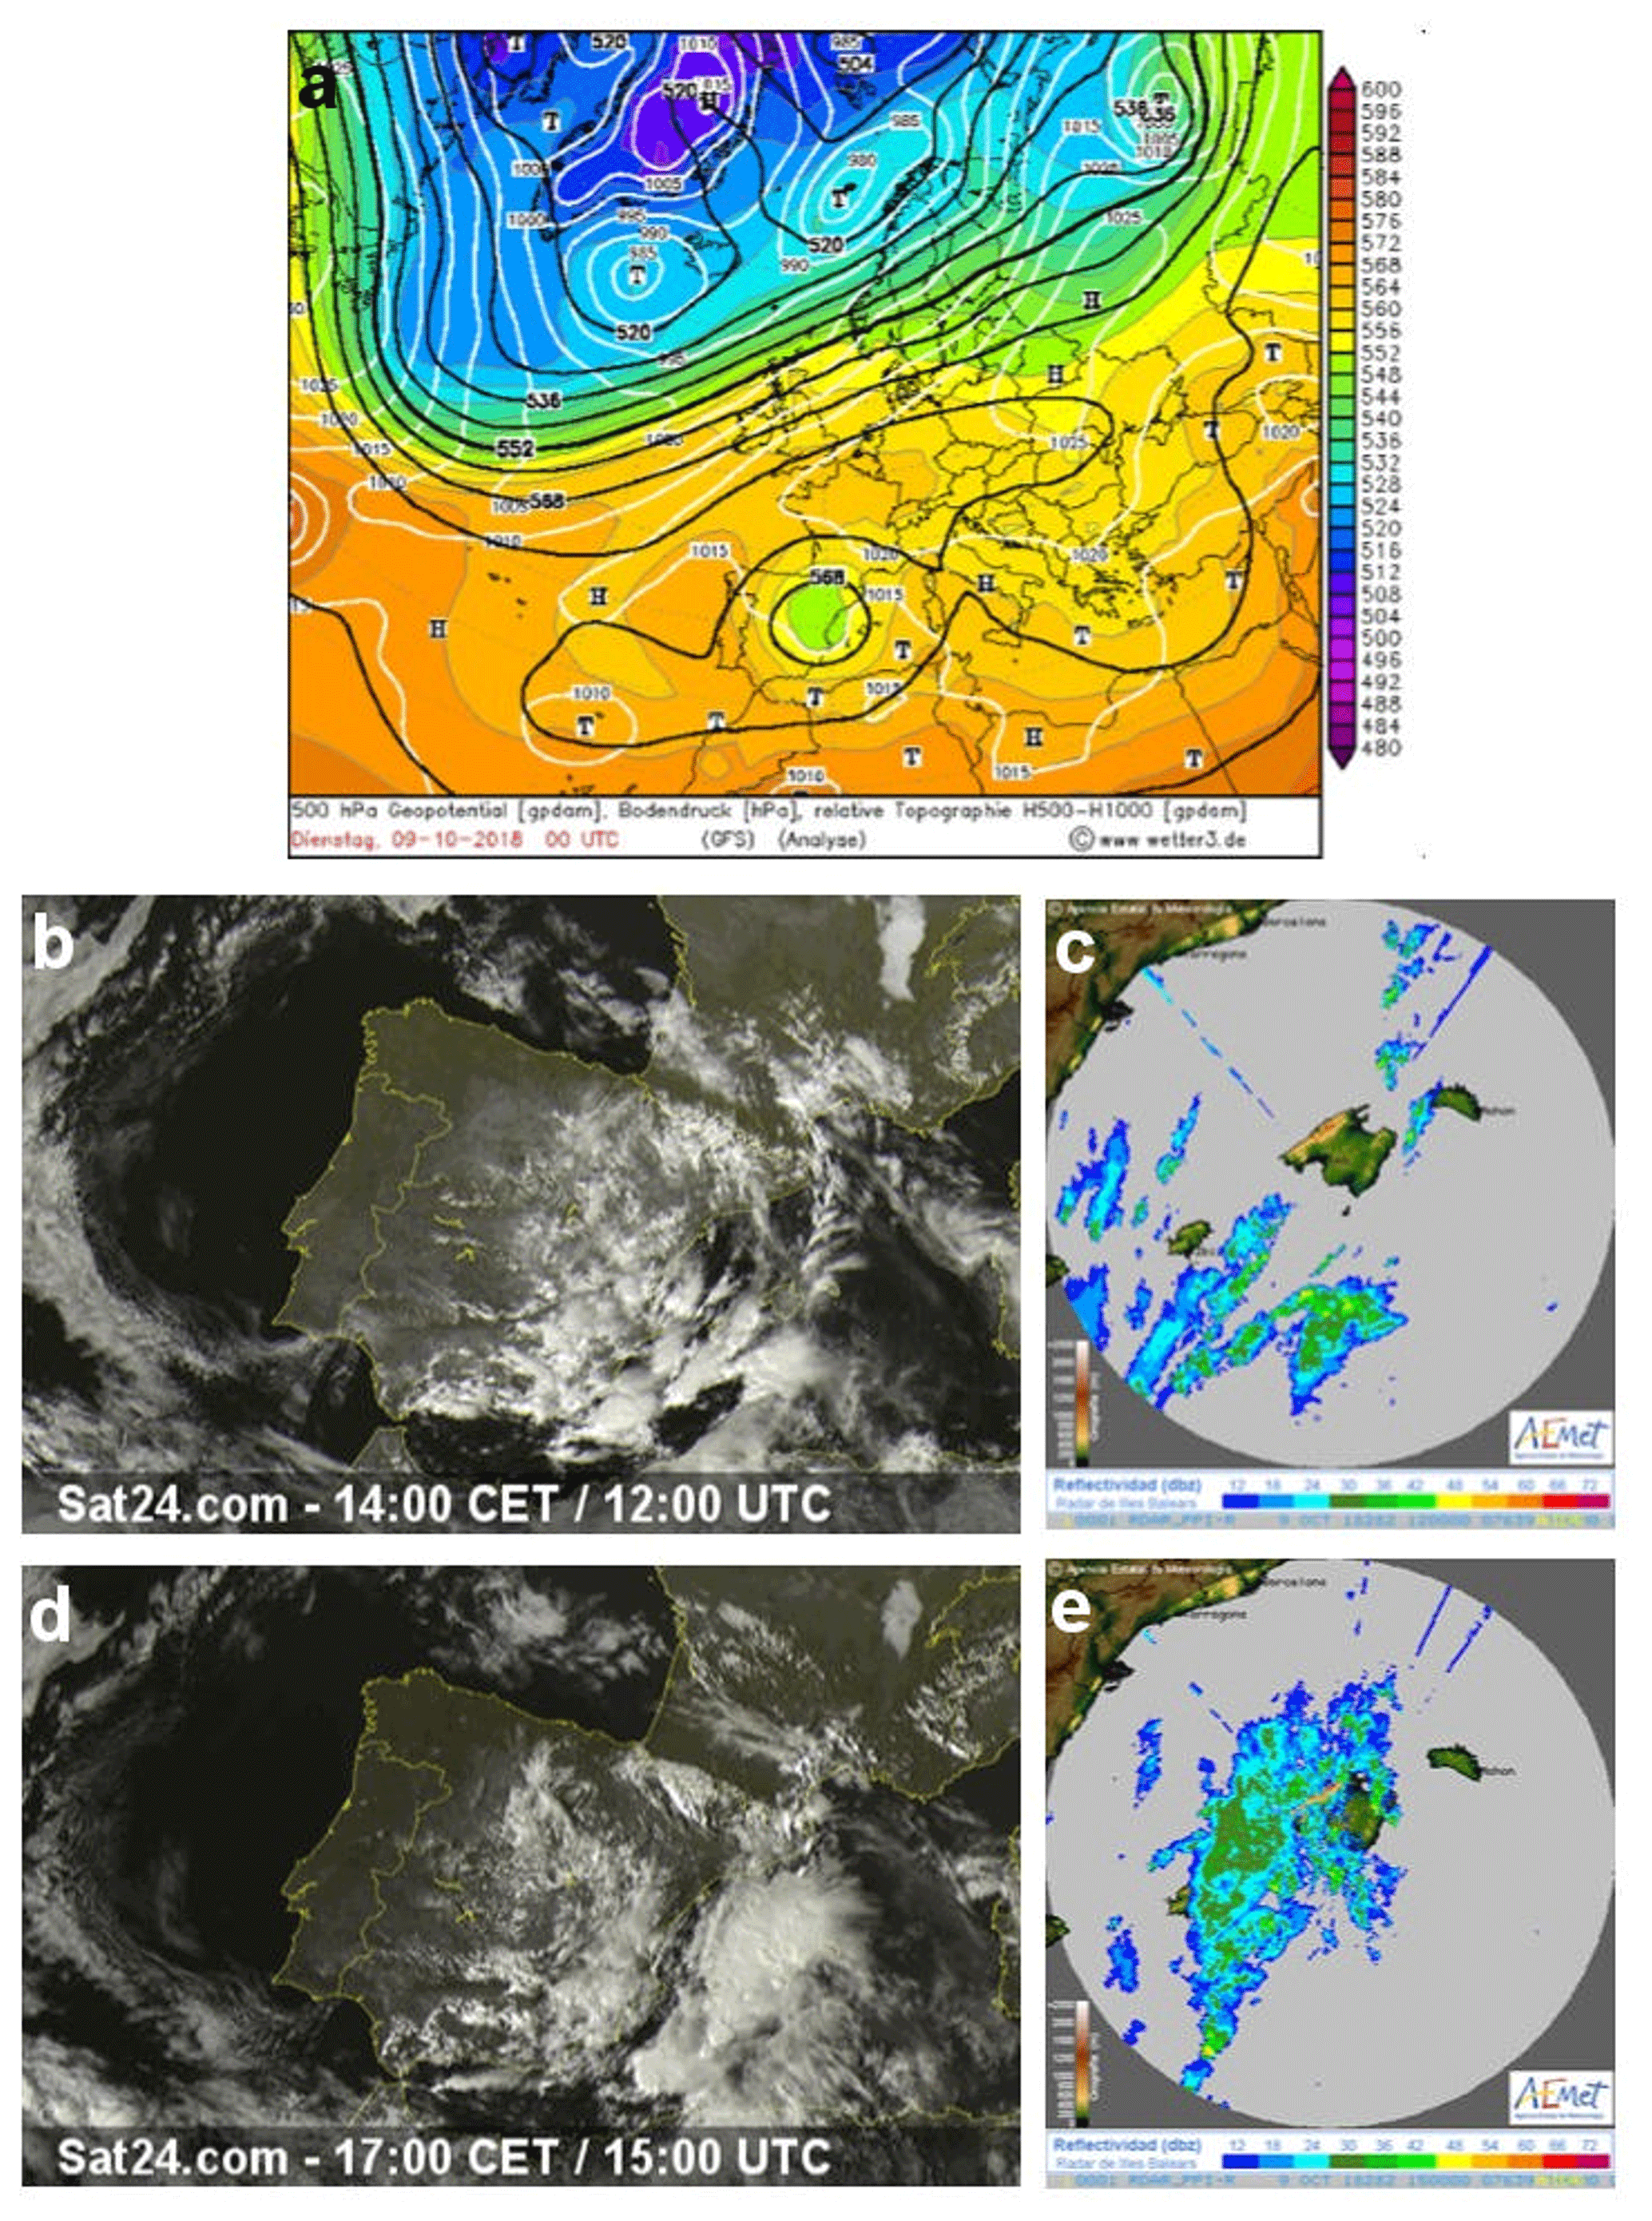
Figure 3(a) Surface pressure and 500 hPa height analyses at 12:00 UTC on 9 October 2018 (source: http://wetter3.de (last access: 15 May 2020), i.e. at the beginning of the precipitation event. Satellite image at (b) 12:00 UTC and (d) 15:00 UTC (source: http://www.sat24.com, last access: 15 May 2020). EUMETSAT and radar images are shown for the same hours (c, e) (source: http://www.aemet.es, last access: 15 May 2020).
2.3 Rainfall data
In order to assess the rainfall–runoff processes during the flash-flood event in the Begura de Salma River, the continuous 10 min precipitation record of the event was obtained from radar (see location in Fig. 2b) images that were initially calibrated through rainfall data downloaded at https://opendata.aemet.es/ (last access: 15 May 2020) and http://asomet.balearsmeteo.com/ (last access: 15 May 2020). The two websites contain meteorological data from official stations of AEMET and the Meteorological Association “BalearsMeteo”, respectively (see Fig. 2c; B526X – Artà-Molí d'en Leu, B496X – Son Servera, B614E – Manacor, B569X – Far de Capdepera and B603X – Colònia de Sant Pere from AEMET; and BM01 – Sant Llorenç des Cardassar from BalearsMeteo). After calibration, all radar images were geostatistically treated to obtain the hourly mean and total precipitation (and its standard deviation) fallen in regular 1×1 km squares (Fig. 2c), thus allowing analysis of the spatiotemporal distribution of the rainfall event.
The radar, located in the west of Mallorca, obtains reflectivity data (in dBZ) at 1×1 km of spatial resolution and at a 10 min temporal resolution for many altitudes. Thanks to the AEMET OpenData platform (opendata.aemet.es), reflectivity data corresponding to the lower plan position indicator (PPI), which corresponds to an azimuth of 0.5∘, can be downloaded in near-real time. Using reflectivity data, rainfall was calculated by using the Marshall–Palmer relation (Marshall and Palmer, 1948):
where Z is the radar reflectivity (mm6 m−3), R is the rain rate (mm h−1), and a and b are two coefficients. As the obtained reflectivity data are in dBZ units instead of mm6 m−3, conversion was necessary using the following relation:
The relation between Z and R depends mainly on the drop size distribution (DSD), which is usually unknown, unless disdrometer data are available, which is not the case (Chapon et al., 2008). Hence, coefficients a and b cannot be established properly for this event. Multiple pairs of values for a and b coefficients can be found in the literature, mostly changing between precipitation types.
Two pairs of coefficients were tested: (i) the pair a=200 and b=1.6 was tested because the AEMET commonly uses these coefficients to obtain near-real-time rainfall calculations (http://www.aemet.es/es/eltiempo/observacion/radar/ayuda, last access: 15 May 2020) from the same radar data that we used in this research; (ii) the pair a=300 and b=1.4 was tested because the National Weather Service (NWS) in the US uses it at operational level (Fulton et al., 1998) and, it is argued, these coefficients perform better in a convective environment than the first ones do (e.g. Seo et al., 2020).
Calculation with the two pairs of coefficients results in high amounts of precipitation (100 mm in the first case and 150 mm in the second case) but an amount much lower than the maximum rainfall observation, which is higher than 250 mm: this shows the complexity of calculating the precipitation of this event accurately by radar data. In the scientific literature, many methodologies to enhance precipitation calculation using radar data can be found. While some methods focus on the correction of the reflectivity data; others are based on the calibration of the estimation of precipitation using reflectivity data, as these are the two main sources of errors (Harrison et al., 2000). Mountains may partially or totally block the electromagnetic radar signal and affect radar reflectivity and precipitation estimations (Germann and Joss, 2004). The study area is mountainous but with low maximum altitudes (∼400 m a.s.l.). This low elevation combined with the regional orography, the distance of the Begura de Salma River from the radar (∼50 km), the 0.5∘ azimuth of the PPI used and the altitude of the radar location (113 m a.s.l.) avoided any topographic interference with the radar signal. Thus, no reflectivity correction technique against orographic blocking was needed. To directly correct the estimation of precipitation, geostatistical methods are commonly implemented in combination with the use of rain gauge data (Barbosa et al., 2018), but the data available in the most affected area are too few to implement these methods. Available data from the surrounding area could be used, but due to the sharp differences in rainfall between the affected and surrounding areas we decided not to use these data.
With the set of coefficients a=300 and b=1.4, the maximum amount of rainfall estimated with radar data clearly underestimated the observed rainfall, with a percent bias of −50.6 % and an estimation of approximately 149 mm as the maximum rainfall amount, compared with the 257 mm recorded at the Sant Llorenç des Cardassar rain gauging station (see Fig. 2c). Instead of using the rainfall recorded at gauging stations to calibrate the radar-based rainfall, a method to correct rainfall estimation based on spatial resampling is put forward here. Accordingly, the 2×2 km spatial resolution of radar data was resampled by assigning to each grid cell the value of the maximum amount of estimated rainfall at 1×1 km. By this method, the regression coefficient reached R2=0.8, a percent bias of only +2.6 % and 258 mm as the maximum estimated rainfall amount, which fitted the rainfall at that point (Fig. S1 in the Supplement).
2.4 Discharge data
A hydrometric gauging station is located where the Begura de Salma River enters the village of Sant Llorenç des Cardassar, 50 m upstream from the Ma-3323 road bridge (Fig. 4a). The station was built by the water authority in the 1970s. After years of abandonment, in 2015, the MEDhyCON research group installed within the gauge house a Hobo water level U20L-04, which measures the water stage by 1 min readings, accumulating 15 min average values. The station is located at the very beginning of the concrete channel that takes the river through the village. Closing a drainage basin of 23 km2, it is located approximately 50 m upstream from the first of the five bridges that cross the river within the village (see bridge 1 in Fig. 4b). At the cross section where the hydrometric station is located, the channel bed is 70.25 m a.s.l., whilst the top of its bank channels is 72.00 m a.s.l.
Figure 4(a) Aerial view of the concrete channel of the Begura de Salma River that crosses the village of Sant Llorenç des Cardassar and the location of bridges. (b) Detailed aerial view of the very beginning of this concrete channel, where the hydrometric station is located. The photographs show a view of bridge 1 from the hydrometric station when (d) the digital equipment was installed on 10 June 2015 and (e) a few hours after the flash flood, on 10 October 2018. Background: aerial photography and DTM data (PNOA, 2015).
The transformation of water stage (hereinafter WS; m) to Q (m3 s−1) through the stage/discharge rating curves (hereinafter SDRCs) into the qualitative range (from low to high Q conditions) is broadly developed by power and polynomial equations, characterised by physical-based parameters. In the absence of direct flow measurements for Q estimation, a complete two-dimensional hydraulic model was developed with the Hydrologic Engineering Center's River Analysis System (HEC-RAS) 5.0.6 software (November 2018 version) by the US Army Corps of Engineers' Hydrologic Engineering Center. In this case, a set of differential equations in partial derivatives that govern flow behaviour, known as Saint-Venant's equations, were solved in shallow water equations.
For the generation of the 2-D hydraulic model, a HR-DTM derived from a 1 m lidar-based DTM dating from 2014 was used; http://pnoa.ign.es/coberturalidar (last access: 15 May 2020). In addition, the entire concrete channel of the Begura de Salma River was topographically surveyed with a differential Global Positioning System (dGPS) Leica 1200 for its integration to the HR-DTM. Within the model, all the bridges with potential flow effects on the hydrometric station were also introduced (Fig. 3a). This 2-D hydraulic model was applied in a longitudinal river section established 150 m upstream and downstream from the hydrometric station. Previously, the geometry of the gauging section was measured to characterise its hydraulic functioning. This is a regular trapezoidal concrete channel of approximately 300 m in length with low sinuosity (Fig. 4a), a longitudinal slope of 0.0052 m m−1, 10 m width at the bed channel and with embankments 1.75 m high. The slope of the longitudinal section was hydraulically high, which meant that the critical depth at the beginning of the channel was the factor constraining its hydraulic capacity (approximately 78 m3 s−1). This Q value was related to 1.75 m of WS, coinciding with the height of the embankments.
As boundary conditions, an input hydrograph was arranged at the most upstream part of the section studied, whilst the WS was subsequently arranged in accordance with the slope of the channel bed at the most downstream part. Hydraulic simulations were always started under no-flow conditions. Taking into account the hydraulic function characteristics for obtaining the SDRC, the calculation method used in these simulations was the diffusion wave. To design an accurate SDRC for the hydrometric station, the hydraulic effects of the concrete channel and bridges were assessed, running iteratively the model by making the representative Q values flow under stable hydraulic functioning conditions.
Accordingly, a first hydrograph was designed step by step by using Q values for a power equation with 2 as the exponent in a range between 2 and 512 m3 s−1. The duration of each constant Q (step) of this hydrograph was established (from preliminary simulations) at 4 h and 15 min, significantly longer than the transit of the flood wave through the longitudinal section studied. In this way, the flow transit for each step under steady-state conditions was guaranteed. These conditions and this hydrograph gave a first approach to the SDRC. Then, to improve the accuracy of the SDRC, a second hydrograph was designed with 19 Q values, containing the previous nine Q values of the first hydrograph, new intermediate values and other significant Q values such as the maximum channel capacity and the Q value at which bridges affect the hydraulics. To optimise the time consumption of the modelling, this second hydrograph employed a constant Q (step) of shorter temporal duration, i.e. 1 and 2 h depending on the Q range.
The SDRC was divided into two sections. The first was related to a scenario where bridges do not affect the hydraulic function at the gauging section, despite flow being bankfull or even overbanking the channel. The second section was a scenario under the influence of bridges, i.e. the flow below them and also over their decks. It is then clear that the design, dimensions and proximity to the hydrometric station of these bridges affected directly flow behaviour at the hydrometric station due to obstruction (see pictures in Fig. 4). The obstruction of bridge 1 occurred when the upstream section of the concrete channel reached the bankfull level, such that dragging and floating elements began to collide against the back of the bridge, triggering the obstruction process. Consequently, the hydraulic model had to integrate the obstructions observed at the downstream bridges, at least the two nearest ones (Fig. 4a). These post-event pictures and maximum water stages observed in situ 10 h after the event were useful for calculating the obstruction percentages of these two bridges: 85 % at bridge 1, 40 % at bridge 2 and with no obstruction at the other ones. The overbank flow coefficients were 2.2 for bridges 1, 4 and 5, and 2.1 for bridges 2 and 3. The SDRC obtained allowed calculation of this phenomenon, which is activated with Q values ranging 130–160 m3 s−1. Nevertheless, calibration of the hydraulic model of overbank flow coefficients and the degree of obstruction of these structures was needed and attained by complete flow equations (full momentum) without changes in boundary conditions. For this purpose, the WS calculated in open-channel conditions were compared with those WS observed in the field during and after the event in the hydrometric station and its surrounding floodplain area. Maximum WS observed in situ 10 h after the event, within a period of time in which the high-water marks could still be seen, were mapped through ground control points. Three of them were selected as representative locations around the hydrometric station (Fig. 4b), and the maximum WS reached at the hydrometric station (4.55 m) was also included. The modelling results in open-channel conditions for the ground control points involved a < 5 % error in WS or even < 1 % in the case of the WS recorded at the hydrometric station.
The SDRC was finally designed (see Fig. 5), showing clearly the two differentiated sections with a gap between them in WS of approximately 1.5 m because 1.4 m is the edge of road bridge 1 located just 50 m downstream from the hydrometric station. The SDRC is fitted to a power equation for both sections, obtaining high values of significance (R2 > 0.990). Thus, in the case of the first section of the SDRC, the adjustment was R2 of 0.999, operating in open-channel flows up to 160 m3 s−1 in bankfull conditions or even overbanking the channel but always without the bridges' influence. The second section, with a R2 of 0.996, defined for Q > 160 m3 s−1, was already influenced by the presence of the bridges, i.e. in open-channel flows but conditioned by the backwater generated in the flow under pressure inside the span of bridge 1 as well as over its concrete decks.

Figure 5Stage–discharge rating curve performed by means of two-dimensional hydraulic modelling with two differentiated sections in accord with the influence of bridge 1 (see Fig. 3a) and its potential obstruction.
2.5 Hydrological modelling
A semi-distributed hydrological model was used to reproduce the hydrological response of the catchment during the flash-flood event: the routing system (RS) model (García-Hernández et al., 2007; Jordan, 2007). The SOil CONTribution (SOCONT) was the rainfall–runoff model used. This comprised an appraisal of hydrological processes such as snowmelt as well as surface and subsurface infiltration-induced flow and groundwater flow due to percolation (Jordan, 2007; Schaefli et al., 2005). The catchments were divided into elevation bands to incorporate the influence of temperature evolution with altitude and orographic effects within mountainous catchments. In this model, the subcatchments were divided into 100 m elevation bands. The SOCONT model was applied to each elevation band, which was added at the outlet of each subcatchment. The input data of the SOCONT were the temperature obtained from meteorological stations and the precipitation derived from radar measurements (see previous section).
The SOCONT model is shown in Fig. S2. First, the temperature was interpolated for each elevation band, based on inverse distance weighting using the Shepard method (Shepard, 1968). Resampled 1 km resolution radar data (see Sect. 2.3) were used in the model to obtain precipitation for each elevation band by including all 1 km resolution points falling within each elevation band. The soil-infiltration model was based on modified GR3 equations (Schaefli et al., 2005). Infiltration and evaporation were determined by the soil saturation; i.e. infiltration is higher for lower soil saturation, whereas evapotranspiration is higher for high soil saturation. Surface runoff was computed with the Storm Water Management Model (SWMM). Soil infiltration was modified to simulate karstic hydrological dynamics, as shown in Fig. S3. Precipitation infiltrated the soil, as in Schaefli et al. (2005), as a function of soil saturation (Fig. S3a). The resulting outflow from the reservoir (QGR) is also dependent on the soil saturation: outflow increases with higher soil saturation. In the modified equations, soil saturation can increase up to a certain level (HGR,threshold), with this being a parameter to be adjusted in the model (Fig. S3b). When this threshold is reached, the soil reservoir releases all the available volume contained between the HGR,threshold and the minimum water level (kkarst in Fig. S3c). The released volume of water is then transferred to the SWMM model described in Schaefli et al. (2005). The relevant parameters for the modified version of the soil infiltration model were the maximum soil capacity (HGR,max), the threshold for the karstic behaviour (HGR,threshold) and the release coefficient (kkarst).
2.6 Damage assessment
Rapid mapping is a mature Earth observation (EO) service with many years of user-oriented development since the international charter “Space and Major Disaster” was established in 1999. EO satellite-data-derived disaster mapping during emergencies is provided to civil protection and humanitarian user communities at national, continental and worldwide scales. Given the great helpfulness of the Copernicus EMS reports attained by rapid mapping techniques, the damage assessment of the event focused on the comparison between two information sources. The first one, a “ground-based” report, was the damage analysis carried out by the Directorate General of Emergencies of the Balearic Islands Government (Pol, 2019a). This “ground-based” report provided a detailed description of the resources mobilised in the emergency phase and also a damage inventory. The second information source was the “remote-based” damage assessment by the Copernicus EMS (https://emergency.copernicus.eu/mapping/ems-product-component/EMSR323_01SANTLLORENC_ 02GRADING_MAP/2, last access: 15 May 2020), which also included the flooded areas established by the Copernicus EMS within the village of Sant Llorenç des Cardassar.
The damage assessment in the two sources was compared by means of a cartographic overlay with GIS tools. To provide greater accuracy, detailed territorial information and flow direction were also incorporated. First, the type of buildings and land use at the urban plot scale from the General Directorate for the Cadastre (http://www.sedecatastro.gob.es/, last access: 15 May 2020) were included. Second, the flow direction in the urban network was calculated with Arc Hydro Tools (ESRI, 2019). This gave a preliminary assessment of the role of hydraulic processes in physical damage. Due to the flow direction, this is mainly related to the velocity vector component perpendicular to the building surface element (Amirebrahimi et al., 2016). The results are given in a set of tables and maps that summarise the effects of the event and help to reflect on its causes and consequences.
2.7 Sediment connectivity
As well as the hydrogeomorphological monitoring tasks, the 15 October 2018 MEDhyCON research group collaborated in the emergency operation to search for a missing person during the flash flood. Firstly, and taking into account the emergency situation, the index of (water and sediment) connectivity at the catchment scale was applied to find the areas with the greatest sediment deposition potential, which were where victims could have been buried by the flash flood. The sediment IC proposed by Borselli et al. (2008) and modified by Cavalli et al. (2013) determined the preferential flow paths by exploring the water and sediment transference patterns in different landscape compartments of the entire Ca n'Amer River. Thus, the IC is a dynamic property of the catchment that indicates the probability of a particle at a certain location reaching a defined target area, which in this study was established at the catchment outlet (Trevisani and Cavalli, 2016). This morphometric index was mainly derived from a HR-DTM, in this case, a 1 m lidar-based DTM dating from 2014; http://pnoa.ign.es/coberturalidar (last access: 15 May 2020). The IC was calculated as follows:
where Dup and Ddn are up- and downslope components, respectively, average percentage slope, A the size of the upslope contributing area, an averaged weighting factor representing terrain roughness and di a flow length of the ith cell along the steepest downslope. IC was calculated by using the freely available SedInConnect (version 2.3) software developed by Crema and Cavalli (2018).
2.8 Geomorphic change detection
HR-DTMs facilitate the improvement of sediment connectivity as a powerful tool to determine preferential flow paths and those areas with the greatest potential sediment deposition. The evaluation of the flash-flood landform signature by UAVs is the second part of creating a tool for a rapid response of post-catastrophe search-and-rescue tasks by applying hydrogeomorphological precision techniques. The estimation of overbank sedimentation allowed the calibration of predicted large sedimentation by IC mapping and its reliability in detecting sites where victims might be buried by flood sediment.
The latest technological advances in remote data acquisition (i.e. UAVs) and topographic modelling (i.e. structure from motion – SfM; multi-view stereo – MVS) have led to a huge advance in Earth and environmental sciences. Following the incorporation of MEDhyCON to the emergency operations, several UAVs flew all along the Ca n'Amer River, from the headwaters (Begura de Salma River) to its outlet into the Mediterranean Sea at the village of S'Illot (Fig. 2c). This fieldwork involved the establishment and survey of more than 250 ground control points (GCPs), needed for an appropriate georeferencing of the aerial photographs taken by the drone. Therefore, on 15 October 2018, just 6 d after the flash flood, evidence of erosion was recorded by aerial photographs taken with a small unmanned aerial vehicle (UAV DJI Phantom 4 Pro, < 2 kg) and its conventional camera. The sensor dimensions are 12.83×8.60 mm, 5472×3648 px. The camera was calibrated by means of the Agisoft Lens, an automatic lens calibration routine included in Agisoft Metashape that uses the LCD screen as a calibration target and enables the full camera calibration matrix, including non-linear distortion coefficients (Agisoft Lens, 2018), to be calculated. Resolution was set at 20 Mpx, shutter speed at 1∕2000 s and focal length was 8.60 mm. Most of the active zones of the main stream – including the floodplain corridor – with evidence of erosion and deposition were surveyed, which also ensured the recording of high-water marks.
Imagery acquired during the aerial campaign enabled (1) the creation of mosaics of aerial georeferenced images and (2) the generation of high-resolution digital terrain models. These were produced by Agisoft Metashape Pro® v1.5.3 using automated digital photogrammetry techniques. This software obtains high-quality results easily from algorithms known as SfM. Further details on the implemented algorithms can be found in Lowe (2004) and Westoby et al. (2012). For the proper acquisition of the imagery, flight altitude was set at 70 m, ensuring ground resolution close to 0.02 m px−1, and the camera was programmed to shoot every 15 m, flying at an average speed of 5 m s−1.
Once all the drone images were georeferenced and properly mosaicked, topographic modelling (i.e. SfM) generated the post-flash-flood very-high-resolution DTM (i.e. 5 cm pixel size). The comparison of that DTM to that of the catchment prior to the catastrophic event (lidar-based DTM dating from 2014) allowed the quantification and assessment of the actual magnitude (competence) of the event in terms of the volume of sediments eroded and/or deposited and the alteration of the fluvial morphology. It is worth noting that no geomorphic changes were observed between 2014 and October 2018, by photointerpretation of aerial imagery (PNOA, 2015) and the continuous measurement of water stages since January 2015, with no overbanked flood events. Consequently, geomorphic changes were estimated in a floodplain downstream from Sant Llorenç des Cardassar to evaluate the amount of overbank sedimentation in the area of the rescue where IC suggested the search. Measurements were taken with a procedure, similar to DEM of difference (DoD), that compared the elevation of the ground class points extracted from the lidar topography collected in 2014 (http://pnoa.ign.es/coberturalidar, last access: 15 May 2020) and the points extracted from the 0.05 m resolution DTM obtained by the UAV flight at the same coordinates. Root mean square errors (RMSEs) in xyz of the UAV DTM were calculated for 12 precise coordinate points (different from those GCPs used for image georeference and located on surfaces not modified by the flash flood) within the floodplain area of volumetric measurements, which were < 0.175 m.
3.1 Catchment hydrological dynamics
The hydrogeological and geomorphological characteristics of Mallorca's river catchments control their surface water–groundwater interactions and thus generate different streamflow regimes (see Estrany et al., 2009). The headwaters of all subcatchments and the tributaries that drain the Llevant ranges and Marinas are ephemeral due to the high degree of fracturing, fissuring and karstification, which favour infiltration and percolation through perched karstic aquifers unconnected to the main stream channels.
The hydrological monitoring period assessed in this paper by using data from the hydrometric station was from 10 January 2015 to 30 September 2018 (Fig. 6). The month of October 2018 was reserved for a singular and deeper study that could describe the catastrophic flash-flood event better (see results, Sect. 3.2). This gives a series of almost 4 hydrological years under hydrometeorological conditions illustrating ephemeral behaviour of the Begura de Salma River that was average in terms of precipitation (see the inset table, Fig. 6). In terms of Q, this inset table also shows the behaviour during the study period of several hydrological parameters. However, these values cannot be compared in the long term due to errors of up to 2 orders of magnitude in Q values measured by the hydrometric network managed by the Balearic Islands Government (see Fortesa et al., 2019). Events of different magnitudes occurred during this study period, some of them representative of recurrence ≈5 years in terms of rainfall. However, only two events recorded peak Q (hereafter Qpeak) values > 1 m3 s−1, both occurring in January, when the hydrological pathways were fully active due to saturation processes. In January 2015, 120 mm of rainfall in 48 h at the AEMET-B630 Ses Pastores rainfall station (see location in Fig. 2) created a flow response with a Qpeak of 2.8 m3 s−1. Finally, in January 2017, 153 mm of rain fell in 72 h with a Qpeak of 4.8 m3 s−1, the maximum recorded at the hydrometric station during the study period before the catastrophic flash flood.
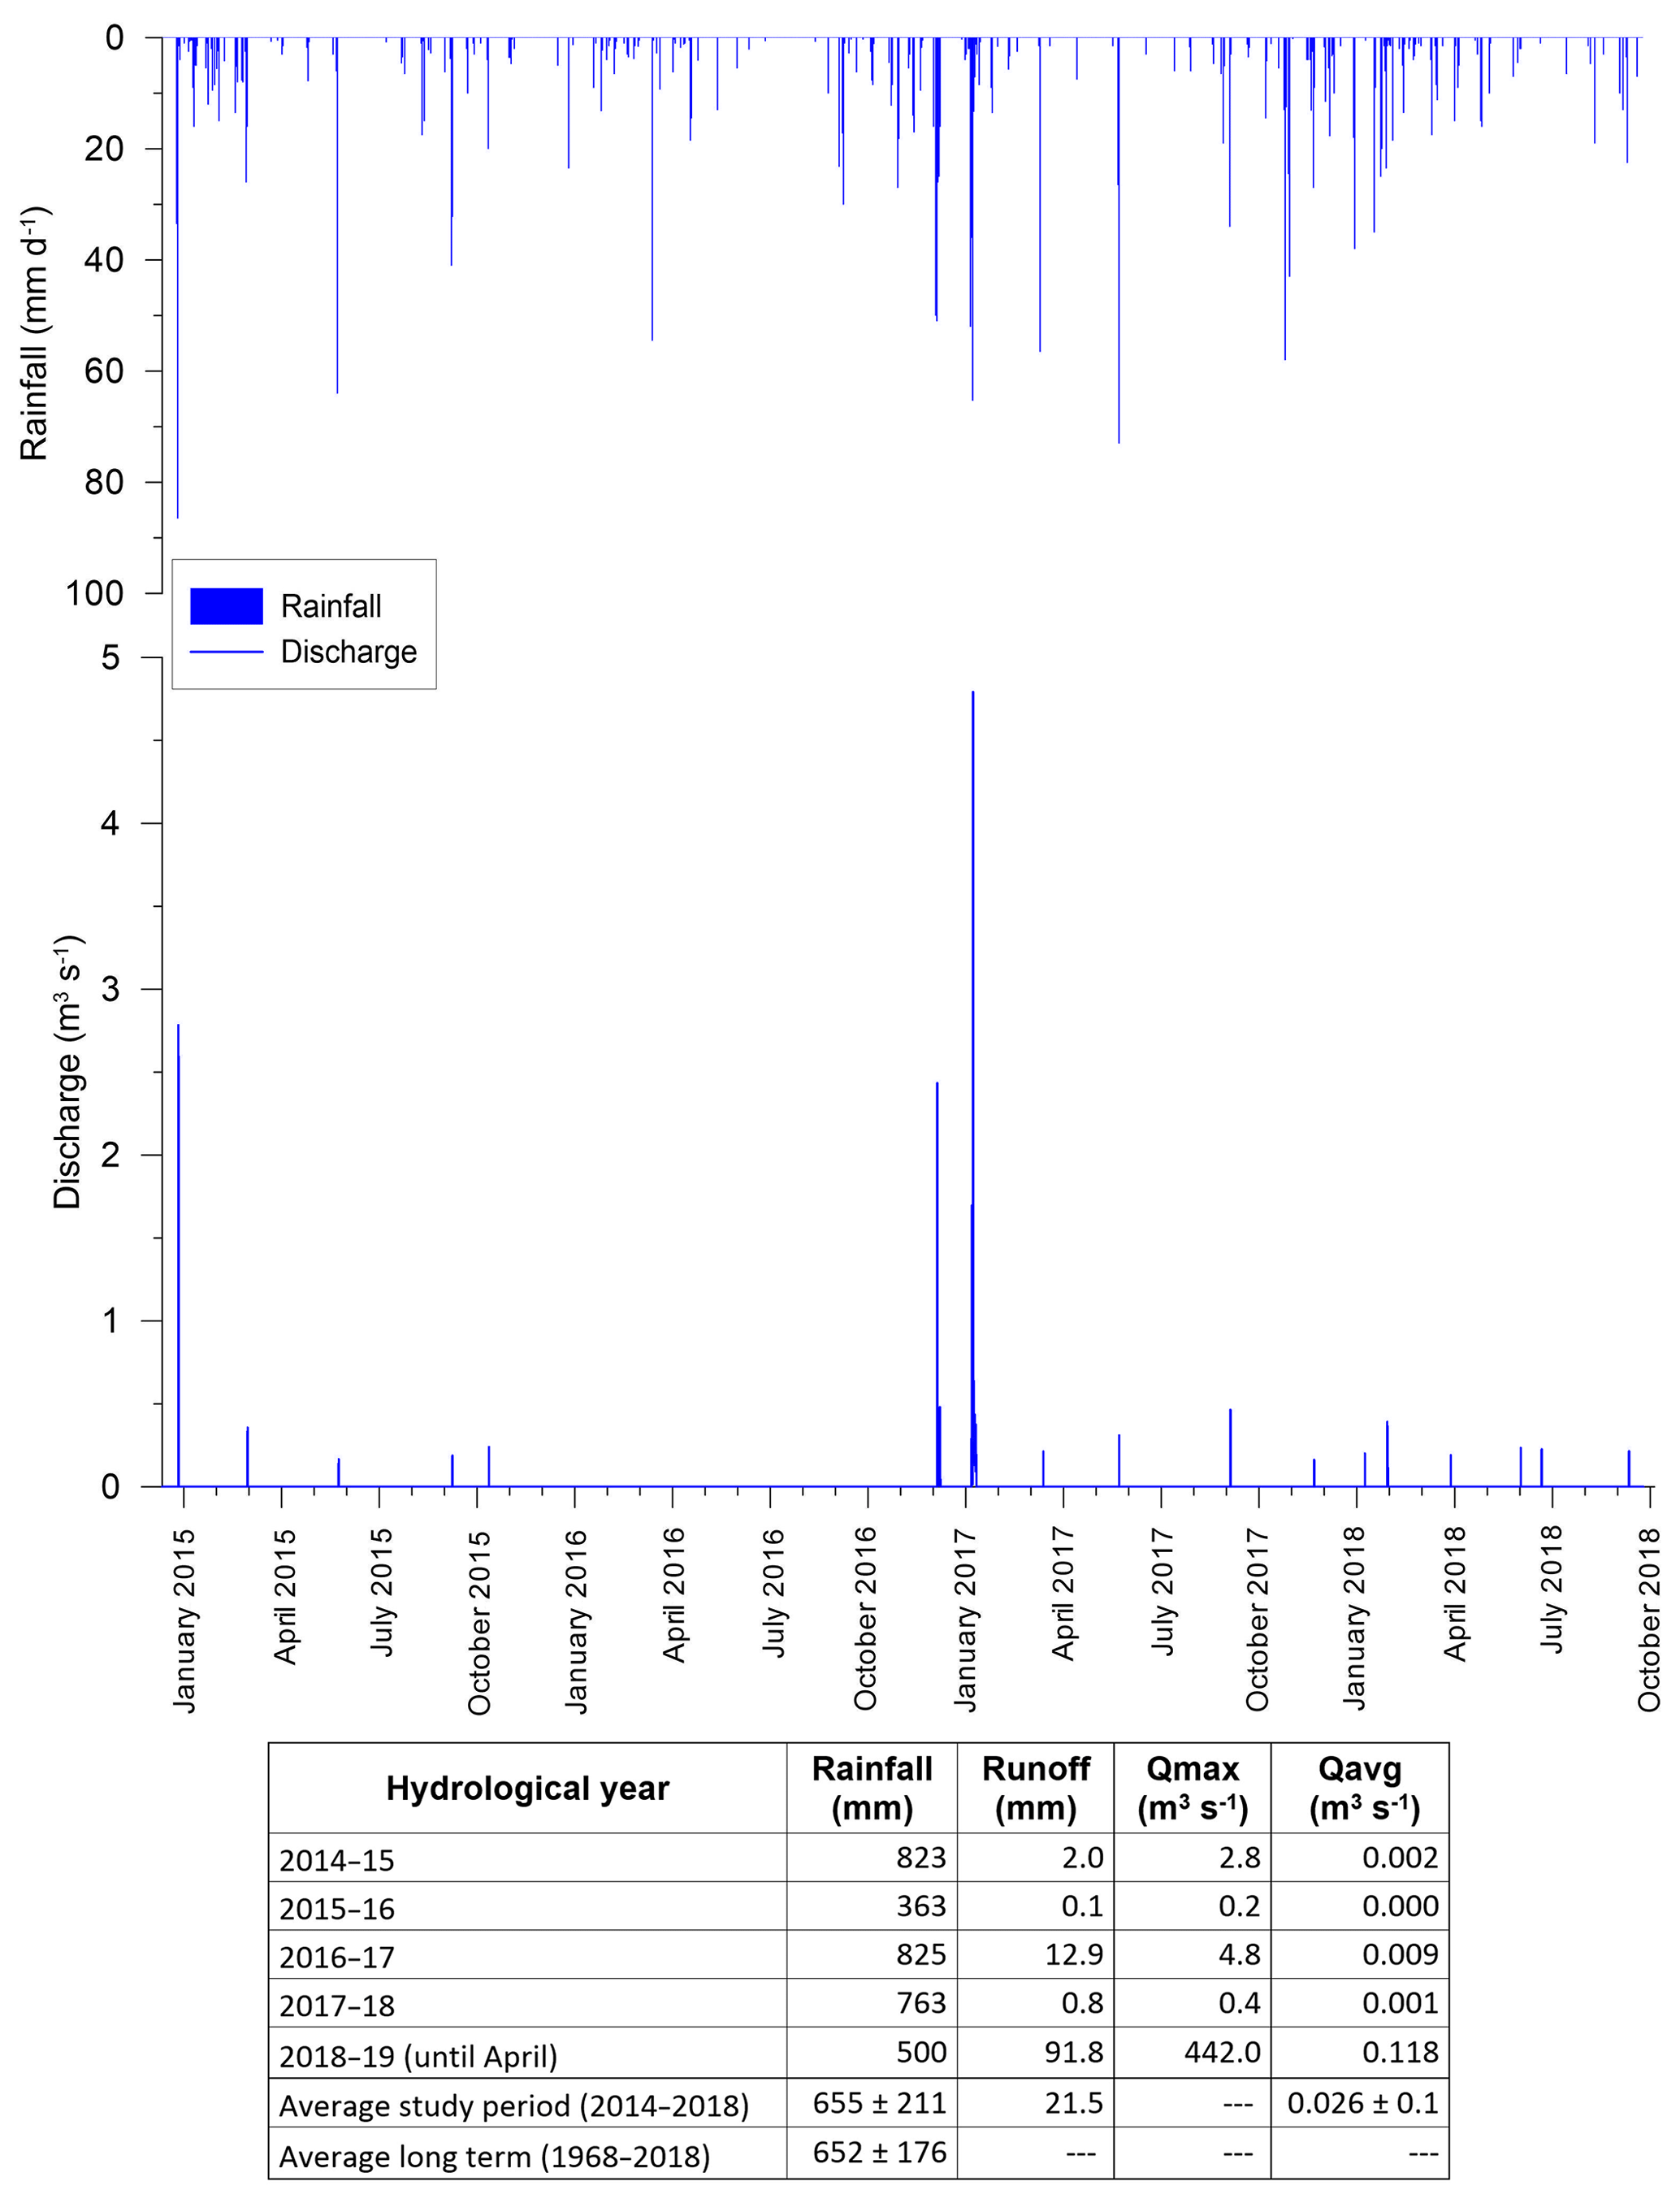
Figure 6Discharge at 15 min intervals measured at the MEDhyCON hydrometric station located at the beginning of the concrete channel of the Begura de Salma River in Sant Llorenç des Cardassar. Likewise, the daily rainfall measured at the AEMET-B630 Ses Pastores during the monitored period (10 January 2015–30 September 2018), prior to the catastrophic flash flood of 9 October 2018, is shown. The bottom table displays the rainfall, runoff and peak discharge for hydrological years during study period. Rainfall data are from AEMET-B630 Ses Pastores, located 10.5 km from the Begura de Salma River catchment outlet and representative of the rainfall dynamics of the Llevant range's headwaters.
3.2 Hydrological response of the flash flood
The hydrological response of the flash flood was analysed through variables derived from the rainfall (Table 1a, seven variables) and runoff (Table 1b, nine variables) of the catchment: event rainfall duration: duration from the beginning of rainfall until it stopped; time of maximum rainfall: time of the highest rainfall intensity; centroid storm: central time of the rainfall event; average radar rainfall: mean rainfall obtained by radar; IPmax average radar: average of the highest rainfall intensities obtained from radar rainfall points; IPmax radar: highest rainfall intensity obtained from radar data; IP average radar: average of rainfall intensities obtained from radar rainfall points; runoff: discharge volume amount divided by the catchment area; runoff ratio: ratio between runoff and rainfall, also known as runoff coefficient when expressed as a percentage; event duration: duration of the flood event; Qmax: peak discharge; time Qmax: time the peak discharge lasted; T centroid storm – T Qmax: duration between the time of the rainfall centroid and the time of the discharge peak; Qaverage: discharge average during the flood event; unit peak discharge: peak discharge divided by catchment area, allowing the comparison of peak discharge regardless of catchment size; reduced unit peak discharge: discharge peak divided by catchment area in square kilometres elevated by 0.6. The exponent was obtained from Gaume et al. (2009), who applied this last parameter to compare reduced unit peak discharge from different flash-flood events. The duration of the rainfall event was approximately 10 h and the average catchment rainfall amount was 249 mm for both the Sa Blanquera River and the Begura de Salma River catchments. Average and maximum rainfall intensities in 10 min were, respectively, 25 and 45 mm h−1 (Table 1a). However, spatial differences in rainfall depth within the catchments could be seen. Thus, the total rainfall amount ranged spatially within the catchment from 170 mm (see R1 in Fig. 7) to 285 mm (see R5 and R6 in Fig. 6), with the highest rainfall amount in 1 h occurring at R12 (77.2 mm). These highest rainfall values occurred at the headwaters of the Begura de Salma River catchment (R12 in Fig. 7) at 15:00 LT, the beginning of the event. At 17:00 LT, the convective train was moving very slowly, causing a new peak of rainfall amounts in 1 h located in the downstream part of this catchment with values between 60 and 70 mm recorded at R5, R6 and R9 (Fig. 7). During the last part of the event, at 19:00 LT, rainfall amounts in 1 h of 60 mm h−1 were recorded from R2 to R5.
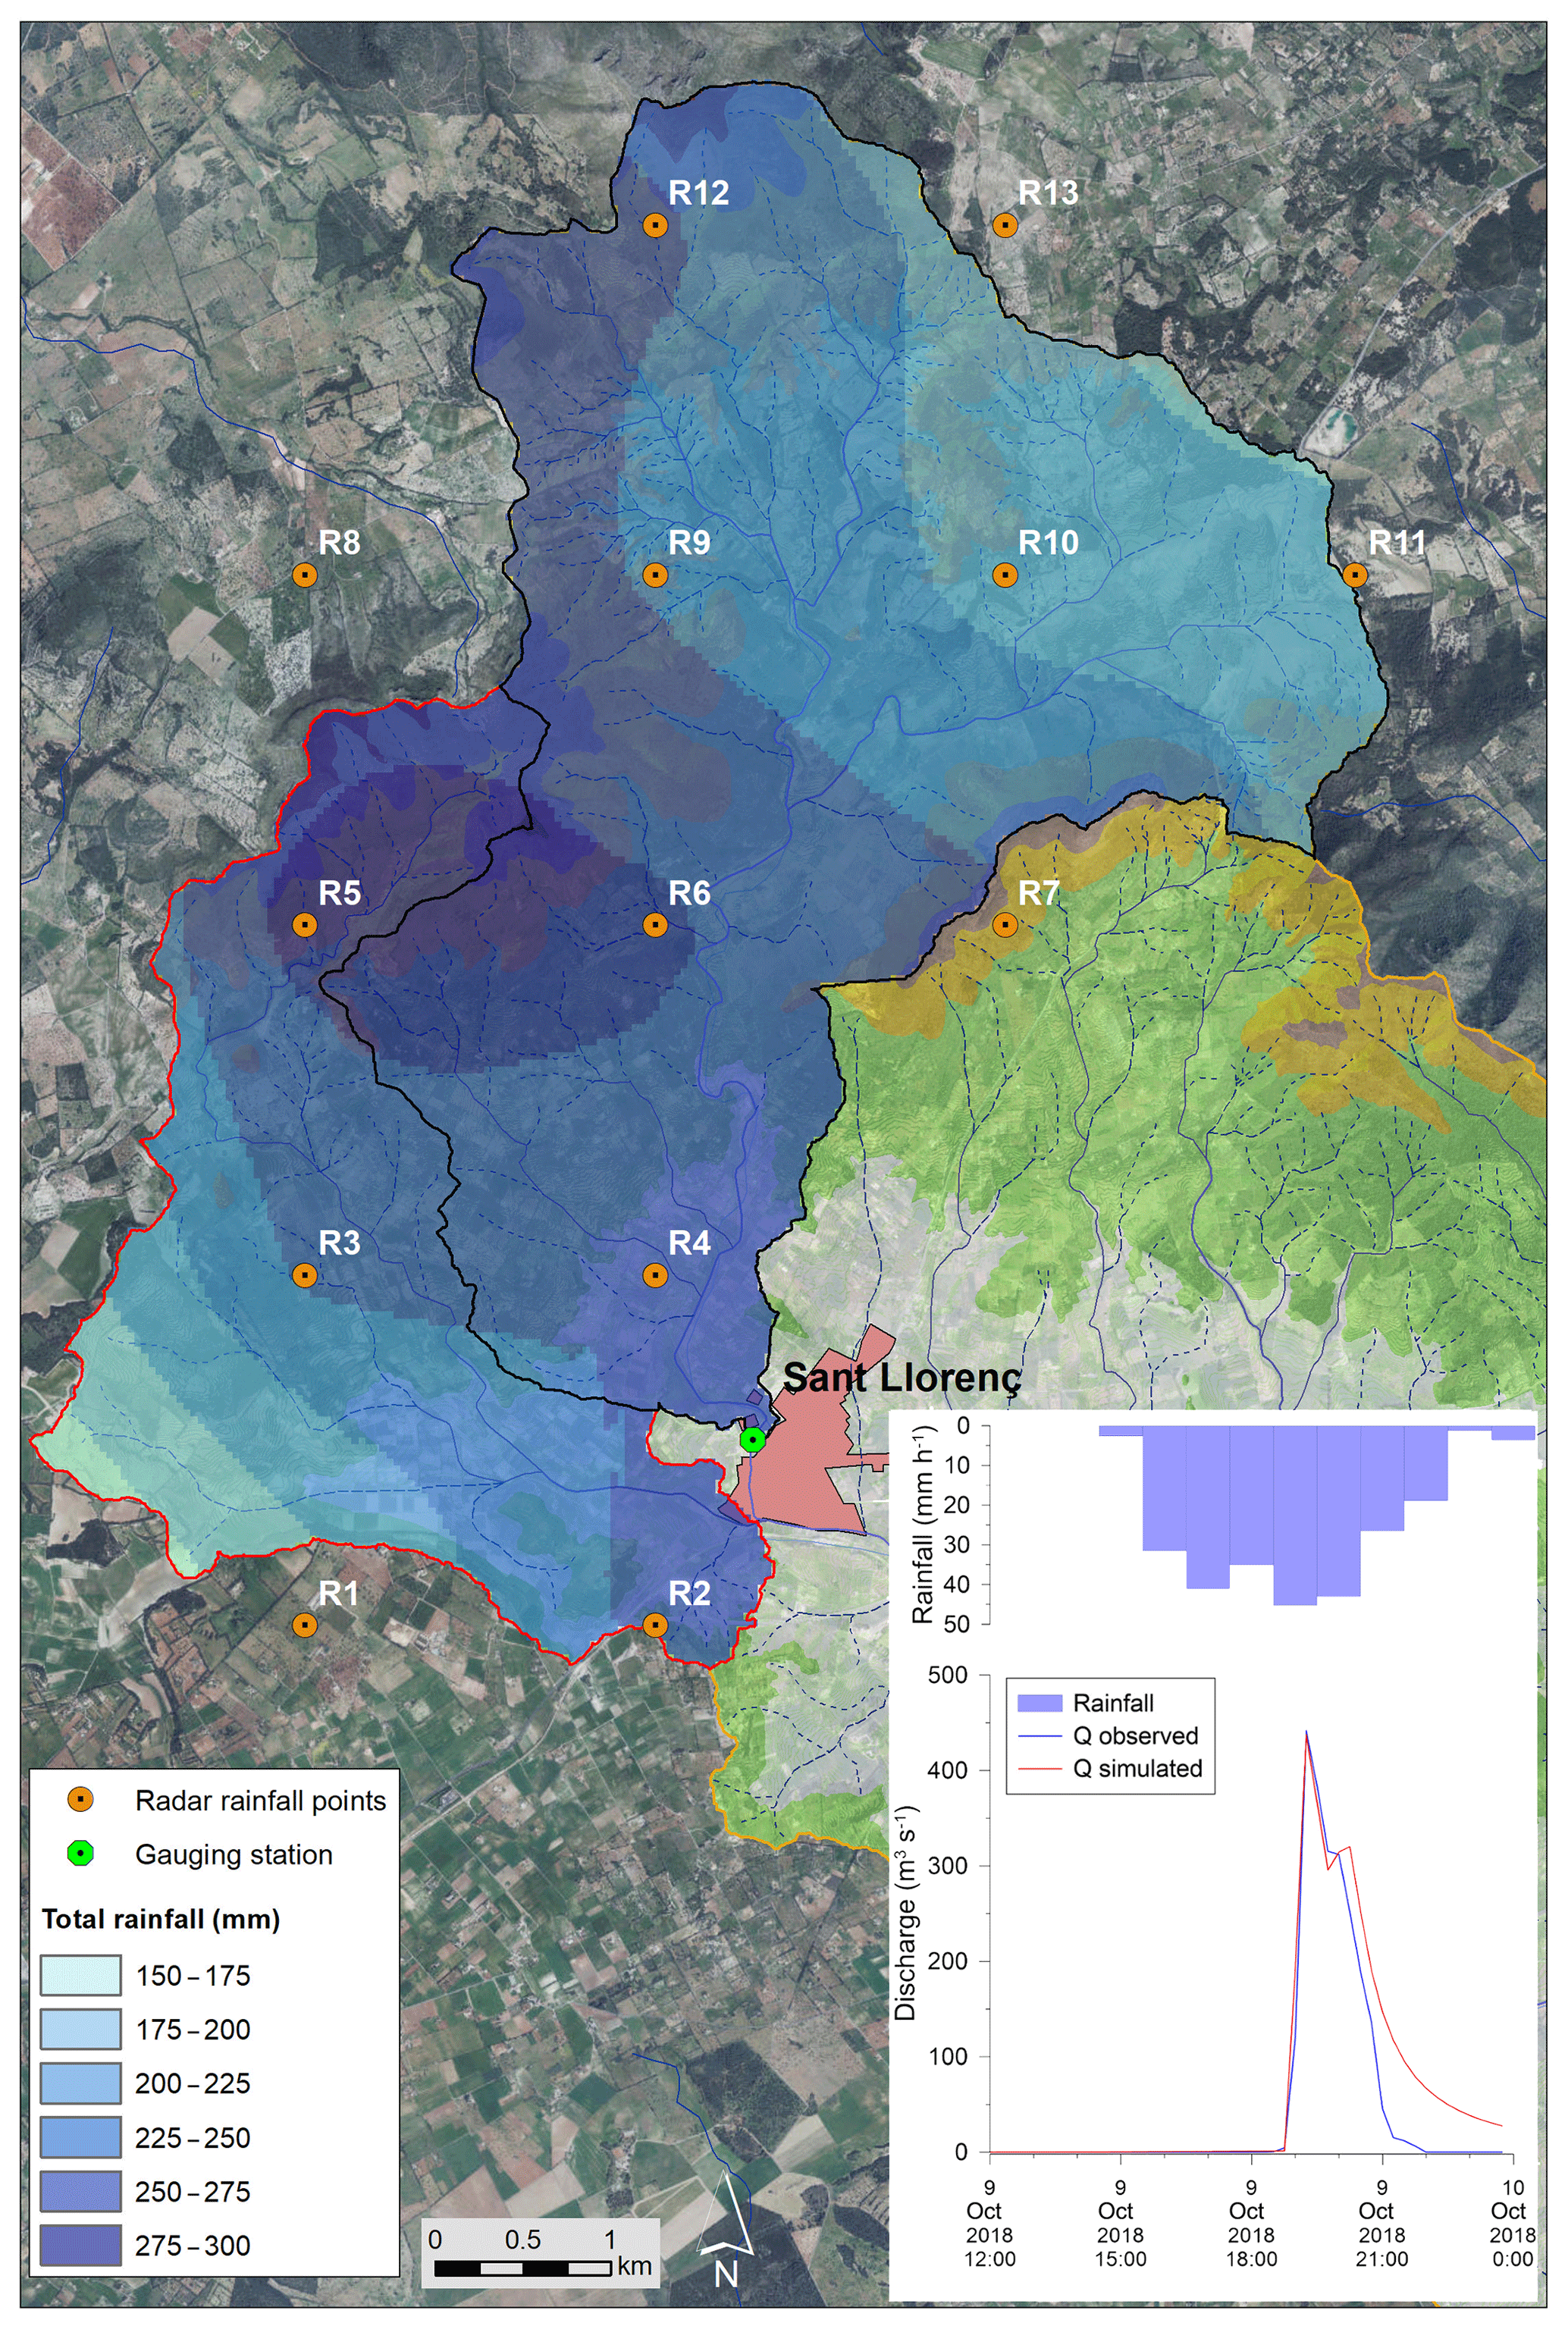
Figure 7Map of isohyets of the rain storm of 9 October 2018 in the two headwater catchments of the Ca n'Amer River, i.e. the Sa Blanquera River and Begura de Salma River. Source: 10 min radar images obtained from the web https://opendata.aemet.es/ (last access: 15 May 2020). The inset figure shows the discharge measured at the MEDhyCON hydrometric station, as well as the result of the rainfall–runoff simulation using a modified version of the GR3 model. Background: aerial photography and DTM data (PNOA, 2015).
Table 1(a) Rainfall and (b) runoff variables of the flash flood at the Begura de Salma River catchment estimated from the continuous water stage monitoring at the MEDhyCON hydrometric station located in the village of Sant Llorenç des Cardassar.
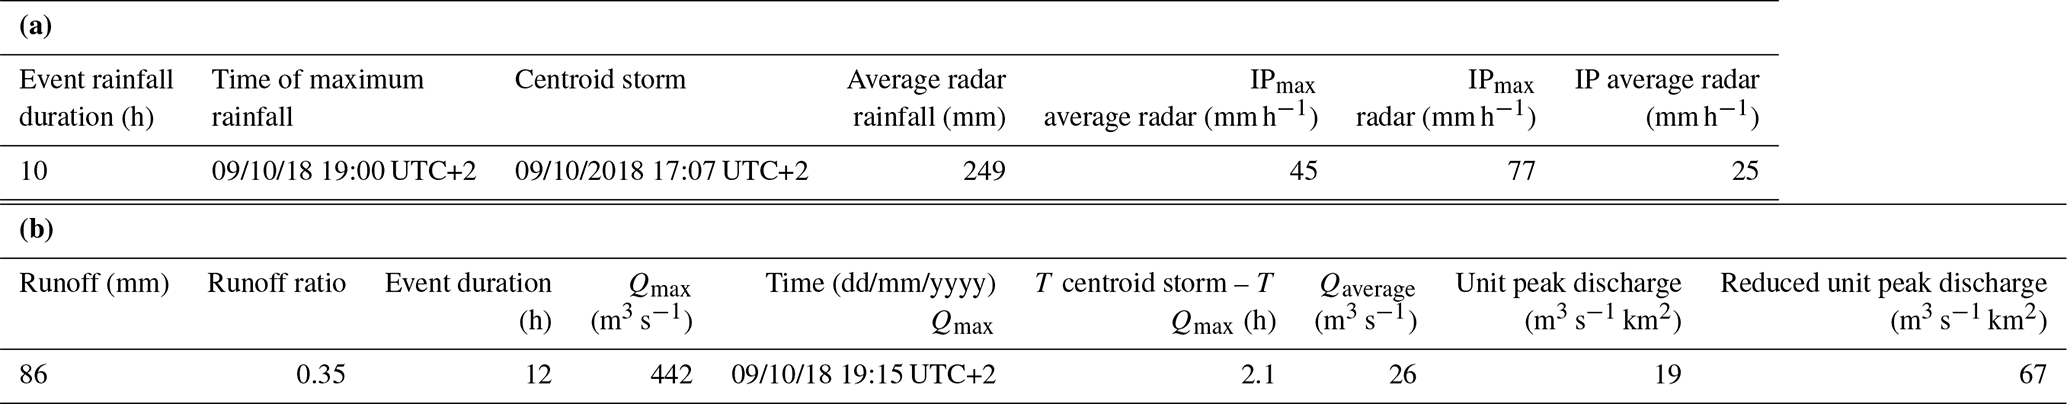
Rain started to fall at 15:00 LT (official time; UTC +2 h). At 18:00 LT, its amount was already 104.2±20 mm h−1, but the runoff response was insignificant with Q of 0.089 m3 s−1. However, 1 h later, at 19:00 LT, with rainfall reaching an amount of 144.6±36.8 mm h−1 Q was already bankfull, i.e. 120 m3 s−1. This was probably because the catchment's soil infiltration capacity was exceeded, which caused a rapid overland flow. Consequently, only 15 min later, Qpeak was recorded (i.e. 442 m3 s−1) which triggered catastrophic flooding. In addition, Q values continued to be high (i.e. > 135 m3 s−1) until 20:45 LT due to the convective train maintaining rainfall intensities > 24 mm h−1. At 00:00 LT, the rainfall event finished and Q dropped sharply to 0.016 m3 s−1. Table 1b summarises the most important runoff parameters, shedding further light on the hydrology of this flash-flood event.
3.3 Reproducing the flashy hydrological response of the catchment
The hydrological model described above helped to understand the process better during the event. The results of the hydrological model simulation can be seen in Fig. 7. The input data used in the model were the continuous radar data set described above and the temperature measured at the surrounding meteorological stations, i.e. three stations within a radius of 12 km. The model was calibrated to reproduce the event and the final parameters were set to
-
m,
-
m and
-
Kkarst=0.045 m.
Initial conditions of the Génie Rural (GR) reservoir: H(t0)0.08 m, corresponding to low soil saturation.
The relative volume error between the simulation and the measurement was 6 %. The simulated peak ratio was 437.7 m3 s−1, with an estimated runoff coefficient of 37.8 %. The recession limb was not as sharp as the measured Q. It is worth noting that it was not possible to simulate Q with the same magnitude as the Q measured during the episode with a non-modified version of the GR3 model.
The same parameters were used for the entire headwater catchment. Accordingly, the Qpeak from the other headwater tributary located on the west flank of the village of Sant Llorenç des Cardassar (Sa Blanquera) was calculated by the model as 77.2 m3 s−1, corresponding to an estimated runoff coefficient of 22.7 %.
3.4 Socioeconomic and territorial flood damages linked to hydrogeomorphological processes
The flash flood had enormous social and economic repercussions in Llevant county and the whole of Mallorca, as well as extensive national and international media coverage. The flash-flood event was a catastrophe with 13 deaths and economic damage that had great impact on the population and infrastructure. The number of casualties in one of the most important international tourist resorts, considered traditionally safe, shook national and international opinion. For further assessment of the media impact, see Table S1.
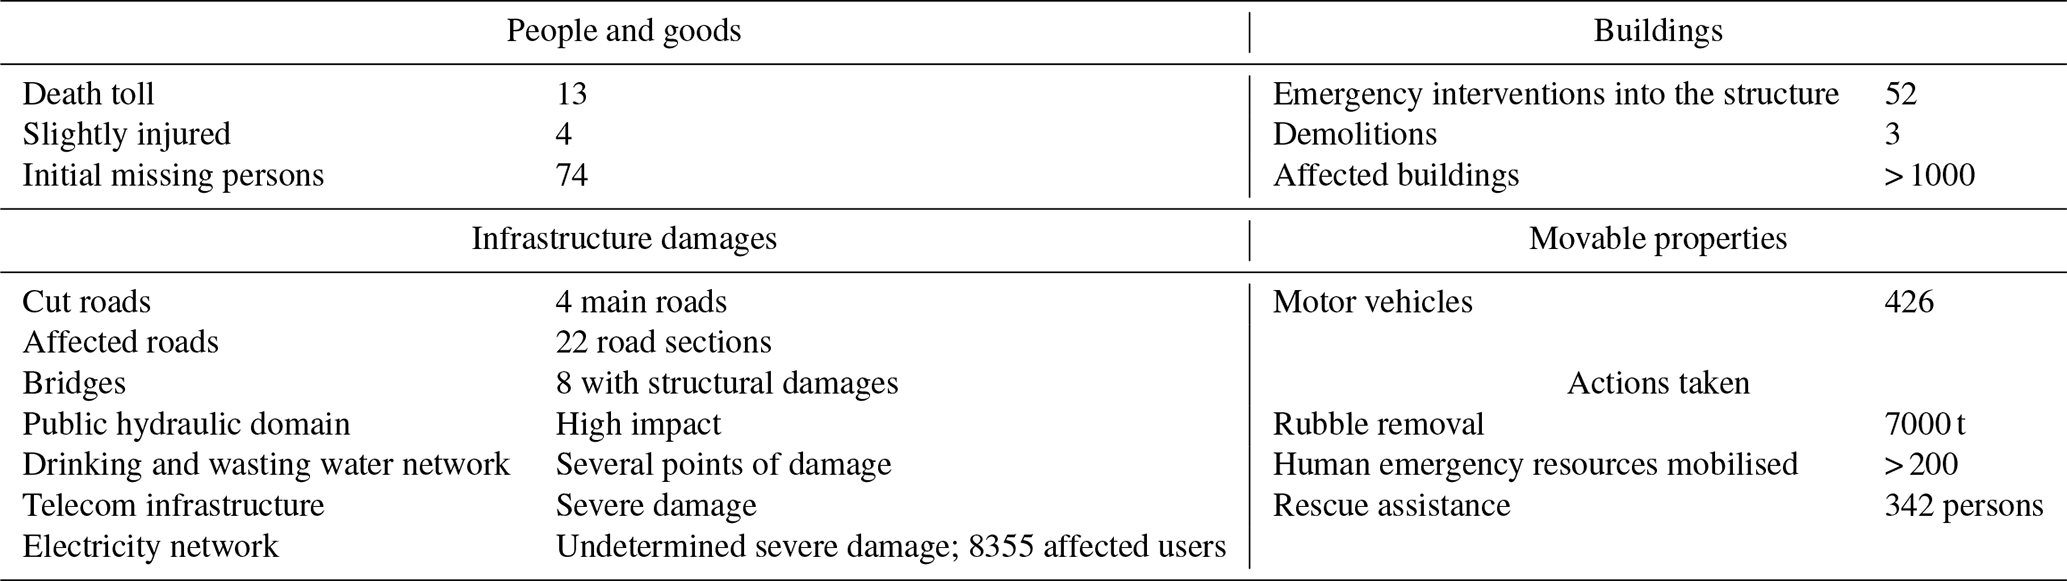
The damage assessment report by the emergency services of the Balearic Islands Government showed an unprecedented mobilisation of resources in the region during the first week after the catastrophe in line with the high number of victims and amount of damage (Table 2; Pol, 2019a). The initial costs of the emergency works exceeded EUR 1.5 million including the following actions: cleaning and restoring river channels, demolition of walls and structures affected, removal of potential polluting sources (Pol, 2019b). The declaration of a disaster area is regulated by Spanish Law 2/2018, other complementary laws (BOE, 2018, 2019) and Decree 33/2018 (GOIB, 2018). These laws established public support for alleviating the basic needs of families, deaths, housing assistance, aid for loss of vehicles and support for the economic sectors affected. The laws provided assistance for the repair of public infrastructure and environmental damage, specifying the amount of aid and the administrative procedures to receive it. These regulations referred to all the affected areas, including the municipalities of Sant Llorenç des Cardassar but also Artà, Capdepera, Son Servera and Manacor. Recovery was financed jointly by the different public administrations: the Spanish Government, the Balearic Islands Autonomous Government, the Mallorca Government and the Sant Llorenç des Cardassar City Council. In April 2019, the expenditure of the Autonomous Government had reached EUR 30.4 million in recovery and mitigation actions (GOIB, 2019). This expenditure included aid to the affected towns and villages of EUR 11.27 million (EUR 2.7 million for the Sant Llorenç des Cardassar City Council), aid to companies of 3.3 million, for rehabilitation of homes (1.6 million), vehicle recovery (1.5 million), social aid (1.2 million) and EUR 0.264 million for deaths. The Sant Llorenç des Cardassar City Council, deployed various funds from the Spanish Government and Autonomous and Mallorca Governments for an investment plan in Sant Llorenç des Cardassar of EUR 3.51 million (Ajuntament de Sant Llorenç des Cardassar, 2018). In parallel, the Insurance Compensation Consortium (CCS, 2018), the Spanish public agency that handles payments to affected people in cases of damage caused by catastrophic events, processed claims for the flash flood as well as all the payments following damage assessment after the disaster in Sant Llorenç des Cardassar. A total of 774 claims were processed, with EUR 6 842 468 paid out (see Table S2 in the Supplement).
Table 2Damage summary and emergency actions after the 9 October 2018 violent flash flood in Llevant county, Mallorca. Source: Pol (2019b).
A territorial and hydrological analysis of the damage assessment is developed here. The location of the affected buildings and the WS reached in the streets and buildings provided by the emergencies department of the Balearic Islands Government and by the Copernicus EMS enabled three affected zones within the urban area of Sant Llorenç des Cardassar to be mapped (Fig. 8a). Zone 1 was due to the overbank flow of the Begura de Salma River and corresponded mostly to the affected areas defined by the Copernicus EMS. In this zone (1), the highest WS in the streets was reached, exceeding 3.3 m. Zones 2 and 3 were those urban areas affected by the overbank flow of the Sa Muntanyeta creek, located in the northernmost area of the village. The streets of Sant Llorenç des Cardassar rerouted the overbank flow from both the Begura de Salma River and the Sa Muntanyeta creek (Fig. 8b), causing significant damages to vehicles and movable public property. In addition, as most of the buildings in Sant Llorenç des Cardassar use the ground floor as a home or business, the event caused major flooding by water and mud that made their use impossible and required cleaning and restoration. According to the Balearic Islands Government, 392 damaged buildings and plots were inventoried in the urban area of Sant Llorenç des Cardassar, most of them in zone 1 (Fig. 8c and 8d). The flow direction illustrated how the north-to-south direction, parallel to the Begura de Salma River, caused most damage in zone 1, with 349 affected buildings and a WS average of approximately 1.03 m. Zones 2 and 3 had lower-intensity damage, with 37 and 6 affected buildings and a maximum WS of 1.80 m and 1.60 m, respectively. In these zones (2 and 3), the flow direction had no clear pattern because the Sa Muntanyeta creek has a small catchment (2.2 km2) and the urban street network and plots are not parallel to its natural flow direction.
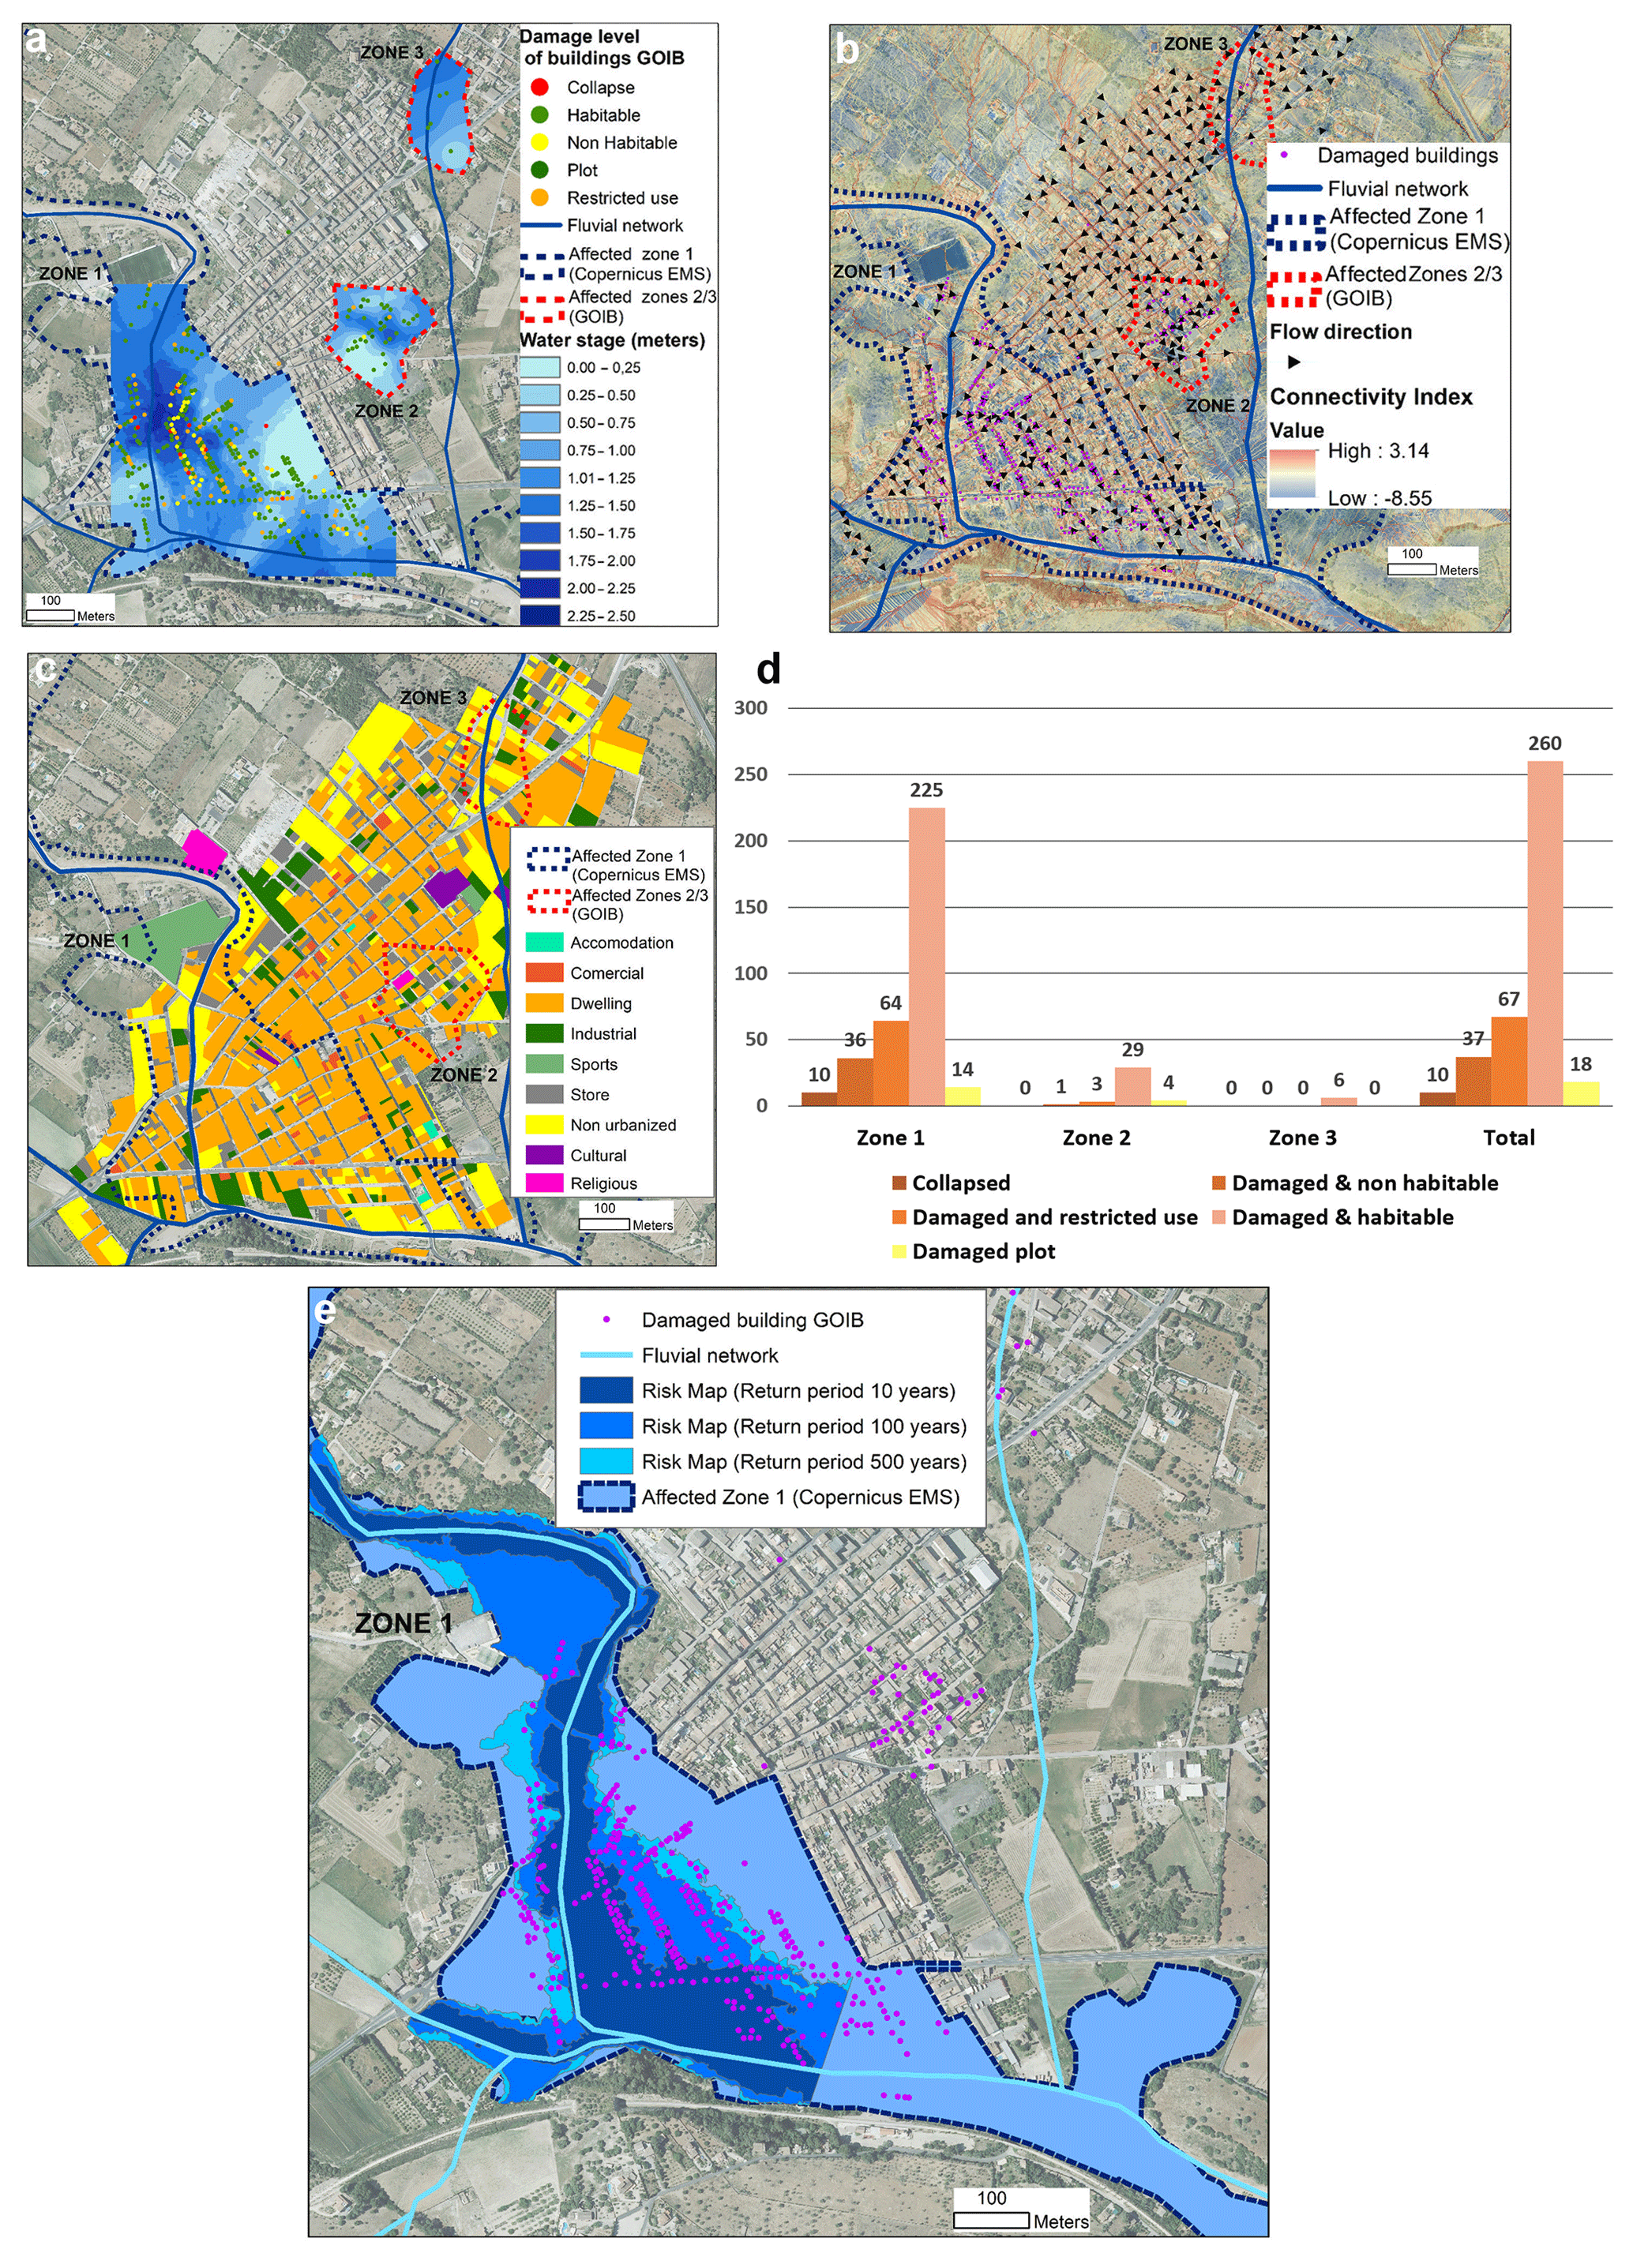
Figure 8(a) Map of the damage level classification of buildings and water stage reached in the different affected zones at Sant Llorenç des Cardassar according to the Balearic Islands Autonomous Government, in comparison to the flood delimitation by Copernicus EMS. Flow direction and hydrological connectivity in the affected zones (b) (1, 2 and 3) in the Sant Llorenç des Cardassar urban network. (c) Economic activities by building in the urban area of Sant Llorenç des Cardassar and the delimitation of affected zones by the flash flood. (d) Damage level classification of buildings in the different affected zones in Sant Llorenç des Cardassar. (e) Official flood risk maps and flood delimitation by Copernicus EMS in the village of Sant Llorenç des Cardassar with the location of buildings affected by the flash flood of 9 October 2018. Background: aerial photography (PNOA, 2015). In Fig. 7d, the source of land use at the urban plot scale is the General Directorate for the Cadastre (http://www.sedecatastro.gob.es/, last access: 15 May 2020).
The maps included in the Balearic Flood Risk Management Plan (GOIB, 2016) indicate the urban area of Sant Llorenç des Cardassar as a maximum risk area. Accordingly, the plan developed an analysis of the potentially affected areas for recurrence periods of 10, 100 and 500 years (Fig. 8e). In addition, Table 3 analyses the damaged buildings to see if they are included in these official flood risk areas in accord with the recurrence periods. None of the flood risk maps for different return periods encompassed the areas affected as a result of the event. The 10-year recurrence map only included 25 % of the affected areas; the 100-year map covered 48 % of the area damaged, while the 500-year map only reached 60 % (Table 3).
Table 3Damaged buildings in the village of Sant Llorenç des Cardassar caused by the violent flash flood on 9 October 2018 and those encompassed in the official flood risk maps for 10-, 100- and 500-year recurrence periods.
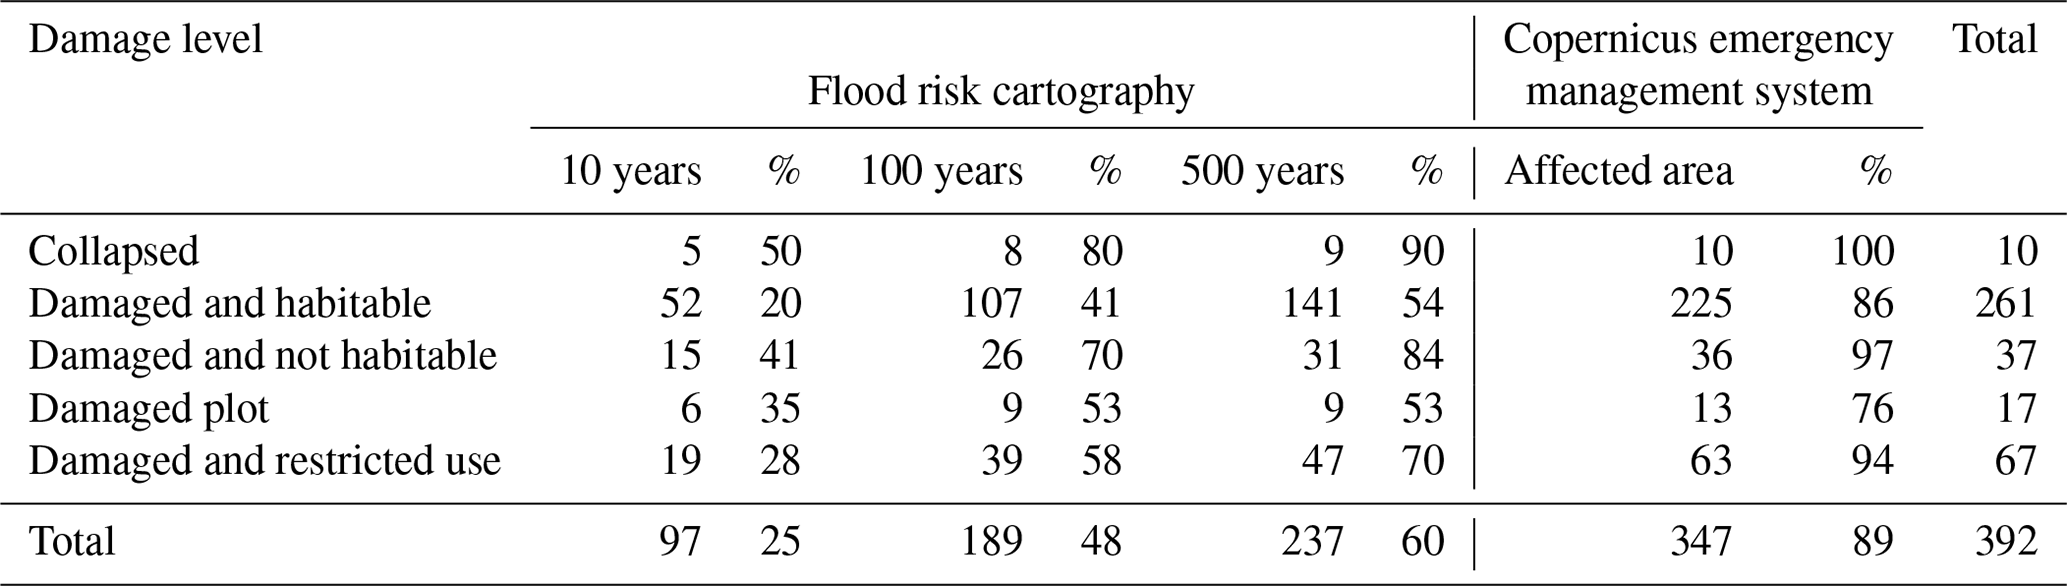
On comparing the affected zones where damaged buildings are also depicted in the Copernicus EMS, some differences between the initial flash-flood definition carried out by the Copernicus EMS-EU and the distribution of damaged buildings were found (Fig. 7f) in zones 2 and 3. It is worth noting that the post-event definition of the Copernicus EMS (Copernicus Emergency Management Service, 2018) covered approximately 90 % of the real damage.
3.5 Sediment connectivity and geomorphic change detection as emergency tools
The search for the only person missing during the flash flood who had not yet been found 6 d after the storm caused considerable social consternation in the Balearic Islands and beyond. Subsequently, hydrogeomorphological precision techniques were crucial. A very intense topographical survey constructed very high-resolution (i.e. 5 cm pixel size) digital elevation models and orthophotomosaics.
First, given the emergency situation, the index of (water and sediment) connectivity at the basin scale was used to identify those areas with the greatest sediment deposition potential (Fig. 9a). The IC shows well the sediment transfer processes within drainage catchments. The most connected areas of a basin are those in which their different compartments are more powerfully linked. That favours the largest water surface flow generation and thus erosion and, potentially, larger soil losses. On the contrary, the zones with low connectivity are those whose topographical characteristics disconnect water and sediment flows, acting as storage or deposition areas. The IC was applied to the whole Ca n'Amer River basin but was only analysed from the point where the missing person was last seen (Fig. 9b, point 1). That was the exact point where the car in which he was driving was swept away by the flood wave. Therefore, the preferential water and sediment paths most likely to be followed by the flood flows were identified, as well as the most important deposition areas downstream from the last point the person was seen. The most likely deposition zone was identified and immediately communicated to the emergency authorities, upstream from the bridge of the Ma-15 road which crosses the Ca n'Amer River about 1 km below Sant Llorenç des Cardassar. The search activities concentrated on that area, which is where the last victim was found (Fig. 9b, point 2) when the emergency authorities had decided to move their search activities to the mouth of the Ca n'Amer River and beyond into the Mediterranean.
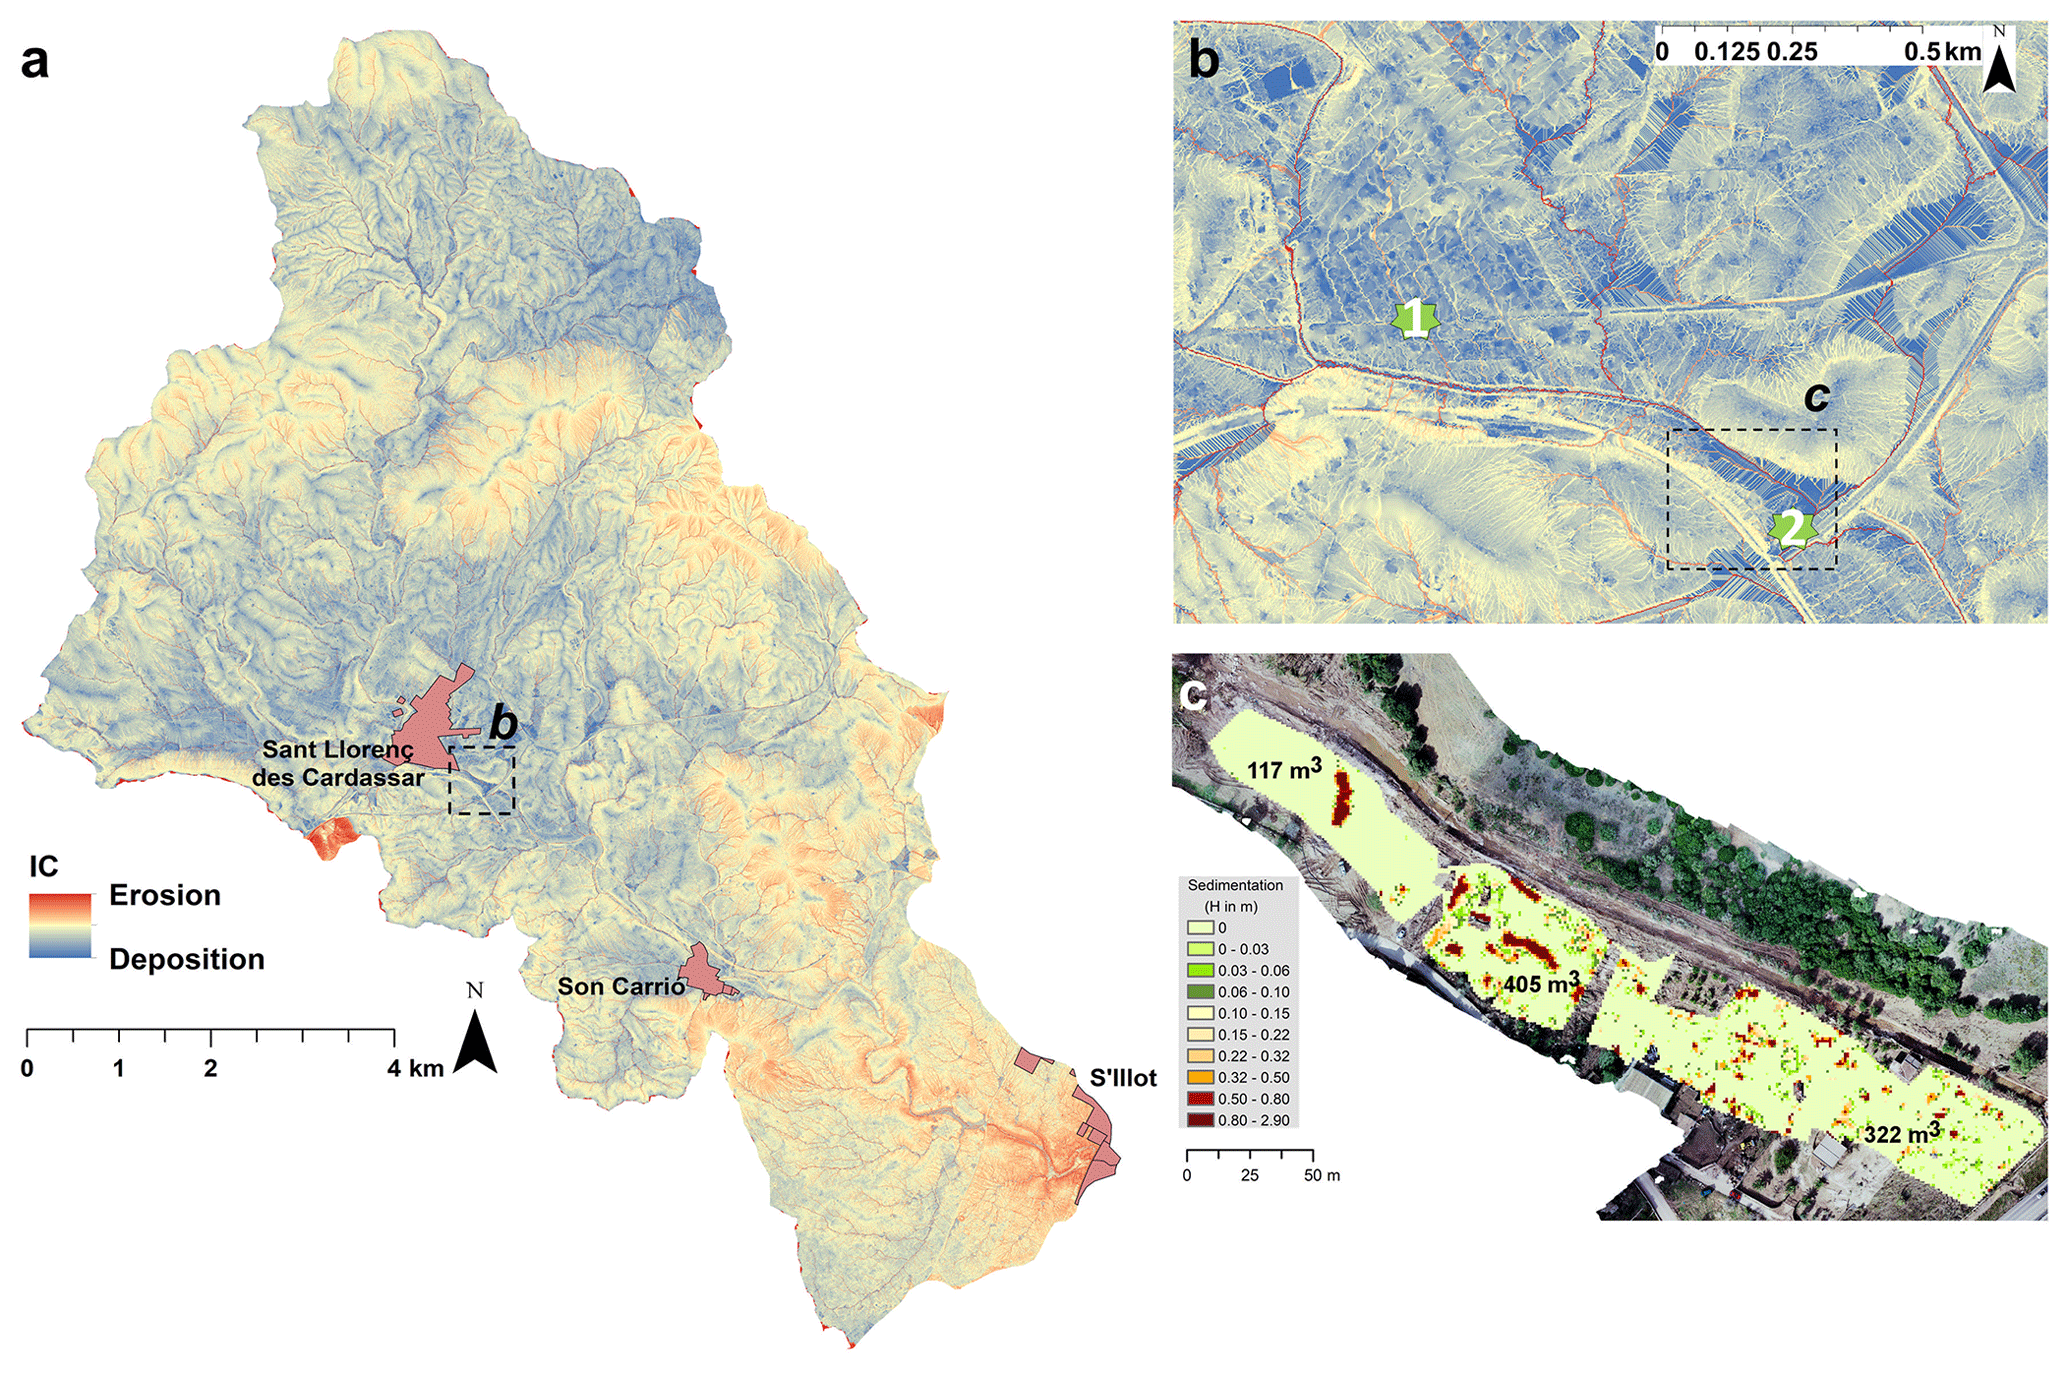
Figure 9Spatial patterns of hydrological and sediment connectivity (deposition zones in blue colours) (a) in the Ca n'Amer River basin, (b) in the southeastern part of Sant Llorenç des Cardassar with numbers indicating (1) the point where the missing person was last seen and (2) where this person was found by using this connectivity index from a 2 m resolution digital terrain model (DTM) (Instituto Geográfico Nacional, 2014). (c) Overbank sedimentation estimated after the flash flood from a DTM performed with SfM from a UAV flight (15 October 2018) in relation to the ground points of the 2014 lidar data. Background aerial orthophotography of approximately 2 cm resolution also obtained from the drone images. Numbers indicate the total volume of deposited sediments in the three areas measured.
In addition to the ability of HR-DTMs to improve sediment connectivity as a powerful tool to determine preferential flow paths and deposition areas, the present study evaluated the landform signatures of the event by using UAVs as a rapid-response tool for post-catastrophe search and rescue tasks along the whole downstream section of the Ca n'Amer River from the village of Sant Llorenç des Cardassar, in order to measure effectively the sediment deposits generated by the flash flood and to locate and quantify the most important deposition areas downstream from where the person was last seen. As the last missing person was found by using the connectivity index, in the end the sediment deposition measurement was not needed during the emergency operation. However, this study checked its validity by assessing the floodplain area where the last person was found. Accordingly, the elevations of each of the 7103 lidar points on the right bank of the Ca n'Amer River were compared. From the differences interpolated (TIN), an elevation raster for a total volume of 844.28 m3 was calculated for an area of 12 254 m2. The irregular distribution of the sediments in Fig. 9c responds to the rescue mobilisation. In the gaps visible in the sedimentation area of Fig. 9c, vehicles and search machinery were removed and not included in the volumes.
The flash-flood event described in this study fits with the monthly distribution of flash floods in Spain carried out by Gaume et al. (2009): October is the month with the highest number of this type of flood event. In addition, the hydrological characteristics of the event were comparable with the flash-flood requirements established by Amponsah et al. (2018) for inclusion in the EuroMedeFF database, which are a Qpeak unit higher than 0.5 m3 s−1 km2, a spatial extent lower than 3000 km2 and a storm duration shorter than 48 h. In this case, the Qpeak unit was 19 m3 s−1 km2 and the storm duration was 10 h. In addition, the characterisation of 60 extreme flash-flood events carried out by Marchi et al. (2010) offers a framework for comparing the event on the Begura de Salma River with other flash floods, in terms of rainfall amount, rainstorm duration, catchment area, lag time, runoff coefficient and Qpeak unit. With a rainstorm duration of 10 h and mean rainfall of 249 mm, the event is located within the flash-flood group of events with the highest rainfall intensities, which is a key factor for extreme events due to the question of the magnitude of the runoff response. This group of events consists mainly of Mediterranean and Alpine–Mediterranean catchments. The relationship between catchment area and lag time is located within the lowest flash-flood response time reported still now. The lag time of the event (2.1 h) was the lowest of extreme flash-flood events with stream gauge data reported in Marchi et al. (2010). In addition, the maximum rainfall accumulated in the whole catchment occurred at 19:00 LT (45 mm; see Table 1a), just 15 min before the Qpeak. This short response time was caused by a combination of geographic characteristics of the catchment as well as the occurrence in time and space of maximum rainfall amounts and intensities (Fig. 7), as is explained in Sect. 3.2. In addition to rainfall characteristics, other factors that play a key role in flash floods are lithology and prior wetness conditions. On the one hand, low runoff coefficients have been reported in karst areas with carbonate lithology due to high infiltration rates (Li et al., 2019). On the other hand, Marchi et al. (2010) reported differences in the median runoff coefficient up to 23 %, which were higher for flash floods occurring when prior conditions were wet. The flash-flood event of the Begura de Salma River occurred under dry preceding conditions because the rainfall amount for the 9 preceding days was only 6.4 mm in a period when evapotranspiration was still high as temperatures were quite warm (i.e. 20 ∘C). Despite these dry preceding conditions, the runoff coefficient of the event (i.e. 35 %) was analogous to the median runoff coefficient under average wetness conditions (37 %) reported by Marchi et al. (2010), rather than dry ones (20 %). This runoff response resulted from the combination of rainfall intensity and its spatial distribution, complex geology and land cover disturbances in generating a high Qpeak (i.e. 442 m3 s−1) with great potential for generating geomorphological changes. Thus, the Qpeak unit obtained (i.e. 19 m3 s−1 km2) can be classified as the third highest value of all the reported values in Marchi et al. (2010) and the highest of those values obtained from streamflow measurements in a hydrometric station and not by post-event analysis. The hydrological response analysis in the course of a flash flood shows how storm structure and evolution result in a scale-dependent flood response (Borga et al., 2007). Consequently, spatial rainfall organisation, geology combined with orography and land cover disturbances led to pronounced contrasts in the flood response at the Begura de Salma River. Spatial rainfall on the catchment scale showed that the highest accumulation at the beginning of the storm was located at the headwaters of the catchment (at 15:00 LT), whilst during the last part of the event the most important rainfall amounts were located in the downstream part. Examination of the flood response illustrated how the extent and the position of the karst terrain (Zanon et al., 2010) and soil conservation practices (Calsamiglia et al., 2018; Tarolli et al., 2014) provided major geological and anthropogenic control of runoff response. Impervious materials cover 74 % of the Begura de Salma River catchment, mostly located at the headwaters, which are responsible for the highest values of topographic torrentiality (Estrany and Grimalt, 2014), facilitating rapid overland flow generation. During the first part of the storm, when the highest rainfall amounts affected the headwaters, runoff response was delayed by the laminar effect of check-dam terraces and field terraces massively constructed over Cretaceous marls and Lias limestone, respectively (Calvo-Cases et al., 2020) and by the predominance of percolation in those areas covered by limestone, mostly in the intermediate parts of the catchment. During the last part of the event, when the highest rainfall intensities were in the downstream part, the excess of soil infiltration capacity and the collapse of headwater check-dam structures triggered the sudden increase in discharge from 120 to 442 m3 s−1 in only 15 min at the hydrometric station. Moreover, the increase of 5 km2 (21% of the catchment area; see more details in Sect. 2.1) of natural vegetation since the 1960s as a result of afforestation processes, increased fuel loads and the risk of wildfires led to 1.7 km2 (7 % of the catchment) being burned since 1980. The removal of vegetation by fires has a similar effect (less interception, less soil storage), which has been experimentally documented after major fires. These factors are a major reason why the history of the steady devastation of plant cover in the Mediterranean is likely to enhance flood risk (Wainwright and Thornes, 2004) and increase desertification tendencies.
The hydrological model was calibrated specifically for the flooding event. The parameters of the modified GR reservoir as well as the initial conditions were adjusted to best represent the flooding event. A very sensitive parameter is the HGR,threshold, which regulated the time when additional water reserve in the soil was released. Modelling results were also very sensitive to initial conditions (soil saturation) before the rainfall event. During the calibration process, it was necessary to simulate, on the one hand, smaller flood events observed at the hydrometric station. On the other hand, the model had to reproduce the historical 2018 flood event. However, the flood event could not be reproduced when the model was calculated for a long time period, due to initial conditions that were not adjusted prior to the event. In this context, the initial condition H(t0) was manually adjusted, as numerical models used to simulate catchment runoff response are often unsuccessful for Mediterranean-climate catchments due to their very heterogeneous responses over time and space (Merheb et al., 2016). The uncertainty for the results regarding the Sa Blanquera River was higher because of the lack of hydrometric data in this catchment. There was no karstic behaviour of the model within this ungauged subcatchment, which was the main modelling uncertainty for it. The model analysis clearly showed that, without any massive water storage during the first part of the rainfall event, which was released at the Qpeak of the event, it was impossible to reproduce the correct flood magnitude and the very short lag time. This water storage may be due to underground karstic volumes combined with pipes, or storage–dam break effects. Only future large flood events will enable validation of the chosen parameters, as the 2018 flood event was the only one needing a karstic component in the rainfall model to be correctly represented by the model.
The predictability of flash-flood events is unresolved, especially because forecasting of intense thunderstorms has also not been solved by operational meteorology. Even using one of the best state-of-the-art weather forecasting models, HARMONIE/AROME, the Spanish National Weather Service (AEMET) only activated a yellow warning for 1 h accumulated precipitation of 20 mm beforehand. In contrast, the synoptic situation was forecast well by global forecasting models some days before the event. An experienced forecaster could anticipate the occurrence of an intense thunderstorm by using these models but would lack any quantitative or geographical precision, which are two key factors in flash-flood forecasting. However, nowcasting products, based on radar, satellite and ground conditions may anticipate severe weather situations better. These products are updated often (several minutes to 1 h) and compensate the weather forecasting models which are updated less often. The main challenge in using the hydrological model as a flash-flood early warning system is to include correctly initial soil saturation conditions as well as accurate rainfall forecasts. For the latter, the scientific community is working on nowcasting products that typically deliver short-term (few hours lead time) rainfall forecasts that are updated very often, from a base of 10 min to an hour. These forecasts are based on real-time measurements that combine data from radar, satellites and meteorological stations. However, it is hard to calculate initial conditions automatically, as the river is dry most of the time and there are no soil moisture measurements in the catchment. Data assimilation and automatic adjustment of initial conditions, which are usually applied in operational forecasts, are therefore not relevant here. However, an early warning system can be built using the model proposed in this paper by assessing the uncertainty of the forecast. At present, Mallorca does not have any sort of early warning system to assist flood risk management and neither does Sant Llorenç des Cardassar. Similarly, no hydrometeorological early warning was issued by the competent authorities, as the Balearic Islands have no operational hydrological control network releasing real-time information on discharge. In October 2018, Sant Llorenç des Cardassar was one of the four municipalities in Mallorca with a flood risk emergency plan. However, it was not operational at the time the emergency was declared. As a result, the population was completely unaware of how to defend themselves, even during the emergency phase, although Sant Llorenç des Cardassar had significant social vulnerability to floods, as most of the casualties were tourists and the elderly.
The addition of the MEDhyCON research group on 15 October 2018 to the emergency operation brought in the application and testing of hydrogeomorphological precision techniques. The fundamentals are that flood risk plans and emergency activities are based on a thorough understanding of linkages between sediment and catchment compartments at all stages of flood events. Integrating topography-based connectivity assessment (Kalantari et al., 2017) and geomorphic change detection may be a crucial support to decision-making in flood risk planning and in emergency surveys, as this study shows. The combination of hydrological and sediment connectivity (IC in various forms) with other key natural characteristics (i.e. soil type and topography by using lidar-based HR-DTM), along with the integration of territorial information such as land cover/uses by using Cadastre databases (Piaggesi et al., 2011), results in a powerful tool. Accordingly, the easy-to-calculate IC can be an effective tool for rescue tasks after extreme flash-flood events with a huge erosion capacity.
In addition, the post-event delimitation and damage assessment released by the Copernicus EMS (Copernicus, 2018) identified approximately 90 % of the real damage in this traditional Mediterranean village, consisting of compact blocks of buildings and plots. The synthetic aperture radar (SAR) technology with very high spatial resolution (1–3 m; Plank, 2014) is fundamental to obtaining high efficiency and accuracy of this rapid mapping tool at low cost. Consequently, emergency resources can be directly concentrated on the most damaged areas without having to check the entire affected area on the ground.
The increase in the torrentiality of rainfall as a result of climate change in the Mediterranean region may exacerbate the level of exposure of urban areas and infrastructure to floods. Catastrophic events will increase in quantity and intensity. Local government bodies will need to adapt continuously prevention and management of flood risk tools to these new scenarios. The legal framework for flood risk planning and management (GOIB, 2016) showed that the level of risk exposure was extensively known. In addition, the analysis of current regulations shows that the appropriate preventive measures were being taken to minimise possible damage in a potential event in the Balearic Islands. However, the magnitude of this flash flood exceeded any type of forecast carried out by the risk and emergency plans. The consequences of the catastrophe revealed deficiencies in prevention by the local government, both at the level of urban planning and infrastructure and in risk management itself. In addition, the population was also unprepared due to a very low level of risk culture.
The hydrogeomorphological analysis and damage assessment developed in this paper has provided a comprehensive understanding of the Sant Llorenç des Cardassar flash-flood event of 9 October 2018 by means of an integrated approach with a meteorological, hydrological, geomorphological, damage and risk data analysis. The use of rainfall radar data – corrected with measurements from rainfall stations in the surrounding region – combined with Q data from stream gauge observations showed how spatiotemporal distribution of rainfall amounts and intensities, karstic features and land use/cover resulted in an unprecedented runoff response in a Mediterranean environment, triggering this natural disaster. It was shown that the application of different direct estimation approaches may reduce the uncertainty of hydrological modelling and thus increase the credibility and practical value of the whole analysis. Undoubtedly, the inclusion of streamflow monitoring data for this kind of flash-flood event proved crucial, as did accurate calibration with a two-dimensional hydraulic model also integrating the influence of bridges' obstruction in flow routing.
The flash-flood event was a catastrophe that caused 13 casualties, huge economic damage and an unprecedented mobilisation of human resources in the Balearic Islands. Rapid mapping from Copernicus EMS and detailed damage reported by regional authorities, linked to territorial information from the Cadastre and hydrogeomorphological processes, showed very accurately the damage-driving factors in the urban area of the village of Sant Llorenç des Cardassar. Although flood risk planning showed the high level of risk exposure, the disaster was generated by a very high exposure of buildings and infrastructure to floods, the absence of early warning systems with efficient action protocols and the lack of municipal regulations to instruct the population on how to act when struck by an event of this magnitude. The incorporation of hydrogeomorphological precision tools during emergency post-catastrophe operations was highly effective. Then, the simple application of a geomorphometric index from easy-access lidar-based topographic data resulted in a rapid identification of deposition zones in the different compartments of a catchment, which helped in the search and rescue of missing persons. In addition, the evaluation of landform signatures by using UAVs measured effectively the sediment deposits generated by the flash flood and/or mobilised by the emergency operations during rescue searches.
This study represents a first step to further improvement of flash-flood risk management in Mediterranean flood-prone regions such as Mallorca, which are likely to recur due to global change. Mediterranean regions are subject to violent flash floods that may intensify – especially in terms of peak discharge – in the future due to forest fire, land use and/or climate changes. These future consequences of global change should lead to the modification of hydrological and flood risk models, enabling the development of a rule-based system on the catchment scale, with adaptive and resilient measures to be taken.
The hydrological data analyzed in this paper can be freely downloaded from the PANGEA data repository; see Estrany et al. (2020a, https://doi.org/10.1594/PANGAEA.921411) and Estrany et al. (2020b, https://doi.org/10.1594/PANGAEA.921412).
The supplement related to this article is available online at: https://doi.org/10.5194/nhess-20-2195-2020-supplement.
JE, MR, RM, AC and FV developed the experimental design, whilst JE, JF and JG were responsible for data curation, fieldwork and figure elaboration, and MT carried out the meteorological analysis. BN and FV performed the hydraulic modelling. RM and XP developed the hydrological model code and performed the simulations. MR completed the damage assessment. AC performed the sediment connectivity and geomorphic change detection. Resources and funding acquisition were supervised by JE and MR. JE prepared the manuscript with contributions from all co-authors.
The authors declare that they have no conflict of interest.
Josep Fortesa has a contract funded by the Vice-presidency and Ministry of Innovation, Research and Tourism of the Autonomous Government of the Balearic Islands (FPI/2048/2017). The contribution of Miquel Tomàs-Burguera was supported by the project CGL2017-83866-C3-3-R, also funded by the AEI. Julián García-Comendador is in receipt of a pre-doctoral contract (FPU15/05239) funded by the Spanish Ministry of Education and Culture. Compensation payments were facilitated by the Spanish Insurance Compensation Consortium, whilst the type of buildings and land use at the urban plot scale were provided by the Spanish Directorate General for the Cadastre, and the damage report was by the Directorate General of Emergencies of the Balearic Islands Government. Meteorological data were facilitated by the Spanish Meteorological Agency (AEMET). We are grateful to BalearsMeteo for providing subhourly rainfall data of the event. The authors want to thank Xurxo Gago, Carlos J. Oliveros, José A. López-Tarazón and Hassan Ouakhir for their assistance during fieldwork. Finally, we want to pay tribute to all the professionals and volunteers who worked with such determination in the rescue tasks.
This research was supported by the Spanish Ministry of Science, Innovation and Universities, the Spanish Agency of Research (AEI) and the European Regional Development Fund (ERDF) through the project CGL2017-88200-R “Functional hydrological and sediment connectivity at Mediterranean catchments: global change scenarios -MEDhyCON2”.
This paper was edited by Kai Schröter and reviewed by two anonymous referees.
Adamovic, M., Branger, F., Braud, I., and Kralisch, S.: Development of a data-driven semi-distributed hydrological model for regional scale catchments prone to Mediterranean flash floods, J. Hydrol., 541, 173–189, https://doi.org/10.1016/j.jhydrol.2016.03.032, 2016.
Agisoft Lens: Agisoft PhotoScan User Manual. Professional Edition, Version 1.4, available at: https://www.agisoft.com/pdf/photoscan-pro_1_4_en.pdf (last access: 12 September 2019), 2018.
Ajuntament de Sant Llorenç des Cardassar: Minutes of the Plenary Session of Sant Llorenç des Cardassar City Council, Sant Llorenç des Cardassar, available at: https://ovac.santllorenc.es/absis/idi/arx/idiarxabsaweb/catala/asp/dlgVisor.asp?codigoVerificacion=176102aec9d248aab3b72deaad1e0beb001 (last access: 15 May 2020), 2018.
Alfieri, L., Berenguer, M., Knechtl, V., Liechti, K., Sempere-Torres, D., and Zappa, M.: Flash Flood Forecasting Based on Rainfall Thresholds, in Handbook of Hydrometeorological Ensemble Forecasting, edited by: Duan, Q., Pappenberger, F., Wood, A., Cloke, H. L., and Schaake, J. C., 1–38, Springer, 2015.
Álvaro, M., Del Olmo, P., and Anglada, E.: Mapa Geológico de España, 1:50 000, Hoja 700 (MANACOR), Madrid, available at: http://info.igme.es/cartografiadigital/datos/magna50/pdfs/d7_G50/Magna50_700.pdf (last access: 30 July 2020), 1991.
Amirebrahimi, S., Rajabifard, A., Mendis, P., and Ngo, T.: A framework for a microscale flood damage assessment and visualization for a building using BIM–GIS integration, Int. J. Digit. Earth, 9, 363–386, https://doi.org/10.1080/17538947.2015.1034201, 2016.
Amponsah, W., Marchi, L., Zoccatelli, D., Boni, G., Cavalli, M., Comiti, F., Crema, S., Lucía, A., Marra, F., and Borga, M.: Hydrometeorological Characterization of a Flash Flood Associated with Major Geomorphic Effects: Assessment of Peak Discharge Uncertainties and Analysis of the Runoff Response, J. Hydrometeorol., 17, 3063–3077, https://doi.org/10.1175/JHM-D-16-0081.1, 2016.
Amponsah, W., Ayral, P.-A., Boudevillain, B., Bouvier, C., Braud, I., Brunet, P., Delrieu, G., Didon-Lescot, J.-F., Gaume, E., Lebouc, L., Marchi, L., Marra, F., Morin, E., Nord, G., Payrastre, O., Zoccatelli, D., and Borga, M.: Integrated high-resolution dataset of high-intensity European and Mediterranean flash floods, Earth Syst. Sci. Data, 10, 1783–1794, https://doi.org/10.5194/essd-10-1783-2018, 2018.
Artinyan, E., Vincendon, B., Kroumova, K., Nedkov, N., Tsarev, P., Balabanova, S., and Koshinchanov, G.: Flood forecasting and alert system for Arda River basin, J. Hydrol., 541, 457–470, https://doi.org/10.1016/j.jhydrol.2016.02.059, 2016.
Barbosa, S., Silva, Á., and Narciso, P.: Analysis of the 1 November 2015 heavy rainfall episode in Algarve by using weather radar and rain gauge data, Nat. Hazards, 93, 61–76, https://doi.org/10.1007/s11069-017-3065-2, 2018.
Barredo, J. I.: Major flood disasters in Europe: 1950–2005, Nat. Hazards, 42, 125–148, https://doi.org/10.1007/s11069-006-9065-2, 2007.
BOE: Boletín Oficial del Estado (BOE No. 283) (23/11/2018). Decreto-ley 2/2018, de 18 de octubre, por el que se establecen ayudas y otras medidas urgentes para reparar las pérdidas y los daños producidos por las lluvias intensas y las inundaciones del día 9 de, Spain, available at: https://www.boe.es/boe/dias/2018/11/23/pdfs/BOE-A-2018-15970.pdf (last access: 15 May 2020), 2018.
BOE: Boletín Oficial del Estado (BOE, No. 12) (26/01/2019), Real Decreto Ley 2/2019 de 25 de enero, por el que se adoptan medidas urgentes para paliar los daños causados por temporales y otras situaciones catastróficas, Spain, 2019.
Borga, M., Boscolo, P., Zanon, F., and Sangati, M.: Hydrometeorological Analysis of the 29 August 2003 Flash Flood in the Eastern Italian Alps, J. Hydrometeorol., 8, 1049–1067, https://doi.org/10.1175/jhm593.1, 2007.
Borga, M., Gaume, E., Creutin, J. D., and Marchi, L.: Surveying flash floods: gauging the ungauged extremes, Hydrol. Process., 22, 3883–3885, https://doi.org/10.1002/hyp.7111, 2008.
Borselli, L., Cassi, P., and Torri, D.: Prolegomena to sediment and flow connectivity in the landscape: A GIS and field numerical assessment, CATENA, 75, 268–277, https://doi.org/10.1016/j.catena.2008.07.006, 2008.
Braud, I., Ayral, P.-A., Bouvier, C., Branger, F., Delrieu, G., Le Coz, J., Nord, G., Vandervaere, J.-P., Anquetin, S., Adamovic, M., Andrieu, J., Batiot, C., Boudevillain, B., Brunet, P., Carreau, J., Confoland, A., Didon-Lescot, J.-F., Domergue, J.-M., Douvinet, J., Dramais, G., Freydier, R., Gérard, S., Huza, J., Leblois, E., Le Bourgeois, O., Le Boursicaud, R., Marchand, P., Martin, P., Nottale, L., Patris, N., Renard, B., Seidel, J.-L., Taupin, J.-D., Vannier, O., Vincendon, B., and Wijbrans, A.: Multi-scale hydrometeorological observation and modelling for flash flood understanding, Hydrol. Earth Syst. Sci., 18, 3733–3761, https://doi.org/10.5194/hess-18-3733-2014, 2014.
Calsamiglia, A., García-Comendador, J., Fortesa, J., López-Tarazón, J. A., Crema, S., Cavalli, M., Calvo-Cases, A., and Estrany, J.: Effects of agricultural drainage systems on sediment connectivity in a small Mediterranean lowland catchment, Geomorphology, 318, 162–171, https://doi.org/10.1016/j.geomorph.2018.06.011, 2018.
Calvo-Cases, A., Gago, J., Ruiz-Pérez, M., García-Comendador, J., Fortesa, J., Company, J., Nácher-Rodríguez, B., Vallés-Morán, F. J., and Estrany, J.: Spatial distribution of geomorphic changes after an extreme flash-flood compared with hydrological and sediment connectivity, in European Geosciences Uninon General Assembly 2020, Copernicus Publications, 2020.
Cassola, F., Ferrari, F., Mazzino, A., and Miglietta, M. M.: The role of the sea on the flash floods events over Liguria (northwestern Italy), Geophys. Res. Lett., 43, 3534–3542, https://doi.org/10.1002/2016GL068265, 2016.
Cavalli, M., Trevisani, S., Comiti, F., and Marchi, L.: Geomorphometric assessment of spatial sediment connectivity in small Alpine catchments, Geomorphology, 188, 31–41, https://doi.org/10.1016/j.geomorph.2012.05.007, 2013.
CCS: Estudio Siniestralidades 2018, Inundación extraordinaria Mallorca: Sant Llorenç des Cardassar. Consorcio de Compensación de Seguros. Ministerio de Economía y Empresa. Gobierno de España, available at: https://www.consorseguros.es/web/inicio (last access: 15 May 2020), 2018.
Chapon, B., Delrieu, G., Gosset, M., and Boudevillain, B.: Variability of rain drop size distribution and its effect on the Z–R relationship: A case study for intense Mediterranean rainfall, Atmos. Res., 87, 52–65, https://doi.org/10.1016/j.atmosres.2007.07.003, 2008.
Collier, C. G.: Flash flood forecasting: What are the limits of predictability?, Q. J. Roy. Meteor. Soc., 133, 3–23, https://doi.org/10.1002/qj.29, 2007.
Copernicus Emergency Management Service: [EMSR323] Flood in Balearic Island, Spain, available at: https://emergency.copernicus.eu/mapping/list-of-components/EMSR323 (last access: 15 May 2020), 2018.
Copernicus Emergency Management Service: Directorate Space, Security and Migration, European Commission Joint Research Centre, available at: https://emergency.copernicus.eu/ (last access: 14 August 2019), 2019.
Corine Land Cover: Copernicus Land Monitoring Service, available at: https://land.copernicus.eu/pan-european/corine-land-cover/clc2018 (last access: 15 May 2020), 2018.
Crema, S. and Cavalli, M.: SedInConnect: a stand-alone, free and open source tool for the assessment of sediment connectivity, Comput. Geosci., 111, 39–45, https://doi.org/10.1016/j.cageo.2017.10.009, 2018.
Defossez, S. and Leone, F.: Assessing Vulnerability to Flooding: Progress and Limitations, Floods, 241–257, https://doi.org/10.1016/B978-1-78548-268-7.50014-6, 2017.
Duo, E., Trembanis, A. C., Dohner, S., Grottoli, E., and Ciavola, P.: Local-scale post-event assessments with GPS and UAV-based quick-response surveys: a pilot case from the Emilia–Romagna (Italy) coast, Nat. Hazards Earth Syst. Sci., 18, 2969–2989, https://doi.org/10.5194/nhess-18-2969-2018, 2018.
ESRI: Arc Hydro Tools, available at: https://www.esri.com/en-us/home (last access: 15 May 2020), 2019.
Estrany, J. and Grimalt, M.: Catchment controls and human disturbances on the geomorphology of small Mediterranean estuarine systems, Estuar. Coast. Shelf Sci., 150, 1–12, https://doi.org/10.1016/j.ecss.2014.03.021, 2014.
Estrany, J., Garcia, C., and Batalla, R. J.: Groundwater control on the suspended sediment load in the Na Borges River, Mallorca, Spain, Geomorphology, 106, 292–303, https://doi.org/10.1016/J.GEOMORPH.2008.11.008, 2009.
Estrany, J., Ruiz, M., Calsamiglia, A., Carriquí, M., García-Comendador, J., Nadal, M., Fortesa, J., López-Tarazón, J. A., Medrano, H., and Gago, J.: Sediment connectivity linked to vegetation using UAVs: High-resolution imagery for ecosystem management, Sci. Total Environ., 671, 1192–1205, https://doi.org/10.1016/j.scitotenv.2019.03.399, 2019.
Estrany, J., Ruiz-Pérez, M., Mutzner, R., Fortesa, J., Nácher-Rodríguez, B., Tomàs-Burguera, M., García-Comendador, J., Peña, X., Calvo-Cases, A., and Vallés-Morán, F. J.: Discharge data series of Begura de Salma River (Mallorca, Spain): January 2015–October 2018, PANGAEA, https://doi.org/10.1594/PANGAEA.921411 2020a.
Estrany, J., Ruiz-Pérez, M., Mutzner, R., Fortesa, J., Nácher-Rodríguez, B., Tomàs-Burguera, M., García-Comendador, J., Peña, X., Calvo-Cases, A., and Vallés-Morán, F. J.: Monthly precipitation and runoff series of Begura de Salma River (Mallorca, Spain): January 2015–October 2018, PANGAEA, https://doi.org/10.1594/PANGAEA.921412, 2020b.
Fortesa, J., García-Comendador, J., Calsamiglia, A., López-Tarazón, J. A., Latron, J., Alorda, B., and Estrany, J.: Comparison of stage/discharge rating curves derived from different recording systems: Consequences for streamflow data and water management in a Mediterranean island, Sci. Total Environ., 665, 968–981, https://doi.org/10.1016/j.scitotenv.2019.02.158, 2019.
Fulton, R. A., Breidenbach, J. P., Seo, D.-J., Miller, D. A., and O'Bannon, T.: The WSR-88D Rainfall Algorithm, https://doi.org/10.1175/1520-0434(1998)013<0377:TWRA>2.0.CO;2, 1998.
García-Hernández, J., Jordan, J., Dubois, J., Boillat, J., and Schleiss, A.: Routing System II: Flow modelling in hydraulic systems, Communication, 32, 1661–1179, 2007.
Gaume, E., Bain, V., Bernardara, P., Newinger, O., Barbuc, M., Bateman, A., Blaškovičová, L., Blöschl, G., Borga, M., Dumitrescu, A., Daliakopoulos, I., Garcia, J., Irimescu, A., Kohnova, S., Koutroulis, A., Marchi, L., Matreata, S., Medina, V., Preciso, E., Sempere-Torres, D., Stancalie, G., Szolgay, J., Tsanis, I., Velasco, D., and Viglione, A.: A compilation of data on European flash floods, J. Hydrol., 367, 70–78, https://doi.org/10.1016/J.JHYDROL.2008.12.028, 2009.
Gaume, E., Borga, M., Llasat, M. C., Maouche, S., Lang, M., and Diakakis, M.: Mediterranean extreme floods and flash floods, in The Mediterranean Region under Climate Change. A Scientific Update, edited by: French National Alliance for Environmental Research – ALLENVI, 133–144, available at: https://hal.archives-ouvertes.fr/hal-01465740v2/document (last access: 15 May 2020), 2016.
Georgakakos, K. P.: On the Design of National, Real-Time Warning Systems with Capability for Site-Specific, Flash-Flood Forecasts, B. Am. Meteorol. Soc., 67, 1233–1239, https://doi.org/10.1175/1520-0477(1986)067<1233:OTDONR>2.0.CO;2, 1986.
Germann, U. and Joss, J.: Operational Measurement of Precipitation in Mountainous Terrain, Springer, Berlin, Heidelberg, 52–77, 2004.
GOIB: Mapas de peligrosidad y riesgo de inundación en la demarcación hidrográfica de Baleares. Conselleria de Medi Ambient, Agricultura i Pesca-Direcció General de Recursos Hídrics, available at: https://www.caib.es/sites/aigua/es/plan_de_ gestion_ del_riesgo_ de_ inundacion_de_ la_ demarcacion_hidrografica_ de_ las_islas_ baleares/ (last access: 15 May 2020), 2016.
GOIB: Boletín Oficial de las Islas Baleares (BOIB No. 130) (18/10/2018), Decreto-ley 2/2018, de 18 de octubre, por el que se establecen ayudas y otras medidas urgentes para reparar las pérdidas y los daños producidos por las lluvias intensas y las inundaciones, available at: http://www.caib.es/eboibfront/pdf/ca/2018/130/101958 (last access: 15 May 2020), 2018.
GOIB: El Govern ja ha abonat 30,4 milions d'euros en ajuts i actuacions de preparació de danys produïts per les inundacions del Llevant, English version: The Balearic Government has already paid 30.4 million euros in aid and actions for the damage caused by the floods in the Llevant county, available at: https://www.caib.es/pidip2front/jsp/ca/fitxa-convocatoria/strongel-govern-ja-ha-abonat-304-milions-drsquoeuros-en-ajuts-i-actuacions-de-reparacioacute-de-danys-produiumlts-per-les-inundacions-del-llevantstrongnbsp (last access: 15 May 2020), 2019.
Gourley, J. J., Giangrande, S. E., Hong, Y., Flamig, Z. L., Schuur, T., and Vrugt, J. A.: Impacts of Polarimetric Radar Observations on Hydrologic Simulation, J. Hydrometeorol., 11, 781–796, https://doi.org/10.1175/2010JHM1218.1, 2010.
Guijarro, J. A.: Contribución a la Bioclimatología de Baleares, Universitat de les Illes Balears, PhD thesis, available at: http://hdl.handle.net/20.500.11765/5369 (last access: 30 July 2020), 1986.
Hardy, J., Gourley, J., Kirstetter, P., Hong, Y., Kong, F., and Flamig, Z.: A method for probabilistic flash flood forecasting, J. Hydrol., 541, 480–494 2016.
Harrison, D., Driscoll, S., and Kitchen, M.: Improving precipitation estimates from weather radar using quality control and correction techniques, Meteorol. Appl., 7, 135–144, doi:https://doi.org/10.1017/S1350482700001468, 2000.
Instituto Geográfico Nacional: Digital Terrain Model for Spain obtained from lidar flights, available at: http://centrodedescargas.cnig.es/CentroDescargas/locale?request_locale=en (last access: 15 May 2020), 2014.
Jordan, F.: Modèle de prévision et de gestion des crues-optimisation des opérations des aménagements hydroélectriques à accumulation pour la réduction des débits de crue, Laboratory of Hydraulic Construction, Ecole Polytechnique Fédérale de Lausanne, Lausanne, 2007.
Kalantari, Z., Cavalli, M., Cantone, C., Crema, S., and Destouni, G.: Flood probability quantification for road infrastructure: Data-driven spatial-statistical approach and case study applications, Sci. Total Environ., 581–582, 386–398, https://doi.org/10.1016/J.SCITOTENV.2016.12.147, 2017.
Langhammer, J. and Vacková, T.: Detection and Mapping of the Geomorphic Effects of Flooding Using UAV Photogrammetry, Pure Appl. Geophys., 175, 3223–3245, https://doi.org/10.1007/s00024-018-1874-1, 2018.
Laudan, J., Rözer, V., Sieg, T., Vogel, K., and Thieken, A. H.: Damage assessment in Braunsbach 2016: data collection and analysis for an improved understanding of damaging processes during flash floods, Nat. Hazards Earth Syst. Sci., 17, 2163–2179, https://doi.org/10.5194/nhess-17-2163-2017, 2017.
Li, Z., Xu, X., Zhu, J., Xu, C., and Wang, K.: Effects of lithology and geomorphology on sediment yield in karst mountainous catchments, Geomorphology, 343, 119–128, https://doi.org/10.1016/j.geomorph.2019.07.001, 2019.
Llasat, M. C., Llasat-Botija, M., Petrucci, O., Pasqua, A. A., Rosselló, J., Vinet, F., and Boissier, L.: Towards a database on societal impact of Mediterranean floods within the framework of the HYMEX project, Nat. Hazards Earth Syst. Sci., 13, 1337–1350, https://doi.org/10.5194/nhess-13-1337-2013, 2013.
Lorenzo-Lacruz, J., Amengual, A., Garcia, C., Morán-Tejeda, E., Homar, V., Maimó-Far, A., Hermoso, A., Ramis, C., and Romero, R.: Hydro-meteorological reconstruction and geomorphological impact assessment of the October 2018 catastrophic flash flood at Sant Llorenç, Mallorca (Spain), Nat. Hazards Earth Syst. Sci., 19, 2597–2617, https://doi.org/10.5194/nhess-19-2597-2019, 2019.
Lowe, D.: Distinctive Image Features from Scale-Invariant Keypoints, Vancouver, available at: https://robo.fish/wiki/images/5/58/Image_Features_ From_ Scale_Invariant_ Keypoints_ Lowe_2004.pdf (last access: 11 September 2019), 2004.
Marchi, L., Borga, M., Preciso, E., and Gaume, E.: Characterisation of selected extreme flash floods in Europe and implications for flood risk management, J. Hydrol., 394, 118–133, https://doi.org/10.1016/j.jhydrol.2010.07.017, 2010.
Marshall, J. S. and Palmer, W. M. K.: The distribution of raindrops with size, J. Meteorol., 5, 165–166, https://doi.org/10.1175/1520-0469(1948)005<0165:TDORWS>2.0.CO;2, 1948.
Merheb, M., Moussa, R., Abdallah, C., Colin, F., Perrin, C., and Baghdadi, N.: Hydrological response characteristics of Mediterranean catchments at different time scales: a meta-analysis, Hydrolog. Sci. J., 61, 2520–2539, https://doi.org/10.1080/02626667.2016.1140174, 2016.
Miao, Q., Yang, D., Yang, H., and Li, Z.: Establishing a rainfall threshold for flash flood warnings in China's mountainous areas based on a distributed hydrological model, J. Hydrol., 541, 371–386, https://doi.org/10.1016/j.jhydrol.2016.04.054, 2016.
Nguyen, P., Thorstensen, A., Sorooshian, S., Hsu, K., AghaKouchak, A., Sanders, B., Koren, V., Cui, Z., and Smith, M.: A high resolution coupled hydrologic–hydraulic model (HiResFlood-UCI) for flash flood modeling, J. Hydrol., 541, 401–420, https://doi.org/10.1016/j.jhydrol.2015.10.047, 2016.
Petrus, J. M., Ruiz, M., and Estrany, J.: Interactions between Geomorphology and Urban Evolution since Neolithic Times in a Mediterranean City, in: Urban Geomorphology, Landforms and Processes in Cities, edited by: Thornbush, M. J. and Allen, C. D., 9–35, https://doi.org/10.1016/B978-0-12-811951-8.00002-3, 2018.
Piaggesi, D., Sund, K. J., and Castelnovo, W.: Global strategy and practice of e-governance?: examples from around the world, Information Science Reference, available at: https://www.igi-global.com/book/global-strategy-practice-governance/46168 (last access: 30 July 2020), 2011.
Plank, S.: Rapid Damage Assessment by Means of Multi-Temporal SAR – A Comprehensive Review and Outlook to Sentinel-1, Remote Sens., 6, 4870–4906, https://doi.org/10.3390/rs6064870, 2014.
PNOA: Plan Nacional de Ortofotografía Aérea, Instituto Geográfico Nacional, Ministerio de Fomento, Gobierno de España, available at: https://pnoa.ign.es/productos_lidar (last access: 15 May 2020), 2015.
Pol, J.: Informe INUNBAL Llevant Mallorca 2018, ISO 271/2018, available at: http://www.caib.es/pidip2front/jsp/adjunto?codi=2243620&idioma=ca (last access: 30 July 2020), Marratxí, 2019a.
Pol, J.: Predicción y Gestión de Emergencias por Inundaciones, in: International Seminar of Planning and Management of Flood Risks in Mediterranean Environments, INAGEA, University of the Balearic Islands, Palma, 2019b.
Pons Esteva, A.: Evolució dels usos del sòl a les illes Balears, 1956–2000, Territoris, 4, 129–145, 2003.
Schaefli, B., Hingray, B., Niggli, M., and Musy, A.: A conceptual glacio-hydrological model for high mountainous catchments, Hydrol. Earth Syst. Sci., 9, 95–109, https://doi.org/10.5194/hess-9-95-2005, 2005.
Segura-Beltrán, F., Sanchis-Ibor, C., Morales-Hernández, M., González-Sanchis, M., Bussi, G., and Ortiz, E.: Using post-flood surveys and geomorphologic mapping to evaluate hydrological and hydraulic models: The flash flood of the Girona River (Spain) in 2007, J. Hydrol., 541, 310–329, https://doi.org/10.1016/J.JHYDROL.2016.04.039, 2016.
Seo, B. C., Krajewski, W. F., and Qi, Y.: Utility of Vertically Integrated Liquid Water Content for Radar-Rainfall Estimation: Quality Control and Precipitation Type Classification, Atmos. Res., 236, 104800, https://doi.org/10.1016/j.atmosres.2019.104800, 2020.
Shepard, D.: A two-dimensional interpolation function for irregularly-spaced data, in Proceedings of the 1968 23rd ACM national conference, 517–524, available at: http://citeseerx.ist.psu.edu/viewdoc/download?doi=10.1.1.154.6880&rep=rep1&type=pdf (last access: 11 September 2019), 1968.
Sofia, G. and Nikolopoulos, E. I.: Floods and rivers?: a circular causality perspective, Nat. Sci. Rep., 10, 1–17, https://doi.org/10.1038/s41598-020-61533-x, 2020.
Strahler, A. N.: Quantitative geomorphology of drainage basins and channel networks, in: Handbook of Applied Hydrology, edited by: Chow, V. T., McGraw-Hill, New York, New York, 4-39–4-76, 1964.
Tarolli, P., Preti, F., and Romano, N.: Terraced landscapes: From an old best practice to a potential hazard for soil degradation due to land abandonment, Anthropocene, 6, 10–25, https://doi.org/10.1016/j.ancene.2014.03.002, 2014.
Trevisani, S. and Cavalli, M.: Topography-based flow-directional roughness: potential and challenges, Earth Surf. Dynam., 4, 343–358, https://doi.org/10.5194/esurf-4-343-2016, 2016.
Vannier, O., Anquetin, S., and Braud, I.: Investigating the role of geology in the hydrological response of Mediterranean catchments prone to flash-floods: Regional modelling study and process understanding, J. Hydrol., 541, 158–172, https://doi.org/10.1016/J.JHYDROL.2016.04.001, 2016.
Versini, P.-A., Velasco, M., Cabello, A., and Sempere-Torres, D.: Hydrological impact of forest fires and climate change in a Mediterranean basin, Nat. Hazards, 66, 609–628, https://doi.org/10.1007/s11069-012-0503-z, 2013.
Wainwright, J. and Thornes, J. B.: Environmental issues in the Mediterranean. Processes and perspectives from the past and present, 1st ed., Routledge, Routledge, London, 2004.
Westoby, M. J., Brasington, J., Glasser, N. F., Hambrey, M. J., and Reynolds, J. M.: `Structure-from-Motion' photogrammetry: A low-cost, effective tool for geoscience applications, Geomorphology, 179, 300–314, https://doi.org/10.1016/j.geomorph.2012.08.021, 2012.
Wohl, E., Brierley, G., Cadol, D., Coulthard, T. J., Covino, T., Fryirs, K. A., Grant, G., Hilton, R. G., Lane, S. N., Magilligan, F. J., Meitzen, K. M., Passalacqua, P., Poeppl, R. E., Rathburn, S. L., and Sklar, L. S.: Connectivity as an emergent property of geomorphic systems, Earth Surf. Proc. Land., 44, 4–26, https://doi.org/10.1002/esp.4434, 2019.
YACU: Estudio de caracterización del régimen extremo de precipitaciones en la isla de Mallorca, Junta d'Aigües de les Illes Balears, available at: http://observatoriaigua.uib.es/repositori/tp_precipitacion_2002.pdf (last access: 30 July 2020), Palma de Mallorca, 2003.
Zanon, F., Borga, M., Zoccatelli, D., Marchi, L., Gaume, E., Bonnifait, L., and Delrieu, G.: Hydrological analysis of a flash flood across a climatic and geologic gradient: The September 18, 2007 event in Western Slovenia, J. Hydrol., 394, 182–197, https://doi.org/10.1016/j.jhydrol.2010.08.020, 2010.