the Creative Commons Attribution 4.0 License.
the Creative Commons Attribution 4.0 License.
 | 02 Jul 2020
Spatiotemporal changes of heat waves and extreme temperatures in the main cities of China from 1955 to 2014
Kuo Li
Gyilbag Amatus
In the past decades, severe heat waves have frequently occurred in many parts of the world. These conspicuous heat waves exerted terrible influences on human health, society, the economy, agriculture, the ecosystem and so on. Based on observed daily temperatures in China, an integrated index of heat waves and extreme-temperature days was established involving the frequency, duration, intensity and scale of these events across large cities in China. Heat waves and extreme-temperature days showed an increasing trend in most regions except northwest China from 1955 to 2014. After the late 1980s, the increasing trend was more obvious than the decades before. The cities in the middle and lower reaches of the Yangtze River were threatened by the most serious heat events in the past 60 years, especially Chongqing and Changsha. Due to the subtropical monsoon climate and special terrain, Chongqing experienced the most heat events in a long period of time. In particular, there was obvious fluctuation of hot years in 31 cities, which did not continuously rise with global warming; 21 cities mainly located in the eastern and southern regions of China had an obvious rising trend; eight cities had a clear declining trend which was mainly distributed in the western and northern regions of China; and there were no extreme-temperature days in Kunming and Lhasa in the past 60 years. The study revealed an obvious differentiation of heat events for 31 cities under climate change; heat threat in most cities is increasing but declining or remaining unchanged in the other cities. The trend is likely to intensify with global warming.
- Article
(2963 KB) - Full-text XML
- BibTeX
- EndNote


In the past 100 years, global warming has been an apparent physical phenomenon in the whole world (Stocker et al., 2013). Extreme events (heat waves, flood, drought, typhoon) frequently break out in many parts of the world and exert huge effects on agriculture, society, human health and the ecosystem (Alexander et al., 2006; Diffenbaugh et al., 2016; Coumou and Rahmstorf, 2012). In the past decade, heat waves (HWs) engulfed many countries worldwide, impacting negatively on the whole population, especially the elderly and children (Horton et al., 2015; Liu et al., 2012; Angélil et al., 2017; Peterson et al., 2013); for example, in 2003, the European continent experienced an extraordinary HW which was characterized by excessive long duration, unprecedented extreme temperature and a vast spatial scale. This devastating HW took a heavy toll on human lives (at least 50 000 deaths) (Stott et al., 2004; Robine et al., 2008). In 2013, a similar HW was experienced in most parts of China with increased intensity and duration, resulting in significant economic loss (Sun et al., 2014).
A concrete definition and exact assessment of HW have become the main obstacles in developing mitigation and adaptation measures (Hajat et al., 2006; Perkins and Alexander, 2013). A HW is usually defined as an event that exceeds prescribed temperature thresholds over a few days (Robinson, 2001). Precise definitions are given in literature which pays attention to different features of HWs (Bonsal et al., 2001; Klein Tank and Können, 2003; Jones et al., 2015). Climate scientists attach greater importance to how to evaluate the intensity and frequency of HWs; disaster scientists pay more attention to the vulnerability evaluation and risk assessment of HWs; sociologists mainly focus on the human health impact of HWs, attempting to estimate the probable heat-related mortality and morbidity of people. In addition, there are many researchers who focus on the impact of HWs on agriculture, water resources, forestry, the ecosystem and other sectors (Dike et al., 2015; Johnson et al., 2009; Dong et al., 2015; Buscail et al., 2012). On the whole, there are two research trends for HWs: one is about the characteristic analysis of HWs, and the other is about the impact assessment and consequence analysis of HWs. The feature analysis of HWs is the basis for impact assessment on different sectors (Liang et al., 2014; Fouillet et al., 2006). But the realities of HWs on different continents are distinctive, so the definitions and thresholds of HWs are debatable for researchers.
In Canada and the USA, the HW threshold is 40.5∘; when the time is more than 3 h accumulated in 2 d in which the temperature is over 40.5∘, a HW could be confirmed. The other threshold of HW is 46.5∘, where for any amount of time in a day a HW would be confirmed (Oswald and Rood, 2014). In the Netherlands, the HW refers to a period of at least 5 d in which the extreme maximum temperature (Tmax) on each day exceeds 25∘. In the meantime, the Tmax exceeds 30∘ on at least 3 d of the above period (Uhe et al., 2016). For the World Meteorological Organization (WMO), the threshold of HW is 32∘, which should be exceeded on at least 3 d (Klein Tank et al., 2009). In China, a HW usually refers to a period of at least 3 d when the extreme maximum temperature (Tmax) on each day exceeds 35∘ (Liu et al., 2017; Chen and Li, 2017). In China, the early warnings of HWs are gradually advanced with the intensity levels of HWs: when Tmax exceeds 35∘, the local meteorological departments would issue a yellow warning; when Tmax exceeds 37∘, the local meteorological departments would issue an orange warning; when Tmax exceeds 40∘, the local meteorological departments would issue a red warning. In a comprehensive view, the thresholds of HW in different regions depend on the local climate conditions.
Unlike the US and Europe, HW assessment in China is primarily focused on occurrence frequencies of individual warm days with extreme temperatures (Huang et al., 2010; Zhang et al., 2005). The basic features of other equally important aspects for HWs, such as duration and intensity, are less emphasized (Li et al., 2010). Some recent studies in the US and Europe began to separately assess diverse HW types (Gasparrini et al., 2015; Easterling et al., 2016), in which the temperature variable (Tmax or Tmin) was delimited into different categorizations, but few studies have been able to integrate the different features of HWs for a holistic assessment. An integrated index is therefore desirable for systematic and quantitative evaluation of HWs in China, and it should include multiple indicators – frequency, duration, intensity and so on. Moreover, the current definition of HWs in China only considers the thresholds of Tmax, which is not enough for the precise assessment of HWs. For example, it is hard to evaluate the exact difference between a HW event (exceeding 35∘, 5 d) and the other HW event (exceeding 40∘, 3 d). For both scientific literature and operational practices in China, this just shows the qualitative situation of scorching conditions, which would not easily give policy-makers and the general public a clear picture of HWs for efficient precautions. As such, a more quantitative and precise evaluation should be done to distinguish different impacts of HWs, such as adverse effects on human health, water resource supply burden, forest fires and ecology degeneration, among others.
This study therefore aims at building an integrated index of HWs and extreme-temperature days. It would compare the observed basic features of HWs and extreme-temperature events in the typical 31 cities of China during 1951–2014 and reveal the change trends of HWs and extreme-temperature events in mainland China under climate change. Spatial distribution of HWs and extreme-temperature days in the past 60 years in different cities would be estimated and mapped. The integrated index of HWs and extreme-temperature events would provide an efficient tool for risk assessment of heat events under future climate change scenarios and support for further physical interpretation and attribution of HWs.
2.1 Data
Data from the National Meteorological Information Center (NMIC) of the China Meteorological Administration (CMA), which is the first and most authoritative national homogenized temperature data set in China, were used. A database from 31 capital cities in all the provinces of China with historical daily temperature data from 1951 to 2014 was used, except Taiwan, Hong Kong and Macau. At some stations the daily data were missing, especially in the years prior to 1955. In order to ensure consistency of temperature extremes and efficiency of the entire study, missing data up to 2 % of the data points at each station in more than 50 years were rejected. The data of 31 stations over the period from 1955 to 2014 were ultimately selected for analysis.
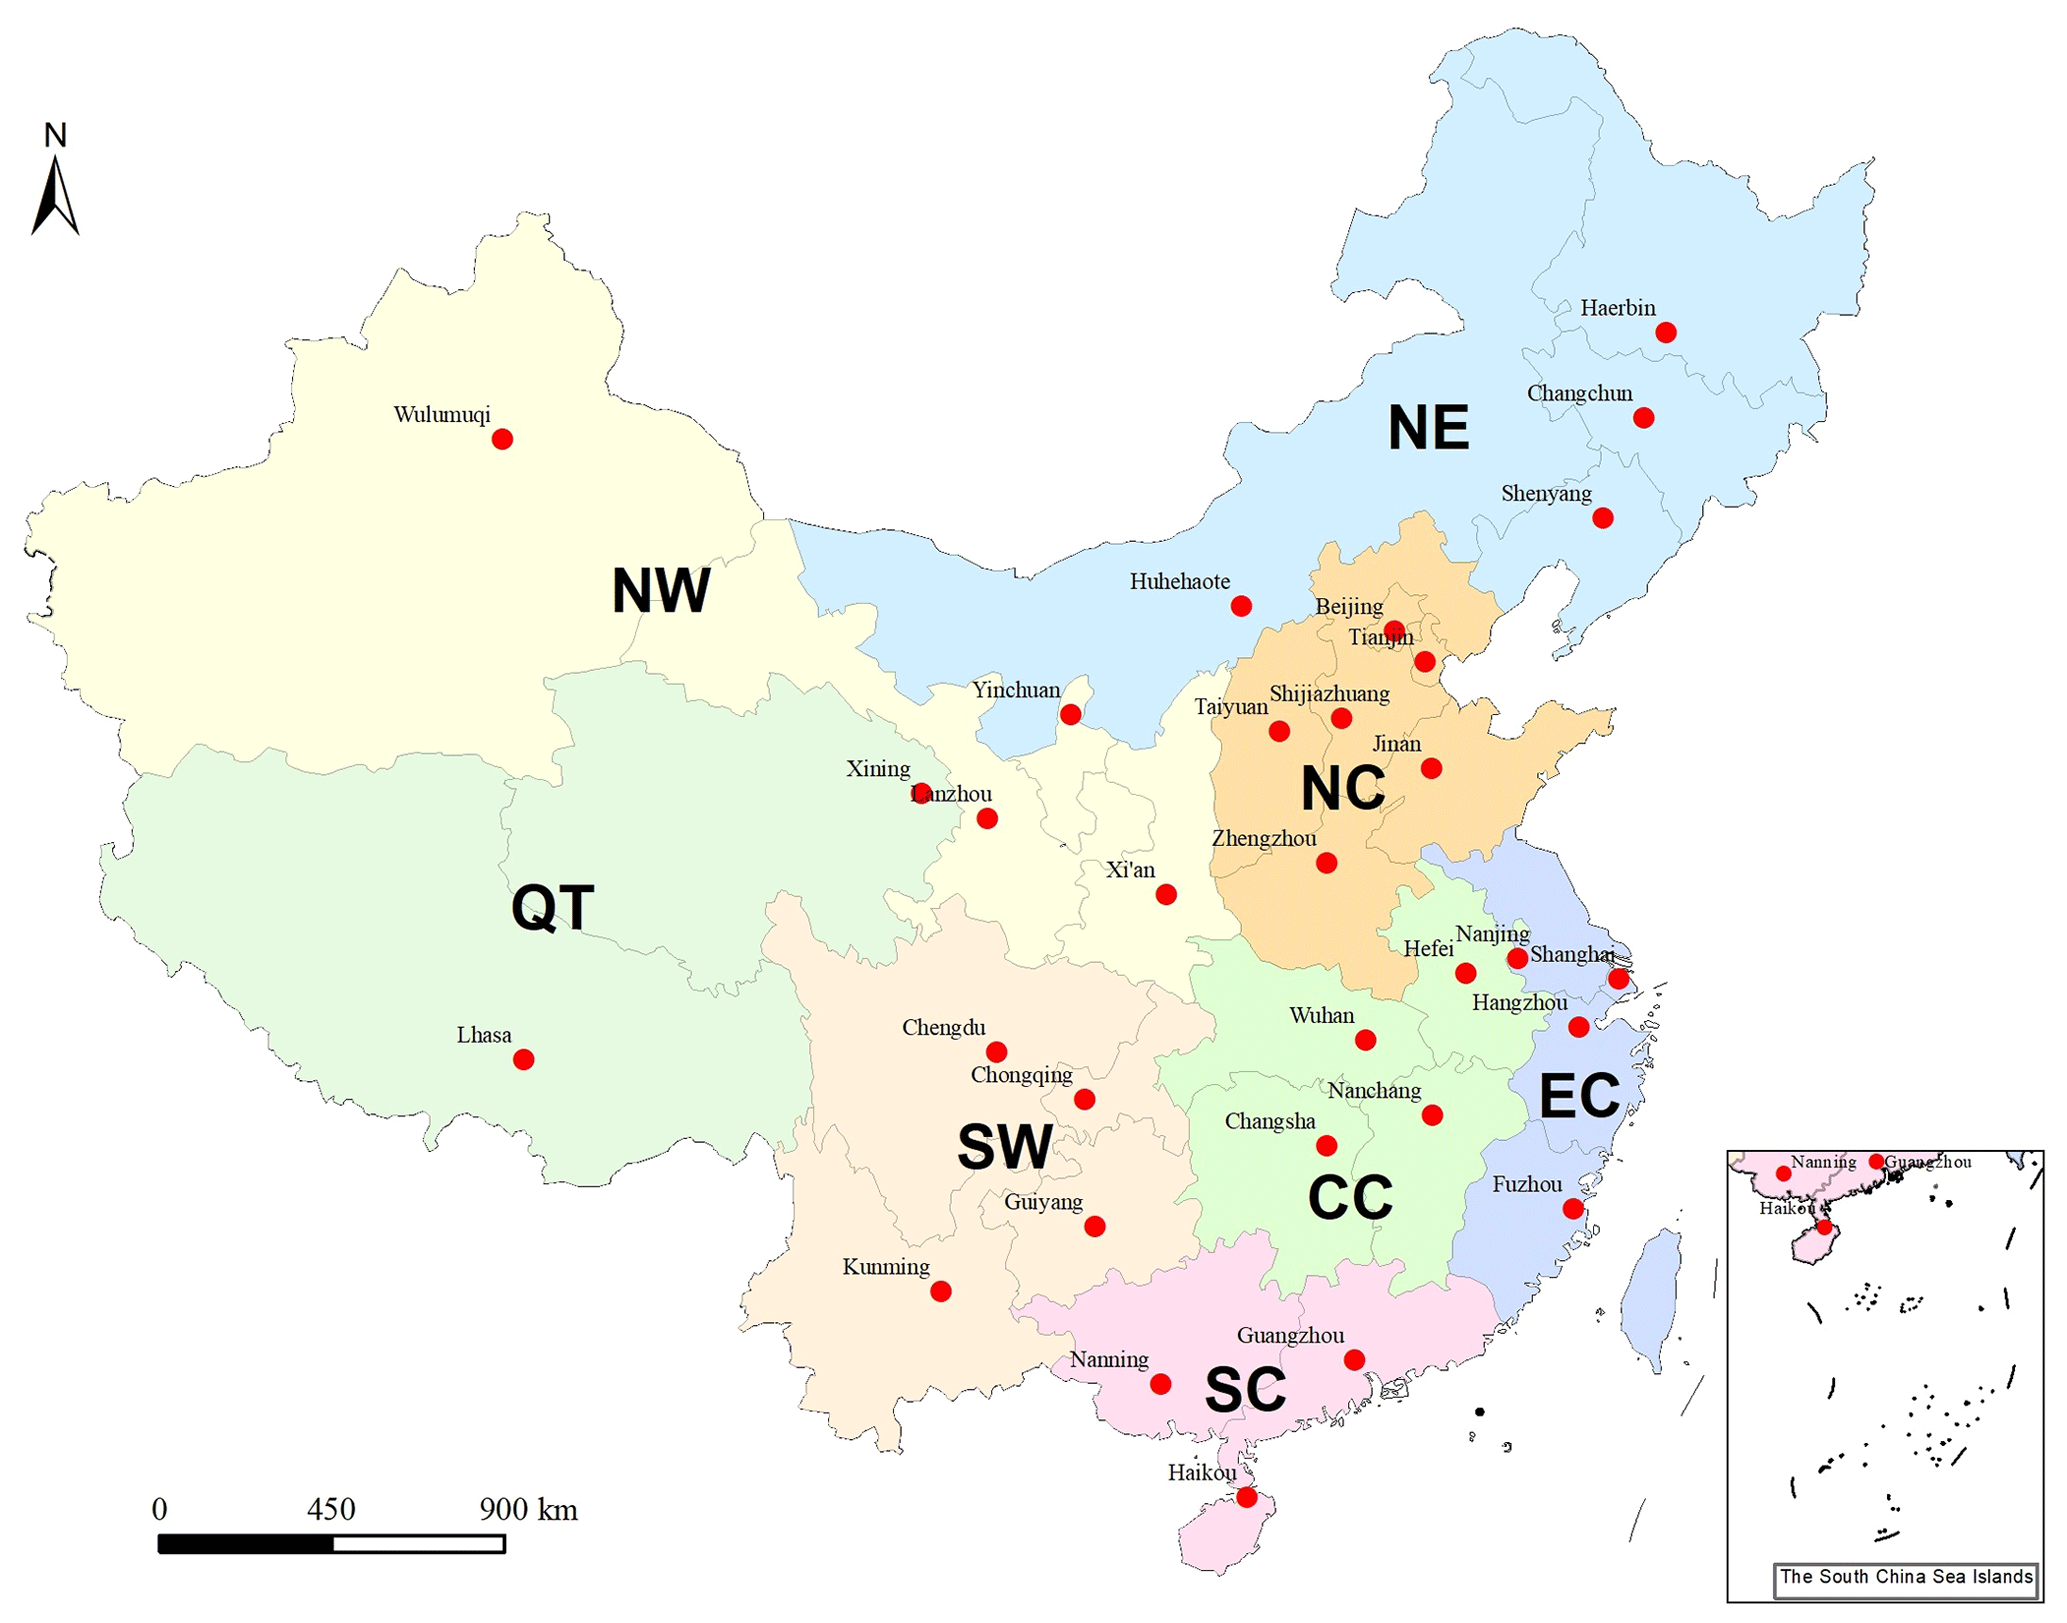
Figure 1Distribution of the weather stations in 31 cities and climate zones in the study area (the climate zones include NE, NW, NC, CC, EC, SC, SW and QT).
2.2 Study area
According to the temperature and precipitation data, combined with the administrative boundaries of provinces, all of China could be divided into eight climate regions (Yang et al., 2002), including northeast China (NE), north China (NC), east China (EC), south China (SC), southwest China (SW), northwest China (NW), central China (CC) and the Qinghai–Tibetan Plateau (QT). Locations for the 31 cities and the climate zones in the study are presented in Fig. 1. The total population of 30 capital cities currently stood at 278 million representing 20 % of the total population of China and contributing 33.5 % of the country's gross domestic product (GDP). These 31 capital cities were therefore chosen to reveal the trends of extreme temperatures in China, which may influence policy directions in reducing extreme-temperature disasters, protecting human health and enhancing crop production.
2.3 Method
In this study, an integrated index is established for systematical and quantitative evaluation of HWs and extreme-temperature events in China, which includes the frequency, duration and intensity of HWs and extreme-temperature days. At first, we made clear two definitions: extreme-temperature days and heat wave (HW). As stated earlier, when Tmax exceeds 35∘, it could be called a day with extreme temperatures in China; when Tmax exceeds 35∘ on more than 2 consecutive days, it could be defined as a heat wave (HW) event. The extreme-temperature days are the base of a HW. In 1 year, there may be several HW events and discontinuous days with extreme temperature, which jointly decide the heat level of one region. Thus the integrated index would contain two aspects in this study, HWs and discontinuous days with extreme temperature.
According to the statistical data, the hot days with extreme temperature are usually concentrated in June–August in China, which account for above 90 % of all the hot days from 1955 to 2014 in 31 capital cities. In May and September, the hot days account for 9 % and in the other months they account for no more than 1 % (Fig. 2). It is obvious that HW events mostly break out in June–August, which are the hottest months of the whole year in 31 capital cities. Thus we take the 3 months as the basic period for intensity assessment of HWs and extreme-temperature days. There are 92 d in total in June–August. If one HW event lasts for 92 d in a year, it would be regarded as the most serious heat event.
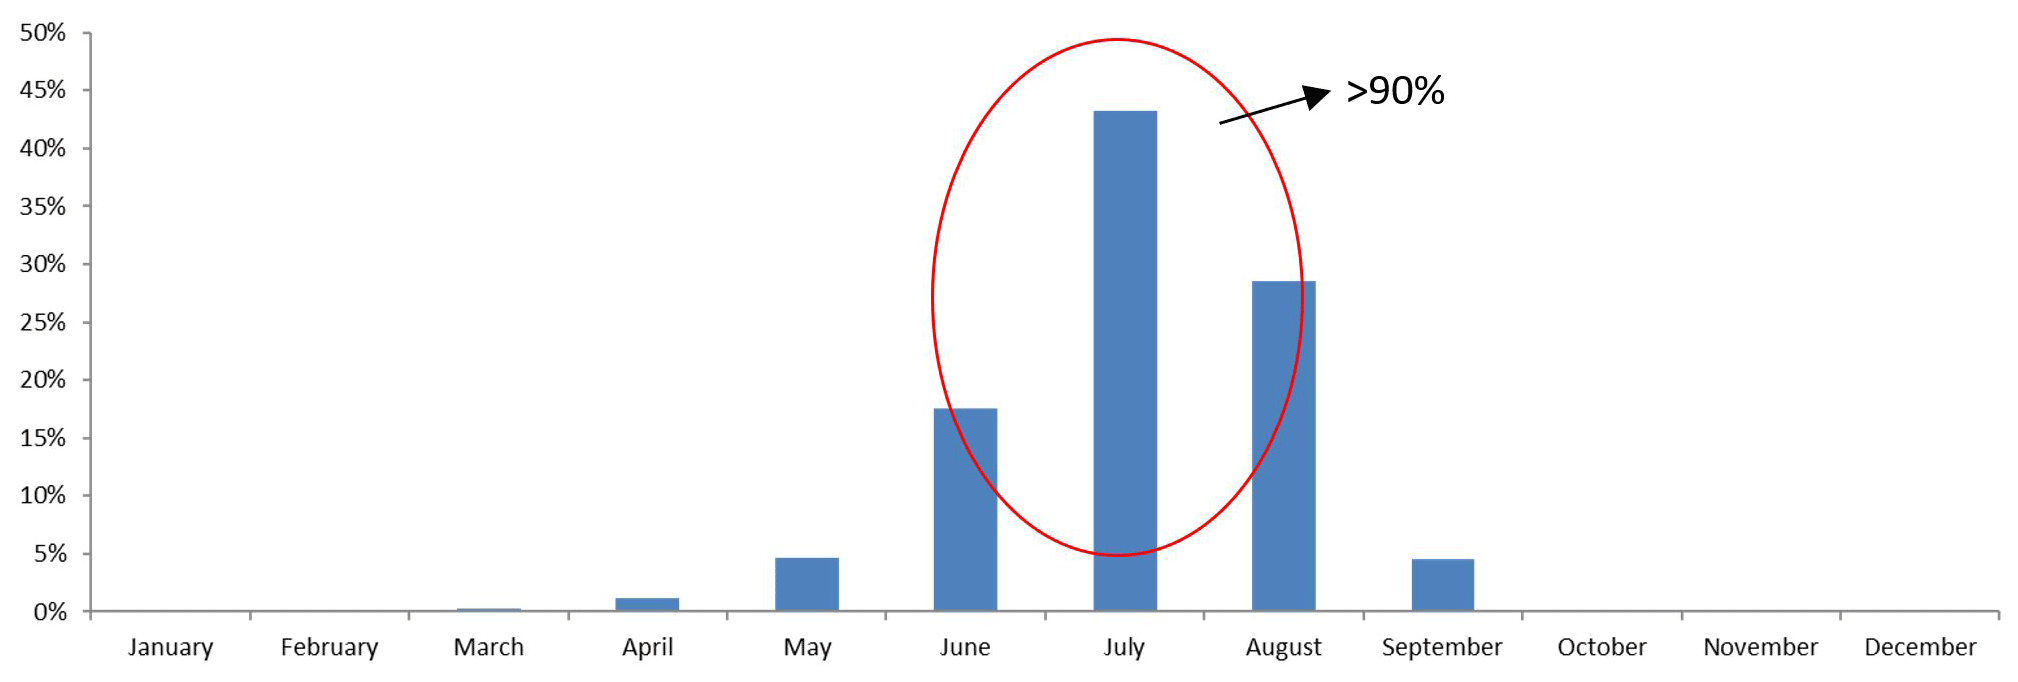
Figure 2The proportion distributions of hot days in 12 months from 1955 to 2014 in 31 capital cities in China.
2.3.1 Heat wave index
For HW events, the frequency, duration and intensity should be considered. Firstly, if the HWs last for more days, the intensity of HWs would be bigger. Secondly, according to the definition of HW, 3 d is the shortest duration for HWs in which daily Tmax exceeds 35∘. Thus the period of 3 d is one essential unit for evaluating the intensity of HWs. Thirdly, as mentioned above, when daily Tmax exceeds 37 or 40∘, especially continuous days above 37 or 40∘, the intensity of HWs would go up rapidly. Therefore in this study, heat wave index (HWI) is established as the following formula.
HWI represents the integrated intensity of HW events: CD35 represents the continuous days on which daily Tmax exceeds 35∘; AD37 represents all days on which daily Tmax exceeds 37∘ among CD35; CD37 represents the continuous days on which daily Tmax exceeds 37∘ among CD35; AD40 represents all days on which daily Tmax exceeds 40∘ among CD35; CD40 represents the continuous days on which daily Tmax exceeds 40∘ among CD35.
For HWI, there are two extreme situations. If there are no heat waves in 1 year, the value of HWI would be 1. If there are 92 continuous days of a year on which Tmax exceeds 40∘, the value of HWI would be the highest, 33 792; for the real world, the second extreme situation would rarely occur except in extreme catastrophes. According to the statistics from 1955 to 2014 in China, the most serious heat wave event occurred in Changsha city in 2013 for which the value of HWI is no more than 140. The value of HWI is mostly determined by the number of continuous days on which Tmax exceeds 37∘, even 40∘. If the extreme-heat days continue longer, HWI would be more serious. Taking the most serious heat wave event in Chongqing city for example, it lasted from 25 July to 19 August 2006; the value of CD35 reaches 26; the value of AD37 is 21; the value of CD37 is 19; the value of AD40 is 9; the value of CD40 is 7. According to the HWI equation above, the HWI of this heat wave event reaches 89.5.
For 1 year, there may be several HW events. The total intensity of annual HWI (AHWI) should contain all HW events of the year. Based on HWI, AHWI is calculated as follows.
AHWI represents the total annual intensity of HW events; n represents the total frequency of HW events in 1 year; i represents the sequence of HW events occurred in 1 year.
2.3.2 Hot year index
As mentioned above, within 1 year, there are not only HW events, but also discontinuous days with extreme temperature. If the heat levels are compared between different cities in different years, the two aspects should be considered synthetically. The discontinuous days with extreme temperature above 35, 37 or 40∘ are not as serious as HW events in some cities. In other cities there may be few HW events in some years, in which the heat levels are mainly decided by the discontinuous days with extreme temperature. Therefore, based on AHWI established above, an integrated index for hot years is constructed, considering the discontinuous days with extreme temperature in 1 year. The formula is as follows:
HYI represents the integrated intensity of hot years in different cities. D35 represents the days of 1 year on which daily Tmax exceeds 35∘; ∑CD35 represents the continuous days on which daily Tmax exceeds 35∘ in 1 year; D37 represents the days in 1 year on which daily Tmax exceeds 37∘; ∑AD37 represents all days on which daily Tmax exceeds 37∘ among CD35 in 1 year; D40 represents the days in 1 year on which daily Tmax exceeds 40∘; ∑AD40 represents all days on which daily Tmax exceeds 40∘ among CD35 in 1 year.
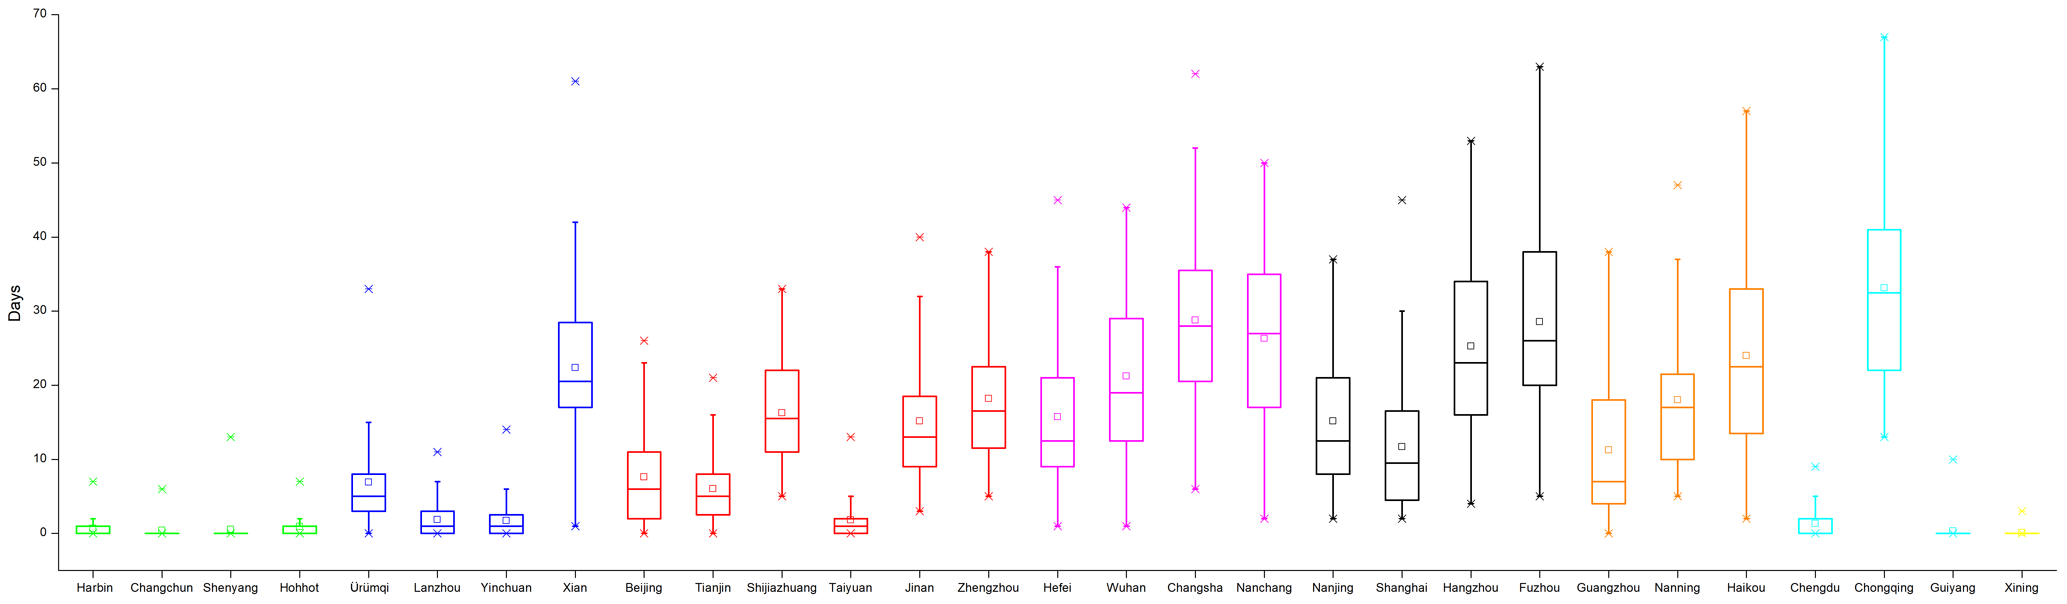
Figure 3Distribution of D35 in 29 cities from 1955 to 2014 (green color: NE; blue color: NW; red color: NC; purple color: CC; black color: EC; orange color: SC; cyan color: SW; yellow color: QT). Boxes indicate the interquartile spread (25th and 75th quantiles) with the horizontal line indicating the ensemble median and the whiskers showing the extreme range of D35 in 29 cities. There has been no high-temperature weather in which daily Tmax exceeds 35∘ in Kunming and Lhasa cities in the past 60 years. Therefore there are 29 cities shown in this figure.

For HYI, there are also two extreme situations. If there are no heat waves or hot days in 1 year, the value of HYI would be 1. The value of HYI is largely determined by the value of AHWI, which would reach 33 792 at most; in other words, if the intensity and frequency of heat wave events in 1 year are bigger, the hot year index would be more severe. There is an insignificant impact on HYI for discontinuous days on which daily Tmax exceeds 35∘, comparing with heat wave events. According to the statistics, the hottest year is also in Changsha city in 2013, when the most serious heat wave event from 1955 to 2014 in China occurred.
3.1 Trends of extreme-temperature days
According to the historical statistics, Chongqing has been the most vulnerable province to disasters of extreme temperature in all of China, in which annual D35 exceeds 33 d in the past 60 years. Meanwhile, there is no extreme-temperature day from 1955 to 2014 in Kunming and Lhasa, which are the most comfortable places of the 31 capital cities in summer. There are seven cities in which annual D35 is between 20 and 30 d (Fig. 3), including Changsha, Fuzhou, Nanchang, Hangzhou, Haikou, Xi'an and Wuhan. With regards to climate zones, central China has been threatened by the most frequent extreme-temperature disasters in the past 60 years; annual D35 in east China and south China was between 10 and 20 d, north China and southwest China was between 1 and 12 d, northwest China was about 8 d, and northeast China and the Qinghai–Tibetan Plateau was fewer than 3 d.
Though the global climate has been continuously warming in the past 60 years, the trend of D35 in China is not increasing constantly. There are three main stages for the variation in D35 in China (Fig. 4). From 1955 to the early 1970s, the value of D35 in 31 cities of China on average amounts to 372 d yr−1, signifying the high level of hot years in this stage. From the early 1970s to late 1980s, the value of D35 in 31 cities of China on average amounts to 280 d yr−1, which means that these cities encountered relatively cool years in this stage. From the early 1990s to 2014, the value of D35 in 31 cities of China on average amounts to 425 d yr−1, which is higher than the past 40 years. It means that all of China has been threatened by more and more serious extreme-temperature events in the last 20 years. However, there are obvious variations in the characteristics of D35 in different climate zones of China. The values of D35 in south China, east China and northeast China obviously increased from 1955 to 2014. The values of D35 in central China, southwest China and north China rose slightly; however, the trend in the values of D35 in northwest China have slightly declined in the past 60 years.
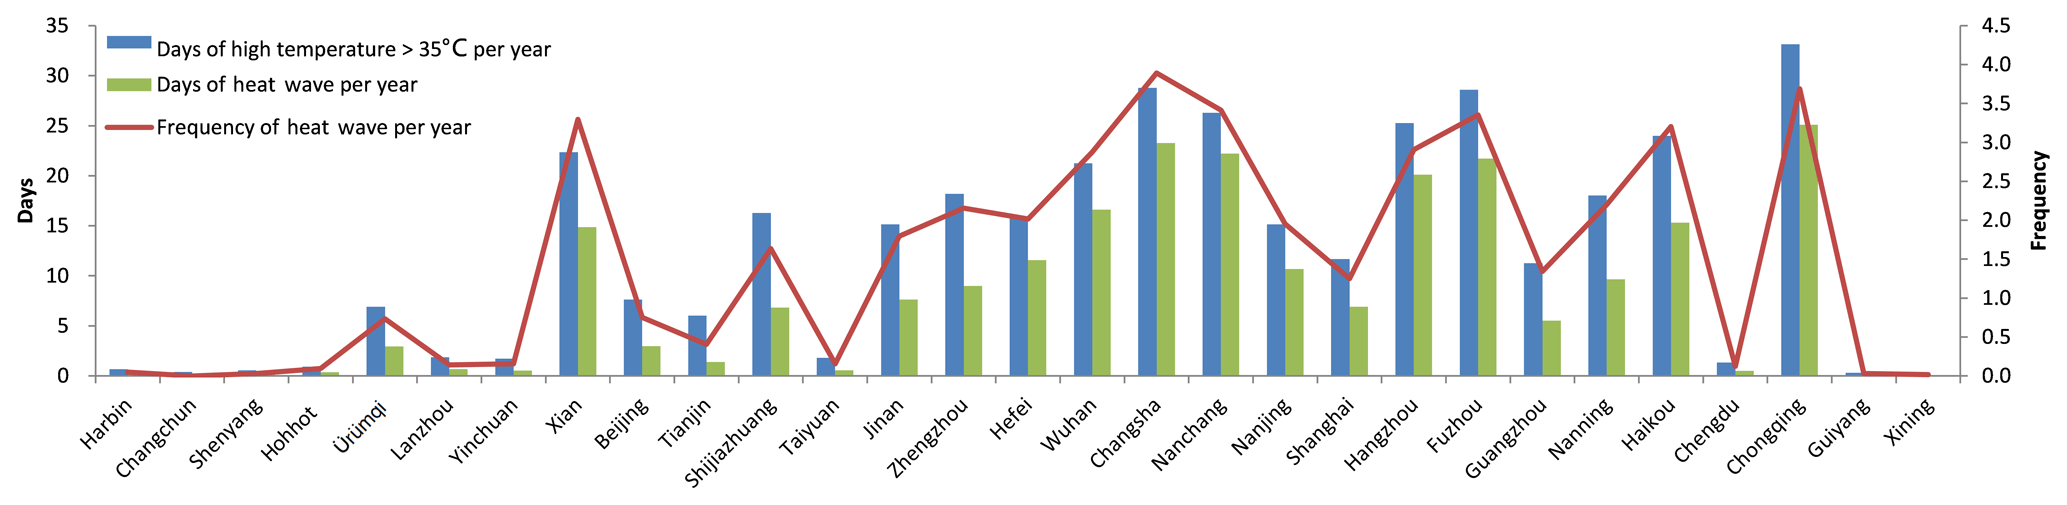
Figure 5Comparison between D35 and HWs per year in 29 cities of China from 1955 to 2014. There has been no high-temperature weather in which daily Tmax exceeds 35∘ in Kunming and Lhasa cities in the past 60 years. Therefore there are 29 cities shown in this figure.
3.2 Trends of heat waves
Following the HW definition in China, an average of 1.54 HW events occurred annually in each city from 1955 to 2014 and last for an average of 5.4 d for each HW event. It is obvious that, as the value of D35 increases in each city, the number and frequency of HWs also increase (Fig. 5). There is a positive correlation between D35 and HWs. Through the analysis of HWs in the 31 typical cities, Chongqing was the most threatened as HW rose up to 25.1 d annually; Changsha experienced the most frequent HWs in the past 60 years, almost 3.9 times per year. The intensities and frequencies of HWs in Nanchang, Fuzhou, Hangzhou, Haikou and Xi'an are smaller than in Chongqing and Changsha, but much bigger than other cities. There was no HW in Kunming, Shenyang, Guiyang, Lhasa and Changchun, but there were a few HWs in Harbin, Hohhot and Xining. For the other cities, the threat from HWs was in the middle level.
According to the statistics, the distribution of number and frequency of HWs per year in the 31 cities was similar to the distribution of D35 (Fig. 6). Comparing the different climate zones, central China has been threatened by the most serious HWs in the past 60 years, in which the frequency and number of HWs per year were the highest. In east China HWs have also been very serious. In south China and southwest China the threat of HWs has been lower than in central China and east China. In north China and northwest China there were fewer annual HWs. In northeast China and the Qinghai–Tibetan Plateau, there was almost no obvious threat of HWs in the past 60 years.
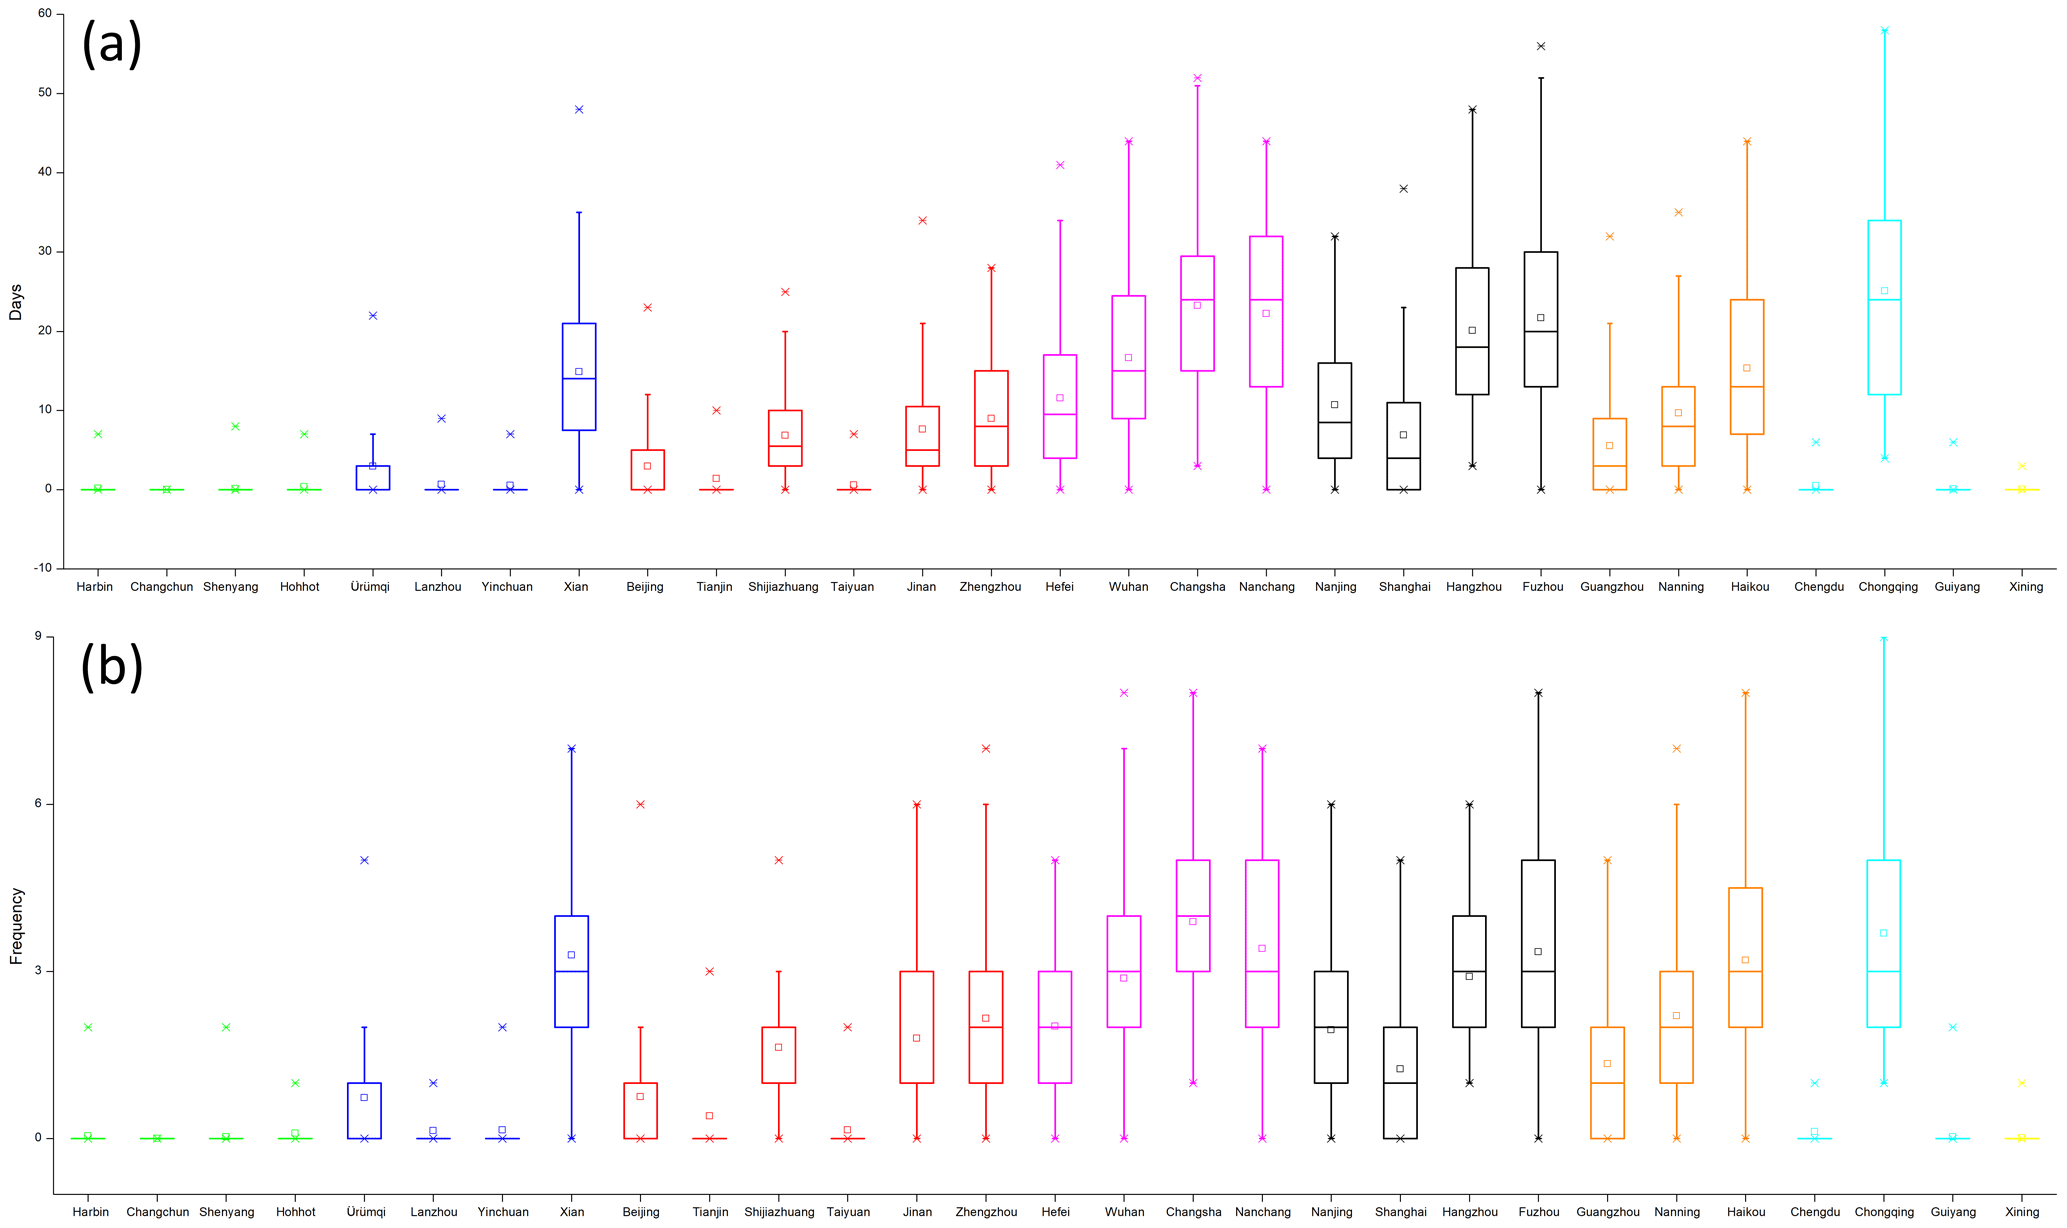
Figure 6Distribution of number and frequency of HWs in 29 cities from 1955 to 2014 – (a) number of HWs; (b) frequency of HWs. Green color: NE; blue color: NW; red color: NC; purple color: CC; black color: EC; orange color: SC; cyan color: SW; yellow color: QT). Boxes indicate the interquartile spread (25th and 75th quantiles) with the horizontal line indicating the ensemble median and the whiskers showing the extreme range of HW frequency and number in 29 cities. There has been no high-temperature weather in which daily Tmax exceeds 35∘ in Kunming and Lhasa cities in the past 60 years. Therefore there are 29 cities shown in this figure.
3.3 Heat wave index
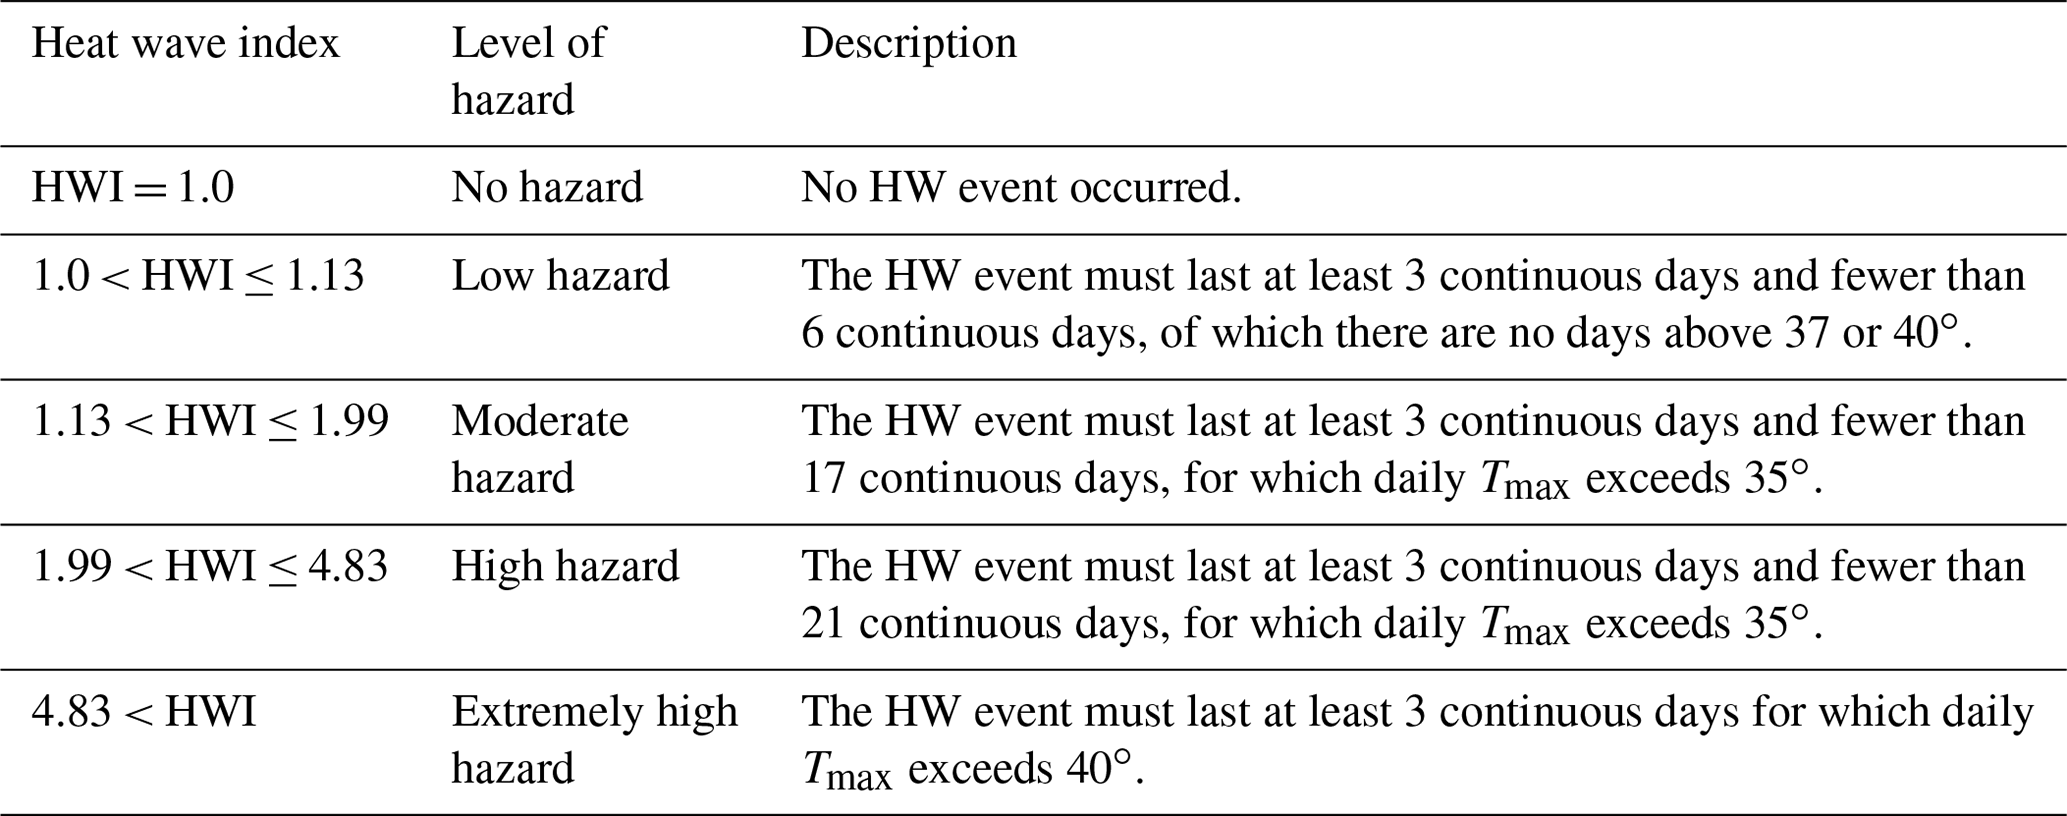
In order to do comparative analysis on the HW occurrence in the different cities for the past 60 years, a heat wave index (HWI) was established as mentioned above. The duration and intensity are the key factors of HWs that define the severity of heat events. Thus HWI is designed to refer to the number of days one HW event lasts and the maximum temperature one HW event reaches (Table 1). HWI provides us a quantitative tool to distinguish the different HWs in 31 typical cities of China. According to the climate conditions and national standards of extreme temperature in China, HWs could be classified into five levels of hazard by the values of HWI. The thresholds of five HWI levels are separately determined by the 50 % percentile, 75 % percentile and 95 % percentile of all heat wave events which occurred in the past 60 years. When the value of HWI is 1.0, it indicates that there is no continuous hot day on which Tmax exceeds 35∘. When the value of HWI is between 1.0 and 1.13, it indicates slight HW hazards in which the duration and intensity of HWs are minimal. When the value of HWI is between 1.13 and 1.99, it means HW hazards are slight as there are few continuous days of Tmax exceeding 37∘. When the value of HWI is between 1.99 and 4.83, it indicates that the HW hazards are serious and the continuous days of Tmax exceeding 37 or 40∘ become frequent. When the value of HWI is above 4.83, it indicates that the HW hazards are very serious and the continuous days of Tmax exceeding 37 or 40∘ may last through the whole period of HWs.
According to the classification of HWI, the frequencies of HW hazards with different levels in the past 60 years in 31 typical cities of China are analyzed (Fig. 7). In all, cities with low HW hazards were the majority, accounting for 52.9 % of all HWs. The moderate HW hazards accounted for 22.3 %, the high HW hazards represented 19.8 % and the extremely high HW hazards accounted for 5.0 %. For all the 31 cities, most of the HW hazards are not serious; only 1∕20 of the HW hazards are of the greatest threats. No HW hazards occurred in Changchun, Shenyang, Guiyang, Kunming and Lhasa from 1955 to 2014; no high or extremely high HW hazards occurred in Harbin, Xining, Yinchuan and Chengdu. No extremely high HW hazards occurred in Beijing, Tianjin, Taiyuan, Hohhot, Ürümqi, Lanzhou and Guangzhou. In the remaining 15 cities, all four levels of HW hazard occurred in the past 60 years. However, most HW events of high (1.2 per year) and extremely high (0.6 per year) levels occurred in Chongqing. Most HW events of moderate levels occurred in Changsha, reaching 1.0 per year, and most HW events of low level occurred in Haikou, reaching 2.3 per year.
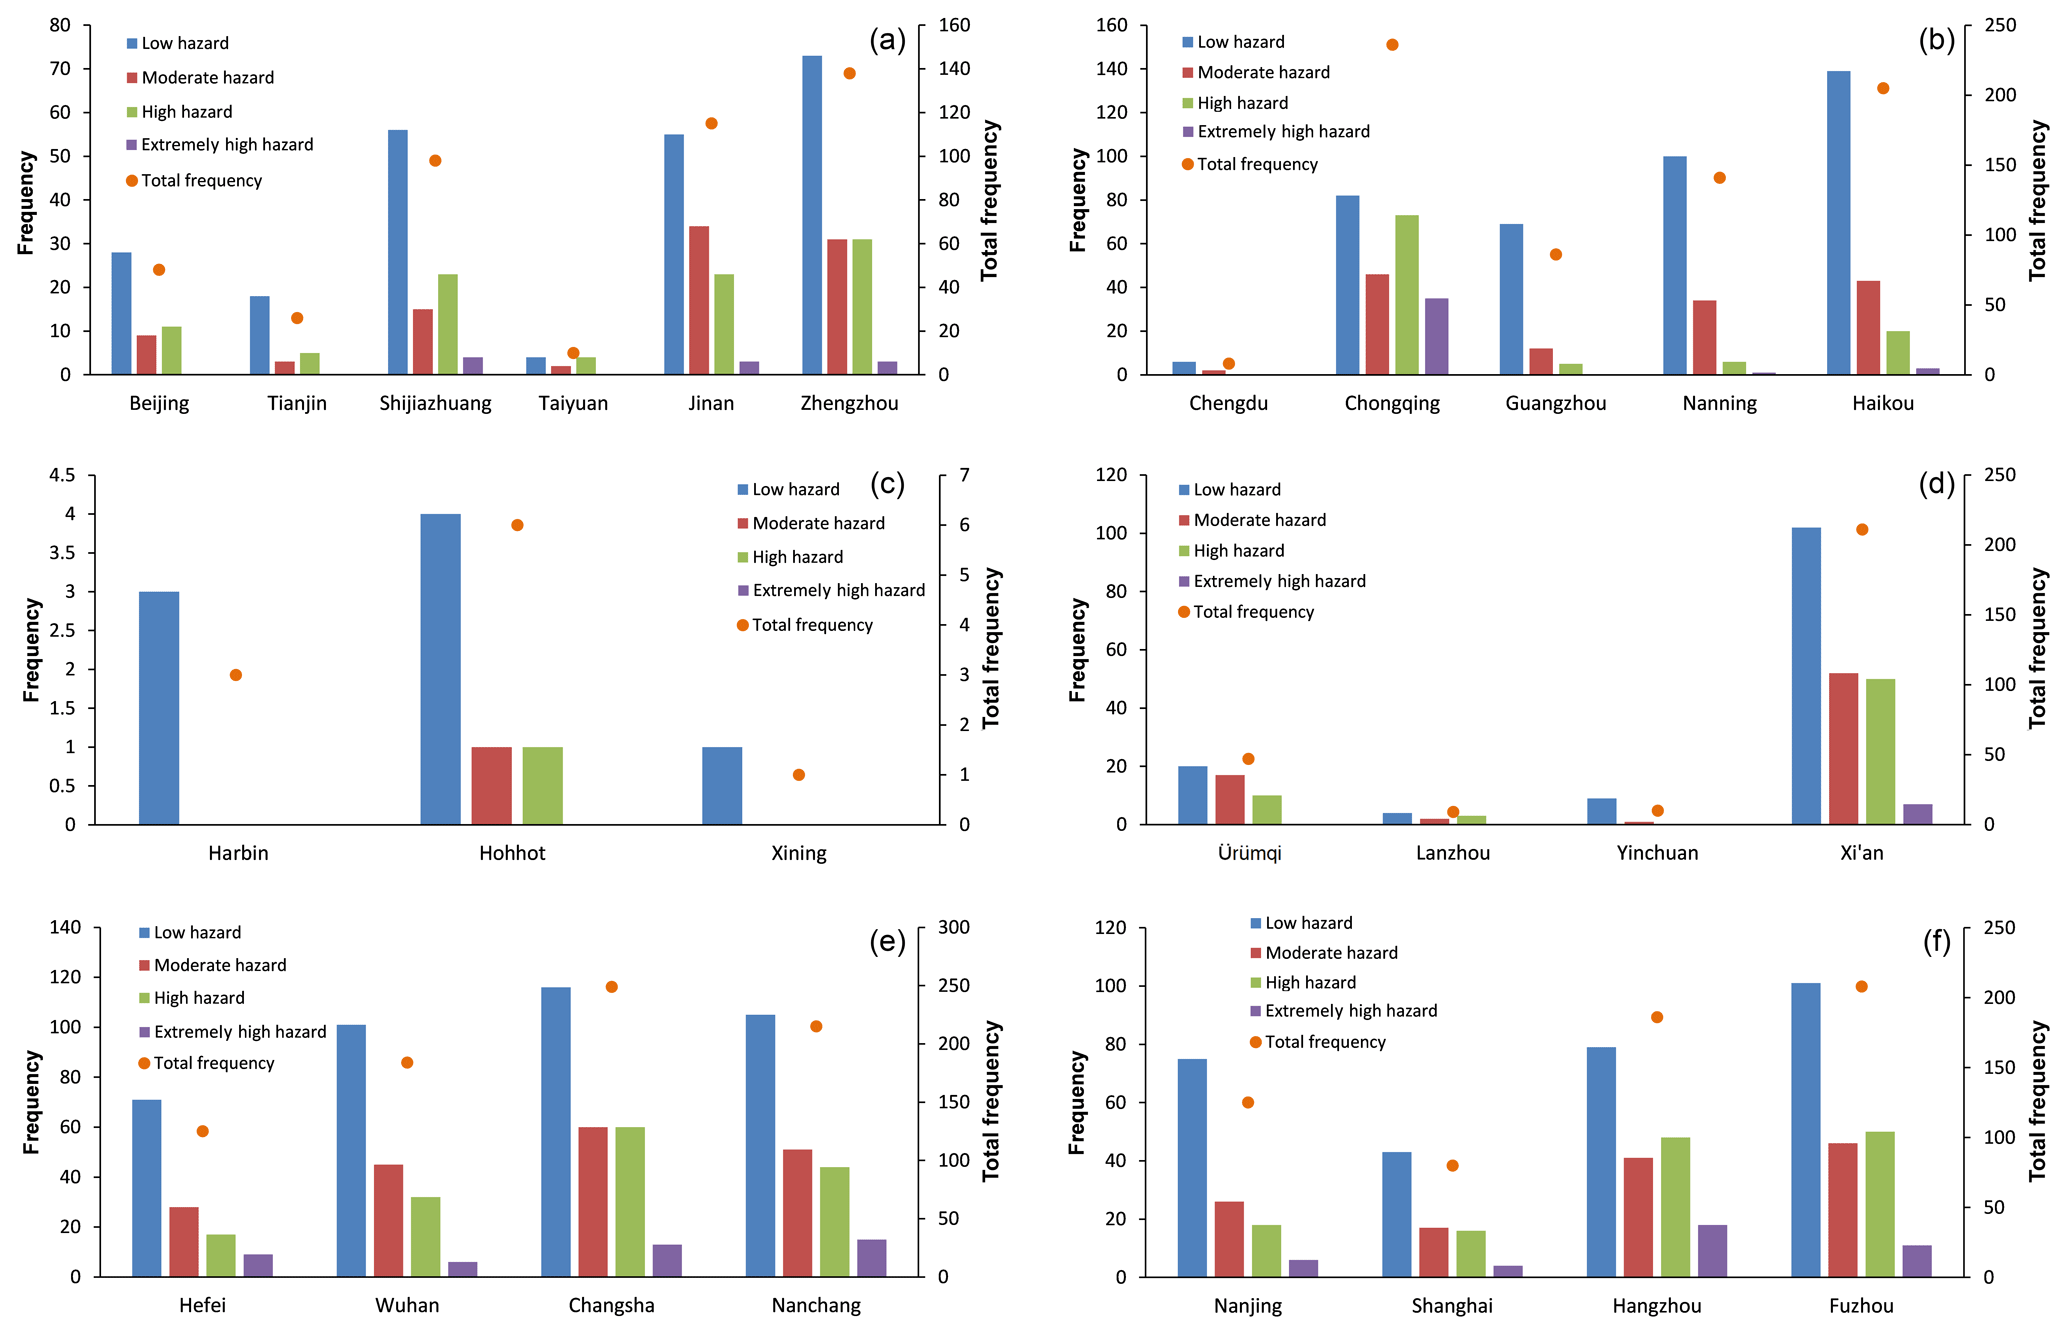
Figure 7Frequency of low, moderately, high and extremely high HW hazards in 26 cities from 1955 to 2014 – (a) NC, (b) SW and SC, (c) NE, (d) NW and QT, (e) CC and (f) EC. There have been no HWs in Changchun, Shenyang, Guiyang, Kunming and Lhasa cities in the past 60 years. Therefore there are 26 cities shown in this figure.

Figure 8The sum values of HWIs in 26 cities from 1955 to 2014. There have been no HWs in Changchun, Shenyang, Guiyang, Kunming and Lhasa cities in the past 60 years. Therefore there are 26 cities shown in this figure.
Based on the calculation of HWI, the sum of HWIs from 1955 to 2014 in each city is shown in Fig. 8. It is obvious that Chongqing has been threatened by the most serious HW hazards in the past 60 years, in which the frequency, duration and intensity of HWs are the biggest of all the 31 cities. The sum value of HWIs in Chongqing is far bigger than other cities; the annual average value of HWIs in Chongqing reached 13.7. Changsha was the city with the second most serious HW hazard, for which the annual average value of HWIs reached 9.5. There were six cities that have been threatened by severe HW hazards, including Hangzhou, Fuzhou, Nanchang, Xi'an, Wuhan and Haikou. The annual average value of HWIs in each city is between 4 and 9. There were seven cities threatened by moderate severe HW hazards; these cities include Hefei, Zhengzhou, Nanjing, Jinan, Shijiazhuang, Nanning, and Shanghai, and the annual average value of HWIs in each city is between 2 and 4. The remaining 11 cities encountered less serious HW hazards in which the annual average value of HWIs is between 0 and 2. As mentioned above, there were no HW hazards in five cities.
3.4 Hot year index
Based on heat wave indexes, hot year indexes in the 31 cities were calculated and analyzed, including HW events and discontinuous days with extreme temperatures (Table 2). The analysis revealed the heat levels of the cities in different years. In the study, the quantity of hot year indexes for all cities added up to 1860 from 1955 to 2014.
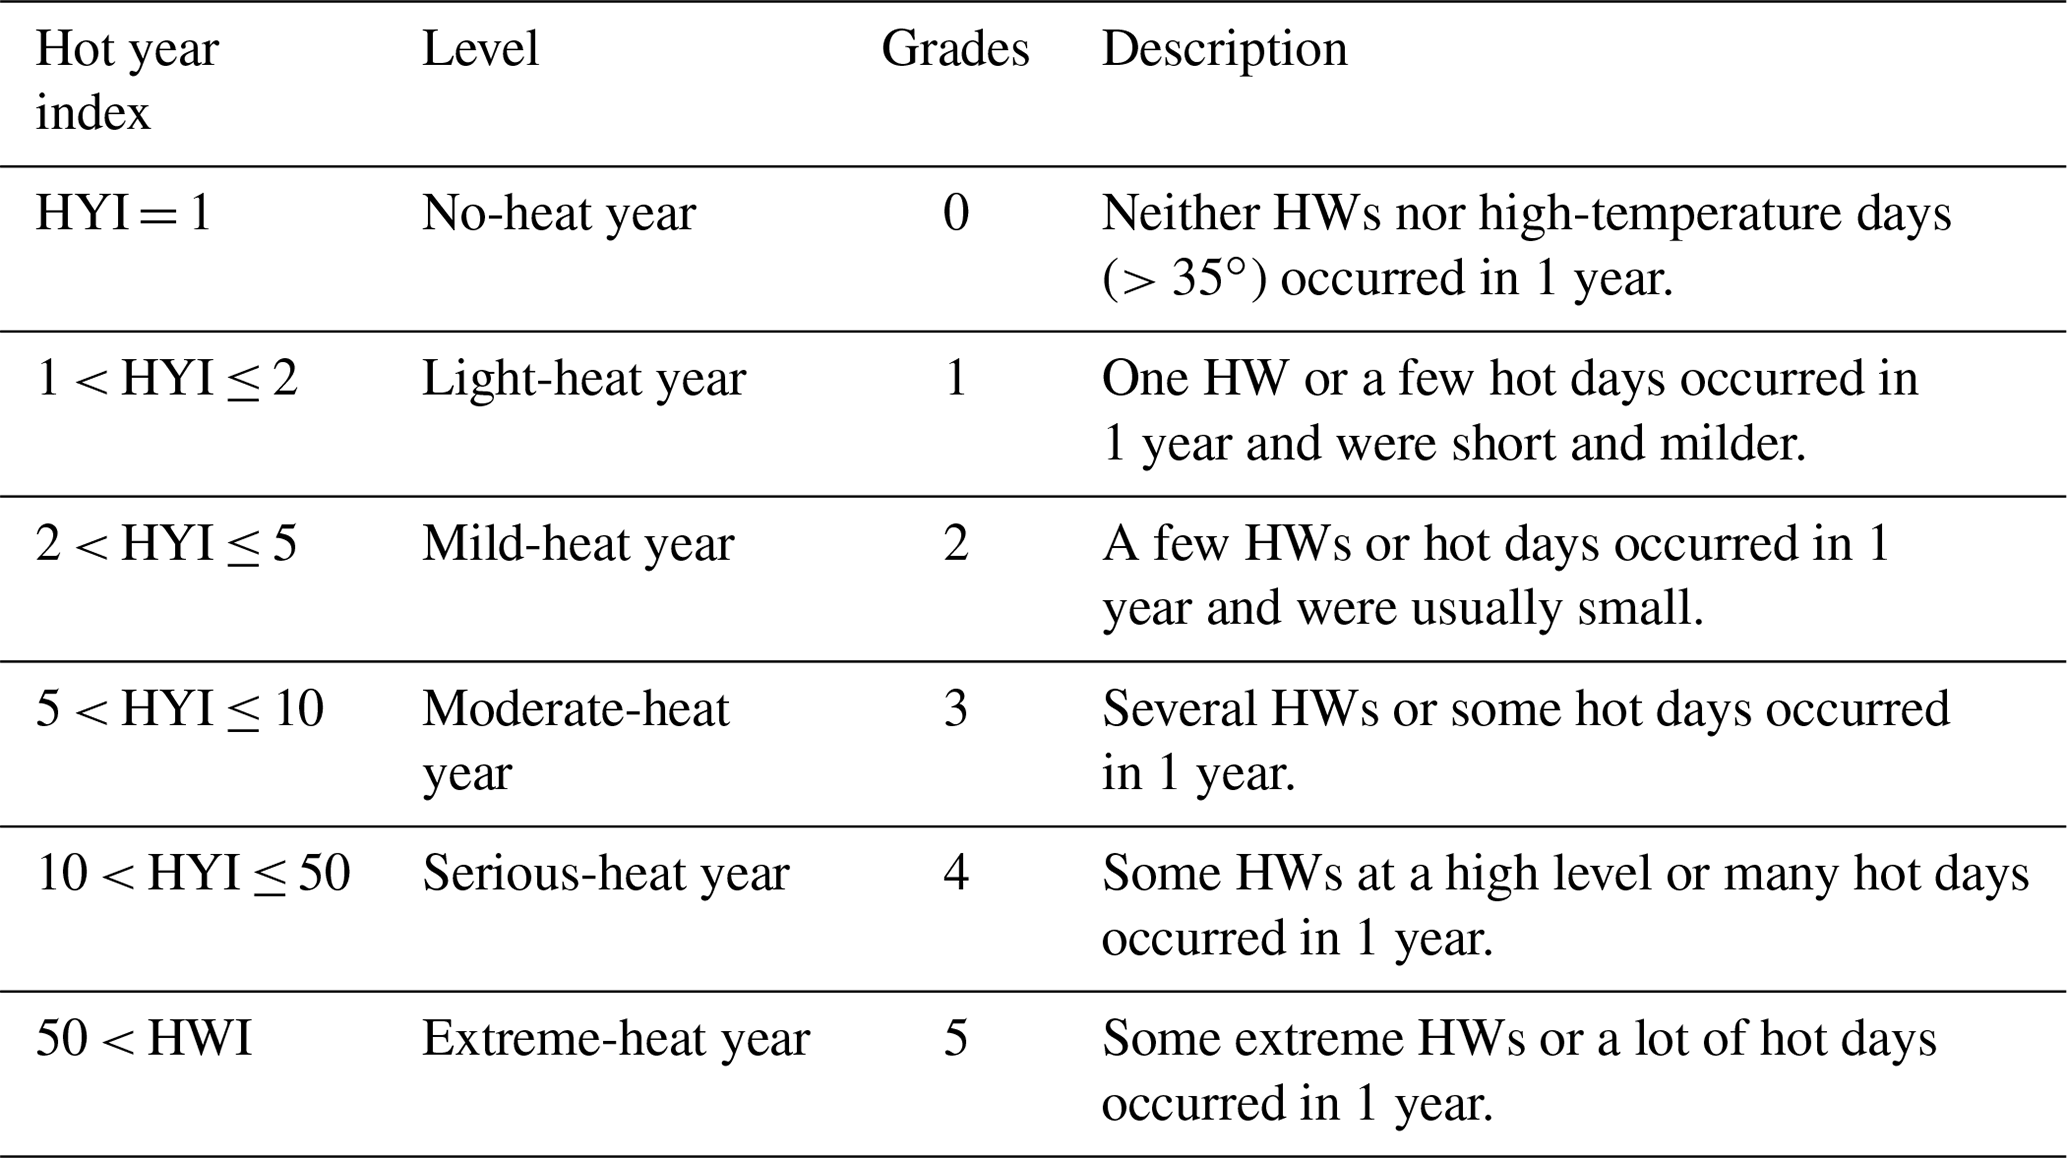
The no-heat year represented 29.1 % of the gross years, light-heat year 28.8 %, mild-heat year 20.3 %, moderate-heat year 13.7 %, serious-heat year 7.9 % and the extreme-heat year 0.3 %. Chongqing has been threatened by the most severe heat, in which serious-heat year and extreme-heat year accounted for 50 % of the 60 years; in Changsha, Nanchang, Hangzhou and Fuzhou, serious-heat year and extreme-heat year accounted for 25 %. However, there was only slight heat threat or no heat threat in the past 60 years in most cities of northeast China, northwest China, southwest China and the Qinghai–Tibetan Plateau, in which no-heat year and light-heat year accounted for more than 90 %. For the remaining 14 cities, mild-heat year and moderate-heat year accounted for most of the 60 years. It is obvious that the west and north regions of China are much cooler than the east and south parts of China; the hottest regions are located in central China and east China.
On the point of time series, there are three kinds of variation trends of HYI for the 31 cities: uptrend, downtrend and no change. In 21 cities, the value of HYI had an obvious rising trend. The remaining eight cities had a clear declining trend in the value of HYI. There were no extreme-temperature days in Kunming and Lhasa in the past 60 years, so there was no change of HYI in the two cities. There are two rising pathways for the 21 cities: one rises directly and the other first declines and then rises. In a comprehensive view, there are three stages for all the cities in the past 60 years. In the first stage from 1955 to the early years of the 1970s, HYIs in most of cities were at a high level. The moderate-heat years and serious-heat years were frequent, which accounted for 27.0 % of the first stage. In the second stage from the middle of the 1970s to the end of the 1980s, HYIs in most of the cities were at a low level. The moderate-heat years and serious-heat years were rare, which accounted for 11.7 % of the second stage. In the third stage from the early years of the 1990s to 2014, HYIs in most of cities were also at a high level. The number of moderate-heat years and serious-heat years accounted for 26.8 %, but the severities of hot years in this stage are more serious than the first stage in most cities. In general, there was an obvious fluctuation for hot years in the past 60 years in the 31 cities, which are not continuously rising with the global warming. There was obvious increasing trend for all of China, for the intensity and the frequency of HWs and extreme temperature days.
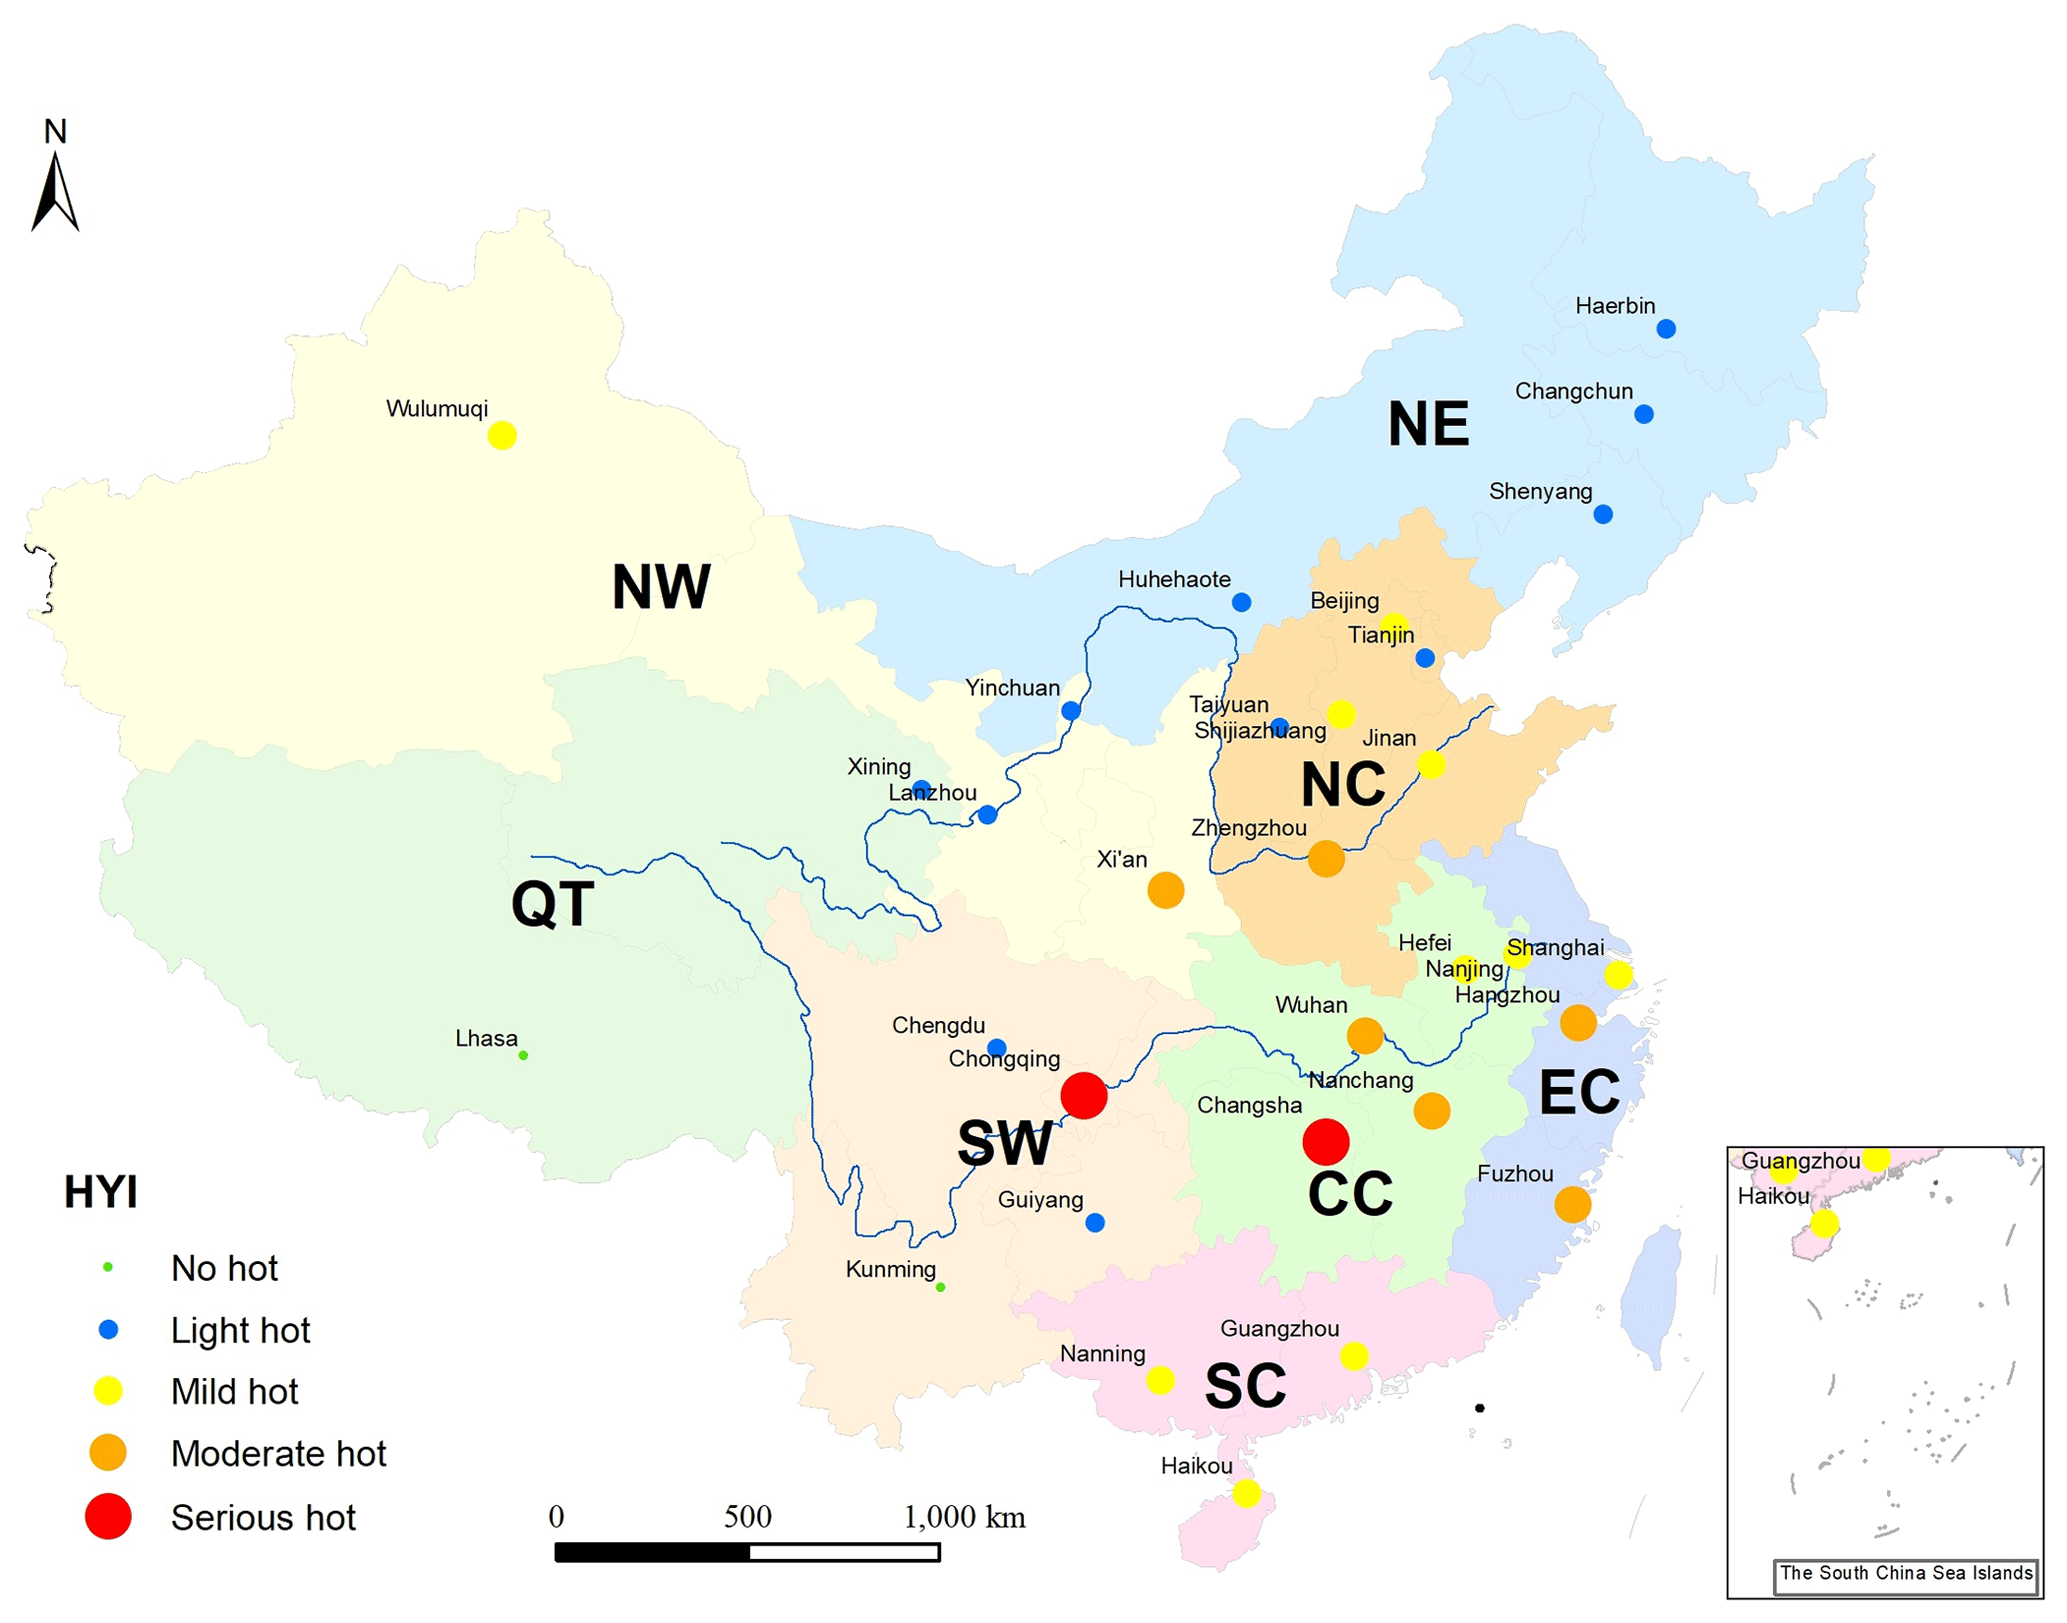
Figure 9Classification of annual average of HYIs from 1955 to 2014 in 31 cities in the study area (the climate zones include NE, NW, NC, CC, EC, SC, SW and QT; the upper blue line: the Yellow River; the lower blue line: the Yangtze River).
From Fig. 9, clear variations in HWI events existed in most cities across the mainland of China. For example, in northwest China, HYIs in Lanzhou and Yinchuan were so small that no serious heat events occurred in the past 60 years, but in Ürümqi and Xi'an, HYIs were more pronounced as the annual average value of HYIs from 1955 to 2014 in Xi'an reached 6.96. In north China, the annual average values of HYIs in Beijing, Tianjin and Taiyuan were between 1.2 and 2.4, in which light-heat years represented 63 % of the whole. However, in Shijiazhuang, Jinan and Zhengzhou, the annual average values of HYIs were between 3.9 and 5.1, and mild-heat years represented 43 % of the whole. In southwest China, there were a few hot waves in Chengdu, Guiyang and Kunming, making these cities as cool as northeast China; however, in Chongqing, the annual average value of HYIs rose up to 15.0. This city had been threatened by the most severe heat events, as serious-heat years represented 34 % and the HYIs ranked first of the 31 cities in 27 years of the past 60 years. From a broader view, three types of regions were identified: northeast China and the Qinghai–Tibetan Plateau composed one type of region: HYIs of these cities were small and the annual average value was 1.02, in which no-heat years accounted for more than 60 %, representing the coolest region in China. Central China, east China and south China also formed one type of region: HYIs of most of these cities were higher than the other regions and the annual average value of HYIs rose up to 5.61, in which moderate-heat years and serious-heat years accounted for 40 %. In northwest China, southwest China and north China, which formed the last type of region, HYIs of most of these cities were in the middle, and the annual average value of HYIs was 3.45, in which light-heat years and mild-heat years accounted for 54 %.
In brief, there is an apparent feature that most of the cities that were threatened by serious heat events in the past 60 years were located in the middle and lower reaches of the Yangtze River. There were a few heat events in NE, NW, SW and QT, except Chongqing, Xi'an and Ürümqi. The lack of heat events in SC is not striking, though the annual mean temperatures of three typical cities in this region are the highest of all 31 cities.
With global warming, there has been a lot of research focusing on HWs. Most of these studies paid more attention to a single factor of HW, especially occurrence frequency. The other key indicators, such as duration, intensity, extent and timing, were usually neglected. There are few studies combining HWs with extreme-temperature days to evaluate the annual heat events and compare the interannual changes of torridity degrees.
From our analysis, we established a statistical model involving the frequency, duration, intensity and length of the HWs and extreme-temperature days across large cities in China. By analyzing HWs and extreme-temperature days in large cities of China, we are capturing the changes and spatial distribution in HWs and the extreme-temperature events caused from climate fluctuation and climate change, as well as local changes from the urban environment.
The results presented in this study are consistent with previous findings on changes in extreme-temperature days and HWs in recent decades across China due to global-scale drivers (Chen and Li, 2017; Fang et al., 2016; You et al., 2013; Qi and Wang, 2012). HW is the basic element for evaluation of heat events which is taken into account in most of the research across the whole world (Spinoni et al., 2015; Oswald and Rood, 2014; Santamouris et al., 2015; Gershunov et al., 2009). However, the discontinuous extreme-temperature days are usually ignored even though they play an important role in evaluation of annual heat events. The common influences of HWs and extreme-temperature days can be seen in heat events in different cities. The increase in the number of HWs and extreme-temperature days in China is consistent with all other global or regional studies that show that the occurrence of warm days increased (Rusticucci, 2012; Nemec et al., 2013; Pingale et al., 2014). The abrupt changes in the trends of HWs and hot years mainly occurred in the 1970s and 1980s. There was a period from the early 1970s to the late 1980s in which the number of HWs and extreme-temperature days was relatively lower than the other years. The changes are in accordance with the former findings put forward by other researchers (Zhou and Ren, 2011; Xu et al., 2013).
The cities distributed in the middle and lower reaches of the Yangtze River have been threatened by the most serious HWs and hot years in the past 60 years, especially Chongqing and Changsha. The long-term anticyclones and the special topography are most responsible for this trend of change. Chongqing is located in a valley surrounded by mountains and Changsha is located in the valley of the Xiang River, which are both affected by a subtropical monsoon climate. At the same time, the location, scope and intensity of HWs and extreme-temperature events in southern China are closely influenced by the western North Pacific subtropical high (WNPSH) and the East Asia jet stream (EAJS). The poleward displacement of the EAJS and an enhanced WNPSH over the midlatitudes of eastern China usually result in a “heat dome” over the region, and the heat waves extend northward or westward to cover a larger area of eastern China or southwest China (Wang et al., 2015). In north China, the threat by HWs and hot years in the past 60 years is relatively mild, except for Xi'an and Zhengzhou. The main cause is due to the anticyclone circling over Lake Baikal. Positive height anomalies at 500 hPa covering the north of China and easterly anomalies at 850 hPa in northwestern China correspond to anomalous high frequencies of HWs (Ding et al., 2010). For most cities in western and northern China, the high latitudes and high altitudes remarkably restrict the occurrence of HWs and extreme-temperature events, for which the threat is slight and there is no obvious increase in the past 60 years (Zhou and Ren, 2011). It is therefore worthwhile to explore how the atmospheric circulation patterns change in the future, which would reveal the spatiotemporal trends of HWs and extreme-temperature events in China. On the other hand, the elaborate depiction and accurate evaluation of HWs and extreme-temperature events in more cities of China would be meaningful for planning of disaster prevention and mitigation.
This study established an integrated index which contained the duration, intensity, extent and timing of HWs and extreme-temperature days. It showed a summary of heat threat in 31 main cities from 1955 to 2014.
Both HWs and extreme-temperature days showed an increasing trend from 1955 to 2014 in NC, CC, NE, SW, EC and SC; there was a slight decreasing trend in NW. For all of China, HWs and extreme-temperature days exhibited an obvious upward trend in the past 60 years with a rapid increase after the late 1980s.
The hottest regions were located in CC and EC over the past 60 years; the cities in SC and NC were faced with a middle level of threat; there was a low threat of heat events in most of the cities in NE, NW and SW, except Chongqing and Xi'an. In particular, Chongqing had been threatened by the most serious HW hazards, more so than the other cities.
There was obvious fluctuation for hot years in 31 cities over the past 60 years and they were not continuously rising with global warming. A total of 21 cities mainly located in the eastern and southern regions of China had an obvious rising trend. Eight cities had a clear declining trend which was mainly distributed in the western and northern regions of China. However, there were no extreme-temperature days in Kunming and Lhasa in the past 60 years. In particular, there were three stages for all 31 cities and the abrupt changes occurred separately in the early 1970s and late 1980s.
The historical weather data (1955–2014) that support the analysis in this study are from the National Meteorological Information Centre (NMIC) of the China Meteorological Administration (CMA) and are publicly available online at http://data.cma.cn/data/cdcdetail/dataCode/SURF_CLI_CHN_MUL_DAY_V3.0.html (last access: June 2020) (CMA, 2020).
The first and corresponding author (KL) was in charge of the data analysis, model construction and writing. The second author (GA) was responsible for data collection, mapping and polishing.
The authors declare that they have no conflict of interest.
Special thanks are due to the National Meteorological Information Centre (NMIC) of the China Meteorological Administration (CMA) for providing the national homogenized temperature data set in China.
This research has been supported by the National Key R & D Program of China (grant no. 2017YFD0300301).
This paper was edited by Vassiliki Kotroni and reviewed by two anonymous referees.
Alexander, L. V., Zhang, X., Peterson, T. C., Caesar, J., Gleason, B., KleinTank, A. M. G., Haylock, M., Collins, D., Trewin, B., Rahimzadeh, F., Tagipour, A., Kumar, K. R., Revadekar, J., Griffiths, G., Vincent, L., Stephenson, D. B., Burn, J., Aguilar, E., Brunet, M., Taylor, M., New, M., Zhai, P., Rusticucci, M., and Aguirre, J. L. V.: Global observed changes in daily climate extremes of temperature and precipitation, J. Geophys. Res.-Atmos., 111, D05109, https://doi.org/10.1029/2005JD006290, 2006.
Angélil, O., Stone, D., Wehner, M., Paciorek, C. J., Krishnan, H., and Collins, W.: An independent assessment of anthropogenic attribution statements for recent extreme temperature and rainfall events, J. Climate, 30, 5–16, https://doi.org/10.1175/JCLI-D-16-0077.1, 2017.
Bonsal, B. R., Zhang, X., Vincent, L. A., and Hogg, W. D.: Characteristics of daily and extreme temperatures over Canada, J. Climate, 14, 1959–1976, 2001.
Buscail, C., Upegui, E., and Viel, J. F.: Mapping heatwave health risk at the community level for public health action, Int. J. Health Geogr., 11, 38, https://doi.org/10.1186/1476-072X-11-38, 2012.
Chen, Y. and Li, Y.: An Inter-comparison of Three Heat Wave Types in China during 1961–2010: Observed Basic Features and Linear Trends, Sci. Rep., 7, 45619, https://doi.org/10.1038/srep45619, 2017.
CMA: Data set of daily values of surface climate in China (V3.0), available at: http://data.cma.cn/data/cdcdetail/dataCode/SURF_CLI_CHN_MUL_DAY_V3.0.html, last access: June 2020.
Coumou, D. and Rahmstorf, S.: A decade of weather extremes, Nat. Clim. Change, 2, 491–496, https://doi.org/10.1038/NCLIMATE1452, 2012.
Diffenbaugh, N.S., Singh, D., Mankin, J. S., Horton, D. E., Swain, D. L., Touma, D., Charland, A., Liu, Y., Haugen, M., Tsiang, M., and Rajaratnam, B.: Quantifying the influence of global warming on unprecedented extreme climate events, P. Natl. Acad. Si. USA, 114, 4881–4886, https://doi.org/10.1073/pnas.1618082114, 2016.
Dike, V. N., Shimizu, M. H., Diallo, M., Lin, Z. H., Nwofor, O., and Chineke, T. C.: Modelling present and future African climate using CMIP5 scenarios in HadGEM2-ES, Int. J. Climatol., 35, 1784–1799, https://doi.org/10.1002/joc.4084, 2015.
Ding, T., Qian, W. H., and Yan, Z. W.: Changes in hot days and heat waves in China during 1961–2007, Int. J. Climatol., 30, 1452–1462, https://doi.org/10.1002/joc.1989, 2010.
Dong, W. H., Liu, Z., Liao, H., Tang, Q. H., and Li, X. E.: New climate and socio-economic scenarios for assessing global human health challenges due to heat risk, Climatic Change, 130, 505–518, https://doi.org/10.1007/s10584-015-1372-8, 2015.
Easterling, D., Kunkel, K. E., Wehner, M. F., and Sun, L. Q.: Detection and attribution of climate extremes in the observed record, Weather Clim. Extrem., 11, 17–27, https://doi.org/10.1016/j.wace.2016.01.001, 2016.
Fang, S. B., Qi, Y., Han, G. J., Li, Q. X., and Zhou, G. S.: Changing trends and abrupt features of extreme temperature in mainland China from 1960 to 2010, Atmosphere, 7, 22, https://doi.org/10.3390/atmos7020022, 2016.
Fouillet, A., Gey, G., Laurent, F., Pavillon, G., Bellec, S., Guihenneuc, J. C., Clavel, J., Jougla, E., and Hémon, D.,: Excess mortality related to the August 2003 heat wave in France, Int. Arch. Occup. Environ. Health, 80, 16–24, https://doi.org/10.1007/s00420-006-0089-4, 2006.
Gasparrini, A., Guo, Y. M., Hashizume, M., Lavigne, E., Zanobetti, A., Schwartz, J., Tobias, A., Tong, S. L., and Rocklev, J.: Mortality risk attributable to high and low ambient temperature: a multicountry observational study, Lancet, 386, 369–375, https://doi.org/10.1016/S0140-6736(14)62114-0, 2015.
Gershunov, A., Cayan, D. R., and Iacobellis, S. F.: The great 2006 heat wave over California and Nevada: signal of an increasing trend, J. Climate, 22, 6181–6203, https://doi.org/10.1175/2009JCLI2465.1, 2009.
Hajat, S., Armstrong, B., Baccini, M., Biggeri, A., Bisanti, L., Russo, A., Paldy, A., Menne, B., and Kosatsky, T.: Impact of high temperatures on mortality: is there an added heat wave effect?, Epidemiology, 17, 632–638, https://doi.org/10.1097/01.ede.0000239688.70829.63, 2006.
Horton, D. E., Johnson, N. C., Singh, D., Swain, D. L., Rajaratnam, B., and Diffenbaugh, N. S.: Contribution of changes in atmospheric circulation patterns to extreme temperature trends, Nature, 522, 465-469, https://doi.org/10.1038/nature14550, 2015.
Huang, W., Kan, H. D., and Kovats, S.: The impact of the 2003 heat wave on mortality in Shanghai, China, Sci. Total Environ., 408, 2418–2420, https://doi.org/10.1016/j.scitotenv.2010.02.009, 2010.
Johnson, D. P., Wilson, J. S., and Luber, G. C.: Socioeconomic indicators of heat-related health risk supplemented with remotely sensed data, Int. J. Health Geogr., 8, 57, https://doi.org/10.1186/1476-072X-8-57, 2009.
Jones, B., O'Neill, B. C., McDaniel, L., McGinnis, S., Mearns, L. O., and Tebaldi, C.: Future population exposure to US heat extremes, Nat. Clim. Change, 5, 652–655, https://doi.org/10.1038/nclimate2631, 2015.
Klein Tank, A. M. G. and Können, G. P.: Trends in indices of daily temperature and precipitation extremes in Europe, 1946–99, J. Climate, 16, 3665–3680, https://doi.org/10.1175/1520-0442(2003)016<3665:TIIODT>2.0.CO;2, 2003.
Klein Tank, A. M. G., Zwiers, F. W., and Zhang, X.: Guidelines on Analysis of Extremes in a Changing Climate in Support of Informed Decisions for Adaptation, WMO, Geneva, Switzerland, 2009.
Li, Z., Liu, W. Z., and Zheng, F. L.: Trends of extreme temperature events in Jinghe watershed during 1965–2005, Sci. Geogr. Sin., 30, 469–474, https://doi.org/10.3724/SP.J.1037.2010.00186, 2010.
Liang, K., Bai, P., Li, J. J., and Liu, C. M.: Variability of temperature extremes in the yellow river basin during 1961–2011, Quatern. Int., 336, 52–64, https://doi.org/10.1016/j.quaint.2014.02.007, 2014.
Liu, L., Xu, Z. X., and Huang, J. X.: Spatio-temporal variation and abrupt changes for major climate variables in the Taihu Basin, China, Stoch. Environ. Res. Risk A., 26, 777–791, https://doi.org/10.1007/s00477-011-0547-8, 2012.
Liu, Z., Anderson, B., Yan, K., Dong, W. H., Liao, H., and Shi, P. J.: Global and regional changes in exposure to extreme heat and the relative contributions of climate and population change, Sci. Rep., 7, 43909, https://doi.org/10.1038/srep43909, 2017.
Nemec, J., Gruber, C., Chimani, B., and Auer, I.: Trends in extreme temperature indices in Austria based on a new homogenised dataset, Int. J. Climatol., 33, 1538–1550, https://doi.org/10.1002/joc.3532, 2013.
Oswald, E. M. and Rood, R. B.: A trend analysis of the 1930–2010 extreme heat events in the continental United States, J. Appl. Meteorol. Clim., 53, 565–582, https://doi.org/10.1175/JAMC-D-13-071.1, 2014.
Perkins, S. E. and Alexander, L. V.: On the measurement of heat waves, J. Climate, 26, 4500–4517, https://doi.org/10.1175/jcli-d-12-00383.1, 2013.
Peterson, T.C., Heim, R. R. J., Hirsch, R., Kaiser, D. P., Brooks, H., Diffenbaugh, N. S., Dole, R. M., Giovannettone, J. P., Guirguis, K., Karl, T. R., Katz, R. W., and Kunkel, K.: Monitoring and understanding changes in heat waves, cold waves, floods and droughts in the United States: State of knowledge, B. Am. Meteorol. Soc., 94, 821–834, https://doi.org/10.1175/BAMS-D-12-00066.1, 2013.
Pingale, S. M., Khare, D., Jat, M. K., and Adamowski, J.: Adamowski. Spatial and temporal trends of mean and extreme rainfall and temperature for the 33 urban centers of the arid and semi-arid state of Rajasthan, India, Atmos. Res., 138, 73–90, https://doi.org/10.1016/j.atmosres.2013.10.024, 2014.
Qi, L. and Wang, Y. Q.: Changes in the observed trends in extreme temperatures over China around 1990, J. Climate, 25, 5208–5222, https://doi.org/10.1175/jcli-d-11-00437.1, 2012.
Robine, J. M., Cheung, S. L., Le Roy, S., Van Oyen, H., Griffiths, C., Michel, J. P., and Herrmann, F. R.: Death toll exceeded 70,000 in Europe during the summer of 2003, C. R. Biol., 331, 171–178, https://doi.org/10.1016/j.crvi.2007.12.001, 2008.
Robinson, P. J.: On the definition of a heat wave, J. Appl. Meteorol., 40, 762–775, https://doi.org/10.1175/1520-0450(2001)040<0762:OTDOAH>2.0.CO;2, 2001.
Rusticucci, M.: Observed and simulated variability of extreme temperature events over south America, Atmos. Res., 106, 1–17, https://doi.org/10.1016/j.atmosres.2011.11.001, 2012.
Santamouris, M., Cartalis, C., Synnefa, A., and Kolokotsa, D.: On the impact of urban heat island and global warming on the power demand and electricity consumption of buildings – a review, Energ. Build., 98, 119–124, https://doi.org/10.1016/j.enbuild.2014.09.052, 2015.
Spinoni, J., Lakatos, M., Szentimrey, T., Bihari, Z., Szalai, S., Vogt, J., and Antofie, T.: Heat and cold waves trends in the Carpathian Region from 1961 to 2010, Int. J. Climatol., 35, 4197–4209, https://doi.org/10.1002/joc.4279, 2015.
Stocker, T. F., Qin, D. H., Plattner, G. K., Tignor, M., Allen, S. K., Boschung, J., Nauels, A., Xia, Y., Bex, V., and Midgley, P. M.: Contribution of Working Group I to the Fifth Assessment Report of the Intergovernmental Panel on Climate Change, Summary for policymaker: The Physical Science Basis, Cambridge University Press, Cambridge, 30–40, 2013.
Stott, P. A., Stone, D. A., and Allen, M. R.: Human contribution to the European heatwave of 2003, Nature, 432, 610–614, https://doi.org/10.1038/nature03089, 2004.
Sun, Y., Zhang, X. B., Zwiers, F. W., Song, L. C., Wan, H., Hu, T., Yin, H., and Ren, G. Y.: Rapid increase in the risk of extreme summer heat in Eastern China, Nat. Clim. Change, 4, 1082–1085, https://doi.org/10.1038/nclimate2410, 2014.
Uhe, P., Otto, F. E. L., Haustein, K., Oldenborgh, G. J. V., King, A. D., Wallom, D., Allen, M. R., and Cullen, H.: Comparison of methods: Attributing the 2014 record European temperatures to human influences, Geophys. Res. Lett., 43, 8685–8693, https://doi.org/10.1002/2016GL069568, 2016.
Wang, W. W., Zhou, W., Li, X. Z., Wang, X., and Wang, D. X.: Synoptic-scale characteristics and atmospheric controls of summer heat waves in China, Clim. Dynam., 46, 2923–2941, https://doi.org/10.1007/s00382-015-2741-8, 2015.
Xu, W. H., Li, Q. X., Wang, X. L., Yang, S., Cao, L. J., and Yang, F.: Homogenization of Chinese daily surface air temperatures and analysis of trends in the extreme temperature inices, J. Geophys. Res.-Atmos., 118, 9708–9720, https://doi.org/10.1002/jgrd.50791, 2013.
Yang, Q. Y., Wu, S. H., and Zheng, D.: A retrospect and prospect of researches on regional physio-geographical system (RPGS), J. Geogr. Res., 21, 407–417, https://doi.org/10.1080/12265080208422884, 2002.
You, Q. L., Ren, G. Y., Fraedrich, K., Kang, S. C., Ren, Y. Y., and Wang, P. L.: Winter temperature extremes in china and their possible causes, Int. J. Climatol., 33, 1444–1455, https://doi.org/10.1002/joc.3525, 2013.
Zhang, X. B., Hegerl, G. C., Zwiers, F. W., and Kenyon, J.: Avoiding inhomogeneity in percentile-based indices of temperature extremes, J. Climate, 18, 1641–1651, https://doi.org/10.1175/JCLI3366.1, 2005.
Zhou, Y. Q. and Ren, G. Y.: Change in extreme temperature event frequency over main land China, 1961–2008, Clim. Res., 50, 125–139, https://doi.org/10.3354/cr01053, 2011.