the Creative Commons Attribution 4.0 License.
the Creative Commons Attribution 4.0 License.
 | 05 Jun 2020
Brief communication: Seasonal prediction of salinity intrusion in the Mekong Delta
Mai Khiem
Nguyen Hong Quan
To Quang Toan
The Mekong Delta is the most important food production area in Vietnam, but salinity intrusion during the dry season poses a serious threat to agricultural production and livelihoods. A seasonal forecast of salinity intrusion is required in order to mitigate the negative effects. This communication presents a statistical seasonal forecast model based on logistic regression using either the ENSO34 index or streamflow as a predictor. The model is able to reliably predict the salinity intrusion up to 9 months ahead (receiver operating characteristic (ROC) scores: >0.8). The model can thus be used operationally as a basis for timely adaptation and mitigation planning.
- Article
(5935 KB) - Full-text XML
-
Supplement
(165 KB) - BibTeX
- EndNote


The Mekong Delta (MKD) is the most important food production area in Vietnam and is responsible for about 56 % of the rice production of Vietnam and 20 % of the agricultural exports of Vietnam as a whole (source: General Statistics Office of Vietnam, GSO, http://www.gso.gov.vn, last access: March 2020). As a low-lying coastal area in a monsoonal climate with distinct wet and dry season, it is naturally prone to salt-water intrusion into the river and channel network during the dry low-flow season. Sea level rise and climate change aggravate this problem, causing more severe, longer-lasting, and more frequent droughts, with the consequence of more severe (longer-lasting and higher salinity levels) and more frequent salinity intrusions during the dry season (Smajgl et al., 2015). The current agricultural production systems and livelihoods have adapted to a given intensity of salinity intrusion over time, but these changes pose a serious threat to the agricultural production and livelihood of the population. A drastic example of the immense negative effects of a strong salinity intrusion is the dry season of 2015/2016. This unprecedented high-salinity intrusion – which manifested in the earliest onset of high-salinity levels, the highest observed salinity measurements in many places, the longest duration, and the deepest penetration of saline water in the river system ever observed – caused widespread crop loss throughout the delta. Of the 13 provinces in the Mekong Delta, 9 were affected by severe salinity intrusion, and all provinces were affected by water shortage (Nguyen, 2017). Approximately 400 000 ha of cropland was subject to saline irrigation water, of which 238 276 ha was paddy rice fields. The salinity intrusion also affected 6575 ha of vegetables, 29 277 ha of fruit trees, and 79 000 ha of aquaculture, affecting mainly brackish water shrimp. Figure 1 provides an overview of the land use in the Mekong Delta as observed and classified in 2010 by satellite remote sensing (Leinenkugel et al., 2013). It roughly illustrates the main affected cropping types in the coastal areas of the delta. The overall economic damages amounted to VND 5.5 trillion, equivalent to about USD 236 million and 0.74 % of the national gross domestic product of the agriculture, fishery, and forestry sectors in 2016 (source: GSO). Furthermore the Vietnamese National Steering Center for Natural Disaster Prevention and Control reported that 194 000 households lacked fresh water for domestic use in the Mekong Delta (VDMA, 2016).
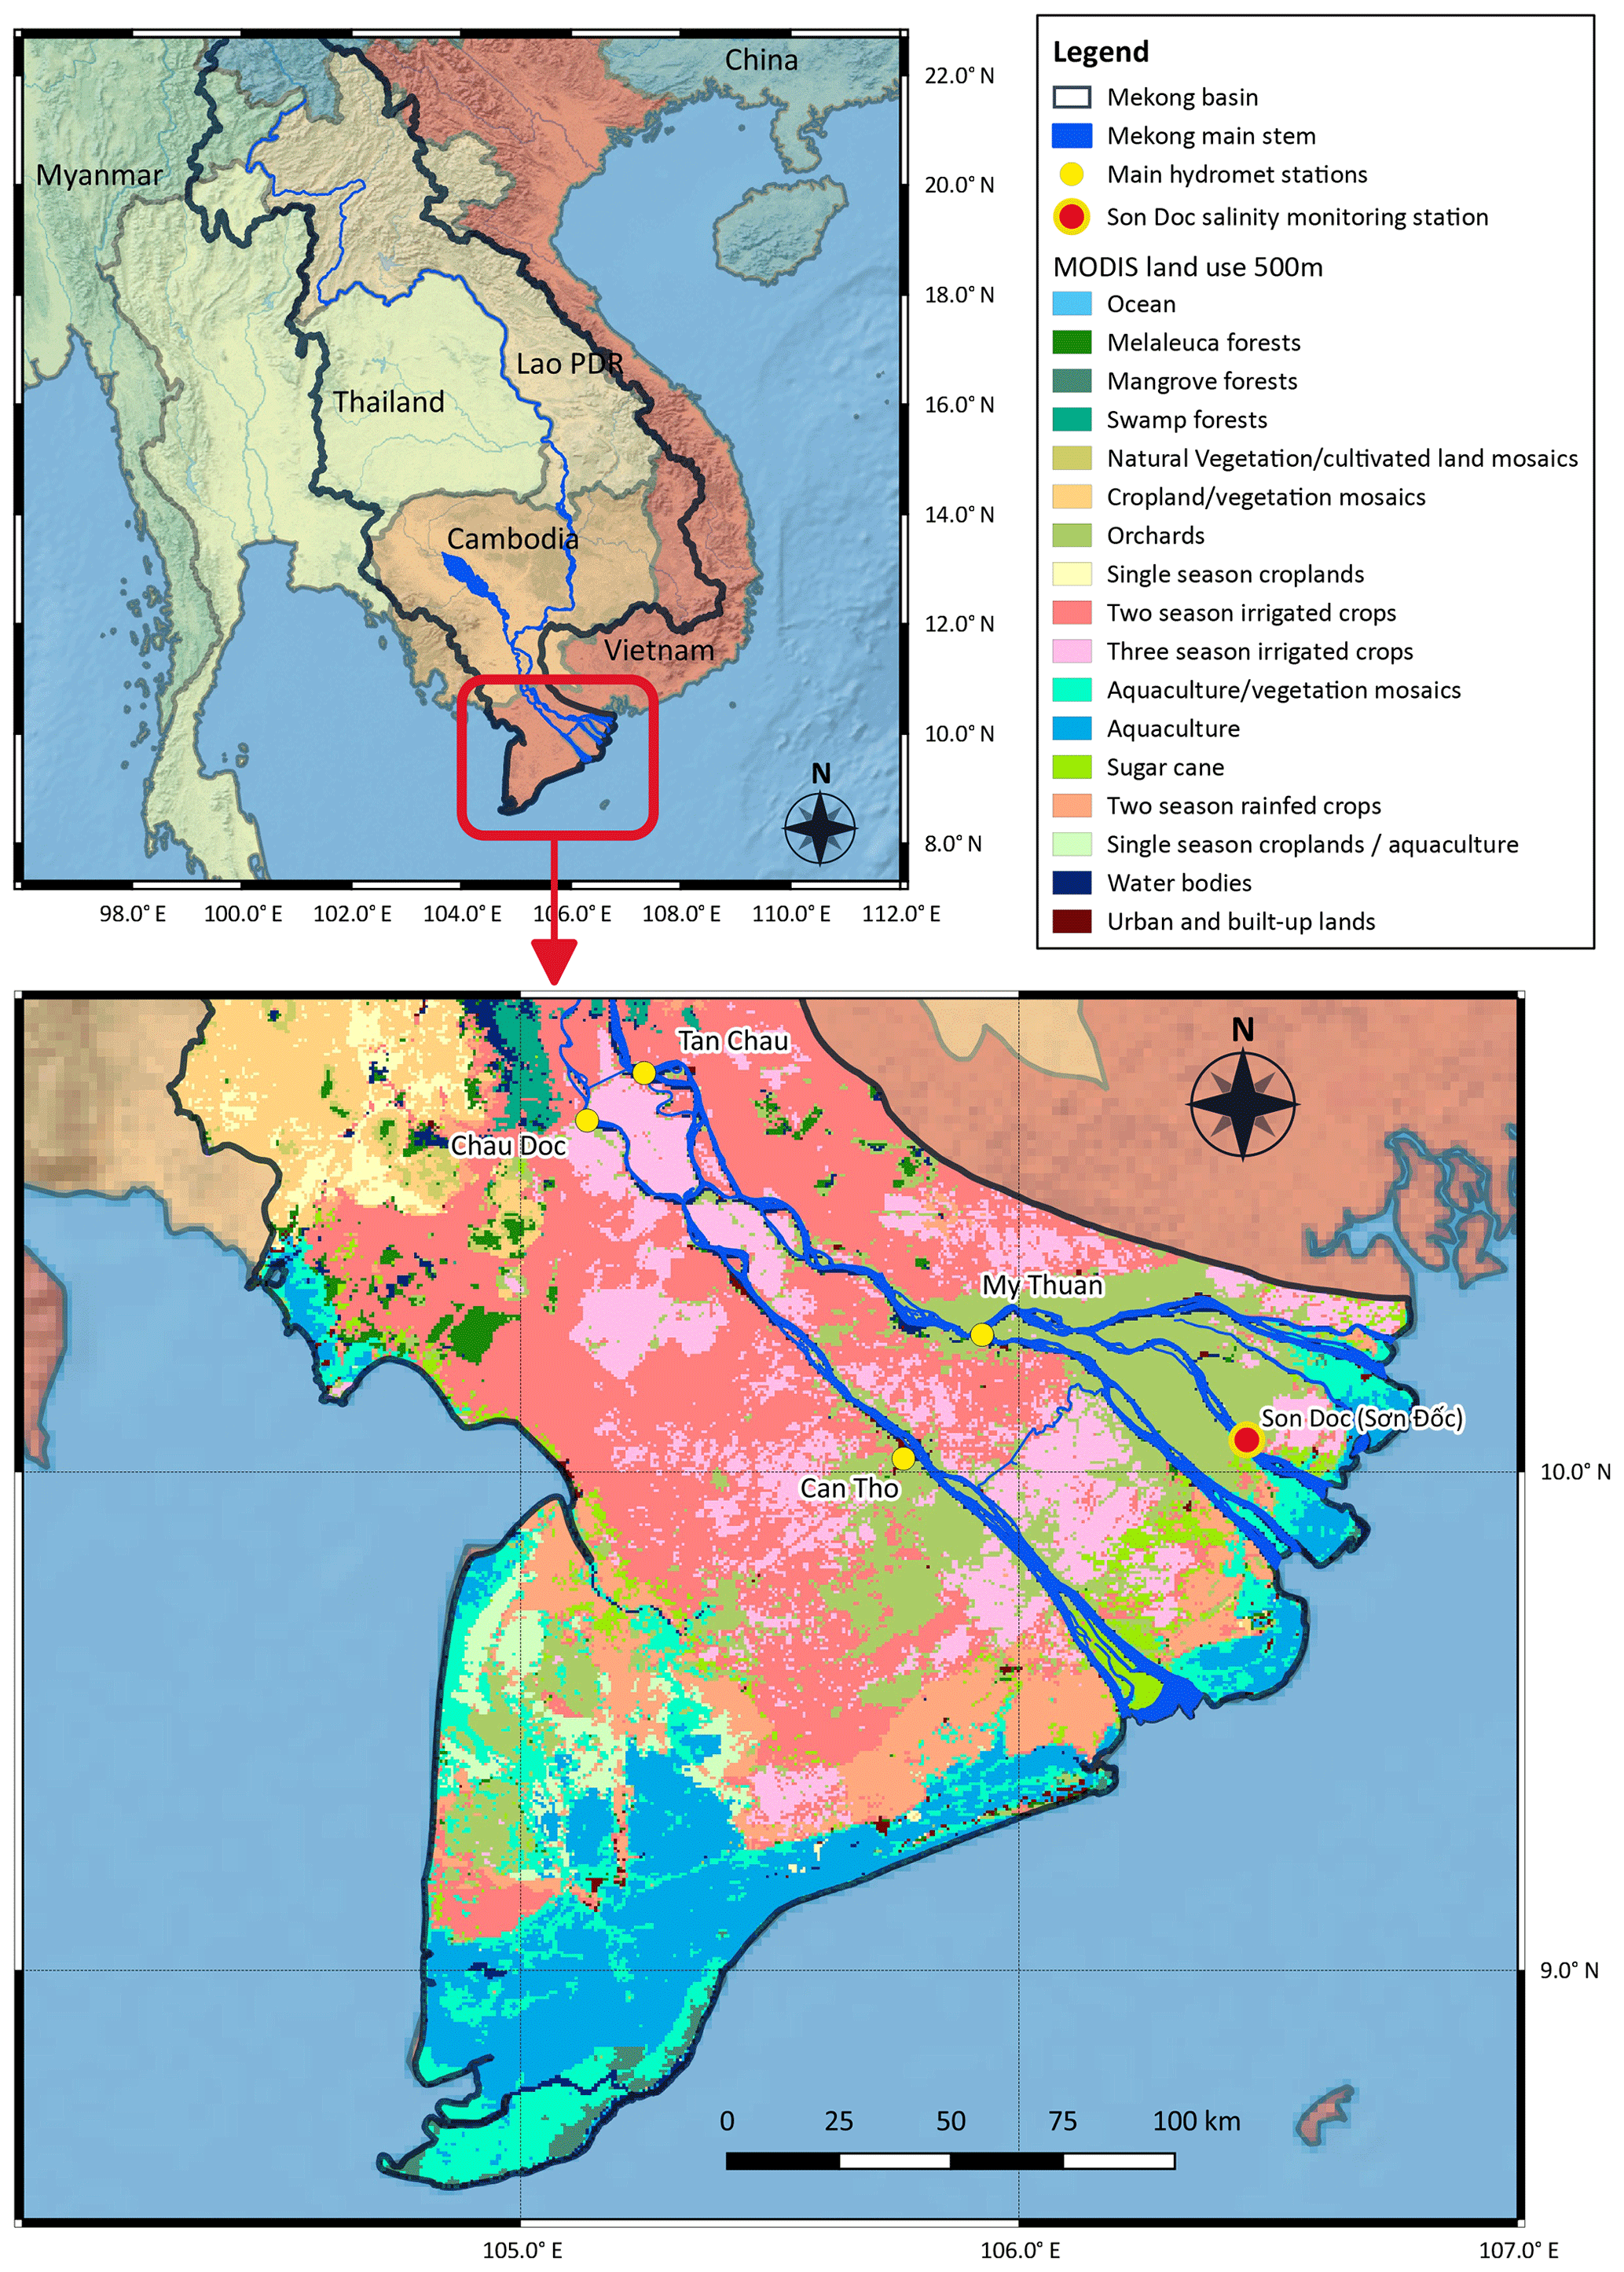
Figure 1Overview map of the Mekong Delta study area. Top left: regional overview showing South East Asia with the Mekong basin and delta and the neighbouring countries. The background country, ocean, and topography maps are made with Natural Earth (free vector and raster map data at http://naturalearthdata.com/, last access: 25 February 2020). Bottom: the Vietnamese part of the Mekong Delta with the location of the main official and permanent hydro-meteorological monitoring stations and the salinity monitoring station Son Doc. The land use map of the Mekong Delta as in 2010 is shown for reference and illustrates the different land use types in the different regions of the delta. The map was derived at 500 m resolution from Moderate Resolution Imaging Spectrometer (MODIS) satellite images. Source: Catch-Mekong Knowledge Hub, https://catchmekong.eoc.dlr.de/Elvis/, last access: 25 February 2020; provided by © the German Aerospace Center, DLR. The method of land use classification is described in Leinenkugel et al. (2013).
The main damaging effect is the lack of fresh water required for irrigation of rice paddies but also of fruit orchards and vegetable farming. The crops are damaged or even die either by lack of water or by the adverse effects of high salt concentration in the irrigation water. Because of these effects, salinity intrusion in the Mekong Delta can also be termed as agricultural drought following the general definition of agricultural drought as a situation in which plant water demands cannot be satisfied by water availability (Mannocchi et al., 2004; Mishra and Singh, 2010). By terming salinity intrusion an agricultural drought we hereby extend the definition of water availability from a pure physical, quantitative view to a water quality perspective. This agricultural drought is a serious hazard for large parts of the population for which irrigation-based agriculture is still the basis of livelihoods. An important factor for the large damages was the lack of appropriate mitigation plans and a timely warning of serious salinity intrusion in order to prepare and adapt agricultural practices for damage reduction.
However, studies and publications dealing with direct forecasts or early warning of salinity intrusion in the Mekong Delta do not exist. This holds true for both short-term and seasonal forecasts. The presented study is thus a novel work in this regional context but also beyond. Publications about forecast models of salinity intrusion are rather scarce in general. There are just a few papers dealing with this issue. All of them apply different methods than the method presented in this study. The approaches of other studies are (a) hydrodynamic modelling of salinity intrusion and the coupling of these models with meteorological and tidal forecast models (Risley et al., 1993), (b) the use of artificial neural networks (Lu and Chen, 2010; Roehl et al., 2013), (c) kernel-based support vector machines (Rohmer and Brisset, 2017), and (d) power law models derived from hydrodynamic models (Etemad-Shahidi et al., 2008). The approaches applied in these studies are quite complex and require an extensive set of data and models.
Although there is this clear gap in the literature, operational forecasts of salinity intrusion in the Mekong Delta are made by the National Centre for Hydro-Meteorological Forecasting (NCHMF) and the Southern Institute of Water Resources Research (SIWRR) under the authority of the Ministry of Agriculture and Rural Development (MARD). The forecasts are provided to MARD and distributed among governmental agencies and provincial governments in the MKD. Both forecasts are based on a complex chain of hydrological and hydraulic models, which are fed by precipitation and tidal monitoring data and forecasts. The forecasts of the NCHMF are short-term, i.e. with a lead time of 10 d, and are issued on a regular basis every 5–10 d. The forecasts of SIWRR also cover longer lead times up to a maximum of 2 months. The core of the forecast model of SIWRR is described in Toan (2014). This lead time is, however, too short to plan and adapt the cropping system well ahead of the drought event. Forecasts with lead times of several months are required to change the cropping system and to prepare for crop planting during the dry season (December to April).
A drought like the one in 2016 is expected to occur more often in the future as negative rainfall anomalies occurring with El Niño events are expected to occur more frequently (Azad and Rajeevan, 2016). Moreover, sea levels around the Mekong Delta are rising and are expected to rise further in future (Smajgl et al., 2015). Rising sea levels cause increasing backwater effects and reverse flow in the river channels, thus promoting salinity intrusion during the dry season. The 2016 event was a wake-up call for society and officials in Vietnam as it proved that large structural problems in drought management and mitigation exist. In order to support disaster management this study aims to develop a reliable and simple salinity intrusion forecast system enabling lead times of several months and thus better early-warning capabilities as well as adaptation to and mitigation of the adverse impacts of salinity intrusion and agricultural droughts in the Mekong Delta.
The hydrology of the Mekong Delta and Mekong basin is dominated by a monsoonal climate, separating the hydrological year into distinct rainy/high-flow and dry/low-flow seasons. The hydrological regime lags behind the climate regime depending on the location in the basin. In the Mekong Delta this lag is most noticeable due to the time required for transforming rainfall in the approximately 800 000 km2 basin to river discharge and routing the discharge to the delta. The lag time in the delta between the onset and end of the rainy and flood season can be up to 2 months. Moreover, the dry-season discharge in the Mekong Delta crucially depends on the discharge generated in the Mekong basin, which in turn depends on the amount of rainfall in the basin during the monsoon period. Discharge in the Mekong basin and delta is therefore highly correlated with the monsoon intensity (Delgado et al., 2012; Räsänen and Kummu, 2013). The South East Asian monsoon intensity is itself determined by the periodically changing sea surface temperatures in the western central Pacific Ocean (West Pacific Warm Pool) that are associated with the El Niño–Southern Oscillation (ENSO). Of particular importance for the monsoon strength is the situation of ENSO in winter and spring prior to the monsoon season, when the general circulation and moisture fluxes for the monsoon season are initiated (Ju and Slingo, 1995). Strong South East Asian monsoons are associated with La Niña events, while weak monsoons and thus higher chances of salinity intrusion in the dry season are associated with El Niño events (Ju and Slingo, 1995). Therefore, a general causal chain for dry-season discharge and thus salinity intrusion in the Mekong Delta can be formulated as follows: ENSO determines the intensity of the South East Asian monsoon, the monsoon intensity determines the rainfall amount over the Mekong basin, the rainfall amount determines the flood-season discharge, the flood-season discharge is itself indicative of the following dry-season discharge, and the dry-season discharge controls the salinity intrusion in the Mekong Delta.
This general causal chain forms the basis for the simple salinity intrusion forecast model presented in this study. Firstly, an early forecast will be attempted utilizing an ENSO index as a predictor. Secondly, an additional forecast will be tested using flood-season and early dry-season discharge as a predictor. Monthly ENSO indexes were collected from the Physical Sciences Division (PSD) of the Earth System Research Laboratory (ESRL) of the National Oceanic and Atmospheric Administration (NOAA; https://www.esrl.noaa.gov/psd/data/climateindices/list/, last access: May 2019). Furthermore, monthly discharge data were collected from the Southern Regional Hydrometeorological Center (SRHMC) for the gauging station Tan Chau, located at the Mekong (Tien in Vietnam) branch of the Mekong in the delta (Fig. 1). The salinity of surface water in the MKD is also measured by the SRHMC but during the dry season only. Salinity is monitored at 39 locations in the MKD and is determined by collecting water samples mid-river at 20 %, 50 % and 80 % of the water depth. The samples are analysed in the laboratory, and the reported salinity is the mean of these three measurements. If the water depth is below 3 m, only one sample is taken at mid-depth. Due to constraints in personal and monetary resources, the monitoring is, however, not time-continuous. The general scheme is to measure 2–3 d in a row at 2 h intervals (i.e. 12 measurements per day). This measurement period is followed by 2–4 d without measurements, after which the monitoring resumes. The salinity time series used in the model development was recorded at gauge Son Doc in Ben Tre province in the estuary of the Mekong (Tien) river branch. Son Doc is located about 175 km downstream of the gauge Tan Chau and about 24 km upstream of the river mouth (Fig. 1). The salinity measurements covered all dry seasons in the time span 1996–2016. The temporal coverage of the salinity measurements at Son Doc is shown in Supplement Sect. S1. In order to derive a meaningful predictand of salinity intrusion, the mean salinity of February and March (February–March) was calculated from the available salinity measurements. This aggregation time period was chosen because it coincides with the vegetative stage of irrigated paddies grown during the dry season, which is the most sensitive phase of paddy rice to high salinity levels (Zeng et al., 2001).
The envisaged seasonal forecast of salinity intrusion does not aim to forecast the exact mean salinity intrusion of this period but rather to forecast the probability of exceedance of critical levels of salinity intrusion. For paddy rice a salinity of the irrigation water exceeding 4 g L−1 is seen by the authorities in Vietnam as too high for the plants to survive during the vegetative stage (cf. Zeng and Shannon, 2000). Therefore a mean salinity of 4 g L−1 during February and March is adopted as the critical salinity level for the forecast model. The mean salinity threshold during this period means that this threshold will be exceeded 43 % of the time, considering the negative exponential distribution of the data (cf. Supplement Sect. S2) and assuming that the discontinuous measurements are representative of the whole time period. In addition to the critical salinity level a threshold of 3 g L−1 mean February–March salinity is used as a predictand. This threshold is exceeded 53 % of the time in February and March (cf. Supplement Sect. S2) and serves as a warning threshold, indicating a strong salinity intrusion with chances of salinity also exceeding 4 g L−1 at times. Rice irrigated with this salinity threshold might survive depending on the duration of the irrigation with saline water, but losses in crop yield have to be expected (Grattan et al., 2002; Zeng and Shannon, 2000).
The forecast model is based on a logistic regression (LR), i.e. a linear statistical model that relates categorized values to continuous, real-number type predictors (Menard, 2009). LR has to our knowledge never been used in forecasting salinity intrusion. Moreover, a seasonal forecast of salinity intrusion, i.e. a forecast with several months lead time, has not been published before. The presented work is thus also novel in this aspect. Compared to the published approaches of salinity intrusion listed in the introduction and the model chains used for the operational forecasts, forecasting with LR is a very simple and data-sparse approach.
The categories to be predicted by the LR are the mean February–March salinity values categorized in bins above or below the defined salinity thresholds (4 and 3 g L−1). The continuous predictors are monthly ENSO index and standardized streamflow index (SSI) values. For this kind of regression LR is the appropriate tool. LR is very flexible in its application because it is not limited to normally distributed predictors as, for example, the possible alternative method of linear discriminant analysis is (Pohar et al., 2004). Regression models were developed with a single predictor using either ENSO indexes or SSIs following the causal chain leading to salinity intrusion in the MKD described above. The ENSO indexes tested were monthly ENSO1, ENSO3, ENSO4, and ENSO34 indexes. All of these indexes aim to represent the state of the El Niño–Southern Oscillation by considering sea surface temperatures at different regions of the Pacific Ocean. Among these indexes ENSO34 is regarded as the most appropriate sea surface temperature index representing the general state of ENSO (Bamston et al., 1997). The testing of different indexes aims to identify the most robust predictor for salinity intrusion in the MKD. All of the ENSO indexes used in the forecast models start in April of the year before the dry season, i.e. with a lead time of up to 9 months before the start of the forecasted February–March time period. For the streamflow predictors, the monthly discharges recorded at the Tan Chau station were transformed into SSIs. This transformation is similar to transforming precipitation records into standardized precipitation indexes (SPIs), as typically done in drought studies and drought definitions (Mishra and Singh, 2010). SSIs have been applied as predictands in seasonal forecast studies, e.g. for predicting streamflow in southern Africa (Seibert et al., 2017). SSIs normalize the monthly discharges by fitting a gamma distribution to the observed long-term record of discharges (here from 1980 to 2016) and transferring it to a normal distribution with a mean of 0. A SSI value of 0 thus indicates the normal hydrological state, while negative values indicate a water deficiency. SSIs have the advantage that a drought condition can be directly recognized by the SSI value and that the prediction models can be easier transferred and compared to other gauging stations with different streamflow magnitudes. Another strength of SSIs is that they can be calculated for a variety of timescales. This is important because droughts usually manifest over extended time periods. SSIs were thus derived for different timescales ranging from 1 month (SSI1) to 6 months (SSI6), each starting in June prior to the dry season, i.e. with a maximum of 7 months lead time. The calculation of the SSIs was performed with the R package SPEI (Vicente-Serrano et al., 2012). Supplement Sect. S3 provides a list of all predictors used in the detection of the best performing forecast models.
The logistic regression models were fitted by iteratively reweighted least squares using the R function glm for a binomial model type, which represents the logistic regression. A fitted LR model provides estimates of the probability of exceedance of the defined salinity thresholds depending on the predictor value. One model was fitted for all predictors and lead times, and the best performing ENSO and SSI predictors for the different lead times were manually selected according to the following criteria:
-
the receiver operating characteristic (ROC) score (Mason, 2008);
-
the Akaike information criterion (AIC) (Burnham and Anderson, 2004);
-
the Cragg and Uhlers (also known as Nagelkerke) pseudo-R2 (Nagelkerke, 1991), which is defined for categorical variables analogously to the normal R2 for continuous variables;
-
the accuracy (rate of correct forecasts).
In order to test the robustness of the linear models a leave-one-out cross-validation (LOOCV) was also performed as applied in Apel et al. (2018) for forecasting seasonal streamflow in central Asia. A robust model is characterized by a model for which the performance values of the LOOCV do not deteriorate compared to the performance of the model using the full data set. Therefore, the ROC scores and accuracies of the LOOCV were used in addition to the performance criteria listed above for the selection of the best performing forecast models.
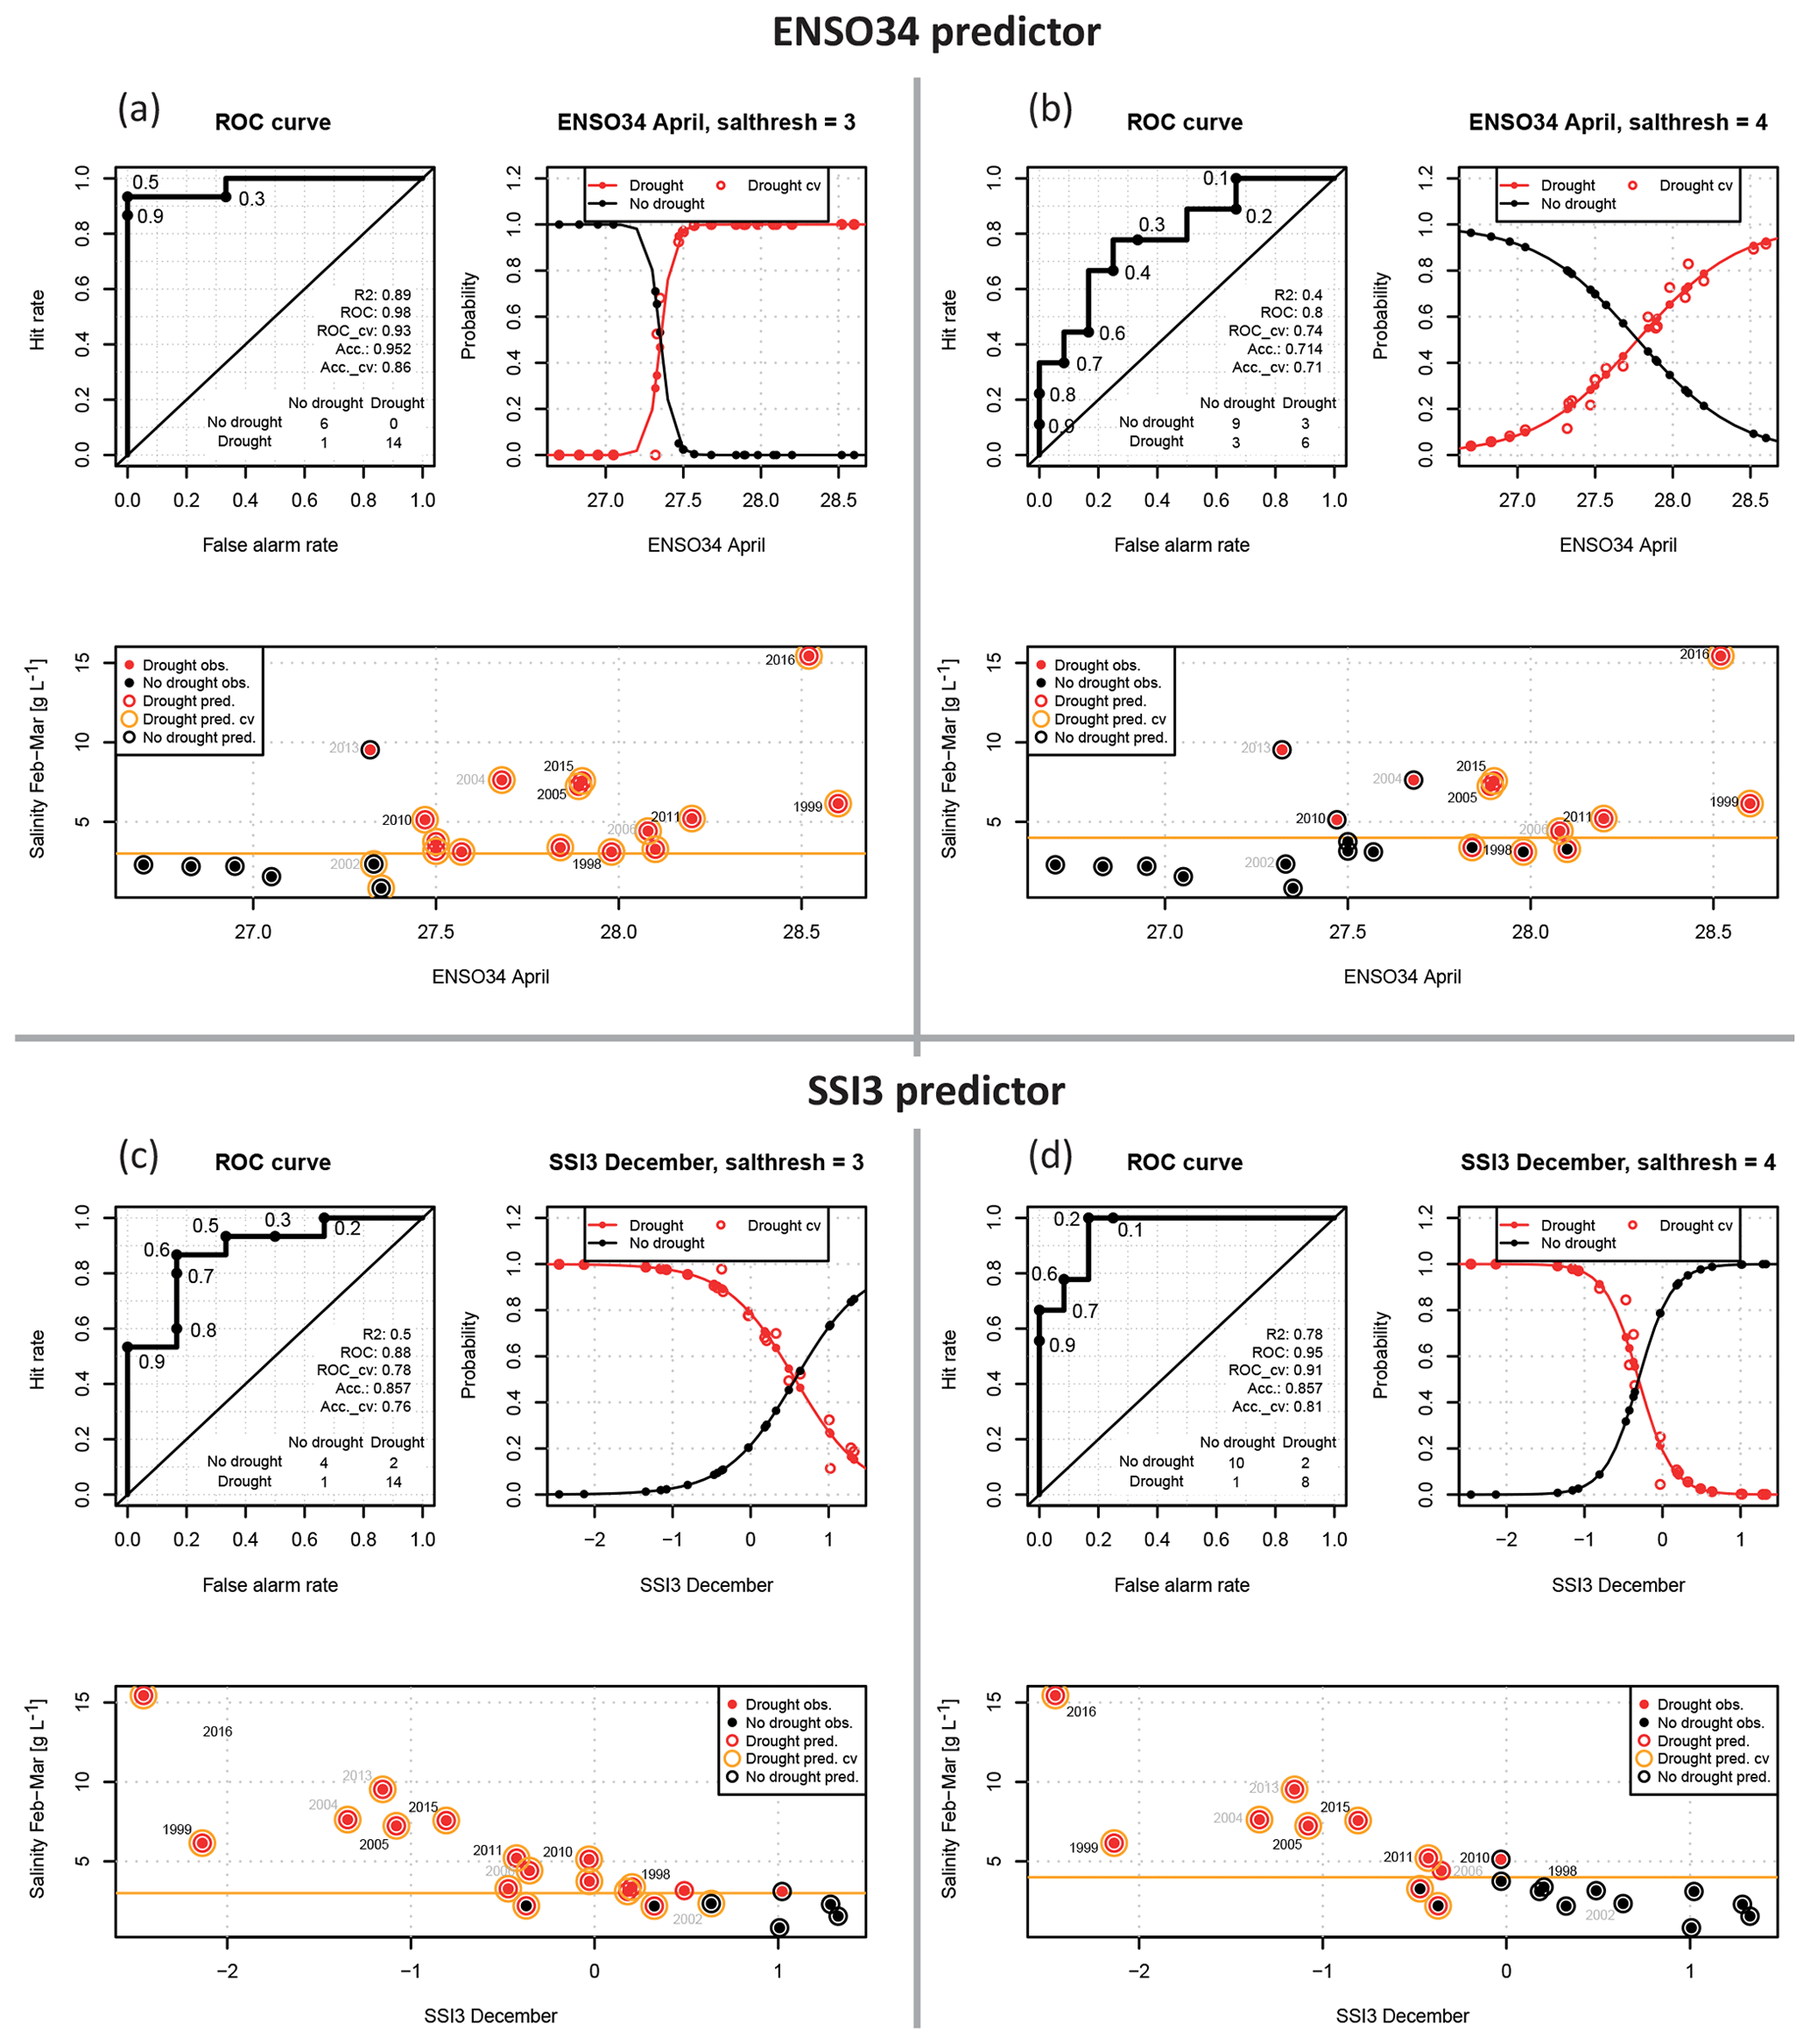
Figure 2Best prediction models using the ENSO34 index (top row: a and b) and SSI3 (bottom row: c and d) as predictors for forecasting exceedance of the 3 g L−1 (left: a and c) and 4 g L−1 (right: b and d) salinity threshold (“salthresh”). The top left insets of (a) to (d) show the ROC curves with the following performance criteria: R2 is the Cragg and Uhlers pseudo-R2; ROC is the ROC score; ROC_cv is the ROC score of the LOOCV; Acc is the accuracy (fraction-correct predictions); and Acc_cv is the accuracy of the LOOCV. The top right insets of (a) to (d) show the logistic regression results with the probabilities of exceedance and non-exceedance of the salinity thresholds depending on the predictor. The bottom insets of (a) to (d) show the observed mean February–March salinity levels at Son Doc and the predictions in terms of exceedance of the salinity thresholds.
The performance testing of the ENSO predictors identified the ENSO34 index as the best performing ENSO index. The best forecast could be obtained with the April index, i.e. with a lead time of 9 months. Figure 2a and b illustrate the performance of the forecast model. Using only the ENSO34 index of April an ROC score of 0.98 and 0.8 and an accuracy of 95 % and 71 % could be achieved for the 3 and 4 g L−1 thresholds, respectively. The pseudo-R2's of 0.89 (3 g L−1 threshold) and 0.4 (4 g L−1 threshold) confirm this excellent performance, considering the typically lower values of pseudo-R2 compared to normal R2 values. This performance is exceptionally high for a seasonal forecast with such a long lead time. The LOOCV resulted in similar high performances, thus indicating the robustness of the statistical model. The logistic regression curves in the top right insets show that the 3 g L−1 threshold can be very well discriminated by the ENSO34 index. The steep slopes of the probabilities changing from drought classification to non-drought classification illustrate this. For the 4 g L−1 threshold the slopes are more gentle, indicating a less pronounced discrimination, which is expressed by the lower performance values. The bottom insets in the figure panels show the observed drought events with reported high-salinity intrusion and the forecasts of the model, including the LOOCV forecasts. It can be seen that only 1 out of 21 dry seasons would have been misclassified as drought for the 3 g L−1 threshold. For the 4 g L−1 threshold 6 out of 21 events would have been wrongly predicted. In this context it has to be noted that the probability threshold for classifying a forecast as a drought was set to 0.5. Different probability thresholds for drought classification have been tested and resulted in different classification errors, but the number of wrong classifications and thus the performance values remained the same.
The forecast performance with ENSO decreases with decreasing lead times, as shown in Fig. 3a by decreasing ROC scores and increasing AIC values. This finding is in line with the causal chain explained above, where ENSO precedes the monsoon development. During the monsoon period ENSO changes to a different state but with less of an impact on the monsoon intensity (Ju and Slingo, 1995); thus the value of ENSO as a predictor for salinity intrusion decreases.
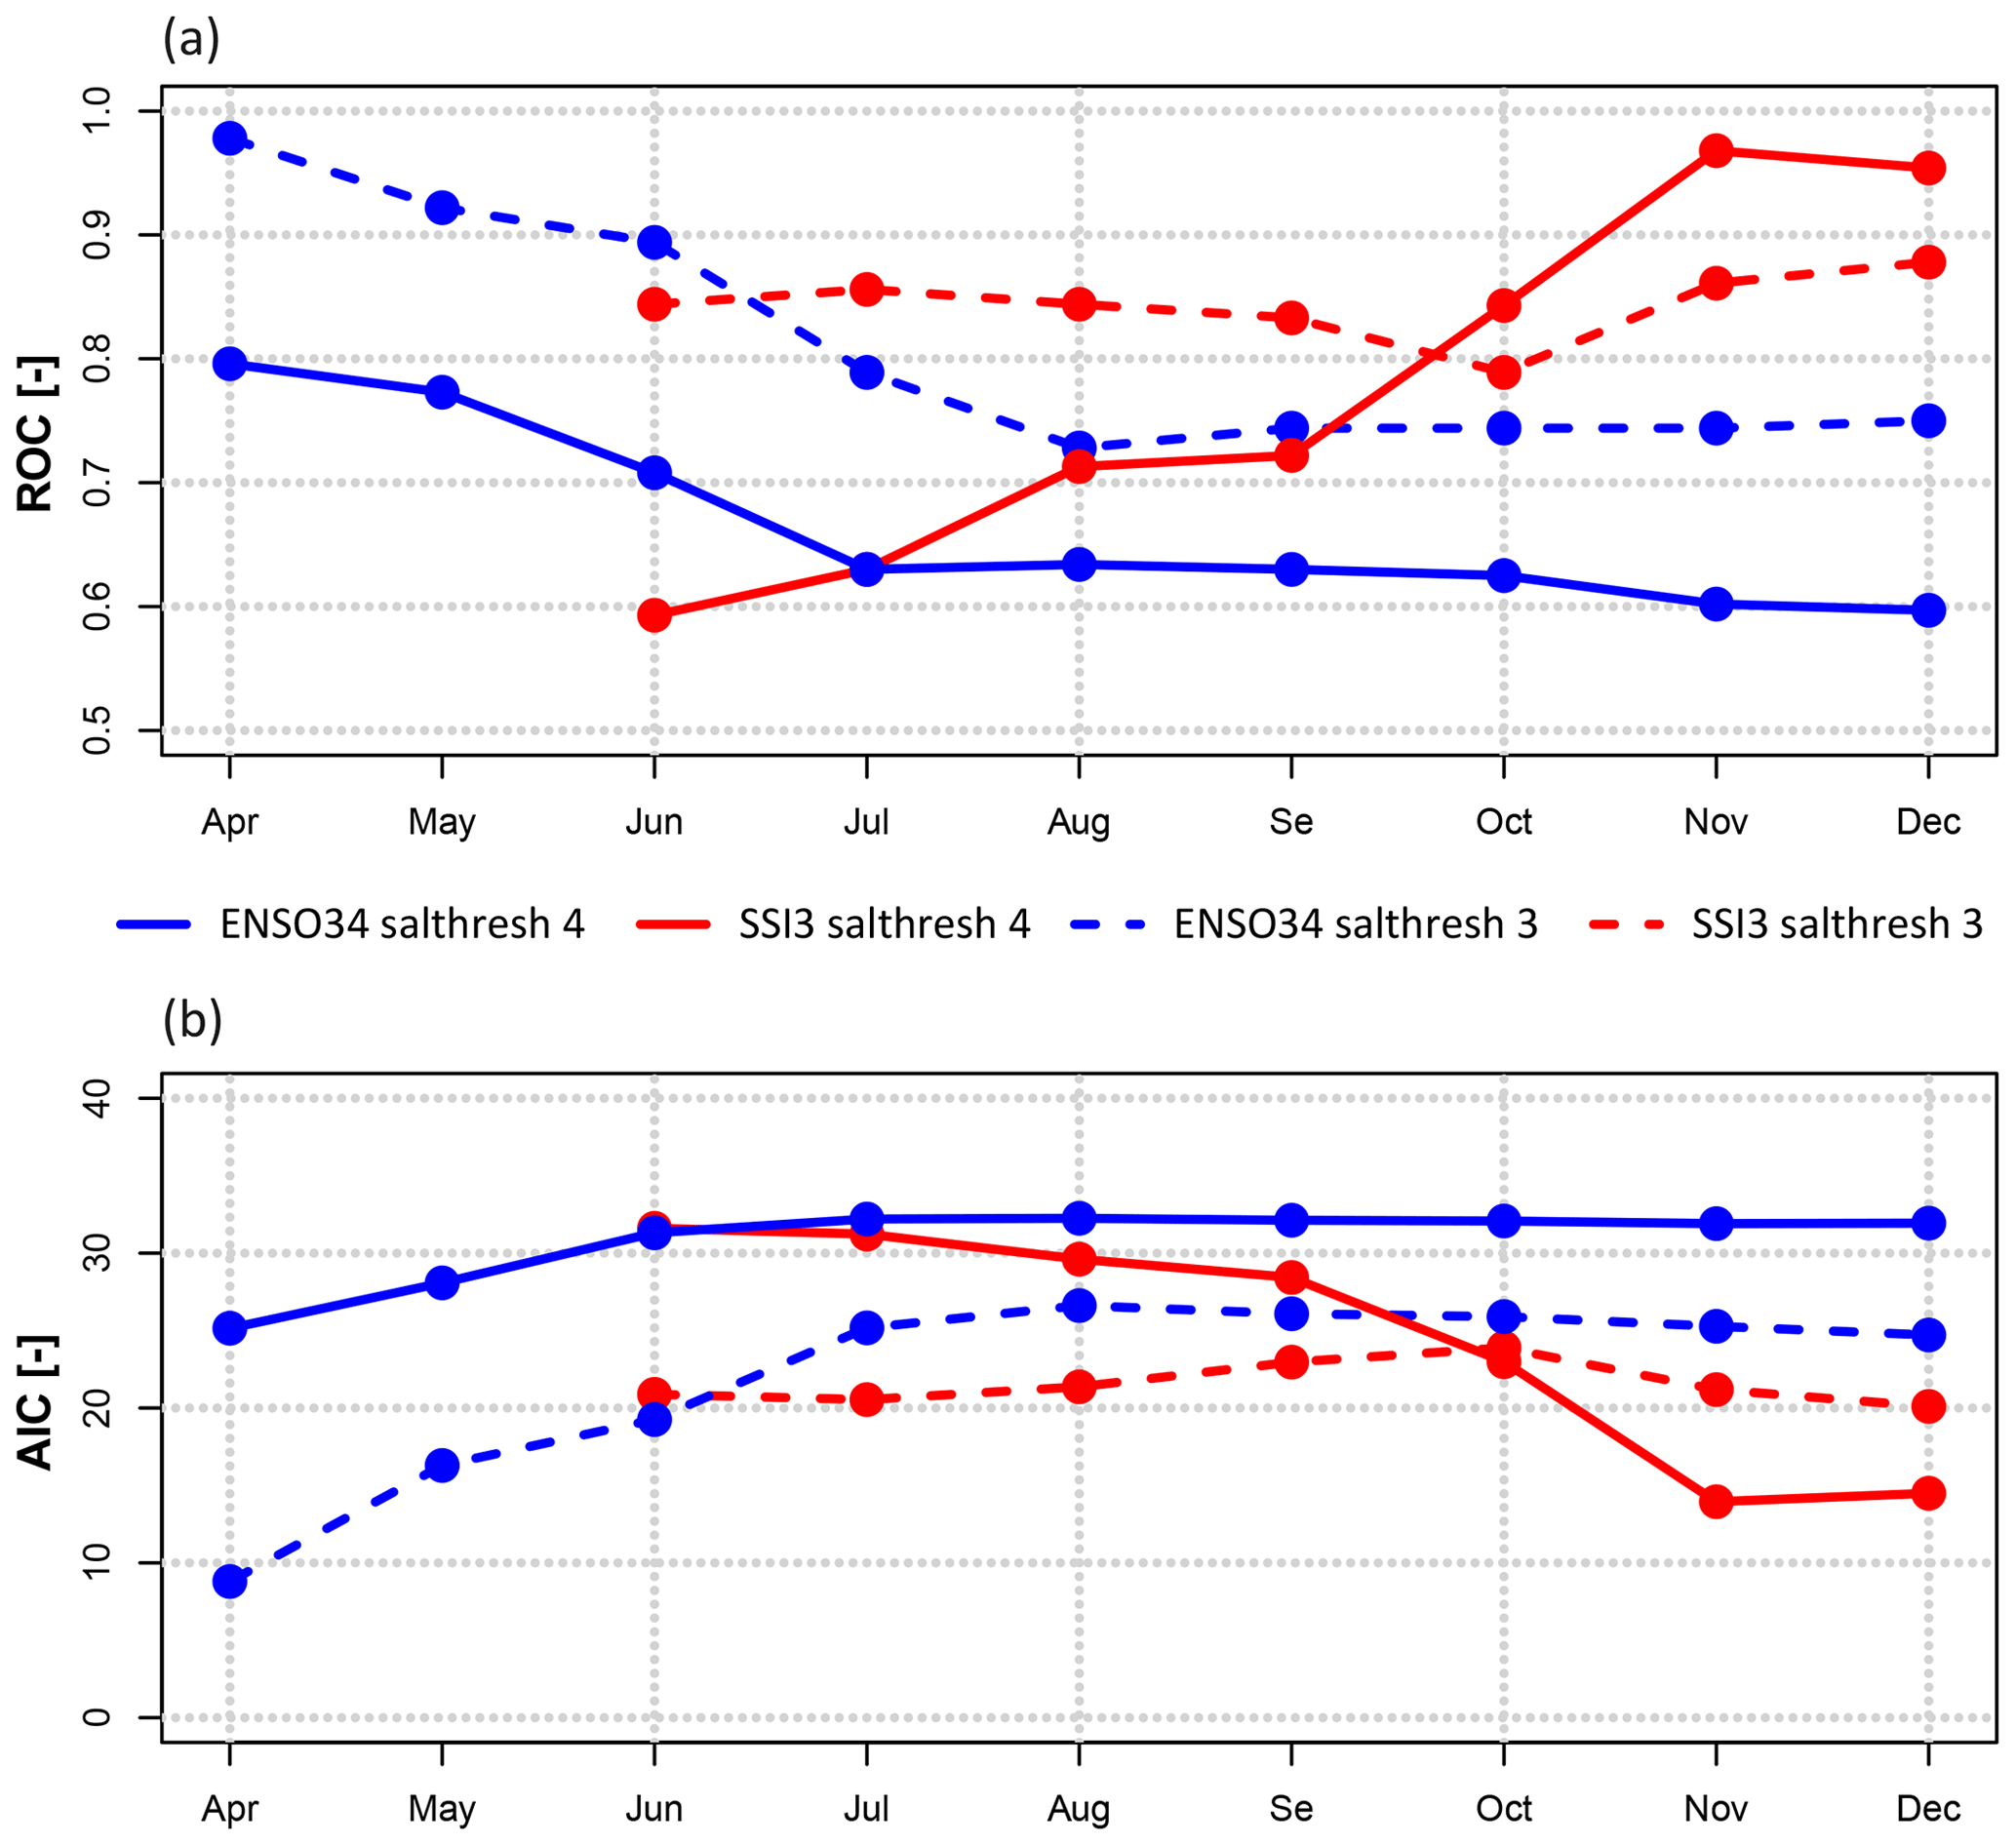
Figure 3Performance of logistic model with ENSO34 and SSI3 predictors at different lead time in terms of (a) ROC score and (b) AIC. The months of the x axis denote a forecast at the end of the indicated month prior to the dry season. For the mean February–March salinity a forecast in December means 1 month of lead time for the predicted season and in April a lead time of 9 months.
Opposite behaviour is observed for the SSI predictors (Fig. 3b). These show in general an increasing performance with decreasing lead time. This behaviour also reflects the hydrological system of the Mekong, where the streamflow at the late flood (October–November) and early dry season (December) is an aggregated measure of the total monsoonal rainfall amount over the Mekong basin, which is more reliable compared to streamflow during the early and high flood season. The SSI3 predictor, i.e. an aggregated index of 3 months of discharge, performs best but only slightly better than SSI4 and SSI6 (not shown). The best forecasts were obtained for November and December, i.e. with 1–2 month(s) lead time. Interestingly the SSI forecasts were in general better for the 4 g L−1 threshold than for the 3 g L−1 threshold (Fig. 3), which is opposite to the forecasts with ENSO. The 4 g L−1 threshold exceedance can be forecasted with an ROC score of 0.85 and an accuracy of 85 % with SSI3 in December and November (Fig. 2c and d). Only 3 out of 21 events were wrongly classified for this salinity threshold. This means that the early salinity intrusion forecast by ENSO for the critical salinity threshold of 4 g L−1 can be further improved with SSI forecasts a few months prior to the dry season, which is important for the actual implementation of disaster mitigation plans.
However, in order to obtain a continuous, well-performing forecast model, the forecasts during the flood season (July–October) need to be improved. Suitable predictors during this period would be rainfall estimates over the Mekong basin following the causal chain of salinity intrusion in the MKD outlined in the method section. These rainfall predictors could be derived from the real-time monitoring rainfall network in the Mekong basin or near-real-time satellite-based rainfall products such as the TRMM-based multi-satellite precipitation analysis (TMPA/3B4x) with its latency of 1–2 months. This needs to be tested during further developments of the model.
The proposed simple linear seasonal forecasting model of salinity intrusion in the Mekong Delta based on ENSO and SSI predictors proved to be a useful tool for an early warning of salinity intrusion during the dry low-flow season in the Mekong Delta. The exceedance and non-exceedance of critical and high levels of salinity at the Son Doc gauging station could be forecasted with high probabilities. Combining the ENSO and SSI forecast models results in a forecasting system that could deliver an early warning as early as 9 months prior to the period of the dry season most critical for paddy rice but also for other crops and fruit orchards. The early forecasts with ENSO in April before the actual flood and the following dry season could serve as an early warning of a likely high-salinity intrusion. The later forecasts based on SSIs would then provide more reliable forecasts of a severe salinity intrusion that would cause high damages to and negative impacts on the livelihood of the population in the coastal provinces of the Mekong Delta if no mitigation action is initiated in time. Based on the long lead times of the forecasts appropriate mitigation measures can be planned as early as during the flood season, i.e. well ahead of the dry season, and then activated if the early forecasts are confirmed by the late forecasts based on SSIs, i.e. actual observed discharges. The proposed forecasting model could thus be used as data-based support for disaster mitigation planning. However, it could be further improved to obtain robust forecasts during the flood season, i.e. lead times of 5–7 months, by testing rainfall estimates over the Mekong basin as predictors.
Due to its simplicity the model can easily be transferred to other gauging stations in the Mekong Delta. This requires mainly sufficiently long time series of salinity measurements because long-term discharge records for the calculation of SSIs are readily available for the main gauges in the Vietnamese Mekong Delta (VMD) and the time series of ENSO indexes are available from public sources. As a rule of thumb, salinity time series of about 15 years and longer should be sufficient for fitting the model (cf. Apel et al., 2018). While the studied gauge Son Doc can be regarded as representative of the general salinity intrusion in the Mekong Delta, forecasts of a larger number of stations would increase data-based evidence of an imminent severe salinity intrusion affecting the whole delta. Moreover, due to the simple model structure and data requirements, the model could be applied beyond the Mekong Delta, in other coastal areas that drain larger basins in a monsoonal climate, where similar hazards of dry-season salinity intrusion exist.
After the model development, the model was validated by forecasting the salinity intrusion in the 2020 dry season. It predicted the observed high-salinity intrusion with high confidence using both the ENSO34 predictor of April 2019 and the SSI3 predictors of November and December 2019. This means that the observed severe salinity intrusion in the dry season of 2020 could have been predicted with a lead time of 9 months. This lead time is certainly sufficient for timely mitigation and adaptation planning. The proposed model can therefore provide data-based support for decisions of the Vietnamese government for future salinity intrusions during the dry seasons. This could avoid severe damages and negative impacts like those in 2015/2016, when no preventive and mitigating action was taken. Mitigation action should include not only local measures in the VMD but also negotiations with the Mekong riparian countries with the aim of adapting the operation schedule of reservoirs in the Mekong basin in order to maintain sufficient flow during the dry season. This aspect in particular needs long-term preparation both in terms of reservoir operation planning and for the required political discussions among the riparian countries.
Data are available upon request from the corresponding author (heiko.apel@gfz-potsdam.de).
The supplement related to this article is available online at: https://doi.org/10.5194/nhess-20-1609-2020-supplement.
HA developed the method and wrote the original draft of the paper. All authors contributed to the preparation of this paper.
The authors declare that they have no conflict of interest.
This study was performed as part of the research project “Catch-Mekong” (https://catchmekong.eoc.dlr.de/, last access: March 2020) and the project “Transforming agricultural livelihoods for climate change adaptation in the Vietnamese Mekong Delta: A case study in Ben Tre province”.
This research has been supported by the German Ministry of Education and Research (BMBF; grant no. 02WM1338C) and by the Vietnamese Ministry of Science and Technology (MOST;
grant no. KHCN-TNB-DT/14-19/C20).
The article processing charges for this open-access
publication were covered by a research
centre of the Helmholtz Association.
This paper was edited by Paolo Tarolli and reviewed by Anton Pijl and one anonymous referee.
Apel, H., Abdykerimova, Z., Agalhanova, M., Baimaganbetov, A., Gavrilenko, N., Gerlitz, L., Kalashnikova, O., Unger-Shayesteh, K., Vorogushyn, S., and Gafurov, A.: Statistical forecast of seasonal discharge in Central Asia using observational records: development of a generic linear modelling tool for operational water resource management, Hydrol. Earth Syst. Sci., 22, 2225–2254, https://doi.org/10.5194/hess-22-2225-2018, 2018.
Azad, S. and Rajeevan, M.: Possible shift in the ENSO-Indian monsoon rainfall relationship under future global warming, Scientific Reports, 6, 20145, https://doi.org/10.1038/srep20145, 2016.
Bamston, A. G., Chelliah, M., and Goldenberg, S. B.: Documentation of a highly ENSO-related sst region in the equatorial pacific: Research note, Atmosphere-Ocean, 35, 367–383, https://doi.org/10.1080/07055900.1997.9649597, 1997.
Burnham, K. P. and Anderson, D. R.: Multimodel Inference: Understanding AIC and BIC in Model Selection, Sociol. Method. Res., 33, 261–304, https://doi.org/10.1177/0049124104268644, 2004.
Delgado, J. M., Merz, B., and Apel, H.: A climate-flood link for the lower Mekong River, Hydrol. Earth Syst. Sci., 16, 1533–1541, https://doi.org/10.5194/hess-16-1533-2012, 2012.
Etemad-Shahidi, A., Dorostkar, A., and Liu, W.-C.: Prediction of salinity intrusion in Danshuei estuarine system, Hydrol. Res., 39, 497–505, https://doi.org/10.2166/nh.2008.107, 2008.
Grattan, S. R., Zeng, L., Shannon, M. C., and Roberts, S. R.: Rice is more sensitive to salinity than previously thought, Calif. Agr., 56, 189–198, https://doi.org/10.3733/ca.v056n06p189, 2002.
Ju, J. and Slingo, J.: The Asian summer monsoon and ENSO, Q. J. Roy. Meteor. Soc., 121, 1133–1168, https://doi.org/10.1002/qj.49712152509, 1995.
Leinenkugel, P., Kuenzer, C., Oppelt, N., and Dech, S.: Characterisation of land surface phenology and land cover based on moderate resolution satellite data in cloud prone areas - A novel product for the Mekong Basin, Remote Sens. Environ., 136, 180–198, https://doi.org/10.1016/j.rse.2013.05.004, 2013.
Lu, J.-F. and Chen, Z.-S.: Salinity Prediction at Modaomen Waterway in Estuary of Pearl River, Journal of China Hydrology, 5, 69–74, 2010.
Mannocchi, F., Francesca, T., and Vergni, L.: Agricultural drought: Indices, definition and analysis, IAHS-AISH Publication, 246–254, 2004.
Mason, S. J.: Understanding forecast verification statistics, Meteorol. Appl., 15, 31–40, https://doi.org/10.1002/met.51, 2008.
Menard, S.: Logistic Regression: From Introductory to Advanced Concepts and Applications, ISBN-13: 9781483351421, 392 pp., SAGE Publications, Thousand Oaks, California, USA, 2009.
Mishra, A. K. and Singh, V. P.: A review of drought concepts, J. Hydrol., 391, 202–216, 2010.
Nagelkerke, N. J. D.: A Note on a General Definition of the Coefficient of Determination, Biometrika, 78, 691–692, https://doi.org/10.1093/biomet/78.3.691, 1991.
Nguyen, N. A.: Historic drought and salinity intrusion in the Mekong Delta in 2016: Lessons learned and response olutions, Vietnam Journal of Science, Technology and Engineering – Environmental Sciences, 59, 93–96, https://doi.org/10.31276/VJSTE.59(1).93, http://vietnamscience.vjst.vn/index.php/VJSTE/article/view/32, 2017.
Pohar, M., Blas, M., and Turk, S.: Comparison of Logistic Regression and Linear Discriminant Analysis: A Simulation Study, Metodološki zvezki1 – Advances in Methodology and Statistics, 1, 143–161, 2004.
Räsänen, T. A. and Kummu, M.: Spatiotemporal influences of ENSO on precipitation and flood pulse in the Mekong River Basin, J. Hydrol., 476, 154–168, https://doi.org/10.1016/j.jhydrol.2012.10.028, 2013.
Risley, J. C., Guertin, D. P., and Fogel, M. M.: Salinity-Intrusion Forecasting System for Gambia River Estuary, J. Water Res. Pl., 119, 339–352, https://doi.org/10.1061/(ASCE)0733-9496(1993)119:3(339), 1993.
Roehl Jr., E. A., Daamen, R. C., and Cook, J. B.: Estimating seawater intrusion impacts on coastal intakes as a result of climate change, Journal – AWWA, 105, E642–E650, 10.5942/jawwa.2013.105.0131, 2013.
Rohmer, J. and Brisset, N.: Short-term forecasting of saltwater occurrence at La Comté River (French Guiana) using a kernel-based support vector machine, Environ. Earth Sci., 76, 246, https://doi.org/10.1007/s12665-017-6553-5, 2017.
Seibert, M., Merz, B., and Apel, H.: Seasonal forecasting of hydrological drought in the Limpopo Basin: a comparison of statistical methods, Hydrol. Earth Syst. Sci., 21, 1611–1629, https://doi.org/10.5194/hess-21-1611-2017, 2017.
Smajgl, A., Toan, T. Q., Nhan, D. K., Ward, J., Trung, N. H., Tri, L. Q., Tri, V. P. D., and Vu, P. T.: Responding to rising sea levels in the Mekong Delta, Nature Clim. Change, 5, 167–174, https://doi.org/10.1038/nclimate2469, 2015.
Toan, T. Q.: 9 – Climate Change and Sea Level Rise in the Mekong Delta: Flood, Tidal Inundation, Salinity Intrusion, and Irrigation Adaptation Methods, in: Coastal Disasters and Climate Change in Vietnam, edited by: Thao, N. D., Takagi, H., and Esteban, M., Elsevier, Oxford, 199–218, 2014.
VDMA: Report on Drought, Salinization and Response Options, Vietnam Disaster Management Authority (VDMA) – National Steering Center for Natural Disaster Prevention and Control, available at: http://dmc.gov.vn/Uploads/Thong tin Thien tai - Disaster Information/2016/03.2016/Han han/Bai trinh bay bao cao han han_EN.pdf?lang=vi-VN (last access: March 2020), 2016.
Vicente-Serrano, S. M., Lopez-Moreno, J. I., Begueria, S., Lorenzo-Lacruz, J., Azorin-Molina, C., and Moran-Tejeda, E.: Accurate Computation of a Streamflow Drought Index, J. Hydrol. Eng., 17, 318–332, https://doi.org/10.1061/(Asce)He.1943-5584.0000433, 2012.
Zeng, L. and Shannon, M.: Salinity Effects on Seedling Growth and Yield Components of Rice, Crop Science – CROP SCI, 40, 996–1003, https://doi.org/10.2135/cropsci2000.404996x, 2000.
Zeng, L., Shannon, M. C., and Lesch, S. M.: Timing of salinity stress affects rice growth and yield components, Agr. Water Manage., 48, 191–206, https://doi.org/10.1016/S0378-3774(00)00146-3, 2001.