the Creative Commons Attribution 4.0 License.
the Creative Commons Attribution 4.0 License.
 | 30 Apr 2020
Improving early warning of drought-driven food insecurity in southern Africa using operational hydrological monitoring and forecasting products
Kristi R. Arsenault
Abheera Hazra
Christa Peters-Lidard
Randal D. Koster
Frank Davenport
Tamuka Magadzire
Chris Funk
Sujay Kumar
Amy McNally
Augusto Getirana
Greg Husak
Ben Zaitchik
Jim Verdin
Faka Dieudonne Nsadisa
Inbal Becker-Reshef
The region of southern Africa (SA) has a fragile food economy and is vulnerable to frequent droughts. Interventions to mitigate food insecurity impacts require early warning of droughts – preferably as early as possible before the harvest season (typically starting in April) and lean season (typically starting in November). Hydrologic monitoring and forecasting systems provide a unique opportunity to support early warning efforts, since they can provide regular updates on available root-zone soil moisture (RZSM), a critical variable for crop yield, and provide forecasts of RZSM by combining the estimates of antecedent soil moisture conditions with climate forecasts. For SA, this study documents the predictive capabilities of RZSM products from the recently developed NASA Hydrological Forecasting and Analysis System (NHyFAS). Results show that the NHyFAS products would have identified the regional severe drought event – which peaked during December–February of 2015–2016 – at least as early as 1 November 2015. Next, it is shown that during 1982–2016, February RZSM (Feb-RZSM) forecasts (monitoring product) available in early November (early March) have a correlation of 0.49 (0.79) with the detrended regional crop yield. It is also found that when the February RZSM forecast (monitoring product) available in early November (early March) is indicated to be in the lowest tercile, the detrended regional crop yield is below normal about two-thirds of the time (always), at least over the sample years considered. Additionally, it is shown that the February RZSM forecast (monitoring product) can provide “out-of-sample” crop yield forecasts with comparable (substantially better with 40 % reduction in mean error) skill to December–February ENSO. These results indicate that the NHyFAS products can effectively support food insecurity early warning in the SA region. Finally, since a framework similar to NHyFAS can be used to provide RZSM monitoring and forecasting products over other regions of the globe, this case study also demonstrates potential for supporting food insecurity early warning globally.
- Article
(3139 KB) - Full-text XML
-
Supplement
(325 KB) - BibTeX
- EndNote


Southern Africa (SA) is vulnerable to food insecurity. Droughts driven by climate stressors (e.g., precipitation and temperature) are among the important drivers of food insecurity (Misselhorn, 2005; Conway et al., 2015). Moreover, anthropogenic climate change is shown to increase the likelihood of climate-driven flash droughts (Yuan et al., 2018). The primary rainy season in SA spans from October to March, which overlaps the main planting season from October to February (Fig. 1a). This period also covers the lean season, when food supplies from the prior year's harvest become limited. April–July is typically the main harvest season, when the food reserve is expected to begin replenishing. In several SA countries, with the Republic of South Africa (RSA) being the main exception, typical monthly variability in food prices closely follows this crop cycle, as shown in Fig. 1b. The prices typically start to rise after the harvest season and reach their peak just before or near the start of the harvest season. This correspondence between the prices and crop cycles highlights the region's climate-related sensitivity to food insecurity. In the case of below-normal crop yield, the food prices rise even more than normal, reducing access to food for the poorest of the population.
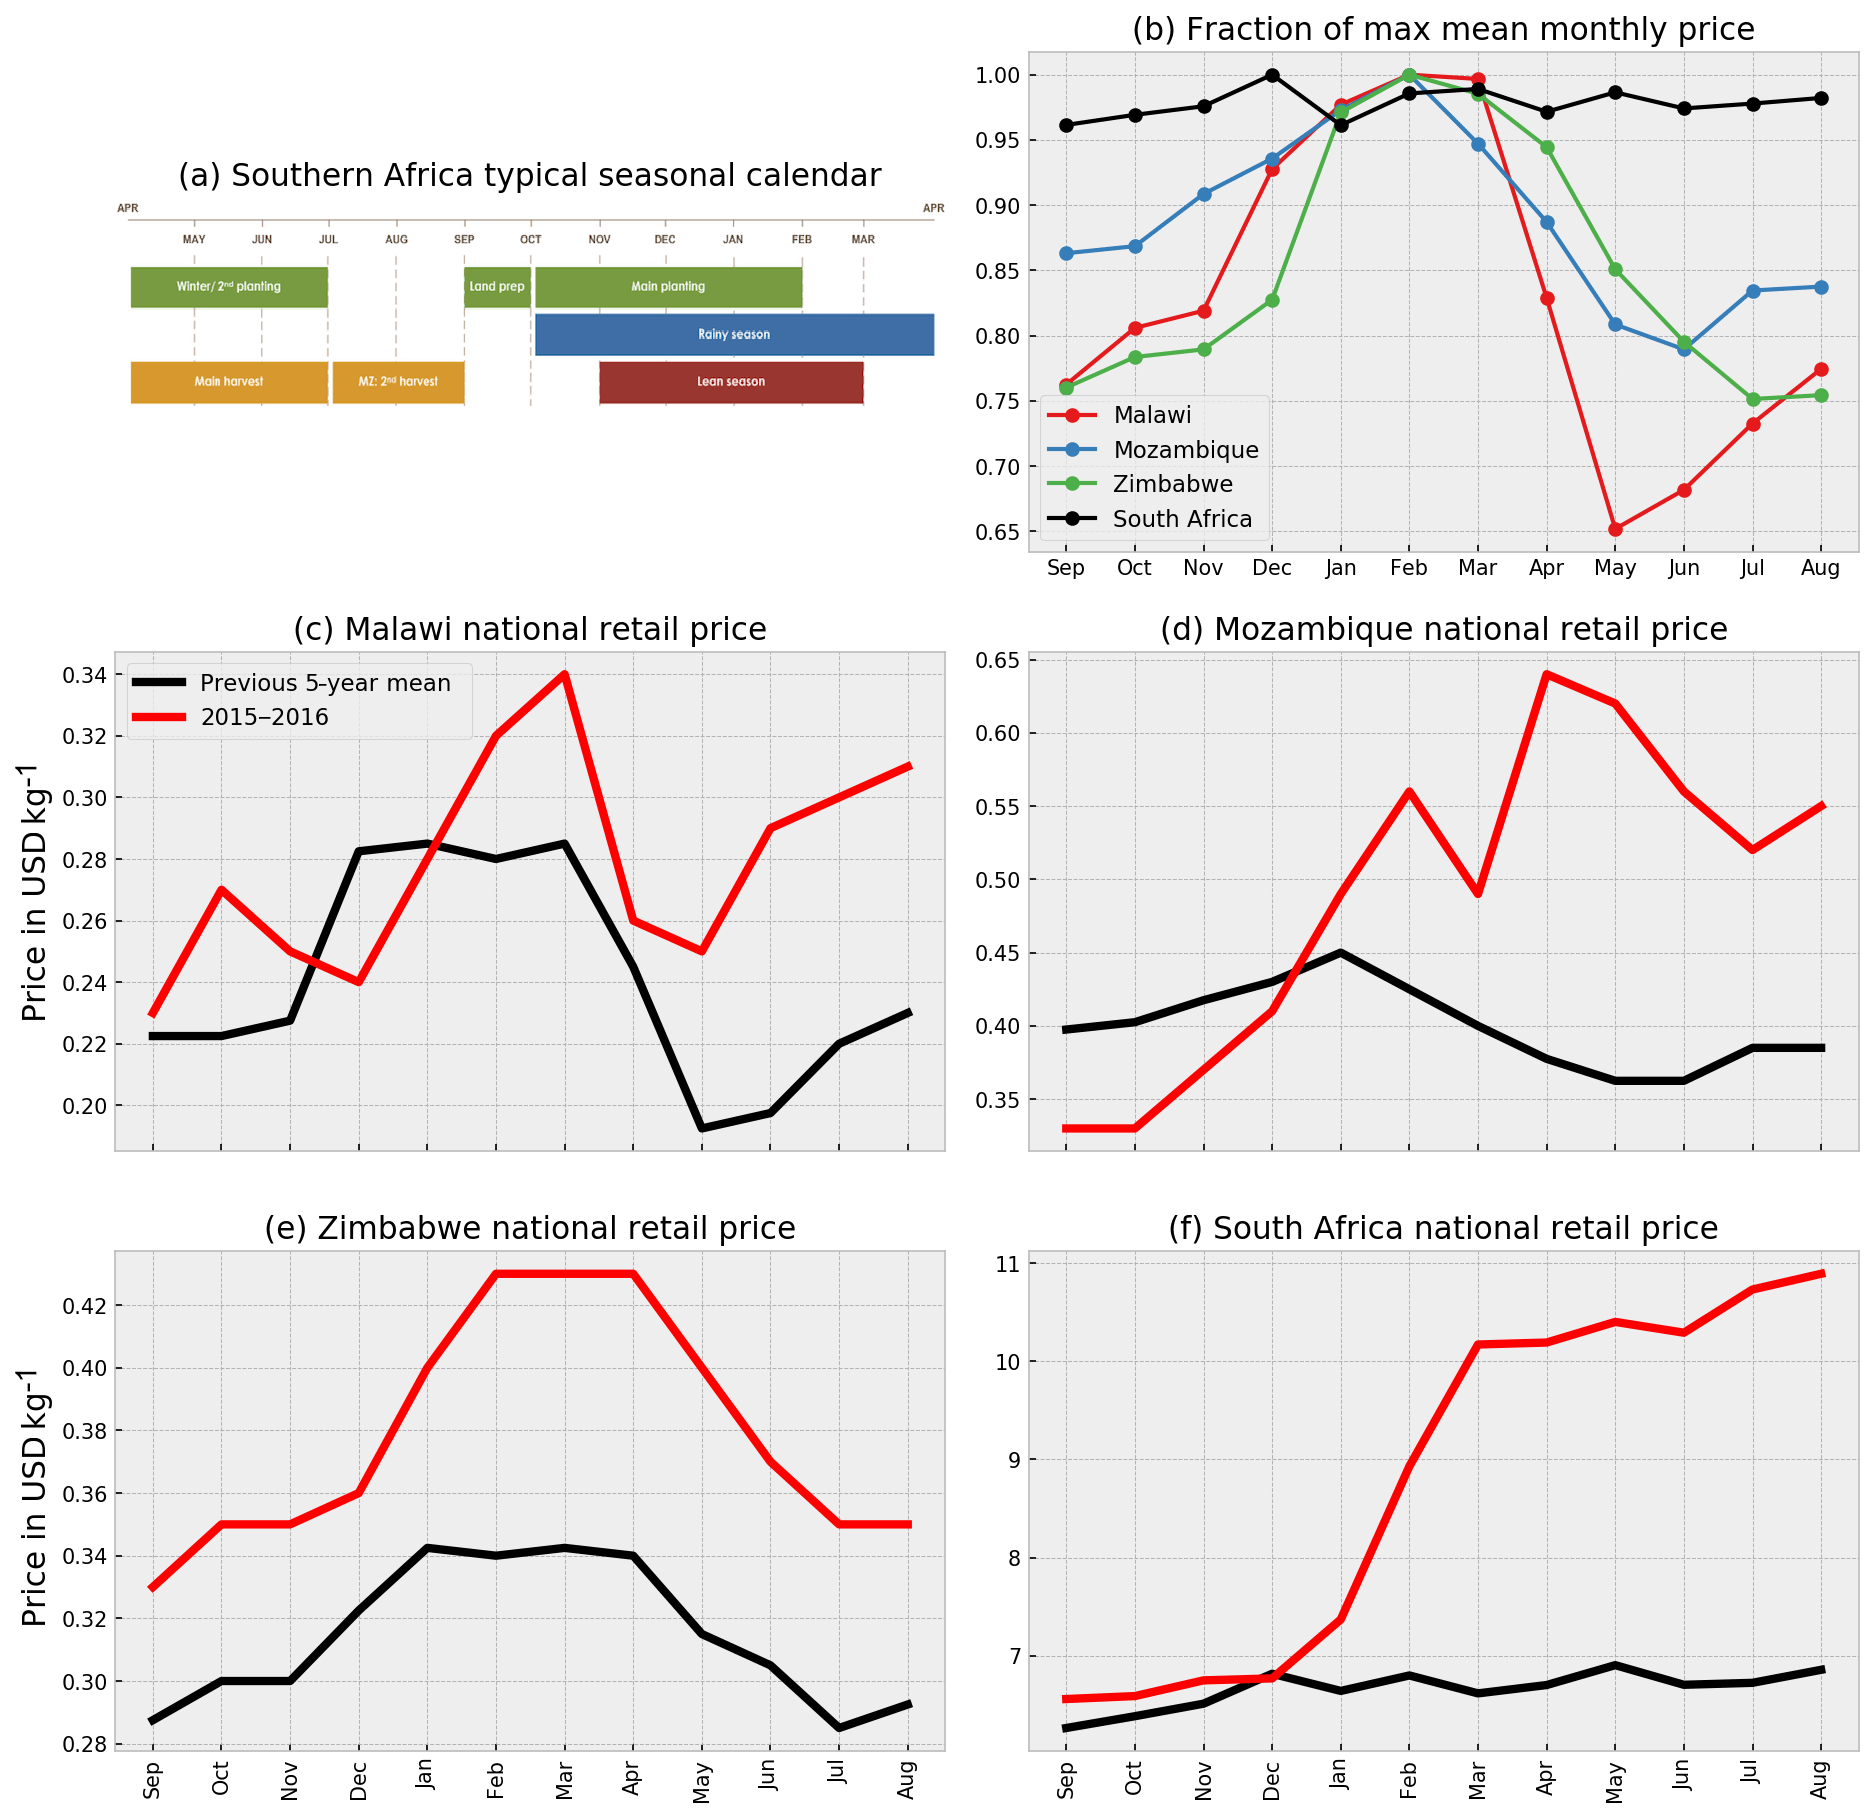
Figure 1(a) Schematic representation of a typical seasonal calendar for the southern Africa region (taken from: http://fews.net/southern-africa, last access: 26 April 2020). (b) Monthly climatology of maize prices in SA countries. The monthly mean prices are normalized relative to the maximum mean monthly price for a given country, as the actual values of the mean monthly prices are different for different countries. Comparison of mean monthly maize prices for (c) Malawi, (d) Mozambique, (e) Zimbabwe, and (f) South Africa during the 2015–2016 event (red line) with the previous 5-year mean prices (black line). The price data are available from FAOSTAT (FAO, http://www.fao.org/faostat/en/#home, last access: 26 April 2020).
The percentage income shared by the poorest 10 % and 20 % of the population in several SA countries has not improved significantly over time (not shown here). These portions of the population are likely to be more food insecure in drought years; they already use a relatively higher share of their income on food, and in the case of price rises related to low crop yield, their access to food becomes even more limited.
The 2015–2016 drought event (attributed to a strong El Niño) in SA further highlighted its vulnerability to climate-related regional food insecurity (Archer et al., 2017; Funk et al., 2018; Pomposi et al., 2018). This event led to a substantial reduction in regional agricultural production – including in the RSA, which is the main crop-producing country in the region – a reduction and rationing of water supplies, a loss of livestock, and an increase in unemployment in the region, and it pushed 29 million people into severe food insecurity (SADC, 2016). Throughout the Southern African Development Community (SADC) region in 2015–2016, cereal production was down by −10.2 % (varying from +61 % to −94 % in individual member countries) relative to the previous 5-year average (SADC, 2016). Figure 1c–f show a comparison of national retail maize prices (in USD) in several of the SA countries during 2015–2016 with the previous 5-year mean prices in those countries. The prices in 2015–2016 were substantially higher than the previous 5-year mean. Of particular importance is the price increase in RSA, where, typically, the food prices do not vary much throughout the year due to its general self-sufficiency in food production as well as its international trade. The consumer price index (CPI) for food for the RSA also experienced a drastic upward shift during the 2015–2016 drought year (not shown here). In fact, based on the CPI data (available from the United Nations Food and Agricultural Organization), the CPI was substantially higher than that of the past 5-year mean during the beginning of the following growing season of 2016–2017, including in the RSA, where typically the CPI remains fairly stable during a year. These price shocks can dramatically impact poor households, which typically spend 60 % or more of their income on food. According to the recent World Development Indicator (World Bank, 2016), incomes for the poorest 10 % and 20 % of households in these countries have remained generally constant, underscoring the depth of poverty (Fig. 2). On average, in Malawi, Mozambique, Zimbabwe, and South Africa, these individuals subsist on USD 70, 126, 288, and 716 a year, respectively.
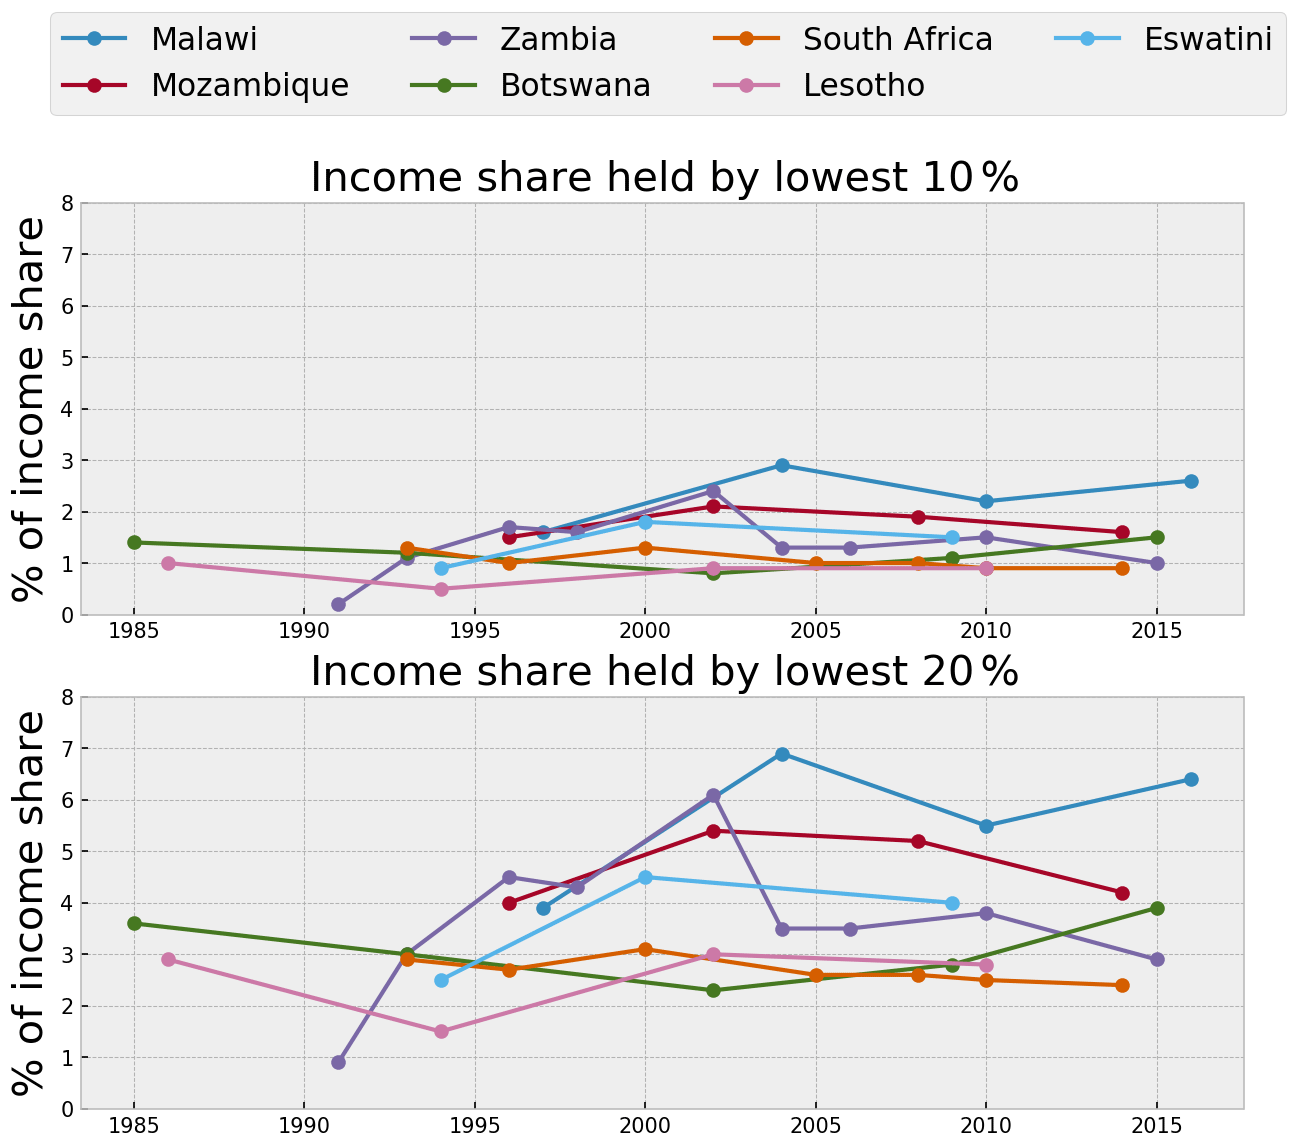
Figure 2Percentage of income share held by lowest 10 % and 20 % income population in the southern Africa countries (data source: the World Bank's World Development Indicators).
The comparison prices shown in Fig. 1c–f and the income-related facts (based on World Bank Development Indicators) presented above highlight the severity of food insecurity in a regional drought event like 2015–2016. In the 2015–2016 event, food imports from the RSA – which is the main producer and exporter of food in the region to the other SA countries – were not enough, and international assistance became crucial. This is why in June 2016, the SADC launched a Regional Humanitarian Appeal stating that approximately 40 million people in the region required humanitarian assistance, at a cost of approximately USD 2.4 billion (Magadzire et al., 2017).
Mitigation of the most adverse impacts of food insecurity, like the event of 2015–2016, requires timely and effective early warning. An effective early warning system has two key attributes (Funk et al., 2019): (1) the ability to provide routine, frequent early warning of drought status and (2) the ability to incorporate both monitoring and forecasting to best account for the conditions up to the date of early warning in combination with the climate outlook for the upcoming season.
A seasonal-scale hydrologic forecasting system can potentially support an early warning system, as it can provide updated hydrologic forecasts on a monthly basis by accounting for the drought conditions as of the forecast release date and climate outlook over the forecast period (Sheffield et al., 2014; Shukla et al., 2014; Yuan et al., 2013). However, thus far, the application of seasonal-scale hydrologic forecasts in food insecurity early warning has been limited at best, with the only other main example being the African Flood and Drought Monitor (Sheffield et al., 2014).
On the other hand, operational, publicly available, state-of-the-art dynamical climate forecasts have found regular usage in guiding climate outlooks as well as assessments of expected food insecurity. For example, the US Agency for International Development's Famine Early Warning Systems Network (FEWS NET; http://fews.net/, last access: 26 April 2020), the G20 Group on Earth Observations Global Agricultural Monitoring (GEOGLAM) Crop Monitor for Early Warning, and SADC's Climate Service Centre (CSC) all utilize the dynamical climate forecasts as one of their early warning tools. Furthermore, numerous past studies have investigated the predictability of SA climate (Meque and Abiodun, 2014) and examined the skill of diverse approaches in forecasting, particularly of rainfall, as well as streamflow and agricultural production in different parts of this region (Archer et al., 2017; Cane et al., 1994; Diro, 2015; Landman et al., 2001; Landman and Beraki, 2010; Landman and Goddard, 2002; Manatsa et al., 2015; Martin et al., 2000; Sunday et al., 2014; Trambauer et al., 2015; Winsemius et al., 2014). Historically, the El Niño–Southern Oscillation (ENSO) has proven to be among the main predictors of this region's climate, with another important predictor being the Subtropical Indian Ocean Dipole (Hoell et al., 2016, 2017; Hoell and Cheng, 2017).
In August 2018, the new National Aeronautics and Space Agency Hydrological Forecasting and Analysis System (NHyFAS), an operational seasonal hydrologic forecasting system (Arsenault et al., 2020), was implemented to support the early warning efforts of FEWS NET, building upon existing hydrologic monitoring (McNally et al., 2017). This study evaluates the ability of NHyFAS to support early warning of regional food insecurity in the SA region. The evaluation is conducted by examining the performance of this system (i) for the 2015–2016 drought event, which led to regional food insecurity, (ii) in explaining regional crop yield variability in the region, and (iii) in identifying below-normal crop yield events, which are characteristically associated with overall lower food availability in the region and, hence, food insecurity. Regional crop yield is used as a target variable here, as it is among the main contributors to regional food insecurity. It is hypothesized that if NHyFAS can skillfully forecast regional crop yield and identify below-normal regional crop yields, it can successfully support the early warning of food insecurity in the region.
As noted above and shown in Fig. 1a, April–July is typically the main harvest season, when the food reserve is expected to begin replenishing and last through the lean season, which starts in November. Below-normal food availability during this period can lead to food insecurity. Therefore, early warning systems aim to provide outlooks for food insecurity as far in advance of the harvest and lean season as possible. Consequently, this study focuses on using forecasting and monitoring products that are available in November (4–5 months before the start of the harvest and about a year before the start of the next lean season) through March (1–2 months before the start of the harvest and about 8–9 months before the start of the next lean season) to examine their value in supporting early warning of food insecurity in the region.
The hydrologic monitoring and forecasting products used in this study come from the NHyFAS (Fig. 3). Figure 3 shows an overview of the implementation of the NHyFAS for the purpose of this study. We provide here a brief description of the hydrologic models (Sect. 2.1), the model parameters (Sect. 2.2), the input observed forcings and climate forecasts (Sect. 2.3), and the root-zone soil moisture (RZSM) monitoring and forecasting products (Sect. 2.4) used in the present study. The reported crop yield data used in this study are described in Sect. 2.5.
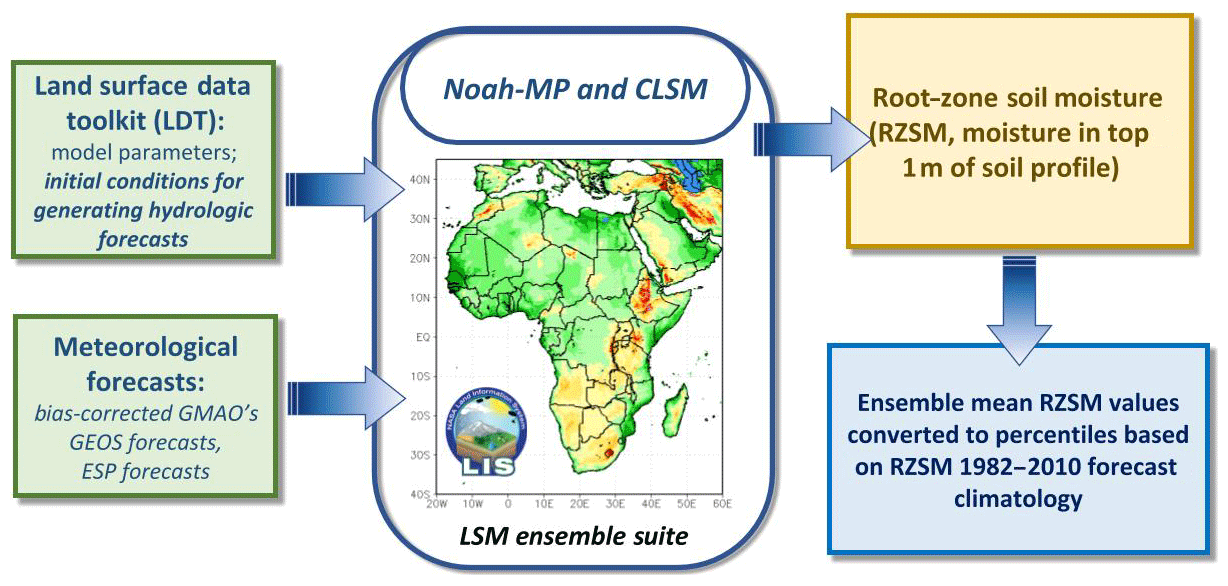
Figure 3Overview of the NHyFAS implementation to produce RZSM monitoring and forecasting products, as used in this study.
2.1 Hydrologic modeling framework
To generate hydrological forecasts, we use NASA's Catchment land surface model (CLSM; Ducharne et al., 2000; Koster et al., 2000) and the Noah-Multiparameterization (Noah-MP; Niu et al., 2011; Yang et al., 2011) land surface model (LSM), which compute changes in soil moisture (e.g., root zone) and groundwater storage in response to computed surface energy and water fluxes. These two LSMs are part of the model suite in the Land Information System (LIS) framework (Kumar et al., 2006) – the primary software system used to produce this study's forecast experiments. Both LSMs were spun up using two cycles of forcing for the period from 1 January 1981 to 31 December 2015; then, historical open-loop (OL) runs were generated for January 1981 through 2018. RZSM, which is the main hydrologic variable used in this analysis, represents the soil moisture in the top 1 m of the soil profile. The entire depth of the soil profile is different for the two models used in this analysis (typically about 2 m for Noah-MP and about 4 m for CLSM).
2.2 Model parameters
In the version of CLSM used here, hydrologic and catchment parameters (Ducharne et al., 2000) are based on a high-resolution, global topographic data set (Verdin and Verdin, 1999), and soil texture (Reynolds et al., 2000) and profile parameters are derived from the Second Global Soil Wetness Project (GSWP-2; Guo and Dirmeyer, 2006) data set and mapped to the catchment tiles. Land cover classes are mapped from the University of Maryland Advanced Very High Resolution Radiometer data set, and vegetation parameters include, for example, the leaf area index (LAI), which is also derived from GSWP-2. Albedo scaling factors are based on Moderate Resolution Imaging Spectroradiometer (MODIS) direct and diffuse visible or near-infrared radiation inputs (Moody et al., 2008).
Noah-MP vegetation parameters include the modified International Geosphere-Biosphere Programme MODIS-based land cover data set (Friedl et al., 2002), leaf area index, and monthly greenness fraction (Gutman and Ignatov, 1998). The soil texture data set is based on Reynolds et al. (2000), and soil parameters are mapped to the varying textures. Monthly global (snow-free) albedo (Csiszar and Gutman, 1999) and a maximum snow albedo parameter field are also employed. Additional details are found in Niu et al. (2011).
2.3 Input observed forcings and climate forecasts
The spin-up and OL runs used to generate the long-term “observed” climatology of RZSM are driven with NASA's Modern-Era Retrospective analysis for Research and Applications, version 2 (MERRA-2; Gelaro et al., 2017), atmospheric fields (e.g., 2 m air temperature, humidity). Precipitation forcing comes from the US Geological Survey (USGS) and University of California, Santa Barbara (UCSB), Climate Hazards Center InfraRed Precipitation with Station data set, version 2.0 (CHIRPSv2; Funk et al., 2015).
Hindcasts of RZSM are generated by forcing the hydrologic models with NASA's Goddard Earth Observing System (GEOS) Atmosphere-Ocean General Circulation Model, version 5 (GEOS; Borovikov et al., 2017), Seasonal-to-Interannual Forecast System. The 11 ensemble members of version 1 of this forecast system that were used in the North American Multi-Model Ensemble (NMME) project are used in the forecast portion of this study. To make the GEOS-forecasted meteorology consistent with the meteorology underlying the OL initial conditions, we bias-corrected and spatially downscaled (BCSD; Wood et al., 2002) the GEOS forecasts using the MERRA-2 and CHIRPS data sets. The BCSD–GEOS forecast files are then ingested into LIS to drive the LSMs and generate the dynamical hydrological forecasts. The BCSD–GEOS hindcasts are initialized on 1 November (near the start of the planting season) and 1 January (middle of the planting season) of each year in 1982–1983 to 2017–2018. Each hindcast is run for 6 months.
Hindcasts of RZSM are also generated using the ensemble streamflow prediction (ESP) method (Day, 1985; Shukla and Lettenmaier, 2011; Shukla et al., 2013), where the models are forced with resampled observed forcings (forcings that are used to drive the OL simulation) taken from the 1982–2010 period. The hindcasts generated using the ESP method derive their skills from the initial hydrologic conditions only.
2.4 RZSM monitoring and forecasting products
The performance of the NHyFAS system is evaluated mainly through its RZSM monitoring (generated from OL) and forecasting products. RZSM indicates the soil moisture in the top 1 m of the soil profile. Typically, the length of the roots of crops such as maize (main crop in the region of SA) is close to 1 m, hence the choice of RZSM as the key forecast variable. Moreover, the entire depth of the soil profile is different for the two models used in this analysis, typically about 2 m for Noah-MP and about 4 m for CLSM; hence RZSM also allows for a consistent way to merge soil moisture products from both models.
Both products are generated at 0.25∘×0.25∘ spatial resolution and daily temporal resolution. Daily values are averaged over a month to get monthly values. The monthly values of the monitoring product are converted to percentiles relative to OL climatology over 1982–2010, and monthly values of the ensemble mean forecasting products (GEOS and ESP based) are converted into percentiles relative to the (ensemble mean) climatology over 1982–2010 of the respective hindcast runs. In both cases, empirical distribution is considered to convert values to percentiles. Once gridded percentile values are generated, they are spatially aggregated over the SA region (as shown in Fig. 2) to get RZSM monitoring and forecasting products over the SA region.
2.5 Regional crop yield
The regional crop yield is calculated using country-level crop production and area harvested reports. These reports come from the United States Department of Agriculture Foreign Agricultural Service (FAS) Production, Supply and Distribution (PSD) database. To compile this database, the USDA relies on several sources, including official country statistics, reports from agricultural attachés at US embassies, data from international organizations, publications from individual countries, and information from traders both inside and outside of the target countries. For this study, we focus only on maize, as it is the main crop in the region and the key crop for food security. To get regional crop yield from country-level crop yield, we first converted country-level yield into production using the harvested area (provided by the PSD), added the total production, and then divided it by the sum of the harvested area in all SA countries in our focus domain. The regional crop yield is detrended for the purposes of this study to reduce the effect of any long-term changes (e.g., technological changes) on the crop yield.
2.6 Out-of-sample crop yield forecasting
We also evaluate the NHyFAS RZSM monitoring and forecasting products' performance in supporting food insecurity early warning in SA through a series of out-of-sample crop forecasting experiments. Specifically, we compare the accuracy of crop yield forecasts made with NHyFAS products with univariate yield forecasts (using only the past yields) and yield forecasts made with ENSO, a widely used predictor for crop yield in this region. This evaluation has a direct implication on the usage of NHyFAS products for operational purposes, as crop yield forecasts are a common tool in food security analysis and response (Davenport et al., 2019).
Our baseline model is a univariate (no exogenous predictors) autoregressive integrated moving average (ARIMA) model,
where yt is the time series of observed yields (and the ′ indicates potential differencing of the time series), p is the order of lags, ϕ is the autoregressive parameters, q is the order of moving averages, θ is the moving average parameters, and ε is forecast errors from the prior periods. ARIMA(p, d, q) models are standard and frequently used methods for time series analysis and forecasting (Hyndman and Athanasopoulos, 2018; Hyndman and Khandakar, 2008). As discussed above, we compare the forecast performance of univariate ARIMA models (Eq. 1) with ARIMA models that also include environmental exogenous predictors, which, in this case, are (i) December–January–February (DJF) ENSO, (ii) the February RZSM (Feb-RZSM) (monitoring) product, and (iii) the February RZSM forecast initialized on 1 November during the growing-season preceding harvested yields in year t (e.g., 1982–1983 DJF used for 1983 yield). All models are fit using the auto.arima( ) function from the forecast package in the R software language (R Core Team, 2018).
We use the period of 1983–2007 (25 years) as a training period and then provide “out-of-sample” forecasts of crop yield starting in 2008. The training period always extends through the year before the target forecast year. For example, the model fit over 1983–2008 is used to forecast yields in 2009, the model fit over 1983–2009 is used to forecast yield in 2010, and so on. We repeat this exercise through 2018 and record the one-step-ahead prediction error in each iteration. In this way, we emulate the forecasting process that food security analysts in the region go through during every year prior to harvest.
3.1 Performance of NHyFAS during the 2015–2016 drought event
As highlighted in Sect. 1, the 2015–2016 drought event in SA is among the most severe in terms of drought severity and food insecurity impacts in the last few decades. Therefore, we begin the evaluation of the suitability of NHyFAS in supporting food insecurity early warning in the SA region by examining how this system would have performed during the 2015–2016 event. Although NHyFAS operationally provides the seasonal forecasts every month, for the purpose of this study, we focus on the forecast initialized on 1 November (near the start of the planting season) and 1 January (near the middle of the growing season) of the 2015–2016 event. Figure 4 shows the RZSM forecasts for the growing season made on 1 November 2015. By this time in the season, both FEWS NET and SADC had provided early warning of poor rainfall performance in the region (Magadzire et al., 2017). The NHyFAS RZSM forecasts would have provided further evidence of a looming unprecedented drought in the region. These forecasts would have also indicated that RSA, which is the most important country for the region's food production, was going to be within the epicenter of this drought event. These forecasts, in turn, could potentially have triggered earlier appropriate actions by the early warning agencies as well as the decision makers (e.g., national governments and international relief agencies).
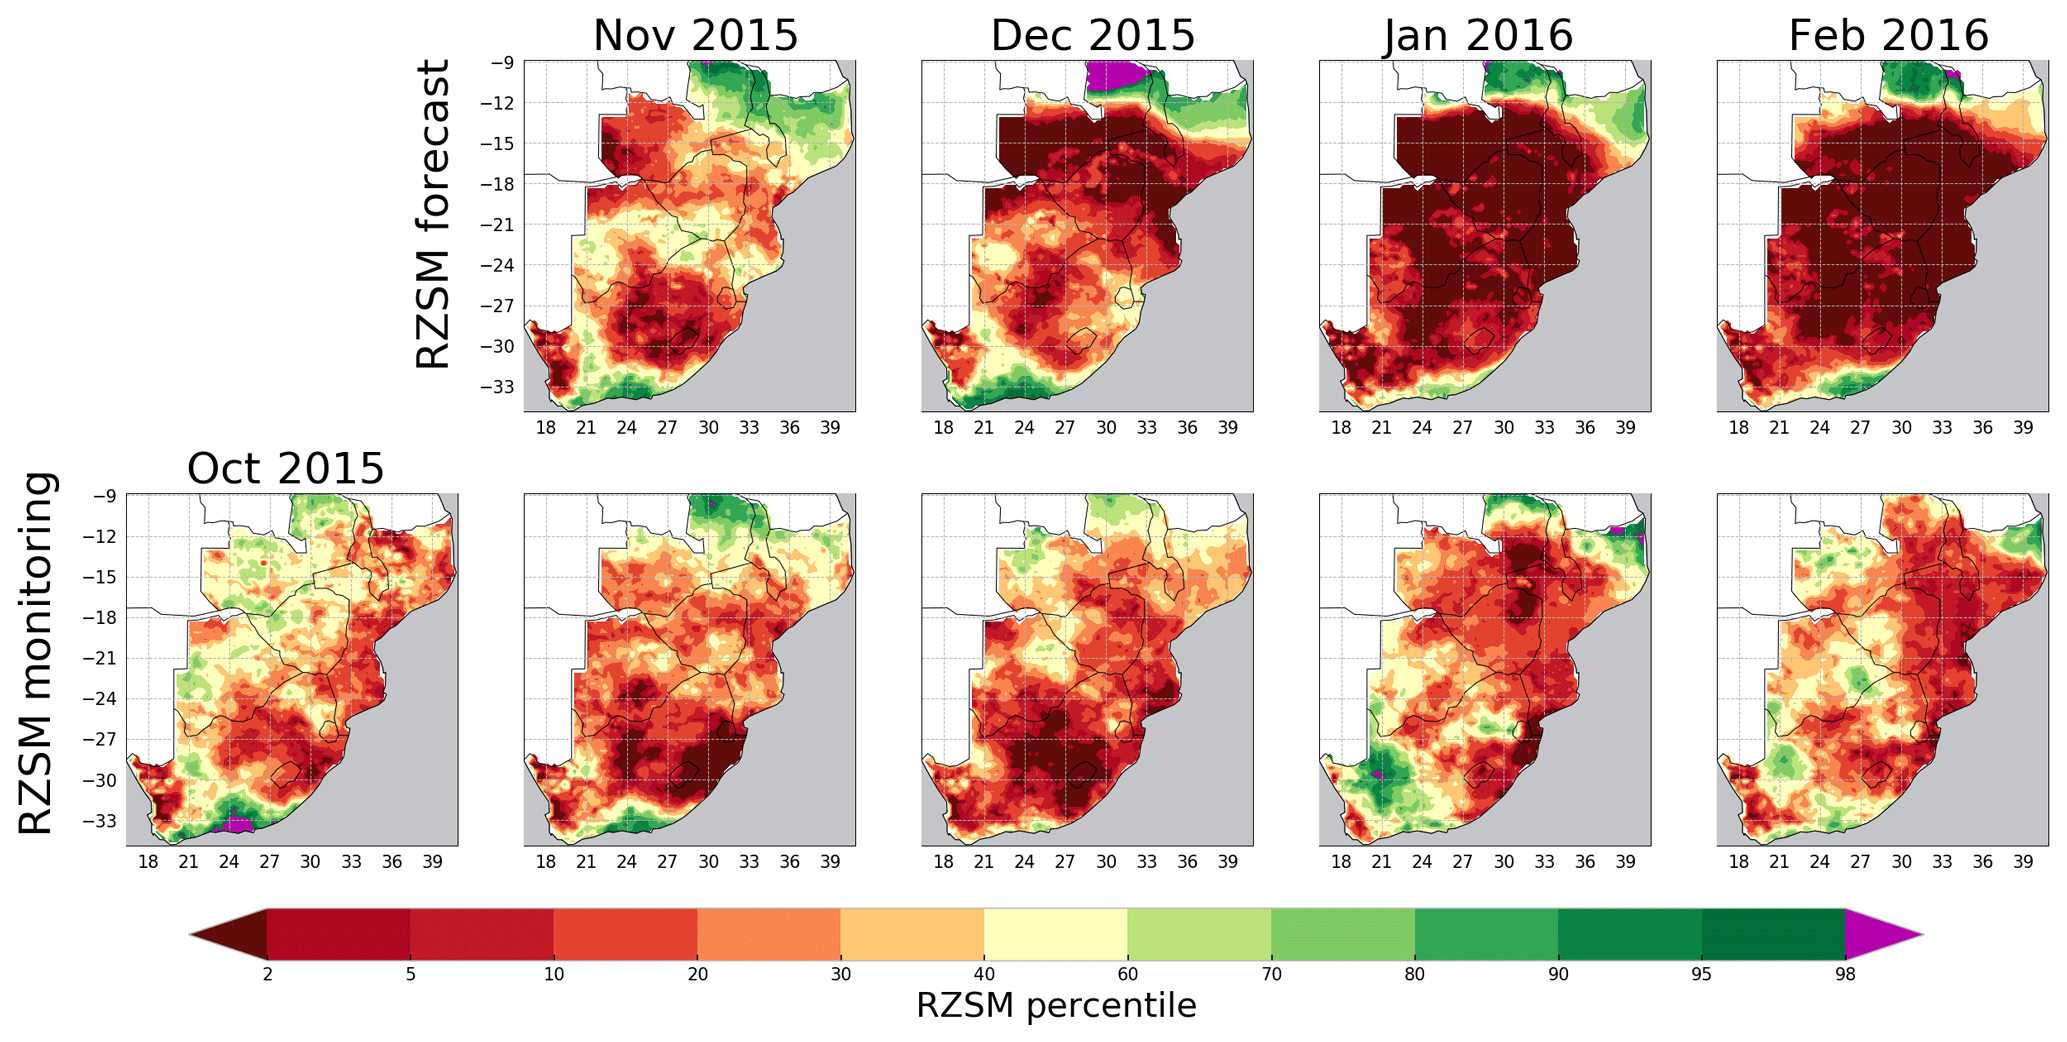
Figure 4Forecast (top panels) and monitoring of root-zone soil moisture (RZSM) percentiles for the months of November 2015 through February 2016. October 2015 conditions reflect the state of RZSM during the month preceding the forecast initialization on 1 November 2015. The RZSM monitoring product for a given month is available during the early part of the following month. The historical climatology (1982–2010) was used to calculate percentile.
Later in the season, as the observed precipitation data became available, RZSM monitoring products would have provided refined estimates of the spatial extent and severity of drought in the region. Figure 4 (bottom panels) shows the RZSM monitoring product available after each of the months from November 2015 to February 2016. This monitoring product would have provided additional proof of the drought occurrence in the region and shown that RSA was within the epicenter of this drought. It is important to state that even the monitoring product can be effectively used as a predictor of food insecurity events, as it is available before the typical start of the harvest season (in April) and the lean season (in November).
3.2 Performance of NHyFAS in supporting food insecurity early warning
Next, we investigate the long-term performance of NHyFAS in supporting food insecurity early warning by examining how well forecasting and monitoring products available from this system can explain historical variability in regional crop yield of the SA region and, in particular, help identify below-normal regional yield events. Regional crop yield is calculated by adding the yearly productions from the SA countries, then dividing it by the yearly total harvested area. The regional crop yield is then detrended to remove the effect of any long-term changes (such as technological changes) on the regional yield.
First, we show in Fig. 5 how detrended crop yield correlates (from early November to early March) with the monthly RZSM monitoring product relative to how it correlates with 3-monthly seasonal precipitation and air temperature. The results indicate that the monthly RZSM monitoring product generally correlates better with detrended crop yield than with the seasonal precipitation or air temperature, with the correlation reaching its peak by early March, when the Feb-RZSM monitoring product and December–February precipitation and temperature are available. Feb-RZSM still shows higher correlation than seasonal precipitation and temperature; however, the difference in correlation is not statistically significant.

Figure 5Variability in the correlation between the 3-month seasonal precipitation, 3-month seasonal air temperature (AirT), and monthly RZSM monitoring product with the detrended crop yield. This result highlights that RZSM is potentially a better predictor of crop yield than seasonal precipitation and AirT; also, the skill is the highest in early March when DJF seasonal precipitation, AirT, and February RZSM monitoring products are available.
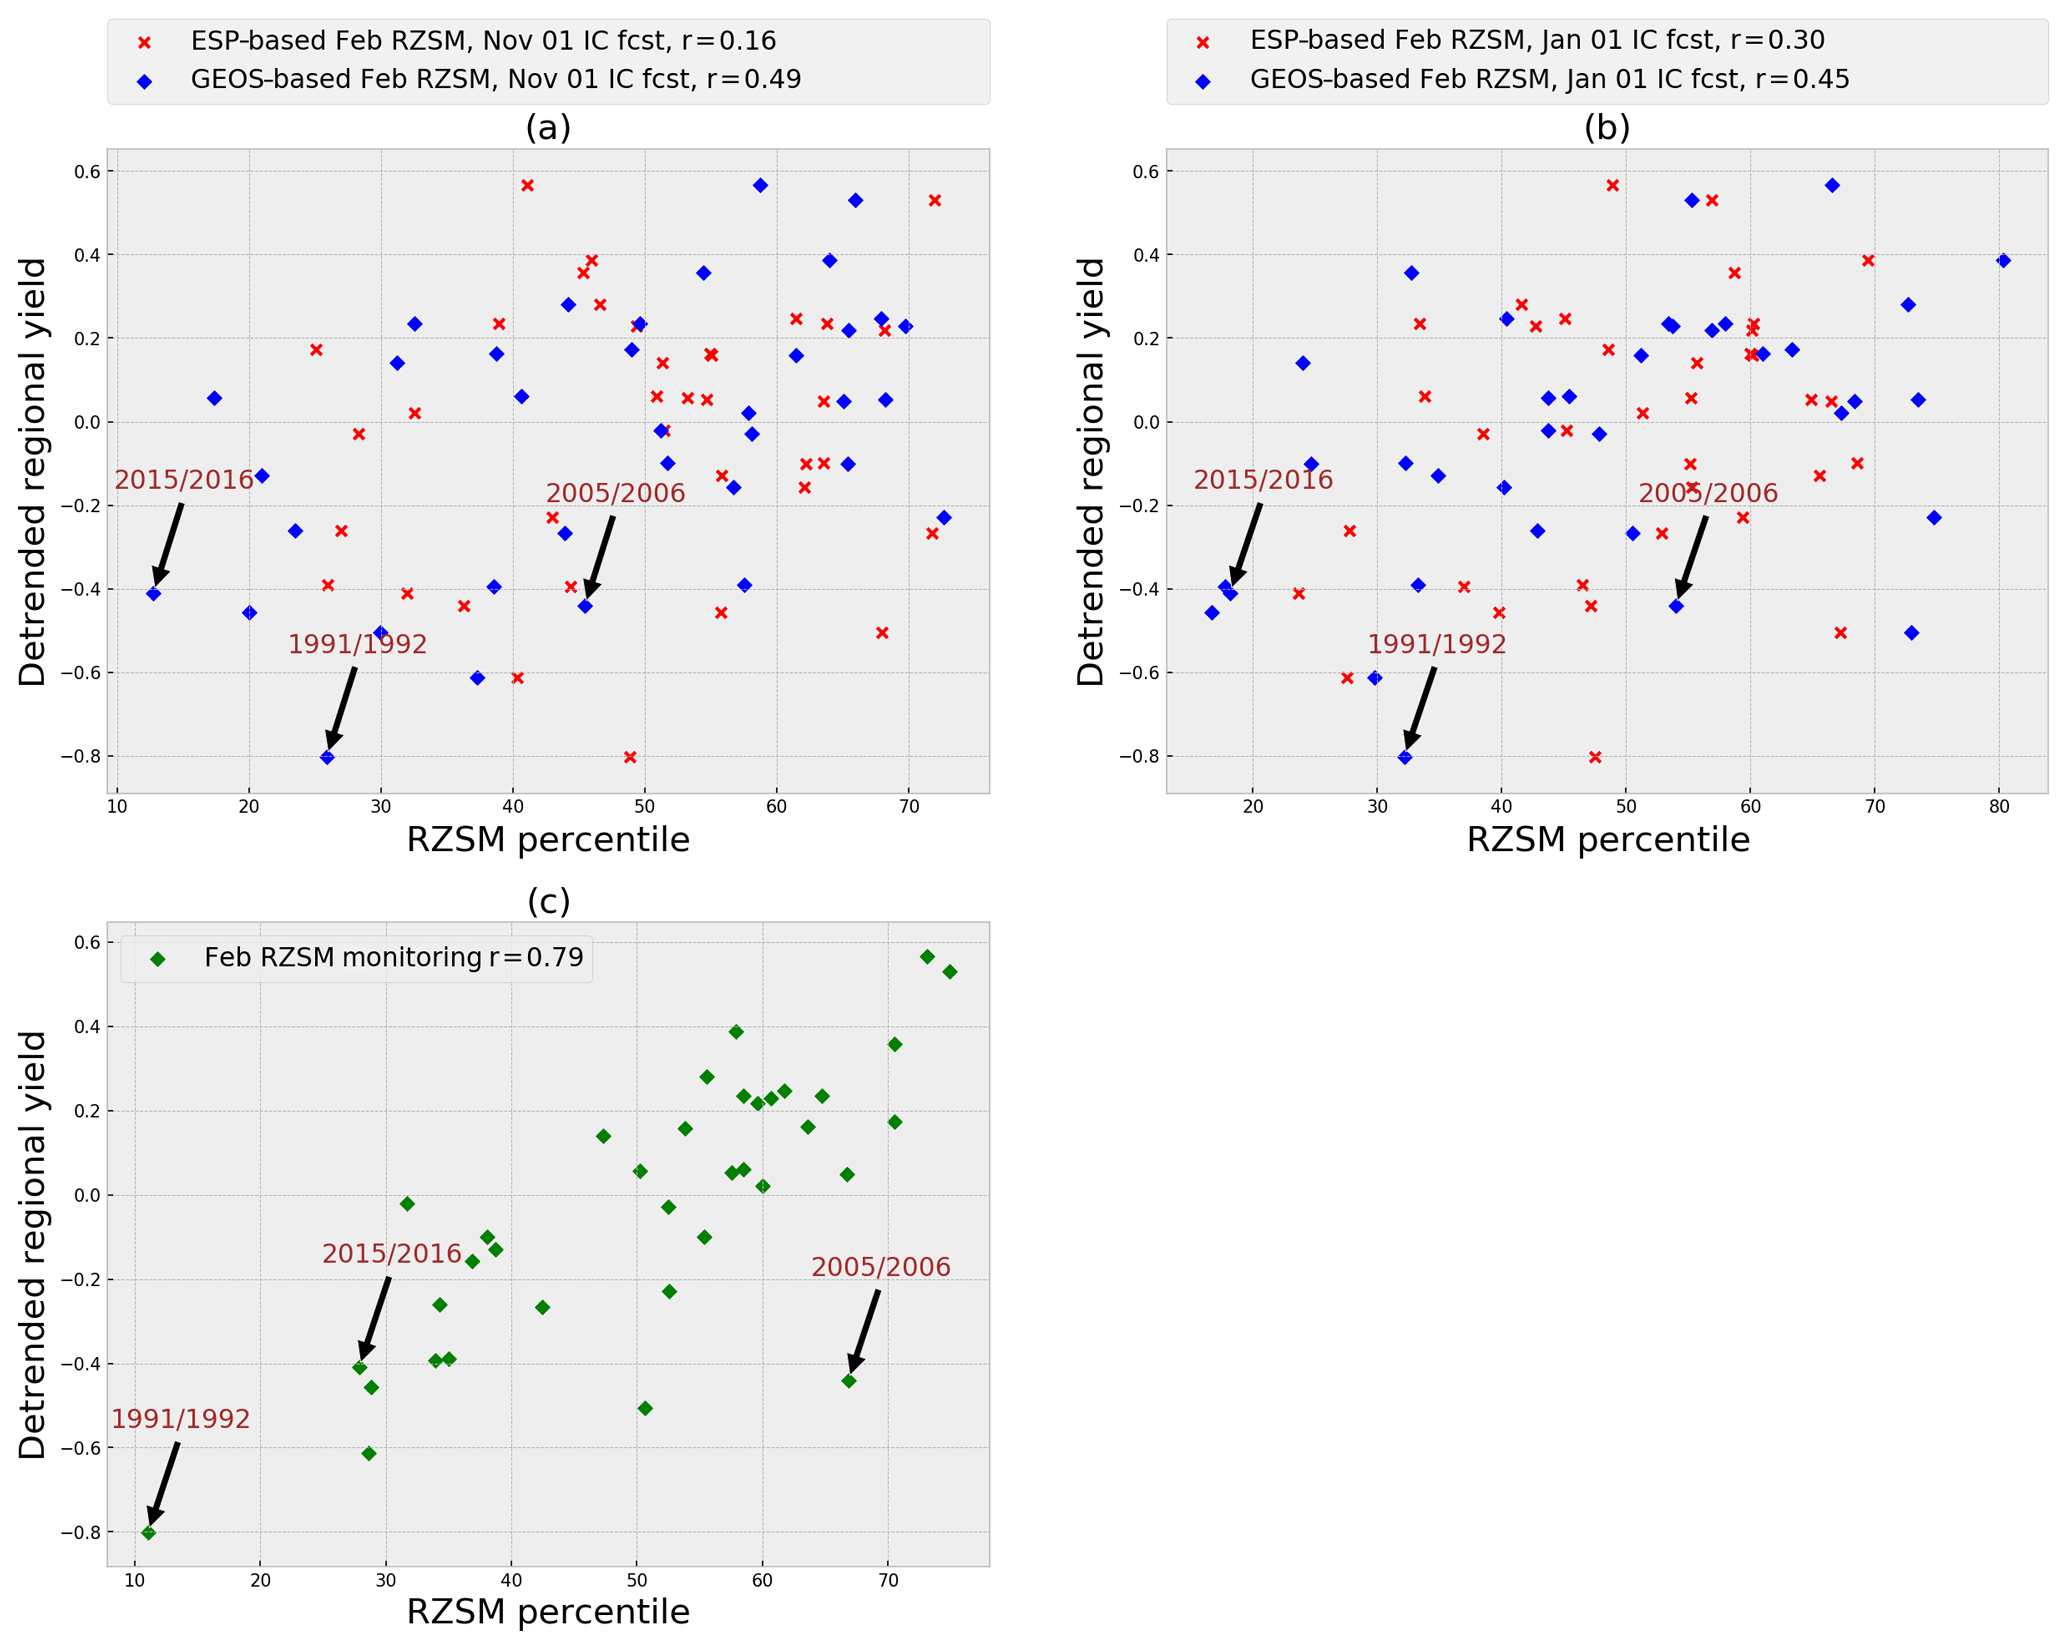
Figure 6Covariability of detrended regional yield in southern Africa, with (a) February RZSM forecasts (initialized on 1 November) generated using ESP method and bias-corrected GEOS forecasts, (b) February RZSM forecasts (initialized on 1 January) generated using ESP method and bias-corrected GEOS forecasts, and (c) the February RZSM monitoring product (available in early March). IC fcst stands for initial condition of forecast.
Next, the correlation between detrended crop yield and February RZSM forecasts (based on ESP method and bias-corrected GEOS forecasts) initialized on 1 November (Fig. 6a) and 1 January (Fig. 6b) is analyzed. The correlation of the yield with GEOS-based February RZSM forecasts initialized on 1 November is 0.49, which is substantially higher than that of ESP-based RZSM forecasts (0.16), clearly demonstrating the added value of using GEOS-based climate forecasts. Similarly, the correlation of yield with the GEOS-based February RZSM forecasts initialized on 1 January is 0.45, higher than that of the ESP-based forecasts (0.30) at that time of the year. Moreover, the correlation of detrended crop yield with GEOS-based February RZSM forecasts initialized on 1 November (0.49) and 1 January (0.45) is higher than that with the RZSM monitoring product (Fig. 5) at those times of the year (<0.1 in early November and <0.4 in early January). Again, this highlights the value of using forecasts of Feb-RZSM through early January in supporting food insecurity early warning. Figure 6c shows that the Feb-RZSM monitoring product, which is available in early March, has the highest correlation of 0.79 with the detrended crop yield.
Next, we examine how well the forecasting and monitoring RZSM products do in providing early warning of below-normal crop yield events. This criterion for performance evaluation is of particular significance for food insecurity early warning in the region, as below-normal crop yield events are the ones that generally lead to food insecurity. In this case, below-normal regional crop yield events are the events that lie in the bottom 18 (i.e., bottom half) when detrended crop yields for the 36 years are ranked in ascending order.
We calculate the probability of below-normal crop yield events when either the February RZSM forecast (initialized on 1 November and 1 January) or the RZSM monitoring product for the month of November (available in early December) through the month of February (available in early March) is in the lowest tercile. RZSM products in this tercile are those lying in the bottom 12 of the RZSM products when ranked in ascending order. In the case of RZSM, the ranked climatology is different for each of the forecasting products and the monitoring products for each month. We use the lower-tercile values of RZSM monitoring and forecasting products to focus on the drought years as indicated by those products. Because SA is a mostly rainfed region, the crop yield is generally below normal during drought years, as indicated in several recent events (2014–2015, 2015–2016, 2018–2019).
Figure 7 shows the fraction of years with below-normal crop yield when February RZSM forecasts (made on 1 November or 1 January) were in the lower tercile (shown by blue bars) or when monthly RZSM monitoring products (shown by green bars) were in the lower tercile. These results indicate that as early as 1 November, if the February RZSM is forecasted to be in the lower tercile, there is ∼66 % probability of the regional crop yield being below normal (statistically significant at 86 % confidence level). This would be 4–5 months before the start of the harvest season and about 1 year before the start of the next lean season. The inferred probability value increases to ∼83 % when the February RZSM forecasts, initialized in January, are in the lower tercile (statistically significant > 95 % confidence level). Finally, by early March, when the February RZSM monitoring product is available, the inferred probability increases to 100 % (statistically significant > 95 % confidence level). In other words, over 1982–2016, whenever the February RZSM monitoring product for the SA region was in the lowest tercile, the crop yield in the following season had been below normal (based on detrended yield). This would be 1–2 months before the start of the harvest season and about 8–9 months before the start of the next lean season.
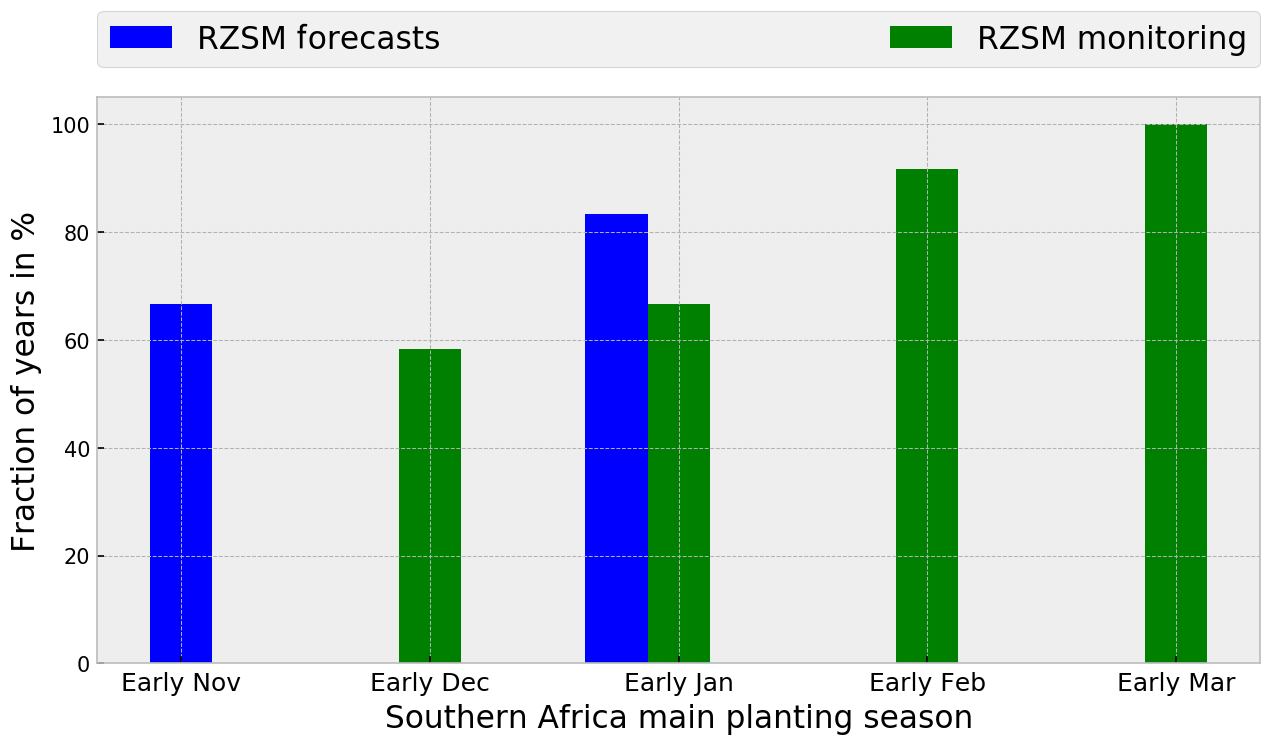
Figure 7Fraction of years with below-normal regional crop yield (based on the rank of detrended crop yield) given that the corresponding RZSM forecasts (initialized on 1 November and 1 January) and RZSM monitoring product (available in early March) were in the lowest tercile (based on the rank of the RZSM climatology). Note that the 1 November (1 January) RZSM forecast-based probability of ∼66 % (∼83 %) is statistically significant at the ∼86 % (∼95 %) confidence level.
Of course, the estimation of these probabilities is necessarily limited by the small sample sizes examined; the actual probability of low crop yield based on low February RZSM, for example, while apparently high, is not a full 100 %. Nevertheless, these results provide, overall, further evidence of the suitability of the forecasting and monitoring products from the NHyFAS in supporting early warning of food insecurity in the region.
3.3 Performance of NHyFAS in providing routine operational crop yield forecasts
Finally, we evaluate the performance of NHyFAS for supporting food insecurity early warning in SA by examining the accuracy of RZSM monitoring and RZSM forecasting products in predicting regional crop yields. We compare the crop yield forecasts made with the RZSM products against both univariate forecasts (using only past observed crop yields) and forecasts made with ENSO. As ENSO is a widely used predictor for precipitation and crop yield forecasts in this region, we examine the added value of using NHyFAS RZSM monitoring and forecasting products above and beyond ENSO. All forecasts are done using ARIMA models described in Sect. 2.6.
Figure 8 shows a comparison between the “observed” reported crop yield (black lines) and the “out-of-sample” (i.e., post-training period) forecasted yield (red lines) produced with a univariate model and the models using environmental exogenous predictors (i) DJF ENSO, (ii) Feb-RZSM (monitoring product), and (iii) Feb-RZSM (forecasting product) initialized on 1 November in addition to that univariate model.
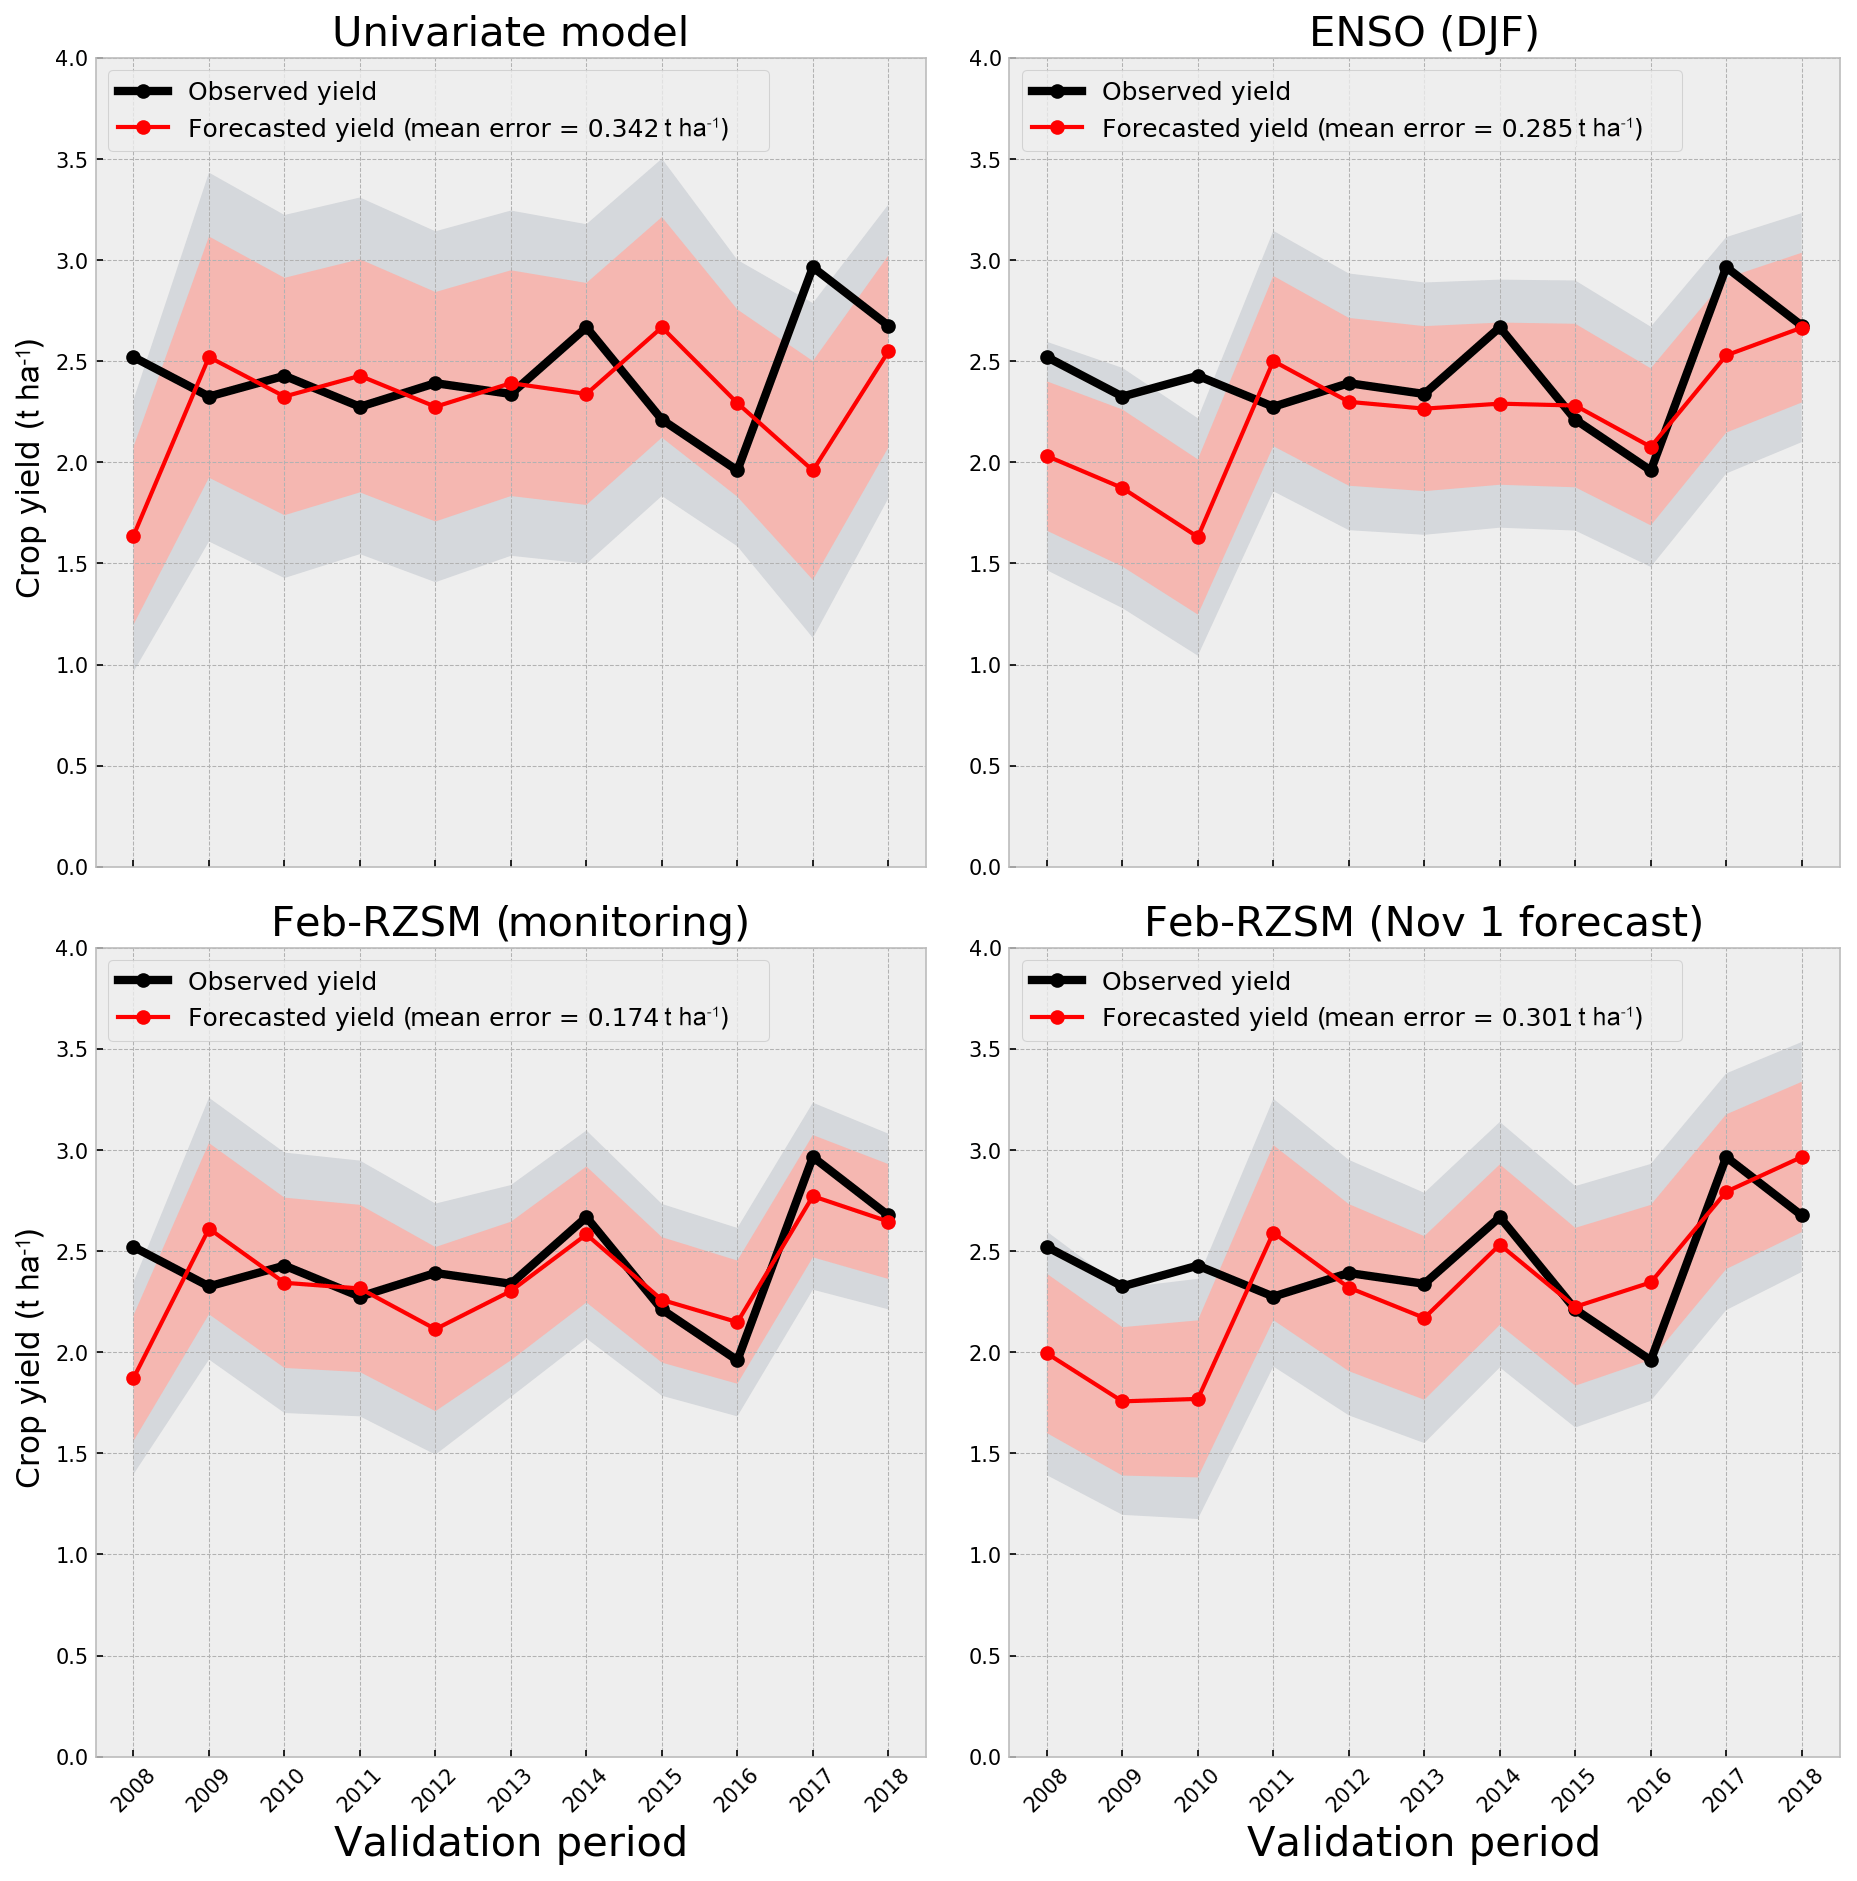
Figure 8Comparison of the performance of a univariate model alone, ENSO (DJF), Feb-RZSM (monitoring product), and Feb-RZSM (forecasting product) as a predictor in forecasting crop yield of southern Africa. Pink (gray) shading indicates 80 % (95 %) confidence interval.
The results indicate the following. (i) Environmental predictors such as ENSO and the NHyFAS products can make crop yield forecasts that are more accurate than those produced using only a univariate approach. When ENSO is used as an additional predictor (in addition to a univariate model), the mean absolute error (MAE) reduces from 0.342 to 0.285 t ha−1, a ∼17 % reduction in error. (ii) Use of the Feb-RZSM monitoring product has an even larger impact, reducing the MAE by about 50 %, to 0.174 t ha−1. (iii) Use of the Feb-RZSM forecasting product (initialized on 1 November) has an impact similar to that of DJF ENSO. Although the MAE is about 6 % larger when the forecasting product is used rather than the ENSO predictor, the forecasting product has the significant advantage of being available about 4 months earlier. For comparison (not shown here) the MAE of the Feb-RZSM forecasting product (initialized on 1 November) is slightly smaller (∼6 %) than the MAE of August–October (ASO) ENSO (also available in early November) and is comparable to the MAE of September–November (SON) ENSO (available in early December) as a predictor of crop yield forecast.
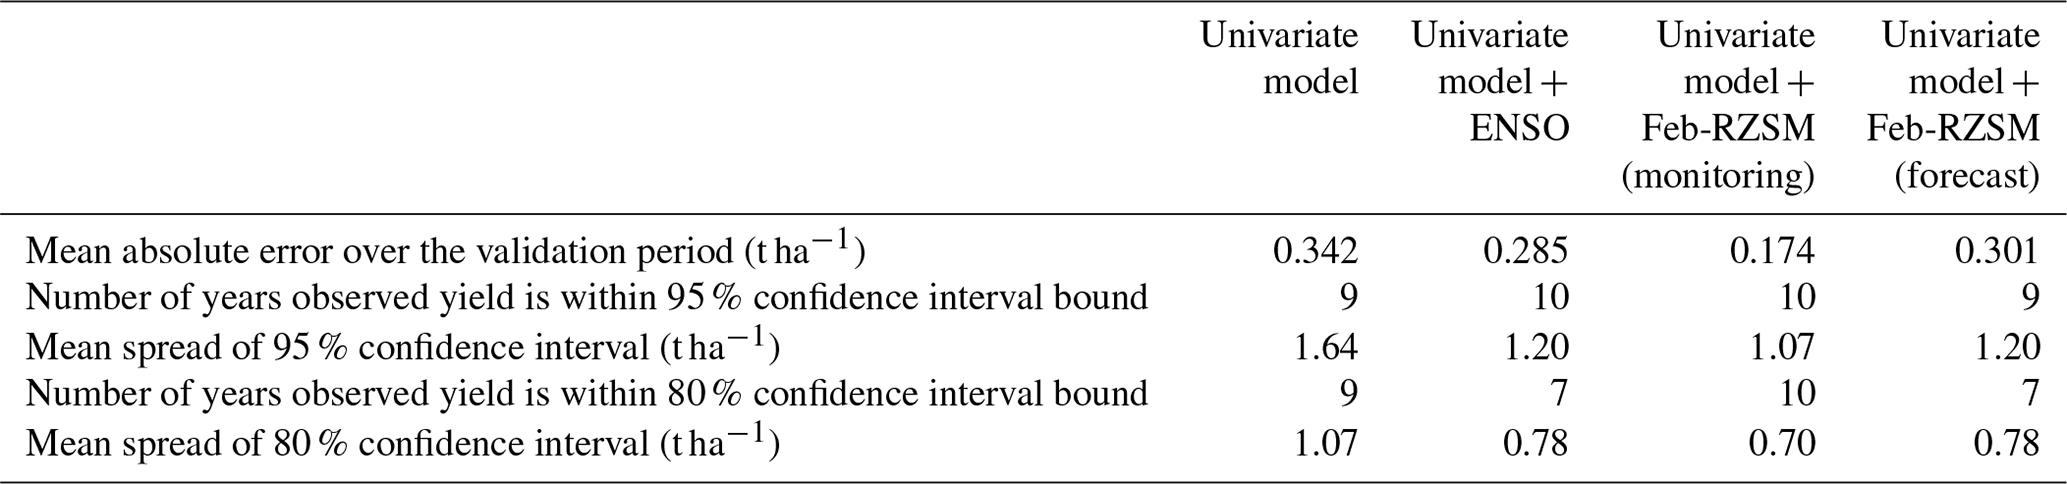
Table 1 shows the number of times the observed yield is within the 80 % confidence interval of the forecasts and the mean spread of the confidence interval. The improvement in performance obtained when the Feb-RZSM monitoring product is used is clear; during 10 of the 11 years in the validation period, the observed yield falls within the 80 % confidence interval, whereas this happens in only 7 years when DJF ENSO is used as the additional predictor. The mean spread of the confidence interval associated with the use of the Feb-RZSM monitoring product (0.70 t ha−1) is also the smallest.
Table 1Performance of “out-of-sample” crop yield forecasting over the validation period of 2008–2018.
This study makes a case for the application of NHyFAS's RZSM forecasting and monitoring products in supporting the early warning of food insecurity in SA. It has been shown that the successful early warning of crop yield, and especially below-normal crop yield years, can be issued based on these products. In this section, we address a few important caveats.
4.1 Comparison with existing drought forecasting systems and approaches
In this study, we keep the comparison with existing forecasting systems and approaches limited to the comparison of the performance of NHyFAS products with (i) ESP-based (i.e., climatology) RZSM forecasts and (ii) ENSO-based crop yield forecasts, both of which are commonly used approaches for drought forecasting in the region, including by early warning providers such as FEWS NET. Comparison against both approaches shows clear added value of using the NHyFAS products. We could not compare the performance of the NHyFAS with FEWS NET or SADC's official historical forecasts for the following reasons:
- i.
FEWS NET's official forecast is an outlook of food insecurity conditions (Funk et al. 2019; https://fews.net/, last access: 26 April 2020) which is based not only on agroclimatology (i.e., agriculture and climate conditions) but also on market conditions and nutrition and livelihood conditions. The NHyFAS forecasts that are now being used by FEWS NET would fall into the category of agroclimatological conditions. In fact, the goal of the evaluation of the NHyFAS forecasts is to establish whether NHyFAS forecasts can be suitable agroclimatological forecast inputs for FEWS NET to guide the development of food insecurity outlook assessments. Also, the FEWS NET food insecurity outlook is partly based on subjective assessments, in some ways similar to the US Drought Monitor (Svoboda et al., 2002) or US Seasonal Drought Outlook, in addition to quantitative assessments such as agroclimatological forecasts. Finally, FEWS NET's archive of food insecurity outlooks currently extends back only to mid-2011.
- ii.
SADC CSC issues probabilistic seasonal-scale rainfall forecasts. These forecasts are based on multiple models (both statistical and dynamical) as well as subjective expert assessments, which makes comparison with purely quantitative products inappropriate. Additionally, the archive of purely quantitative forecasts from SADC CSC only goes back to 2017.
Finally, the NHyFAS products are intended to be used as an addition to the existing early warning tools of FEWS NET and SADC CSC, which are partners in the efforts described in this study, rather than replacing any of the existing tools.
4.2 Influence of crop yield on regional food insecurity and issues in crop yield reports
In this study, it is assumed that when the SA region faces a production shortfall, the regional food insecurity is likely to rise. This was certainly the case during the 20152–2016 El Niño, the most recent major food insecurity event in the region (SADC 2016). However, this assumption ignores other important factors that may lead to or further worsen food insecurity in the region, such as inadequate agricultural inputs, price shocks (which can be global in nature), a rise in population, conflict, limited livelihood options, stocks, etc. Nonetheless, the direct relationship of crop yield with the interannual variability in available moisture makes RZSM an important variable for food security monitoring, and, thus, it is of keen interest to early warning systems like FEWS NET, which is presently the primary end user of the NHyFAS. Crop yield early warning based on the NHyFAS products is also directly relevant to international collaborative efforts like the Group on Earth Observations Global Agricultural Monitoring (GEOGLAM) initiative (Becker-Reshef et al., 2010, 2020) and, particularly, to Crop Monitor for Early Warning (https://cropmonitor.org/, last access: 26 April 2020), which provides monthly assessments of crop conditions for the countries most vulnerable to food insecurity. Such assessments are key to reducing the uncertainty of crop prospects as the growing season progresses and to providing critical evidence for informing food security decisions by humanitarian organizations and governments alike.
It is also worth noting that crop yield reports can be influenced by external factors (for example, reporting issues related to methods) other than long-term agricultural, technology-driven changes and climate interannual variability. The effect of these factors on the regional crop yield, of course, cannot be discounted by the detrending method employed in this study.
4.3 Reliance on single-climate-model forecasts
Finally, the results of this study are also likely affected by the use of only one dynamical climate forecast model for driving the seasonal hydrologic forecasting system. Adding forecasts from more climate and hydrologic models would likely enhance the skill of the system (Kirtman et al., 2014; Krishnamurti et al., 1999). The choice of one dynamical system was made mostly for logistical purposes, since GEOS archived and real-time forecasts include all atmospheric forcing variables needed to drive such LSMs and are available through the NASA Goddard Space Flight Center routinely to facilitate operational production of NHyFAS forecasts.
The region of SA has witnessed several severe food insecurity events in the last few decades. Mitigation of food insecurity impact requires timely and effective interventions by national, regional, and international agencies. To support those interventions, early warning of food insecurity is needed. In this study, we investigate the suitability of the operational RZSM products produced by a recently developed NASA seasonal-scale hydrologic forecasting system, NHyFAS, in supporting food insecurity early warning in this region.
The key findings of this study are as follows. (i) The NHyFAS products would have identified the regional severe 2015–2016 drought event (which peaked in December–February) at least as early as 1 November 2015. (ii) February RZSM forecasts produced as early as 1 November (4–5 months before the start of harvest and about 1 year before the start of the next lean season) can explain the interannual variability in regional crop yield production with moderate skill (correlation 0.49). (iii) Use of dynamical climate forecasts adds to the skill (relative to the skill coming from the initial hydrologic conditions alone) in predicting regional crop yield through the prediction of February RZSM. (iv) The February RZSM monitoring product, available in early March (1–2 months before the start of harvest and 8–9 months before the start of the next lean season) can explain the variability in regional crop yield with high skill (correlation of 0.79). (v) When the February RZSM forecast (initialized on 1 November) is found to be in the lowest tercile, the subsequent detrended regional crop yield is below normal about 66 % of the time (statistical significance level ∼86 %), and, likewise, when the February RZSM monitoring product is in the lowest tercile, the subsequent crop yield is (for a limited set of samples considered) always below normal (statistical significance level > 95 %). (vi) The February RZSM monitoring product can provide “out-of-sample” crop yield forecasts with higher skill than DJF ENSO (38 % reduction in mean error relative to DJF ENSO), whereas the February RZSM forecasting product, available in early November, can provide crop yield forecasts with comparable skill (∼6 % increase in mean error relative to DJF ENSO).
The NHyFAS products described here were first generated in August 2018 for operational applications by FEWS NET. As described in much detail in Funk et al. (2019), each month, FEWS NET's regional scientists (located in eastern, western, and southern Africa) review the latest products ahead of the FEWS NET's monthly climate discussions. The NHyFAS products, in addition to other early warning tools, are used to support or revise the assumptions of climate and hydrologic conditions in the upcoming season. The updated assumptions are then passed on to food analysts for the region in order to help inform needed relief actions. This study demonstrates the value of the NHyFAS products in supporting food insecurity early warning in the SA region. It is worth mentioning that since NHyFAS currently covers the regions of Africa and the Middle East, the NHyFAS products are applicable for food insecurity early warning in the rest of Africa and the Middle East as well. Based on this study, it is postulated (future research pending) that NHyFAS RZSM products can be particularly effective for the rainfed agriculture regions and seasons which are not known to have strong teleconnection (e.g., with ENSO), as in the SA region. Finally, since the data sets and models used to implement the NHyFAS are available globally, a similar seasonal RZSM monitoring and forecasting framework can be developed at a global scale to support food insecurity early warning in other rainfed regions across the globe.
Crop yield, production, and consumption data were obtained from USDA FAS's PSD: https://apps.fas.usda.gov/psdonline/app/index.html#/app/home (last access: 26 April 2020). Average price data were obtained from FAO's FAO STATS database http://www.fao.org/faostat/en/#home (last access: 26 April 2020). World Bank Development Indicators were downloaded from https://data.worldbank.org/indicator/ (last access: 26 April 2020). GEOS forecast data sets are generated and supported by NASA's Global Modeling and Assimilation Office (GMAO). Model source code can be found at NASA's Land Information System's GitHub repository (https://lis.gsfc.nasa.gov/news/latest-lis-code-now-available-github, last access: 26 April 2020) (Kumar et al., 2006). Model parameters are available upon request per email. The daily CHIRPS precipitation data can be found at ftp://ftp.chg.ucsb.edu/pub/org/chg/products/CHIRPS-2.0/global_daily/netcdf/p25/ (last access: 26 April 2020) (Funk et al., 2015). MERRA-2 reanalysis-based atmospheric forcings can be found through NASA's GES DISC archive (https://disc.gsfc.nasa.gov/datasets?keywords=(MERRA-2)&page=1&source=Models%2FAnalyses MERRA-2, last access: 26 April 2020) (Gelaro et al., 2017). NHyFAS forecasts, in the form of maps, can be found here: https://lis.gsfc.nasa.gov/projects/nhyfas (last access: 26 April 2020). As of now, NHyFAS forecast data sets are not publicly accessible.
The supplement related to this article is available online at: https://doi.org/10.5194/nhess-20-1187-2020-supplement.
SS led the design of the analysis, conducted the analysis, and wrote the paper and generated figures. KRA, CPL, CF, and FDN contributed to the design of the analysis. FD contributed to the analysis as well. KRA and AH conducted the model simulations. RK and CPL reviewed the article and proposed substantial changes. CPL and GH are PIs of projects supporting this work. TM, JV, AM, and AH facilitated real-time application of the products. The other co-authors reviewed the article and provided their input and edits.
The authors declare that they have no conflict of interest.
This article is part of the special issue “Recent advances in drought and water scarcity monitoring, modelling, and forecasting (EGU2019, session HS4.1.1/NH1.31)”. It is a result of the European Geosciences Union General Assembly 2019, Vienna, Austria, 7–12 April 2019.
Support for this study comes from NASA grant no. NNX15AL46G, NASA Harvest Consortium, award no. #80NSSC18M0039, the US Geological Survey (USGS) cooperative agreement no. G09AC000001, and the United States Agency for International Development (USAID) cooperative agreement no. 72DFFP19CA00001. High-performance computing resources were provided by the NASA Center for Climate Simulation (NCCS) in Greenbelt, MD. The authors thank the Climate Hazards Center's technical writer, Juliet Way-Henthorne, for providing professional editing.
This research has been supported by NASA (grant no. NNX15AL46G), the NASA Harvest Consortium (award no. #80NSSC18M0039), the USGS (grant no. G09AC000001) and the United States Agency for International Development (USAID; grant no. 72DFFP19CA00001).
This paper was edited by Carmelo Cammalleri and reviewed by Charles Rougé and one anonymous referee.
Archer, E., Landman, W. A., Tadross, M. A., Malherbe, J., Weepener, H., Maluleke, P., and Marumbwa, F. M.: Understanding the evolution of the 2014–2016 summer rainfall seasons in southern Africa: Key lessons, Clim. Risk Manage., 16, 22–28, 2017.
Arsenault, K., Shukla, S., Hazra, A., Getirana, A., McNally, A., Kumar, S., Koster, R., Zaitchik, B., Badr, H., Jung, H. C., Narapusetty, B., Navari, M., Wang, S., Mocko, S., Funk, C., Harrison, L., Husak, G., Verdin, J. V., and Peters-Lidard, C. C.: A NASA modeling and remote-sensing based hydrological forecast system for food and water security applications, B. Am. Meteorol. Soc., https://doi.org/10.1175/BAMS-D-18-0264.1, in press, 2020.
Becker-Reshef, I., Justice, C., Sullivan, M., Vermote, E., Tucker, C., Anyamba, A., Small, J., Pak, E., Masuoka, E., Schmaltz, J., Hansen, M., Pittman, K., Birkett, C., Williams, D., Reynolds, C., and Doorn, B.: Monitoring Global Croplands with Coarse Resolution Earth Observations: The Global Agriculture Monitoring (GLAM) Project, Remote Sens., 2, 1589–1609, 2010.
Becker-Reshef, I., Barker, B., Bonifacio, M., Budde, M., Constantino, A., Humber, M., Jarivs, I., Justice, C., Magadzire, T., Mwangi, K., Nakalembe, C., Newby, T., Pound, J., Shitote, C., Sobue, S., Verdin, J., and Whitcraft, A.: Strengthening agricultural decisions in countries at risk of food insecurity: The GEOGLAM Crop Monitor for Early Warning, Remote Sens. Environ., 237, 111556, https://doi.org/10.1016/j.rse.2019.111553, 2020.
Borovikov, A., Cullather, R., Kovach, R., Marshak, J., Vernieres, G., Vikhliaev, Y., Zhao, B., and Li, Z.: GEOS-5 seasonal forecast system, Clim. Dynam., 53, 7335–7361, https://doi.org/10.1007/s00382-017-3835-2, 2017.
Cane, M. A., Eshel, G., and Buckland, R. W.: Forecasting Zimbabwean maize yield using eastern equatorial Pacific sea surface temperature, Nature, 370, 204–205, 1994.
Conway, D., van Garderen, E. A., Deryng, D., Dorling, S., Krueger, T., Landman, W., Lankford, B., Lebek, K., Osborn, T., Ringler, C., Thurlow, J., Zhu, T., and Dalin, C.: Climate and southern Africa's water–energy–food nexus, Nat. Clim. Change, 5, 837–846, https://doi.org/10.1038/nclimate2735, 2015.
Csiszar, I. and Gutman, G.: Mapping global land surface albedo from NOAA AVHRR, J. Geophys. Res.-Atmos., 104, 6215–6228, https://doi.org/10.1029/1998jd200090, 1999.
Day, G.: Extended Streamflow Forecasting Using NWSRFS, J. Water Resour. Pl. Manage., 111, 157–170, https://doi.org/10.1061/(ASCE)0733-9496(1985)111:2(157), 1985.
Davenport, F. M., Harrison, L., Shukla, S., Husak, G., Funk, C., and McNally, A.: Using out-of-sample yield forecast experiments to evaluate which earth observation products best indicate end of season maize yields, Environ. Res. Lett., 14, 124095, https://doi.org/10.1088/1748-9326/ab5ccd, 2019.
Diro, G. T.: Skill and economic benefits of dynamical downscaling of ECMWF ENSEMBLE seasonal forecast over southern Africa with RegCM4, Int. J. Climatol., 36, 675–688, 2015.
Ducharne, A., Koster, R. D., Suarez, M. J., Stieglitz, M., and Kumar, P.: A catchment-based approach to modeling land surface processes in a general circulation model: 2. Parameter estimation and model demonstration, J. Geophys. Res.-Atmos., 105, 24823–24838, 2000.
Friedl, M. A., McIver, D. K., Hodges, J. C. F., Zhang, X. Y., Muchoney, D., Strahler, A. H., Woodcock, C. E., Gopal, S., Schneider, A., Cooper, A., Baccini, A., Gao, F., and Schaaf, C.: Global land cover mapping from MODIS: algorithms and early results, Remote Sens. Environ., 83, 287–302, https://doi.org/10.1016/s0034-4257(02)00078-0, 2002.
Funk, C., Peterson, P., Landsfeld, M., Pedreros, D., Verdin, J., Shukla, S., Husak, G., Rowland, J., Harrison, L., Hoell, A., and Michaelsen, J.: The climate hazards infrared precipitation with stations – a new environmental record for monitoring extremes, Sci. Data, 2, 150066, https://doi.org/10.1038/sdata.2015.66, 2015.
Funk, C., Davenport, F., Harrison, L., Magadzire, T., Galu, G., Artan, G. A., Shukla, S., Korecha, D., Indeje, M., Pomposi, C., Macharia, D., Husak, G., and Nsadisa, F. D.: Anthropogenic Enhancement of Moderate-to-Strong El Niño Events Likely Contributed to Drought and Poor Harvests in Southern Africa During 2016, B. Am. Meteorol. Soc., 99, S91–S96, 2018.
Funk, C., Shukla, S., Thiaw, W. M., Rowland, J., Hoell, A., McNally, A., Husak, G., Novella, N., Budde, M., Peters-Lidard, C., Adoum, A., Galu, G., Korecha, D., Magadzire, T., Rodriguez, M., Robjhon, M., Bekele, E., Arsenault, K., Peterson, P., Harrison, L., Fuhrman, S., Davenport, F., Landsfeld, M., Pedreros, D., Jacob, J. P., Reynolds, C., Becker-Reshef, I., and Verdin, J.: Recognizing the Famine Early Warning Systems Network (FEWS NET): Over 30 Years of Drought Early Warning Science Advances and Partnerships Promoting Global Food Security, B. Am. Meteorol. Soc., 100, 1011–1027, https://doi.org/10.1175/bams-d-17-0233.1, 2019.
Gelaro, R., McCarty, W., Suárez, M. J., Todling, R., Molod, A., Takacs, L., Randles, C. A., Darmenov, A., Bosilovich, M. G., Reichle, R., Wargan, K., Coy, L., Cullather, R., Draper, C., Akella, S., Buchard, V., Conaty, A., Da Silva, A. M., Gu, W., Kim, G., Koster, R., Lucchesi, R., Merkova, D., Nielsen, J. E., Partyka, G., Pawson, S., Putman, W., Rienecker, M., Schubert, S. D., Sienkiewicz, M., and Zhao, A. B.: The Modern-Era Retrospective Analysis for Research and Applications, Version 2 (MERRA-2), J. Climate, 30, 5419–5454, 2017.
Guo, Z. and Dirmeyer, P. A.: Evaluation of the Second Global Soil Wetness Project soil moisture simulations: 1. Intermodel comparison, J. Geophys. Res., 111, D22S02, https://doi.org/10.1029/2006jd007233, 2006.
Gutman, G. and Ignatov, A.: The derivation of the green vegetation fraction from NOAA/AVHRR data for use in numerical weather prediction models, Int. J. Remote Sens., 19, 1533–1543, https://doi.org/10.1080/014311698215333, 1998.
Hoell, A. and Cheng, L.: Austral summer Southern Africa precipitation extremes forced by the El Niño-Southern oscillation and the subtropical Indian Ocean dipole, Clim. Dynam., 50, 3219–3236, 2017.
Hoell, A., Funk, C., Zinke, J., and Harrison, L.: Modulation of the Southern Africa precipitation response to the El Niño Southern Oscillation by the subtropical Indian Ocean Dipole, Clim. Dynam., 48, 2529–2540, 2016.
Hoell, A., Gaughan, A. E., Shukla, S., and Magadzire, T.: The Hydrologic Effects of Synchronous El Niño–Southern Oscillation and Subtropical Indian Ocean Dipole Events over Southern Africa, J. Hydrometeorol., 18, 2407–2424, 2017.
Hyndman, R. J. and Athanasopoulos, G.: Forecasting: principles and practice, Melbourne, Australia, available at: https://otexts.com/fpp2/ (last access: 26 April 2020), 2018.
Hyndman, R. J. and Khandakar, Y.: Automatic Time Series for Forecasting: The Forecast Package for R, J. Stat. Softw., 27, https://doi.org/10.18637/jss.v000.i00, 2008.
Kirtman, B. P., Min, D., Infanti, J. M., Kinter, J. L., Paolino, D. A., Zhang, Q., van den Dool, H., Saha, S., Mendez, M. P., Becker, E., Peng, P., Tripp, P., Huang, J., DeWitt, D. G., Tippett, M. K., Barnston, A. G., Li, S., Rosati, A., Schubert, S. D., Rienecker, M., Suarez, M., Li, Z. E., Marshak, J., Lim, Y., Tribbia, J., Pegion, K., Merryfield, W. J., Denis, B., and Wood, E. F.: The North American Multimodel Ensemble: Phase-1 Seasonal-to-Interannual Prediction; Phase-2 toward Developing Intraseasonal Prediction, B. Am. Meteorol. Soc., 95, 585–601, https://doi.org/10.1175/BAMS-D-12-00050.1, 2014.
Koster, R. D., Suarez, M. J., Ducharne, A., Stieglitz, M., and Kumar, P.: A catchment-based approach to modeling land surface processes in a general circulation model: 1. Model structure, J. Geophys. Res.-Atmos., 105, 24809–24822, 2000.
Krishnamurti, T., Kishtawal, C., LaRow, T., Bachiochi, D., Zhang, Z., Williford, C., Gadgil, S., and Surendran, S.: Improved Weather and Seasonal Climate Forecasts From Multi-Model Superensemble, Science, 285, 1548–1550, https://doi.org/10.1126/science.285.5433.1548, 1999.
Kumar, S., Peterslidard, C., Tian, Y., Houser, P., Geiger, J., Olden, S., Lighty, L., Eastman, J., Doty, B., and Dirmeyer, P.: Land information system: An interoperable framework for high resolution land surface modeling, Environ. Model. Softw., 21, 1402–1415, 2006.
Landman, W. A. and Beraki, A.: Multi-model forecast skill for mid-summer rainfall over southern Africa, Int. J. Climatol., 32, 303–314, 2010.
Landman, W. A. and Goddard, L.: Statistical Recalibration of GCM Forecasts over Southern Africa Using Model Output Statistics, J. Climate, 15, 2038–2055, 2002.
Landman, W. A., Mason, S. J., Tyson, P. D., and Tennant, W. J.: Retro-active skill of multi-tiered forecasts of summer rainfall over southern Africa, Int. J. Climatol., 21, 1–19, 2001.
Magadzire, T., Galu, G., and Verdin, J. P.: How climate forecasts strengthen food security, WMO, available at: https://public.wmo.int/en/resources/bulletin/how-climate-forecasts-strengthen-food-security (last access: 23 January 2020), 2017.
Manatsa, D., Mushore, T., and Lenouo, A.: Improved predictability of droughts over southern Africa using the standardized precipitation evapotranspiration index and ENSO, Theor. Appl. Climatol., 127, 259–274, 2015.
Martin, R. V., Washington, R., and Downing, T. E.: Seasonal Maize Forecasting for South Africa and Zimbabwe Derived from an Agroclimatological Model, J. Appl. Meteorol., 39, 1473–1479, 2000.
McNally, A., Arsenault, K., Kumar, S., Shukla, S., Peterson, P., Wang, S., Funk, C., Peters-Lidard, C. D., and Verdin, J. P.: A land data assimilation system for sub-Saharan Africa food and water security applications, Scient. Data, 4, 170012, https://doi.org/10.1038/sdata.2017.12, 2017.
Meque, A. and Abiodun, B. J.: Simulating the link between ENSO and summer drought in Southern Africa using regional climate models, Clim. Dynam., 44, 1881–1900, 2014.
Misselhorn, A. A.: What drives food insecurity in southern Africa? a meta-analysis of household economy studies, Global Environ. Change, 15, 33–43, https://doi.org/10.1016/j.gloenvcha.2004.11.003, 2005.
Moody, E. G., King, M. D., Schaaf, C. B., and Platnick, S.: MODIS-Derived Spatially Complete Surface Albedo Products: Spatial and Temporal Pixel Distribution and Zonal Averages, J. Appl. Meteorol. Clim., 47, 2879–2894, https://doi.org/10.1175/2008jamc1795.1, 2008.
Niu, G.-Y., Yang, Z.-L., Mitchell, K. E., Chen, F., Ek, M. B., Barlage, M., Kumar, A., Manning, K., Niyogi, D., Rosero, E., Tewari, M., and Xia, Y.: The community Noah land surface model with multiparameterization options (Noah-MP): 1. Model description and evaluation with local-scale measurements, J. Geophys. Res., 116, D12109, https://doi.org/10.1029/2010jd015139, 2011.
Pomposi, C., Funk, C., Shukla, S., Harrison, L., and Magadzire, T.: Distinguishing southern Africa precipitation response by strength of El Niño events and implications for decision-making, Environ. Res. Lett., 13, 074015, https://doi.org/10.1088/1748-9326/aacc4c, 2018.
R Core Team: R: A Language and Environment for Statistical Computing, R Foundation for Statistical Computing, Vienna, available at: https://www.R-project.org (last access: 26 April 2020), 2018.
Reynolds, C. A., Jackson, T. J., and Rawls, W. J.: Estimating soil water-holding capacities by linking the Food and Agriculture Organization Soil map of the world with global pedon databases and continuous pedotransfer functions, Water Resour. Res., 36, 3653–3662, https://doi.org/10.1029/2000wr900130, 2000.
SADC: SADC Regional Vulnerability Assessment and Analysis Synthesis Report 2016, State of Food Insecurity and Vulnerability in the Southern African Development Community, Compiled from the National Vulnerability Assessment Committee (NVAC) Reports Presented at the Regional Vulnerability Assessment and Analysis (RVAA) Annual Dissemination Forum on 6–10 June 2016 in Pretoria, Republic of South Africa, 2016.
Sheffield, J., Wood, E. F., Chaney, N., Guan, K., Sadri, S., Yuan, X., Olang, L., Amani, A., Ali, A., Demuth, S., and Ogallo, L.: A Drought Monitoring and Forecasting System for Sub-Sahara African Water Resources and Food Security, B. Am. Meteorol. Soc., 95, 861–882, 2014.
Shukla, S. and Lettenmaier, D. P.: Seasonal hydrologic prediction in the United States: understanding the role of initial hydrologic conditions and seasonal climate forecast skill. Hydrol. Earth Syst. Sci., 15, 3529–3538, https://doi.org/10.5194/hess-15-3529-2011, 2011.
Shukla, S., Sheffield, J., Wood, E. F., and Lettenmaier, D. P.: On the sources of global land surface hydrologic predictability, Hydrol. Earth Syst. Sci., 17, 2781–2796, https://doi.org/10.5194/hess-17-2781-2013, 2013.
Shukla, S., McNally, A., Husak, G., and Funk, C.: A seasonal agricultural drought forecast system for food-insecure regions of East Africa, Hydrol. Earth Syst. Sci., 18, 3907–3921, https://doi.org/10.5194/hess-18-3907-2014, 2014.
Sunday, R. K. M., Masih, I., Werner, M., and van der Zaag, P.: Streamflow forecasting for operational water management in the Incomati River Basin, Southern Africa, Phys. Chem. Earth Pt. A/B/C, 72–75, 1–12, 2014.
Svoboda, M., LeComte, D., Hayes, M., Heim, R., Gleason, K., Angel, J., Rippey, B., Tinker, R., Palecki, M., Stooksbury, D., Miskus, D., and Stephens, S.: The Drought Monitor, B. Am. Meteorol. Soc., 83, 1181–1190, https://doi.org/10.1175/1520-0477-83.8.1181, 2002.
Trambauer, P., Werner, M., Winsemius, H. C., Maskey, S., Dutra, E., and Uhlenbrook, S.: Hydrological drought forecasting and skill assessment for the Limpopo River basin, southern Africa, Hydrol. Earth Syst. Sci., 19, 1695–1711, https://doi.org/10.5194/hess-19-1695-2015, 2015.
Verdin, K. L. and Verdin, J. P.: A topological system for delineation and codification of the Earth's river basins, J. Hydrol., 218, 1–12, https://doi.org/10.1016/s0022-1694(99)00011-6, 1999.
Winsemius, H. C., Dutra, E., Engelbrecht, F. A., Archer Van Garderen, E., Wetterhall, F., Pappenberger, F., and Werner, M. G. F.: The potential value of seasonal forecasts in a changing climate in southern Africa, Hydrol. Earth Syst. Sci., 18, 1525–1538, https://doi.org/10.5194/hess-18-1525-2014, 2014.
Wood, A. W., Maurer, E. P., Kumar, A., and Lettenmaier, D. P: Long-range experimental hydrologic forecasting for the eastern United States, J. Geophys. Res., 107, 4429, https://doi.org/10.1029/2001jd000659, 2002.
World Bank: World Development Indicators, available at: https://datacatalog.worldbank.org/dataset/world-development-indicators (last access: 26 April 2020), 2016.
Yang, Z.-L., Niu, G.-Y., Mitchell, K. E., Chen, F., Ek, M. B., Barlage, M., Longuevergne, L., Manning, K., Niyogi, D., Tewari, M., and Xia, Y.: The community Noah land surface model with multiparameterization options (Noah-MP): 2. Evaluation over global river basins, J. Geophys. Res., 116, D12110, https://doi.org/10.1029/2010jd015140, 2011.
Yuan, X., Wood, E. F., Chaney, N. W., Sheffield, J., Kam, J., Liang, M., and Guan, K.: Probabilistic Seasonal Forecasting of African Drought by Dynamical Models, J. Hydrometeorol., 14, 1706–1720, https://doi.org/10.1175/jhm-d-13-054.1, 2013.
Yuan, X., Wang, L., and Wood, E. F.: Anthropogenic Intensification of Southern African Flash Droughts as Exemplified by the 2015/16 Season, B. Am. Meteorol. Soc., 99, S86–S90, https://doi.org/10.1175/bams-d-17-0077.1, 2018.