the Creative Commons Attribution 4.0 License.
the Creative Commons Attribution 4.0 License.
 | 12 Aug 2019
Enhancement of large-scale flood risk assessments using building-material-based vulnerability curves for an object-based approach in urban and rural areas
Johanna Englhardt
Hans de Moel
Charles K. Huyck
Marleen C. de Ruiter
Jeroen C. J. H. Aerts
Philip J. Ward
In this study, we developed an enhanced approach for large-scale flood damage and risk assessments that uses characteristics of buildings and the built environment as object-based information to represent exposure and vulnerability to flooding. Most current large-scale assessments use an aggregated land-use category to represent the exposure, treating all exposed elements the same. For large areas where previously only coarse information existed such as in Africa, more detailed exposure data are becoming available. For our approach, a direct relation between the construction type and building material of the exposed elements is used to develop vulnerability curves. We further present a method to differentiate flood risk in urban and rural areas based on characteristics of the built environment. We applied the model to Ethiopia and found that rural flood risk accounts for about 22 % of simulated damage; rural damage is generally neglected in the typical land-use-based damage models, particularly at this scale. Our approach is particularly interesting for studies in areas where there is a large variation in construction types in the building stock, such as developing countries.
- Article
(1200 KB) - Full-text XML
-
Supplement
(366 KB) - BibTeX
- EndNote


Globally, floods are one of the main natural hazards in terms of socioeconomic impacts, causing billions of dollars of damage each year. For example, between 1980 and 2013, global flood damage exceeded USD 1 trillion and resulted in ca. 220 000 fatalities (Dottori et al., 2016). Reducing disaster risk, such as from flooding, is globally very high on the political agenda. For example, it is an important aspect of both the Sendai Framework for Disaster Risk Reduction (UNISDR, 2015) and the Warsaw International Mechanism for Loss and Damage Associated with Climate Change Impacts (UNFCCC, 2013). To achieve this reduction in risk at the global scale requires methods to quantitatively assess global flood risk (Mechler et al., 2014). Here, flood risk is defined as a function of three components: hazard (e.g. flood extent and depth), exposure (assets and people exposed), and vulnerability (factors that determine the susceptibility of the exposed assets to the hazard) (UNISDR, 2015).
Global flood risk assessments are increasingly used in decision-making and practice and have been useful for identifying flood risk hotspots (e.g. Ward et al., 2015). In an ideal situation, such flood risk assessment models could use detailed, high-resolution data for all locations around the globe (Jonkman, 2013). In practice, data and resources required for such models rarely exist, and therefore global flood risk models have been developed. Current global flood risk models often use resolutions between and 0.5∘ × 0.5∘ to assess the exposed assets (e.g. Alfieri et al., 2013; Arnell and Gosling, 2016; Ward et al., 2013). Recently, much effort has been put into improving global risk models, mainly by improving the hazard component (e.g. Dottori et al., 2016; Ikeuchi et al., 2017; Sampson et al., 2015; Trigg et al., 2016). However, much less attention has been given to improvements in the representation of exposure and vulnerability, despite the fact that their overall contribution to uncertainty is large (de Moel and Aerts, 2010).
In large-scale assessments, i.e. regional to global levels, exposure is generally represented based on aggregated land-use categories, especially in regions where only limited data are available, such as Africa (de Moel et al., 2015). Whilst using such data provides a useful first assessment of large-scale damage and risk (e.g. Feyen et al., 2011; Hall et al., 2005; Ward et al., 2013), more detailed information of the exposed objects could improve these assessments. Vulnerability is mostly represented using stage-damage functions, also known as vulnerability curves, which describe the relationship between the potential damage of the exposed elements for different levels of the hazard (usually water depth). These functions can represent physical vulnerability, which we refer to in this paper, but not social vulnerability (i.e. characteristics that influence a person's or group's capability of dealing with the impact of a natural hazard) or other vulnerability dimensions (e.g. institutional, economic, environmental) (Fuchs, 2009; Papathoma-Köhle et al., 2017). For large-scale studies, a vulnerability curve is generally developed for each of the aggregated land-use categories used to represent exposure (Ward et al., 2013).
Whilst aggregated land-use categories may be a suitable option to represent exposure if data are limited, they cannot reflect the (spatial) heterogeneity within each land-use category (Wünsch et al., 2009). For instance, large-scale flood risk models usually focus on an urban category that aggregates exposed elements of various types (e.g. houses, infrastructure, shops, green areas) into one land-use class (Ward et al., 2015). Since an aggregated land-use category like urban is coupled to one urban vulnerability curve, these curves generalize the relationship between flood depth and damage across all of the diverse exposed element types within that category. Without a more direct relation between these types of exposed elements and the impact of flood waters, large uncertainties exist in the simulated damage (de Moel and Aerts, 2010). More detailed information on the specific land use, its extent, and the vulnerability of the exposed elements could improve large-scale assessments, for example by using high-resolution remote sensing products (Goldblatt et al., 2018; Myint et al., 2011) or information as used in local-scale flood damage studies at an object level (individual buildings, businesses, infrastructure objects, etc.) (de Moel et al., 2015; Merz et al., 2010). In our approach, we therefore utilize information about the composition of an area's building stock and the characteristics of exposed objects, particularly construction types and materials. Applying such object-based information, which is not to be confused with object-based image analysis in remote sensing, is contrasting to the common land-use-based approach in large-scale flood risk assessments.
The literature distinguishes flood vulnerability of buildings according to different structural factors (such as building type, quality, height, and material), as well as occupancy type (such as residential, commercial, and industrial). The latter is a commonly used factor for determining vulnerability (de Ruiter et al., 2017), with much fewer studies relating potential losses to the structural factors. Reasons for this are the paucity of information and the huge effort it takes to obtain information on the damage incurred by individual objects and the structural components (Wahab and Tiong, 2016). Studies or models that do include information on these factors are mostly based on surveys and have therefore only been feasible on smaller scales. FLEMOps (Thieken et al., 2008) is an example of a model that uses survey data on flood damage in Germany and includes factors such as building type and quality. The study by de Villiers et al. (2007) is one of the few assessments (see also World Bank, 2000) within Africa but uses size and content value of houses to determine flood damage and does not go into detail on structural features. Studies that focus on construction type and building material to assess the flood damage show that these characteristics, together with ground floor elevation and number of floors, are important features in determining the vulnerability of different building types to floods (e.g. Godfrey et al., 2015; Neubert et al., 2008; Schwarz and Maiwald, 2008; Zhai et al., 2005). Furthermore, building characteristics are essential components of physical vulnerability and risk assessment in the earthquake domain (de Ruiter et al., 2017), as well as for other flood types such as flash floods in mountain areas and debris flows. For such studies on the local scale, aspects can even include for example features of the building envelope such as layout of openings and wall dimensions, flow direction, sediment load, and surrounding buildings; these elements are sometimes evaluated via laboratory experiments and on-site data collection (e.g. Godfrey et al., 2015; Milanesi et al., 2018; Sturm et al., 2018). There is a gap in applying such indicators in large-scale flood risk assessments, which could be improved by using object-based characteristics to represent exposure and vulnerability, particularly in developing countries with a diverse structural building stock.

Figure 1Flowchart for large-scale flood risk assessment using object-based data with a building-material-based vulnerability approach.
Recently, a building exposure dataset has been developed for several African countries as part of the Building Disaster Resilience programme for the World Bank's Africa Disaster Risk Financing Initiative by ImageCat (ImageCat et al., 2017). ImageCat uses a stratified sampling technique that infers the number of buildings in a region from census data and then uses image processing tools to identify development patterns (Hu et al., 2014). The construction practices are then characterized through a review of the literature, interviews, review of very high resolution (VHR) images, in situ video, and in some cases site visits (Silva et al., 2018). This characterization of development patterns is used for dasymetric mapping of building counts to a 15′′ grid. Estimates are supplemented with total estimates of floor area and replacement values based on construction practices observed in each development pattern (Huyck and Eguchi, 2017). Compared to the methods employed in current large-scale flood risk models, the information about the built environment of an area and its characteristics as provided in such datasets enables a differentiation between the exposed objects in terms of vulnerability to flood waters and exposed value.
Furthermore, a greater level of detail opens up the possibility to address the issue of distinguishing urban and rural flood risk. This is commonly neglected in land-use-based flood risk assessment, due to the focus on higher-value urban damage. Moreover, land-use classification studies have difficulties in assessing urban and rural differences. This is because the resolution in previous land-use and land-cover products was not sufficient to identify smaller settlements, and the characteristics of urban and rural areas are very different and can be difficult to grasp in land-use classification studies (Dijkstra and Poelman, 2014). Internationally there is no agreed way to distinguish urban from rural areas. For example, according to the national census of Ethiopia, localities of 2000 or more inhabitants are considered urban, whereas the urban definition for Niger only includes capitals of departments and districts (UNSD, 2016). Another traditional distinction is that urban areas provide a different way of life and usually a higher living standard (UNSD, 2017). Compared to developed countries, the building stock in rural areas of developing countries is often constructed from more traditional and less expensive building materials, which makes them more vulnerable to flooding. In this regard, urban settlements in the context of this study are defined as geographic units with built-up areas that are more developed and have a higher built-up density than rural settlements.
The aim of this paper is (i) to develop an approach for assessing large-scale river flood risk in urban and rural areas using object-based data from ImageCat to represent exposure and (ii) to develop vulnerability curves for different building classes. The approach draws upon common practices in earthquake risk assessments and relates damage by flood waters more directly to the vulnerability of buildings based on the building materials. We test the suitability of this approach for the case of Ethiopia, comparing our results with those using a more traditional large-scale flood risk modelling approach, examining how the increased detail influences risk estimates. In addition to river floods, Ethiopia has experienced flash flood events in the past, such as in 2006 with several casualties and millions in property damage in Dire Dawa (Billi et al., 2015). However, these kinds of floods are not included in this analysis.
The approach used in this study is composed of the following main four steps and shown in Fig. 1:
-
development of vulnerability classes and curves for different construction types and building materials based on a literature review of previous studies,
-
classification of an object-based exposure dataset using input data from ImageCat,
-
derivation of maximum damage values, and
-
risk assessment by combining the aforementioned vulnerability and exposure with hazard data.
Each of these steps is described in more detail in the following subsections.
2.1 Vulnerability classes and curves
As a first step (Fig. 1), an extensive literature review was conducted to develop flood vulnerability classes and associated curves based on construction types and building materials (Table 1). An increasing number of studies investigate multi-parameter damage models (e.g. Chinh et al., 2016; Wagenaar et al., 2018), but, given the large amount of data required to apply such models, we here only consider studies on river floods that apply stage-damage curves. For the class and curve development, we use studies from different regions that have focused on the vulnerability of individual construction types or building materials and which are preferably based on actual event data. Some additional studies, often more qualitative in nature, were used to further refine the flood vulnerability classifications of the different building materials and construction types (e.g. Kappes et al., 2012; Laudan et al., 2017; Neubert et al., 2008; Zhai et al., 2005). Apart from reviewing the literature, experts with a structural engineering background were consulted to confirm the coherence of the final classification and vulnerability curves.
Table 1Overview of studies used to derive construction type and building-material-based vulnerability classes and curves. The four classes are (I) non-engineered buildings created by compacted mud, adobe blocks, or informal buildings; (II) wooden buildings; (III) unreinforced masonry/concrete buildings; and (IV) reinforced masonry/concrete and steel buildings.
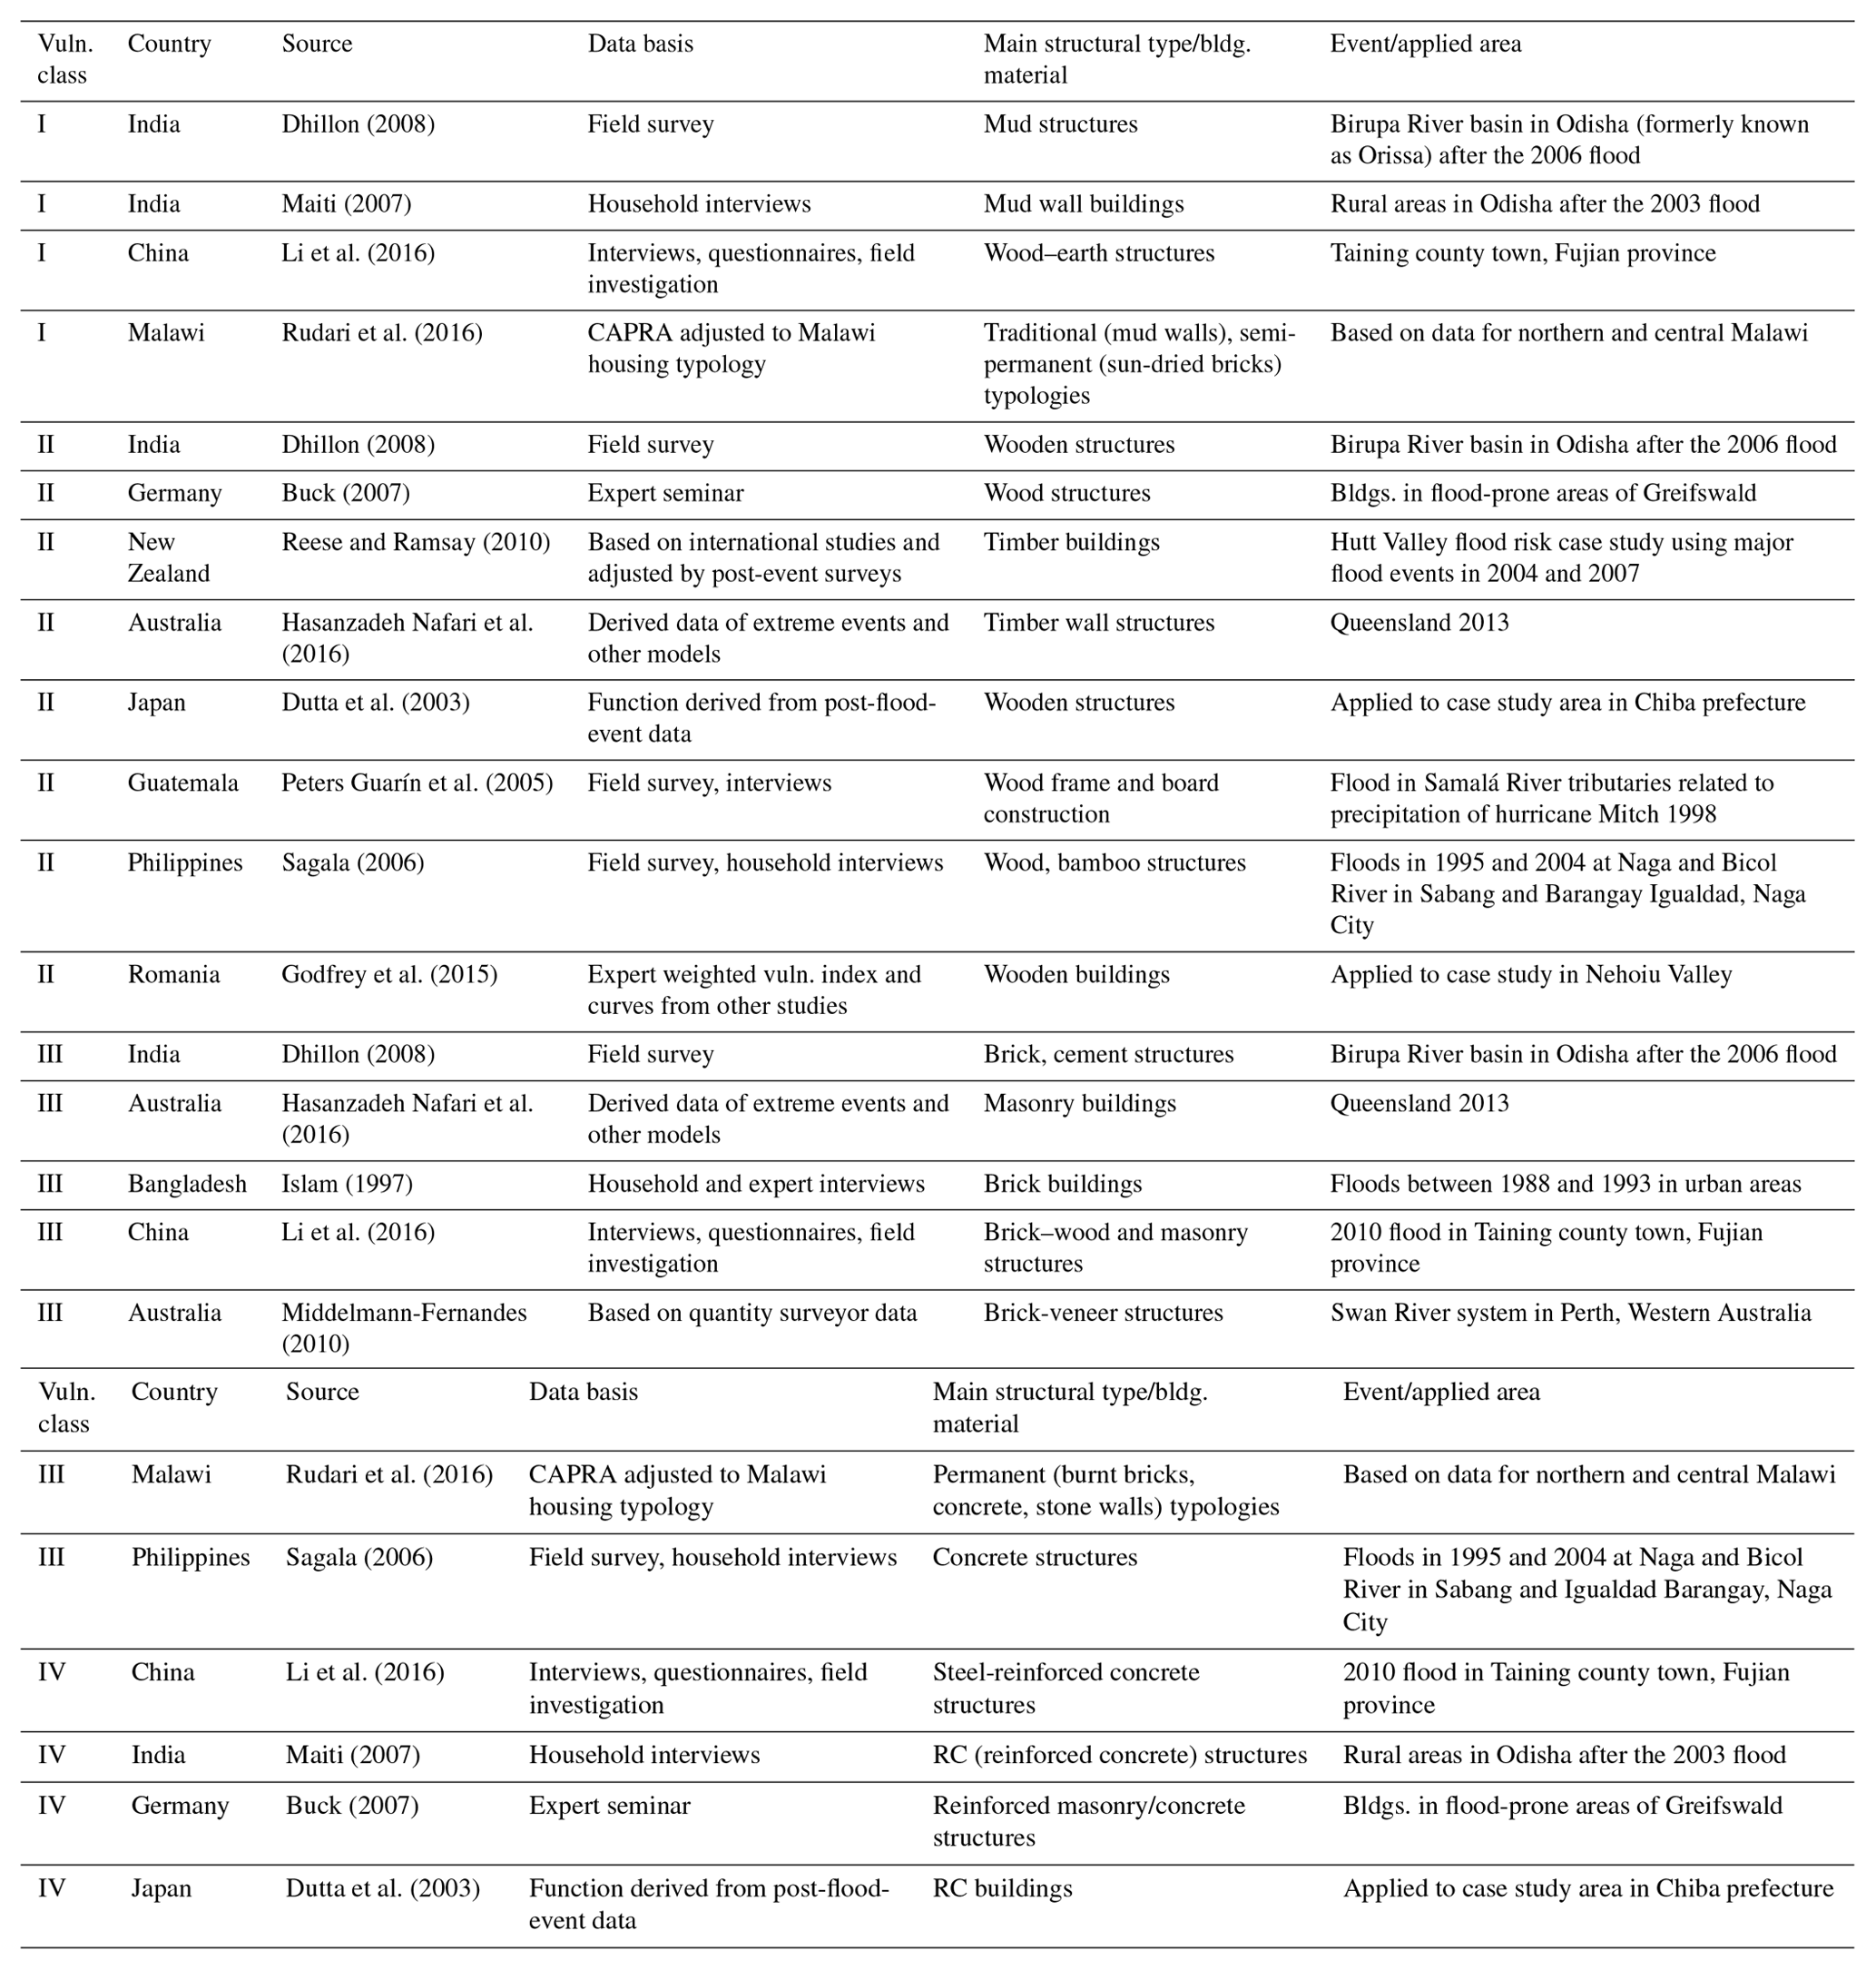
Table 1 summarizes the studies used to derive construction type and building-material-based vulnerability classes and curves. In all of these studies, the construction type or (dominant) building material is clearly specified, and it is either the only indicator or one of the primary indicators for the description of the flood vulnerability. Four vulnerability classes can be identified from this literature, of which each class consists of similar construction types and building materials with comparable behaviour towards flooding. The four classes are (I) non-engineered buildings built with materials such as compacted mud and adobe block or informal buildings; (II) wooden buildings; (III) unreinforced masonry/concrete buildings with walls of burnt bricks or stone or concrete blocks; and (IV) reinforced masonry/concrete and steel buildings.
From the literature described in Table 1, we identified information to develop the stage-damage curve for each of these vulnerability classes. The stage-damage curves in most of the studies are concave, increasing steeply at low water depths (especially for the buildings made with more vulnerable materials), and with a decreasing slope at higher water depths. This overall concave shape was differentiated into curves for each of the four vulnerability classes, shown in Fig. 2, using information on threshold levels (e.g. the water depth at which most damage was incurred) from the studies in Table 1. We distinguish curves that go up to 2.5 m and up to 5 m (for buildings with one and two floors), as flood levels rarely reach higher levels. Housing built through informal channels dominates in Africa (World Bank, 2015), and self-constructed buildings using inexpensive materials and traditional manufacturing techniques are still very common (Alagbe and Opoko, 2013; Collier and Venables, 2015). Buildings of class I and II belong to this group and are assumed to be one floor only, as multiple-storey buildings would require higher quality materials and hiring a professional construction crew. The four vulnerability classes are described below:
-
Class I consists of non-engineered buildings built with materials such as compacted mud, (non-cemented) adobe blocks, and other traditional materials found in the natural environment or informal buildings (often using natural or scrap materials for the walls and roof covers). Buildings in this class can disintegrate and collapse easily when impacted by flood waters and thus are the most vulnerable to flooding. Literature shows that mud walls can collapse when flooded by about a metre of water (Maiti, 2007), and submersion tests illustrate that most adobe bricks completely dissolve when submerged for 24 h (Chen, 2009). Depending on the material mixture and mortar, the stability of these buildings can be increased, for example by adding cement. However, with the high level of the cement prices in Africa (Schmidt et al., 2012) this is rather a consideration for class I buildings in other regions. Buildings of class I are assumed to be one floor only.
-
Class II consists of wooden buildings. Theoretically, these are far less vulnerable to collapsing than class I, when held together by joinery or nailing and straps into a structural frame and have durable wall and roof cover materials, but if wood frames become wet, they often have to be replaced, or finishing needs to be removed for drying (and replaced afterwards). In a study carried out in Germany, Buck (2007) showed that the damage can be ∼35 %–50 % higher for wood frame homes than for masonry/concrete homes. However, the value and quality of the wooden buildings in Ethiopia is much lower and they seem to be predominantly present in rural areas with more informal, less durable building material. Therefore, we decided to let the curve progress up to damage factor 1 (total loss due to destruction or need for demolition) at a flood depth of 2.5 m (i.e. damage can reach full building value, unlike masonry and concrete constructions). Buildings that are based on wood construction types can account for a large proportion of overall building stock in some countries (e.g. USA, Japan, and Ethiopia). The quality of these constructions and the building's value can vary considerably. For large-scale assessments outside of Africa, adjustment towards a greater flood resistance is recommended.
-
Class III consists of unreinforced masonry/concrete buildings with walls of burnt bricks or stone or concrete blocks. These buildings are more vulnerable than those in class IV (reinforced masonry/concrete or steel). This is related to the fact that unreinforced walls are less able to resist the pressure of flood water exerted on walls. However, damage potential is assumed to be less than class II, as bricks, stone, and concrete blocks are more durable and less likely to disintegrate or need replacement after being flooded compared to wood. Nonetheless, as described in Li et al. (2016), brick masonry buildings are less resilient than steel-reinforced structures. Therefore, a curve between class II and class IV was created for both one- and two-storey buildings of this class.
-
Class IV represents engineered reinforced masonry/concrete and steel buildings. These types of buildings are engineered and basically standard in most western countries and large cities in Africa. Overall, they constitute the most resistant class to flooding. Many studies (e.g. Buck, 2007; Li et al., 2016; Maiti, 2007) show that vulnerability curves for these types of buildings do not go up to a damage factor of 1, as some elements do not need replacement after a flood (e.g. the foundation or the structural walls or the frames). This is similar to the values from Dutta et al. (2003) and HAZUS-MH (Scawthorn et al., 2006), who show examples of curves that go up to 0.6–0.7 damage ratio. Therefore, in this study it is chosen to let this curve go up to 0.65. Both reinforced masonry and reinforced concrete and steel are put in the same class.
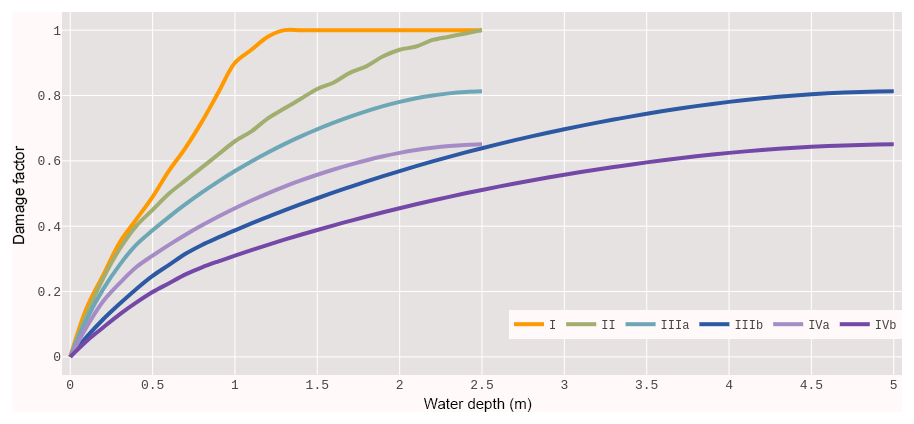
Figure 2Stage-damage curves for four building-material-based vulnerability classes. For class III and IV the one- and two-floor curve are denoted by (a) and (b).
2.2 Object-based exposure data
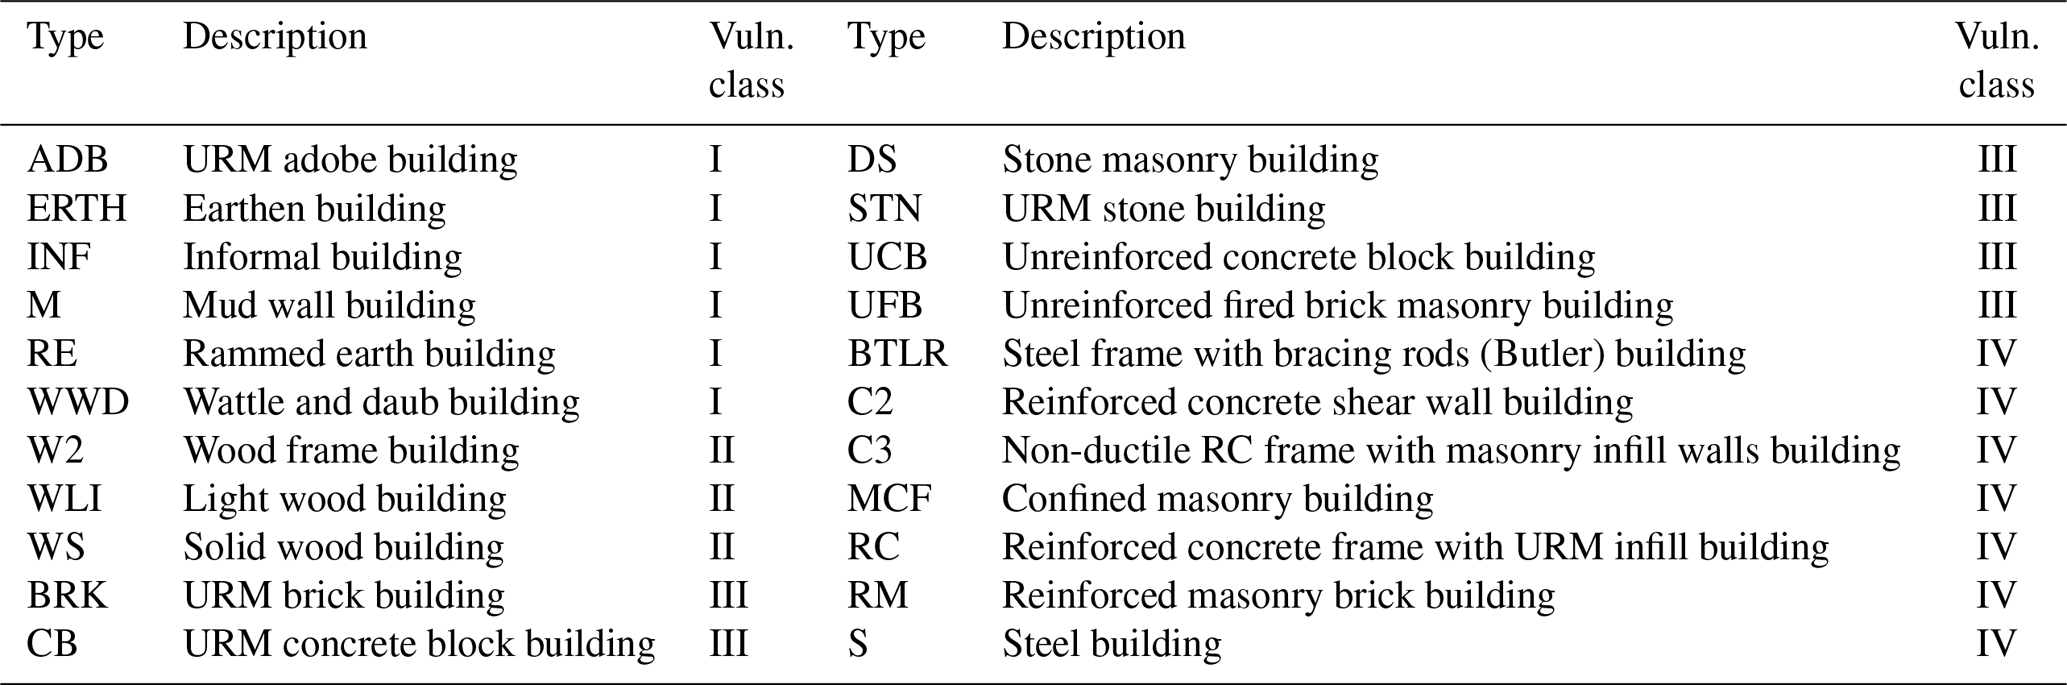
In step 2 (Fig. 1), we reclassify the objects identified in the ImageCat database into the four vulnerability classes and distinguish between urban and rural areas. The exposure data developed by ImageCat are available on a grid for several African countries. Each grid cell contains building counts for different construction types, as well as the total floor area and total building value of the cell's building stock. For the building numbers the Ethiopian census data on housing units were used directly in most regions as the building stock is mostly single-family housing. The living area was gleaned from sampling building footprint data and as with structural characteristics varies by development pattern. For a predominantly commercial pattern, building stock data are adjusted with exposure derived from building footprint data. The number of floors can vary by development pattern, but for the vast number of buildings it is single storey for most of the country. For highly urbanized areas the number of stories was adjusted through expert opinion of several country-based structural engineers (Huyck and Eguchi, 2017). In total, 22 construction types are differentiated in the ImageCat data. Table 2 shows how these can be reclassified into the four vulnerability classes used in our study. Further description of the construction types can be found in Sect. S1 in the Supplement. In the Ethiopian data nine of the types from Table 2 occur.
Table 2Construction types of the ImageCat building exposure data with their respective flood vulnerability class.
Most large-scale flood assessments focus on urban areas due to the availability of data and high potential damage. In countries with large differences between urban and rural living standards, such as developing countries, it can be expected that the share of more vulnerable buildings (i.e. class I and II) is higher in rural areas compared to urban areas (e.g. Fiadzo, 2004). To account for these differences, we classify each cell as urban or rural. If more than 50 % of the ImageCat objects in a cell belong to vulnerability class I or II, the area is assumed to be predominantly rural.
To check the assumption that the share of class I and II buildings in developing countries is higher in rural areas compared to urban areas, we examined these shares in the PAGER dataset (Jaiswal and Wald, 2008; Jaiswal et al., 2010). PAGER is a global residential and non-residential building inventory at the country level (usually but not exclusively expressed in proportions of people living or working in particular building structure typologies in urban and rural areas respectively), which is often used in earthquake research. PAGER provides information at a country level on the construction types that make up the total urban and rural building stock, though the information quality varies between countries. First, we reclassified the PAGER construction types into the four flood vulnerability classes used in our study (see Table S1 in the Supplement). Then, we calculated the percentage of buildings in PAGER's total urban and rural building stocks that are categorized as class I and II (Fig. 3). The building stock differences between urban and rural areas can be found to a changing degree in all groups. While there is a distinct gap suggested for Africa, PAGER has to rely there on very limited information (i.e. only two of the countries differentiate between urban and rural building stock without judging information from neighbouring countries). Nevertheless, the data for urban and rural building stock distribution compared by income level also indicate these differences in the built environment. In low- and lower-middle-income countries, the percentage of buildings in class I and II is indeed much higher in rural areas (36 %) than in urban areas (10 %). These differences are far less pronounced for higher-income countries. The chosen threshold to identify rural areas in the ImageCat dataset (>50 %) is larger than the average share we find in PAGER (Fig. 3). This means that cells identified as rural using the ImageCat data information about the built environment with the chosen threshold are quite likely to indeed be rural.
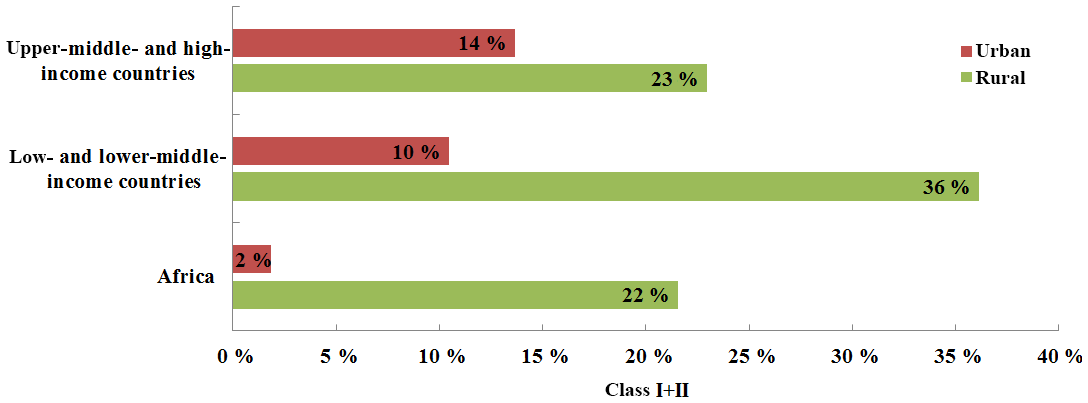
Figure 3Average percentage of urban and rural buildings belonging to vulnerability classes I and II for different income groups and Africa according to PAGER for countries with different urban–rural inventory.
In remote sensing or land-use studies, accuracy assessments determine a process' accomplishment of classifying an image (e.g. satellite data, aerial photos). Such an assessment requires reference values that represent the ground truth of the region of interest. Preferably these values are from ground-collected data or hand-labelled high-resolution imagery validated by multiple interpreters (e.g. Goldblatt et al., 2018; Miyazaki et al., 2011). With these options out of the scope of this study, we examine the similarity between existing land-use products and classified areas in our approach. Compared to a strict accuracy assessment this holds the limitation of comparing already classified products. However, by benchmarking the classified ImageCat data against established and recently published products, we provide an assessment of how well areas are identified in comparison. To this end, we reviewed the quality of the urban–rural ImageCat map by visual comparison with satellite imagery and by overlap with other classification products, visually and by quantifying the agreement between classified areas of the ImageCat data and other products (Sect. 3.1). Two comparisons are made, one for urban and rural areas and one only for urban areas. Similar to an accuracy assessment, we express the performance of this overlap by calculating common comparison metrics from a confusion matrix such as overall accuracy, the kappa coefficient, and producer's and user's accuracy for the sampling cells as described in Fig. S1 in the Supplement. Overall accuracy and the kappa coefficient are metrics indicating the general agreement between the reference and comparison dataset. The latter two refer to the accuracy of individual classes of which the producer's accuracy describes the probability that, for example, an urban pixel is correctly classified and the user's accuracy that a pixel classified as urban is actually urban.
For Ethiopia, the comparison maps are from several global land-use datasets as there are no other maps on a national scale available for the country. For the reference map, the ImageCat data are assigned the reference categories urban, rural, and other land use for cells outside of settlements. From the comparison maps, GHS-SMOD is the only other product that also considers rural settlements, allowing for a comparison of both urban and rural classifications. GHS-SMOD is a relatively new product based on the high-resolution European Joint Research Centre (JRC)'s Global Human Settlement Layer (Pesaresi and Freire, 2016). For GHS-SMOD, built-up areas are combined with population grids to differentiate between three settlement classes: urban centres, urban clusters, and rural (Pesaresi and Freire, 2016). In order to compare to the ImageCat reference, the GHS-SMOD's urban centre and cluster cells were reassigned into a single urban class and rural cells were kept as is.
More products are available that provide a classification limited to urban areas but largely overlook rural areas, such as GRUMP (CIESIN, 2011), MOD500 (Schneider et al., 2009), the Global Urban Footprint (GUF) (Esch et al., 2017), and HBASE (Global Human Built-up And Settlement Extent) (Wang et al., 2017). GRUMP and MOD500 are widely used land-cover/land-use datasets, with GRUMP being a grid of urban extent and MOD500 based on MODIS satellite data with a 500 m × 500 m resolution. GUF represents built-up areas based on satellite imagery with a 12 m × 12 m spatial resolution. HBASE is a 30 m × 30 m Landsat-derived dataset of the extent of built-up area and settlements. All these products are used in the second comparison, in which only the ImageCat settlements classified as urban remain in the reference map and all cells outside of these settlements are reassigned to other land use. From GHS-SMOD, the urban centre and cluster cells are again combined, but rural GHS-SMOD areas are excluded in this assessment.
Both the urban–rural and the sole urban classification comparisons between the ImageCat data and the other products follow a class-defined stratified random sampling scheme, meaning that per class 10 000 sample points were randomly placed over the cells in each reference class. As the original maps do not all share a common geospatial model, they were reprojected to a raster, using the WGS-84 datum. The results of the assessments are discussed in Sect. 3.1.
2.3 Maximum damage values
In step 3 (Fig. 1), we determine the maximum damage of buildings in each vulnerability class. For a coherent set of input values, we use depreciated country-specific structural maximum damage estimates per square metre as provided by the JRC report of Huizinga et al. (2017), in which residential construction costs are estimated per country using a non-linear relationship between construction costs and GDP per capita. This maximum damage value needs to be further differentiated between the four different vulnerability classes used in our study and then multiplied by an estimate of the building footprint area per cell. This is achieved by applying the following formula for each cell:
where Di is total structural maximum damage in a given cell (i); S is structural maximum damage per square metre in Ethiopia; N is the number of buildings belonging to vulnerability class k and cell i; A is the object area, meaning the building footprint for each vulnerability class k and cell i; and F is the maximum damage adjustment factor for vulnerability class k.
The factors A and F are derived as follows.
-
Building footprint area (A). As data on the footprint of different building types are not directly available, we estimated these based on floor area and number of floors derived from the ImageCat data. ImageCat provides estimates of floor areas for each construction type, based on sampling of building footprints, OpenStreetMap data, interviews with local contractors and experts, and literature review (Huyck and Eguchi, 2017). The country data descriptions also provide information on the typical number of floors, based on sampling. For each construction type, we divided the average floor area from the ImageCat data with the number of floors and calculated the footprint area per class (A) as the average from the construction types belonging to each class.
Our assumptions on the number of floors are derived from information in the ImageCat country data descriptions. Since buildings of construction types belonging to vulnerability class I or II rarely exceed one floor, we assumed they have one floor in both urban and rural areas. The construction of class III and IV buildings with more than one floor requires a higher skill level, mainly found in professional construction workers available in urban areas. Considering these characteristics, most class III buildings can be assumed to have one floor in rural areas. However, as most buildings in urban areas have more than one floor, we assumed class III buildings in urban areas have two floors. Class IV buildings are assumed to have multiple floors in all areas. The buildings of class III and IV with multiple floors have a much greater footprint than the one assigned to the other classes. While buildings with smaller footprints are primarily single-family residential structures or within informal settlements, the buildings of the last two classes are mainly found in urban environments, with many of them being long apartment blocks with very large building footprints leading to a larger average footprint. The resulting building footprints for Ethiopia can be seen in Table 3.
-
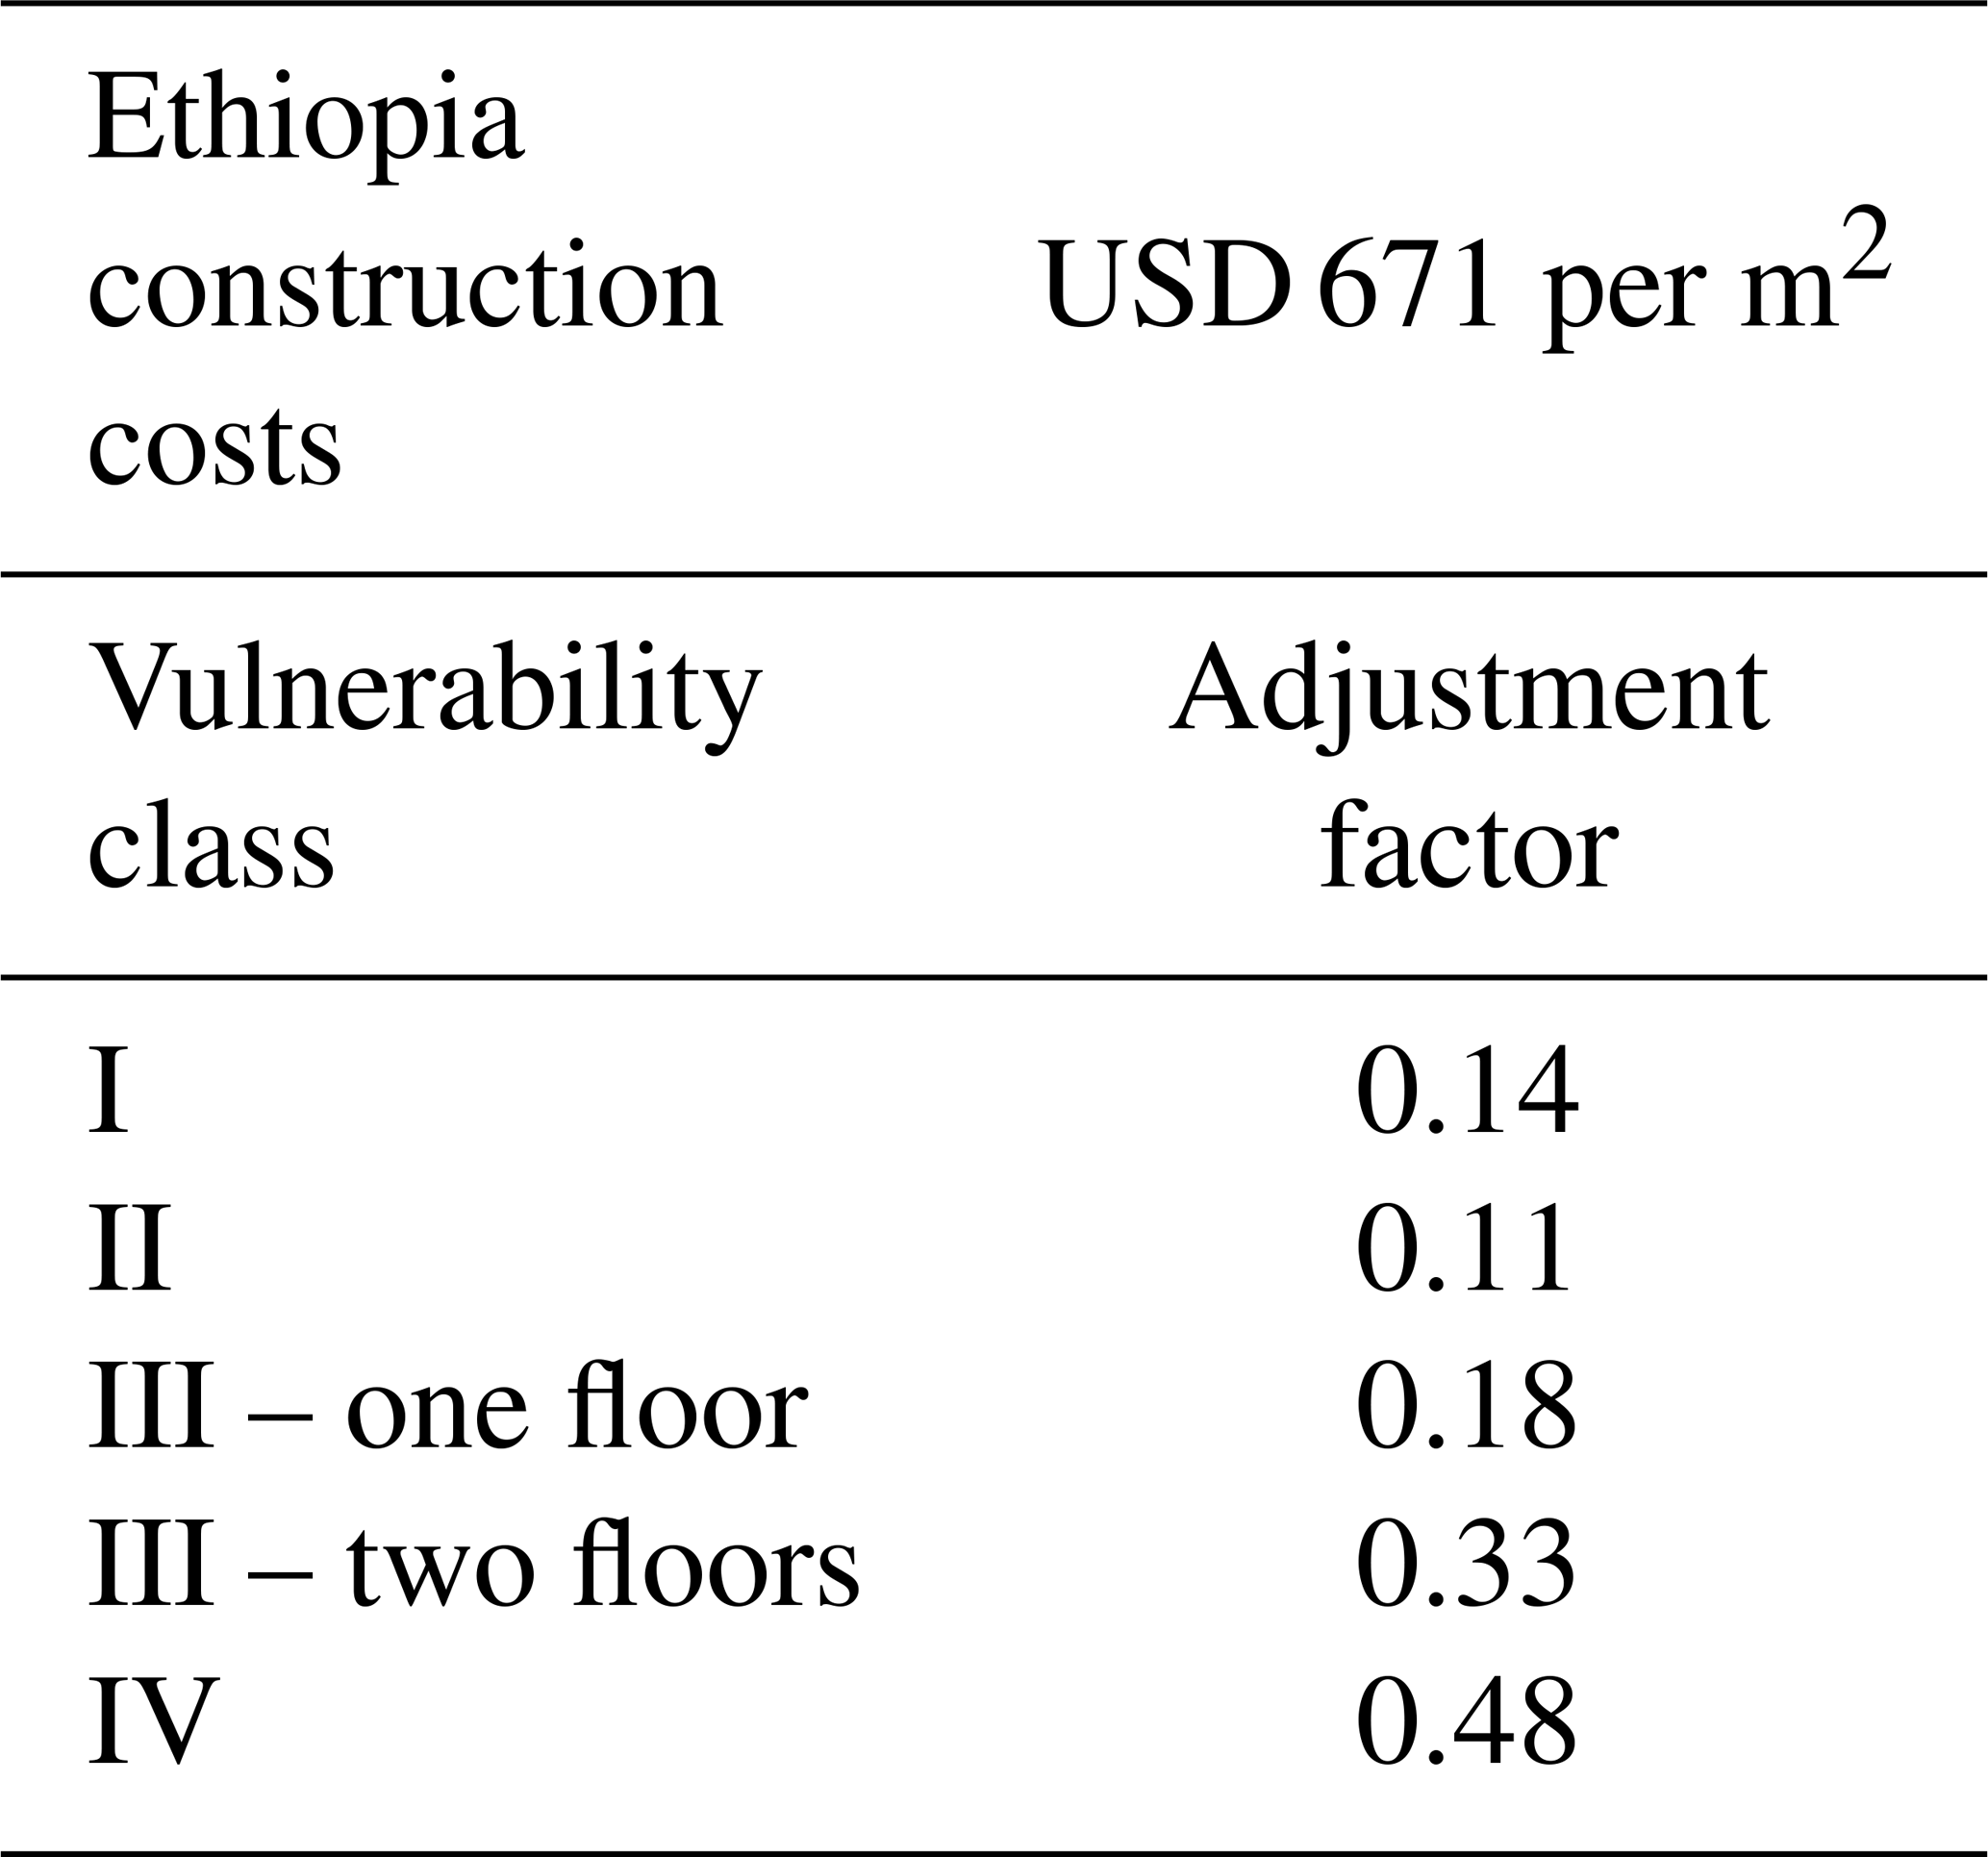
Maximum damage adjustment factor (F). The maximum damage values of Huizinga et al. (2017) are depreciated country-specific structural maximum damage estimates, averaged across various building types. Therefore, we differentiated these into maximum damage values for the four different vulnerability classes used in our study. Huyck and Eguchi (2017) provides estimates of replacement costs for different structures, based on factors such as construction material and whether the structure is owner-built or engineered using professional contractors. We used these to calculate the average replacement costs for each of the four vulnerability classes, for example the average for vulnerability class I in Ethiopia is about USD 95 per square metre. In order to apply comparable maximum damage values based on a coherent dataset, these average costs per vulnerability class are then compared to the country-specific values from Huizinga et al. (2017), resulting in adjustment factors (F) for each vulnerability class (see Table 4) to arrive at maximum damage estimates.
A detailed example of the maximum damage value can be found in Fig. S2. The overall Ethiopian building stock is according to the ImageCat data comprised of over 16.8 million buildings. With the described approach, the total value exposed in urban areas amounts to about USD 250 billion compared to almost USD 30 billion in rural areas. Similarly, there is also a large gap between the living standard in rural and urban areas. The last Ethiopian census in 2007 (CSA, 2010) and the 2016 DHS (Demographic and Health Survey) report (CSA and ICF, 2016) provide some indications for rural and urban households that show huge differences in household durables and quality; for example more than half of the rural household with livestock share at night the room with the animals, or high-quality floors in two-thirds of urban households compared to only 4 % of floors in rural households. The contrasts shown there in housing characteristics such as sanitation, drinking water, and flooring material illustrate that there are large differences in living conditions which indicate similar differences in exposed urban and rural value.
Table 3Building footprints derived for Ethiopia from the ImageCat data.
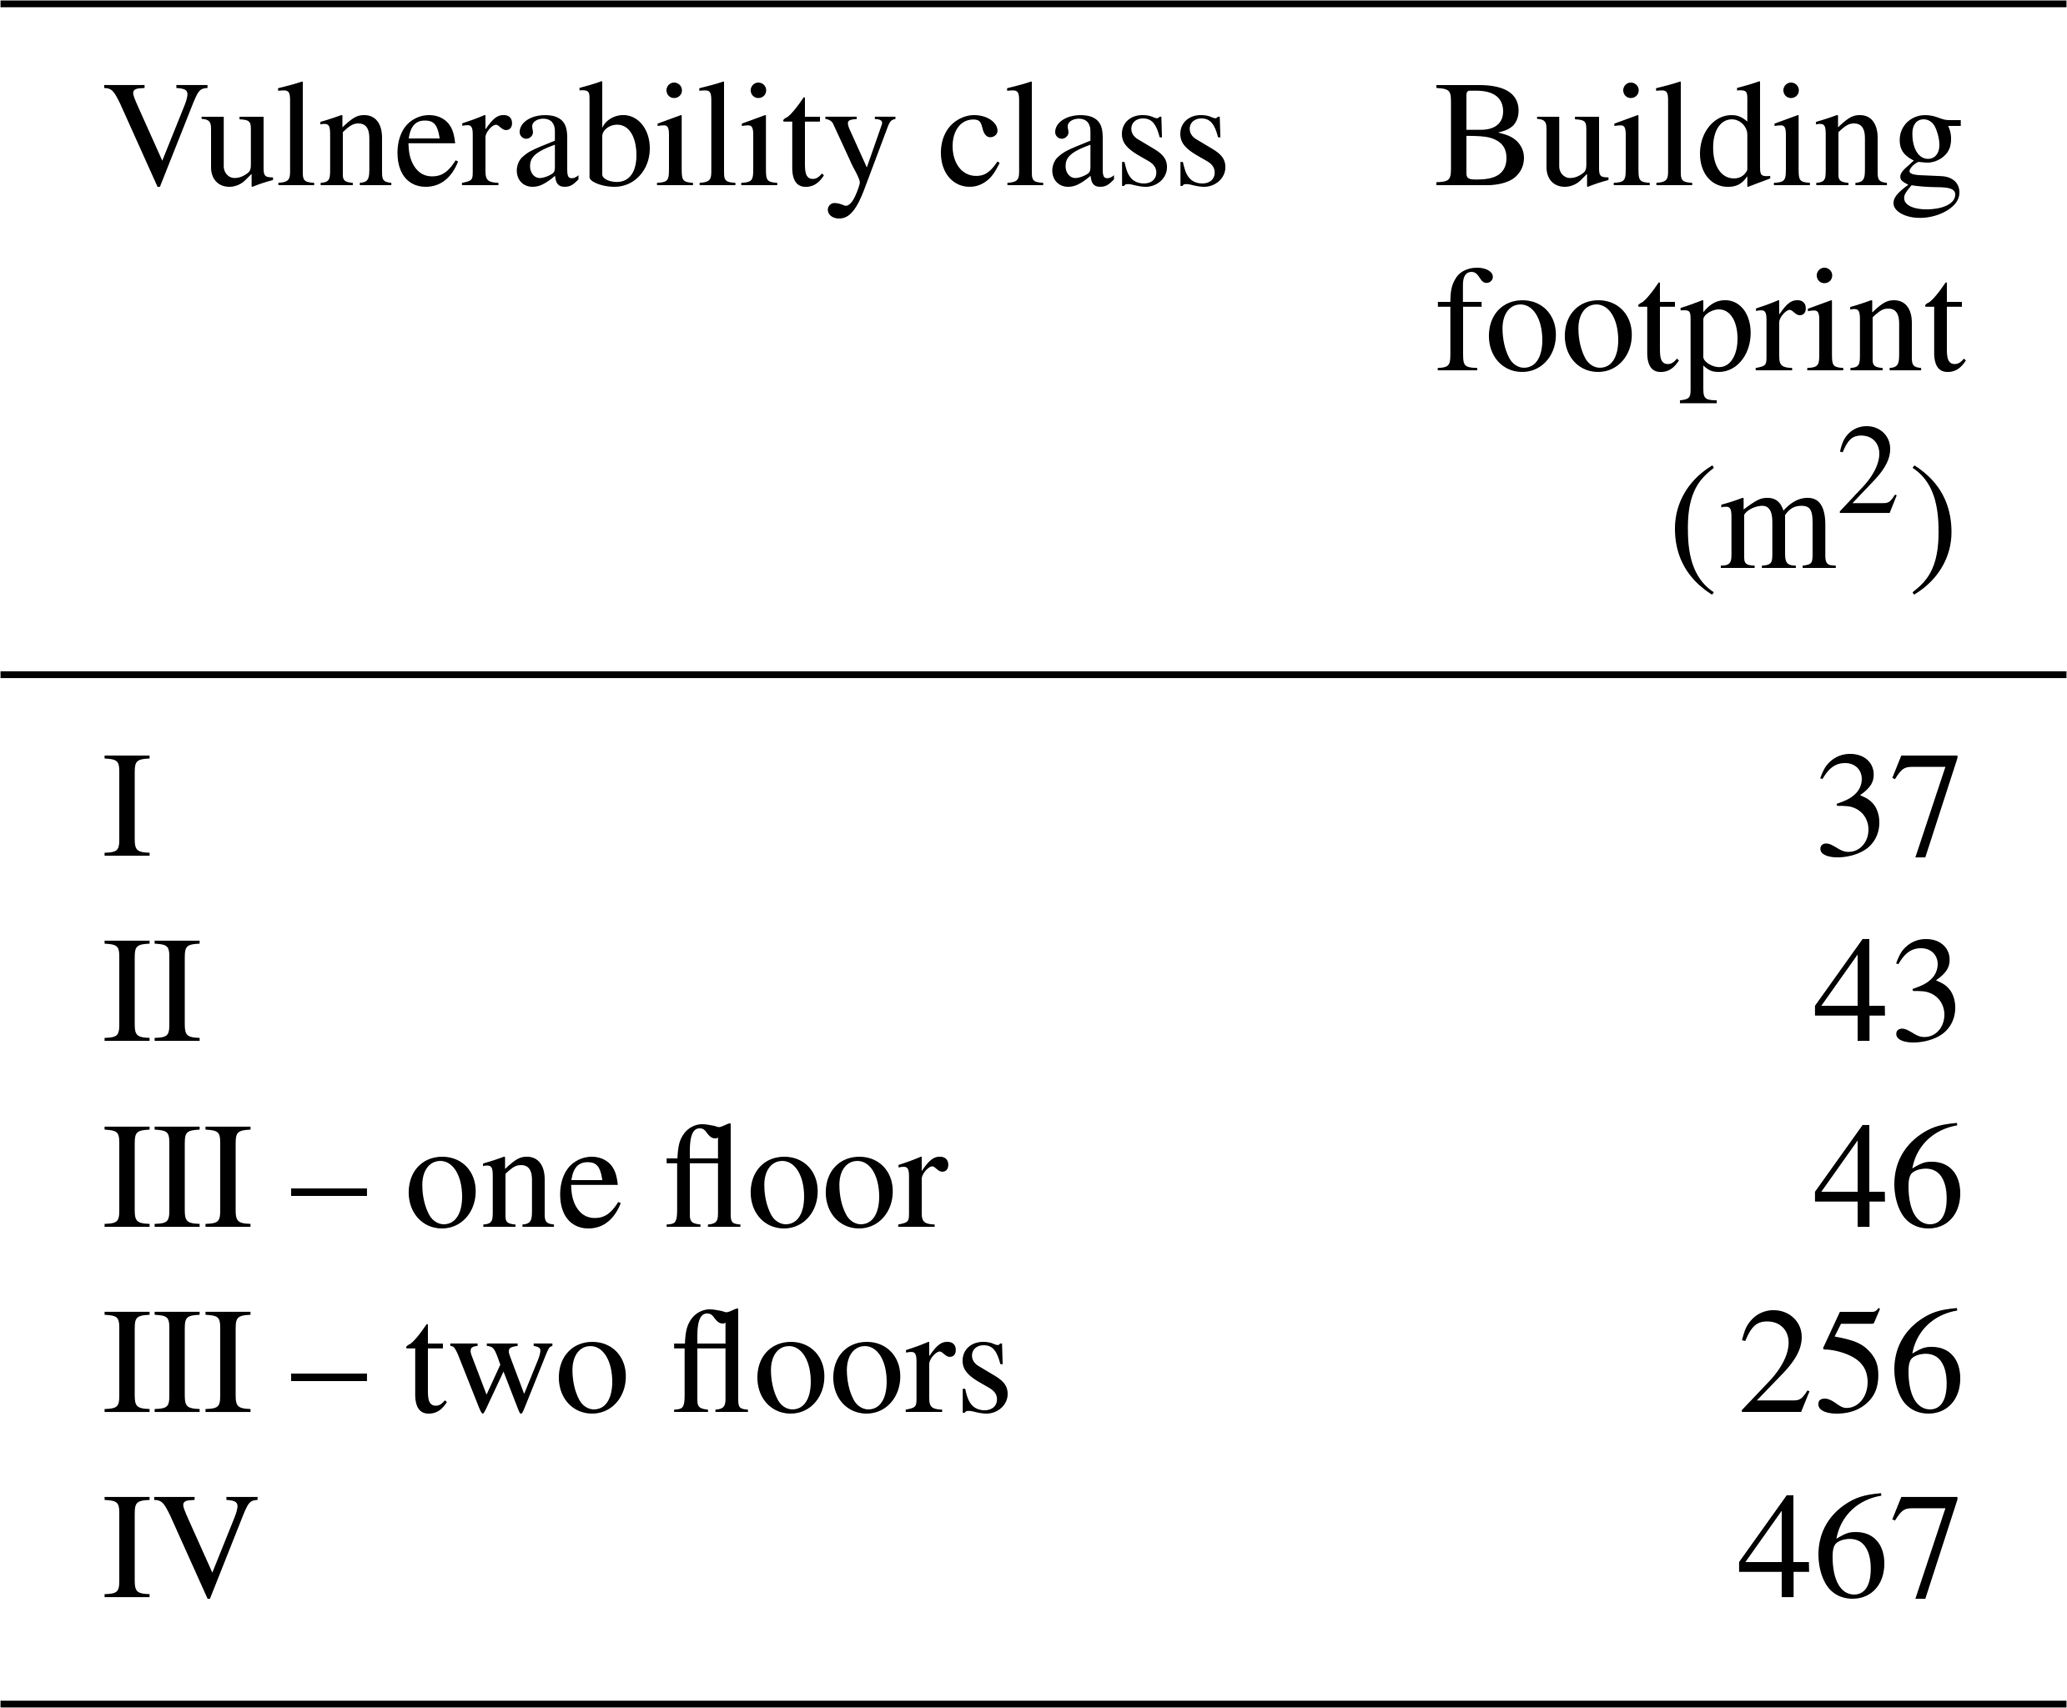
Table 4Construction cost based on Huizinga et al. (2017) and adjustment factors derived from the ImageCat data for Ethiopia.
2.4 Damage and risk assessment
To calculate the damage, we combine the new exposure and vulnerability data described above, with existing hazard maps derived from the GLOFRIS global flood risk model (WRI, 2018). These maps show inundation extent and depth at a horizontal resolution of for different return periods for which per cell a Gumbel distribution was fitted to a time series of annual maximum flood volume extracted from simulated daily flood volumes (Ward et al., 2013). Details of the original model setup of GLOFRIS are described in Ward et al. (2013) and Winsemius et al. (2013). The maps used in this study are those developed for the current time period in Winsemius et al. (2015), which have been further benchmarked against observations and high-resolution local models in Ward et al. (2017). In doing so, we estimate damage for the return periods 2, 5, 10, 25, 50, 100, 250, 500 and 1000 years. The inundation associated with each return period is assumed to occur everywhere simultaneously. Therefore the inundation maps are not presenting single events but country-wide probabilistic maps for the return periods. We expressed flood risk using the commonly used metric of expected annual damage (EAD). This is estimated as the integral of the flood damage curve over all exceedance probabilities (e.g. Ward et al., 2013). A source of uncertainty in flood risk assessment is the level of incorporated flood protection. Here, we use the modelled protection standard for Ethiopia taken from the FLOPROS database, a global database of flood protection standards developed by Scussolini et al. (2016), namely 2 years.
The third chapter is organized as follows: Sect. 3.1 discusses the urban–rural exposure in the comparison between the ImageCat data and other products. In Sect. 3.2, we present the results of the Ethiopian flood risk assessment using our approach and compare them in Sect. 3.3 to the results of a traditional model. In Sect. 3.4, the sensitivity of our flood risk results is discussed for different model parameters.
3.1 Urban–rural identification
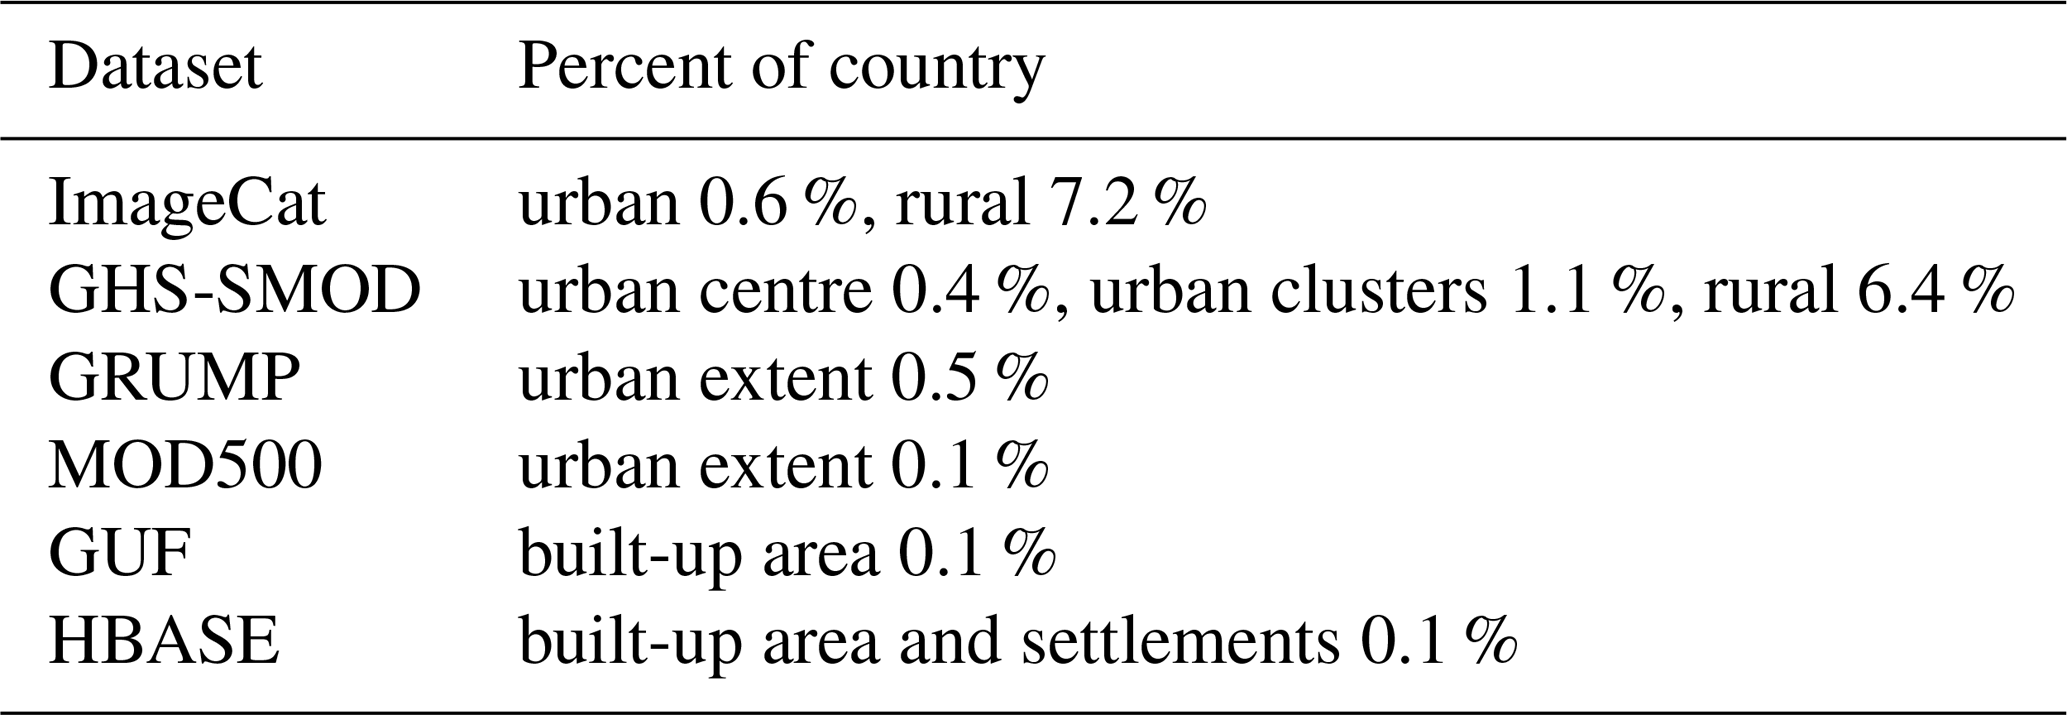
The results of our classification of ImageCat cells for Ethiopia into urban or rural are shown in Table 5, along with summaries of data from other data sources. For rural areas, our result (7.2 %) is similar to that of GHS-SMOD (6.4 %), which is the only other data source among the products that has a specific value for rural areas. The area in Ethiopia categorized as urban or built-up is relatively low in all data sources and is in accordance with Ethiopia being one of the least urbanized countries in Sub-Saharan Africa, with the share of urban population being according to Schmidt and Kedir (2009) only between 11 % and 16 %, or according to more recent data from the World Bank (2016) at about 20 %.
Table 5Cell areal extent of different land-use categories in Ethiopia as a percentage of the country area according to different products (original dataset projections).
3.1.1 Visual comparison
Our urban–rural classification is shown spatially in the example of Fig. 4, in which we compare different land-use products for an area near the city of Awasa. The urban and rural areas identified in GHS-SMOD and our classified ImageCat data show a more detailed and differentiated representation of the settlements than the coarse-resolution GRUMP and MOD500 products. All products overlap in the location of main urban areas, although their extent varies. Locations of built-up areas with medium extent, for example in GUF, are hardly or not detected in HBASE, MOD500, and GRUMP, but they are also seen with GHS-SMOD and our ImageCat classification.
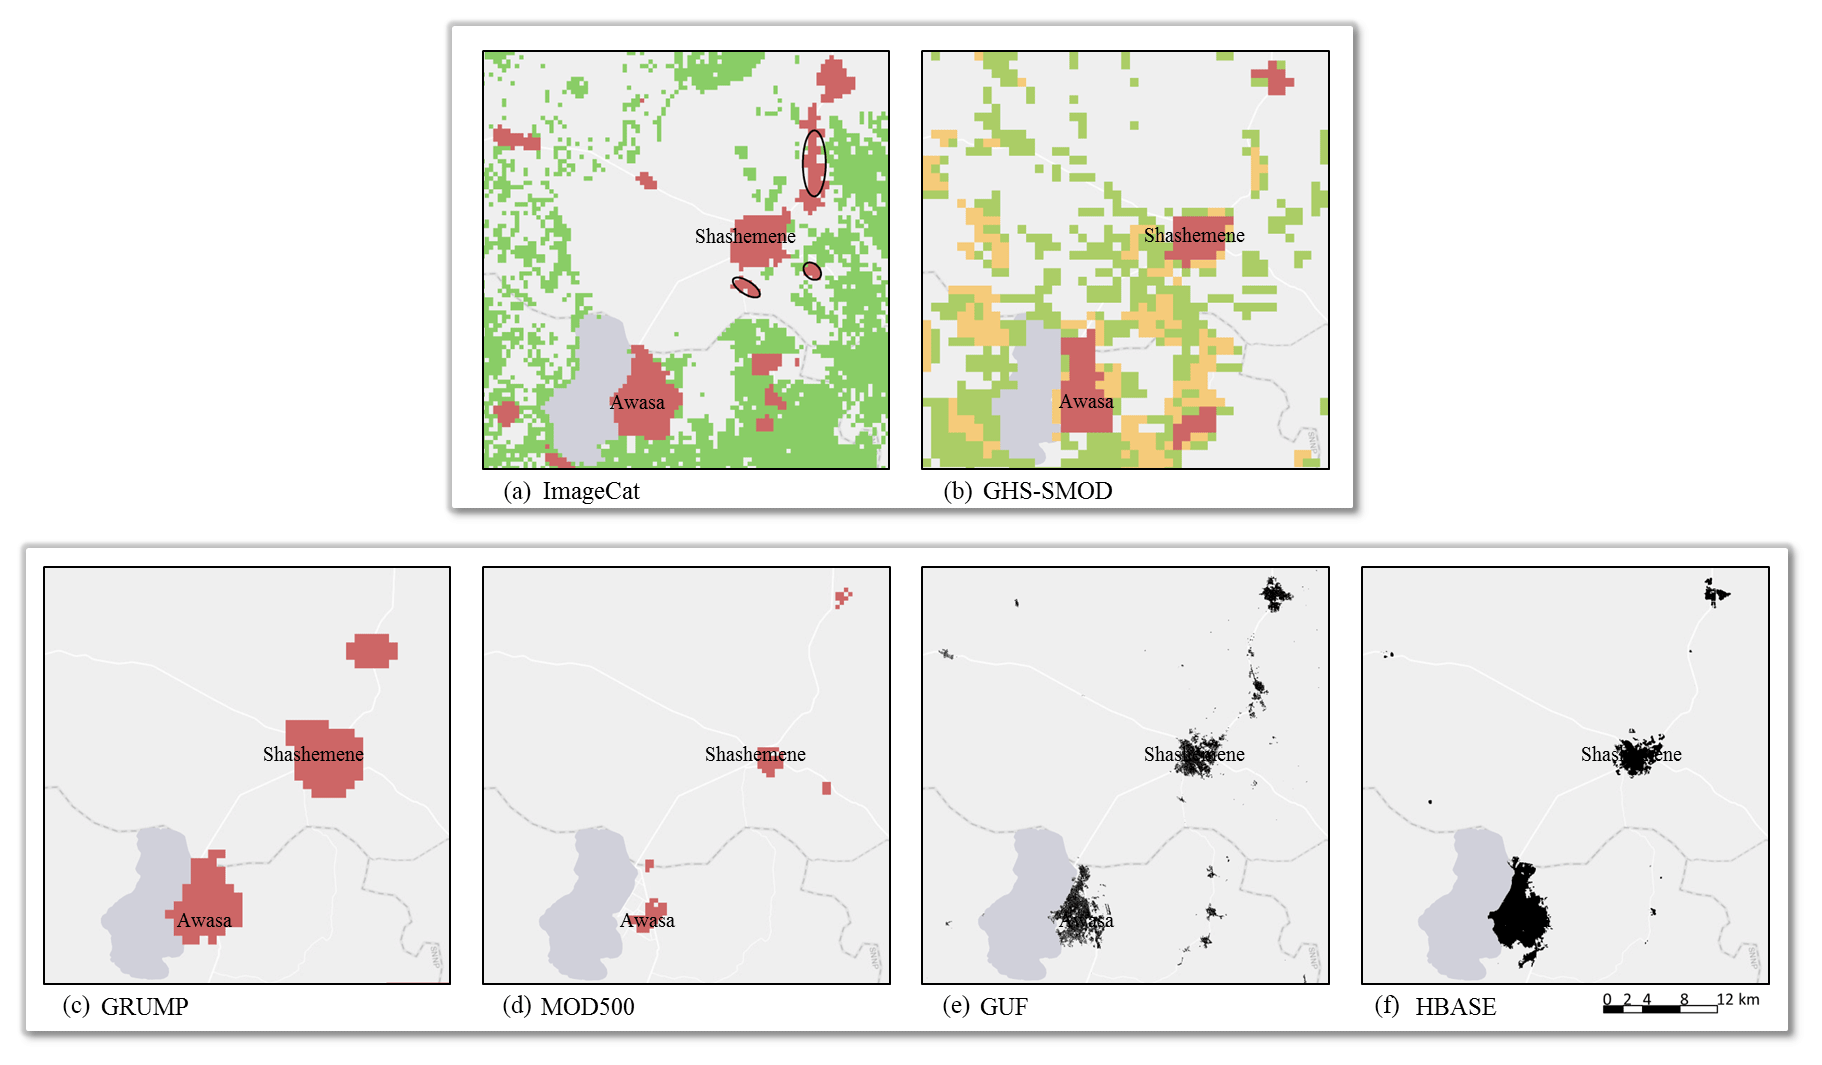
Figure 4Illustration of urban–rural land use in the greater Awasa area in Ethiopia: (a) urban (red) and rural (green) classified ImageCat data; (b) GHS-SMOD urban centre (red), urban cluster (yellow), and rural (green); (c) GRUMP urban extent (red); (d) MOD500 urban extent (red); (e) GUF built-up area (black); (f) HBASE built-up area and settlements (black); original dataset projections. Source background map: Esri, HERE, DeLorme, MapmyIndia, © OpenStreetMap contributors, and the GIS User Community. © OpenStreetMap contributors 2019. Distributed under a Creative Commons BY-SA License.
Using our classification method, some smaller settlements are labelled urban with the ImageCat data, because their building stocks have high shares of class III and IV buildings, whilst GHS-SMOD classifies them as urban clusters or rural. Examples are the areas around Shashemene (see circled examples in Fig. 4a). By visual inspection of Google Earth, these seem to be areas of urban–rural transition. They have a more densely built environment than rural areas and a higher number of class III and IV buildings, which leads to the urban classification in our method. Areas where cells from the ImageCat data get classified as rural are also rural in GHS-SMOD or to some extent urban clusters due to a higher population density in the surrounding cells. However, the overlap of these settlements is more about the general area and less regarding a cell-by-cell comparison. In addition, visual inspection showed that the small, more widespread settlements such as east of Awasa and Shashemene are correctly detected in the ImageCat data (rural areas in Fig. 4a) but are not displayed in GHS-SMOD (Fig. 4b). As a consequence of these issues, it is expected that the classified ImageCat data and GHS-SMOD overlap is lower for rural than urban settlements.
3.1.2 Map agreement analyses
Map agreement has been assessed for urban–other classes and urban–rural–other classes using confusion matrices (see Tables S2 and S3). When comparing the urban areas (Table S4), we see that urban and built-up-area cells in the GRUMP, MOD500, GUF, and HBASE almost always correspond with urban cells in the ImageCat map (urban user's accuracy ∼99 %–100 %). This confirms the observations from the visual comparison (Fig. 4) where we see that the general location of the main urban areas are similar between the datasets. However, with the ImageCat data more medium-sized urban areas are detected, which are often not in the other datasets, resulting in the low producer's accuracy (∼6 %–26 %), again confirming the visual comparison of the Awasa region.
Table 6Results of map agreement for Ethiopia using the ImageCat data classified as urban, rural, and other land use as the reference map.
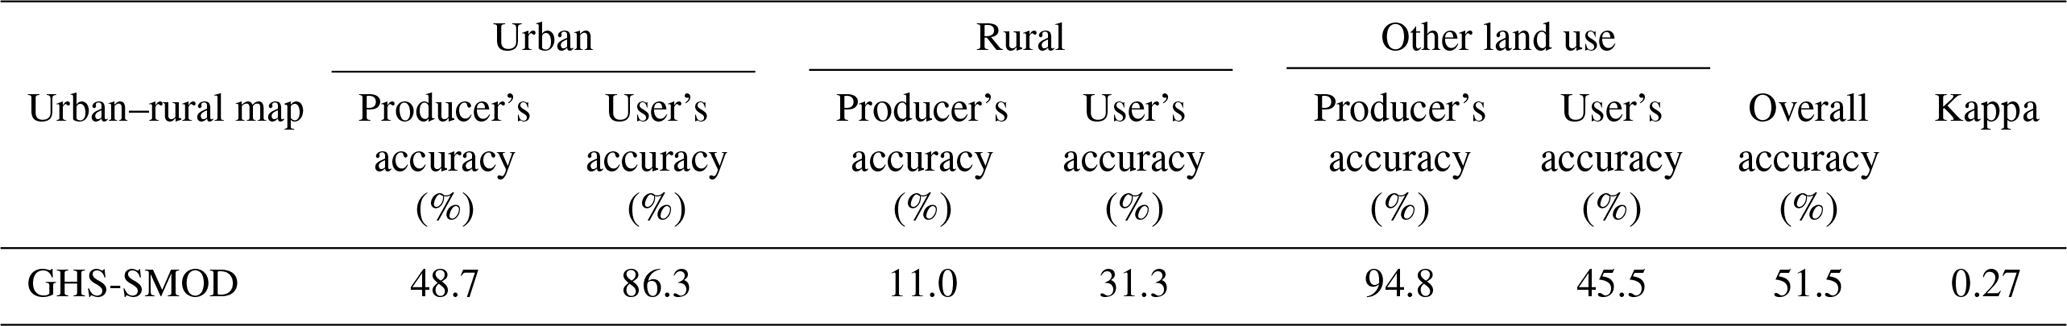
When including rural settlements in the assessment, only GHS-SMOD and the ImageCat classification can be compared (Table 6), as they are the only datasets which distinguish rural areas. This comparison is complicated by the fact that GHS-SMOD has three categories (urban centres, urban clusters, and rural). Visual comparison with satellite imagery reveals that the middle class of urban clusters are sometimes an extension of urban centres, but this can also refer to higher-density settlements areas in rural areas. Nevertheless, for the map agreement analysis of urban–rural–other classes, we grouped these urban clusters with the urban centres to form the urban class. We find that urban cells in the GHS-SMOD have a high probability to also be urban areas in the ImageCat map (urban user's accuracy of 86.3 %). However, urban cells from the ImageCat data have a much lower probability to be urban in GHS-SMOD (urban producer's accuracy of 48.7 %). This implies that there are various urban settlements in the ImageCat map, which are not present in the urban group (centres and clusters) of the GHS-SMOD.
The agreement of rural cells is not as good compared to the urban cells, with considerably lower user's and producer's accuracies (31.3 % and 11.0 % respectively). Classifications of the built-up land from remote-sensing-based products inherently have lower accuracy levels in less developed regions and rural settings. Even high-resolution products still omit large shares of built-up areas and have to improve their performance in arid regions of Africa and areas where settlements are more scattered (Klotz et al., 2016; Leyk et al., 2018). We can also observe this in the visual comparison (Fig. 4) where the high-resolution GUF and HBASE datasets omit many of the scattered settlements that are found in the ImageCat data or GHS-SMOD. Because of these difficulties in detecting such scattered settlements, the agreement between rural areas from the ImageCat classification and in GHS-SMOD is adversely affected as one dataset might indicate rural areas that are not identified in the other.
Comparability of classified maps remains an issue. For example, it has been illustrated in the literature that the total urban land in global maps varies by an order of magnitude between early global earth observation products and GRUMP. Likewise, there is about a factor of 5 difference between MOD500 and GRUMP (Potere et al., 2009), and the global built-up area in the high-resolution GUF product is 35 % less than in GHS built-up areas (Esch et al., 2017). ImageCat data are more specific to the African context as the other maps are based on global classification algorithms.
The construction-type-based ImageCat classification is a distinctly different approach as compared to most classifications, which use population and/or built-up densities. This can also cause some mismatches, for instance in informal settlements in or around cities which are classified as urban when looking at densities but would be classified as rural when looking at construction types. Our analysis showed, however, that the classification from ImageCat data is overall reasonably similar to existing datasets, and it includes unlike other land-use products rural settlements and, as such, a good alternative for flood risk assessments as it provides the option for more detailed building-material-based vulnerability curves in the analysis.
3.2 Flood risk assessment
Modelled flood damage for the different return periods and risk for urban and rural areas are shown in Fig. 5. To calculate the overall risk in the country, these simulation are based on probabilistic maps for which inundation associated with 2, 5, 10, 25, 50, 100, 250, 500, or 1000-year return period respectively occurs simultaneously in all flood-affected cells. For 2-year return periods the damage is always zero as it is assumed that these floods would not cause overbank flooding. As can be expected, the damage in urban areas is higher, as it is a more densely concentrated built-up environment and the value of the buildings is higher. On the other hand, the majority of exposed buildings are in rural areas. To illustrate, about 88 000 buildings in urban areas of Ethiopia are exposed to a flood of a 100-year return period, compared to more than 4 times as many rural buildings. Furthermore, we can see that a large amount of damage already occurs for higher-probability flooding; for example for the 25-year return period country-wide flooding, rural damage already amounts to over USD 200 million, and the damage amounts to over USD 700 million in urban areas.
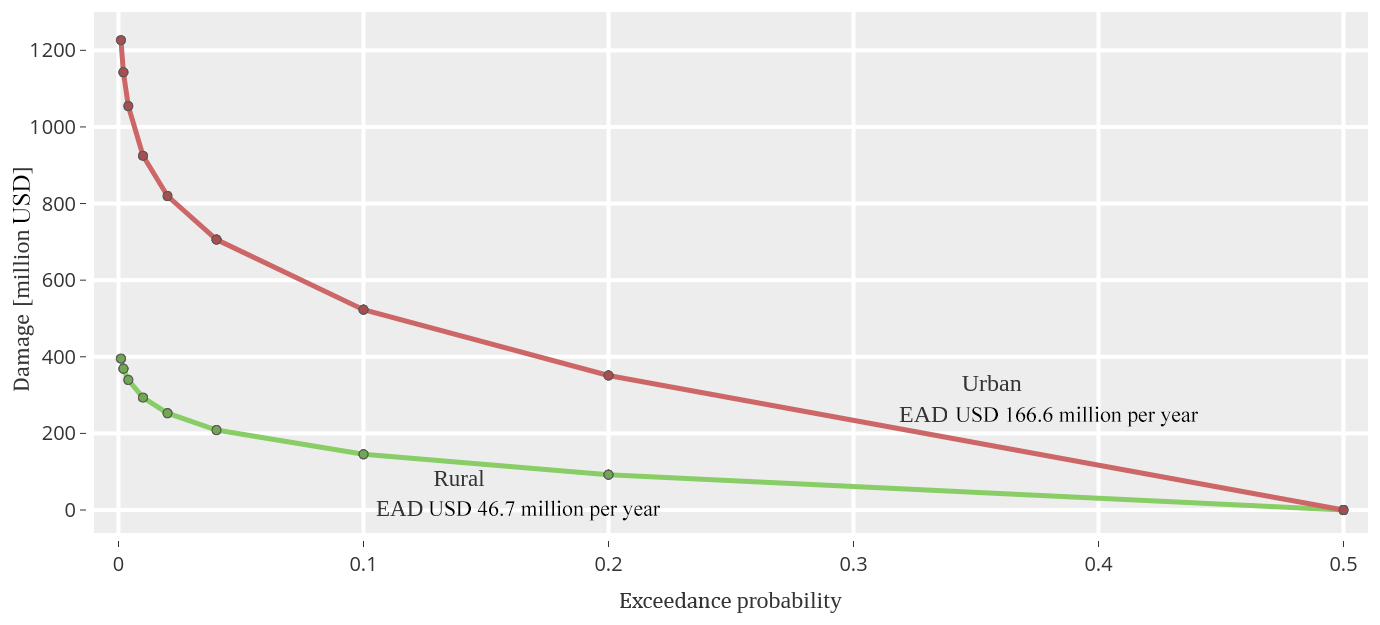
Figure 5Risk curve for simulated flood damage to building structures in urban and rural areas of Ethiopia for return periods from 2 to 1000 years. USD amounts are given in 2016 values.
Table 7 shows the EAD for the different vulnerability classes in urban and rural areas. These results show that most of the damage in rural areas results from damage to buildings of class I, which are buildings with the highest vulnerability. In urban areas, the largest share of the damage results from damage to buildings of class IV; these are the buildings with the highest exposed values. In addition, this class also makes up a large share of the exposed urban buildings, about 57 000 for a flood of a 100-year return period, which is more than twice as many buildings of class III. In total more than 464 000 buildings are simulated to be affected for flooding with this return period, but most are in rural areas with the majority belonging to class I (58.3 %) (class II 14.6 %, class III 8.1 %).
Table 7Expected annual damage (in million USD in 2016 values) to building structures by vulnerability class in urban and rural areas of Ethiopia.
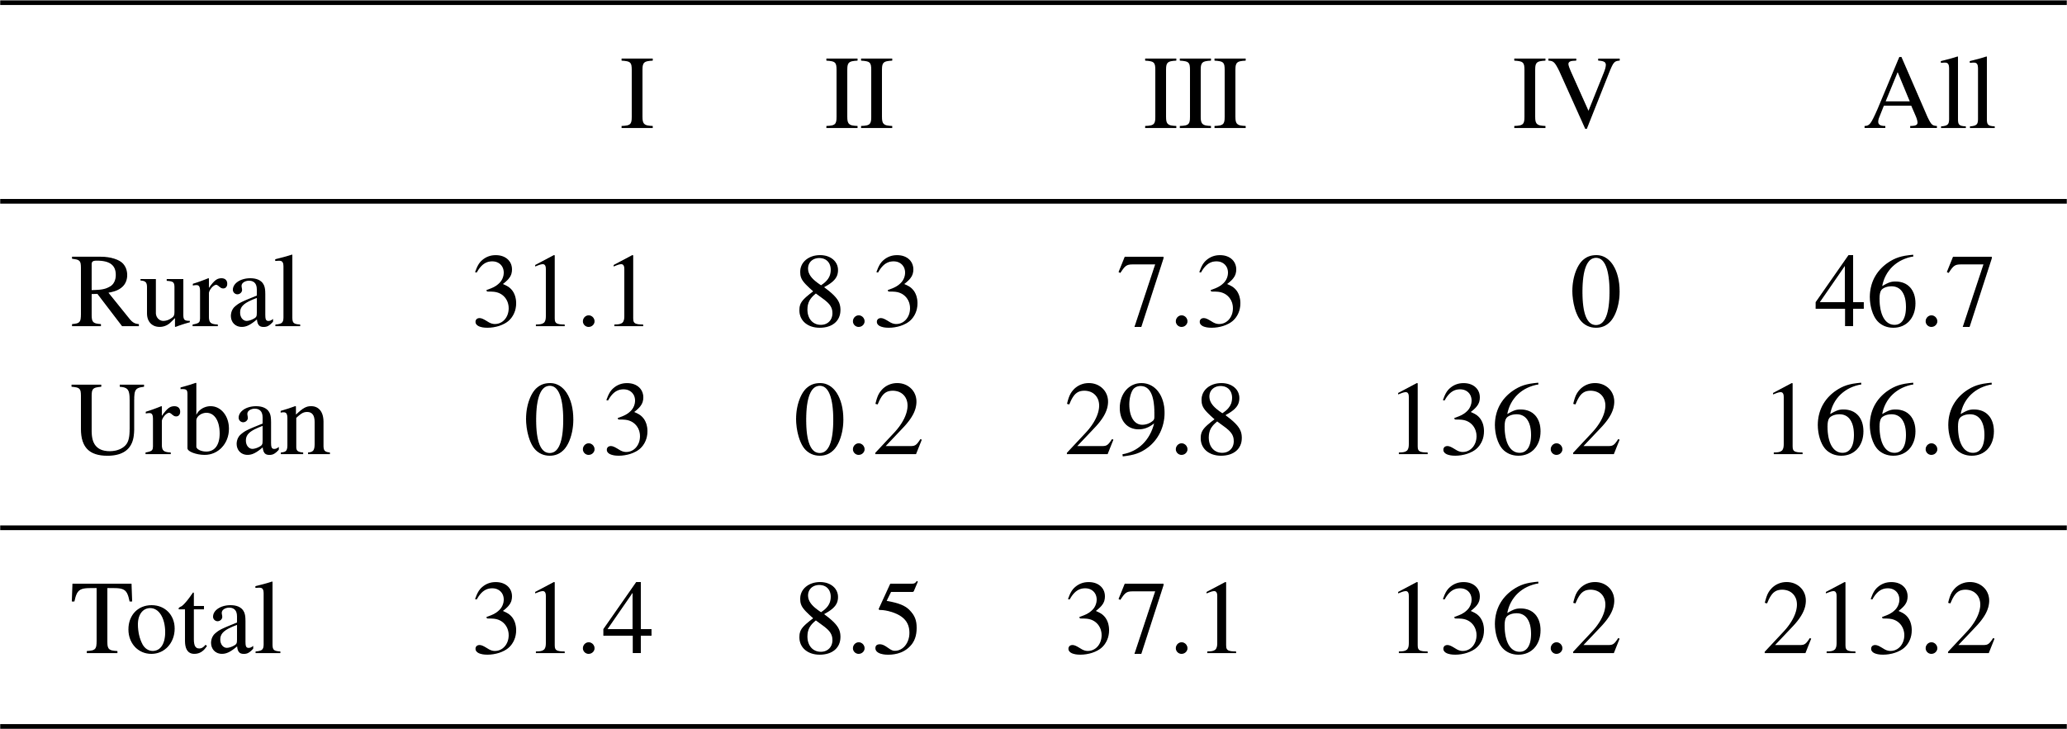
The overall flood risk in Ethiopia (i.e. expected annual damage, EAD) is about USD 213.2 million per year; 78 % of the total EAD is in urban areas. Whilst the rural EAD is below the EAD in urban areas, it is still high in absolute terms (USD 46.7 million per year). This demonstrates that neglecting damage to rural buildings in large-scale assessments may lead to a severe underestimation of total damage values. Furthermore, the flood damage in urban and rural areas has to be considered in the context of the coping capacity of the population in the respective areas. The flood vulnerability of people below the poverty line is higher, as a larger proportion of their wealth could be affected during a flood event (Winsemius et al., 2018). While this is also true for the urban poor, the livelihoods of rural people are more susceptible where services and infrastructure are limited (Komi et al., 2016).
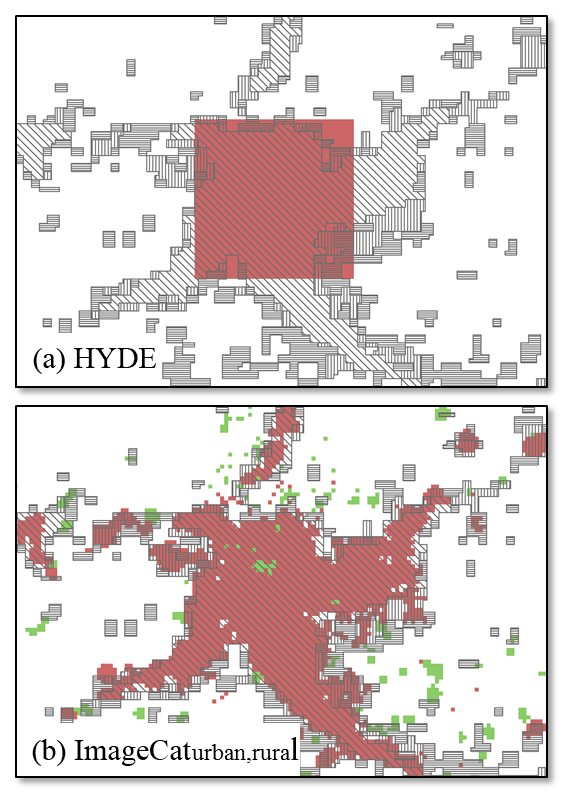
Figure 6Addis Ababa mapped by (a) HYDE as used in GLOFRIS with above 0 % urban built-up cell (red); (b) classified ImageCat data: urban (red) and rural (green); GHS-SMOD rural (horizontal), urban cluster (vertical), and urban centre (diagonal) as background boundary reference.
3.3 Comparison with Aqueduct
Compared to a traditional land-use-based model, the total simulated damage in our approach is somewhat higher but similar in magnitude. For example, the new version of the GLOFRIS model used for the Aqueduct Global Flood Analyzer tool (WRI, 2018) applies the same inundation data as used in this study but follows the common approach of using land-use-based exposure and vulnerability data, resulting in EAD for Ethiopia of USD 182 million per year. The results from our approach contain much more detail on the exposed elements and their vulnerability and allow us to examine damage in urban and rural areas. Damage in urban and rural areas cannot be distinguished in GLOFRIS as it uses HYDE data (Klein Goldewijk et al., 2011) to represent exposure, which represents the urban built-up fraction per grid cell. Moreover, Fig. 6 compares the land-use exposure map using classified ImageCat data and HYDE for the example of Addis Ababa. As for the rest of the country, it demonstrates that datasets like the ImageCat exposure data can provide more spatial detail than the commonly used exposure maps such as HYDE used in land-use-based flood risk models. Settlement extent and outlines are more distinctive, resulting in an overall better representation of affected settlement areas in the risk assessment of our approach.
Further risk comparison as well as flood protection influence can be found in Sect. S2.
3.4 Sensitivity analysis
Given the uncertainty in the input datasets and methods used in our approach, we perform a one-at-a-time sensitivity analysis to assess how the simulated EAD is affected by our assumptions on the (a) structural maximum damage values, (b) threshold used in the urban/rural classification, (c) object area, and (d) stage-damage curves.
To assess the sensitivity of the results to the assumed values for maximum damage, we used the 90 % confidence interval of estimated construction costs for residential buildings reported by Huizinga et al. (2017). These state that construction costs can be between 28 % lower and 53 % higher than the estimates used in this paper. For sensitivity to the threshold used in the urban/rural classification, we used thresholds of 20 % and 80 % for classifying urban areas, instead of the 50 % used in the earlier analysis. Object areas can be very diverse between and within countries and depend on the characteristics of the housing market. For example, the Centre for Affordable Housing Finance in Africa's yearbooks include some indication on the average house size and price per country. However, the sample sizes used for example are very small, and the average value covers only the minimum size that formal developers in urban areas are prepared to build, therefore neglecting self-built houses. Furthermore, no differentiation between building types or constructions is given (CAHF, 2017). For the sensitivity analysis, instead of calculating the footprint areas from average floor areas across the construction types per vulnerability class, we used the most frequent floor area size per type in the ImageCat data. The building footprint sizes most affected by this are those for classes II and III (see Table S5), as the size decreased by 5 to 11 m2. The stage-damage curves in this study show a wide range of vulnerability (see Fig. 2). Nonetheless, this as well as a comparable shape can also be found in the identified residential curves for different continents by Huizinga et al. (2017) as for example their damage degrees at 1 m range between 38 % to 71 %. While our vulnerability functions show high degrees of damage particularly for class I and II (mud/adobe and wooden buildings), other functions that consider building structure such as in the CAPRA project (CAPRA, 2012; Wright, 2016) display similar behaviour for these types of buildings. The sensitivity regarding the vulnerability curves is analysed by applying like most traditional flood risk models only one vulnerability curve, thus neglecting the differentiation our model makes toward material-based vulnerability. To this end, we selected the residential stage-damage curve used in GLOFRIS, for which the degree of damage progresses slightly below the class III one-floor curve.
Table 8Expected annual damage (in million USD in 2016 values) compared for the normal model setup and the modified parameters used in the sensitivity analysis.
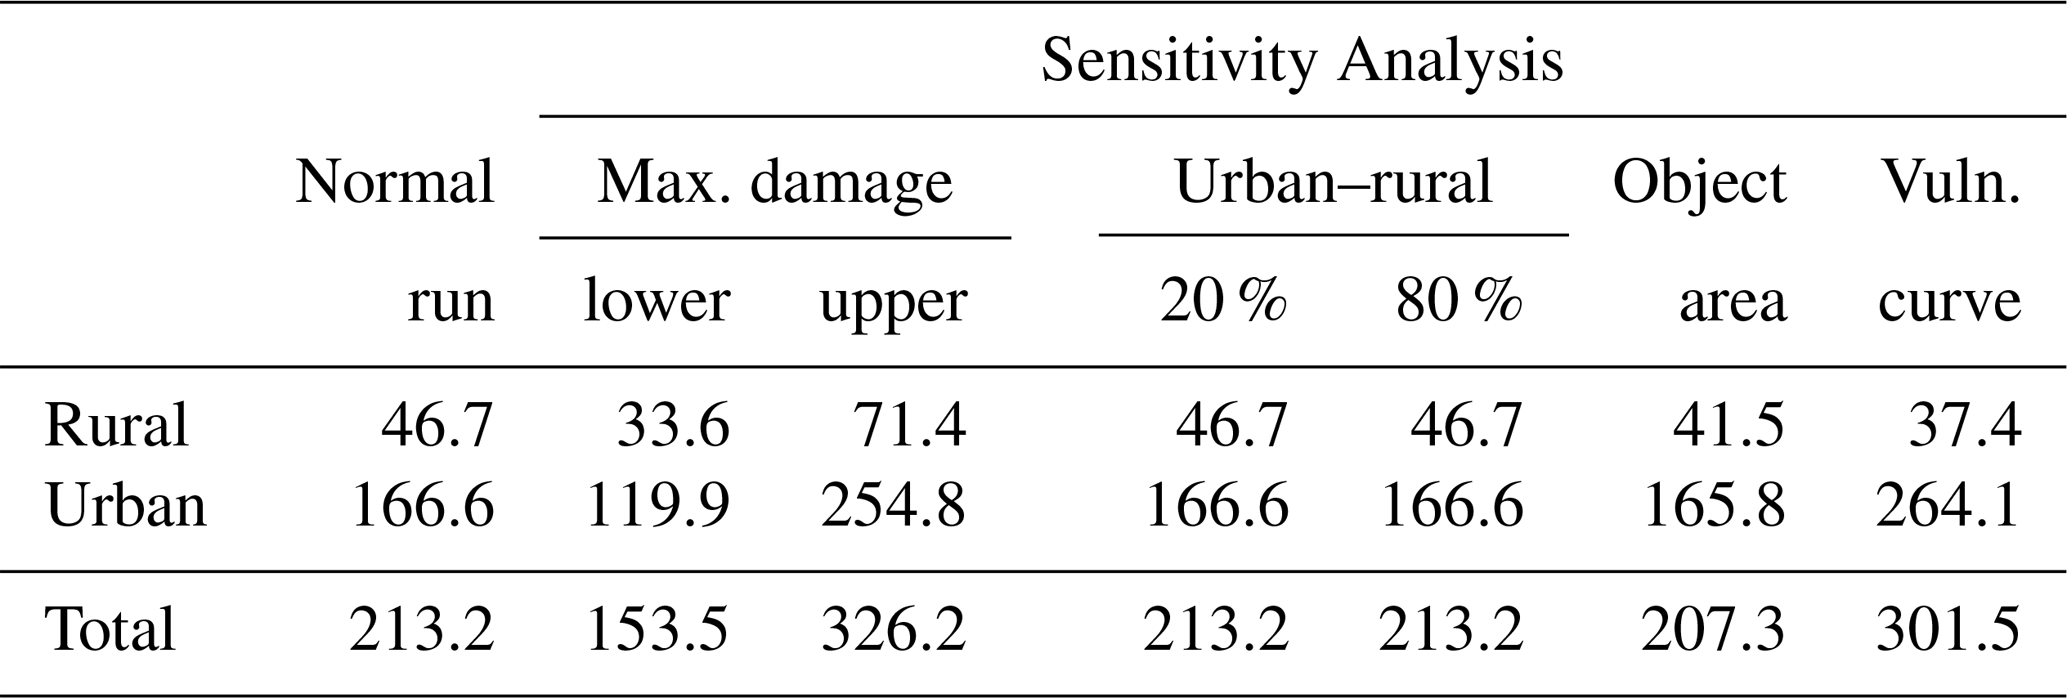

Results of the sensitivity analysis are summarized in Table 8. Clearly, the flood risk estimate is very sensitive to the applied maximum damage values, as the EAD scales linearly with maximum damage changes. The results also show the EAD to be sensitive to the applied vulnerability curve. Using the single curve from GLOFRIS leads to a higher total estimate of risk by 41 %. Therefore, the estimation of maximum damage values and improved representation of vulnerability are important considerations for large-scale flood risk modelling. Our approach improves the incorporation of vulnerability in the risk assessment by differentiating a built environment into classes that characterize the vulnerability of a building stock even on large scales. The EAD is very insensitive to the threshold used in the urban/rural classification. Even with the wide range of thresholds used in the sensitivity analysis, influence on the urban–rural distribution is minimal, confirming that the urban and rural built environment in Ethiopia is very distinct in terms of what materials and construction types are applied. Nonetheless, as previously discussed in Sect. 3.1, exposure of an area can vary depending on the applied dataset. Using ImageCat data, over half of the construction types in Ethiopia belong to class I, and about 14 % to each of the other classes (see Table 9). However, according to data from the last census in Ethiopia from 2007, 73.9 % of all housing units in Ethiopia have been assigned the wood and mud wall material, with 80 % of the urban units and 72.5 % of rural units, whereas a large share of rural units were built with wood (and thatch) walls (15.5 %). Compared to the ImageCat data, the Ethiopian building stock appears to be less diverse and shows a different distribution of urban and rural constructions, which is also affected by the applied definition of urban in the census. Since the 2007 census, Ethiopia has experienced considerable economic growth that appears to coincide with growth in the Ethiopian construction industry (World Bank, 2019). Furthermore, census data are aggregated to administrative levels and thus cannot be applied in the approach developed in this paper, for which an object-based dataset is required that is comparable between countries, such as the ImageCat data. With different methodologies in exposure datasets, future research should explore how flood risk assessments that are based on building-material-based vulnerability are affected by the applied building stock dataset and their different scales. In our sensitivity analysis, the assumptions made on the object areas have little influence on the EAD, with overall slightly lower EAD when using alternative footprint sizes. Even though the effect of the object areas is small, it must be noted that these are estimated sizes and in reality building layouts are very diverse.
In this paper, we investigated how characteristics of the built environment can be used to assess flood impacts on large scales. To this end, we developed flood vulnerability classes and stage-damage curves that are based on construction types and building materials. In contrast to other large-scale flood risk models that employ aggregated land-use categories and vulnerability curves, our approach takes advantage of detailed information of the exposed elements to differentiate their vulnerability.
Showing that the predominant types of buildings are different in urban and rural areas, particularly in developing countries, the settlements' land use can be identified by the characteristics of their building stock. By distinguishing the urban and rural built environment using our vulnerability classes, we opened up the possibility to analyse flood impacts outside of the typical focus on urban areas of large-scale flood assessments. We used it to show how flood damage to buildings differs and assessed flood risk in urban and rural areas of Ethiopia. Although EAD in urban areas exceeds EAD in rural areas, the rural flood risk of USD 46.7 million per year (over 20 % of total risk) is nevertheless significant. Moreover, far more buildings are affected in rural as opposed to urban areas. As low water depths can already cause major damage to the types of buildings that predominantly exist in rural settings in Africa, differentiation between flood damage in urban and rural settings could also be invaluable to studies related to poverty and flooding.
We examined the effects of parameter uncertainty and found that the model is insensitive to the applied threshold identifying urban and rural areas from the object-based information about the characteristics of building stock in the study area using our material-based vulnerability classes. Consistent with other studies (e.g. de Moel and Aerts, 2010; Merz et al., 2010), the sensitivity analysis showed that the replacement value of the exposed buildings deserves considerable attention as we see large differences in the model output. The results further showed that aggregated vulnerability as used in large-scale land-use-based models affects the results to a great extent. In our model, vulnerability is addressed in greater detail as it reflects the behaviour of different types of buildings during floods according to their structural characteristics. Therefore, it provides a more direct relation between physical damaging processes and flood impact on different structural types.
This approach is of particular importance for studies where there is a large variation in construction types, such as large-scale studies or studies in developing countries for which the urban and rural building stock is much more differentiated. Large informal settlement areas in cities are not specifically addressed in the current setup and would be classified as rural. To acknowledge this, the urban–rural classification could be extended to highlight such areas and ones where none of the typically urban or rural building types clearly prevail. Lastly, it has to be noted that maintenance can influence the quality of the construction over the years; thus the structural vulnerability would further increase with building age. Future research would benefit from including these indicators or similar ones such as building laws and practices, given that sufficient data become available, to highlight differences between regions. Furthermore, if the data allow in the future, vulnerabilities within the classes could be further refined such as between clay, stone, and concrete brick/block construction or regarding non-structural elements like electrical components and partition walls.
Besides improving the accuracy in estimating direct flood damage, the use of building-material-based vulnerability curves also paves the road to the enhancement of multi-risk assessments as the method enables the comparison of vulnerability across different natural hazard types that also use building-material-based vulnerability.
This work relied on data which are available from the providers cited in Sects. 2 and 3.
The supplement related to this article is available online at: https://doi.org/10.5194/nhess-19-1703-2019-supplement.
JE, HdM, and PJW conceived the study. JE, HdM, and MCdR developed the vulnerability classification and conducted the literature review. The methodology was designed by JCJHA, JE, HdM, and PJW, with exposure data provided by ImageCat and CKH contributing to the enrichment of the analysis and discussion of results. JE analysed the data and prepared the draft, with all co-authors commenting on the manuscript.
The authors declare that they have no conflict of interest.
This article is part of the special issue “Global- and continental-scale risk assessment for natural hazards: methods and practice”. It is a result of the European Geosciences Union General Assembly 2018, Vienna, Austria, 8–13 April 2018.
We thank the editor James Daniell and the two anonymous reviewers for their very valuable comments.
This paper was edited by James Daniell and reviewed by two anonymous referees.
This research has been supported by the Netherlands Organisation for Scientific Research (NWO) (grant nos. 453.140.006 and 016.161.324). The ImageCat exposure data are based on work supported by the National Aeronautics and Space Administration (grant no. NNX14AQ13G), issued through the Research Opportunities in Space and Earth Sciences (ROSES) Applied Sciences Program. The views and conclusions contained here are solely those of the authors.
Alagbe, O. A. and Opoko, A. P.: Housing Nigerian Urban Poor through Self-Build Housing Concept Using Compressed Stabilized Laterite Bricks, Int. J. Res. Social Sci., 2, 13–18, 2013.
Alfieri, L., Burek, P., Dutra, E., Krzeminski, B., Muraro, D., Thielen, J., and Pappenberger, F.: GloFAS – global ensemble streamflow forecasting and flood early warning, Hydrol. Earth Syst. Sci., 17, 1161–1175, https://doi.org/10.5194/hess-17-1161-2013, 2013.
Arnell, N. W. and Gosling, S. N.: The impacts of climate change on river flood risk at the global scale, Climatic Change, 134, 387–401, https://doi.org/10.1007/s10584-014-1084-5, 2016.
Billi, P., Alemu, Y. T., and Ciampalini, R.: Increased frequency of flash floods in Dire Dawa, Ethiopia: Change in rainfall intensity or human impact?, Nat. Hazards, 76, 1373–1394, https://doi.org/10.1007/s11069-014-1554-0, 2015.
Buck, W.: Die neue DWA-Arbeitshilfe Hochwasserschadensinformationen, Fünf Jahre nach der Flut. Hochwasserschutzkonzepte – Planung, Berechnung, Realisierung, Dresdner Wasserbaukolloquium, 8–9 October 2007, Dresden, 95–103, 2007.
CAHF: 2017 Yearbook, Housing finance in Africa, Centre for Affordable Housing Finance in Africa, Johannesburg, South Africa, available at: http://housingfinanceafrica.org/app/uploads/2017_CAHF_YEARBOOK_14.10-copy.compressed.pdf (last access: 7 March 2018), 2017.
CAPRA: Probabilistic Risk Assessment Program, ERN-Vulnerability v2, available at: https://ecapra.org/ (last access: 8 May 2019), 2012.
Chen, G. Y. Y.: Analysis of stabilized adobe in rural East Africa, Thesis, California Polytechnic State University, San Luis Obispo, 99 pp., https://doi.org/10.15368/theses.2009.149, 2009.
Chinh, D., Gain, A., Dung, N., Haase, D., and Kreibich, H.: Multi-Variate Analyses of Flood Loss in Can Tho City, Mekong Delta, Water, 8, 6, https://doi.org/10.3390/w8010006, 2016.
CIESIN: Global Rural-Urban Mapping Project, Version 1 (GRUMPv1), Urban Extents Grid, Center for International Earth Science Information Network (CIESIN) Columbia University, International Food Policy Research Institute (IFPRI), The World Bank, and Centro Internacional de Agricultura Tropical (CIAT), Palisades, NY, https://doi.org/10.7927/H4GH9FVG, 2011.
Collier, P. and Venables, A. J.: Housing and Urbanization in Africa: Unleashing a Formal Market Process, in: The urban imperative: Towards competitive cities, edited by: Glaeser, E. and Joshi-Ghandi, A., Oxford University Press, Oxford, 413–436, 2015.
CSA: The 2007 Population and Housing Census of Ethiopia: Statistical Report at Country Level, Central Statistical Agency Ethiopia, available at: https://microdata.worldbank.org/index.php/catalog/2747/download/39211 (last access: 26 April 2019), 2010.
CSA and ICF: Ethiopia Demographic and Health Survey 2016, Addis Ababa, Ethiopia and Rockville, Maryland, USA, Central Statistical Agency and ICF, https://dhsprogram.com/pubs/pdf/FR328/FR328.pdf (last access: 19 May 2019), 2016.
de Moel, H. and Aerts, J. C. J. H.: Effect of uncertainty in land use, damage models and inundation depth on flood damage estimates, Nat. Hazards, 58, 407–425, https://doi.org/10.1007/s11069-010-9675-6, 2010.
de Moel, H., Jongman, B., Kreibich, H., Merz, B., Penning-Rowsell, E., and Ward, P. J.: Flood risk assessments at different spatial scales, Mitig. Adapt. Strat. Global Change, 20, 865–890, https://doi.org/10.1007/s11027-015-9654-z, 2015.
de Ruiter, M. C., Ward, P. J., Daniell, J. E., and Aerts, J. C. J. H.: Review Article: A comparison of flood and earthquake vulnerability assessment indicators, Nat. Hazards Earth Syst. Sci., 17, 1231–1251, https://doi.org/10.5194/nhess-17-1231-2017, 2017.
de Villiers, G., Viljoen, G., and Booysen, H.: Standaard residensiële vloedskadefunksies vir Suid-Afrikaanse toestande (Standard residential flood damage functions for South African conditions), Suid-Afrikaanse Tydskrif vir Natuurwetenskap en Tegnologie, 26, 26–36, available at: https://journals.co.za/content/aknat/26/1/EJC20402 (last access: 1 May 2018), 2007.
Dhillon, R. K.: Flood damage assessment and identification of safe routes for evacuation using a micro-level approach in part of Birupa River Basin, Orissa, India, Thesis, Indian Institute of Remote Sensing (IIRS) National Remote Sensing Agency, International Institute for Geo-Information Science and Earth Observation (ITC), Enschede, the Netherlands, 145 pp., 2008.
Dijkstra, L. and Poelman, H.: A harmonised defintion of cities and rural areas: the new degree of urbanisation, European Commission Directorate-General for Regional and Urban Policy, WP 01/2014, available at: https://ec.europa.eu/regional_policy/sources/docgener/work/2014_01_new_urban.pdf (last access: 16 February 2018), 2014.
Dottori, F., Salamon, P., Bianchi, A., Alfieri, L., Hirpa, F. A., and Feyen, L.: Development and evaluation of a framework for global flood hazard mapping, Adv. Water Resour., 94, 87–102, https://doi.org/10.1016/j.advwatres.2016.05.002, 2016.
Dutta, D., Herath, S., and Musiake, K.: A mathematical model for flood loss estimation, J. Hydrol., 277, 24–49, https://doi.org/10.1016/S0022-1694(03)00084-2, 2003.
Esch, T., Heldens, W., Hirner, A., Keil, M., Marconcini, M., Roth, A., Zeidler, J., Dech, S., and Strano, E.: Breaking new ground in mapping human settlements from space – The Global Urban Footprint, ISPRS J. Photogram. Remote Sens., 134, 30–42, https://doi.org/10.1016/j.isprsjprs.2017.10.012, 2017.
Feyen, L., Dankers, R., Bódis, K., Salamon, P., and Barredo, J. I.: Fluvial flood risk in Europe in present and future climates, Climatic Change, 112, 47–62, https://doi.org/10.1007/s10584-011-0339-7, 2011.
Fiadzo, E.: Estimating the determinants of housing quality: the case of Ghana, Joint Center for Housing Studies, Harvard University, W04-6, available at: http://siteresources.worldbank.org/INTURBANDEVELOPMENT/Resources/336387-1268963780932/6881414-1268966662197/fiadzo.pdf (last access: 7 March 2018), 2004.
Fuchs, S.: Susceptibility versus resilience to mountain hazards in Austria – paradigms of vulnerability revisited, Nat. Hazards Earth Syst. Sci., 9, 337–352, https://doi.org/10.5194/nhess-9-337-2009, 2009.
Godfrey, A., Ciurean, R. L., van Westen, C. J., Kingma, N. C., and Glade, T.: Assessing vulnerability of buildings to hydro-meteorological hazards using an expert based approach – An application in Nehoiu Valley, Romania, Int. J. Disast. Risk Reduct., 13, 229–241, https://doi.org/10.1016/j.ijdrr.2015.06.001, 2015.
Goldblatt, R., Deininger, K., and Hanson, G.: Utilizing publicly available satellite data for urban research: Mapping built-up land cover and land use in Ho Chi Minh City, Vietnam, Dev. Eng., 3, 83–99, https://doi.org/10.1016/j.deveng.2018.03.001, 2018.
Hall, J. W., Sayers, P. B., and Dawson, R. J.: National-scale Assessment of Current and Future Flood Risk in England and Wales, Nat. Hazards, 36, 147–164, https://doi.org/10.1007/s11069-004-4546-7, 2005.
Hasanzadeh Nafari, R., Ngo, T., and Lehman, W.: Calibration and validation of FLFArs – a new flood loss function for Australian residential structures, Nat. Hazards Earth Syst. Sci., 16, 15–27, https://doi.org/10.5194/nhess-16-15-2016, 2016.
Hu, Z., Huyck, C., Eguchi, M., and Bevington, J.: User guide: Tool for spatial inventory data development, GEM Technical Report 2014-05 V1.0.0, GEM Foundation, Pavia, Italy, 60 pp., https://doi.org/10.13117/GEM.DATA-CAPTURE.TR2014.05, available at: https://old.globalquakemodel.org/media/publication/DATA-CAPTURE-GEM-Userguide-Spatial-Inventory-Data (last access: 29 October 2018), 2014.
Huizinga, J., De Moel, H., and Szewczyk, W.: Global flood depth-damage functions. Methodology and the database with guidelines, European Commission Joint Research Centre, Publications Office of the European Union, Luxembourg, https://doi.org/10.2760/16510, 2017.
Huyck, C. K. and Eguchi, M.: GFDRR Africa Disaster Risk Financing – Result Area 5 Exposure Development, Replacement Cost Refinements to the Exposure data, Prepared for World Bank, GFDRR, 2017.
Ikeuchi, H., Hirabayashi, Y., Yamazaki, D., Muis, S., Ward, P. J., Winsemius, H. C., Verlaan, M., and Kanae, S.: Compound simulation of fluvial floods and storm surges in a global coupled river-coast flood model: Model development and its application to 2007 Cyclone Sidr in Bangladesh, J. Adv. Model. Earth Syst., 9, 1847–1862, https://doi.org/10.1002/2017ms000943, 2017.
ImageCat, CIESIN, and Porter, K.: Africa Disaster Risk Financing Phase 1 – Result Area 5, Exposure Development for 5 Sub-Saharan African countries, Ethiopia, Kenya, Uganda, Niger, Senegal, 2017.
Islam, K. M. N.: The impacts of flooding and methods of assessment in urban areas of Bangladesh, PhD thesis, Flood Hazard Research Centre, Middlesex University, Middlesex, 556 pp., available at: http://eprints.mdx.ac.uk/9602/ (last access: 2 May 2018), 1997.
Jaiswal, K. S. and Wald, D. J.: PAGER Inventory Database v2.0, US Geological Survey, Golden, Colorado, USA, available at: https://pubs.usgs.gov/of/2008/1160/index.html (last access: 10 July 2018), 2008.
Jaiswal, K. S., Wald, D. J., and Porter, K.: A Global Building Inventory for Earthquake Loss Estimation and Risk Management, Earthquake Spectra, 26, 731–748, https://doi.org/10.1193/1.3450316, 2010.
Jonkman, S. N.: Advanced flood risk analysis required, Nat. Clim. Change, 3, 1004–1004, https://doi.org/10.1038/nclimate2031, 2013.
Kappes, M. S., Papathoma-Köhle, M., and Keiler, M.: Assessing physical vulnerability for multi-hazards using an indicator-based methodology, Appl. Geogr., 32, 577–590, https://doi.org/10.1016/j.apgeog.2011.07.002, 2012.
Klein Goldewijk, K., Beusen, A., Van Drecht, G., and De Vos, M.: The HYDE 3.1 spatially explicit database of human-induced global land-use change over the past 12,000 years, Global Ecol. Biogeogr., 20, 73–86, https://doi.org/10.1111/j.1466-8238.2010.00587.x, 2011.
Klotz, M., Kemper, T., Geiß, C., Esch, T., and Taubenböck, H.: How good is the map? A multi-scale cross-comparison framework for global settlement layers: Evidence from Central Europe, Remote Sens. Environ., 178, 191–212, https://doi.org/10.1016/j.rse.2016.03.001, 2016.
Komi, K., Amisigo, B., and Diekkrüger, B.: Integrated Flood Risk Assessment of Rural Communities in the Oti River Basin, West Africa, Hydrology, 3, 42, https://doi.org/10.3390/hydrology3040042, 2016.
Laudan, J., Rözer, V., Sieg, T., Vogel, K., and Thieken, A. H.: Damage assessment in Braunsbach 2016: data collection and analysis for an improved understanding of damaging processes during flash floods, Nat. Hazards Earth Syst. Sci., 17, 2163–2179, https://doi.org/10.5194/nhess-17-2163-2017, 2017.
Leyk, S., Uhl, J. H., Balk, D., and Jones, B.: Assessing the Accuracy of Multi-Temporal Built-Up Land Layers across Rural-Urban Trajectories in the United States, Remote Sens. Environ., 204, 898–917, https://doi.org/10.1016/j.rse.2017.08.035, 2018.
Li, W., Xu, B., and Wen, J.: Scenario-based community flood risk assessment: a case study of Taining county town, Fujian province, China, Nat. Hazards, 82, 193–208, https://doi.org/10.1007/s11069-016-2187-2, 2016.
Maiti, S.: Defining a Flood Risk Assessment Procedure using Community Based Approach with Integration of Remote Sensing GIS, Bassed on the 2003 Orissa Flood, Thesis, Indian Institute of Remote Sensing (IIRS) National Remote Sensing Agency, International Institute for Geo-Information Science and Earth Observation (ITC), Enschede, the Netherlands, available at: https://itc.nl/library/papers_2007/msc/iirs/maiti.pdf (last access: 10 May 2018), 2007.
Mechler, R., Bouwer, L. M., Linnerooth-Bayer, J., Hochrainer-Stigler, S., Aerts, J. C. J. H., Surminski, S., and Williges, K.: Managing unnatural disaster risk from climate extremes, Nat. Clim. Change, 4, 235–237, https://doi.org/10.1038/nclimate2137, 2014.
Merz, B., Kreibich, H., Schwarze, R., and Thieken, A.: Review article “Assessment of economic flood damage”, Nat. Hazards Earth Syst. Sci., 10, 1697–1724, https://doi.org/10.5194/nhess-10-1697-2010, 2010.
Middelmann-Fernandes, M. H.: Flood damage estimation beyond stage-damage functions: an Australian example, J. Flood Risk Manage., 3, 88–96, https://doi.org/10.1111/j.1753-318X.2009.01058.x, 2010.
Milanesi, L., Pilotti, M., Belleri, A., Marini, A., and Fuchs, S.: Vulnerability to Flash Floods: A Simplified Structural Model for Masonry Buildings, Water Resour. Res., 54, 7177–7197, https://doi.org/10.1029/2018wr022577, 2018.
Miyazaki, H., Iwao, K., and Shibasaki, R.: Development of a New Ground Truth Database for Global Urban Area Mapping from a Gazetteer, Remote Sensing, 3, 1177–1187, https://doi.org/10.3390/rs3061177, 2011.
Myint, S. W., Gober, P., Brazel, A., Grossman-Clarke, S., and Weng, Q.: Per-pixel vs. object-based classification of urban land cover extraction using high spatial resolution imagery, Remote Sens. Environ., 115, 1145–1161, https://doi.org/10.1016/j.rse.2010.12.017, 2011.
Neubert, M., Naumann, T., and Deilmann, C.: Synthetic Water Level Building Damage Relationship for GIS-supported Flood Vulnerability Modeling of Residential Properties, FLOODRISK 2008, Flood Risk Management – Research and Practice, in: Proceedings of the European Conference on Flood Risk Management Research into Practice, 30 September–2 October 2008, Oxford, UK, 1717–1724, 2008.
Papathoma-Köhle, M., Gems, B., Sturm, M., and Fuchs, S.: Matrices, curves and indicators: A review of approaches to assess physical vulnerability to debris flows, Earth-Sci. Rev., 171, 272–288, https://doi.org/10.1016/j.earscirev.2017.06.007, 2017.
Pesaresi, M. and Freire, S.: GHS Settlement grid following the REGIO model 2014 in application to GHSL Landsat and CIESIN GPW v4-multitemporal (1975–1990–2000–2015), European Commission Joint Research Centre (JRC), available at: http://data.europa.eu/89h/jrc-ghsl-ghs_smod_pop_globe_r2016a, last access: 19 January 2016.
Peters Guarín, G., van Westen, C. J., and Montoya, L.: Community-based flood risk assessment using GIS for the town of San Sebastián, Guatemala, J. Human Secur. Dev., 1, 29–49, 2005.
Potere, D., Schneider, A., Angel, S., and Civco, D. L.: Mapping urban areas on a global scale: which of the eight maps now available is more accurate?, Int. J. Remote Sens., 30, 6531–6558, https://doi.org/10.1080/01431160903121134, 2009.
Reese, S. and Ramsay, D.: RiskScape: Flood fragility methodology, NIWA, WLG2010-45, available at: https://victoria.ac.nz/sgees/research-centres/documents/riskscape-flood-fragility-methodology.pdf (last access: 10 May 2018), 2010.
Rudari, R., Beckers, J., De Angeli, S., Rossi, L., and Trasforini, E.: Flood Risk Modelling for the North and Central Malawi, CIMA, ACP-EU, GFDRR, RASOR, available at: https://preventionweb.net/publications/view/54387 (last access: 1 May 2018), 2016.
Sagala, S. A. H.: Analysis of flood pyhsical vulnerability in residential areas. Case Study: Naga City, the Philippines, Thesis, International Institute for Geo-Information Science and Earth Observation (ITC), Enschede, the Netherlands, 2006.
Sampson, C. C., Smith, A. M., Bates, P. D., Neal, J. C., Alfieri, L., and Freer, J. E.: A high-resolution global flood hazard model, Water Resour. Res., 51, 7358–7381, https://doi.org/10.1002/2015WR016954, 2015.
Scawthorn, C., Flores, P., Blais, N., Seligson, H., Tate, E., Chang, S., Mifflin, E., Thomas, W., Murphy, J., Jones, C., and Lawrence, M.: HAZUS-MH Flood Loss Estimation Methodology. II. Damage and Loss Assessment, Nat. Hazards Rev., 7, 72–81, https://doi.org/10.1061/(ASCE)1527-6988(2006)7:2(72), 2006.
Schmidt, E. and Kedir, M.: Urbanization and Spatial Connectivity in Ethiopia: Urban Growth Analysis Using GIS, Working Paper 3,International Food Policy Research Institute (IFPRI), Addis Ababa, available at: https://ifpri.org/cdmref/p15738coll2/id/130941/filename/131152.pdf (last access: 13 August 2018), 2009.
Schmidt, W., Hirya, N. N. M., Bjegovic, D., Uzoegbo, H. C., and Kumaran, S. G.: Cement technology in sub-Saharan Africa – practical and scientific experiences, Am. Ceram. Soc. Bull., 91, 52–56, 2012.
Schneider, A., Friedl, M. A., and Potere, D.: A new map of global urban extent from MODIS satellite data, Environ. Res. Lett., 4, 044003, https://doi.org/10.1088/1748-9326/4/4/044003, 2009.
Schwarz, J. and Maiwald, H.: Damage and loss prediction model based on the vulnerability of building types, in: 4th International Symposium on Flood Defence, 6–8 May 2008, Toronto, Canada, 2008.
Scussolini, P., Aerts, J. C. J. H., Jongman, B., Bouwer, L. M., Winsemius, H. C., de Moel, H., and Ward, P. J.: FLOPROS: an evolving global database of flood protection standards, Nat. Hazards Earth Syst. Sci., 16, 1049–1061, https://doi.org/10.5194/nhess-16-1049-2016, 2016.
Silva, V., Henshaw, P., Huyck, C. K., and O'Hara, M.: D5 – Final Report, GEM Foundation, Pavia, Italy, 2018.
Sturm, M., Gems, B., Keller, F., Mazzorana, B., Fuchs, S., Papathoma-Köhle, M., and Aufleger, M.: Understanding impact dynamics on buildings caused by fluviatile sediment transport, Geomorphology, 321, 45–59, https://doi.org/10.1016/j.geomorph.2018.08.016, 2018.
Thieken, A. H., Olschewski, A., Kreibich, H., Kobsch, S., and Merz, B.: Development and evaluation of FLEMOps – a new Flood Loss Estimation MOdel for the private sector, in: Flood Recovery, Innovation and Response, edited by: Proverbs, D., Brebbia, C. A., and Penning-Rowsell, E., WIT Press, 315–324, https://doi.org/10.2495/FRIAR080301, 2008.
Trigg, M. A., Birch, C. E., Neal, J. C., Bates, P. D., Smith, A., Sampson, C. C., Yamazaki, D., Hirabayashi, Y., Pappenberger, F., Dutra, E., Ward, P. J., Winsemius, H. C., Salamon, P., Dottori, F., Rudari, R., Kappes, M. S., Simpson, A. L., Hadzilacos, G., and Fewtrell, T. J.: The credibility challenge for global fluvial flood risk analysis, Environ. Res. Lett., 11, 094014, https://doi.org/10.1088/1748-9326/11/9/094014, 2016.
UNFCCC: Decision 2/CP. 19: Warsaw international mechanism for loss and damage associated with climate change impacts, FCCC/CP/2013/10/Add.1, available at: http://unfccc.int/resource/docs/2013/cop19/eng/10a01.pdf (last access: 26 May 2018), 2013.
UNISDR: Sendai framework for disaster risk reduction 2015–2030, United Nations International Strategy for Disaster Reduction, Geneva, UNISDR, available at: https://unisdr.org/we/inform/publications/43291 (last access: 25 May 2018), 2015.
UNSD: Demographic Yearbook 2015, UN Statistics Devision, UN Department of Economic and Social Affairs, United Nations, New York, available at: https://unstats.un.org/unsd/demographic-social/products/dyb/dybsets/2015.pdf (last access: 16 August 2018), 2016.
UNSD: Principles and recommendations for population and housing censuses, Revision3̃, UN Statistics Devision, UN Department of Economic and Social Affairs, United Nations, New York, available at: https://unstats.un.org/unsd/demographic-social/Standards-and-Methods/files/Principles_and_Recommendations/Population-and-Housing-Censuses/Series_M67rev3-E.pdf (last access: 16 August 2018), 2017.
Wagenaar, D., Lüdtke, S., Schröter, K., Bouwer, L. M., and Kreibich, H.: Regional and temporal transferabilityof multivariable flood damage models, Water Resour. Res., 54, 3688–3703, https://doi.org/10.1029/2017WR022233, 2018.
Wahab, R. and Tiong, R.: Multi-variate residential flood loss estimation model for Jakarta: an approach based on a combination of statistical techniques, Nat. Hazards, 86, 779–804, https://doi.org/10.1007/s11069-016-2716-z, 2016.
Wang, P., Huang, C., Brown de Colstoun, E. C., Tilton, J. C., and Tan, B.: Global Human Built-up And Settlement Extent (HBASE) Dataset From Landsat, Palisades, NY, https://doi.org/10.7927/H4DN434S, 2017.
Ward, P. J., Jongman, B., Weiland, F. S., Bouwman, A., van Beek, R., Bierkens, M. F. P., Ligtvoet, W., and Winsemius, H. C.: Assessing flood risk at the global scale: model setup, results, and sensitivity, Environ. Res. Lett., 8, 044019, https://doi.org/10.1088/1748-9326/8/4/044019, 2013.
Ward, P. J., Jongman, B., Salamon, P., Simpson, A., Bates, P., De Groeve, T., Muis, S., de Perez, E. C., Rudari, R., Trigg, M. A., and Winsemius, H. C.: Usefulness and limitations of global flood risk models, Nat. Clim. Change, 5, 712–715, https://doi.org/10.1038/nclimate2742, 2015.
Ward, P. J., Jongman, B., Aerts, J. C. J. H., Bates, P. D., Botzen, W. J. W., Diaz Loaiza, A., Hallegatte, S., Kind, J. M., Kwadijk, J., Scussolini, P., and Winsemius, H. C.: A global framework for future costs and benefits of river-flood protection in urban areas, Nat. Clim. Change, 7, 642–648, https://doi.org/10.1038/nclimate3350, 2017.
Winsemius, H. C., Van Beek, L. P. H., Jongman, B., Ward, P. J., and Bouwman, A.: A framework for global river flood risk assessments, Hydrol. Earth Syst. Sci., 17, 1871–1892, https://doi.org/10.5194/hess-17-1871-2013, 2013.
Winsemius, H. C., Aerts, J. C. J. H., van Beek, L. P. H., Bierkens, M. F. P., Bouwman, A., Jongman, B., Kwadijk, J. C. J., Ligtvoet, W., Lucas, P. L., van Vuuren, D. P., and Ward, P. J.: Global drivers of future river flood risk, Nat. Clim. Change, 6, 381–385, https://doi.org/10.1038/nclimate2893, 2015.
Winsemius, H. C., Jongman, B., Veldkamp, T. I. E., Hallegatte, S., Bangalore, M., and Ward, P. J.: Disaster risk, climate change, and poverty: assessing the global exposure of poor people to floods and droughts, Environ. Dev. Econ., 23, 328–348, https://doi.org/10.1017/s1355770x17000444, 2018.
World Bank: A Preliminary Assessment of Damage from the Flood and Cyclone Emergency of February–March 2000, available at: http://siteresources.worldbank.org/INTDISMGMT/Resources/WB_flood_damages_Moz.pdf (last access: 1 September 2018), 2000.
World Bank: Stocktaking of the Housing Sector in Sub-Saharan Africa: Challenges and Opportunities, World Bank Group, Washington, D.C., available at: https://openknowledge.worldbank.org/handle/10986/23358 (last access: 26 July 2018), 2015.
World Bank: World Development Indictors – Urban population (% of total), available at: https://data.worldbank.org/indicator/SP.URB.TOTL.IN.ZS?locations=ET (last access: 29 April 2019), 2016.
World Bank: The World Bank in Ethiopia, AfricaCan, The World Bank, available at: https://worldbank.org/en/country/ethiopia/overview#1, last access: 28 April 2019.
WRI: Hotspots of global river and coastal flood risk: challenges and opportunities, World Resources Institute, Washington, D.C., 2018.
Wright, D. B.: Methods in Flood Hazard and Risk Assessment, Advances in Probabilistic Flood Hazard Assessment (CAPRA) technical notes, 100086, World Bank, Washington, D.C., available at: http://documents.worldbank.org/curated/en/395541467991908801/Methods-in-flood-hazard-and-risk-assessment (last access: 12 July 2018), 2016.
Wünsch, A., Herrmann, U., Kreibich, H., and Thieken, A. H.: The role of disaggregation of asset values in flood loss estimation: a comparison of different modeling approaches at the Mulde River, Germany, Environ. Manage., 44, 524–541, https://doi.org/10.1007/s00267-009-9335-3, 2009.
Zhai, G., Fukuzono, T., and Ikeda, S.: Modeling Flood Damage: Case of Tokai Flood 2000, J. Am. Water Resour. Assoc., 41, 77–92, https://doi.org/10.1111/j.1752-1688.2005.tb03719.x, 2005.