the Creative Commons Attribution 4.0 License.
the Creative Commons Attribution 4.0 License.
 | 27 Jul 2018
Changing seasonality of moderate and extreme precipitation events in the Alps
Stefan Brönnimann
Jan Rajczak
Erich M. Fischer
Christoph C. Raible
Marco Rohrer
Christoph Schär
The intensity of precipitation events is expected to increase in the future. The rate of increase depends on the strength or rarity of the events; very strong and rare events tend to follow the Clausius–Clapeyron relation, whereas weaker events or precipitation averages increase at a smaller rate than expected from the Clausius–Clapeyron relation. An often overlooked aspect is seasonal occurrence of such events, which might change in the future. To address the impact of seasonality, we use a large ensemble of regional and global climate model simulations, comprising tens of thousands of model years of daily temperature and precipitation for the past, present, and future. In order to make the data comparable, they are quantile mapped to observation-based time series representative of the Aare catchment in Switzerland. Model simulations show no increase in annual maximum 1-day precipitation events (Rx1day) over the last 400 years and an increase of 10 %–20 % until the end of the century for a strong (RCP8.5) forcing scenario. This fits with a Clausius–Clapeyron scaling of temperature at the event day, which increases less than annual mean temperature. An important reason for this is a shift in seasonality. Rx1day events become less frequent in late summer and more frequent in early summer and early autumn, when it is cooler. The seasonality shift is shown to be related to summer drying. Models with decreasing annual mean or summer mean precipitation show this behaviour more strongly. The highest Rx1day per decade, in contrast, shows no change in seasonality in the future. This discrepancy implies that decadal-scale extremes are thermodynamically limited; conditions conducive to strong events still occur during the hottest time of the year on a decadal scale. In contrast, Rx1day events are also limited by other factors. Conducive conditions are not reached every summer in the present, and even less so in the future. Results suggest that changes in the seasonal cycle need to be accounted for when preparing for moderately extreme precipitation events and assessing their socio-economic impacts.
- Article
(2722 KB) - Full-text XML
-
Supplement
(986 KB) - BibTeX
- EndNote


Heavy precipitation extremes in the Alps may trigger flood events or landslides that lead to loss of lives, cause large monetary losses, and threaten important infrastructure. While the most extreme events have the highest socio-economic impact, even moderate extreme events such as the annual maximum rainfall (Rx1day) or events with a 10-year return period may be relevant for climate change adaptation. Even for these events, the observation records at a single location may not be long enough to capture trends. Still, aggregating weather station records from Switzerland, Scherrer et al. (2016) found an increase in intensity as measured by the magnitude of the annul maximum 1-day precipitation extreme (Rx1day) or exceedances of the 99th percentile.
Heavy precipitation requires moisture convergence and convection or synoptic-scale uplift. With increasing temperatures, saturation specific humidity increases and as a consequence an increased precipitation intensity is expected. At the global scale, precipitation is limited by radiation that has to balance the latent heat release (e.g. Allen and Ingram, 2002). For extreme precipitation events, however, Scherrer et al. (2016) found that the increase closely follows a Clausius–Clapeyron scaling of the annual mean temperature trend. Fischer and Knutti (2016) also found a scaling close to Clausius–Clapeyron for regional temperature changes in both global models and observations. However, the scaling may not hold exactly for various reasons (Pendergrass, 2018).
First, global models do not resolve changes in convection (Prein et al., 2015; Zhang et al., 2017), which is important for the case of Alpine precipitation (Giorgi et al., 2016). For instance, trends in Alpine precipitation are different during summer in convection-resolving regional models (Ban et al., 2014). Second, the scaling of extreme precipitation with temperatures at day-to-day timescales cannot generally be extrapolated to the future based on annual or seasonal mean temperatures (e.g. Ban et al., 2015; Schär et al., 2016; Zhang et al., 2017). One possible cause for a discrepancy between scaling at day-to-day timescales and at timescales of long-term warming is a potential change in seasonality. Pfahl et al. (2017), in an analysis of CMIP5 data (Taylor et al., 2012), found a shift in the future Rx1day towards smaller saturation specific humidity over most of the northern extratropical land areas (their Fig. S6), indicative of lower temperatures and thus a shift towards the colder seasons. Recently, Messmer et al. (2018) focused on one dynamical feature, which is responsible for extreme precipitation events in the Alps, the so-called Vb cyclone (van Bebber, 1898; Messmer et al., 2015). They found in dynamically downscaled scenario simulations (RCP8.5) that the occurrence of extreme Vb cyclones is shifted from midsummer to May and September in the future.
In this paper we focus on seasonality changes of heavy precipitation events (Rx1day) in the Alps using a comprehensive set of global and regional model simulations comprising tens of thousands of years of daily temperature and precipitation quantile mapped to observations representative of a large catchment in Switzerland. Based on this comprehensive data set, we analyse (1) trends in Rx1day and their relation to temperature trends, (2) the effect of changes in the seasonal cycle of temperature on Rx1day events, and (3) the effect of changes in the seasonal frequency of occurrence of Rx1day.
The paper is organised as follows. Section 2 gives a brief overview of the data and the quantile-mapping approach (Rajczak et al., 2018a, b) and outlines the analyses performed. Section 3 presents the results for Rx1day. A discussion in terms of underlying mechanisms and differences between models and model set-ups follows in Sect. 4. Conclusions are drawn in Sect. 5.
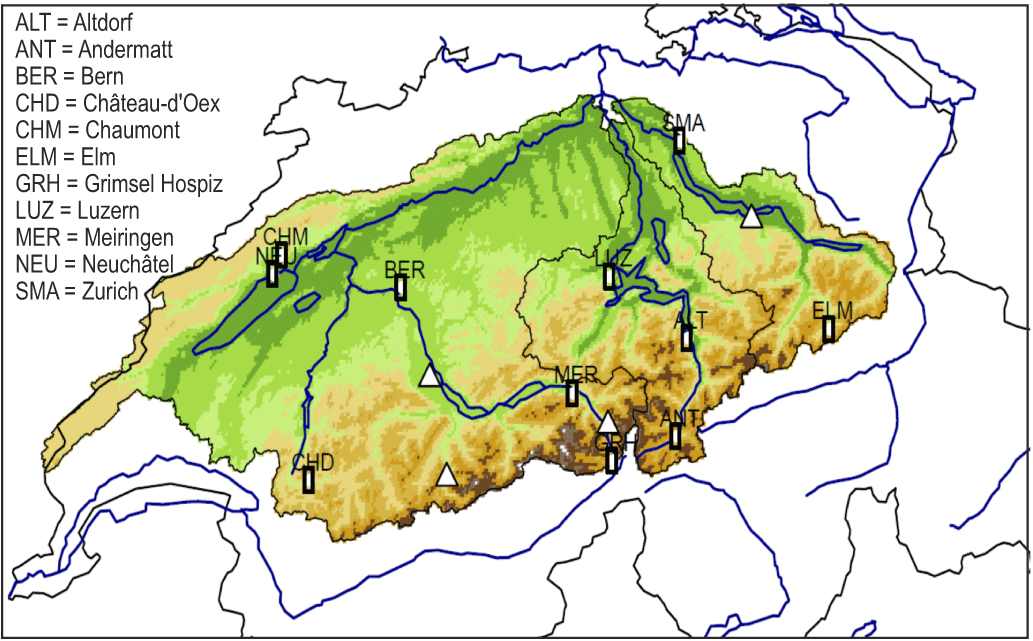
Figure 1Catchment of the Aare River. All data used in this study represent averages over this region. The representative weather stations are shown as squares (providing both temperature and precipitation) and triangles (only precipitation).
Table 1Overview of model experiments used in our study (see Table S1 for further details).
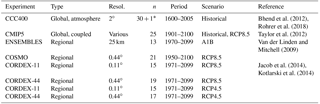
* Trends in some land-surface properties were mis-specified in the 30-member ensemble; an additional member with corrected land-surface properties was performed to assess the errors (Rohrer et al., 2018). The figures in this paper show the 30-member ensemble; results for the land-surface-corrected member share the same features and are shown in Fig. S3.
The study focuses on the Aare River catchment in Switzerland, an area of approximately 17 000 km2 (see Fig. 1). Heavy precipitation events in this catchment can cause major floods of the lower Aare River and the Rhine, where several nuclear power plants are located. We extract daily temperature and precipitation data over this domain from a large data set, comprising simulations of the past, present, and future from different set-ups (coupled and uncoupled simulations, global and regional simulations, single-member or ensemble simulations), reanalyses, dynamically downscaled reanalyses, and observations. A total of 55 000 simulation years are available (Rajczak et al., 2018a, b; the data are available from this website: https://doi.pangaea.de/10.1594/PANGAEA.886881, last access: 25 July 2018). In this study we focus on experiments with regional and global models. The following ensembles are used:
-
CCC400, an ensemble of 30 AMIP-type global atmospheric model simulations using ECHAM5.4 at T63 and covering the period 1600–2005;
-
the CMIP5 ensemble of 25 simulations (historical and RCP8.5) covering the period 1900–2100;
-
initial conditions ensemble of 21 COSMO simulations (0.44∘) using the RCP8.5 scenario and covering the years 1950–2100;
-
a set of 13 ENSEMBLES simulations using the A1B scenario and covering the period 1971–2100;
-
a set of 15 CORDEX-11 simulations at 0.11∘ resolution (RCP8.5 and RCP4.5) covering the period 1970–2099;
-
a set of 17 (RCP4.5) and 19 (RCP8.5) CORDEX-44 simulations at 0.44∘ resolution covering the period 1970–2099.
Table 1 gives an overview of all experiments used in our study, including references. The fact that the data sets differ in several key aspects (e.g. resolution, time period covered, scenario used, complexity of the model) allows a comprehensive view of possible changes and sources of uncertainties.
A consistent analysis of the available data sources is hardly feasible, as the data stem from models with vastly different resolution and characteristics. All models suffer to some extent from biases. The variety of modelling approaches thereby implies significant model-to-model differences. For this reason, we focus on a fairly large catchment (where all models should arguably have at least some potential) and use a statistical approach (quantile mapping) to calibrate the simulation results against observations.
More specifically, the data are quantile mapped (Themessl et al., 2011; Gudmundsson et al., 2012; Teutschbein and Seibert, 2012; Räty et al., 2014) to observation-based time series representative of the average over the Aare catchment in Switzerland (see Fig. 1 for the stations; Fig. S1 in the Supplement shows the observation-based annual time series). Both data sets are used with daily resolution. The data and bias correction are described in detail in Rajczak et al. (2018a, b). The method has recently been used in other Swiss climate impact studies (Rajczak et al., 2016a) and is reasonably skilful in daily and multi-day precipitation diagnostics (Rajczak et al., 2016b). The transfer function depends on the season and is based on a 91-day moving window, centred over the day of the year (Themessl et al., 2012; Wilcke et al., 2013; Rajczak et al., 2016a, b). Values above the observed range of values are corrected according to percentile 99.9 (p99.9) in a constant manner (p1 and p99 in the case of temperature). Studies recommend such an implementation opposed to complex extrapolation methods (Gutjahr and Heinemann, 2013; Ivanov and Kotlarski, 2017; Themessl et al., 2012). Comparisons of raw and quantile-mapped data are shown in Fig. S2. Note that quantile mapping does affect mean temperature as well as temperature at the event day, which implies changes in saturation specific humidity. It is therefore important to also perform all analyses for the raw data.
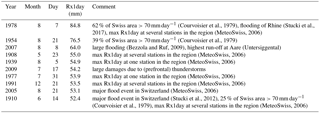
Table 2The largest 10 Rx1day events in the catchment-averaged observations sorted by their strength.
The analysis focuses on Rx1day, the maximum Rx1day per decade, annual mean temperature, temperature at the event day, and the day of year of the event. All analyses are applied to each individual simulation; only then are the ensemble statistics formed. No further weighting is performed for multi-model data sets, but for some analyses the simulations are separated into those exhibiting a drying or a wetting. We have performed all analyses for both the raw and quantile-mapped data. We refer to the raw data occasionally in the text; more comprehensive material is found in the Supplement. For our analyses the following approach is used.
- i.
We analyse long-term changes in Rx1day in each data set and compare them to the long-term changes in annual mean temperature as well as the trend in temperature at the event day. This gives an indication of the proximity of trends in precipitation changes to a Clausius–Clapeyron scaling.
- ii.
Changes in the seasonal cycle of temperature and event frequency (see below) are then addressed by partitioning the data sets into sub-periods. For simulations of past climate (CCC400), we partition the data from 1601–2000 into century chunks. For the present and future, for reasons of consistency, we show results only for the two 35-year periods 1971–2005 and 2065–2099, which are common to all model experiments. In the Supplement we also show results for all future simulations partitioned into three periods of equal length (four periods for the longer simulations CMIP5 and CCC400) to make full use of all data.
- iii.
Within the periods, we analyse the seasonal cycle of the relative frequency of Rx1day events as well as the seasonal cycle of temperature at the event day. The former indicates whether the seasonality of Rx1day events changes, which is likely to affect the temperature trend on event days. The latter takes this seasonality shift into account and indicates whether for a given calendar day temperature trends on event days differ from trends on all days. The annual cycle of temperature for all days and for event days is estimated by fitting the first two harmonics of the seasonal cycle.
- iv.
Finally, we address the dependence of Rx1day seasonality changes on background climate trends. This is performed for multi-model ensembles by stratifying the simulations within an ensemble according to their linear trend (obtained with least-squares regression) in annual or summer mean precipitation over the period 1971–2099. This allows addressing common signatures, e.g. whether drying models tend to show stronger changes in seasonality than wetting models.
Before analysing the statistics of Rx1day, a short description of typical Rx1day events at the catchment scale are provided. Figure S2 shows meteorological fields from the CERA20C reanalysis (Laloyaux et al., 2018) for the three strongest Rx1day events. The 10 strongest events are listed in Table 2, along with references. The typical catchment-scale Rx1day event is caused by the passage of a cold front related to an elongated trough or cut-off low situation with destabilisation and prefrontal convective activity. Rx1day situations are often also associated with convergence and lifting of moist air, originating from the Mediterranean region, north of the Alps in a Vb-type flow situation (see also Stucki et al., 2012; Messmer et al., 2015, 2017). The event in 1978 is a typical example (Courvoisier, 1979; Stucki et al., 2017), but the situations in many of the events listed in Table 2 were similar (Schmutz et al., 2008). Although models may not reproduce the flow deformation by the Alps as well as orographic enhancement of convection, they are assumed to reproduce the synoptic-scale processes such as frontal systems, moisture transport, and uplift.
Time series of Rx1day for the ensembles CCC400 (1600–2005) and CMIP5 (historical and RCP8.5, 1900–2100), the COSMO initial condition ensemble (RCP8.5, 1950–2100), the ENSEMBLES simulations (A1B, 1971–2100), CORDEX-11 (RCP8.5, 1970–2099), and CORDEX-44 (RCP8.5, 1970–2099) are shown in Fig. 2a. Over the past 400 years, no change in Rx1day is found (the same is true for past millennium simulations; Lehner et al., 2015, or the Twentieth Century Reanalysis 20CRv2c; Compo et al., 2011, included in Rajczak et al., 2018a, b; not shown). A slight increase in Rx1day over the past 50 years appears in CMIP5 (historical). Note that there are also indications at the continental to global scales that the majority of regional and global models tend to underestimate the observed intensification in heavy rainfall (Fischer and Knutti, 2016; Borodina et al., 2017). Simulations for the future show a clear increase in Rx1day of around 10 %–20 % in the ensemble mean. In the CMIP5 ensemble, the upper range of the ensemble shows a stronger increase than the mean.
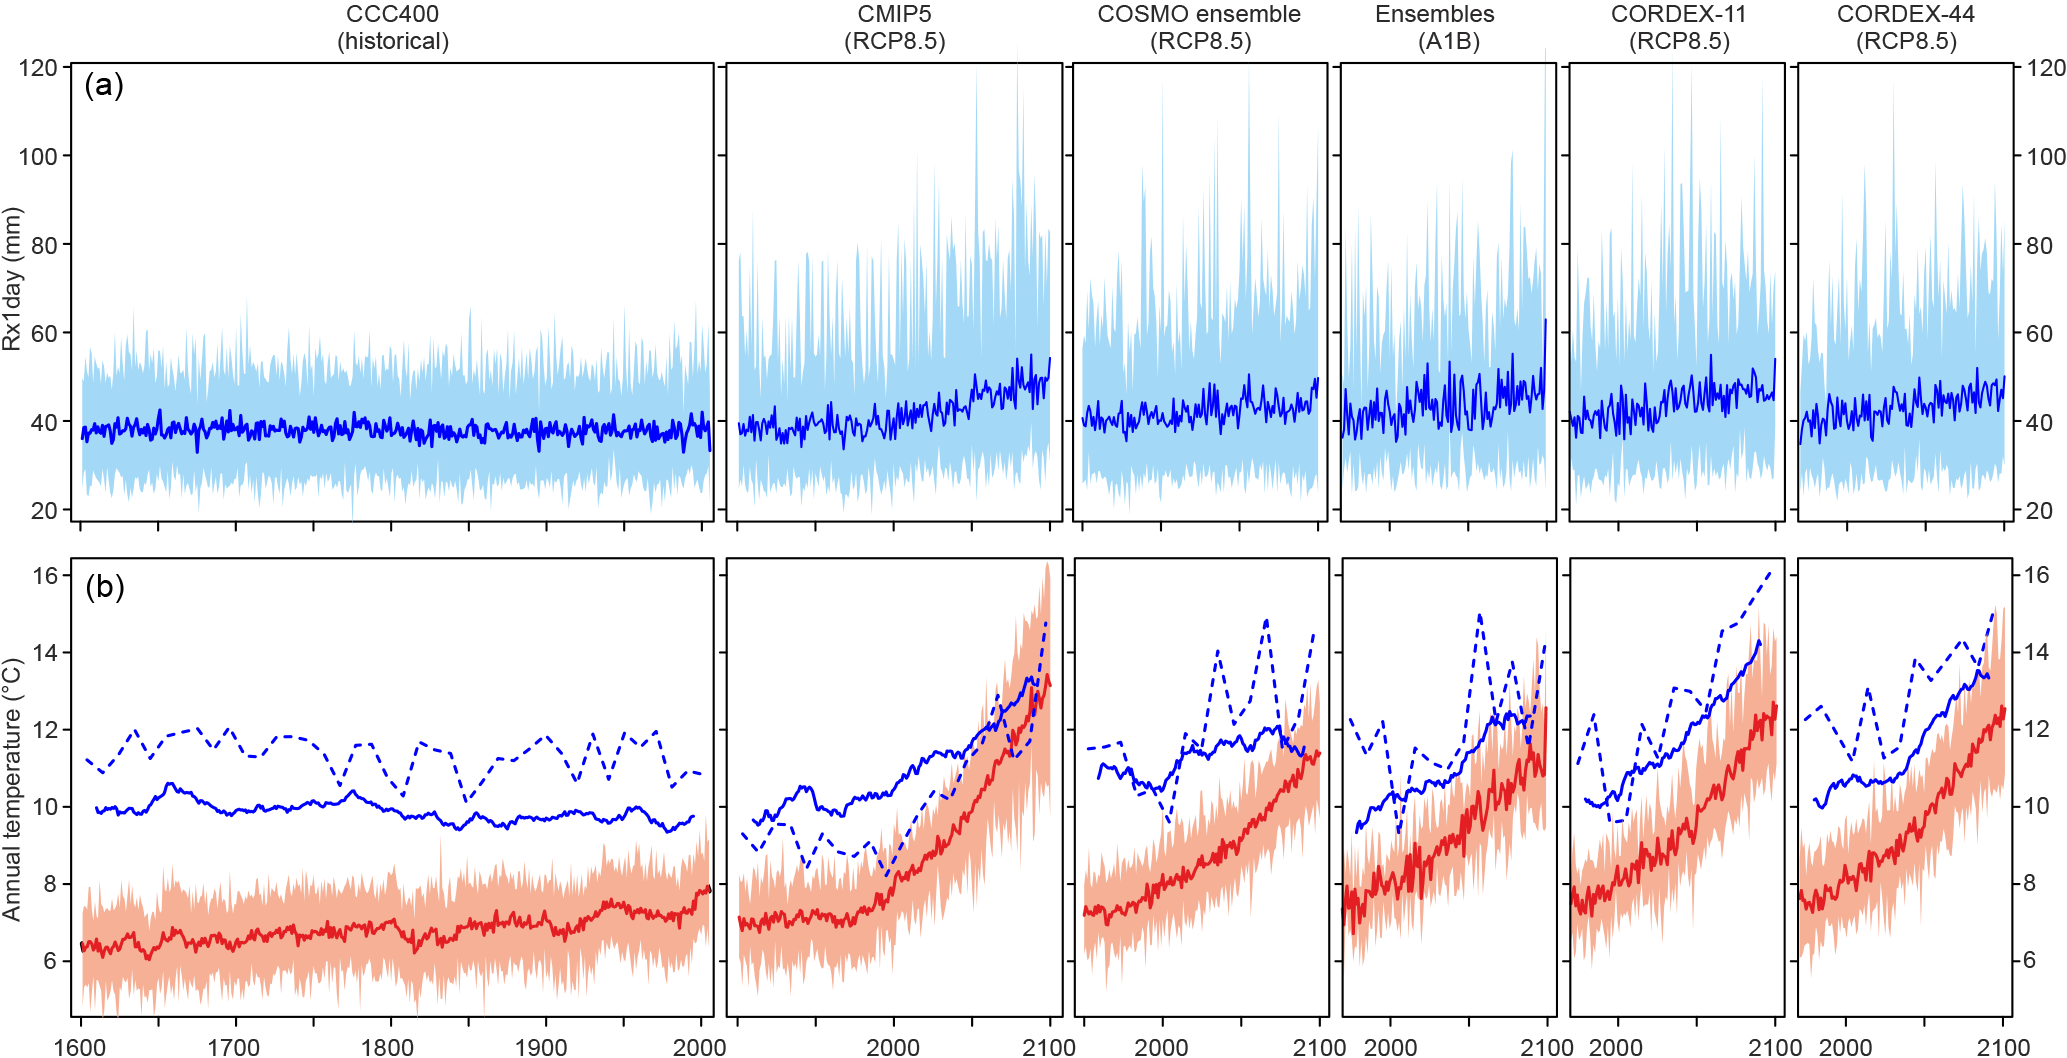
Figure 2Annual time series (ensemble mean as line and ensemble range as shading) of (a) Rx1day and (b) annual mean temperature (red) as well as the temperature during the Rx1day event (blue solid line, smoothed with a 20-year running average) in CCC400, CMIP5, and COSMO (quantile mapped). Also shown is the temperature at the highest Rx1day event per decade (blue dashed; ensemble mean).
Annual mean temperature (Fig. 2b, red line) shows a pronounced increase of 4–6 ∘C in the 21st century. According to the Clausius–Clapeyron relation, this would correspond to a 30 %–50 % increase in precipitation extremes, which is not the case. However, if we consider only the temperature on the day of the Rx1day precipitation events (Fig. 2b, full blue line; note that this time series is smoothed), we find a smaller temperature increase for most of the simulations. For the 21st century, the temperature increase during Rx1day events amounts to only 3 ∘C (CMIP5) or even just 1 ∘C (COMSO), but with considerable differences among experiments. Trends in Rx1day of 10 %–20 % thus approximately follow the Clausius–Clapeyron scaling. The same analyses for raw data give very similar results (shown in Fig. S2).
As already stated above, the Clausius–Clapeyron argument is expected to apply for the largest events but not for intermediate events and maybe not even for Rx1day events. Ban et al. (2015) analysed convection-resolving climate simulations at a resolution of 2 km and calculated the scaling rates as a function of all-day percentiles in the Alpine region for summer (see their Fig. 4e). In terms of percentiles, our Rx1day event class would correspond to roughly percentile 99.7, and at this event category the scaling estimate of Ban et al. (2015) amounts to about 1–3 % ∘C−1. This is roughly consistent with the results in Fig. 2 (when using mean temperature changes). Nevertheless, Ban et al. (2015) found that increases in precipitation intensity would approximately asymptote towards the Clausius–Clapeyron rate at very high percentiles.
The lower part of Fig. 2 also shows the same analysis for the temperature taken at the highest Rx1day per decade (dashed lines). Note that sample size here is very small except for CCC400 and CMIP. Interestingly, in CMIP5 temperatures during these events increase more strongly than for all Rx1day events. The trend resembles that of the annual mean.
Two factors can contribute to the fact that the temperature increase on Rx1day events is smaller than the increase in the annual mean: (1) a change in the occurrence frequency of Rx1day events towards a colder season or (2) a different change of the temperature on Rx1day events even for unchanged seasonality. We first analyse the latter. Considering the seasonal cycle of temperature during Rx1day events (Fig. 3, top row of panels), we find that in summer, Rx1day events in the present occur on days that are slightly colder than average, while those few Rx1day events that occur during the cold season occur with warmer-than-average conditions. This is evident in both observations (long black dashes) and model simulations. In the future, Rx1day events tend to occur on days that are even cooler than average, i.e. the trend on Rx1day events (the difference between 2065–2099 and 1971–2005 is shown on the right) is ca. 1 ∘C smaller than the trend on all days. This holds for all model ensembles, and the difference has no obvious seasonal cycle. Thus, part of the trend difference between Rx1day and all days is unrelated to the seasonality of Rx1day.
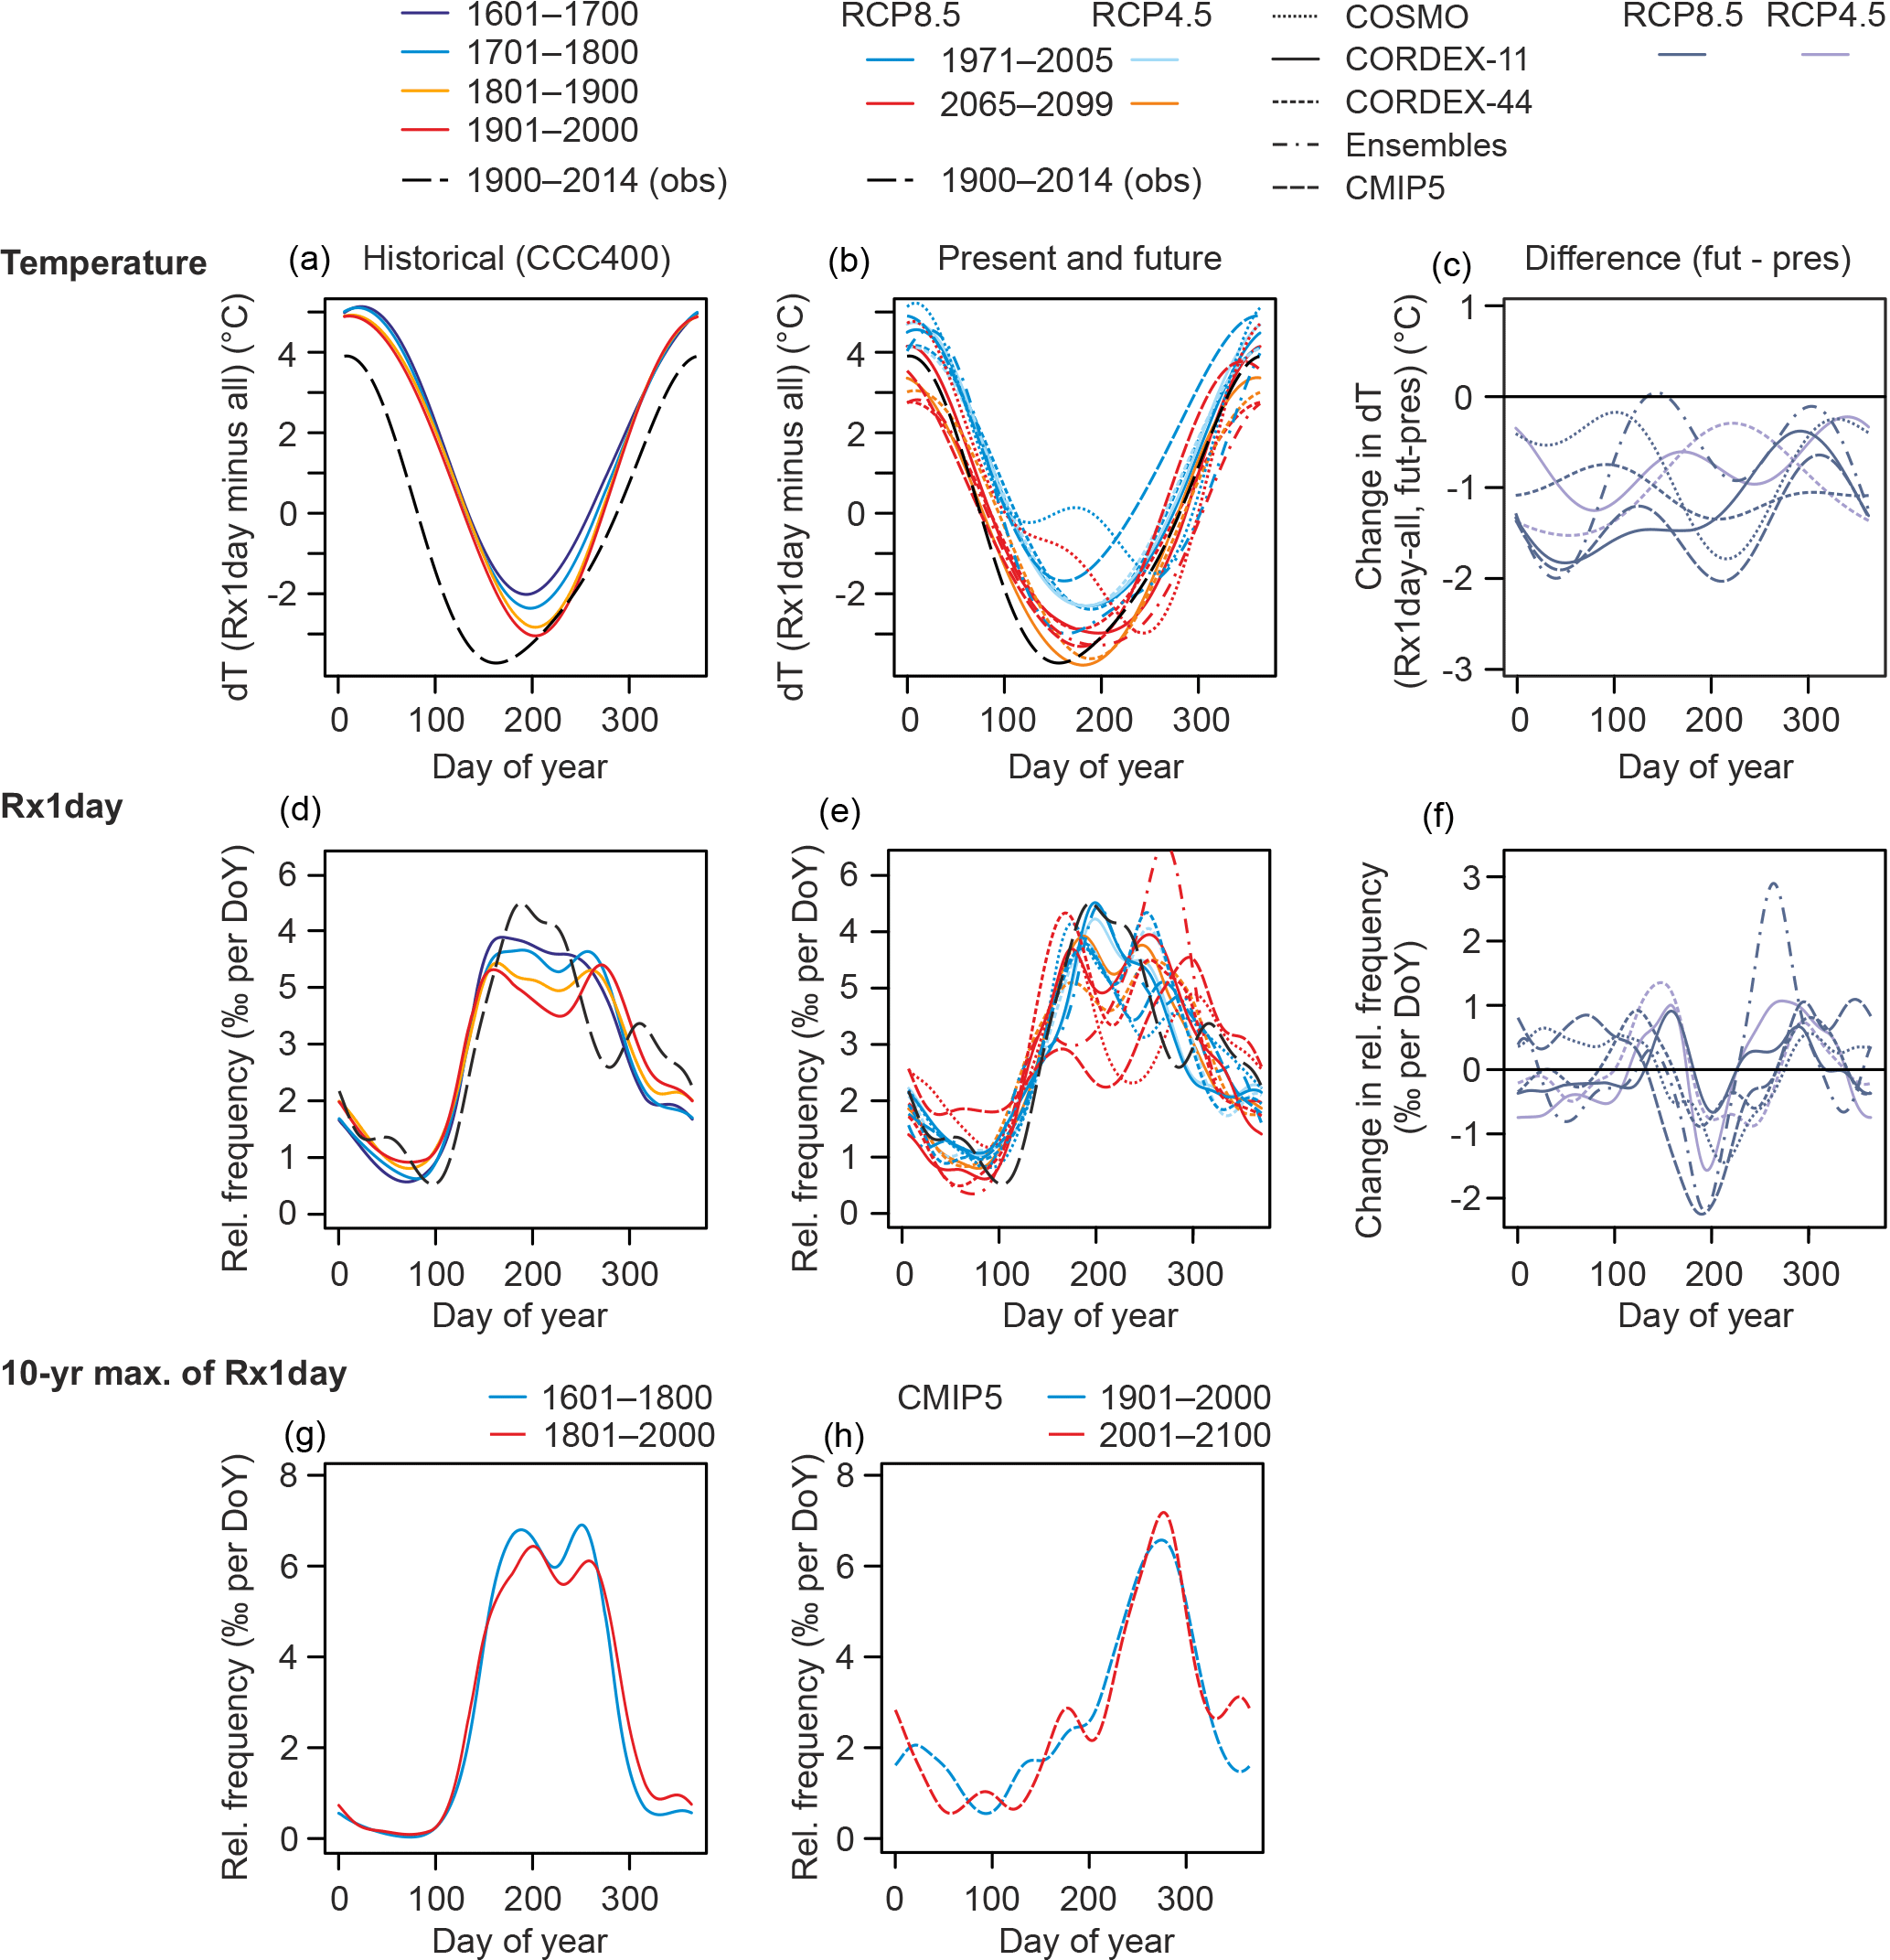
Figure 3(a–c) Temperature difference as a function of calendar day between event days (Rx1day) and all days for different time periods in CCC400 (a, d, g) and in model simulations of the present (1971–2005) and future (2065–2099) (b, e, h; c, f show the difference between the two periods). (d–f) Density plot of the day of occurrence of Rx1day events for different time periods in CCC400 (a, d, g) and in model simulations of the present (1971–2005) and future (2065–2099) (b, e, h; c, f show the difference between the two periods). (g, h) Same as the second row, but only for the highest Rx1day per decade. Note that only CCC400 and CMIP5 have sufficiently large ensembles, and longer time periods were chosen. All analyses are based on quantile-mapped data (see Fig. S3 for additional plots and Fig. S2 for the same analysis based on raw data). A Gaussian kernel smoother with a bandwidth of 15 days was used for plotting. Results from catchment-averaged observations are shown as long black dashes.
The day of occurrence of Rx1day (Fig. 3, second row panels) shows a broad summer peak in the observations. Several of the model simulations simulate two peaks, one in early summer (June) and one in early autumn (September). Both in the past (CCC400) and in the future, there is a trend towards fewer occurrences during June and July and more during the neighbouring months, i.e. both the early summer and the early autumn peaks shift towards the cold season. This becomes particularly clear when plotting the difference in relative frequency as a function of day of year between 2065–2099 and 1971–2005 (Fig. 3f) for each experiment. The midsummer events become rare; their occurrence already decreased by 10 % during the past 400 years and might further decrease by 30 % in the future. This shift in seasonality explains the remaining difference in temperature trends between Rx1day event days and all days.
As we use the periods 1971–2005 and 2065–2099, Fig. 3 (second row of panels) is based on 100 (left panels) or 35 (middle panels) values per ensemble member and results were then smoothed with a Gaussian kernel with a bandwidth of 15 days. In order to exploit the full data set, we also partitioned each data set into equally sized bins (Fig. S3) and found very similar results. Note also that the change in seasonality is not due to the quantile mapping but also appears in the raw data (see Fig. S2).
However, the above results depend on the rarity of events. When analysing rarer events, such as the highest Rx1day events per decade (Fig. 3, bottom panels; note that samples are large enough only for CCC400 and CMIP5; results for other experiments are shown in Fig. S3), we find a different result. These events are even more concentrated to midsummer than Rx1day in the present climate (the midsummer dip almost vanishes). In CCC400, their occurrence is high throughout the summer whereas in CMIP5 these are mostly early autumn events. Interestingly, there is no change in the frequency of occurrence over time. Hence, only moderately extreme events (with a frequency of once per year) are affected by a change in seasonality and not the more extreme events.

Figure 4Density plot of the day of occurrence of Rx1day for the present (1971–2005) and future (2065–2099) in the different multi-model ensembles (a, b). Panels (c, d) show the difference between future and present climate. Ensemble members are separated into those that show a positive or negative trend in annual mean (a, c) or summer mean (b, d) precipitation over the 1971–2099 period (see Fig. S4 for additional plots from other scenarios and different time periods).
What causes this change in seasonality? Given the limited number of variables at our disposition (temperature, precipitation), it is not possible to properly disentangle dynamical and thermodynamical contributions. However, analysing differences among the ensemble members gives important indications. Within ENSEMBLES, CORDEX-11, CORDEX-44, and CMIP5 the contributing ensemble members are grouped according to their trend in annual or summer mean precipitation (Fig. 4) and the analysis of the frequency of occurrence is repeated. Clear differences are found between ensemble simulations, which show a drying, and ensemble members with a positive trend in precipitation in summer and in the annual mean (Fig. 4), particularly in CMIP5 and CORDEX-44, less so in ENSEMBLES and CORDEX-11. The wetting ensemble members show hardly any change in seasonality or even an increased frequency in summer, while the drying members show a decrease in the frequency of occurrence of Rx1day events in midsummer. The inter-model variability is large as the samples get smaller, but the signature is robust across the entire data set (see Fig. S4).
Drying might also explain the changing seasonality in CCC400, as the ensemble mean shows decreasing precipitation over the past 400 years (Fig. S6). Note that a mis-specified trend in land-surface parameters might affect CCC400 (Rohrer et al., 2018). However, a simulation with corrected land surface shows the same change in seasonality (Fig. S3).
Heavy precipitation events (Rx1day) in the Aare catchment in the present climate are most frequent during the warm season. If all preconditions (atmospheric circulation, stability, soil moisture, etc.) are conducive to a heavy precipitation event, the intensity of the event is then expected to depend mainly on thermodynamics, i.e. on saturation specific humidity. It will thus follow a Clausius–Clapeyron scaling as a first-order approximation, often summarised as thermodynamic changes. In fact, trends in Rx1day over the Aare catchment do follow a Clausius–Clapeyron scaling, however not of annual mean temperature but rather of event day temperature. This is because Rx1day may also change due to dynamic changes; e.g. conducive conditions become less frequent and are not reached each summer. Such changes may relate to changes in the large-scale circulation patterns or enhanced atmospheric stability (e.g. Kröner et al., 2017), leading to reduced vertical updrafts (Pfahl et al., 2017).
In this respect, Rx1day and decadal-scale events exhibit a different behaviour in that the former show a change in seasonality while the latter do not. This discrepancy may be interpreted in the following way: decadal-scale precipitation extremes are mainly thermodynamically limited; i.e. chances are high that within a decade, conducive conditions occur on a late summer day, when temperatures and thus saturation specific humidity are highest. In the future, such conditions can still be reached in late summer once per decade, and thus the increase in temperature leads to an intensification of the most extreme events, with no apparent change in seasonality, consistent with Ban et al. (2015). However, on an annual scale such conditions are not reached every summer. Even in the present climate, Rx1day events do not occur most frequently at the warmest time of the year. This indicates that other factors (which we termed preconditions above) matter and Rx1day events are not fully thermodynamically limited. This tendency will strengthen in the future as preconditions change, leading to a change in seasonality. This result is consistent though more pronounced than identified by Pfahl et al. (2017), who found a change of Rx1day events towards lower saturation specific humidity over the northern extratropical land areas, indicating that the behaviour found in our analysis may be true for other extratropical land regions as well.
While we cannot disentangle the contributions of individual factors to the preconditions, we can identify drying as one if the important factors in models. Models that show a drying trend tend to exhibit a shift in the seasonal cycle of moderate extremes (Rx1day) away from late summer towards early summer and autumn, whereas the others do not.
A further result of our study is that even for a given calendar day, the future temperature trend in the models is smaller for Rx1day than for all days. A possible explanation, particularly for summer days, is model drying and thus excessive heating on non-precipitation days. In fact, stratifying the simulations according to their summer-mean precipitation trends indicates that drying simulations have a stronger cooling of event days relative to all days (Fig. S5).
The findings of our study – intensification of the most extreme events and change of seasonality for moderate extremes – is relevant for adapting to future climatic changes. This is particularly the case as observational coverage of the highest Rx1day per decade is limited. Whether or not the seasonality shift is a real effect or occurs due to artificial summer drying of the models remains to be studied. More detailed studies of the underlying processes, including stability and atmospheric circulation, during future extreme events are also required (e.g. Messmer et al., 2018).
Over the Alpine region moderate precipitation extremes such as characterized by Rx1day may not increase as much as expected from applying a Clausius–Clapeyron relation to the change in annual mean temperature due to a change in seasonality of Rx1day events and due to smaller-than-average temperature trends during event days (regardless of the season). Both reasons are due to the fact that moderate extreme events are not purely thermodynamically limited. In our study, we find that Rx1day events in a future climate tend to occur less frequently in midsummer but more often in spring and autumn. A similar change is also found over the past 400 years in model simulations. Further analyses show that mostly those models are concerned whose annual mean or summer mean precipitation decreases; i.e. the changing seasonality is in part due to drying. Conversely, 10-year events do also exhibit their highest frequency in midsummer in the future, with no apparent change in seasonality.
For flood protection this means that moderate events might shift towards the cold season with only a small change in intensity, but the more relevant extreme events such as those with 10-year return period remain in summer and increase strongly in intensity.
All data are published (Rajczak et al., 2018a) and can be downloaded from https://doi.pangaea.de/10.1594/PANGAEA.886881.
The supplement related to this article is available online at: https://doi.org/10.5194/nhess-18-2047-2018-supplement.
The authors declare that they have no conflict of interest.
This work was funded by the Swiss Federal Office for the Environment (FOEN),
the Swiss Federal Office of Energy (SFOE), and the Swiss Federal Nuclear
Safety Inspectorate (ENSI) in the framework of the project EXAR: Understanding
Extreme Flooding Events Aare-Rhein in Switzerland as well as by the Swiss
National Science Foundation (project 200021_143219
“EXTRA-LARGE”). We acknowledge the World Climate Research Programme's
Working Group on Regional Climate and the Working Group on Coupled
Modelling, former coordinating body of CORDEX and responsible panel for
CMIP5. We also thank the climate modelling groups (listed in Table S1 of this
paper) for producing and making available their model output. We also
acknowledge the Earth System Grid Federation infrastructure, an international
effort led by the U.S. Department of Energy's Program for Climate Model
Diagnosis and Intercomparison, the European Network for Earth System
Modelling, and other partners in the Global Organisation for Earth System
Science Portals (GO-ESSP). Computation facilities for the CCC400 simulations were
provided by the Swiss National Supercomputing Centre (CSCS). The Twentieth
Century Reanalysis Project is supported by the U.S. Department of Energy (DOE)
Office of Science Innovative and Novel Computational Impact on Theory
and Experiment (INCITE) program, the Office of Biological and Environmental
Research (BER), and the National Oceanic and Atmospheric Administration
Climate Program Office.
Edited by: Ricardo Trigo
Reviewed by: two anonymous referees
Allen, M. R. and Ingram, W. J.: Constraints on future changes in climate and the hydrologic cycle, Nature, 419, 224–232, 2002.
Ban, N., Schmidli, J., and Schär, C.: Evaluation of the convection-resolving regional climate modelling approach in decade-long simulations, J. Geophys. Res.-Atmos., 119, 7889–7907, https://doi.org/10.1002/2014JD021478, 2014.
Ban, N., Schmidli, J., and Schär, C.: Heavy precipitation in a changing climate: Does short-term summer precipitation increase faster?, Geophys. Res. Lett., 42, 1165–1172, https://doi.org/10.1002/2014GL062588, 2015.
Bezzola, G. R. and Ruf, W. (Edd.): Ereignisanalyse Hochwasser August 2007, in: Analyse der Meteo- und Abflussvorhersagen; vertiefte Analyse der Hochwasserregulierung der Jurarandgewässer, Umwelt-Wissen Nr. 0927, Bundesamt für Umwelt, Bern, 209 pp., 2009.
Bhend, J., Franke, J., Folini, D., Wild, M., and Brönnimann, S.: An ensemble-based approach to climate reconstructions, Clim. Past, 8, 963–976, https://doi.org/10.5194/cp-8-963-2012, 2012.
Borodina, A., Fischer, E. M., and Knutti, R.: Models are likely to underestimate increase in heavy rainfall in the extratropical regions with high rainfall intensity, Geophys. Res. Lett., 44, 7401–7409, 2017.
Compo, G. P., Whitaker, J. S., Sardeshmukh, P. D., Matsui, N., Allan, R. J., Yin, X., Gleason, B. E., Vose, R. S., Rutledge, G., Bessemoulin, P., Brönnimann, S., Brunet, M., Crouthamel, R. I., Grant, A. N., Groisman, P. Y., Jones, P. D., Kruk, M. C., Kruger, A. C., Marshall, G. J., Maugeri, M., Mok, H. Y., Nordli, Ø., Ross, T. F., Trigo, R. M., Wang, X. L., Woodruff, S. D., and Worley, S. J.: The Twentieth Century Reanalysis Project, Q. J. Roy. Meteorol. Soc., 137, 1–28, 2011.
Courvoisier, H. W., Gensler, G. A., Primault, B., and Roesli, H. P.: Das Unwetter vom 7./8. August 1978 in der Schweiz, Arbeitsberichte der Schweizerischen Meteorologischen Zentralanstalt Nr. 85, MeteoSchweiz, Zurich, 1979.
Fischer, E. M. and Knutti, R.: Anthropogenic contribution to global occurrence of heavy-precipitation and high-temperature extremes, Nat. Clim. Change, 5, 560–564, 2015.
Fischer, E. M. and Knutti, R.: Observed heavy precipitation increase confirms theory and early models, Nat. Clim. Change, 6, 986–991, 2016.
Giorgi, F., Torma, C, Coppola, E., Ban, N., Schär, C., and Somot, S.: Enhanced summer convective rainfall at Alpine high elevations in response to climate warming, Nat. Geosci., 9, 584–589, 2016.
Gudmundsson, L., Bremnes, J. B., Haugen, J. E., and Engen-Skaugen, T.: Technical Note: Downscaling RCM precipitation to the station scale using statistical transformations – a comparison of methods, Hydrol. Earth Syst. Sci., 16, 3383–3390, https://doi.org/10.5194/hess-16-3383-2012, 2012.
Gutjahr, O. and Heinemann, G.: Comparing precipitation bias correction methods for high-resolution regional climate simulations using COSMO-CLM, Theor. Appl. Climatol., 114, 511–529, https://doi.org/10.1007/s00704-013-0834-z, 2013.
Ivanov, M. and Kotlarski, S.: Assessing distribution-based climate model bias correction methods over an alpine domain: added value and limitations, Int. J. Climatol., 37, 2633–2653, https://doi.org/10.1002/joc.4870, 2016.
Jacob, D., Petersen, J., Eggert, B., Alias, A., Christensen, O. B., Bouwer, L. M., Braun, A., Colette, A., Déqué, M., Georgievski, G., Georgopoulou, E., Gobiet, A., Menut, L., Nikulin, G., Haensler, A., Hempelmann, N., Jones, C., Keuler, K., Kovats, S., Kröner, N., Kotlarski, S., Kriegsmann, A., Martin, E., van Meijgaard, E., Moseley, C., Pfeifer, S., Preuschmann, S., Radermacher, C., Radtke, K., Rechid, D., Rounsevell, M., Samuelsson, P., Somot, S., Soussana, J.-F., Teichmann, C., Valentini, R., Vautard, R., Weber, B., and Yiou, P.: EURO-CORDEX: new high-resolution climate change projections for European impact research, Reg. Environm. Change, 14, 563–578, 2014.
Kotlarski, S., Keuler, K., Christensen, O. B., Colette, A., Déqué, M., Gobiet, A., Goergen, K., Jacob, D., Lüthi, D., van Meijgaard, E., Nikulin, G., Schär, C., Teichmann, C., Vautard, R., Warrach-Sagi, K., and Wulfmeyer, V.: Regional climate modeling on European scales: a joint standard evaluation of the EURO-CORDEX RCM ensemble, Geosci. Model Dev., 7, 1297–1333, https://doi.org/10.5194/gmd-7-1297-2014, 2014.
Kröner, N., Kotlarski, S., Fischer, E., Lüthi, D., Zubler, E., and Schär, C.: Separating climate change signals into thermodynamic, lapse-rate and circulation effects: theory and application to the European summer climate, Clim. Dynam., 48, 3425–3440, 2017.
Laloyaux, P., de Boisseson, E., Balmaseda, M., Bidlot, J.-R., Brönnimann, S., Buizza, R., Dalhgren, P., Dee, D., Haimberger, L., Hersbach, H., Kosaka, Y., Martin, M., Poli, P., Rayner, N., Rustemeier, E., and Schepers, D.: CERA-20C: A coupled reanalysis of the Twentieth Century, J. Adv. Model. Earth Syst., 10, 1172–1195, https://doi.org/10.1029/2018MS001273, 2018.
Lehner, F., Joos, F., Raible, C. C., Mignot, J., Born, A., Keller, K. M., and Stocker, T. F.: Climate and carbon cycle dynamics in a CESM simulation from 850 to 2100 CE, Earth Syst. Dynam., 6, 411–434, https://doi.org/10.5194/esd-6-411-2015, 2015.
Messmer, M., Gómez-Navarro, J. J., and Raible, C. C.: Climatology of Vb cyclones, physical mechanisms and their impact on extreme precipitation over Central Europe, Earth Syst. Dynam., 6, 541–553, https://doi.org/10.5194/esd-6-541-2015, 2015.
Messmer, M., Gómez-Navarro, J. J., and Raible, C. C.: Sensitivity experiments on the response of Vb cyclones to sea surface temperature and soil moisture changes, Earth Syst. Dynam., 8, 477–493, https://doi.org/10.5194/esd-8-477-2017, 2017.
Messmer, M., Gomez-Navarro, J. J., and Raible, C. C.: The Impact of Climate Change on the Climatology of Vb-Cyclones, Tellus, submitted, 2018.
MeteoSwiss: Starkniederschlagsereignis August 2005, Arbeitsberichte der MeteoSchweiz 211, Zurich, 63 pp., 2006.
Pendergrass, A. G.: What precipitation is extreme?, Science, 360, 1072–1073, 2018.
Pfahl, S., O'Gormann, P. A., and Fischer, E. M.: Understanding the regional pattern of projected future changes in extreme precipitation, Nat. Geosci., 7, 423–427, 2017.
Prein, A. F., Langhans, W., Fosser, G., Ferrone, A., Ban, N., Goergen, K., Keller, M., Tölle, M., Gutjahr, O., Feser, F., Brisson, E., Kollet, S., Schmidli, J., van Lipzig, N. P. M., and Leung, R.: A review on regional convection-permitting climate modeling: Demonstrations, prospects, and challenges, Rev. Geophys., 53, 323–361, https://doi.org/10.1002/2014RG000475, 2015.
Rajczak, J., Kotlarski, S., and Schär, C.: Does quantile mapping of simulated precipitation correct for biases in transition probabilities?, J. Climate, 29, 1605–1615, https://doi.org/10.1175/JCLI-D-15-0162.1, 2016a.
Rajczak, J., Kotlarski, S., Salzmann, N., and Schär, C.: Robust climate scenarios for sites with sparse observations: A two-step bias correction approach, Int. J. Climatol., 36, 1226–1243, https://doi.org/10.1002/joc.4417, 2016b.
Rajczak, J., Brönnimann, S., Fischer, E. M., Raible, C. C., Rohrer, M., and Schär, C.: Daily precipitation and temperature time series from multiple climate model simulations for the Aare river catchment (Switzerland), Eidgenössische Technische Hochschule Zürich, PANGAEA, https://doi.org/10.1594/PANGAEA.886881, 2018a.
Rajczak, J., Brönniman, S., Fischer, E. M., Raible, C. C., Rohrer, M., Sørland, S. L., and Schär, C.: Daily precipitation and temperature series from multiple climate model simulations for the Aare river catchment in Switzerland, submitted, 2018b.
Räty, O., Räisänen, J., and Ylhäisi, J.: Evaluation of delta change and bias correction methods for future daily precipitation: intermodel cross-validation using ENSEMBLES simulations, Clim. Dynam., 42, 2287–2303, https://doi.org/10.1007/s00382-014-2130-8, 2014.
Rohrer, M., Brönnimann, S., Martius, O., Raible, C. C., Wild, M., and Compo, C. P.: Representation of extratropical cyclones, blocking anticyclones, and Alpine circulation types in multiple reanalyses and model simulations, J. Climate, 31, 3001–3031, https://doi.org/10.1175/JCLI-D-17-0350.1, 2018.
Schär, C., Ban, N., Fischer, E. M., Rajczak, J., Schmidli, J., Frei, C., Giorgi, F., Karl, T. R., Kendon, E. J., Klein Tank, A. M. G., O'Gorman, P. A., Sillmann, J., Zhang, X., and Zwiers, F. W.: Percentile indices for assessing changes in heavy precipitation events, Climatic Change, 137, 201–216, https://doi.org/10.1007/s10584-016-1669-2, 2016.
Scherrer, S. C., Fischer, E. M., Posselt, R., Liniger, M. A., Croci-Maspoli, M., and Knutti, R.: Emerging trends in heavy precipitation and hot temperature extremes in Switzerland, J. Geophys. Res.-Atmos., 121, 2626–2637, https://doi.org/10.1002/2015JD024634, 2016.
Schmutz, C., Arpagaus, M., Clementi, L., Frei, C., Fukutome, S., Germann, U., Liniger, M., and Schacher, F.: Meteorologische Ereignisanalyse des Hochwassers 8. bis 9. August 2007, Arbeitsberichte der MeteoSchweiz 222, MeteoSchweiz, Zurich, 30 pp., 2008.
Stucki, P., Rickli, R., Brönnimann, S., Martius, O., Wanner, H., Grebner, D., and Luterbacher, J.: Five weather patterns and specific precursors characterize extreme floods in Switzerland, Meteorol. Z., 21, 531–550, 2012.
Stucki, P., Baumann, A., and Bucher, D.: The 1978 Heavy Precipitation and Flood Event in Switzerland, in: Historical Weather Extremes in Reanalyses, edited by: Brönnimann, S., Geographica Bernensia G92, Bern, 69–80, https://doi.org/10.4480/GB2017.G92.06, 2017.
Taylor, K. E., Stouffer, R. J., and Meehl, G. A.: An Overview of CMIP5 and the Experiment Design, B. Am. Meteorol. Soc., 93, 485–498, https://doi.org/10.1175/BAMS-D-11-00094.1, 2012.
Teutschbein, C.,and Seibert, J.: Bias correction of regional climate model simulations for hydrological climate-change impact studies: Review and evaluation of different methods, J. Hydrol., 456–457, 12–29, 2012.
Themessl, M., Gobiet, A., and Leuprecht, A.: Empirical-statistical downscaling and error correction of daily precipitation from regional climate models, Int. J. Climatol., 31, 1530–1544, 2011.
Themessl, M., Gobiet, A., and Leuprecht, A.: Empirical-statistical downscaling and error correction of regional climate models and its impact on the climate change signal, Climatic Change, 112, 449–486, https://doi.org/10.1007/s10584-011-0224-4, 2012.
Van Bebber, W.: Die Zugstrassen der barometrischen Minima nach den Bahnenkarten der deutschen Seewarte für den Zeitraum 1875–1890, Meteorol. Z., 8, 361–366, 1891.
Van der Linden, P. and Mitchell, J. F. B.: ENSEMBLES: Climate change and its impacts: Summary of research and results from the ENSEMBLES Project, MetOffice Hadley Centre, Exeter, UK, 2009.
Wilcke, R. A. I., Mendlik, T., and Gobiet, A.: Multi-variable error correction of regional climate models, Climatic Change, 120, 871–887, https://doi.org/10.1007/s10584-013-0845-x, 2013.
Zhang, X., Zwiers, F. W., Li, G., Wan, H., and Cannon, A. J.: Complexity in estimating past and future extreme short-duration rainfall, Nat. Geosci., 10, 255–259, 2017.