the Creative Commons Attribution 4.0 License.
the Creative Commons Attribution 4.0 License.
 | 27 Feb 2026
First mapping of a tsunami wavefield by SWOT satellite: observation data and preliminary numerical simulation of the 19 May 2023 tsunami near the Loyalty Islands
Yannice Faugère
Hélène Hébert
Antoine Delepoulle
Gérald Dibarboure
The NASA-CNES altimetry mission SWOT (Surface Water and Ocean Topography) deployed in December 2022 embarks a Ka-band Radar Interferometer (KaRIn), providing a 120 km-wide swath sea level measurement. On 19 May 2023, SWOT was able to record a 2D signature of the tsunami generated by the Mw 7.7 earthquake southeast of the Loyalty Islands (southwest Pacific Ocean), about 1 h after the earthquake, on a straight SSW-NNE path. Comparison between numerical models and real measurements was performed to assess SWOT's ability to monitor tsunami waves. A uniform coseismic slip rupture model allows to satisfactorily fit the regional observations. Testing models against a dynamic representation of the tsunami wavefield (instead of static) show a good phase agreement, but simulated amplitudes are lower than the measurements. However, this SWOT unprecedented 2D observation critically inform on tsunami propagation and modelling, and offer a breakthrough perspective for better predictions.
- Article
(6392 KB) - Full-text XML
- BibTeX
- EndNote


The probability of detecting a tsunami with a satellite altimeter is low, since the satellite must orbit, by chance and within a few minutes, over the propagating tsunami wavefield, taking into account tsunami propagation speed and direction, and waves dispersion. However, several cases have been reported in the literature: the first observation of a tsunami propagating at the surface of the oceans using satellite altimetry was performed by TOPEX which measured the tsunami triggered by the 1992 Mw 7.6 earthquake in Nicaragua (Okal et al., 1999). But it is only with the 2004 Indian Ocean tsunami that satellite altimetry data provided useful additional information about tsunami propagation and amplitudes (Ablain et al., 2006; Hayashi, 2008; Wang and Liu, 2006; Gower, 2007; Godin et al., 2009). In that specific case the resulting large tsunami amplitude induced clear signal visible on both satellite and tide gauge records throughout the Indian Ocean. It was the first tsunami to be detected very clearly in the sea level anomaly derived from altimeter measurements from 4 satellites crossing its wavefront (TOPEX, Jason-1, Envisat and GFO; Gower, 2007). With such a rich constellation, the separation of the tsunami signal from the oceanic variability was possible. The maximum wave amplitude observed in the deep ocean was about 60 cm on 3 different satellite tracks 2 h after the earthquake occurrence. This unprecedented record allowed the recovery of a seismic rupture slip model based on a single inversion of offshore tsunami data, which was very consistent with models obtained from seismic and geodetic data (Sladen and Hébert, 2008). Other signals at small wavelength (20–40 km) but strong amplitude (20–25 cm) were discovered in the full rate altimetry dataset (600 m posting for TOPEX and 300 m for Jason and Envisat). These signals, in agreement with the theory of tsunami wave propagation, were not seen in the numerical model outputs, demonstrating again the high value of altimetry information. More recently, altimetry analyses were also performed in the case of the 2010 Chile (Hamlington et al., 2011) and 2011 Tohoku (Hamlington et al., 2012) tsunamis. Finally, in January 2022, the tsunami generated by the eruption of the Hunga Tonga–Hunga Ha'apai submarine volcano in Tonga (southern Pacific Ocean) was measured by various in situ, airborne and space platforms (e.g., Shrivastava et al., 2023) including the Chinese altimeter satellite HY2B which recorded, 1 h after the eruption, a 20 cm amplitude tsunami signal on a track between the Kermadec and Samoa Islands (Faugère et al., 2022). The oceanic variability processing was necessary to refine the interpretation.
On 16 December 2022 a new satellite, named SWOT for Surface Water Ocean Topography, was deployed as a result of a collaboration between NASA and CNES, the US and French Space Agencies, respectively, in cooperation with the United Kingdom and Canadian Space Agencies (UKSA and CSA, respectively; Vaze et al., 2018). The SWOT satellite has completed the international altimetry constellation, equipped with an innovative feature compared with its predecessors: the wide swath. The mission's objective is to make the first global survey of Earth's water surfaces: ocean surface topography, inland water heights, river discharge, etc. (Morrow et al., 2019; Fu and Rodriguez, 2004). To achieve this goal, the main instrument of the SWOT mission is a Ka-band interferometer (KaRIn) that delivers a bi-dimensional (2D) view of the water surface topography. To meet its requirement, the interferometer requires an extremely precise attitude and orbit control system (AOCS), as well as the full suite of “conventional” altimetry payload: a Nadir altimeter (POSEIDON-3C, TOPEX/Jason class), precise orbit determination sensors (DORIS positioning system, precise Global Navigation Satellite System, laser reflector array) and a microwave radiometer (to correct for the wet troposphere path delay). The two important SWOT features over the ocean are (1) its ability to provide a synoptic 2D view of the ocean surface without interpolation, and (2) its high precision (vertical accuracy of several cm and down to 1 km of spatial resolution over oceanic surfaces; Archer et al., 2025). This combination makes it possible to capture many ocean features such as mesoscale or internal waves, as small as a few kilometers, including the wavelength range of tsunami waves. Fu et al. (2024) illustrate the breakthrough provided by SWOT during its first months of operations.
Today the SWOT satellite provides global coverage up to a latitude of ±78° with an exact repeat orbit of 21 d. However, SWOT was first operated on a 1 d repeat orbit from April to July 2023, for calibration and validation purposes. Validation phase ended in spring 2024 with the conclusion that SWOT is meeting its requirements (Dibarboure et al., 2025). Peral et al. (2024) provide an in-depth review of the good behavior of the KaRIn instrument and preliminary analyses report a nominal behavior of the product quality (Raynal et al., 2023; Bohé, 2023; Chen, 2023; Fjørtoft et al., 2024). During this phase, it provided not only the first 2D water surface topography of all water surfaces, but also the first daily revisit of topography by any satellite altimeter mission. The high temporal revisit implies very sparse spatial sampling, which makes it all the more incredible how fortunate it was to capture the specific tsunami signature presented herein.
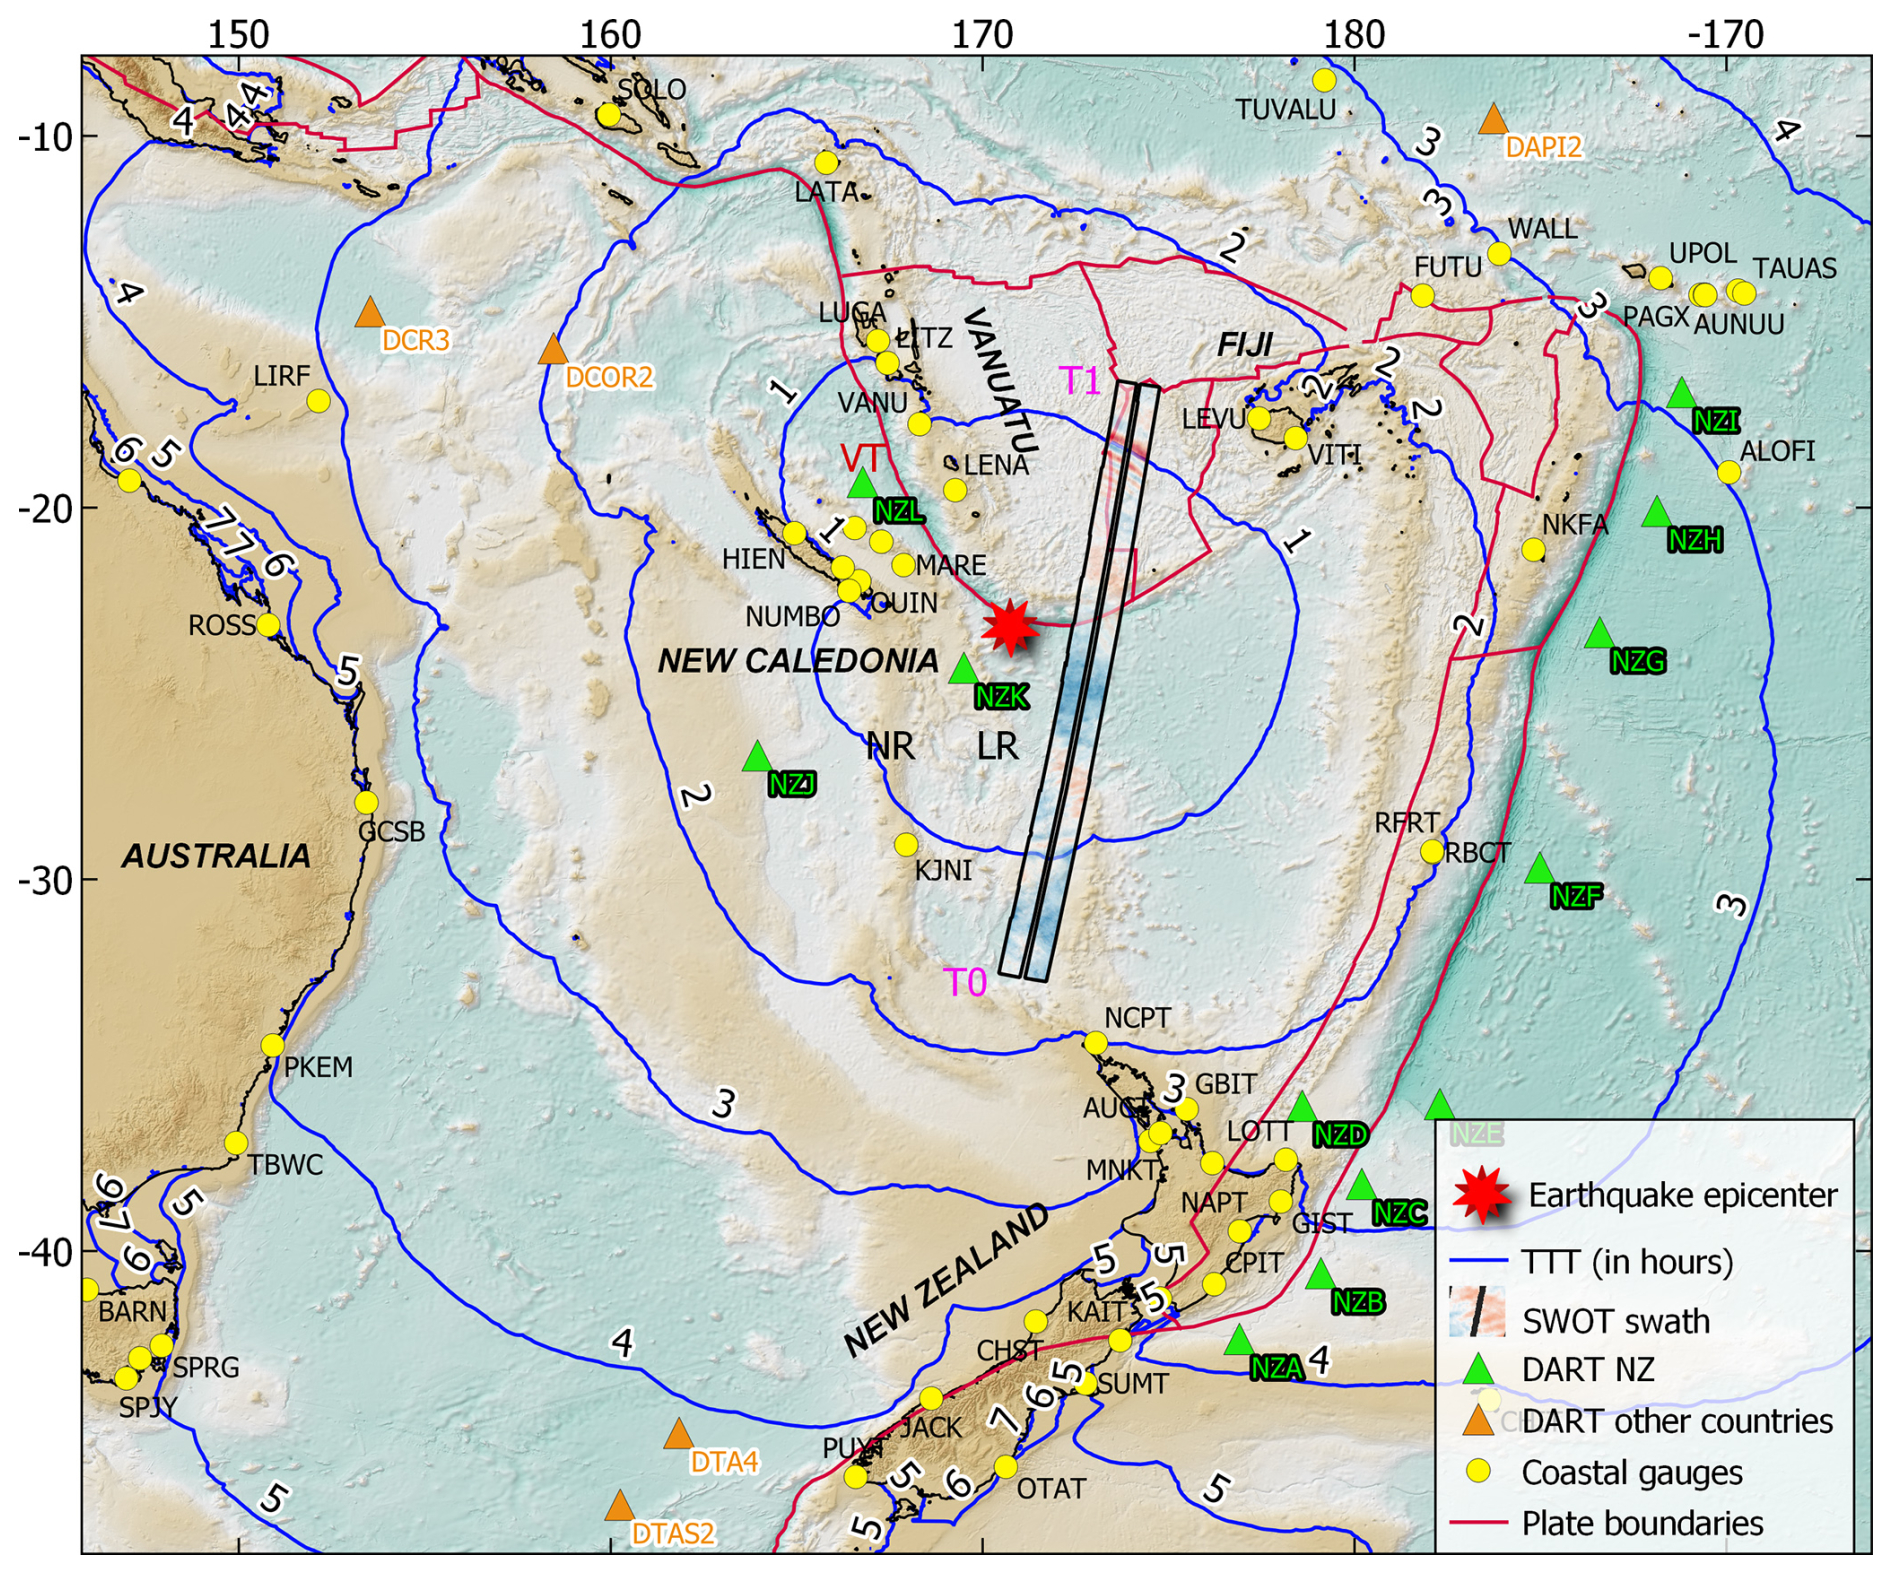
Figure 1The 19 May 2023 Mw 7.7 earthquake and tsunami. Tsunami travel times from the epicenter were calculated using Mirone software (Luis, 2007). The coloured band symbolizes the swath track of the SWOT satellite dataset presented herein with T0 and T1 symbolizing the start and end time of the swath. VT: Vanuatu Trench; LR: Loyalty Ridge; NR: Norfolk Ridge. Background topography is from GEBCO (GEBCO Bathymetric Compilation Group 2023, 2023).
On 19 May 2023 at 02:57:03 UTC (Te hereafter), a magnitude Mw 7.7 earthquake occurred in the south of the Vanuatu Subduction Zone (VSZ), ∼ 100 km southwest of Matthew Island and ∼ 320 km southeast of Maré Island, Loyalty Archipelago (Fig. 1). The different published focal mechanism solutions show a strongly non-double couple normal fault rupture, located on the plunging Australian plate, on the outer-rise of the VSZ (Roger et al., 2025). The earthquake epicenter showing a relatively shallow depth (∼ 18 km; https://earthquake.usgs.gov/earthquakes/eventpage/us6000kd0n/executive, last access: 26 February 2026), the seismic rupture implying a significant vertical motion of the sea bottom triggered a tsunami recorded first on the tide gauge located in Tadine Harbour, Maré Island. It was then progressively recorded on many other coastal and deep-ocean sensors of the southwest Pacific Region, including the DART systems (Deep-ocean Assessment and Reporting of Tsunamis; e.g., Meinig et al., 2001) of the recently deployed New Zealand network (Power et al., 2018), as far as New Zealand, Tonga or Tasmania (Robert et al., 2025; Roger et al, 2025).
The SWOT satellite flew over the region around 04:00 UTC, approximately 1 h after the earthquake occurred, capturing the tsunami signature along a SSW-NNE pathway between 30 and 17° S of latitude. This synchronized overflight was highly improbable, given the infrequency, propagation speed, and dispersion of these events, especially in the deep ocean, as it is the case for all of the tsunamis recorded via altimetric missions. However, since the SWOT satellite deployment, at least one seiche (Monahan et al., 2025) and three tsunamis have been recorded, including the Loyalty Islands tsunami, the tsunami triggered by the 2 May 2025 Mw 7.4 earthquake having occurred within the Drake Passage (south of Patagonia, Chile: https://www.aviso.altimetry.fr/en/missions/current-missions/swot/portfolio-of-swot-first-results/tsunami-waves-observed-by-swot-for-the-second-time.html, last access: 26 February 2026) and the tsunami triggered by the 30 July 2025 Mw 8.8 earthquake offshore Kamchatka Peninsula (Russia: https://www.aviso.altimetry.fr/en/missions/current-missions/swot/portfolio-of-swot-first-results/a-third-tsunami-observed-by-swot-due-to-kamchatka-earthquake.html, last access: 26 February 2026). We will only focus on the 2023 Loyalty Islands tsunami in the rest of this article.
Numerical simulation of tsunami has been performed using COMCOT (Cornell Multi-grid Coupled Tsunami model), a robust modelling code tested and widely applied to numerous tsunami studies for about four decades (e.g. Liu et al., 1995; Wang and Power, 2011; Wang et al., 2020; Roger et al., 2023; Roger and Wang, 2023). It computes tsunami generation, propagation and coastal interaction by solving both linear and nonlinear shallow water equations using a modified explicit leap-frog finite difference scheme and considering the weak dispersion effect (Wang, 2008). The initial sea surface deformation is calculated using the Okada (1985)'s formulae with the fault plane geometry and either a uniform or non-uniform slip distribution. Water surface elevation and horizontal velocities are calculated respectively at the cell center and at the edge centers of each grid cell of the computational domain. Absorbing boundary schemes are used at the boundaries of the computational domain to dampen the incoming waves, avoiding reflection from the grid boundaries.
For the purpose of the present study, numerical simulation of tsunami generation and propagation have been computed over a 15 arcsec-resolution grid covering the southwest Pacific Region using GEBCO (GEBCO Bathymetric Compilation Group 2023, 2023) 15 arcsec-resolution dataset. A simulated propagation time of 3 h includes the passage of the satellite over the region. This resolution is considered sufficient at first order to simulate a tsunami in the deep ocean and compare the results with SWOT records.
The selected source for the tsunami generation is coming from the analysis done by Roger et al. (2025). It is a GCMT-based scenario (Global Centroid Moment Tensor project; Dziewonski et al., 1981; Ekström et al., 2012) showing the best fit in terms of wave phase and amplitude and arrival time between the simulated and real recorded waveforms at DART systems and coastal gauges location. The parameters of this scenario are based on the GCMT focal mechanism solution with hypocentral longitude, latitude and depth being 170.89°, −23.35° and 20.4 km, respectively. The selected nodal plane is the one showing strike = 274°, dip = 47° and rake = −71°. Empirical relationships from Strasser et al. (2010) and Wells and Coppersmith (1994) were used to calculate a 95 km-length and 48 km-width fault plane, as well as a 1.7 m-coseismic slip.
On 19 May 2023, SWOT flew over the area disturbed by the tsunami waves from the southwest to the northeast exactly between 03:59 and 04:02 UTC. This corresponds to pass number 17 of cycle number 525 of the SWOT satellite. SWOT Products derived from both SWOT KaRIn and Nadir measurements from 18 May 2023 (pass 17 of cycle 524 – before the tsunami – and 525 – during the tsunami) have been used. Unfortunately, no measurement is available the next day due to a platform anomaly. The area captured during this time is shown on Fig. 1.
Additionally, 7 Nadir altimeter satellites, namely Sentinel 6 MF, Jason-3, Sentinel3a, Sentinel3b, Altika, Cryosat-2 and HY2B are used to provide ocean large scale and mesoscale data, before and after 19 May, to compute the Oceanic variability content in order to extract the tsunami signal from SWOT. The Nadir products used in this study are Level-3 (L3) products, provided by the multi-mission Data Unification and Altimeter Combination System (DUACS), the multi-satellite, multi-agency system developed by CNES and CLS operated since 2015 within the Copernicus Marine Service (https://data.marine.copernicus.eu/product/WAVE_GLO_PHY_SWH_L3_MY_014_005/description, last access: 26 February 2026). The standards of these L3 products, available through the Copernicus Marine Service catalogue, refer as DUACS DT 202 described in Taburet et al. (2019).
The DUACS system has been upgraded by CNES in the recent years 2016–2023 in order to be able to handle SWOT measurements over the ocean for various scientific and operational applications. L3 algorithms and products are developed specifically for SWOT/KaRIn (geophysical corrections, timing, cross-calibration, editing, filtering steps). In particular, the calibration used at L3 (Ubelmann et al., 2024) ensures a good homogeneity between SWOT and the Copernicus Marine Service Nadir product. SWOT “2 km” L3 products version 1.0.2 available on Aviso (https://www.aviso.altimetry.fr/en/data/products/sea-surface-height-products/global/swot-l3-ocean-products.html, last access: 26 February 2026) are derived and used in this study (see Dibarboure et al., 2025, for further details).
To extract the finest estimation of tsunami signal from altimeter measurements, a specific processing is necessary. First a Sea Level Anomaly (SLA) is obtained after instrumental and geophysical correction (e.g., tide signal, or ocean response to atmospheric pressure and wind). The L3 variable “ssha” containing the SWOT 2D SLA includes many different ocean signals such as large scale and mesoscale ocean variability which have to be removed for our analysis. To this end, the MIOST (Multivariate Inversion of Ocean Surface Topography) mapping technique (Ubelmann et al., 2021, 2022) was used to map these oceanic signals not related to the tsunami, interpolating data in space and time along the 19 May 2023 SWOT profile. These interpolated SLA data correspond to the sea level signals that would have been observed on 18 May, when the tsunami had not occurred yet. This algorithm is applied to the 7 Nadir altimeter satellites in order to produce the best signal estimation.
Correcting SWOT SLA from the MIOST estimation allows to analyse the tsunami signal with a good quality, thanks to a fine space/time sampling of the ocean with 7 altimeters. However, the correction is not perfect at fine scales, as detailed in Ballarotta et al. (2019, 2023). The effective spatial resolution of MIOST mapping is around 200 km in the Loyalty Islands area, meaning that oceanic features with wavelength below 200 km, may still be present in SWOT measurement, as other non-tsunami signals, notably near the coasts, due to imperfect tidal corrections or atmospheric effects.
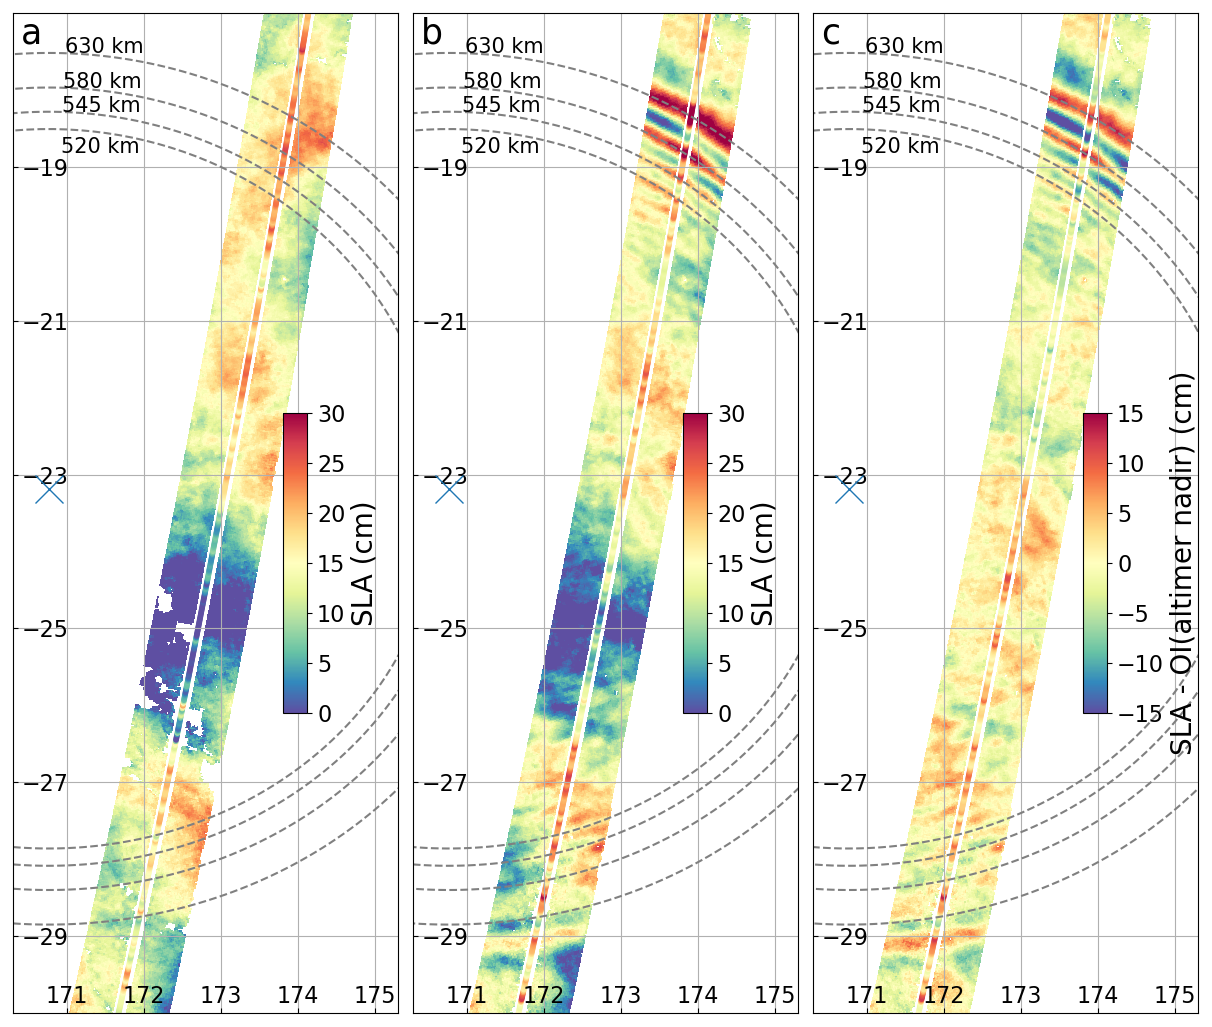
Figure 2The SWOT SLA (a) on pass 17 on 18 May 2023 (cycle 524) 23 h before the Earthquake, (b) 19 May (cycle 525) 1 h after the earthquake. Panel (c) is the same as panel (b) but with ocean variability estimated by MIOST removed. The dashed concentric lines symbolize the distance from the epicenter.
Figure 2a shows the SWOT SLA on pass 17 on 18 May 2023 (cycle 524), ∼ 23 h before the earthquake, and Fig. 2b shows 19 May (cycle 525) ∼ 1 h after the earthquake. The two figures show similar patterns, notably large oceanic and mesoscale signals. The two main wavefronts, called later the North and South wavefront of the tsunami signature, are visible respectively on Fig. 2b at the latitudes 18 and 29° S. First, a good consistency between swath and Nadir SLA (central line) is observed. On Fig. 2c the MIOST estimation is removed, better revealing the tsunami signature. The North wavefront measured at 630 km North away from the earthquake epicenter appears clearly. The South wavefront is lower in amplitude. Note that the two wavefronts have not been measured at the same time. The satellite heading North met the South Front at 03:58 UTC and the North front ∼ 4 min later at 04:02 UTC (T0 = Te + 61 min and T1 = Te + 65 min on Fig. 1, respectively). Secondary waves within the 630 km-radius circle around the earthquake epicenter are visible. Contrarily to a simple 1D field the 2D measurement allows to easily discriminate the waves from the residual oceanic variability.
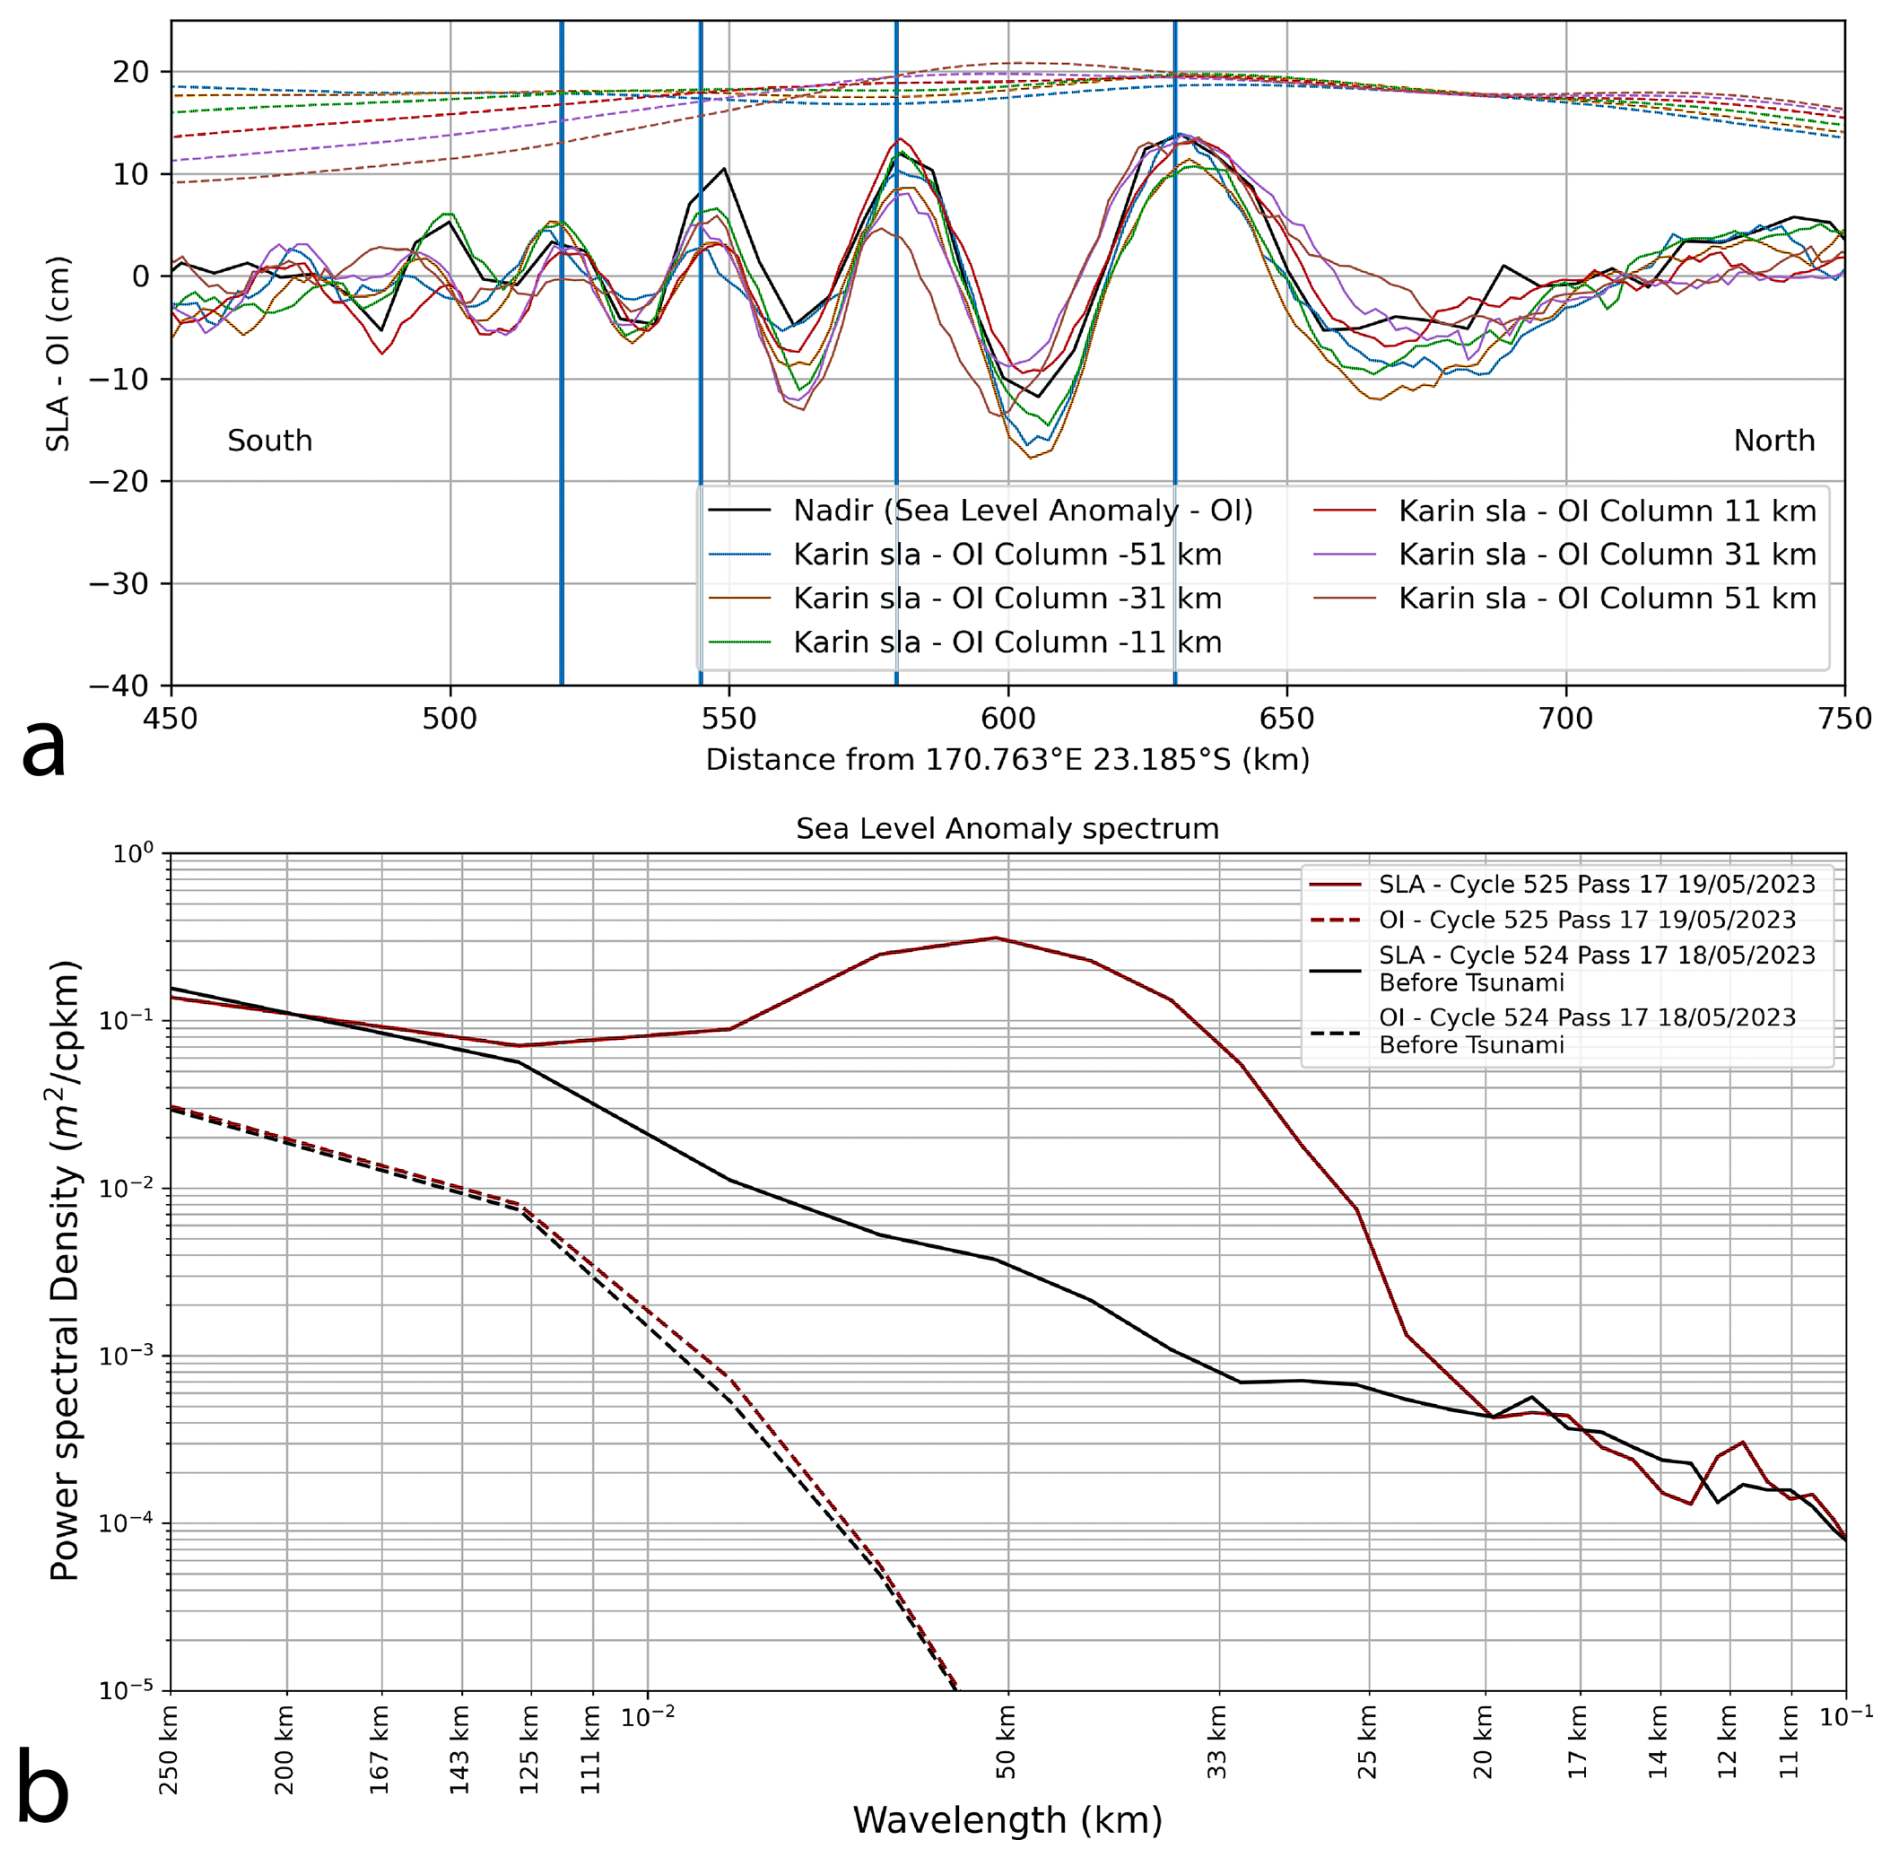
Figure 3SWOT SLA and Power Spectral Density. (a) Zoom on SWOT SLA pass 17 on 19 May in 1D along track of the Nadir and Karin instruments for six across track distance, at 51, 31 and 11 km either side of the Nadir position. The dashed lines represent the optimal interpolation removed for each profile, with respect to colors. (b) Power Spectral Density of SWOT SLA over the same area for 19 and 18 May (the optimal interpolation OI is the MIOST).
Figure 3a focuses on the North Front wave showing 1D along-direction profiles of both the Nadir and swath SLA (KaRIn instrument). Several profiles are displayed, for different track distances, at ±51, 31 and 11 km, on either side of the Nadir position. The first front wave on Fig. 3a shows the largest amplitude up to 15 cm, and the largest wavelength of more than 100 km. Moving closer to the epicenter, thus later in the propagation pattern (toward the left of the figure), the amplitude and the wavelength decrease to a few cm and a few tens of km, respectively. This is expected as the short wavelengths travel slower than the longer wavelengths due to tsunami frequency dispersion. Figure 3b shows the spectral analysis of SWOT SLA over the same area for 18 and 19 May. A large energy lobe is clearly visible at wavelengths between 20 and 120 km documenting the strong dispersive property of the tsunami signal. The optimal interpolation (OI) removed for each profile (before and during tsunami) shows similar spectrums (PSD). It is important to remove mesoscale ocean variability (but also gyres and other potential large structures) to avoid confusing their signatures with tsunami signature. Mesoscale signature could be higher than tsunami amplitude (not the case for the signal at latitude of 18° S). Difference of signal with OI removed or not is visible on Fig. 2 between Fig. 2b and c.
Simulation results and measurement data are compared (Sect. 4.1) and the misfit between them is further discussed (Sect. 4.2) as well as the residual errors from SWOT signal (Sect. 4.3).
4.1 Comparison between observations and model output
Tsunami simulation results are compared with the swath record on the whole area using shade colours as presented on Fig. 4. Figure 4a and c shows a superposition of the satellite swath over the simulated tsunami propagation wavefield 61 and 65 min after the earthquake occurrence time Te, respectively. For this exercise, the swath dataset was resampled to a regular 15 arcsec-resolution grid using kriging interpolation to fit the simulation grid spatial resolution. A first impression shows a really good correlation between the two datasets, especially for what concerns the location of the tsunami wavefronts on the southwest (Fig. 4a at T0 = Te + 61 min) and northwest (Fig. 4c at T1 = Te + 65 min) of the region. While making this comparison, it is important to keep in mind the limited knowledge and possible complexity of the source (the signal is not reproduced perfectly on all DART systems and coastal gauges as indicated by Roger et al., 2025), the resolution of the bathymetry (15 arcsec, with some variations of quality depending on the region), and the general challenging processing of the SWOT dataset (applied corrections, artifacts, etc.). Generally, this also allows to highlight some finer consistency notably concerning secondary waves which show also a good agreement, with sometimes some marginal differences. However, when subtracting the swath data with the simulated wavefield (Fig. 4b and d), it shows larger discrepancies: in both cases, but more visible at T1 on Fig. 4d, the difference reveals that the real record shows larger wave amplitudes in general. In fact, the difference range goes from −8 to 39 cm, with a median value of 12 cm. First, it highlights that the satellite data exhibits larger waves than the simulated signal on most of the swath region. Then, it shows that the larger difference sits clearly in the northeastern wave front. Note that it takes less than 5 min for the satellite to cover the region where the tsunami was propagating, recording both the South and North Fronts of the tsunami. The median value of the ocean depth along the Nadir track is ∼ 3000 m, which leads to a tsunami speed of approximately 620 km h−1. In five minutes, the tsunami would have travelled ∼ 50 km. The spatial shift of the main wave on Fig. 5b measures approximately 8 km, which corresponds to ∼ 48 s of propagation. That means a slight delay in the simulation, linked to the uncertainties listed above, is able to explain this shift. What is modelled is finally an approximation of what the satellite was able to measure during its ∼ 4 min journey above the region happening between 0 h 57 min 51.6 s and 1 h 2 min 30.9 s after the earthquake time. Thus, the simulation output could be too late in the southwest and too early in the northeast, which can explain partially the differences.
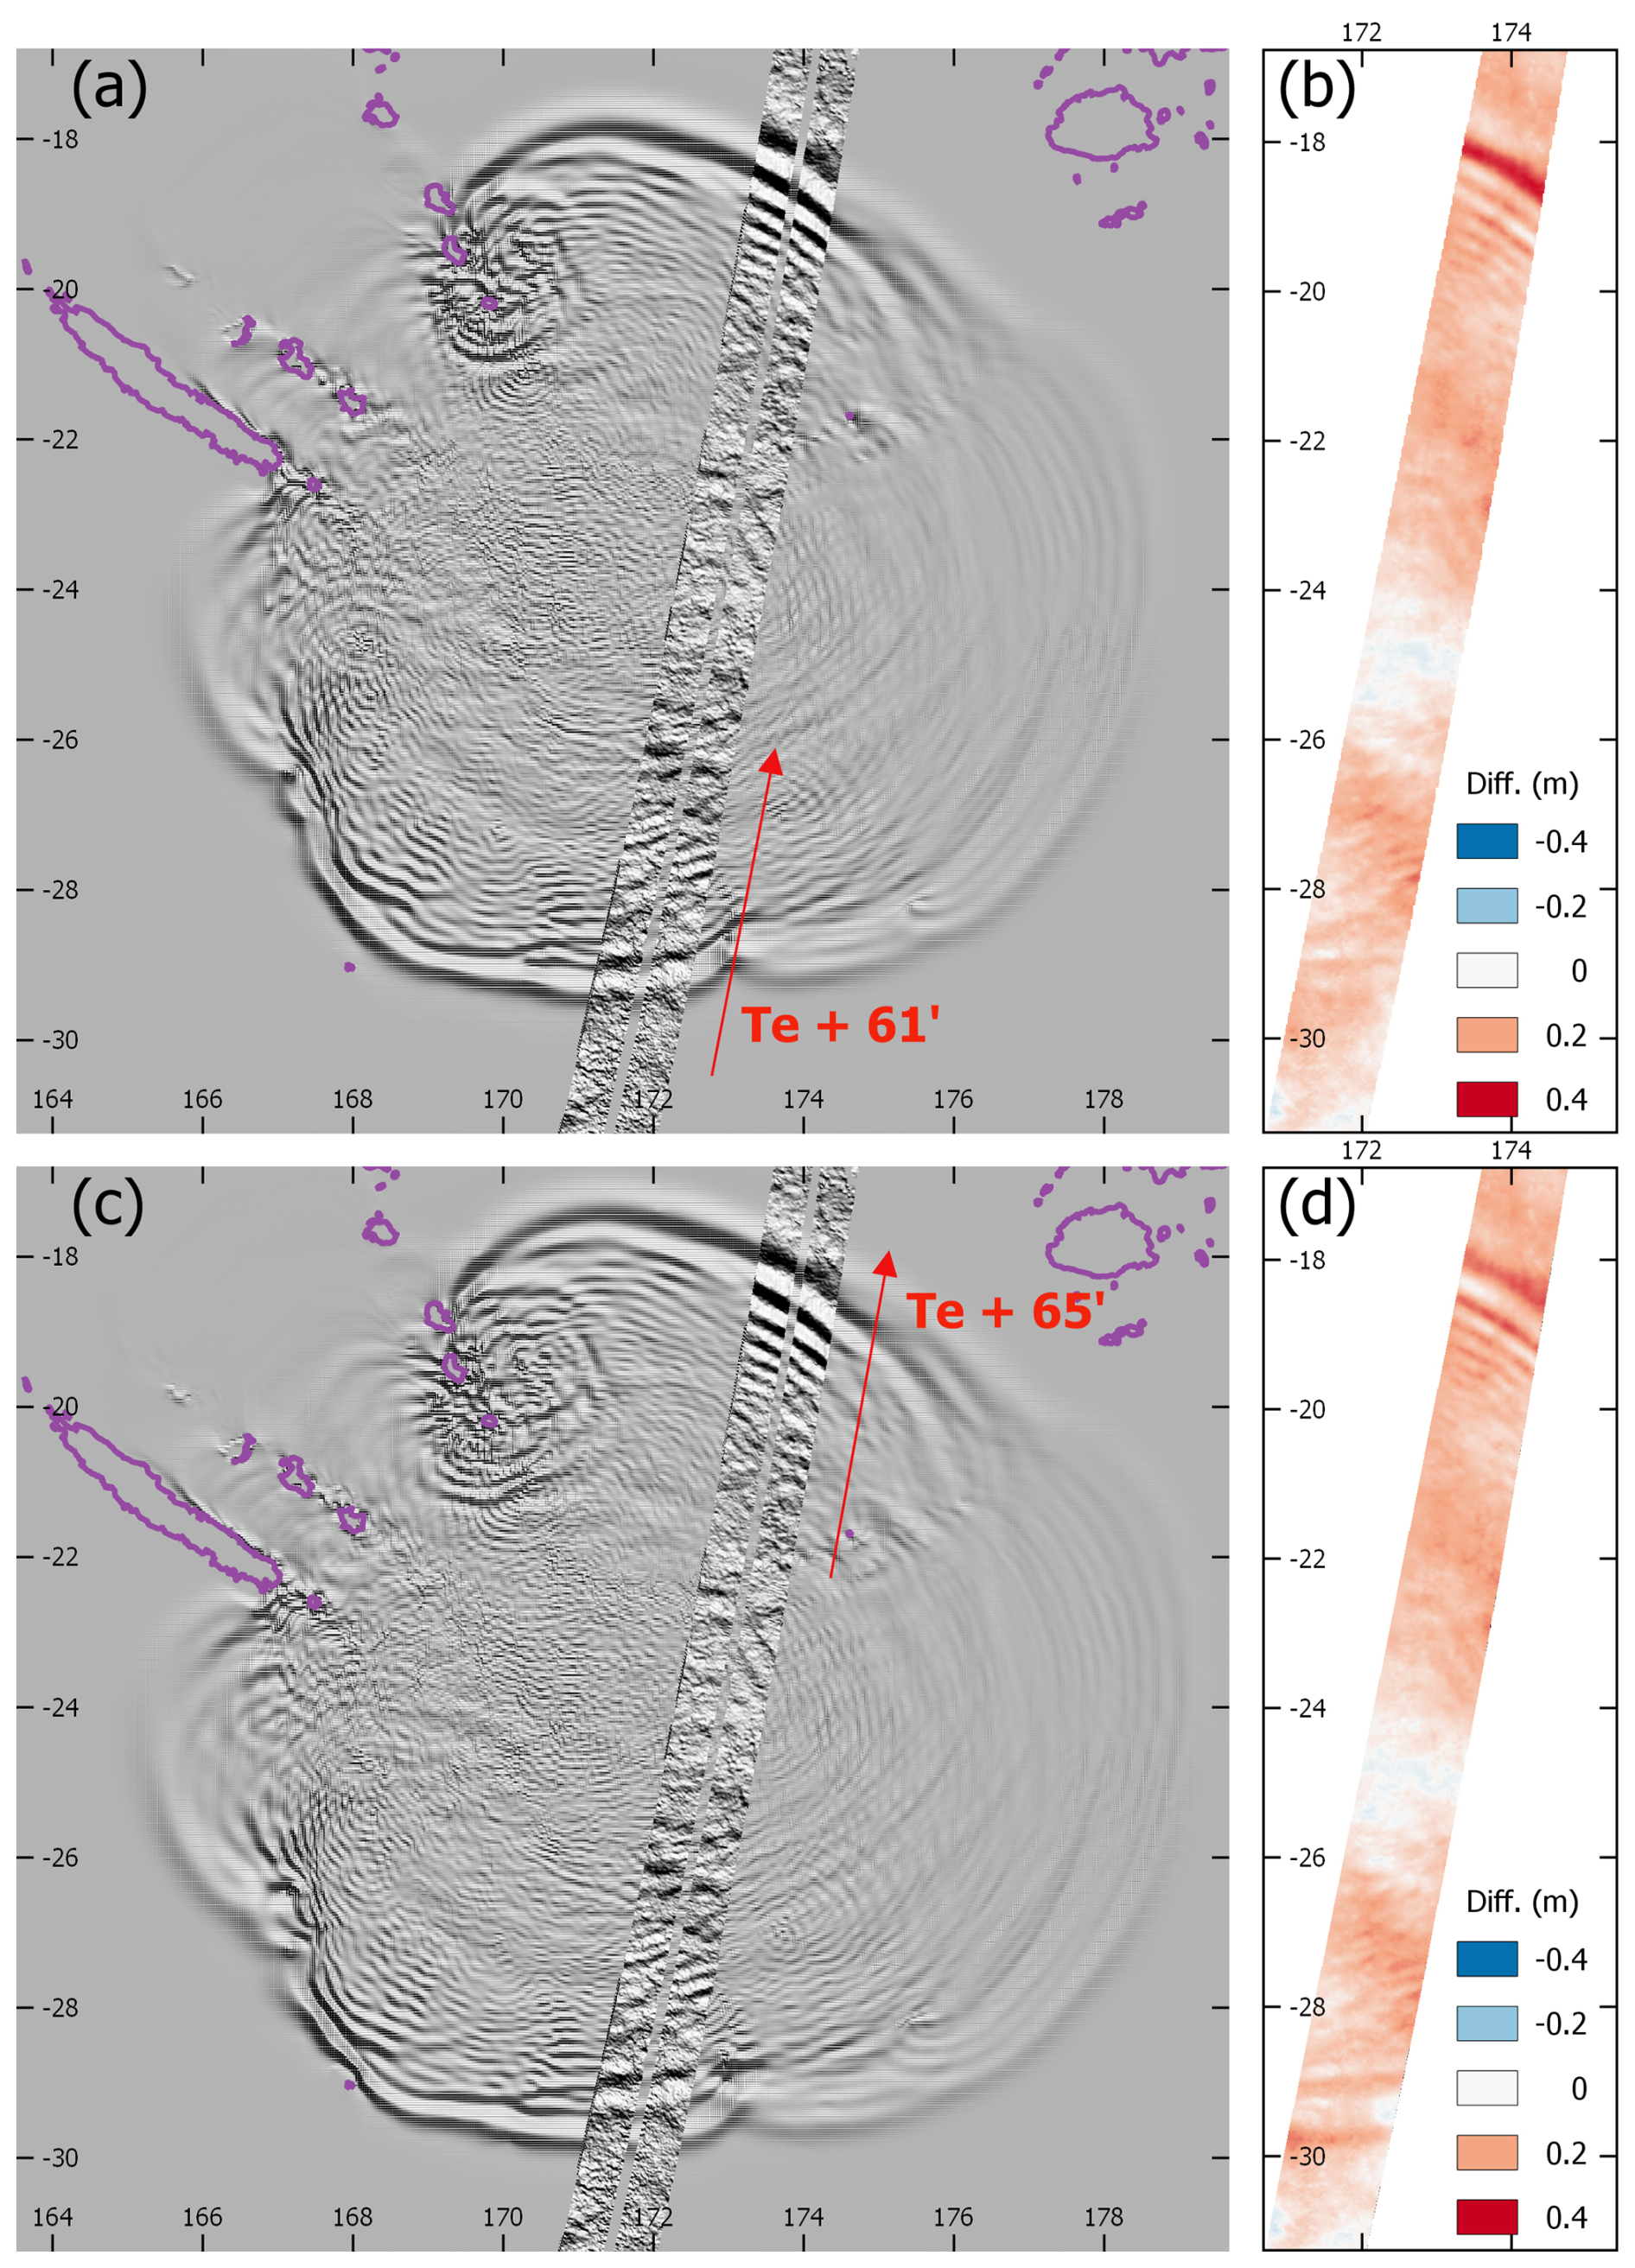
Figure 4Superposition of the SWOT satellite swath (KaRIn; presented on Fig. 2) with the simulated tsunami propagation wavefield using the GCMT-based scenario of coseismic rupture from Roger et al. (2025) at (a) min (61 min after earthquake occurrence time Te) and (c) min; (b, d) sea-surface elevation differences between SWOT record and the modelling output. The red arrows symbolize the direction of the swath measurement.
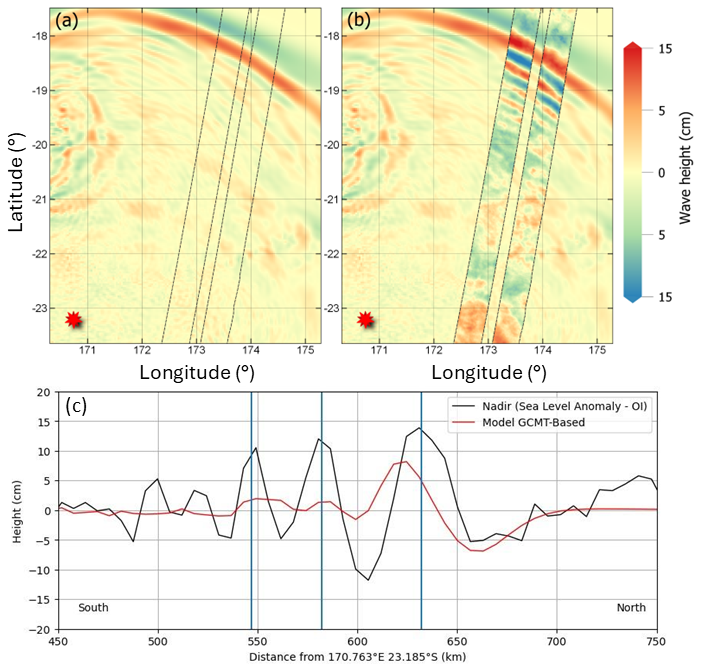
Figure 5Comparison between Nadir SWOT measurements and the model estimation cross-section at T1: (a) GCMT-based wavefield model only showing the position of SWOT measurement (dashed lines), (b) SWOT measurement superimposed on the simulated wavefield, (c) SWOT and model comparison along the Nadir. Blue vertical lines symbolize the dashed distance circles visible on Fig. 2. Red stars locate the epicenter in panels (a) and (b).
Figure 5 shows (a) the simulated tsunami propagation wavefield at T1 and (b) a superposition of the satellite swath over this simulated wavefield, focusing on the northern region of the concerned area. Figure 5c shows a comparison between SWOT data and the simulated waves at T1 along Nadir. There is a good correlation between the two profiles regarding the timing location (however showing a slight delay of the simulated main peak compared to the SWOT record) of the tsunami wavefront and the phase of the three main first waves. However, the differences between the observation and the model are notable in terms of amplitude, approximately with a factor of 2, while a better fit could be obtained, such as in a previous work on the 2004 Indian Ocean tsunami (Ablain et al., 2006; Sladen and Hébert, 2008). In this latter case the earthquake source was however more refined. In addition, the dispersion of the tsunami waves is very visible on SWOT data (Figs. 3a, 4b), and although our model accounts for weak dispersion, it remains preliminary, and does not produce enough amplitudes for the dispersed wavetrain.
4.2 Comments on the misfit between tsunami observation and model
Source models are considered here as badly constrained, due to the lack of seismic stations and additional sensors like GNSS stations leading to bad azimuthal coverage of earthquakes occurring in the southernmost region of the VSZ, and also due to the limited knowledge of the tectonic processes in this specific region. Therefore, the signal is generally not reproduced perfectly on all DART systems and coastal gauges available (Roger et al., 2025). This led Robert et al. (2025) to move the source epicenter ∼ 20 km from its calculated region to fit the records a bit better. Thus, the complexity of the 19 May 2023 event, which was largely non-double couple and located in a complex tectonic region, leads to real difficulties to correctly reproduce the associated tsunami generation mechanism.
For deep ocean tsunami modelling, the resolution of the bathymetry used here (15 arcsec, equivalent to ∼ 450 m), is sufficient to account for tsunami long waves (50–100 km), even for presumably dispersed waves as shown on Fig. 4 (∼ 10 km long). However as underlined by Robert et al. (2025), the highly complex bathymetry of this region may also slightly impact the results at small scale (secondary waves reflection, diffraction, etc.).
4.3 Sources of the differences from SWOT data analysis
Despite the novelty of the instrument onboard SWOT, i.e. KaRIn, the results from the validation phase indicate that its measurement can be trusted, reinforced by a consistent SLA obtained on the classic Nadir instrument also onboard SWOT. However, SWOT signals can contain, as mentioned earlier, residual errors due to imperfect geophysical and oceanic corrections. Although we can definitely conclude on its ability to detect/record tsunami waves along a 2D swath, the validation of the wave amplitudes may need further consideration, including comparison of records with simulation outputs for other future observations.
A Mean Sea Surface (MSS) model is also used to correct SWOT measurements from the geoid signature. This MSS model is very recent (Laloue et al., 2024), meaning that unresolved geoid signatures may remain, polluting SWOT products at short wavelengths. This may happen especially in this area of rugged bathymetry, with uncharted seamounts, rifts, continental shelf, etc.
For the first time on 19 May 2023, tsunami waves in the open ocean have been clearly measured in 2D by the SWOT satellite deployed in 2022. The recorded signal well describes the tsunami, showing its wave amplitudes and wavelengths. 2D data allows to better discriminate the waves and related errors from the ocean signal and properly distinguish fine variations within the swath. Preliminary numerical simulations of tsunami have been computed using COMCOT. There is a good correlation between the two profiles regarding the location of the tsunami wavefronts. However, the differences between the two signals are notable in terms of amplitude, by approximately a factor of 2. This highlights that (1) the source model is not well constrained, notably with this kind of complex earthquake source case with a significant non-double couple component; (2) the azimuthal gap of measurement needs to be filled in for this seismically active section of a complex subduction zone; and (3) future surveys may focus on completing the bathymetry gaps, especially in the North Fiji Basin.
This study demonstrates the opportunity of using SWOT to contribute to a better understanding and improvement of the modelling of tsunami generation, propagation and dissipation. Observations can be used, in particular, to refine the initial displacement conditions due to the earthquake, and, during the propagation phase, provide an unprecedented picture of the dispersed tsunami waveforms. The recent May 2025 Drake Passage and July 2025 Kamchatka tsunamis have underlined the usefulness of such records to better refine tsunami sources and fit the modeling results to current records. Interest in such measurements can also be highlighted, to better confirm tsunami triggered by an earthquake or another geohazard in complement to DARTs, coastal gauges, seafloor cables and GNSS-equipped vessels. it reminds the importance of using multisensors array to better understand and model complex tsunamis. This kind of approach also allows in turn to better understand oceanic variability measured on these modern altimetry satellites, and to better correct its signature to study oceanic hazards. In any case, due to the kinematic conditions of satellite path and tsunami propagation, this kind of observation remains indeed very rare and probably not well adapted for the tsunami warning challenges (see also Hébert et al., 2020 for a review).
Whatever the misfit regarding the earthquake source models, it is also crucial to stress that well-designed seismic networks are still essential to contribute to efficient seismic warning in the first minutes after an earthquake. While regional initiatives are already set up in situ or in preparation thanks to several national commitments (for instance, Oceania Regional Seismic NETwork, ORSNET, developed since the 2010s; or the New Zealand regional DART network, fully operational since 2021: Power et al., 2018), efforts must be maintained in the long term to grant timely access to reliable and complete datasets. In addition, submarine data acquisition is more and more developed and should growingly contribute to early warning, with new projects such as SMART cable (Howe et al., 2019) that are able to monitor both seismic activity and tsunami propagation with dedicated networks of in situ seismic sensors and sea-level gauges.
There is a need to rework the model, especially the seismic rupture accuracy with a better understanding of the event in general, in order to improve the quality of the amplitude of the front waves. SWOT data may be used to assess the quality or accuracy of the source model, but also provides an unvaluable look at the secondary waves.
In addition, SWOT data could also be integrated in an inversion process as it is already the case for static deep-ocean and coastal gauges datasets. Although inverting data on a dynamic 2D track instead of waveforms from time series at specific locations might be challenging, numerical models performed on discrete sampling points along the track, accounting for the satellite motion, could be integrated in massive inversion process using advanced numerical techniques (e.g., machine learning).
Finally, the next generation of wide-swath satellites is already in the starting-blocks after SWOT, i.e. the S3NG-T constellation (Copernicus programme, e.g., Le Traon et al., 2025) and should be deployed in ∼ 2030. Although repeatability will probably still not be sufficient for real-time early detection and warning, this study shows how such observation improves the 2D picture of a propagating tsunami and can contribute to enhanced studies of tsunami physics and modelling offshore.
COMCOT code is available upon reasonable request from Dr. Xiaoming Wang (Tsinghua University, Beijing, China, https://www.tsinghua.edu.cn/en/Contact.htm, last access: 26 February 2026).
The Level-3 (L3) SWOT products version 1.0.2 used in this study are available on the Aviso repository from CNES (https://www.aviso.altimetry.fr/en/data/products/sea-surface-height-products/global/swot-l3-ocean-products.html, last access: 26 February 2026). The processed data of 19 May 2023 are available on the Earth System Data repository (https://doi.org/10.57932/8b9996d3-c100-4a0a-ac67-05dd2e81155a, Delepoulle et al., 2026).
JHMR: Conceptualization, Formal analysis, Investigation, Validation, Visualization, Writing (original draft preparation), Writing (review & editing). YF: Conceptualization, Formal analysis, Investigation, Validation, Writing (original draft preparation), Writing (review & editing). HH: Investigation, Writing (original draft preparation), Writing (review & editing). AD: Data curation, Formal analysis, Investigation, Visualization, Writing (review & editing). GD: Data curation, Formal analysis, Investigation, Visualization.
The contact author has declared that none of the authors has any competing interests.
Publisher's note: Copernicus Publications remains neutral with regard to jurisdictional claims made in the text, published maps, institutional affiliations, or any other geographical representation in this paper. The authors bear the ultimate responsibility for providing appropriate place names. Views expressed in the text are those of the authors and do not necessarily reflect the views of the publisher.
The authors are grateful with Dr. Xiaoming Wang for providing the last version of COMCOT tsunami modelling code and unwavering support to use it. The study represents a fruitful scientific collaboration between Earth Sciences New Zealand (formerly GNS Science), CNES, CEA and CLS (France).
This research has been supported by the Ministry for Business Innovation and Employment (grant no. C05X1702).
This paper was edited by Mauricio Gonzalez and reviewed by two anonymous referees.
Ablain, M., Dorandeu, J., Le Traon, P.-Y., and Sladen, A.: High resolution altimetry reveals new characteristics of the December 2004 Indian Ocean tsunami, Geophys. Res. Lett., 33, L21602, https://doi.org/10.1029/2006GL027533, 2006.
Archer, M., Wang, J., Klein, P., Dibarboure, G., and Fu, L.-L.: Wide-swath satellite altimetry unveils global submesoscale ocean dynamics, Nature, 640, 691–696, https://doi.org/10.1038/s41586-025-08722-8, 2025.
Ballarotta, M., Ubelmann, C., Pujol, M.-I., Taburet, G., Fournier, F., Legeais, J.-F., Faugère, Y., Delepoulle, A., Chelton, D., Dibarboure, G., and Picot, N.: On the resolutions of ocean altimetry maps, Ocean Sci., 15, 1091–1109, https://doi.org/10.5194/os-15-1091-2019, 2019.
Ballarotta, M., Ubelmann, C., Veillard, P., Prandi, P., Etienne, H., Mulet, S., Faugère, Y., Dibarboure, G., Morrow, R., and Picot, N.: Improved global sea surface height and current maps from remote sensing and in situ observations, Earth Syst. Sci. Data, 15, 295–315, https://doi.org/10.5194/essd-15-295-2023, 2023.
Bohé, A.: KaRIn LR Oceanography Products Status & Examples, 2023 SWOT Science Team meeting, Toulouse, https://swotst.aviso.altimetry.fr/fileadmin/user_upload/SWOTST2023/20230919_2_Karin_overview1/11h30-BOHE_plenary.pdf (last access: 12 March 2024), 2023.
Chen, C.: Features of KaRIn Data that Users Should be Aware of, 2023 SWOT Science Team meeting, Toulouse, https://swotst.aviso.altimetry.fr/fileadmin/user_upload/SWOTST2023/20230919_3_Karin_overview2/14h10-KaRInFeatures.pdf (last access: 12 March 2024), 2023.
Delepoulle, A., Roger, J., Hébert, H., and Fuentes, M.: Tsunami records with the NASA/CNES SWOT space altimeter, EaSy Data [data set], https://doi.org/10.57932/8b9996d3-c100-4a0a-ac67-05dd2e81155a, 2026.
Dibarboure, G., Anadon, C., Briol, F., Cadier, E., Chevrier, R., Delepoulle, A., Faugère, Y., Laloue, A., Morrow, R., Picot, N., Prandi, P., Pujol, M.-I., Raynal, M., Tréboutte, A., and Ubelmann, C.: Blending 2D topography images from the Surface Water and Ocean Topography (SWOT) mission into the altimeter constellation with the Level-3 multi-mission Data Unification and Altimeter Combination System (DUACS), Ocean Sci., 21, 283–323, https://doi.org/10.5194/os-21-283-2025, 2025.
Dziewonski, A. M., Chou, T.-A., and Woodhouse, J. H.: Determination of earthquake source parameters from waveform data for studies of global and regional seismicity, J. Geophys. Res., 86, 2825–2852, https://doi.org/10.1029/JB086iB04p02825, 1981.
Ekström, G., Nettles, M., and Dziewonski, A. M.: The global CMT project 2004–2010: Centroid-moment tensors for 13,017 earthquakes, Phys. Earth Planet. Inter., 200–201, 1–9, https://doi.org/10.1016/j.pepi.2012.04.002, 2012.
Faugère, Y., Husson, R., Busche, C., Dibarboure, G., Rolland, L., Sladen, A., and Munaibari, E.: The 2022 Honga Tonga Tsunami monitored by satellite altimetry and SAR, 2022 OSTST meeting, https://ostst.aviso.altimetry.fr/fileadmin/user_upload/OSTST2022/Presentations/APO2022-The_2022_Honga_Tonga_Tsunami_monitored_by_satellite_altimetry_and_SAR.pdf (last access: 24 February 2026), 2022.
Fjørtoft, R., Chen, C., Corben, A., Desai, S. D., Desroches, D., Picot, N., Pottier, C., Stuurman, C., Williams, B., and Wu, X.: SWOT Hydrology Products and Early Results, in: IGARSS 2024 – 2024 IEEE International Geoscience and Remote Sensing Symposium, IEEE, 1410–1413, https://doi.org/10.1109/IGARSS53475.2024.10642160, 2024.
Fu, L. L. and Rodriguez, E.: High-Resolution Measurement of Ocean Surface Topography by Radar Interferometry for Oceanographic and Geophysical Applications, in: The State of the Planet: Frontiers and Challenges in Geophysics, edited by: Sparks, R. S. J. and Hawkesworth, C. J., IUGG Geophysical Monograph, American Geophysical Union, Washington, DC, USA, 19, 209–224, https://doi.org/10.1029/150GM17, 2004.
Fu, L.-L., Pavelsky, T., Cretaux, J.-F., Morrow, R., Farrar, J. T., Vaze, P., Sengenes, P., Vinogradova-Shiffer, N., Sylvestre-Baron, A., Picto, N., and Dibarboure, G.: The Surface Water and Ocean Topography Mission: A breakthrough in radar remote sensing of the ocean and land surface water, Geophys. Res. Lett., 51, e2023GL107652, https://doi.org/10.1029/2023GL107652, 2024.
GEBCO Bathymetric Compilation Group 2023: The GEBCO_2023 Grid – a continuous terrain model of the global oceans and land, NERC EDS British Oceanographic Data Centre NOC [data set], https://doi.org/10.5285/f98b053b-0cbc-6c23-e053-6c86abc0af7b, 2023.
Godin, O. A., Irisov, V. G., Leben, R. R., Hamlington, B. D., and Wick, G. A.: Variations in sea surface roughness induced by the 2004 Sumatra-Andaman tsunami, Nat. Hazards Earth Syst. Sci., 9, 1135–1147, https://doi.org/10.5194/nhess-9-1135-2009, 2009.
Gower, J.: The 26 December 2004 tsunami measured by satellite altimetry, Int. J. Remote Sens., 28, 2897–2913, https://doi.org/10.1080/01431160601094484, 2007.
Hamlington, B. D., Leben, R. R., Godin, O. A., Legeais, J. F., Gica, E., and Titov, V. V.: Detection of the 2010 Chilean tsunami using satellite altimetry, Nat. Hazards Earth Syst. Sci., 11, 2391–2406, https://doi.org/10.5194/nhess-11-2391-2011, 2011.
Hamlington, B. D., Leben, R. R., Godin, O. A., Gica, E., Titov, V. V., Haines, B. J., and Desai, S. D.: Could satellite altimetry have improved early detection and warning of the 2011 Tohoku tsunami?, Geophys. Res. Lett., 39, L15605, https://doi.org/10.1029/2012GL052386, 2012.
Hayashi, Y.: Extracting the 2004 Indian Ocean tsunami signals from sea surface height data observed by satellite altimetry, J. Geophys. Res.-Oceans, 113, https://doi.org/10.1029/2007JC004177, 2008.
Hébert, H., Occhipinti, G., Schindelé, F., Gailler, A., Pinel-Puysségur, B., Gupta, H.K., Rolland, L., Lognonné, P., Lavigne, F., Meilianda, E., and Chapkanski, S.: Contributions of Space Missions to Better Tsunami Science: Observations, Models and Warnings, Surv. Geophys., 41, 1535–1581, https://doi.org/10.1007/s10712-020-09616-2, 2020.
Howe, B. M., Arbic, B. K., Aucan, J., Barnes, C. R., Bayliff, N., Becker, N., Butler, R., Doyle, L., Elipot, S., Johnson, G. C., Landerer, F., Lentz, S., Luther, D. S., Müller, M., Mariano, J., Panayotou, K., Rowe, C., Ota, H., Song, Y. T., Thomas, M., Thomas, P. N., Thompson, P., Tilmann, F., Weber, T., and Weinstein, S.: SMART Cables for Observing the Global Ocean: Science and Implementation, Front. Mar. Sci., 6, 1–27, https://doi.org/10.3389/fmars.2019.00424, 2019.
Laloue, A., Schaeffer, P., Pujol, M. I., Veillard, P., Andersen, O., Sandwell, D., Delepoulle, A., Dibarboure, G., and Faugère, Y.: Merging recent Mean Sea Surface into a 2023 Hybrid model (from Scripps, DTU, CLS and CNES), Authorea, https://doi.org/10.22541/au.171987154.42384510/v1, 2024.
Le Traon, P.-Y., Dibarboure, G., Lellouche, J.-M., Pujol, M.-I., Benkiran, M., Drevillon, M., Drillet, Y., Faugère, Y., and Remy, E.: Satellite altimetry and operational oceanography: from Jason-1 to SWOT, Ocean Sci., 21, 1329–1347, https://doi.org/10.5194/os-21-1329-2025, 2025.
Liu, P. L. F., Cho, Y.-S., Briggs, M. J., Synolakis, C. E., and Kanoglu, U.: Runup of solitary waves on a circular island, J. Fluid Mech., 302, 259–285, https://doi.org/10.1017/S0022112095004095, 1995.
Luis, J. F.: Mirone, A multi-purpose tool for exploring grid data, Comput. Geosci., 33, 31–41, https://doi.org/10.1016/j.cageo.2006.05.005, 2007.
Meinig, C., Eble, M. C., and Stalin, S. E.: System development and performance of the Deep-ocean Assessment and Reporting of Tsunamis (DART) system from 1997–2001, in: Proceedings of the International Tsunami Symposium 2001 (ITS 2001), NHTMP Review Session, R24, 235–242, https://www.pmel.noaa.gov/pubs/docs/ITS2001/R-24_Meinig.pdf (last access: 26 February 2026), 2001.
Monahan, T., Tang, T., Roberts, S., and Adcock, T. A. A.: Observations of the seiche that shook the world, Nat. Commun., 16, 1–14, https://doi.org/10.1038/s41467-025-59851-7, 2025.
Morrow, R., Fu, L.-L., Ardhuin, F., Benkiran, M., Chapron, B., Cosme, E., d'Ovidio, F., Farrar, J. T., Gille, S. T., Lapeyre, G., Le Traon, P.-Y., Pascual, A., Ponte, A., Qiu, B., Rascle, N., Ubelmann, C., Wang, J., and Zaron, E. D.: Global observations of fine-scale ocean surface topography with the surface water and ocean topography (SWOT) mission, Front. Mar. Sci., 6, https://doi.org/10.3389/fmars.2019.00232, 2019.
Okada, Y.: Surface deformation due to shear and tensile fault in a half-space, B. Seismol. Soc. Am., 75, 1135–1154, 1985.
Okal, E. A., Piatanesi, A., and Heinrich, P.: Tsunami detection by satellite altimetry, J. Geophys. Res.-Sol. Ea., 104, 599–615, https://doi.org/10.1029/1998JB000018, 1999.
Peral, E., Esteban-Fernández, D., Rodríguez, E., McWatters, D., De Bleser, J. W., Ahmed, R., Chen, A. C., Slimko, E., Somawardhana, R., Knarr, K., and Johnson, M.: KaRIn, the Ka-band radar interferometer of the SWOT mission: design and in-flight performance, IEEE T. Geosci. Remote, 62, 1–27, https://doi.org/10.1109/TGRS.2024.3405343, 2024.
Power, W. L., Fry, B., Gusman, A. R., Burbidge, D. R., Brewer, M., and Wang, X.: DART buoys network design. GNS Science consultancy report 2018/147, 53 pp., 2018.
Raynal, M., Dibarboure, G., Bohe, A., Bignalet-Cazalet, F., Picot, N., Prandi, P., Cadier, E., Nencioli, F., Briol, F., Delepoulle, A., Flamant, B., Denneulin, M., Picard, B., Ubelmann, C., Chen, C., and Stiles, B.: Early SWOT 21-day data assessment, 2023 SWOT Science Team meeting, Toulouse, https://swotst.aviso.altimetry.fr/fileadmin/user_upload/SWOTST2023/20230922_1_going_forward/09h10-RAYNAL_L2LR_CalVal_scienceOrbit.pdf (last access: 12 March 2024), 2023.
Robert, W. H., Yamazaki, Y., Cheung, K. F., and Lay, T.: Tsunami variability for the 2021 megathrust and 2023 outer rise MW 7.7 earthquakes southeast of the Loyalty Islands, J. Geophys. Res.-Oceans, 130, e2024JC021880, https://doi.org/10.1029/2024JC021880, 2025.
Roger, J., Pelletier, B., Gusman, A., Power, W., Wang, X., Burbidge, D., and Duphil, M.: Potential tsunami hazard of the southern Vanuatu subduction zone: tectonics, case study of the Matthew Island tsunami of 10 February 2021 and implication in regional hazard assessment, Nat. Hazards Earth Syst. Sci., 23, 393–414, https://doi.org/10.5194/nhess-23-393-2023, 2023.
Roger, J., Gusman, A., Faugère, Y., Rolland, L., Hébert, H., Delouis, B., and O'Kane, A.: The 2023 South Vanuatu doublet of earthquakes and tsunamis: observations, numerical simulations and gray areas, EGU General Assembly 2025, Vienna, Austria, 27 April–2 May 2025, EGU25-7571, https://doi.org/10.5194/egusphere-egu25-7571, 2025.
Roger, J. H. M. and Wang, X.: Impact of tsunamis in Porirua Harbour: focus on Mana Marina, GNS Science report 2023/31, 62 pp., https://doi.org/10.21420/WETZ-0X92, 2023.
Shrivastava, M. N., Sunil, A. S., Maurya, A. K., Aguilera, F., Orrego, S., Sunil, P. S., Cienfuegos, R., and Moreno, M.: Tracking tsunami propagation and Island's collapse after the Hunga Tonga Hunga Ha'apai 2022 volcanic eruption from multi-space observations, Sci. Rep., 13, 20109, https://doi.org/10.1038/s41598-023-46397-1, 2023.
Sladen, A. and Hébert, H.: On the use of satellite altimetry to infer the earthquake rupture characteristics: application to the 2004 Sumatra event, Geophys. J. Int., 172, 707–714, https://doi.org/10.1111/j.1365-246X.2007.03669.x, 2008.
Strasser, F. O., Arango, M. C., and Bommer, J. J.: Scaling of the source dimensions of interface and intraslab subduction-zone earthquakes with moment magnitude, Seismol. Res. Lett., 81, 941–950, https://doi.org/10.1785/gssrl.81.6.941, 2010.
Taburet, G., Sanchez-Roman, A., Ballarotta, M., Pujol, M.-I., Legeais, J.-F., Fournier, F., Faugere, Y., and Dibarboure, G.: DUACS DT2018: 25 years of reprocessed sea level altimetry products, Ocean Sci., 15, 1207–1224, https://doi.org/10.5194/os-15-1207-2019, 2019.
Ubelmann, C., Dibarboure, G., Gaultier, L., Ponte, A., Ardhuin, F., Ballarotta, M., and Faugère, Y.: Reconstructing ocean surface current combining altimetry and future spaceborne Doppler data, J. Geophys. Res.-Oceans, 126, e2020JC016560, https://doi.org/10.1029/2020JC016560, 2021.
Ubelmann, C., Carrere, L., Durand, C., Dibarboure, G., Faugère, Y., Ballarotta, M., Briol, F., and Lyard, F.: Simultaneous estimation of ocean mesoscale and coherent internal tide sea surface height signatures from the global altimetry record, Ocean Sci., 18, 469–481, https://doi.org/10.5194/os-18-469-2022, 2022.
Ubelmann, C., Dibarboure, G., Flamant, B., Delepoulle, A., Vayre, M., Faugère, Y., Prandi, P., Raynal, M., Briol, F., Bracher, G., and Cadier, E.: Data-driven calibration of SWOT's systematic errors: first in-flight assessment, Remote Sens., 16, 3558, https://doi.org/10.3390/rs16193558, 2024.
Vaze, P., Kaki, S., Limonadi, D., Esteban-Fernandez, D., and Zohar, G.: March. The surface water and ocean topography mission, in: 2018 IEEE Aerospace Conference, IEEE, 1–9, https://doi.org/10.1109/AERO.2018.8396504, 2018.
Wang, X.: Numerical modelling of surface and internal waves over shallow and intermediate water. PhD Thesis, Ithaca (NY), Cornell University, 245 pp., https://catalog.library.cornell.edu/catalog/6794450 (last access: 26 February 2026), 2008.
Wang, X. and Liu, P. L. F.: An analysis of 2004 Sumatra earthquake fault plane mechanisms and Indian Ocean tsunami, J. Hydraul. Res., 44, 147–154, https://doi.org/10.1080/00221686.2006.9521671, 2006.
Wang, X. and Power, W.: COMCOT: a tsunami generation, propagation and run-up model. GNS Science Report, 2011/43, GNS Science, Lower Hutt, New Zealand, 121 pp., https://shop.gns.cri.nz/sr_2011-043-pdf/ (last access: 26 February 2026), 2011.
Wang, X., Holden, C., Power, W., Liu, Y., and Mountjoy, J.: Seiche effects in Lake Tekapo, New Zealand, in an Mw8.2 Alpine Fault earthquake, Pure Appl. Geophys., 177, 5927–5942, https://doi.org/10.1007/s00024-020-02595-w, 2020.
Wells, D. L. and Coppersmith, K. J.: New empirical relationships among magnitude, rupture length, rupture width, rupture area, and surface displacement, B. Seismol. Soc. Am., 84, 974–1002, https://doi.org/10.1785/BSSA0840040974, 1994.
- Abstract
- Introduction
- Earthquake rupture model and simulation of tsunami
- Extraction of the tsunami signal from SWOT measurements
- Comparisons and discussion
- Conclusion & perspectives
- Code availability
- Data availability
- Author contributions
- Competing interests
- Disclaimer
- Acknowledgements
- Financial support
- Review statement
- References