the Creative Commons Attribution 4.0 License.
the Creative Commons Attribution 4.0 License.
 | 13 Feb 2026
Rapid amplification of Compound Drought and Heatwave risk over India: a regime shift from arid northwest to humid southern and eastern hotspots
Debankana Bhattacharjee
Chandrika Thulaseedharan Dhanya
Quantifying the regional intensification of Compound Droughts and Heatwaves (CDHW) is critical under changing precipitation regimes. The spatiotemporal evolution of CDHW events is investigated across India (1951–2016) using the Standardized Net-Precipitation and Distribution Index (SNEPI) to capture intra-monthly precipitation spell variability. Results indicate a statistically significant 86 % rise in the frequency of individual heatwaves and a significant drought intensification in historically humid zones. Consequently, the spatial extent of India affected by the CDHWs expanded from 10 % to 35 %, with hotspots transitioning from the historically arid northwest to humid eastern and southern regions. While lower-intensity CDHW events expanded 3 to 5 times spatially, the extreme category experienced a 25-fold increase. Notably, 46.4 % of moderate and 43.3 % of elevated events escalated to higher severities, suggesting a cascading amplification of risk. Despite intervening wet periods, 10 %–16 % of CDHWs recurred, indicating limited mitigation over traditionally wet and resilient regions. Agricultural impact analysis reveals that high-intensity CDHW years reduced national rice yields by 12.1 %, while wheat yields increased by 13.9 %, highlighting the critical but often overlooked influence of CDHW occurrences on India's major crops, i.e., suppressing water-sensitive rice production but favouring heat-resilient wheat cultivation. Furthermore, the emergence of statistically distinct new hotspots, particularly in Kerala and Assam, coincides with a 4–10 fold increase in exposed urban populations, underscoring the urgent need to reassess regional adaptation strategies under evolving rainfall regimes across both traditionally arid and humid zones.
- Article
(10213 KB) - Full-text XML
-
Supplement
(49495 KB) - BibTeX
- EndNote


-
Droughts in tropical monsoon regions are now more pronounced and persistent due to changing precipitation spell variability. CDHW hotspots have shown a significant regime shift (p < 0.1) from the arid northwest to the historically humid eastern and southern peninsula.
-
While the spatial extent of moderate, elevated, severe, and intense CDHW categories increased 3–4 fold across the country, the extreme category spread ∼ 25 times.
-
A cascading amplification of risk is observed where ∼ 45 % of lower-intensity events in humid zones are now escalating into severe and intense categories.
-
High-intensity CDHW years suppressed national crop yields by 12.1 %, demonstrating that explicitly combining heat stress with precipitation-spell variability captures the multi-hazard conditions most damaging to Indian agriculture.
The frequency, intensity, and societal costs of high-impact climate extremes have surged worldwide in the recent decades (Ridder et al., 2022; Seneviratne et al., 2021; IPCC, 2021). Concurrent compound extremes now attract increasing attention because they exacerbate the damages even further (Ali, 2025; Fehlman et al., 2025; Raymond et al., 2020; Zscheischler et al., 2018, 2020). Specifically, compound droughts and heatwaves (CDHW) have increased globally, posing amplified threats to agriculture, water resources, and human livelihoods (Tripathy et al., 2023; Tavakol et al., 2020a; Mazdiyasni and AghaKouchak, 2015). Notably, the intensity, frequency, and duration of heatwaves themselves have increased globally (Meehl and Tebaldi, 2004) and are expected to continue to rise over the next century (Fischer and Knutti, 2015; Meehl and Tebaldi, 2004). Additionally, the drought characteristics have become more severe under shifting precipitation patterns (Singh et al., 2021; Trenberth, 2011). Under these increasing anomalies of heatwaves and droughts, fewer studies have rigorously evaluated how these two hazards co-occur and evolve under the changing climatic conditions.
Global and regional variations of the CDHW extremes are extensively investigated (Feng et al., 2020); for example, over Europe (Tripathy and Mishra, 2023; Ionita et al., 2021), China (Feng et al., 2025; Liu et al., 2024; Kong et al., 2020), Australia (Chapman et al., 2025), the United States (Rastogi et al., 2023; Hao et al., 2020b), Southern Africa (Mbokodo et al., 2023; Hao et al., 2020a), and at the global scale (He et al., 2022; Mukherjee and Mishra, 2021; Zscheischler and Seneviratne, 2017). Reportedly, the frequency, severity, and duration of CDHW events have significantly augmented, particularly in hotspots like Africa, the Mediterranean, and Central Asia, due to the rise in global temperatures (Takyi, 2024; Wang et al. 2022). While substantial evidence highlights the impact of this augmentation on environment, human health, agricultural yield, water resources, and energy consumption (Liu et al., 2025; Zhang et al., 2025; Tripathy et al., 2023; Mukherjee et al., 2022; Mukherjee et al., 2020), the conclusions derived from these studies are bound to be influenced by how these extremes are quantified.
CDHW events are often investigated through dynamical approaches using fully coupled climate models to simulate physical land-atmosphere feedbacks (Liu and Qin, 2025; Wang et al., 2024; Seo and Ha, 2022) and statistical approaches leveraging direct observations (Swain et al., 2024; Liu, 2024; Takyi, 2024; Afroz et al., 2023; Leonard et al., 2014) to quantify probabilistic interactions and dependence structures (Miao et al., 2016; Fischer and Knutti, 2013; Hao et al., 2013; Morán-Tejeda et al., 2014). Statistical approaches offer distinct advantages in the identification and quantification of compound climate events, as they directly integrate the observational data to capture the complex dependencies and interactions among multiple variables, such as temperature and precipitation, using multivariate distributions (Trepanier et al., 2017; Zscheischler and Seneviratne, 2017) and indicator approaches (Salvadori et al., 2007). However, a critical limitation remains in how the precipitation component of these interactions is parameterized.
Heatwaves are usually quantified as a sequence of consecutive sweltering days, deploying univariate indicators (McElroy et al., 2020), rarely incorporating the joint behavior of intensity and duration. Droughts, in contrast, are commonly quantified through standardized indices to represent distinct aspects of water availability (IPCC, 2021; Van Loon et al., 2016; Dracup et al., 1980; Palmer, 1965; Gumbel, 1963). For example, SPI (Standardized Precipitation Index) (McKee et al., 1993), SPEI (Standardized Precipitation Evaporation Index) (Vicente-Serrano et al., 2010), and scPDSI (Self Calibrated Palmer Drought Index) (Wells et al., 2004) are a few commonly used indicators. SPEI is arguably a more accurate representation of the regional drought condition, as it integrates the impact of both temperature and precipitation (Peng et al., 2024; Afshar et al., 2022; Vicente-Serrano et al., 2010). Since all these indices rely on aggregated monthly or weekly data, this creates a scale mismatch.
While the intramonthly variation of temperature is typically incorporated in heatwave identification, the intramonthly variations of the meteorological variables are seldom considered in drought characterization, primarily because conventional drought metrics overlook short, intense rainfall bursts interspersed with extended dry spells. However, augmentation of droughts across the world, due to increasingly skewed distribution of precipitation resulting in short, intense spells followed by long dry periods, is highlighted by many recent studies (Rawat et al., 2024; Singh et al., 2023, 2021). Such intramonthly variations in precipitation spell/frequency have reportedly increased the occurrences of droughts, especially over the tropical and subtropical regions (Singh et al., 2023). The Standardized Net Precipitation and Distribution Index (SNEPI) developed by Singh et al. (2021) quantifies the droughts by accounting for the daily net precipitation distribution characteristics.
Therefore, while CDHWs are generally quantified at weekly and daily resolutions using moisture-balance indices (e.g., weekly scPDSI with daily heatwaves, or fully daily standardized indices) (Zhang et al., 2024; Shan et al., 2024; Tripathy and Mishra, 2023; Mukherjee and Mishra, 2021), none has integrated intra-month precipitation-spell structure directly into the drought component. Prior studies have provided valuable insights into CDHW identification, but their reliance on aggregated weekly or daily deficit indices does not capture the internal spell variability that governs drought-heatwave linkages.
This study, addresses this specific knowledge gap, and advances the field by coupling SNEPI's realistic spell-sensitive drought metric with daily heatwave detection to construct a 7-decade record of CDHW events across India. Unlike traditional indices that aggregate daily data into a simple monthly sum, SNEPI explicitly computes the non-uniformity of daily net-precipitation distribution using a Uniformity Coefficient (Uc) embedded within its formulation (Singh et al., 2021). By incorporating the intra-month distribution of precipitation spells into the index value itself, the proposed framework enables investigation of transition dynamics, inter-seasonal dependencies, and hotspot shifts in compound hazard severity that may remain obscured under traditional indices which effectively “interpret” variable rainfall as a flat average.
Hence, we hypothesize that the evolving intra-month precipitation spell distribution patterns have altered the frequency, persistence, and spatial distribution of CDHW occurrences, with impacts varying across diverse climate zones. Testing this hypothesis over India, with diverse climatic zones and precipitation variability, provides a novel, process-based perspective on the mechanisms driving CDHW intensification.
Therefore, the overall objectives of this study are to (a) investigate the regional evolution and dynamics of droughts, heatwaves, and their compound occurrences across India, (b) develop a robust framework to identify, categorize, and track CDHW events under varying climatic conditions, (c) evaluate spatial and temporal shifts in CDHW characteristics across historical periods and climate zones, and (d) assess the broader implications of CDHW events, particularly their potential impacts on agriculture and associated vulnerabilities.
This article is organized as follows. Section 2 details the dataset and the study area. Section 3 describes the detailed methodology, followed by the results and discussion in Sect. 4 and conclusions in Sect. 5.
India is chosen as our study region to test the hypothesis, which spans about 3.29 million km2, encompasses diverse climate zones (as shown in Fig. 1; Beck et al., 2018; Peel et al., 2007; Köppen, 1884), and exhibits heterogeneous hydro-meteorological characteristics. India has been facing repeated extreme heatwave events exacerbated by unpredictable monsoon patterns and rising temperatures (Webster et al., 1998). Notably, many studies have highlighted a substantial shift in the spell/frequency characteristics of precipitation and, thereby, its influence on the hydrological extremes (Goel and Rajendran, 2025; Vinnarasi and Dhanya, 2016; Singh et al., 2014; Sushama et al., 2010; Dash et al., 2009).

Figure 1Location of states chosen as hotspots and the climatic zones over India: (1) Rajasthan in Hot Desert (BWh)/Arid, (2) Himachal Pradesh in Humid Subtropical and Cold Desert (BWk), (3) West Bengal in Tropical Wet and Dry/Tropical Savannah (Aw) and Humid Subtropical (CWa), (4) Assam in Humid Subtropical/Temperate (Cwa), (4) Andhra Pradesh in Semi-arid (BSh) and Tropical Wet and Dry (Aw), (5) Kerala in Tropical Monsoon/Tropical Wet (Am)).
The top northernmost region of India was unaffected by the 2002 monsoon season drought, in contrast to the peninsular and northwestern regions (Chuphal et al., 2024). In 1965, the central and eastern regions of India were the most severely affected by the most severe water year (Chuphal et al., 2024). Additionally, the eastern, northwestern, and southern regions of India were significantly impacted by the 2002 calendar year drought. Overall, Himachal Pradesh (located just below Ladakh) experienced the most severe droughts between 1901 and 2021 (Chuphal et al., 2024). Conversely, one of the top five heatwave hotspot states in the 2013–2022 decade was Rajasthan (Pai et al., 2013). The heatwave days also exhibited a substantial increase in the regions of North India, Northwest India, Central India, and Andhra Pradesh. Conversely, North India and West Bengal, from the east coast of the country, exhibited a substantial diminishing trend between 1961 and 2010 (Pai et al., 2013). Previous studies over the country had identified the hot regions (such as Central India and South India). See Fig. 1 to see the locations of some of these regions as major hotspots of CDHW events (Sharma and Majumdar, 2017).
We used the daily gridded precipitation (0.25° × 0.25°) derived from 6995 rain gauges (Pai et al., 2014) and maximum daily temperature (1° × 1°) derived from 395 stations (Vinnarasi et al., 2017; Srivastava et al., 2009) which was then resampled to 0.25° × 0.25° using bilinear interpolation to match the precipitation grid resolution, ensuring spatial consistency for grid-wise CDHW analysis, for a period from January 1951 to December 2016, covering mainland India.
Further, state-level annual crop-yield data (rice and wheat) were obtained from the Directorate of Economics and Statistics, Ministry of Agriculture and Farmers Welfare, Government of India (Government of India et al., 2024). For national-scale context, India-wide annual rice and wheat yield data for 1961–2016 were retrieved from the FAOSTAT database of the Food and Agriculture Organization of the United Nations (FAO, 2024). Both data sets provide yield in kilograms per hectare and were harmonised to common units and for recent decades (1981–2016) for the present analysis.
3.1 Extraction of individual extremes (droughts and heatwaves)
In this study, the Standardized Net-Precipitation Distribution Index (SNEPI) (Singh et al., 2021) at 1-month time-scale is used, which incorporates the intra-month precipitation spell variability, to enhance the characterization of meteorological droughts and their interaction with heatwave events. At each grid cell, drought conditions were defined following the threshold-based approach: SNEPI < −1, representing moderate to extreme drought anomalies relative to the climatological baseline. The binary drought occurrence at grid (x, y) and month t is obtained by:
For each decadal window k between 1951–2016, drought intensity (DI) is quantified as the average magnitude of SNEPI deficits during drought months. The decadal mean intensity is computed as:
where Nd,k is the number of drought months for each grid during decade k. This measure reflects the average severity of negative moisture anomalies, with higher negative values indicating stronger drought intensities.
Temporal persistence of droughts is determined by continuous drought sequences within B. Each drought spell m is defined as a contiguous run of months with SNEPI < −1, and the duration DD of the mth drought event is computed as:
where ts and te denote the start and end months of the mth drought event. For each decadal window, the mean drought duration is then calculated as:
where Mk is the total number of discrete drought spells detected during decade k. This parameter captures the persistence of moisture deficit episodes.
Drought frequency is further defined as the total number of independent drought spells per unit time at each grid cell. The normalized drought frequency, expressed as the number of spells per year, is estimated as:
where Ny,k represents the total number of years in the respective analysis window. thus denotes the mean annual drought occurrence rate for each location and decade.
Heatwaves are defined based on India Meteorological Department (IMD) criteria and widely cited Indian heatwave studies (Mishra et al., 2020; Rohini et al., 2016; Pai et al., 2013). According to IMD, a heatwave occurs when the daily maximum temperature is at least 40 °C in the plains, or when the daily maximum temperature exceeds local climatological normal by ≥ 4.5 °C, for 4 or more consecutive days. To capture the range of severities reported in the literature, we further stratified the events by fixed thresholds of 40, 42, and 45 °C, enabling assessment of moderate, severe, and extreme heatwaves, in the later stages. This adaptation preserves direct compatibility with established national standards while allowing a sensitivity analysis of heatwave intensity and duration across India's diverse climate zones. The binary heatwave occurrence at grid (x,y) and day t is obtained by:
A valid heatwave event is a sequence of consecutive days where persists for at least k = 4 d. A jth heatwave event (Hj) is identified if:
The duration is the persistence (in days) of a valid jth event.
For each decade k, let Sk be the set of all valid heatwave events j that occurred within that decade, then, the heatwave frequency (Fk) is the total count of valid heatwave events in decade k.
Then the decadal mean duration (Dk) is the average duration of all events in decade k:
Heatwave intensity is defined as the peak magnitude (maximum temperature) recorded during a valid jth event. And the average peak intensity of all events in decade k:
The spatiotemporal trends of drought and heatwave characteristics are further analysed using a frequently adopted noise-assisted data-analysis method known as Ensemble Empirical Mode Decomposition (EEMD) that is less sensitive to boundary conditions (Wang et al., 2014; Wu and Huang, 2010). Unlike standard linear trend analyses, EEMD separates deterministic signals from stochastic noise. Crucially, to ensure statistical robustness, a Monte Carlo Simulation approach (Wu et al., 2011) is integrated into the EEMD framework. For every variable, 10 000 samples of red noise are generated to establish a 10 % significance threshold (p < 0.1), ensuring that the trends represent significant physical regime shifts rather than random variability. Further mathematical details of the EEMD method and the significance testing framework are given in Sect. S2 in the Supplement.
3.2 Detection of CDHW events
The CDHW events are identified using a joint-occur occurrence sampling approach at the native grid scale. Drought conditions are defined using the 1-month SNEPI (SNEPI-1), which integrates the intra-monthly distribution of daily net-precipitation spells. A drought month is identified when SNEPI-1 falls below −1 at a grid cell. Coincidentally, a heatwave event is defined at the same grid cell if the daily maximum temperature exceeds 40 °C for more than or equal to four consecutive days. So, for each grid cell g and calendar month m in year y,
A CDHW month occurs when and .
The CDHW frequency for cell g over a given period (annual or decadal) is
where N is the number of months in the aggregation window.
This methodology involves observing compound extremes as events occurring at the same grid point, while nevertheless maintaining interdependence between the individual extreme events. In addition, the study includes sampling in various hotspots to analyze the distinct effects of compound events on different hydrological regions across India.
To aid interpretation of regional patterns of individual extremes, k-means clustering of the spatiotemporal footprints of droughts and heatwaves is performed additionally. Optimal cluster numbers were chosen using the silhouette criterion. This exploratory analysis is described in detail in the Supplement (Sect. S3.1; Figs. S2 and S3). The intersection of the clusters of drought and heatwave leading to compound clusters may not necessarily indicate simultaneous occurrence of both extremes to define CDHW events, but provide context for understanding the spatial organization of extremes or event footprint, i.e., the presence of both extremes at a particular grid for a minimum of 1 month.
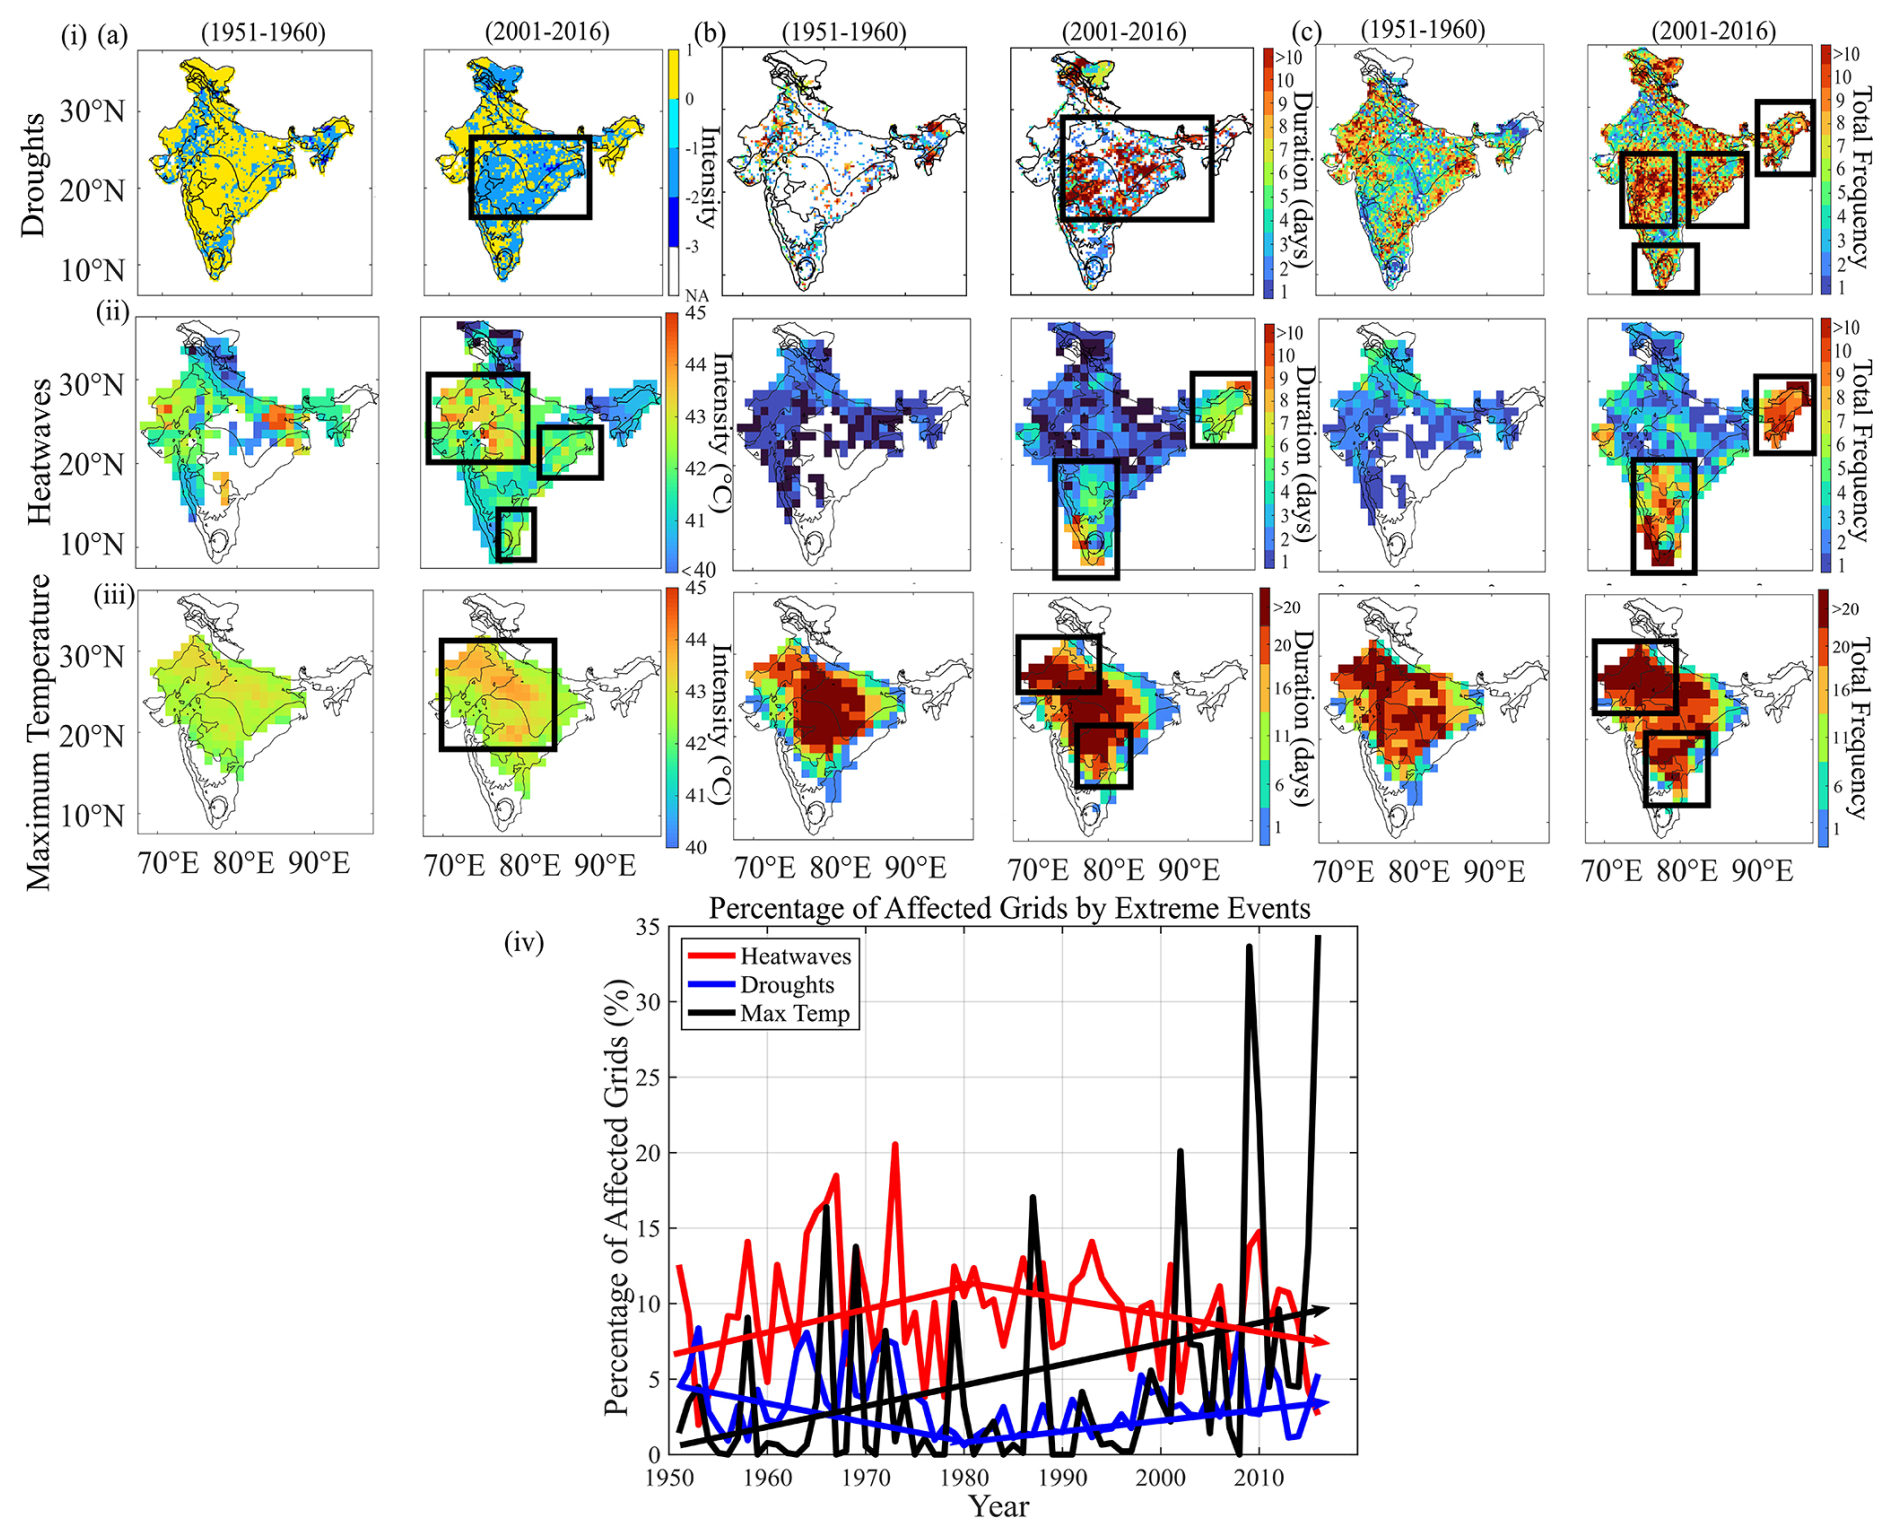
Figure 2Spatiotemporal evolution of (i) drought characteristics (a: intensity, b: duration, c: frequency), (ii) heatwave characteristics (a: intensity, b: duration, c: frequency), and (iii) maximum temperature characteristics (a: intensity, b: duration, c: frequency) over India during 2001–2016, as compared to the first epoch 1951–1960 (consistent with the statistically significant non-linear trends with p < 0.1); (iv) yearly percentage of affected grids by the individual droughts, heatwaves, and maximum temperature over the entire period of 66 years from 1951 to 2016.
4.1 Exploring the regional dynamics of individual drought and heatwave occurrences
We quantified the evolution of droughts (using SNEPI at 1-month time scale) and heatwaves (daily gridded maximum temperature exceeding 40 °C continuously for more than 4 d) over 6 epochs spanning from 1951 to 2016. By filtering stochastic variability through Monte Carlo-validated EEMD analysis (p < 0.1), robust regime shifts are identified. Drought severity declined over western and northern India, while moderate and severe droughts escalated in the east and south regions (Fig. 2i-a). For brevity, only the first (1951–1960) and last (2000–2016) periods are shown in Fig. 1. The details of the temporal evolution over the decades are demonstrated in Fig. S1. Noteworthy is the nuanced pattern observed in extreme drought occurrences, which displayed a declining trajectory in the far eastern reaches but registered an upward trend in southern and eastern-central India. Notably, SNEPI revealed more pronounced and persistent droughts in tropical monsoon or wet areas compared to the known arid regions as reported by the conventional indices in the past literature (Singh et al., 2021). This highlights the importance of rainfall spell variability in monitoring the droughts and its role in escalating aridity or humidity in wet or dry locations.
Drought duration exhibited a similar narrative, with declining occurrences over western India, while central, eastern, and extreme north experienced increasing trends in prolonged droughts (Fig. 2i-b). Notably, the most persistent drought durations, previously concentrated in northwestern and western India, have expanded and intensified eastwards, now encompassing central and eastern India and even some parts of the southwest coast. The spatial distribution of drought frequency has also shifted significantly from 1951–1960 to 2001–2016, with a notable intensification (Fig. 2i-c). Initially, droughts were concentrated in the west, northwest, and southeastern coasts, but by 2001–2016, their frequency exceeded and shifted to the southwestern coast, the entire eastern and northeastern India, extreme northern regions, Indo–Gangetic plains, and the far south. This suggests that areas previously less affected by frequent droughts have now become highly vulnerable, highlighting an intensification of arid conditions across multiple climatic zones.
The examination of heatwave attributes in India indicates a notable intensity and geographical extension over time. From 1951 to 1960, heatwave intensities (Fig. 2ii-a) exceeding 40 °C threshold were predominantly restricted to western India, segments of the Indo–Gangetic plains, eastern India, and the central Deccan plateau, while southern, central, and northeastern India encountered negligible occurrences. Between 2011 and 2016, these severe temperatures progressively proliferated in western and central India, while the eastern and southeastern coasts, along with much of the nation, recorded maximum temperatures rising between 30 and 40 °C, remaining just below the sever heatwave criteria. Heatwave durations (Fig. 2ii-b) also intensified. In the 1950s, valid heatwave events (meeting the minimum 4 d criteria) were rare and typically short-lived across impacted areas. However, by 2011–2016, these events experienced a significant escalation, extending to as much as 10 consecutive days in extreme northeastern India and the southern coast (Kerala). Similarly, the frequency of heatwaves (Fig. 2ii-c), which ranged from 1–2 occurrences per decade in the Indo–Gangetic plains, western, and northeastern India, with certain regions experiencing up to 4–6 occurrences, surged to 8–10 occurrences across the entire northeast, Deccan plateau, and southwest coast, with over 10 occurrences in specific locations. Western India, previously subjected to regular heatwaves, has witnessed an escalation to 6–8 occurrences per decade. On average, the frequency of heatwaves across India has increased by approximately 86 % over the past 6 decades. Figure S1 illustrates the comprehensive progression of heatwave features over each decade. The findings underscore the escalating severity, duration, and frequency of heatwaves in India, accentuating the rising climate dangers linked to intense heat.
However, this increase in heatwave occurrences over southern and eastern India is not consistently reflected in the maximum temperature characteristics. In recent decades, the geographical range of maximum temperatures has extended into central and southern India; nonetheless, the most extreme maximum temperatures (Fig. 2iii-a) continue to be concentrated in the northern, northwestern, and central arid regions from 2011 to 2016. Likewise, the duration of high maximum temperatures (Fig. 2iii-b) surpassed 20 d predominantly in northern, northwestern, and central India from 2001 to 2016, signifying enduring heat stress in these areas. Conversely, the frequency of exceptional maximum temperature events (Fig. 2iii-c) seems more dispersed yet continues to be significant in the northern, northwestern, and southern regions in recent decades. Figure S1a–c depicts the evolution of maximum temperature characteristics across each decade. This indicates that although heatwaves have proliferated nationwide, the prevailing maximum temperature intensities and durations remain predominant in historically warmer and drier areas, signifying possible alterations in heatwave dynamics beyond mere temperature extremes.
The temporal evolution of the spatial extent of individual extreme (Fig. 2iv), reveals distinct and non-linear behaviours across heatwaves, droughts, and maximum temperature extremes. The percentage of grades affected by heatwaves exhibits an increase from 12.5 % in the 1950s to 21 % by mid-1970s, which then decreased to ∼ 15 % by 2010, with further decline to ∼ 10 % by 2016, indicating localised extreme heat wave occurrences. In contrast, the spatial footprint of droughts displays a markedly different evolution. Drought-affected grades speak early in the record, reaching ∼ 4.4 % in 1951 and attaining a local maximum around 1964. This is followed by a sustained decline to 3 % during the mid-1980s, after which a renewed expansion is evident, culminating in a maximum of ∼ 5 % by 2016, suggesting a resurgence of widespread drought conditions in the recent decades. The evolution of maximum temperature shows the strongest and most persistent spatial expansion of more than 16 % by 2016, representing more than a twofold increase relative to earlier peaks. Notably, the divergence between heatwave and maximum temperature spatial extents in the recent decades indicates a decoupling between mean-state thermal warming and heatwave occurrence, suggesting that in increasing background temperatures do not necessarily translate into a proportional expansion of heatwave-affected areas.
A separate correlation analysis (Supplement, Fig. S1d) illustrates feeble correlations among these extremes, with maximum temperature duration and heatwave duration (0.02), maximum temperature frequency and heatwave frequency (0.04), and near-zero values for drought-heatwave associations, indicating that their simultaneous occurrence may not be predominantly influenced by common underlying factors but rather by autonomous processes that converge under particular circumstances. This demands additional examination of compound CDHW events, in which simultaneous droughts and heatwaves may exacerbate socio-environmental hazards beyond those seen in standalone extremes.

Figure 3(i) Spatiotemporal evolution of the relative frequency of compound drought and heatwave (CDHW) occurrences over the 6 decades, showing a statistically significant shift from the west to eastern India, with the probability of occurrence ranging between 10 % and 50 %. (ii) A temporal trend in the percentage of grids over India affected by each of the individual droughts and heatwaves and the CDHW occurrences (trends exceeding the 90 % confidence bounds of stochastic noise). (iii) The evolution in the CDHW occurrences over selected hotspots showing a decrease in occurrences during the mid-term, whereas increased occurrences over both the initial and the final years under consideration.
4.2 Grid-scale joint occurrence of droughts and heatwaves
The joint behaviour of meteorological droughts and heatwaves reveals distinctly significant spatial and temporal evolution across India during 1951–2016 as shown in Fig. 3. Crucially, the identification of these evolving patterns relies on the specific sensitivity of the SNEPI framework; a comparative analysis (detailed in the Supplement, Sect. S3.2, Fig. S4) demonstrates that while conventional indices like SPEI accurately captures arid-zone hotspots, they often underestimate compound risks in humid and tropical zones. SNEPI, by explicitly accounting for intra-monthly precipitation spell persistence, captures prolonged land-atmosphere coupling events that SPEI misses, particularly during the monsoon-retreat and cool seasons.
Decadal CDHW maps (Fig. 3i) show that, during the initial decades, compound extremes were prevalent in northwest and central India, embracing hot semiarid regions and segments of humid subtropical zones, with the probability of occurrence reaching up to 30 %–50 %, underscoring the strong concurrence of the two individual extremes in these climatologically vulnerable regions. From the 1980s onward, a pronounced transition occurred, with the temporary decline in joint occurrence. However, subsequent decades displayed a marked eastward and southward expansion. By the 1991–2016 period, large parts of eastern India and segments of the southern peninsula recorded joint occurrence of 20 %–30 %, reflecting both intensified heatwave activity and changing drought characteristics consistent with observed warming trends. Temporal evolution analysis of national-scale averages (Fig. 3ii) confirms this shift: the frequency and spatial footprint of CDHW events increased after 1980, in line with rising drought occurrences. The states of Kerala, Assam, West Bengal, and Himachal Pradesh and parts of central and northeast India emerged as prominent hotspots of the compound hazards, highlighting their heightened vulnerability during the recent years after a significant decline till 1980s (Fig. 3iii). These regions, historically regarded as humid or moisture-secure, now experience concurrent compound extremes, signalling a significant alteration of hydro-climatic regimes, contrary to earlier studies (e.g., Mukherjee and Mishra, 2021) which suggested that the brunt of the combined hazards was largely confined to the arid and semi-arid regions. The SNEPI-based detection confirms that these new hotspots are driven by precipitation deficits in transitional seasons, periods where parametric assumptions in traditional indices often mask deviation severity.
To confirm that these expanding hotspots represent physically coupled events rather than random coincidence, the observed joint probability of co-occurrence is compared against the product of their marginal probabilities during the recent decades (1981–2016) (see the Supplement, Sect. S3.2, Fig. S5). demonstrating a statistically robust positive dependence beyond the simple arithmetic overlap of more frequent individual hazards.
To further aid interpretation of these large-scale spatial modes, supplementary analyses were performed on the individual extremes. Drought and heatwave footprints were separately clustered using the k-means algorithm (optimal cluster number = 3 for both hazards, the Supplement, Sect. S3.1, Fig. S2). The resulting spatiotemporal clusters and their decade-wise overlaps are provided in Fig. S3i and ii, offering context for the evolving spatial patterns discussed above. These clustering results support, but are not essential to, the primary joint-occurrence findings presented here.
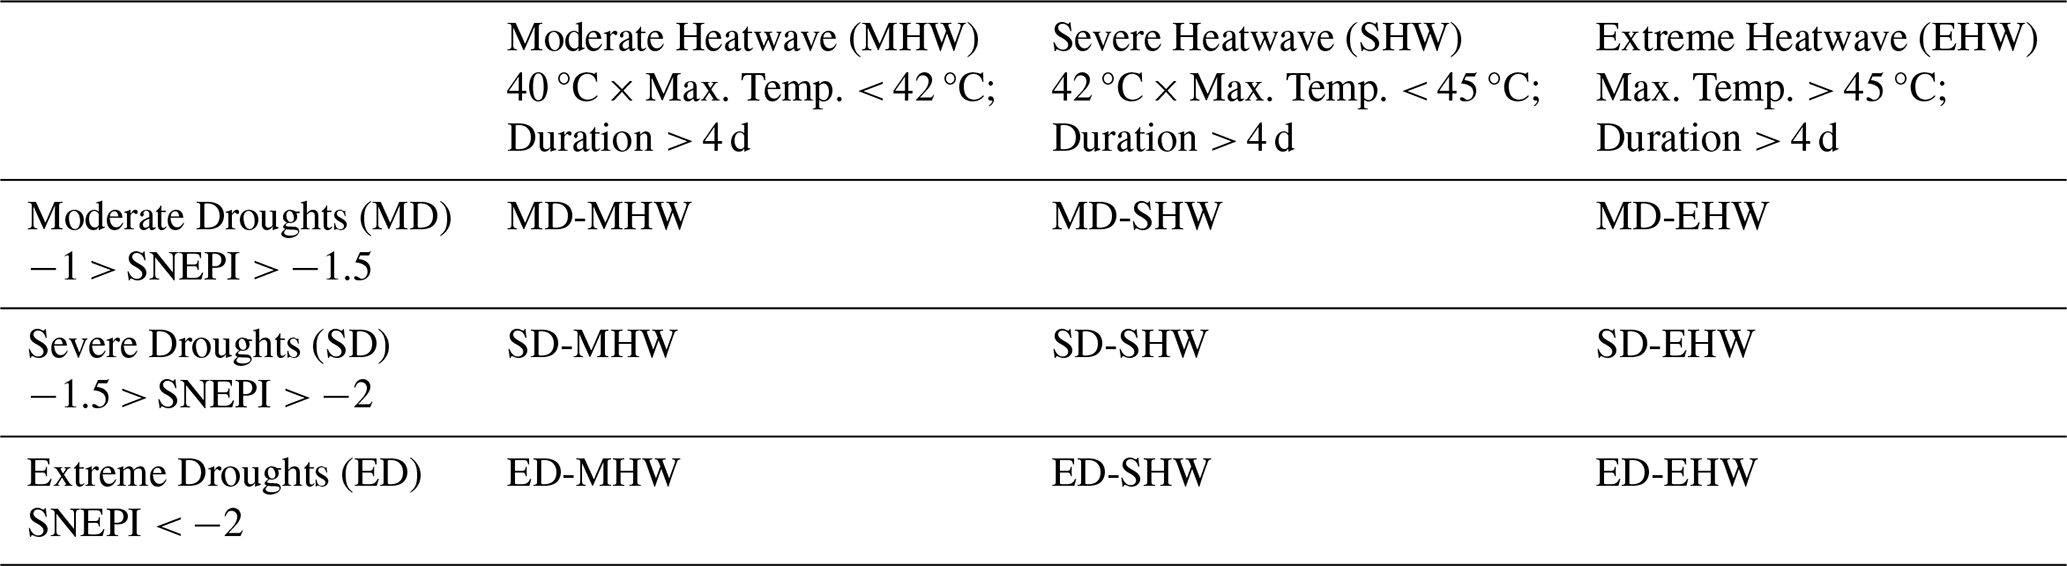
Table 1Categorization of the different compound events constituted of different types of droughts coincident with different types of heatwaves.
4.3 Evolution of CDHW impact categories across India
To understand the variations in the intensity of the compound extremes, we classified the individual droughts into moderate (−1 > SNEPI > −1.5), severe (−1.5 > SNEPI > −2), and extreme (SNEPI < −2) droughts based on 1-month SNEPI values. Similarly, the heatwaves are classified into moderate HW (40 °C < Max. Temp. < 42 °C; Duration > 4 d), severe HW (42 °C < Max. Temp. < 45 °C; Duration > 4 d), and extreme HW (Max. Temp. > 45 °C; Duration > 4 d). These nine compound events are further grouped into 5 broad impact categories (indicated in different colors) as shown in Table 1, assuming similar impacts within each category. These five categories are named as: Moderate CDHW (MD-MHW), Elevated CDHW (MD-SHW, SD-MHW), Severe CDHW (SD-SHW, MD-EHW, ED-MHW), Intense CDHW (SD-EHW, ED-SHW), and Extreme CDHW (ED-EHW) categories.

Figure 4(a) Spatial evolution of impact-based CDHW categories between 1951–1960 and 2001–2016 shows a significant intensification (in terms of frequency (count)) and shift in occurrence patterns. (b) Decadal grid count distribution of the CDHW categories highlighting an overall increase in the affected grids across all severity levels. (c) Average frequency (mean count) of CDHW categories per grid across decades, illustrating a multi-fold increase in all categories.
The evolution of the identified CDHW categories throughout India indicates a statistically significant (p < 0.1) change in their spatial distribution and frequency over time (Fig. 4a). Moderate CDHW episodes, initially localized in the west, northwest, and certain eastern regions from 1951 to 1960. However, these have markedly proliferated towards the northeast, southeast coast, southwest, southern, and central India between 2001 and 2016. Likewise, Elevated and Severe CDHWs, previously restricted to the north and west, have intensified across the northeast, southeast, and northern Deccan plateau, accompanied by significant decline in their prevalence in the north and west. Intense and Extreme CDHW episodes, previously rare in the mid-20th century, have progressively surfaced in the east, southeast, northeast, and Deccan plateau, but Extreme CDHW occurrences remain relatively few. Figure S6 depicts the entire evolution of each of the CDHW categories over each decade.
The decadal grid count distribution of CDHW categories (Fig. 4b) indicates a general increase across all severity levels until 1980, a decline from 1981 to 1990, and a subsequent revival, culminating in a peak from 2001 to 2016, during which the largest total number of affected grids was documented. Overall, the first three categories, Moderate, Elevated, and Severe, have sprawled over the whole country, with an almost fourfold increase in the number of affected grids. Meanwhile, Intense events have risen by 3.5-fold, and Extreme events have surged dramatically, with almost no spatial coverage during the initial decades to an almost 25-fold increase during 2001–2016.
The average frequency per grid for all CDHW categories has also significantly increased (Fig. 4c). Moderate CDHWs grew over fourfold (0.15 to 0.62), Elevated CDHWs rose from 0.12 to 0.50, Severe CDHWs nearly quintupled (0.09 to 0.43), and Intense CDHWs increased by more than fivefold (0.02 to 0.11) between 1951–1960 and 2001–2016. Even infrequent Extreme CDHW episodes have shown a quantifiable rise. The significant increase in both the frequency and spatial extent of CDHWs highlights a growing risk of compounded climate extremes in India. The extensive escalation of several CDHW categories highlights a significant transformation in India's extreme climatic patterns.
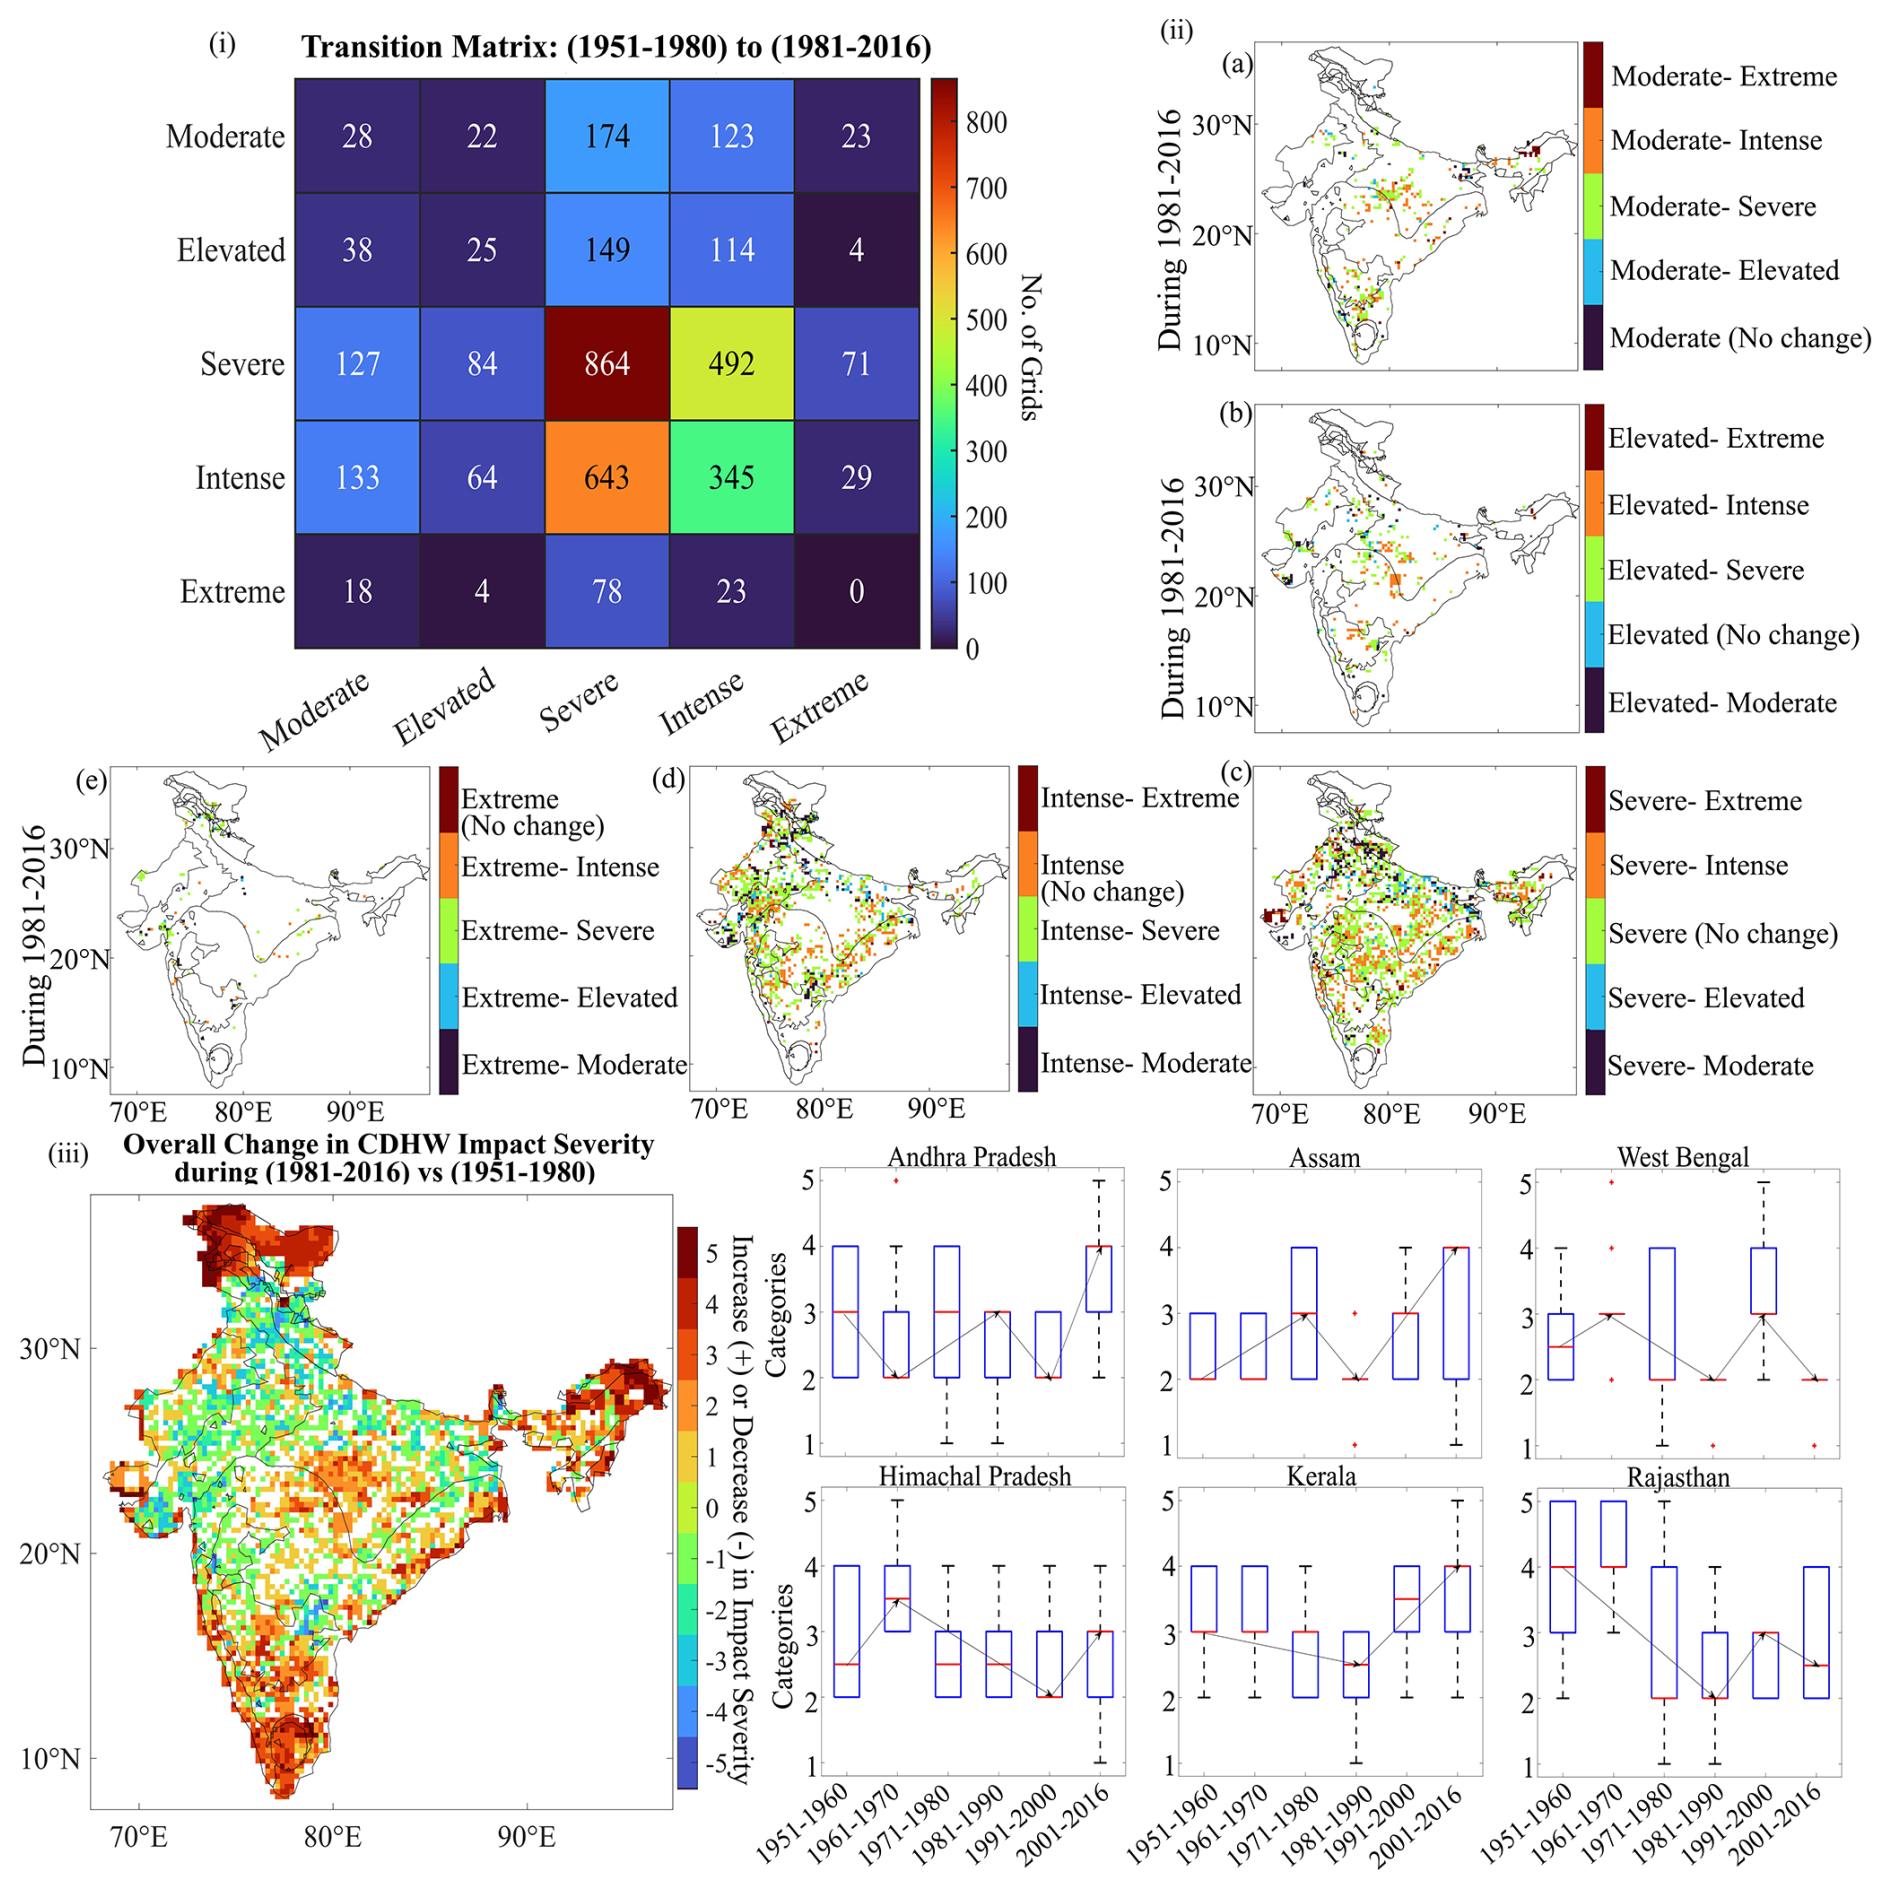
Figure 5(i) Transition matrix of the dominant CDHW impact categories between 1951–1980 and 1981–2016, quantified using the number of grids transitioning between categories over time to illustrate the shift in climate event severity. (ii) Spatial change maps illustrating the CDHW severity transitions between 1951–1980 and 1981–2016, showing the persistence and intensification patterns of the different CDHW categories: (a) Moderate, (b) Elevated, (c) Severe, (d) Intense, (e) Extreme. (iii) Overall change map identifying hotspots of intensified CDHW events during 1981–2016 as compared to 1951–1980, with positive values indicating an increase in severity and negative values indicating a decrease, and zero denoting no change. (iv) Decadal evolution of the median CDHW categories over identified hotspots from 1951–2016, highlighting the dynamic nature of the CDHW evolution.
4.4 Transition between compound event categories
We further examined the transition dynamics across different severity categories. Analyzing these transitions will elucidate if moderate incidents are escalating into more severe ones, the frequency of regional shifts between categories, and whether certain locations are becoming progressively susceptible to extreme CDHW events over time. The transition matrix (Fig. 5i) is now derived by identifying the dominant event category for each grid during 1951–1980 and 1981–2016 and computing the frequency of transitions between the categories. The two analysis windows 1951–1980 and 1981–2016 were selected to reflect the clear temporal break observed in the earlier results. The earlier analyses showed a modest rise up to the late 1970s, a short plateau or dip through the 1980s, and a pronounced, sustained increase thereafter. This inflection around 1980 marks the onset of the modern warming era for the country, and thereby provides a natural division for examining how compound-event severity has evolved.
A substantial fraction of grids originally classified as Moderate (46.4 %) and Elevated (43.3 %) shifted to Severe or higher categories. The Severe category demonstrated the greatest persistence (864 grids) and notable escalation, with 36.3 % grids evolving into Intense and 5.2 % advancing to Extreme events. Only 7.6 % of both Moderate and Elevated grids retained their original severity, indicating that previously moderate events are evolving into higher-impact extremes, hence reducing the prevalence of lower-intensity events across the study region. Furthermore, while only 23 grids transitioned directly from Moderate to Extreme, the escalation pathway through Severe (71 grids) and Intense (29 grids) suggests a cascading amplification of CDHW severity. Historically less intense CDHW events are now manifesting with higher severity.
The spatial manifestation of these transitions (Fig. 5ii) further substantiates this escalation, with Moderate events enduring in portions of the eastern Indo–Gangetic Plains and the western coast while intensifying to Elevated, Severe, and Intense categories elsewhere. Likewise, Elevated events demonstrated a widespread shift to Severe and Intense classifications, especially in central India and the Deccan Plateau, whereas northeast India underwent direct shifts to Extreme occurrences. Severe occurrences, despite their persistence, intensified across western, northwestern, eastern, and coastal regions, with minor weakening in the Indo–Gangetic Plain and northern India. Intense occurrences persisted in the eastern and coastal regions while intensifying in some regions in the north. Notably, no grids maintained an Extreme categorization, with changes predominantly to Intense and Severe in southern and western India, while declines occurred in some other regions. These shifts further underscore the intensification of CDHW severity, characterized by a reduction in moderate events and an increasing prevalence of high-impact occurrences.
Additionally, the spatial and decadal evolution of the dominant CDHW category across India from 1951 to 2016 is presented in Fig. S7, further highlighting the progressive intensification and regional shifts in every severity over time.
The overall change map (Fig. 5iii), with positive values indicating an increase in CDHW severity and negative values denoting a decrease during 1981–2016, aids in the identification of hotspots of the intensified CDHW events. The southern, southwestern, and southeastern coasts, spanning from Andhra Pradesh to Kerala, northeastern states, parts of Chhattisgarh, Madhya Pradesh, upper Gujarat, and the western borders of Rajasthan, experienced an increase in CDHW severity. The spatial patterns correspond with the hotspots identified for individual droughts and heatwaves (Fig. 2i and ii), and a decadal analysis further substantiates the strengthening of the CDHW categories over those hotspots (Fig. 5iv). Andhra Pradesh transitioned from Elevated to Intense post-2000, and Assam along with the broader Northeast, evolved from Severe to Intense occurrences. Although Himachal Pradesh showed a fluctuation between Elevated and Severe occurrences, Kerala experienced an escalation in severity after 1990, whilst Rajasthan and West Bengal exhibited a decline in severity.
4.5 Inter-Seasonal CDHW dependencies
Additionally, we analyzed the inter-seasonal dependency between droughts and heatwaves to understand their role in modulating CDHW occurrences. For this, first the individual drought and heatwave data aggregated for each season are extracted, and then the possibility of droughts in one season being followed by heatwaves in the next season is investigated. Temporal correlations were computed separately for each year over the 66-year period (1951–2016) to assess the strength of this seasonal linkage and its variability over time. This was then followed by examining how these seasonal drought-heatwave dependencies, computed annually over the 66-year period, influence the interannual variability in the frequency and intensity of CDHW events.
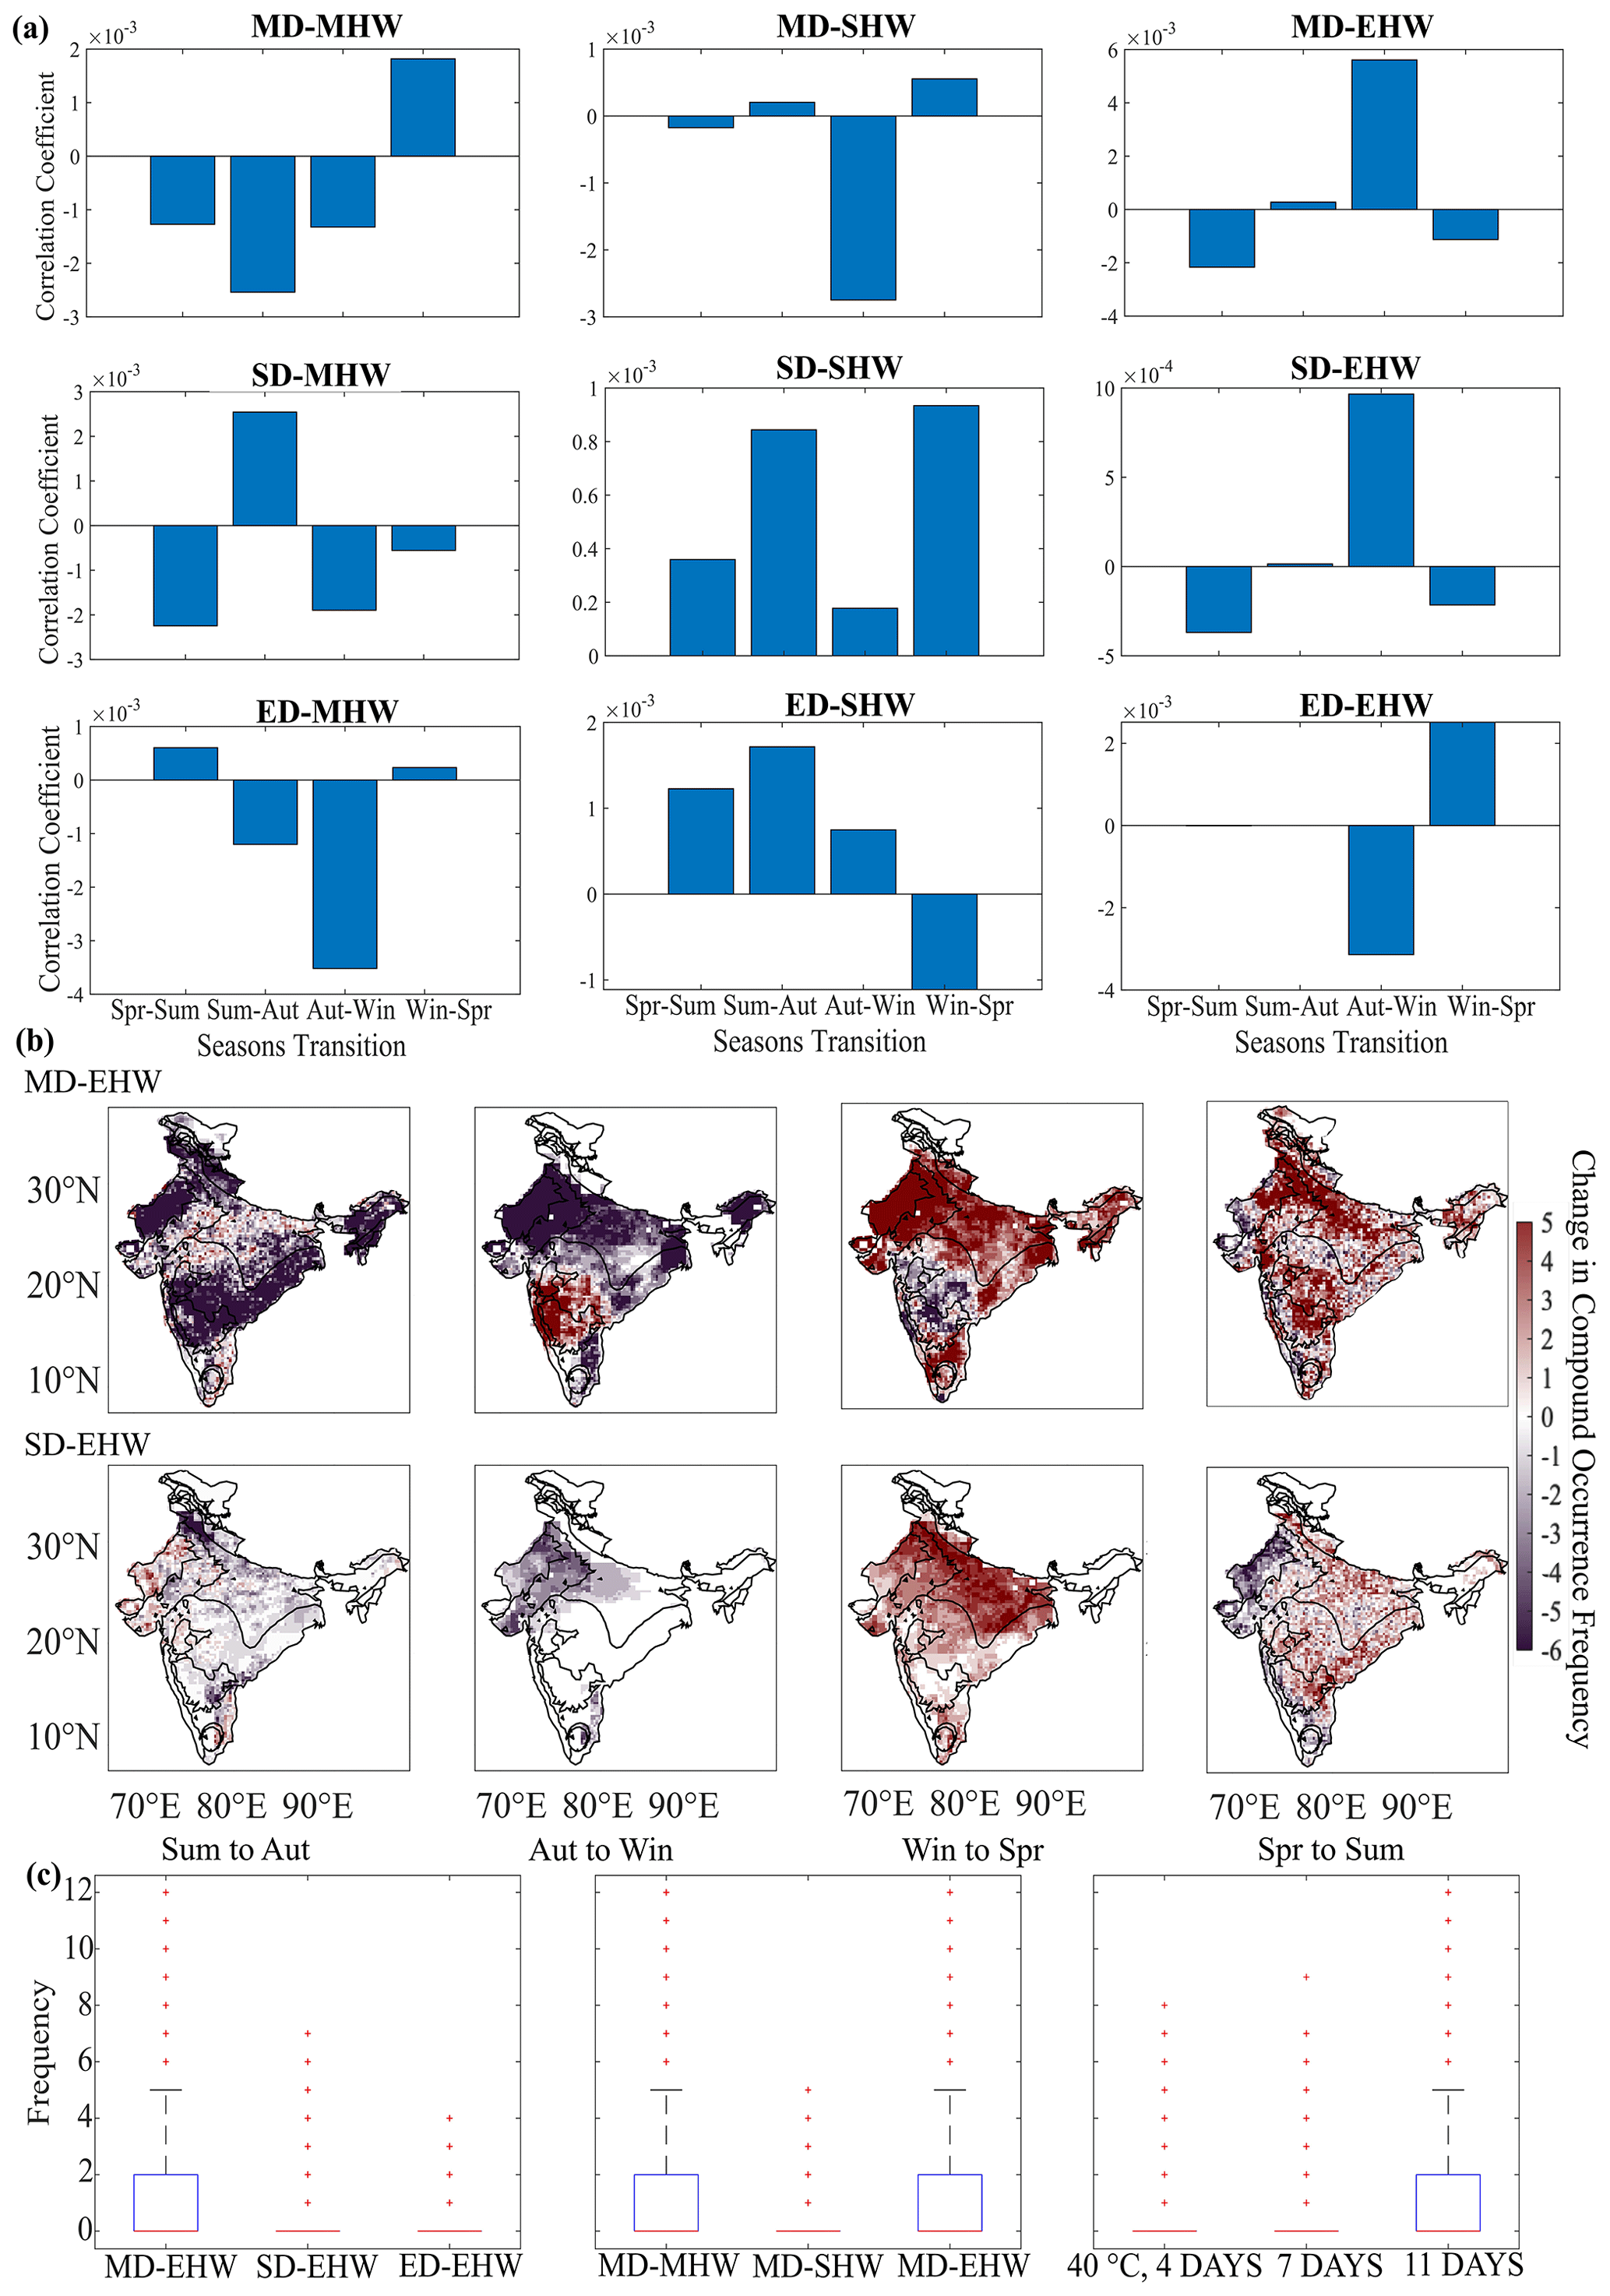
Figure 6(a) Correlation between seasonal shift in individual drought and heatwave occurrences and their compound occurrences for all the 9 categories of the CDHW events. (b) Spatial evolution and the change in frequency of the two major compound event categories (MD-EHW and SD-EHW) exhibiting significant correlation between the compound occurrences and the seasonal shift in the individual droughts and heatwaves- Regions highlighted in shades of red denote a positive frequency difference, whereas regions in shades of blue show a negative frequency difference. (c) Boxplots showing the change in frequency of the CDHW events with the increase in the drought intensity, heatwave intensity (increase in temperature), and the duration of heatwaves (left to right).
The correlation analysis of the nine distinct categories of individual droughts and heatwaves from Table 1 (Fig. 6a) shows that MD-EHW and SD-EHW demonstrate the strongest seasonal dependencies with CDHW intensities. MD-EHW exhibits the strongest positive link during the autumn-to-winter transition, suggesting that moderate drought conditions in autumn may intensify elevated temperatures in winter, resulting in an intensified CDHW occurrence. Conversely, SD-EHW exhibits the highest negative correlation during the spring-to-summer transition, suggesting that intense drought conditions in spring may suppress subsequent heatwave development, thereby reducing the likelihood of extreme CDHW events.
To evaluate the influence of these predominant seasonal dependencies, we examined the spatial progression and frequency variations of MD-EHW and SD-EHW events throughout India during the seasons (Fig. 6b). MD-EHW shows the most pronounced positive frequency differences over northern and northwestern India, the Indo–Gangetic plains, and eastern India, where post-monsoon drought conditions persist into winter, intensifying CDHW occurrences. A discernible increase is observed during the summer-to-autumn transition, especially in southwestern India, the eastern coastline, and the far northeast, due to lingering heatwaves. The reduction in CDHW occurrences for SD-EHW is particularly evident in western, northwestern, and southern India during spring-summer and autumn-winter, while an increase in frequency is noted in the Indo–Gangetic plains and southern and eastern India during winter-spring.
Prolonged heatwave durations could further exacerbate the frequency and severity of compound events, leading to heightened risks of heat-related impacts (Fig. 6c). Further, a spatial analysis is illustrated in Fig. S8, highlighting the influence of drought intensity, heatwave duration, and temperature variations on CDHW occurrence frequencies.
A significant revelation is the emergence of the southwest coast as a new CDHW hotspot. Historically regarded as a humid area, it is currently undergoing extended intra-monthly hot and dry spells, resulting in a rise in compound drought-heatwave occurrences. This change is especially alarming due to the region's significant rainfall fluctuation within a month. This study, utilizing SNEPI, has demonstrated an escalating impact of drought-induced CDHW events in wet regions, contrasting with prior research that depended on precipitation-based indices (e.g., SPI, Sharma and Majumdar, 2017), which predominantly identified previously arid areas as hotspots. This indicates that alterations in precipitation patterns, along with post-monsoon warming, have substantially modified the spatial distribution of CDHW occurrences, highlighting an urgent necessity to re-evaluate climate risks in areas historically not prone to drought.
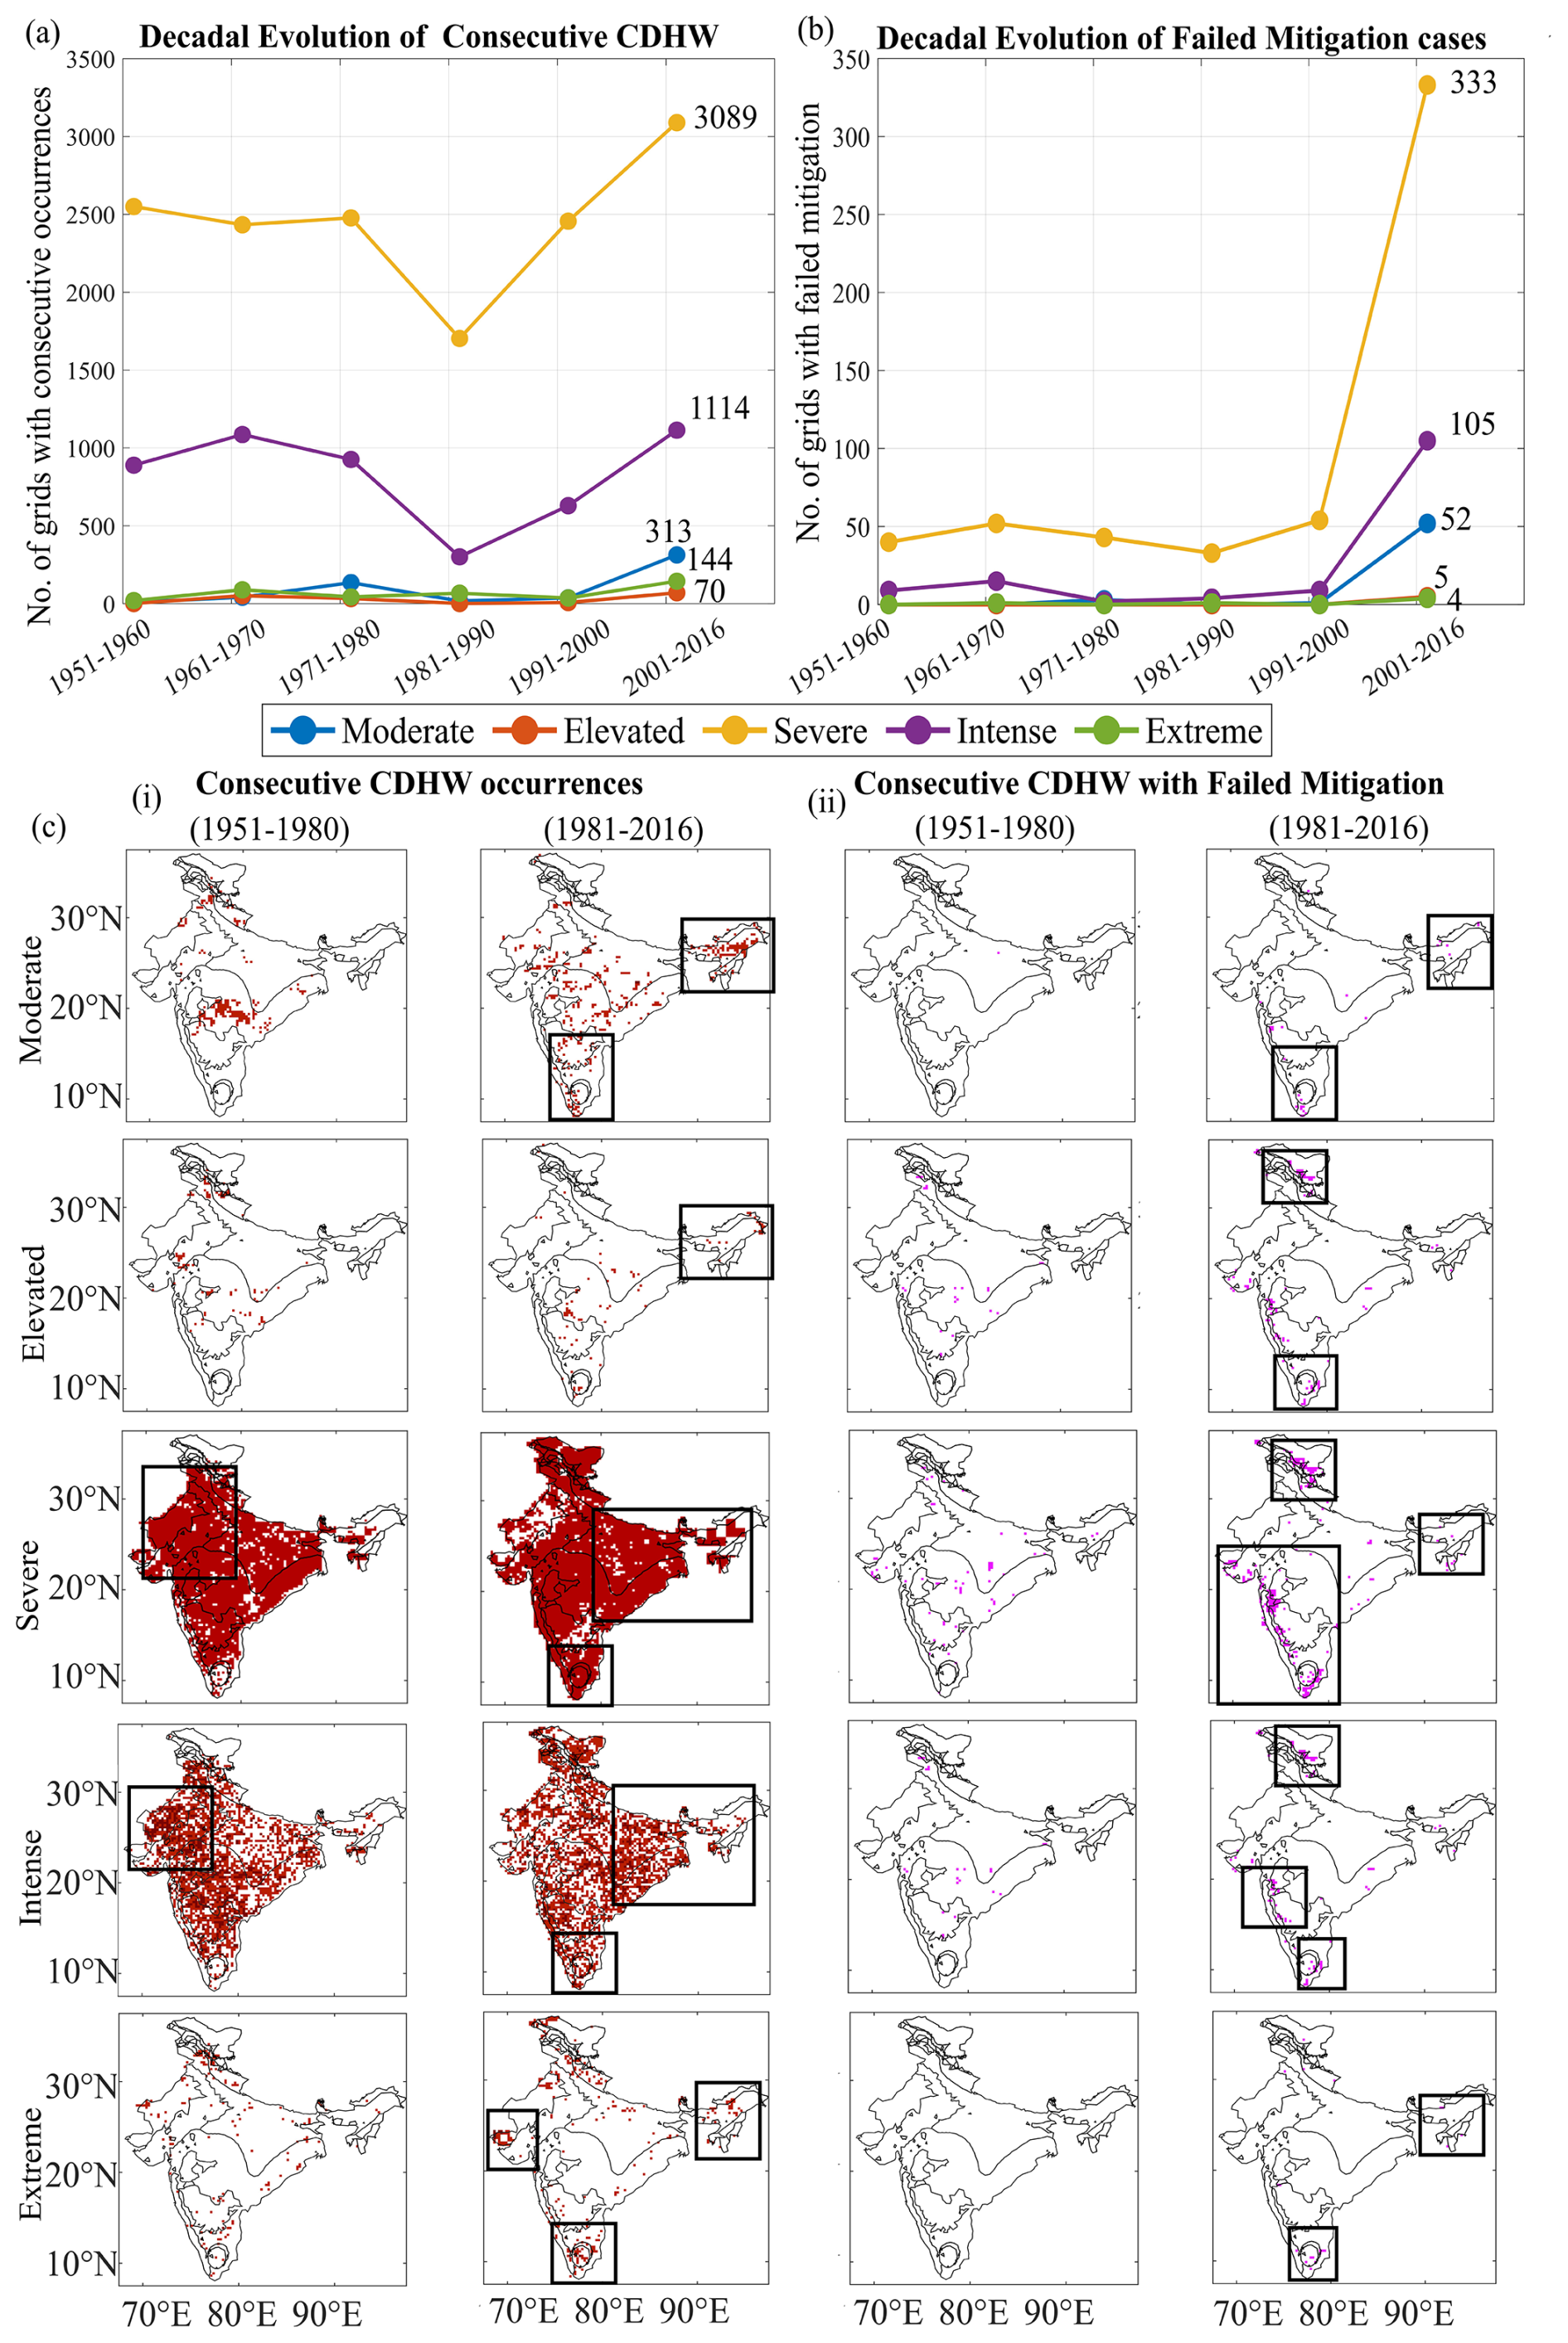
Figure 7(a) Decadal evolution in the number of grids of the Indian Subcontinent that are suffering from Concurrent-CDHW per category. (b) Decadal evolution of the spatial spread affected by failed mitigation due to a wet spell that occurred between two consecutive CDHW events but failed to prevent their recurrence. (c-i) Spatial evolution of the Concurrent CDHW categories during 1951–1980 and 1981–2016; (c-ii) Spatial evolution of the consecutive CDHW categories with failed mitigation during 1951–1980 and 1981–2016, showing a statistically robust regime shift (p < 0.1).
4.6 Persistence and recurrence of CDHW events
Further, we analyze the persistence and recurrence of CDHW events by examining their consecutive occurrences across years, leading to prolonged CDHW occurrences (Fig. 7a and c-i). Additionally, we assess the role of intervening wet spells (SNEPI > 1) in mitigating these events. If a wet spell followed a CDHW event but was immediately succeeded by another CDHW, it was classified as a failed mitigation. This analysis (Fig. 7b and c-ii) evaluates whether short-term wet periods provide effective relief or if drought-heatwave conditions persist despite intermittent wet spells, highlighting the resilience of CDHW events.
Over the decades, concurrent CDHW events have not only intensified but also expanded their footprint across India, with their persistence challenging significant portions of India. In the early decades, concurrent “Moderate” CDHW occurrences were predominantly limited to the northern and Deccan plateau regions, which have proliferated significantly over central, western, southern, and northeastern India during the recent decades (Fig. 7c-i), with an increase in spread of 34.7 times. While concurrent “Elevated” CDHW events rose almost 69-fold towards central and northeastern India during the recent decades, “Severe” events rose by 23.6 % spreading towards the north, south, and northeast; “Intense” events by 25.3 %; and “Extreme” events expanded 6.2 times (Fig. 7a). However, despite the occurrence of wet spells between consecutive CDHW events, these brief reprieves often failed to break the sequence. Failed mitigations became increasingly common within concurrent Moderate (16.6 % increased spread), Severe (10.8 %), and Intense (9.4 %) CDHW cases, highlighting the persistence of the extreme hot and dry conditions (Fig. 7b).
It is particularly notable that even the traditionally wet regions, such as the western coast and the northeast, where tropical climates with frequent wet spells previously acted as a buffer, are now failing to mitigate concurrent CDHW occurrences. Spatially, failed mitigations in concurrent Elevated, Severe and Intense CDHW events are majorly observed across western, southwestern, southeastern, and northeastern regions (Fig. 7c-ii), thereby enforcing that intermittent wet spells are no longer providing sufficient relief and are unable to curb the persistence of consecutive CDHW events, allowing them to intensify and prolong their impact over time.
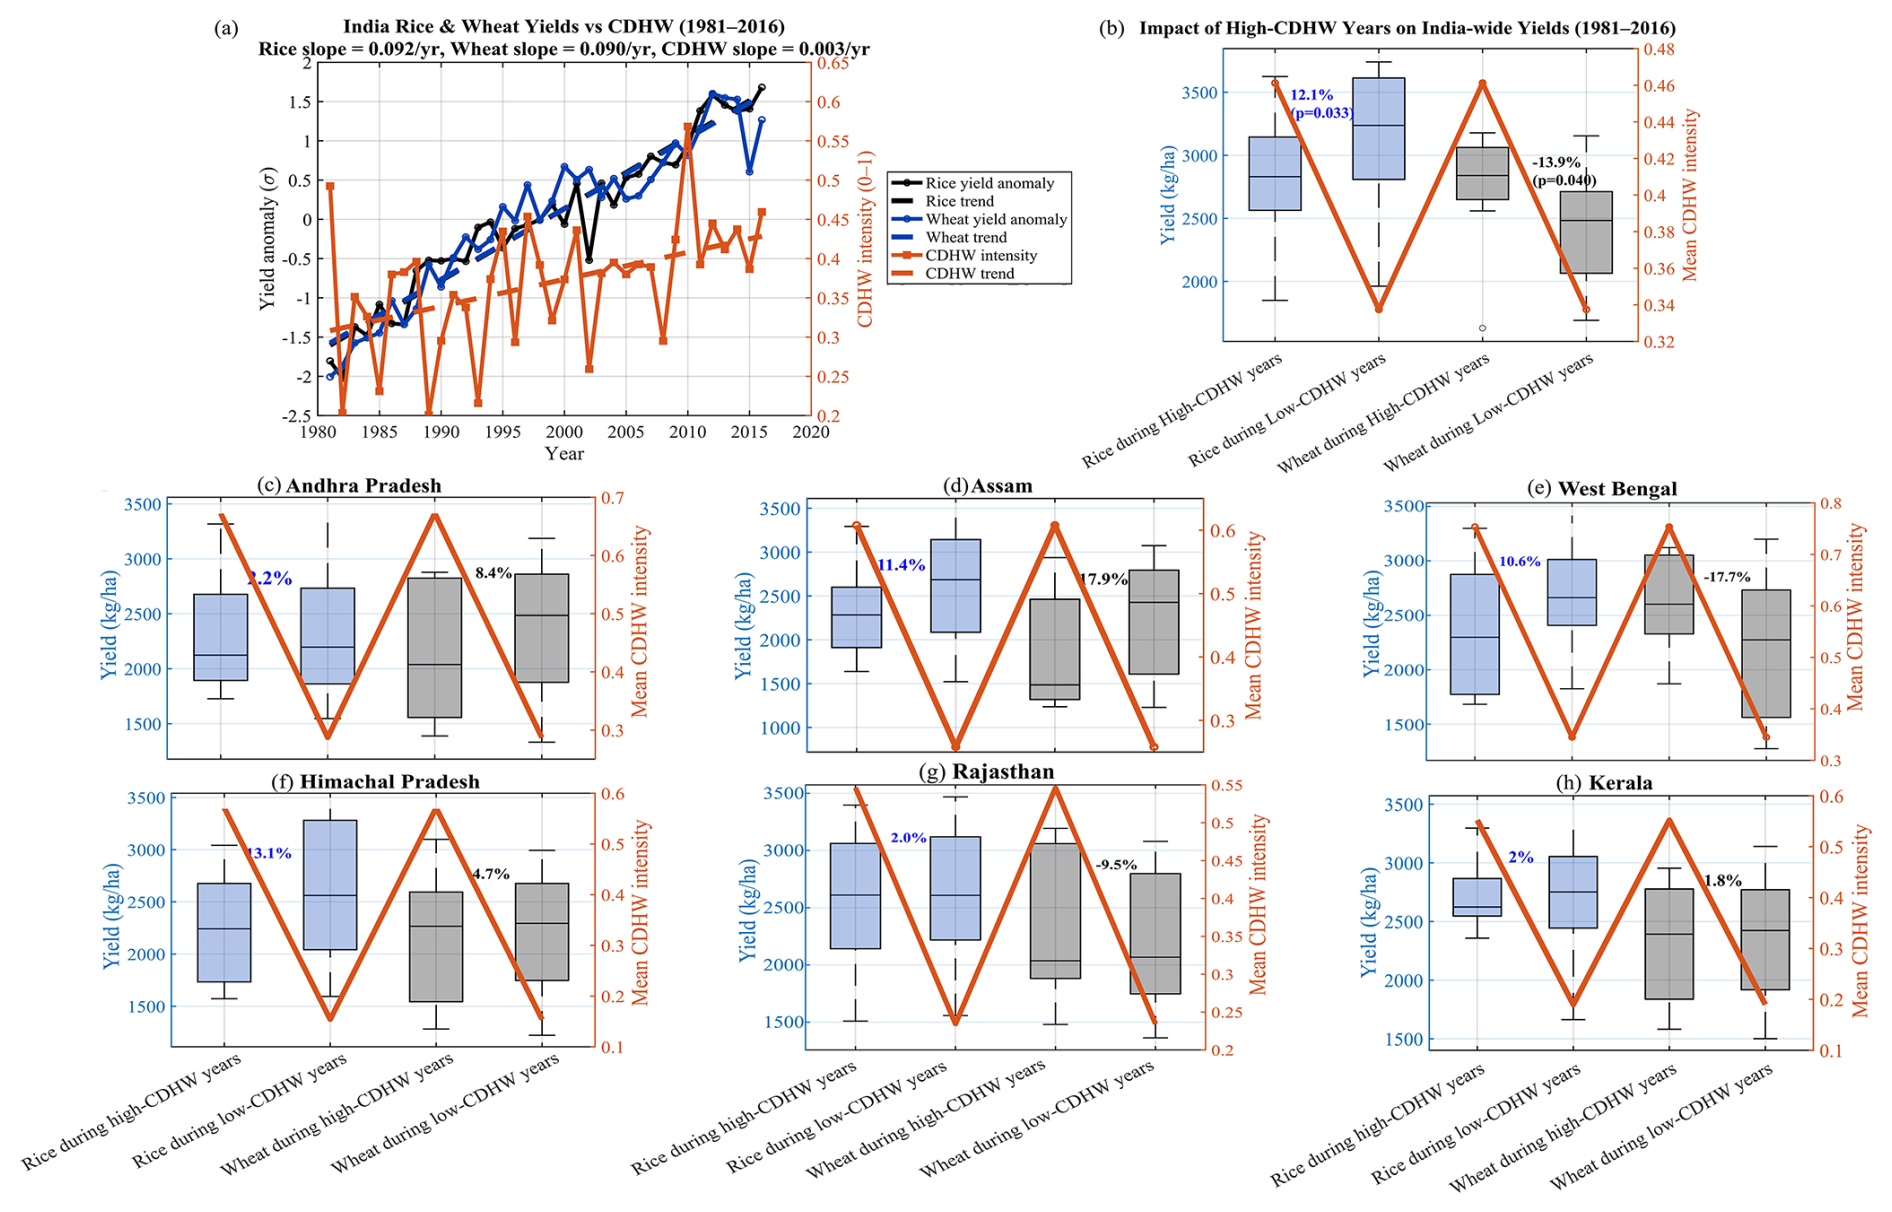
Figure 8(a) National time series of rice (black) and wheat (blue) yield anomalies (left axis) and CDHW intensity (right axis) with linear trends. (b) Boxplots of India-wide rice and wheat yields (kg ha−1, left axis) during high- and low-CDHW years, with mean CDHW intensity over-plotted (right axis). (c–h) Same as (b) for hotspot states: Andhra Pradesh, Assam, West Bengal, Himachal Pradesh, Rajasthan, and Kerala, with percent yield change in high- versus low-CDHW years.
4.7 Agricultural yield responses to CDHW hotspots across India
The historical analysis of CDHW events reveals a clear but spatially diverse imprint on Indian agriculture during the recent decades. By explicitly combining heat stress with precipitation-based drought anomalies, not just mean deficits but also the erratic distribution of rainfall that governs soil moisture recharge and plant stress is captured. Nationally (Fig. 8a), CDHW intensity rose steadily at about 0.003 per year, while both rice and wheat yields increased overall. Yet when years of high CDHW intensity (top 25 % to focus on extreme CDHW events while retaining sufficient sample size for statistical comparison) are isolated (Fig. 8b), rice yields decline by 12.1 % (p = 0.033), showing that this summer crop, sown and grown during the monsoon, remains highly vulnerable to the combined signal of drought and concurrent heat extremes. Such variability can shorten the critical flowering phase and reduce grain filling, even when total rainfall appears adequate (Sehgal et al., 2018; Chen et al., 2016; Lobell et al., 2012). In contrast, wheat yields rise by 13.9 % during those same years, suggesting that winter wheat might benefit from the warmer and often dryer post-monsoon conditions that accompany intense CDHW summers, especially where irrigation buffers water stress (Madhukar et al., 2022).
State-level patterns (Fig. 8c–h) underscores the heterogeneity of these impacts: rice reductions are largest in Assam (−11.4 %) and Himachal Pradesh (−13.1 %), where rain-fed cultivation and limited irrigation heighten sensitivity to rainfall intermittency, while West Bengal and Rajasthan show only minor losses (−10.6 % and −2 %, respectively). Wheat responses are even more varied, with decreases in Andhra Pradesh (−8.4 %), Assam (−17.9 %), and Himachal Pradesh (−4.7 %), but clear gains in West Bengal (+17.7 %) and Rajasthan (+9.5 %), and near-neutral change in Kerala. The observed state-level heterogeneity in yield responses therefore reflects that CDHWs exert asymmetric and region-specific influences on crop productivity, governed by climate regime, irrigation intensity, and crop-specific thermal tolerance.
Therefore, explicitly integrating precipitation variability with heat stress captures the multi-hazard conditions most damaging to Indian agriculture. By revealing how short, intense swings in rainfall and temperature drive yield losses even when seasonal totals appear normal, the analysis highlights a critical but often overlooked risk pathway for staple crops of India.
To further conceptualize the intensification of CDHW events, their linkages with long-term demographic and land use changes across emerging hotspots are analyzed. The results, detailed in Sect. S3, Fig. S9, reveal a substantial rise, up to 10-fold, in the urban population exposed to moderate to intense CDHWs in regions including Kerala, Assam, Andhra Pradesh, and West Bengal, among others. Against a backdrop of shifting weather patterns and climate variability, these historically climate-resilient states are facing renewed scrutiny, as they are becoming progressively susceptible due to shifting precipitation patterns, urban development, and limited adaptive capacity. This reinforces the urgency for re-evaluating adaptation frameworks in both arid and historically humid regions under intensifying climate extremes.
This study delves into the complex dynamics of compound drought and heatwave (CDHW) events in India, with a focus on understanding their spatial distribution, temporal evolution, and underlying drivers. By leveraging the Standardized Net-Precipitation and Distribution Index (SNEPI) and filtering stochastic variability via Monte Carlo-validated EEMD analysis, statistically significant non-linear trends (p < 0.1) in combined drought severity and heatwave occurrences were analysed over 6 decades spanning from 1951 to 2016. Intriguing regional dynamics emerged, with declining trends in severe CDHW events observed in northern and western India juxtaposed against a robust escalation in moderate and severe CDHW events in the east, central, and south. Moreover, the integration of joint-occurrence sampling and clustering analysis allowed for a comprehensive assessment of compound hazard dynamics. Contrary to earlier assumptions, moist tropical monsoon regions emerged as prominent hotspots of compound occurrences. This is further reinforced by the SPEI-SNEPI agreement, which highlights the growing and significant contribution of intra-month precipitation variability and post-monsoon water deficits to CDHW formation in these wetter zones. Categorization of individual droughts and heatwaves provided granular insights into the multifaceted nature of compound hazards, facilitating a nuanced understanding of their severity and temporal dynamics. Transition analysis of these compound event categories across climatic severity levels revealed significant shifts towards heightened severity levels in recent decades, particularly from elevated to severe and intense categories over Andhra Pradesh, Kerala, Himachal Pradesh, and Assam, whereas there was a decrease in intensity over West Bengal and Rajasthan. Spatially, regions historically afflicted by moderate and elevated CDHW events exhibited transitions towards more severe categories in recent years, while the severe and intense categories remained persistent throughout the period while also escalating to the extreme category, emphasizing the need for targeted adaptation strategies. A robust growing interdependence between post-monsoon droughts and heatwaves has been seen to intensify severe CDHW occurrences over traditionally less susceptible, wetter climate zones.
Furthermore, the study delved into the repercussions of concurrent CDHW events, highlighting their intensified impact in recent years and their resilience to short-term wet periods. Finally, the evolution of CDHW events over the recent decades has now exerted a dual pressure on India's socio-ecological systems, simultaneously threatening food security and amplifying human exposure. From shifts in land cover to changes in urbanization and crop patterns, the study underscores the complex interplay between CDHW events, agriculture, population dynamics, and LULC changes, providing critical insights for resilience-building efforts in the face of evolving climate risks over critically vulnerable hotspots.
Overall, this study establishes that CDHWs in India are undergoing a statistically significant regime shift, not only in their geographic distribution but also in their severity pathways and societal implications. By documenting these transitions and revealing the pivotal role of precipitation spell variability, this work significantly advances the understanding of compound hazards in monsoon-dependent regions. By elucidating the spatial and temporal patterns of compound hazards, this research provides valuable insights for policymakers, urban planners, and disaster management authorities, emphasizing the need for adaptive strategies to mitigate the impacts of compound drought and heatwave events. Further research endeavours should focus on understanding their underlying drivers and developing targeted adaptation strategies to enhance resilience to compound hazards in the region.
The SNEPI data at the 1-month time scale all over India have been obtained from Singh et al. (2021). The data and MATLAB codes used for the compound drought and heatwave analysis are available at https://doi.org/10.5281/zenodo.15255598 (Bhattacharjee and Dhanya, 2025). State- and national-level crop yield data are freely available.
The supplement related to this article is available online at https://doi.org/10.5194/nhess-26-791-2026-supplement.
D. Bhattacharjee: writing – original draft, writing – review and editing, visualization, formal analysis, investigation, conceptualization. C. T. Dhanya: writing – review and editing, validation, supervision, resources, formal analysis, conceptualization.
The contact author has declared that neither of the authors has any competing interests.
Publisher's note: Copernicus Publications remains neutral with regard to jurisdictional claims made in the text, published maps, institutional affiliations, or any other geographical representation in this paper. The authors bear the ultimate responsibility for providing appropriate place names. Views expressed in the text are those of the authors and do not necessarily reflect the views of the publisher.
The author sincerely acknowledges Dr. Gauranshi Raj Singh (Indian Institute of Technology Delhi, India) for sharing the SNEPI data at 1-month timescale over India and for her support in facilitating access to the data framework.
This paper was edited by Philip Ward and reviewed by three anonymous referees.
Afroz, M., Chen, G., and Anandhi, A.: Drought-and heatwave-associated compound extremes: A review of hotspots, variables, parameters, drivers, impacts, and analysis frameworks, Frontiers in Earth Science, 10, 914437, https://doi.org/10.3389/feart.2022.914437, 2023.
Afshar, M. H., Bulut, B., Duzenli, E., Amjad, M., and Yilmaz, M. T.: Global spatiotemporal consistency between meteorological and soil moisture drought indices, Agr. Forest Meteorol., 316, 108848, https://doi.org/10.1016/j.agrformet.2022.108848, 2022.
Ali, J.: Assessing Multi-Hazard Risks And Impacts Of Compound Climate And Weather Extreme Events For Socio-Economic Risk Management, Graduate Thesis and Dissertation post-2024.96, University of Central Florida, https://stars.library.ucf.edu/etd2024/96 (last access: 2 February 2026), 2025.
Beck, H. E., Zimmermann, N. E., McVicar, T. R., Vergopolan, N., Berg, A., and Wood, E. F.: Present and future Köppen–Geiger climate classification maps at 1-km resolution, Sci. Data, 5, 1–12, https://doi.org/10.1038/sdata.2018.214, 2018.
Bhattacharjee, D. and Dhanya, C. T.: Compound Drought and Heatwave Analysis, Zenodo [data set/code], https://doi.org/10.5281/zenodo.15255598, 2025.
Chuphal, D. S., Kushwaha, A. P., Aadhar, S., and Mishra, V.: Drought Atlas of India, 1901–2020, Sci. Data., 11, https://doi.org/doi:10.1038/s41597-023-02856-y, 2024.
Chapman, S., Trancoso, R., Syktus, J., Eccles, R., and Toombs, N.: Impacts on compound drought heatwave events in Australia per global warming level, Environ. Res. Lett., 20, 054070, https://doi.org/10.1088/1748-9326/adc8bd, 2025.
Chen, Y., Zhang, Z., Wang, P., Song, X., Wei, X., and Tao, F.: Identifying the impact of multi-hazards on crop yield – a case for heat stress and dry stress on winter wheat yield in northern China, Eur. J. Agron., 73, 55–63, https://doi.org/10.1016/j.eja.2015.10.009, 2016.
Dash, S. K., Kulkarni, M. A., Mohanty, U. C., and Prasad, K.: Changes in the characteristics of rain events in India, J. Geophys. Res.-Atmos., 114, https://doi.org/10.1029/2008JD010572, 2009.
Dracup, J. A., Lee, K. S., and Paulson Jr., E. G.: On the statistical characteristics of drought events, Water Resour. Res., 16, 289–296, https://doi.org/10.1029/WR016i002p00289, 1980.
FAO: Agricultural production statistics 2010–2023, FAOSTAT Analytical Briefs, No. 96, FAO, Rome, https://openknowledge.fao.org/handle/20.500.14283/cd3755en (last access: 2 February 2026), 2024.
Fehlman, C. A., Ryan, S. C., Lysne, K. G., Rundgren, Q. M., Spurlock, T. J., Orbison, R. O., Runkle, J. D., and Sugg, M. M.: Scoping review of the societal impacts of compound climate events, Discov. Environ., 3, https://doi.org/10.1007/s44274-025-00185-y, 2025.
Feng, A., Zhang, Q., Gu, X., Singh, V. P., Hu, L., Sun, Y., and Zhao, J.: Compound drought-heatwaves in China: driving factors and risks, Nat. Hazards, 121, 21283–21303, https://doi.org/10.1007/s11069-025-07621-5, 2025.
Feng, S., Wu, X., Hao, Z., Hao, Y., Zhang, X., and Hao, F.: A database for characteristics and variations of global compound dry and hot events, Weather and Climate Extremes, 30, 100299, https://doi.org/10.1016/j.wace.2020.100299, 2020.
Fischer, E. M. and Knutti, R.: Robust projections of combined humidity and temperature extremes, Nat. Clim. Change, 3, 126–130, https://doi.org/10.1038/nclimate1682, 2013.
Fischer, E. M. and Knutti, R.: Anthropogenic contribution to global occurrence of heavy-precipitation and high-temperature extremes, Nat. Clim. Change, 5, 560–564, https://doi.org/10.1038/nclimate2617, 2015.
Goel, N. K. and Rajendran, V.: Integrating regionalisation, uncertainty, and nonstationarity in modelling extreme rainfall events in India, J. Environ. Manage., 376, 124377, https://doi.org/10.1016/j.jenvman.2025.124377, 2025.
Government of India, Ministry of Agriculture & Farmers Welfare, Department of Agriculture & Farmers Welfare, and Directorate of Economics & Statistics: Agricultural Statistics at a Glance 2024, Government of India, https://www.scribd.com/document/962786318/Agricultural-Statistics-at-a-Glance-2024-%E0%A4%95%E0%A5%83%E0%A4%B7%E0%A4%BF-%E0%A4%B8%E0%A4%BE%E0%A4%82%E0%A4%96-%E0%A4%AF%E0%A4%BF%E0%A4%95%E0%A5%80-%E0%A4%8F%E0%A4%95-%E0%A4%9D%E0%A4%B2%E0%A4%95-2024 (last access: 2 February 2026), 2025.
Gumbel, E. J.: Statistical forecast of droughts, Hydrolog. Sci. J., 8, 5–23, 1963.
Hao, Z., AghaKouchak, A., and Phillips, T. J.: Changes in concurrent monthly precipitation and temperature extremes, Environ. Res. Lett., 8, 034014, https://doi.org/10.1088/1748-9326/8/3/034014, 2013.
Hao, Y., Hao, Z., Feng, S., Zhang, X., and Hao, F.: Response of vegetation to El Niño-Southern Oscillation (ENSO) via compound dry and hot events in southern Africa, Global Planet. Change, 195, 103358, https://doi.org/10.1016/j.gloplacha.2020.103358, 2020a.
Hao, Z., Li, W., Singh, V. P., Xia, Y., Zhang, X., and Hao, F.: Impact of dependence changes on the likelihood of hot extremes under drought conditions in the United States, J. Hydrol., 581, 124410, https://doi.org/10.1016/j.jhydrol.2019.124410, 2020b.
He, Y., Fang, J., Xu, W., and Shi, P.: Substantial increase of compound droughts and heatwaves in wheat growing seasons worldwide, Int. J. Climatol., 42, 5038–5054, https://doi.org/10.1002/joc.7518, 2022.
Ionita, M., Caldarescu, D. E., and Nagavciuc, V.: Compound hot and dry events in Europe: variability and large-scale drivers, Frontiers in Climate, 3, 688991, https://doi.org/10.3389/fclim.2021.688991, 2021.
IPCC: Climate Change 2021: The Physical Science Basis. Contribution of Working Group I to the Sixth Assessment Report of the Intergovernmental Panel on Climate Change, edited by: Masson-Delmotte, V., Zhai, P., Pirani, A., Connors, S. L., Péan, C., Berger, S., Caud, N., Chen, Y., Goldfarb, L., Gomis, M. I., Huang, M., Leitzell, K., Lonnoy, E., Matthews, J. B. R., Maycock, T. K., Waterfield, T., Yelekçi, O., Yu, R., and Zhou, B., Cambridge University Press, Cambridge, United Kingdom and New York, NY, USA, 2391 pp, https://doi.org/10.1017/9781009157896, 2021.
Kong, Q., Guerreiro, S., Blenkinsop, S., Li, X. F., and Fowler, H.: Increases in summertime concurrent drought and heatwave in Eastern China, Weather and Climate Extremes, 28, 100242, https://doi.org/10.1016/j.wace.2019.100242, 2020.
Köppen, W.: The Earth's heat zones, considered according to the duration of the hot, temperate, and cold seasons and according to the effect of heat on the organic world, Meteorological Journal, 1, 5–226, https://koeppen-geiger.vu-wien.ac.at (last access: 2 February 2026), 1884.
Leonard, M., Westra, S., Phatak, A., Lambert, M., van den Hurk, B., McInnes, K., Risbey, J., Schuster, S., Jakob, D., and Stafford-Smith, M.: A compound event framework for understanding extreme impacts, WIREs Clim. Change, 5, 113–128, https://doi.org/10.1002/wcc.252, 2014.
Liu, L.: Study of heatwave evolution in Southeast Asia and its correlation with drought and extreme precipitation amidst climate change, Doctoral thesis, Nanyang Technological University, Singapore, https://hdl.handle.net/10356/183380 (last access: 2 February 2026), 2024.
Liu, L. and Qin, X.: Investigating Compound Drought and Hot Extreme Events in Southeast Asia Through Copula Analysis, Int. J. Climatol., 45, e8773, https://doi.org/10.1002/joc.8773, 2025.
Liu, T., Zhang, Y., Guo, B., Zhang, S., and Li, X.: Substantial increase in future land exposure to compound droughts and heatwaves in China dominated by climate change, J. Hydrol., 645, 132219, https://doi.org/10.1016/j.jhydrol.2024.132219, 2024.
Liu, Z., Jiao, L., and Lian, X.: Changes in compound extreme events and their impacts on cropland productivity in China, 1985–2019, Earth's Future, 13, e2024EF005038, https://doi.org/10.1029/2024EF005038, 2025.
Lobell, D. B., Sibley, A., and Ivan Ortiz-Monasterio, J.: Extreme heat effects on wheat senescence in India, Nat. Clim. Change, 2, 186–189, https://doi.org/10.1038/nclimate1356, 2012.
Madhukar, A., Kumar, V., and Dashora, K.: Temperature and precipitation are adversely affecting wheat yield in India, J. Water Clim. Change, 13, 1631–1656, https://doi.org/10.2166/wcc.2022.443, 2022.
Mazdiyasni, O. and AghaKouchak, A.: Substantial increase in concurrent droughts and heatwaves in the United States, P. Natl. Acad. Sci. USA, 112, 11481–11489, https://doi.org/10.1073/pnas.1422945112, 2015.
Mbokodo, I. L., Bopape, M. J. M., Ndarana, T., Mbatha, S. M., Muofhe, T. P., Singo, M. V., Singo, M. V., Xulu, N. G., Mohomi, T., Ayisi, K. K., and Chikoore, H.: Heatwave variability and structure in South Africa during summer drought, Climate, 11, 38, https://doi.org/10.3390/cli11020038, 2023.
McKee, T. B., Doesken, N. J., and Kleist, J.: The relationship of drought frequency and duration to time scales, in: Proceedings of the 8th Conference on Applied Climatology, 17, 179–183, 1993.
McElroy, S., Schwarz, L., Green, H., Corcos, I., Guirguis, K., Gershunov, A., and Benmarhnia, T.: Defining heat waves and extreme heat events using sub-regional meteorological data to maximize benefits of early warning systems to population health, Sci. Total Environ., 721, 137678, https://doi.org/10.1016/j.scitotenv.2020.137678, 2020.
Meehl, G. A. and Tebaldi, C.: More intense, more frequent, and longer lasting heat waves in the 21st century, Science, 305, 994–997, https://doi.org/10.1126/science.1098704, 2004.
Miao, C., Sun, Q., Duan, Q., and Wang, Y.: Joint analysis of changes in temperature and precipitation on the Loess Plateau during the period 1961–2011, Clim. Dynam., 47, 3221–3234, https://doi.org/10.1007/s00382-016-3022-x, 2016.
Mohanty, A. and Shreya, W.: Mapping India's Climate Vulnerability: A District-Level Assessment, Council on Energy, Environment and Water, New Delhi, https://images.hindustantimes.com/images/app-images/2021/11/ ceew-study-on-climate-change-vulnerability-index-and-district-level-risk-assessment.pdf (last access: 2 February 2026), 2021.
Morán-Tejeda, E., Lorenzo-Lacruz, J., López-Moreno, J. I., Rahman, K., and Beniston, M.: Streamflow timing of mountain rivers in Spain: Recent changes and future projections, J. Hydrol., 517, 1114–1127, https://doi.org/10.1016/j.jhydrol.2014.06.053, 2014.
Mukherjee, S. and Mishra, A. K.: Increase in compound drought and heatwaves in a warming world, Geophys. Res. Lett., 48, e2020GL090617, https://doi.org/10.1029/2020GL090617, 2021.
Mukherjee, S., Ashfaq, M., and Mishra, A.: Compound drought and heatwaves at a global scale: The role of natural climate variability-associated synoptic patterns and land-surface energy budget anomalies, J. Geophys. Res.-Atmos., 125, https://doi.org/10.1029/2019JD031943, 2020.
Mukherjee, S., Mishra, A. K., Ashfaq, M., and Kao, S. C.: Relative effect of anthropogenic warming and natural climate variability to changes in Compound drought and heatwaves, J. Hydrol., 605, 127396, https://doi.org/10.1016/j.jhydrol.2021.127396, 2022.
Pai, D., Nair, S., and Ramanathan, A.: Long term climatology and trends of heat waves over India during the recent 50 years (1961–2010), Mausam, 64, 585–604, 2013.
Pai, D., Sridhar, L., Rejeevan, M., Sreejith, O., Satbhai, N., and Mukhopadhyay, B.: Development of a new high spatial resolution (0.25° × 0.25°) long period (1901–2010) daily gridded rainfall data set over India and its comparison with existing data sets over the region, Mausam, 65, 1–18, https://doi.org/10.54302/mausam.v65i1.851, 2014.
Palmer, W. C.: Meteorological drought, Research Paper No. 45, U.S. Department of Commerce, Weather Bureau, https://www.ncei.noaa.gov/monitoring-content/temp-and-precip /drought/docs/palmer.pdf (last access: 2 February 2026), 1965.
Peel, M. C., Finlayson, B. L., and McMahon, T. A.: Updated world map of the Köppen-Geiger climate classification, Hydrol. Earth Syst. Sci., 11, 1633–1644, https://doi.org/10.5194/hess-11-1633-2007, 2007.
Peng, L., Sheffield, J., Wei, Z., Ek, M., and Wood, E. F.: An enhanced Standardized Precipitation–Evapotranspiration Index (SPEI) drought-monitoring method integrating land surface characteristics, Earth Syst. Dynam., 15, 1277–1300, https://doi.org/10.5194/esd-15-1277-2024, 2024.
Rastogi, D., Trok, J., Depsky, N., Monier, E., and Jones, A.: Historical evaluation and future projections of compound heatwave and drought extremes over the conterminous United States in CMIP6, Environ. Res. Lett., 19, 014039, https://doi.org/10.1088/1748-9326/ad0efe, 2023.
Rawat, K. S., Behera, A., Bahuguna, A., and Baweja, H. S.: A case study of rainfall variability analysis using precipitation concentration index in talcher region, Odisha, India, AIP Conference Proc., 3072, 040010, https://doi.org/10.1063/5.0198692, 2024.
Raymond, C., Horton, R. M., Zscheischler, J., Martius, O., AghaKouchak, A., Balch, J., Bowen, S. G., Camargo, S. J., Hess, J., Kornhuber, K., Oppenheimer, M., Ruane, A. C., Wahl, T., and White, K.: Understanding and managing connected extreme events, Nat. Clim. Change, 10, 611–621, https://doi.org/10.1038/s41558-020-0790-4, 2020.
Ridder, N. N., Ukkola, A. M., Pitman, A. J., and Perkins-Kirkpatrick, S. E.: Increased occurrence of high impact compound events under climate change, npj Clim. Atmos. Sci., 5, 3, https://doi.org/10.1038/s41612-021-00224-4, 2022.
Rohini, P., Rajeevan, M., and Srivastava, A. K.: On the variability and increasing trends of heat waves over India, Scientific Reports, 6, 1–9, https://doi.org/10.1038/srep26153, 2016.
Mishra, V., Thirumalai, K., Singh, D., and Aadhar, S.: Future exacerbation of hot and dry summer monsoon extremes in India, npj Clim. Atmos. Sci., 3, 10, https://doi.org/10.1038/s41612-020-0113-5, 2020.
Salvadori, G., De Michele, C., Kottegoda, N. T., and Rosso, R.: Extreme Value Analysis Via Copulas, in: Extremes in Nature, Water Science and Technology Library, Vol. 56, Springer, Dordrecht, https://doi.org/10.1007/1-4020-4415-1_5, 2007.
Sehgal, A., Sita, K., Siddique, K. H., Kumar, R., Bhogireddy, S., Varshney, R. K., HanumanthaRao, B., Nair, R. M., Prasad, P. V. V., and Nayyar, H.: Drought or/and heat-stress effects on seed filling in food crops: impacts on functional biochemistry, seed yields, and nutritional quality, Frontiers in Plant Science, 9, 1705, https://doi.org/10.3389/fpls.2018.01705, 2018.
Seneviratne, S. I., Zhang, X., Adnan, M., Badi, W., Dereczynski, C., Luca, A. D., Ghosh, S., Iskandar, I., Kossin, J., Lewis, S., Otto, F., Pinto, I., Satoh, M., Vicente-Serrano, S. M., Wehner, M., Zhou, B. and Allan, R.: Weather and climate extreme events in a changing climatem in: Climate Change 2021: The Physical Science Basis: Working Group I contribution to the Sixth Assessment Report of the Intergovernmental Panel on Climate Change, edited by: Masson-Delmotte, V. P., Zhai, A., Pirani, S. L. and Connors, C., Cambridge University Press, Cambridge, UK, 1513–1766, https://doi.org/10.1017/9781009157896.013, 2021.
Seo, Y. W. and Ha, K. J.: Changes in land-atmosphere coupling increase compound drought and heatwaves over northern East Asia, npj Climate and Atmospheric Science, 5, 100, https://doi.org/10.1038/s41612-022-00325-8, 2022.
Shan, B., Verhoest, N. E. C., and De Baets, B.: Identification of compound drought and heatwave events on a daily scale and across four seasons, Hydrol. Earth Syst. Sci., 28, 2065–2080, https://doi.org/10.5194/hess-28-2065-2024, 2024.
Sharma, S. and Majumdar, P.: Increasing frequency and spatial extent of concurrent meteorological droughts and heatwaves in India, Scientific Reports, 7, 15582, https://doi.org/10.1038/s41598-017-15896-3, 2017.
Singh, D., Tsiang, M., Rajaratnam, B., and Diffenbaugh, N. S.: Observed changes in extreme wet and dry spells during the South Asian summer monsoon season, Nat. Clim. Change, 4, 456–461, https://doi.org/10.1038/nclimate2208, 2014.
Singh, G., Dhanya, C., and Chakravorty, A.: A Robust Drought Index accounting changing Precipitaion Characteristics, Water Resour. Res., 57, https://doi.org/10.1029/2020WR029496, 2021.
Singh, G. R., Dhanya, C. T., and Chakravorty, A.: Unraveling the pertinence of drought indices in the changing climate, Environ. Res. Lett., 18, 064024, https://doi.org/10.1088/1748-9326/acd567, 2023.
Srivastava, A., Rajeevan, M., and Kshirsagar, S.: Development of a high resolution daily gridded temperature data set (1969–2005) for the Indian region, Atmos. Sci. Lett., 10, 249, https://doi.org/10.1002/asl.232, 2009.
Sushama, L., Khaliq, N., and Laprise, R.: Dry spell characteristics over Canada in a changing climate as simulated by the Canadian RCM, Global Planet. Change, 74, 1–14, https://doi.org/10.1016/j.gloplacha.2010.07.004, 2010.
Swain, S. S., Mishra, A., and Chatterjee, C.: Time-varying evaluation of compound drought and hot extremes in machine learning–predicted ensemble CMIP5 future climate: A multivariate multi-index approach, J. Hydrol. Eng., 29, 04024001, https://doi.org/10.1061/JHYEFF.HEENG-602, 2024.
Takyi, E.: Spatial and compound dependencies in drought and heatwaves in the climate of South-Western Europe, Master's thesis, Oslo Metropolitan University, https://dhefeus.rd.ciencias.ulisboa.pt/teses/ACIT_Master_Ebenezer_ExtremeClimate.pdf (last access: 2 February 2026), 2024.
Tavakol, A., Rahmani, V., and Harrington Jr., J.: Probability of compound climate extremes in a changing climate: A copula-based study of hot, dry, and windy events in the central United States, Environ. Res. Lett., 15, 104058, https://doi.org/10.1088/1748-9326/abb1ef, 2020.
Trenberth, K. E.: Changes in precipitation with climate change, Clim. Res., 47, 123–138, https://doi.org/10.3354/cr00953, 2011.
Trepanier, J. C., Yuan, J., and Jagger, T. H.: The combined risk of extreme tropical cyclone winds and storm surges along the US Gulf of Mexico Coast, J. Geophys. Res.-Atmos., 122, 3299–3316, https://doi.org/10.1002/2016JD026180, 2017.
Tripathy, K. P. and Mishra, A. K.: How unusual is the 2022 European compound drought and heatwave event?, Geophys. Res. Lett., 50, e2023GL105453, https://doi.org/10.1029/2023GL105453, 2023.
Tripathy, K. P., Mukherjee, S., Mishra, A. K., Mann, M. E., and Williams, A. P.: Climate change will accelerate the high-end risk of compound drought and heatwave events, P. Natl. Acad. Sci. USA, 120, e2219825120, https://doi.org/10.1073/pnas.2219825120, 2023.
Van Loon, A. F., Gleeson, T., Clark, J., Van Dijk, A. I., Stahl, K., Hannaford, J., Di Baldassarre, G., Teuling, A. J., Tallaksen, L. M., Uijlenhoet, R., Hannah, D. M., Sheffield, J., Svoboda, M., Verbeiren, B., Wagener, T., Rangecroft, S., Wanders, N., and Van Lanen, H. A. J.: Drought in the Anthropocene, Nat. Geosci., 9, 89–91, https://doi.org/10.1038/ngeo2646, 2016.
Vicente-Serrano, S. M., Beguería, S., and López-Moreno, J. I.: A multiscalar drought index sensitive to global warming: the standardized precipitation evapotranspiration index, J. Climate, 23, 1696–1718, https://doi.org/10.1175/2009JCLI2909.1, 2010.
Vinnarasi, R. and Dhanya, C. T.: Changing characteristics of extreme wet and dry spells of Indian monsoon rainfall, J. Geophys. Res.-Atmos., 121, 2146–2160, https://doi.org/10.1002/2015JD024310, 2016.
Vinnarasi, R., Dhanya, C. T., Chakravorty, A., and AghaKouchak, A.: Unravelling diurnal asymmetry of surface temperature in different climate zones, Scientific Reports, 7, 7350, https://doi.org/10.1038/s41598-017-07627-5, 2017.
Wang, C., Li, Z., Chen, Y., Li, Y., Liu, X., Hou, Y., Wang, X., Kulaixi, Z., and Sun, F.: Increased compound droughts and heatwaves in a double pack in Central Asia, Remote Sensing, 14, 2959, https://doi.org/10.3390/rs14132959, 2022.
Wang, C., Li, Z., Chen, Y., Ouyang, L., Zhao, H., Zhu, J., Wang, J., and Zhao, Y.: Characteristic changes in compound drought and heatwave events under climate change, Atmos. Res., 305, 107440, https://doi.org/10.1016/j.atmosres.2024.107440, 2024.
Wang, H., Chen, J., and Dong, G.: Feature Extraction of Rolling Bearing's early weak fault based on EEMD and tunable Q-factor wavelet transform, Mech. Syst. Signal Pr., 48, 103–119, https://doi.org/10.1016/j.ymssp.2014.04.006, 2014.
Webster, P. J., Magana, V. O., Palmer, T. N., Shukla, J., Tomas, R. A., Yanai, M. U., and Yasunari, T.: Monsoons: Processes, predictability, and the prospects for prediction, J. Geophys. Res.-Oceans, 103, 14451–14510, https://doi.org/10.1029/97JC02719, 1998.
Wells, N., Goddard, S., and Hayes, M. J.: A self-calibrating Palmer drought severity index, J. Climate, 17, 2335–2351, https://doi.org/10.1175/1520-0442(2004)017<2335:ASPDSI>2.0.CO;2, 2004.
Wu, Z. and Huang, N. E.: On the Filtering properties of the Emperical Mode Decomposition, Advances in Adaptive Data Analysis, 2, 397–414, https://doi.org/10.1142/S1793536910000604, 2010.
Wu, Z., Huang, N. E., Wallace, J. M., Smoliak, B. V., and Chen, X.: On the time-varying trend in global-mean surface temperature, Clim. Dynam., 37, 759–773, https://doi.org/10.1007/s00382-011-1128-8, 2011.
Zhang, B., Wang, S., and Slater, L.: Anthropogenic climate change doubled the frequency of compound drought and heatwaves in low-income regions, Commun. Earth. Environ., 5, 715, https://doi.org/10.1038/s43247-024-01894-7, 2024.
Zhang, Y., Ren, Z., Zhou, Y., Wang, X., Song, C., Cai, Y., Qin, B., Shi, K., and Woolway, R. I.: Varied responses of inland waters to compound heatwave-drought events in the Yangtze River Basin, Sci. Total Environ., 996, 180185, https://doi.org/10.1016/j.scitotenv.2025.180185, 2025.
Zscheischler, J. and Seneviratne, S. I.: Dependence of drivers affects risks associated with compound events, Science Advances, 3, e1700263, https://doi.org/10.1126/sciadv.1700263, 2017.
Zscheischler, J., Westra, S., van den Hurk, B. J. J. M., Seneviratne, S. I., Ward, P. J., Pitman, A., AghaKouchak, A., Bresch, D. N., Leonard, M., Wahl, T., and Zhang, X.: Future climate risk from compound events, Nat. Clim. Change, 8, 469–477, https://doi.org/10.1038/s41558-018-0156-3, 2018.
Zscheischler, J., Martius, O., Westra, S., Bevacqua, E., Raymond, C., Horton, R. M., van den Hurk, B., AghaKouchak, A., Jézéquel, A., Mahecha, M. D., Maraun, D., Ramos, A. M., Ridder, N., Thiery, W., and Vignotto, E.: A typology of compound weather and climate events, Nature Reviews Earth & Environment, 1, 333–347, https://doi.org/10.1038/s43017-020-0060-z, 2020.