
the Creative Commons Attribution 4.0 License.
the Creative Commons Attribution 4.0 License.
 | 19 Nov 2026
Modeling tsunami and seismic waveforms from regional earthquakes for the TamTam SMART subsea cable

Yoshiki Yamazaki
Thorne Lay
Matthew J. Fouch
John J. Niroa
Bruce M. Howe
Science Monitoring And Reliable Telecommunications (SMART) subsea cables utilize sensors to record temperature, pressure, and ground motion on the seafloor. The planned TamTam SMART cable will connect Vanuatu and New Caledonia across a major subduction zone. Modeling recent Mw 7.7 to 8.0 earthquakes and maximum-considered Mw 8.33 to 8.8 scenarios provides a range of seismic waveforms with realistic relative timing and long-period ground displacements along the preliminary cable route. The corresponding coseismic seafloor uplift and subsidence define the input for nonhydrostatic computation of tsunami generation, propagation, and scattering in the Southwest Pacific. Spectral analysis of the computed tsunami waves shows multi-scale oscillations along the Vanuatu Trench with periods from a few minutes to over an hour. Since the preliminary sensor locations are outside energetic antinodes of oscillation modes, the tsunami waveforms computed there are representative of the seismic source with minor interference from landmasses. The suite of synthetic seismic and tsunami signals informs implementation of the sensor system for regional hazard monitoring. Once deployed, the TamTam SMART cable will enhance rapid earthquake and tsunami warning capabilities in this tectonically active region with limited land-based instrumentation.
- Article
(12207 KB) - Full-text XML
- BibTeX
- EndNote


The last decade has seen growing interest in leveraging subsea telecommunication cables as a cost-effective means to monitor vast expanses of the ocean. There are currently 1.5 million km of subsea cables in operation around the world. As existing cables are replaced and new routes are developed, sensors can be installed at repeaters or in separate modules to provide distributed measurements of temperature, pressure, and seismic ground motion for oceanographic, climate, and geophysical research at a modest incremental cost (Howe et al., 2019). The resulting Science Monitoring And Reliable Telecommunications (SMART) subsea cables also provide real-time data for earthquake and tsunami warning, and that has provided motivation for a number of ongoing projects, such as the InSEA wet demonstration project off Sicily, Italy, and the Atlantic CAM ring system connecting Lisbon, Azores, and Madeira in Portugal (Howe et al., 2022).
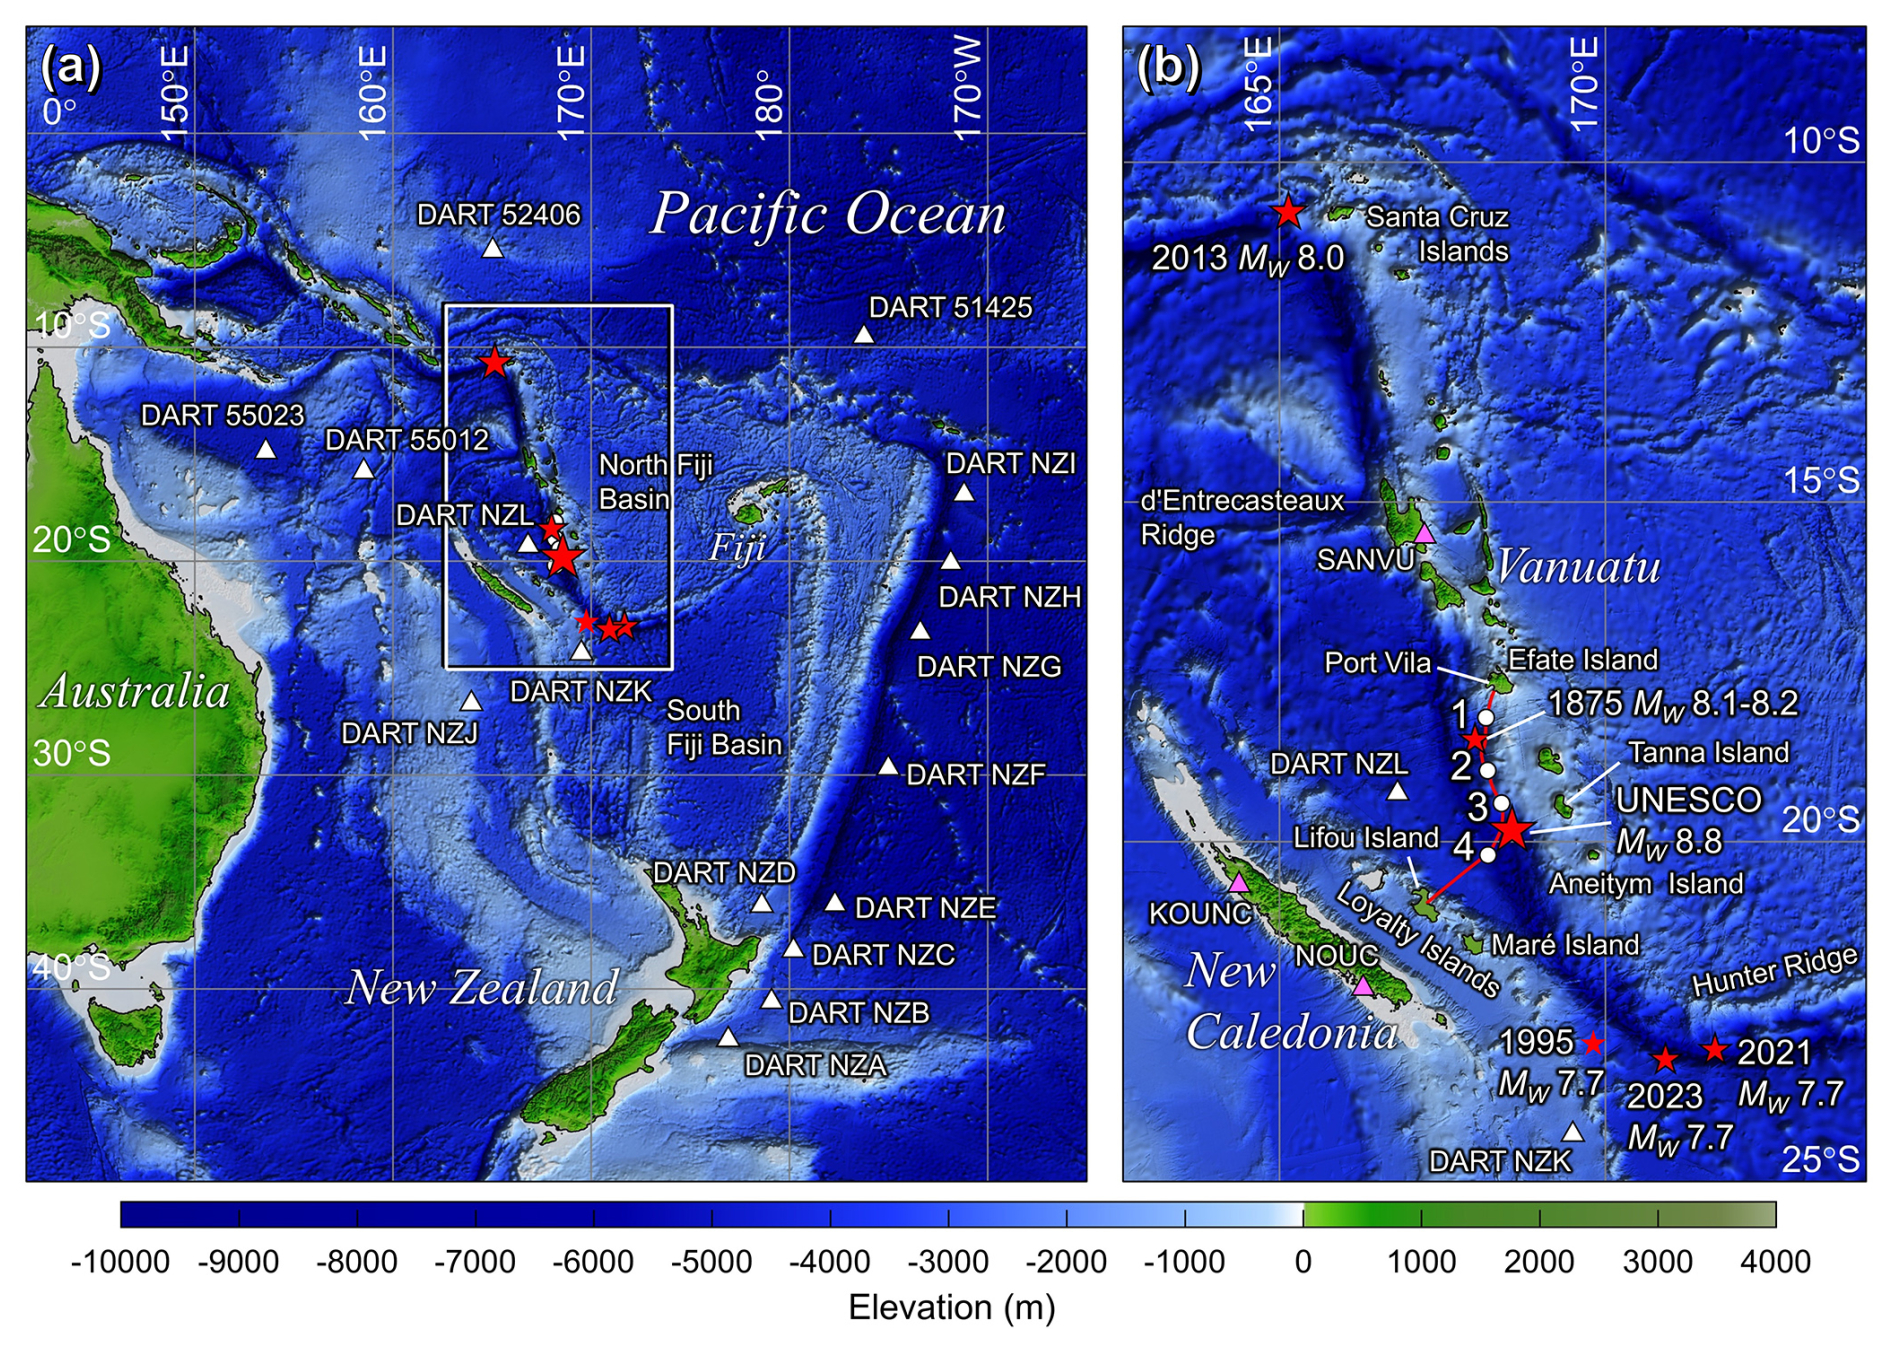
Figure 1Location map and region of interest. (a) Southwest Pacific. White rectangle delineates close-up view. (b) Vanuatu subduction zone. The red line and white circles denote the preliminary TamTam SMART cable route and sensor locations from UNESCO-IOC (2025). White triangles denote DART locations and magenta triangles indicate seismic stations for model comparison. Smaller red stars indicate epicenters of large historical and recent tsunamigenic earthquakes and the large red star indicates the UNESCO maximum-considered scenario in the southern Vanuatu subduction zone.
Planning for the TamTam SMART subsea cable between Vanuatu and New Caledonia in the Southwest Pacific is currently underway by a consortium of French agencies and industry partners with local and international participation. The system will stretch across the Vanuatu subduction zone, which is tectonically active and geologically complex with frequent tsunamigenic earthquakes (Roger and Pelletier, 2024). Figure 1b shows a preliminary cable route, which extends from Port Vila, the capital of Vanuatu on Efate Island, southward along the archipelago before crossing the trench to reach an existing landing station on Lifou Island with connectivity to the rest of New Caledonia (UNESCO-IOC, 2025). Development of this regional cable system is funded by FRANCE 2030, the Asian Development Bank (ADB), and the European Investment Bank (EIB) with equity shares from Prima Limited and the Vanuatu National Provident Fund (VNPF). Pacific Peering is the project lead and technology integrator, while Ifremer (French Research Institute for Exploitation of the Sea) serves as the core scientific manager.
The TamTam cable route is still preliminary and subject to revision at the design stage following the marine survey. The current layout includes four sensor modules ∼ 50–90 km apart along the ∼ 450 km cable (Fig. 1b). Three sensor modules are on the upper Vanuatu margin slope along the shelf edge and one on the New Caledonia side of the trench to provide real-time earthquake and tsunami monitoring near populated areas. Existing seismic and sea-level networks in the region will provide complementary observations for evaluating data quality and interoperability. As shown in Fig. 1a, the New Zealand DART (Deep-ocean Assessment and Reporting of Tsunamis) network has some coverage of tsunami waves in the Southwest Pacific with stations to the west and south of the Vanuatu islands (Fry et al., 2020). Global seismic network stations are rather sparsely distributed in the Southwest Pacific but are supplemented by more than 50 stations of the Oceania Regional Seismic Network (ORSNET) operated by South Pacific countries (UNESCO-IOC, 2025).
Earthquakes have generated most of the tsunamis in the region, while volcanic and other non-seismic sources account for less than 5 % of documented events (Roger and Pelletier, 2024). Figure 1b shows the locations of large tsunamigenic earthquakes with regional implications. The northern Vanuatu subduction zone has produced several large earthquakes over the past century. One of the largest was the 2013 Mw 8.0 Santa Cruz Islands earthquake, which involved shallow dipping thrust faulting and generated a destructive tsunami impacting local communities (e.g., Lay et al., 2013; Cleveland et al., 2014). Across the d'Entrecasteaux Ridge, the southern Vanuatu subduction zone is known for strong and long-duration aftershock sequences (Ye et al., 2021), which follow large plate-boundary and outer-rise earthquakes (Roger et al., 2021). The largest known historical event, an Mw 8.1–8.2 thrust-faulting earthquake in 1875, produced tsunami deposits at elevations reaching 10 m on the northeastern coast of Lifou Island, New Caledonia (Ioualalen et al., 2017; Paris et al., 2023). An Mw 7.7 normal faulting earthquake in 1995 along the Loyalty Ridge also generated a tsunami with 8 m runup on Aneityum Island, Vanuatu (Roger and Pelletier, 2024).
The southernmost Vanuatu Trench curves eastward along the Hunter Ridge. The 2021 and 2023 Mw 7.7 earthquakes, which occurred on opposite sides of the southern Vanuatu Trench, were the largest in the region over the past quarter-century. The resulting tsunamis of comparable wave amplitude have distinct near-field patterns influenced by seamounts and islands near the sources, but similar far-field patterns due to regional standing waves developed in the Southwest Pacific (Robert et al., 2025). This pair of events two years apart is analogous to the 2013 Mw 8.0 Santa Cruz Islands megathrust and 2015 Mw 7.0 normal faulting earthquakes on opposite sides of the trench in the northern Vanuatu subduction zone (Heidarzadeh et al., 2016). These recent earthquakes at the northern and southern termini of the subduction zone produced moderate tsunami impacts in Vanuatu and New Caledonia. Large earthquakes between the two archipelagos, such as the 1875 Mw 8.1–8.2 and the 1995 Mw 7.7, pose a greater tsunami risk to nearby population centers.
Governments, scientists, and stakeholders seek to improve understanding of earthquake and tsunami hazards in support of coordinated risk-management strategies among nations in the Southwest Pacific. UNESCO-IOC (2025) proposed maximum-considered earthquake scenarios based on the inferred degree of segmentation, width of strain-accumulation zones, fault locking relative to plate convergence, and material properties of rocks along the Vanuatu subduction zone. Comparable magnitude estimates were developed for the northern, central, southern, and Matthew-Hunter Islands regions along the arc. Full rupture of the southern 500 km long segment crossed by the preliminary TamTam cable route is represented by an Mw 8.8 earthquake composed of five Mw 8.33 subevents. This maximum-considered scenario and its subevents, together with the well-resolved 2013 Mw 8.0 Santa Cruz Islands earthquake to the north and the 2021 and 2023 Mw 7.7 earthquakes southeast of the Loyalty Islands, provide a representative range of large regional events that the SMART subsea cables might record signals for. This study characterizes the corresponding seismic and tsunami signals along the preliminary cable route to provide operational insights and identify implications for regional warning and emergency management during the cable system planning stage.
An appropriate representation of the earthquake rupture process is important for tsunami and seismic wave modeling. Finite-fault models resolve the spatiotemporal distribution of slip across discretized fault surfaces, constrained by a combination of seismic, geodetic, and tsunami observations (Kikuchi and Kanamori, 1982; Hartzell and Heaton, 1983; Satake, 1987). Such models, which are routinely developed for large earthquakes, can describe seafloor deformation time histories for nonhydrostatic computation of tsunami generation (Yamazaki et al., 2023). For seismic wave modeling, the poorly constrained short-period source characteristics and regional propagation structures limit calculations to ground displacements with periods longer than ∼ 20 s, consistent with simplified point-source representations in a one-dimensional velocity structure. Within the constraints of the available data, the modeling approaches provide a framework for estimating tsunami waveforms and spectral content as well as long-period ground displacements at the TamTam site produced by large earthquakes along the Vanuatu subduction zone.
2.1 Rupture models
Finite-fault models describe rupture kinematics through grids of subfaults, each of which has uniform slip and a parameterized source time function. Their collective motion defines the spatiotemporal evolution of seismic moment release during the rupture. In the present approach, the seafloor vertical displacement is computed from the half-space solution of Okada (1985) and corrected for horizontal translation of the local seafloor slope according to Tanioka and Satake (1996). Figure 2 shows the finite fault models and coseismic vertical seafloor displacements for the 2013 Mw 8.0 Santa Cruz Islands earthquake (Lay et al., 2013), the 2021 and 2023 Mw 7.7 earthquakes southeast of the Loyalty Islands (Robert et al., 2025), and the Mw 8.8 maximum-considered earthquake scenario for the southern Vanuatu subduction zone (UNESCO-IOC, 2025). The source models for the three historical events have finer subfaults that resolve seismic radiation at periods longer than ∼ 5–10 s. Their detailed slip distributions and rupture time histories were determined from joint modeling of global seismic and regional DART and tide gauge recordings. The maximum-considered earthquake scenario has larger subfaults with prescribed uniform slip and rise time, and is valid for seismic wave periods longer than ∼ 40 s.

Figure 2Slip distribution and seafloor deformation. (a) The 2013 Mw 8.0 Santa Cruz Islands earthquake. (b) The 2021 Mw 7.7 earthquake southeast of the Loyalty Islands. (c) The 2023 Mw 7.7 earthquake southeast of the Loyalty Islands. (d) UNESCO Mw 8.33 A, B, C, D, and E subevents that combine to give the Mw 8.8 maximum-considered earthquake scenario.
The finite-fault model for the 2013 Mw 8.0 Santa Cruz Islands earthquake shows rupture of a shallow, eastward-dipping megathrust with two large slip patches and a southeastward propagation speed of ∼ 1.5 km s−1. Peak slip reaches 12.7 m, producing 3.3 m of near-trench uplift and minor arc subsidence (Lay et al., 2013). The 2021 Mw 7.7 thrust-faulting earthquake occurred on the plate interface near the southern hook of the Vanuatu subduction zone. Its finite-fault model has a peak slip of 7.5 m and a rupture duration of 55 s and produces up to 1.3 m of uplift with minor subsidence on the upper margin slope (Robert et al., 2025). The nearby 2023 Mw 7.7 earthquake, with a similar east-west extent, involved normal faulting in the outer rise. The modeled peak slip reaches 5.2 m over a 45 s rupture duration, and the resulting seafloor deformation is characterized by relatively small uplift but large subsidence of up to 2.4 m near the trench (Robert et al., 2025). The validated finite-fault models for these three historical events provide time histories of seafloor deformation for tsunami generation (Figs. A1 and A2).
The maximum-considered earthquake scenario spans 500 km along the southern Vanuatu subduction zone and extends 100 km downdip from the trench (UNESCO-IOC, 2025). The Mw 8.8 earthquake represents the 90th percentile of the posterior distribution of maximum seismic moment reported in the probabilistic tsunami hazard assessment of Davies and Griffin (2018). The model has a uniform slip of 10 m, which lies within the 5.2–12.7 m range of modeled peak slip for the three recent large events, but extends over a much larger area. The resulting uplift ranges from 1.1 m at the shelf edge to 4.6 m near the trench, while subsidence is relatively minor because of the uniform slip across the full segment. The five Mw 8.33 subevents, each representing rupture of a 100 km by 100 km fault, are modeled separately as local failures along the segment to augment the parameter space. Because there are no known constraints on rupture heterogeneity or directivity, slip is assumed to start simultaneously across the entire fault and increase linearly to the prescribed value over 30 s. Synchronous rupture of the five subevents is computed for the Mw 8.8 earthquake scenario to direct tsunami waves normal to the arc and to provide a conservative estimate of the impact on local communities along both sides of the trench.
2.2 Tsunami and seismic wave modeling
The nonhydrostatic NEOWAVE code describes tsunami generation by time-dependent seafloor deformation, frequency dispersion during transoceanic propagation, wavenumber-dependent shoaling on seafloor slopes, and formation of bores or hydraulic jumps nearshore (Yamazaki et al., 2009, 2011, 2023). The modeling involves two levels of two-way nested computational grids derived from the GEBCO14 digital elevation model with native resolution of 30 arcsec (∼ 0.9 km). The level-1 grid covers the Southwest Pacific to capture large-scale standing waves from reflection at land boundaries as well as wave trapping along island chains (Fig. 1a). Its 2 arcmin (∼ 3.7 km) resolution provides optimal model dispersion for transoceanic tsunami propagation (Li and Cheung, 2019). The level-2 grid extends along the Vanuatu subduction zone and resolves the margin and tsunami sources at 30 arcsec (∼ 0.9 km, Fig. 1b). Time-dependent coseismic seafloor deformation provides the tsunami forcing and dynamically updates the model bathymetry and topography. The subgrid roughness of the seafloor is described by a Manning's coefficient of 0.025. The local mean sea level is the vertical datum for both the digital elevation model and the computed sea-surface elevation.
The precise details of the historical finite-fault ruptures have limited influence on long-period ground displacement and are not known for the maximum-considered rupture scenario. We therefore represent the three recent large earthquakes and the five subevents of the maximum-considered scenario by equivalent point-source moment tensors. Synthetic seismograms are computed using the SYNGINE (Synthetic Engine) seismic-wave simulator with a standard one-dimensional Earth model (https://service.iris.edu/irisws/syngine/1/, last access: 6 November 2026), which is an anisotropic version of the Preliminary Reference Earth Model (PREM; Dziewonski and Anderson, 1981). Although SYNGINE provides ground displacements at periods as short as 2 s, the short-period waveforms and associated ground velocities and accelerations are sensitive to details of source complexity and three-dimensional propagation structure along the source-to-receiver paths, neither of which is sufficiently constrained for the present assessment. The analysis considers only the simulated ground-displacement signals at periods of ∼ 20 s and longer, for which equivalent point-source representations and a one-dimensional velocity structure provide appropriate first-order guidance on the timing, duration, and amplitude of ground motions that could potentially be observed at the TamTam site (Fig. A3).
The modeling work provides tsunami and seismic waves generated by the three recent large earthquakes, the UNESCO maximum-considered earthquake scenario, and the five UNESCO subevents computed individually along the southern Vanuatu subduction zone. The tsunami modeling covers an elapsed time of 10 h to capture shelf oscillations along archipelagos as well as standing waves within the North and South Fiji Basins (Fig. 1a). The results include regional tsunami amplitude maps and energetic oscillation modes along the margin. Because the computed tsunami waves and long-period ground displacements vary gradually along the preliminary cable route, representative synthetic signals are provided at (18.8° S, 168.2° E) near sensor 2 for illustration (Fig. 1b).
3.1 Recent large events
The 2013 Mw 8.0 Santa Cruz Islands earthquake and the 2021 and 2023 Mw 7.7 earthquakes southeast of the Loyalty Islands represent large events from the northern and southern termini of the Vanuatu subduction zone. Figure 3 presents the regional distributions of the maximum absolute sea-surface elevation, which includes both positive crests and negative troughs to better represent the radiation pattern, particularly for the 2023 normal-fault event (Robert et al., 2025). The two near-trench uplift patches from the 2013 thrust-faulting earthquake provide the primary tsunami source, with minor contributions from subsidence on the upper margin slope (Fig. 2a). Lay et al. (2013) showed that constructive interference of the waves radiated from the two uplift patches defines the main lobes extending northeast and southwest away from Vanuatu (Fig. 3a). Refraction over the margin slope and outer rise produces notable side lobes to the east and south toward the Santa Cruz Islands and the main island of New Caledonia. SMART cable sensor 2, located southeast of the source on the margin slope, experiences only minor wave action despite amplification over the adjacent insular shelves and seamounts of the Vanuatu archipelago.

Figure 3Computed maximum absolute sea-surface elevation of tsunamis generated by recent large earthquakes. (a) The 2013 Mw 8.0 Santa Cruz Islands earthquake. (b) The 2021 Mw 7.7 earthquake southeast of the Loyalty Islands. (c) The 2023 Mw 7.7 earthquake southeast of the Loyalty Islands. The red line and white circles denote the preliminary SMART cable route and sensor locations.
The 2021 and 2023 Mw 7.7 earthquakes on opposite sides of the southern Vanuatu Trench have similar east-west rupture extents but produce tsunamis with a leading crest and a leading trough associated with the thrust and normal faulting mechanisms, respectively (Robert et al., 2025). The contrasting northern radiation lobes result from the respective source locations relative to seamounts and islands immediately to the north along the Hunter Ridge. In comparison, the southern lobes are oriented normal to the respective strikes of the earthquakes because no major bathymetric features are present immediately south of the sources. The 2023 earthquake produces a narrower zone of seafloor deformation beneath deeper water, resulting in shorter-period tsunami waves that are focused more effectively along seamounts and island chains (Robert et al., 2025). For both earthquakes in the southern arc of the subduction zone, the primary tsunami radiation is directed northward and southward away from the main island of New Caledonia. Refraction over the margin slope generates side lobes toward the Vanuatu Islands, where shelf oscillations produce moderate wave action for both events.

Figure 4Oscillation modes derived from the modeled tsunami generated by the 2013 Mw 8.0 Santa Cruz Islands earthquake. The red line and black circles denote the preliminary SMART cable route and sensor locations.
The four sensor modules are located seaward of the insular shelves (Fig. 1b) and outside zones of tsunami amplification for all three recent events (Fig. 3). The computed tsunami wave amplitudes at the sensors are an order of magnitude smaller than those over the adjacent insular shelves. The bathymetry-driven oscillations are analyzed using model results for the 2013 Santa Cruz Islands tsunami, which show widespread excitation throughout the Southwest Pacific (Lay et al., 2013). Spectral analysis converts the computed sea-surface elevation time series into amplitude and phase as functions of period (Munger and Cheung, 2008). Figure 4 depicts selected oscillation modes with well-defined nodal lines, along which the amplitude approaches zero and across which the phase changes by 180°, indicative of standing waves or resonance. The 7 to 40 min modes exhibit distinct standing waves along the New Caledonia Ridge, the Loyalty Ridge, and the Santa Cruz and Vanuatu island chains. The standing waves along the geographically smaller Loyalty Ridge are absent at longer periods, when the oscillations occur at margin and basin scales. The excitation of the individual oscillation modes depends on the tsunami source, but their spatial structures and periods are controlled by bathymetry only (e.g., Cheung et al., 2013; Aranguiz et al., 2019). Sensors located outside high-amplitude antinodes can record direct tsunami signals with minor influence from adjacent landmasses.
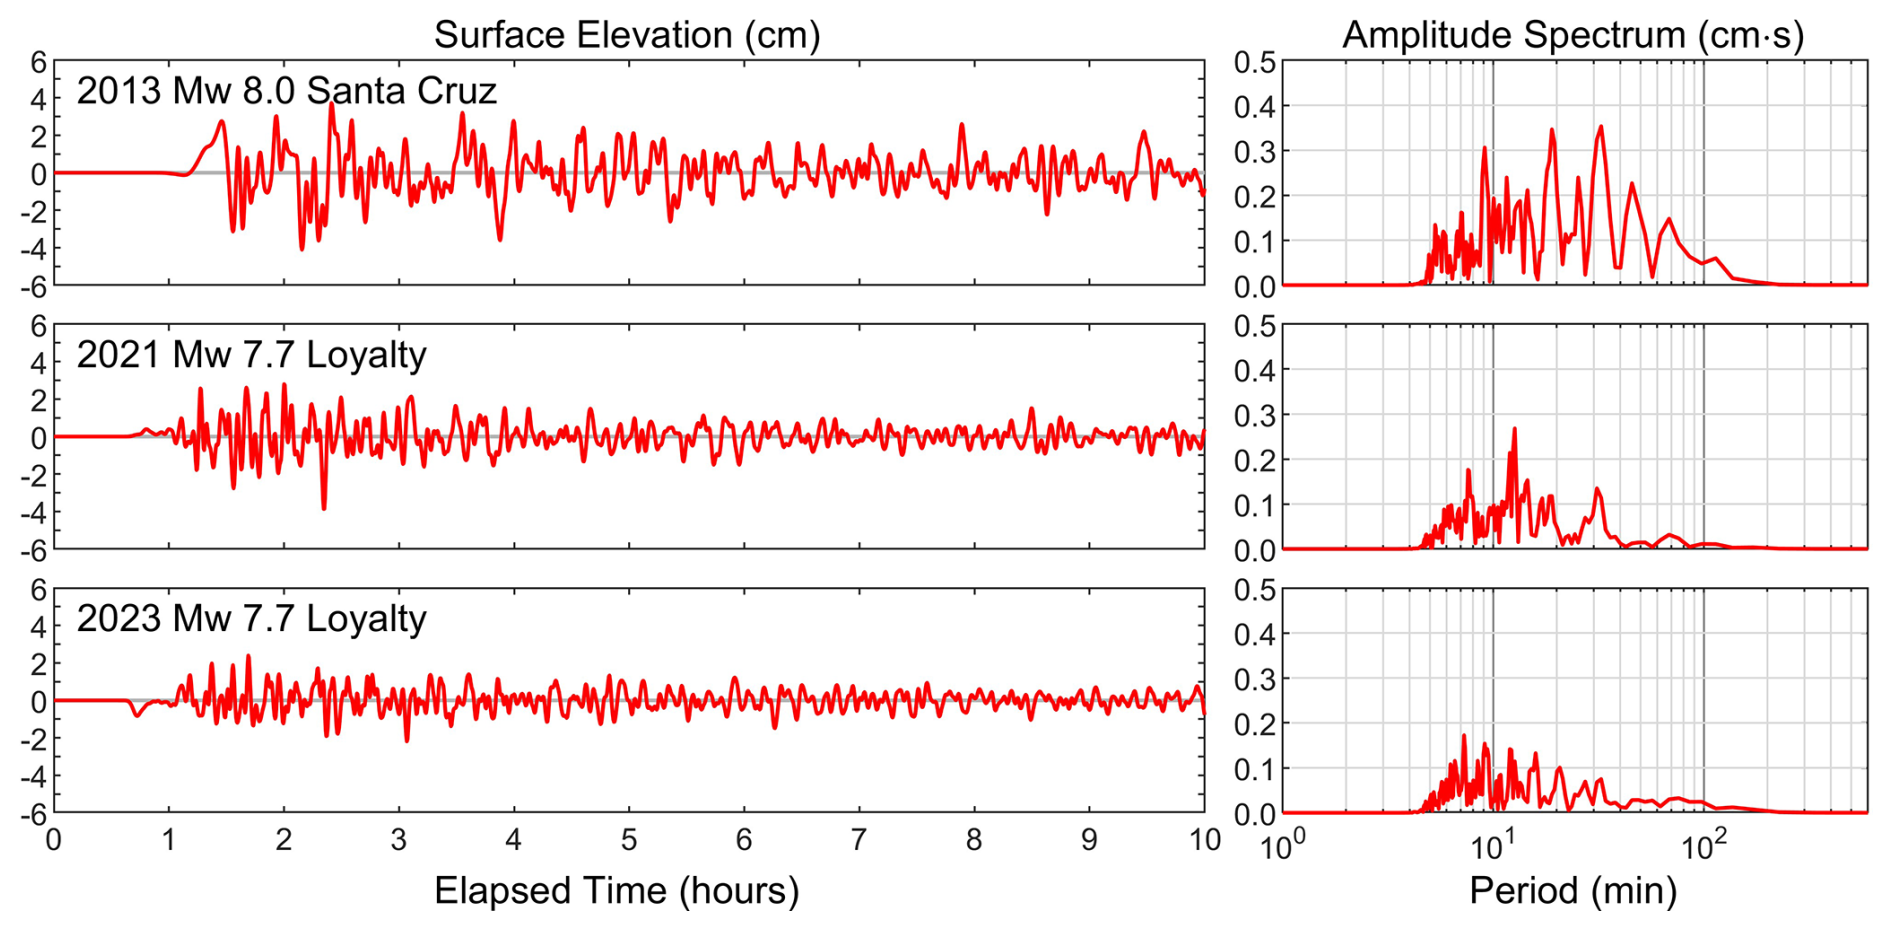
Figure 5Synthetic tsunami time series and spectra at the representative location near sensor 2 from finite-fault models of the three recent large earthquakes in the Vanuatu subduction zone shown in Fig. 2a–c.
Figure 5 shows the computed waveforms and spectra from the 2013, 2021, and 2023 tsunamis at the representative location near sensor 2 of the preliminary TamTam SMART cable. All three tsunamis arrive ∼ 1 h after earthquake initiation. The 2013 and 2021 thrust faulting events produce leading crests, while the 2023 normal faulting results in a leading trough. The initial arrivals directly from the 2021 and 2023 sources southeast of the Loyalty Islands through the Vanuatu Trench are weak because most of the energy radiates normal to the fault strike into the North and South Fiji Basins (Fig. 3). The subsequent waveforms primarily comprise refracted waves across the Hunter Ridge and energy leaking from nearby shelf oscillations, where the amplitude is an order of magnitude larger. The 2013 tsunami from the Santa Cruz Islands exhibits stronger long-period components due to the observing location at 90° azimuth from the main radiation lobe. Despite their distinct waveforms, the three tsunamis exhibit similar groups of spectral peaks within the 10 to 40 and 50 to 100 min period bands associated with the island and basin-scale oscillations shown in Fig. 4.

Figure 6Synthetic ground displacement time series at the representative location near sensor 2 from point-source representations of the three recent large earthquakes in the Vanuatu subduction zone shown in Fig. 2a–c. Numbers in degrees indicate epicentral distances.
The vertical and transverse ground displacements at the representative location are computed for point-source representations of the three recent large earthquakes along the Vanuatu subduction zone (Fig. 6). The transverse component is oriented horizontally and is perpendicular to the great-circle path at the observing location. A 40 s low-pass filter has been applied to approximate the spatiotemporal finiteness of the ruptures. The arrival times vary with distance from the source to the observing location. Peak ground motions of approximately 3–4 cm in the vertical direction and up to 9 cm in the transverse direction are associated with the large Rayleigh wave and Love wave packets, respectively. The synthetic signals include all body wave arrivals. The initial P wave arrives at about 75–120 s after the earthquake origin time, when real-time analysis of ground shaking detected at the cable could commence. If on-scale recordings are obtained from the four three-component sensors distributed along the cable, rapid array processing could determine the azimuth of approach, while the initial ground motion amplitudes could provide a magnitude estimate. Analysis of the larger surface-wave signals is viable within 150 to 380 s of the earthquake origin time, provided that the sensors adequately record low-frequency motion.
3.2 UNESCO scenarios
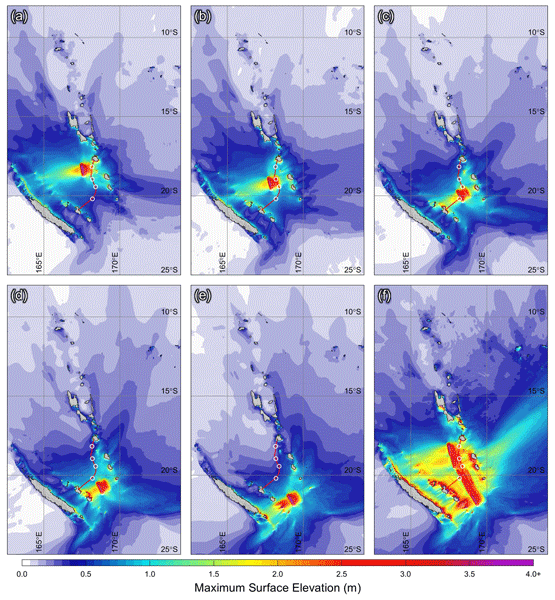
The UNESCO Mw 8.8 maximum-considered earthquake scenario and its five Mw 8.33 subevents complement the recent large events to provide broader coverage of tsunami hazards, particularly along the critical southern segment adjacent to population centers. Figure 7 shows the computed tsunami wave amplitude along the Vanuatu subduction zone for the six scenarios. The initial waves generated by these thrust-faulting events are characterized by sea-surface uplift across the margin slope with a peak of 3.7 m near the trench, reduced from the corresponding seafloor uplift of 4.6 m by nonhydrostatic effects. Subevent A at the northern end of the segment has the most severe impact on Vanuatu with surges reaching 8.5 m elevation at the east-facing shore of Efate Island. The subevents to the south are more critical to the Loyalty Islands with a maximum elevation of 9.3 m at Maré Island. For the combined Mw 8.8 scenario, the arc curvature focuses tsunami energy toward the southern Vanuatu Islands, where nearshore amplification produces surges up to 11.5 m elevation at Tanna Island. The computed sea-surface elevation reaches 12.7 m at Lifou Island and 11.9 m along the main island of New Caledonia. These values represent nearshore sea-surface elevations resolvable by the 0.5 arcmin (∼ 0.9 km) level-2 grid; the corresponding runup heights may be larger or smaller depending on the coastal terrain and wave period (Bai et al., 2023b).

Figure 7Computed maximum sea-surface elevation of tsunamis generated by UNESCO earthquake scenarios in Fig. 2d. (a) Mw 8.33 A earthquake. (b) Mw 8.33 B earthquake. (c) Mw 8.33 C earthquake. (d) Mw 8.33 D earthquake. (e) Mw 8.33 E earthquake. (f) Mw 8.8 combined maximum-considered earthquake scenario. The red line and white circles denote the preliminary SMART cable route and sensor locations.

Figure 8Synthetic tsunami time series and spectra at the representative location near sensor 2 for the fault models of the UNESCO earthquake scenarios shown in Fig. 2d.
At least one sensor along the preliminary cable route lies within each of the source regions for subevents A through C and would therefore undergo coseismic vertical displacement. The recorded bottom pressure would need correction for local seafloor uplift and nonhydrostatic effects before being converted to sea-surface elevation (Yamazaki et al., 2023). Analysis of the model results indicates travel times of 11 and 18 min for the tsunamis generated by subevents D and E to the nearest sensor. Figure 8 shows, for illustration, the computed waveforms and amplitude spectra at the representative location near sensor 2 from the five subevents and the combined scenario. The sea surface rises to 2.5 m during the rupture of subevent B directly beneath this location, where the accompanying seafloor uplift makes the bottom pressure correction particularly important. With minor energy trapping over the margin slope, the ensuing oscillation decays rapidly through radiation. Because of wave attenuation away from the source, the other subevents produce 1 m amplitude or less at this location. The combined scenario has an initial wave amplitude similar to that of subevent B, but the much larger rupture length results in stronger codas as waves arrive sequentially from the five subevents along the segment. The wave spectrum exhibits bimodal excitation at island and basin scales with peaks aligned with the oscillation modes deduced from the 2013 Santa Cruz Islands event (Fig. 4).
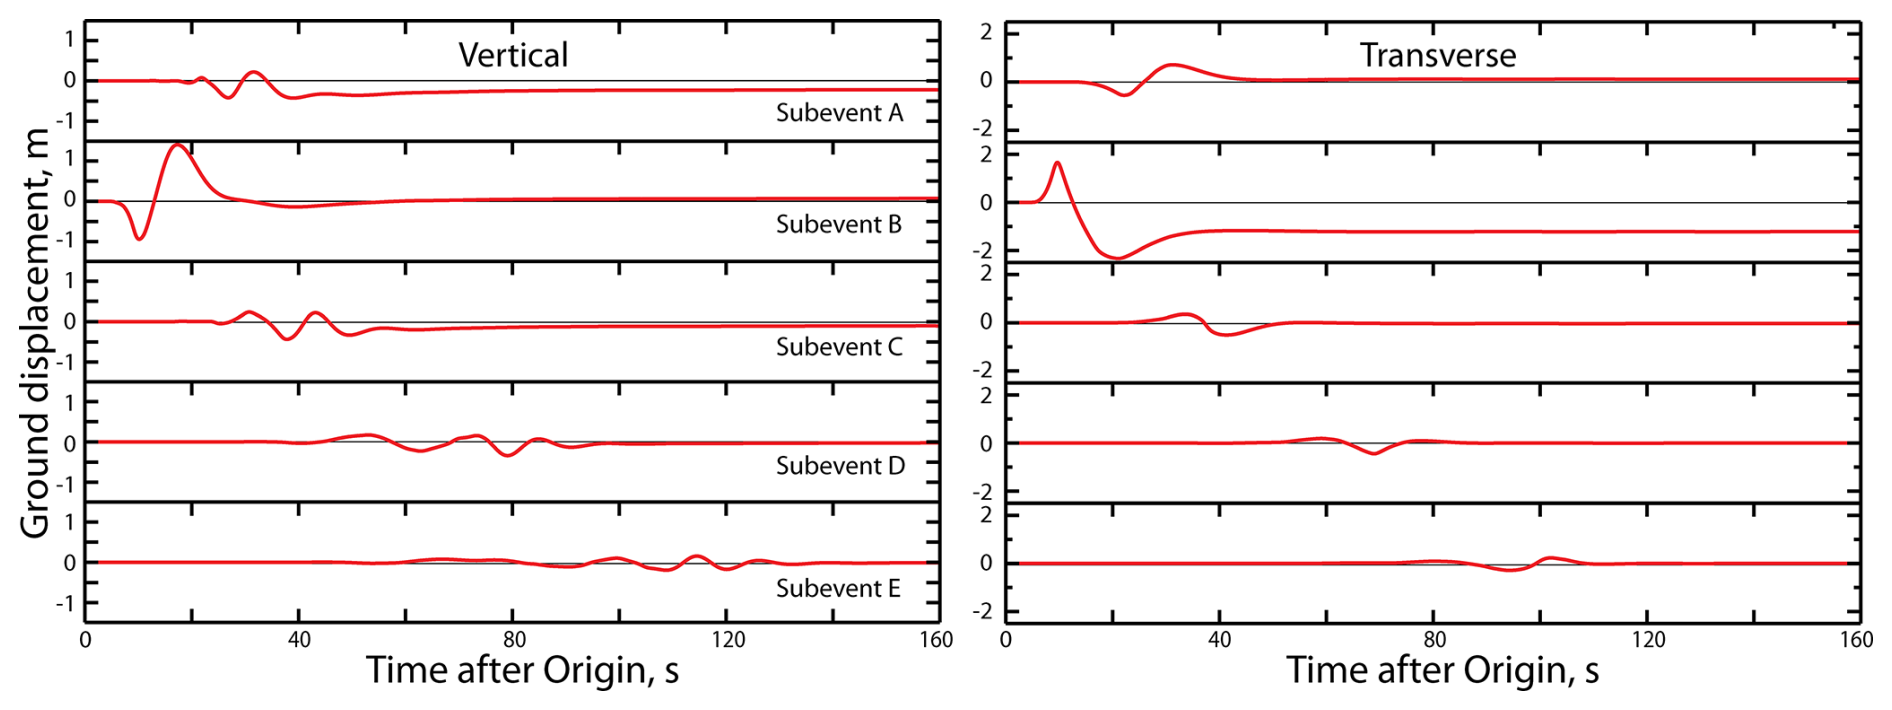
Figure 9Synthetic ground displacement time series at the representative location near sensor 2 for point-source representations of the UNESCO Mw 8.33 earthquake scenarios A–E in Fig. 2d.
The seismic waves at the representative location are computed for the individual Mw 8.33 subevents and the Mw 8.8 combined faulting. All scenarios prescribe 10 m slip with moment tensor point sources at subevent centers and, for the combined scenario, synchronous rupture across the entire segment for simplicity. Figure 9 shows the subevent signals comprising long-period seismic ground motions as well as static displacements. A low-pass filter with a corner period of 40 s has been applied to approximately account for the expected smoothing from the finite spatiotemporal extent of each subevent. Ground motions are shown for the vertical and transverse components, with arrival times ranging from 6 to 60 s according to the distances from the subevent centers to the observing location. The increasing duration of ground motions with source distance is consistent with surface-wave dispersion and greater separation of seismic-wave arrivals within the one-dimensional model framework. The strongest seismic waves are produced by subevent B, whose point source lies closest to the observing location. The peak vertical and transverse transient displacements reach 1.5 and 2.3 m, respectively, with a static transverse displacement of ∼ 1 m remaining after passage of the large surface waves. These estimates at the observing location within the subevent B rupture zone are subject to the limitations of the point-source approximation, which may explain why the static vertical displacement predicted by the finite-fault model is not reproduced here. The signals from the other subevents, while weaker, should be better approximated by point sources because of their greater distances from the observing location.
The composite, long-duration displacement for the Mw 8.8 earthquake scenario is shown in Fig. 10. Since the subevents are assumed to rupture at the same time, their arrivals at the representative location are functions of propagation distance alone. The composite ground motions are expressed in terms of the vertical, north-south, and east-west components because the orientation of the transverse component changes with each subevent location. A 40 s low-pass filter is again applied to approximate the smoothing associated with the finite spatiotemporal extents of the individual subevents. The sequence of discrete subevent pulses would be smeared out for a true continuous rupture, but the heterogeneous coupling expected along the subduction zone would likely involve correspondingly complex localized failures. The seismic waves from the center of subevent B arrive 6 s after earthquake initiation, and the shaking persists for over 2 min, ending with passage of the waves from the farthest subevent E. The peak ground motion is about 1.4 m on the vertical component and 3.2 m in the horizontal plane. Despite the observing location being within the rupture zone of subevent B, which is represented by a point source, the synthetics provide a first-order reference for the overall timing, duration, and amplitude of long-period ground motions (Appendix). They also demonstrate how interference among the subevent seismic waves shapes the composite ground motion at the cable site.

Figure 10Synthetic ground displacement time series at the representative location near sensor 2 for point-source representations of the UNESCO Mw 8.8 earthquake scenario in Fig. 2d. The five subevents are assumed to rupture synchronously, and the summed displacements are shown for the vertical, north-south, and east-west components of motion due to the differing subevent positions relative to the observing location.
Large earthquakes occur throughout the Vanuatu subduction zone, exposing numerous islands in the region to strong ground shaking and tsunami impact. Prior studies have systematically examined these hazards and developed fault models for recent large earthquakes and maximum-considered scenarios. These fault models provide a basis to develop a plausible range of seismic and tsunami waveforms at the TamTam SMART cable. The results provide a reference for hazard assessment, data integration, and emergency management ahead of cable installation and operation.
4.1 Earthquake and tsunami hazards
There have been 18 shallow (< 70 km deep) Mw 7.5+ earthquakes recorded in the Vanuatu subduction zone since 1900 (UNESCO-IOC, 2025). The UNESCO maximum-considered scenario of Mw 8.8 provides an upper-bound estimate of potential tsunami impacts and long-period ground motions, but smaller and more frequent earthquakes in the southern segment can still devastate local communities. For example, the tsunami generated by the 1875 Mw 8.1–8.2 earthquake produced over 10 m of runup on the northeastern coast of Lifou Island, New Caledonia (Paris et al., 2023). The overall severity is comparable to the UNESCO Mw 8.33 subevents, for which the computed sea-surface elevation reaches 8.5 m at the shore of Efate Island, Vanuatu, and 9.3 m at Maré Island, New Caledonia. The five subevents can individually serve as preferred maximum scenarios along the southern Vanuatu subduction zone. Acquiring nearshore bathymetry for inundation mapping, even at modest resolution, is a logical next step to strengthen emergency management in the region.
Large earthquakes along the northern and Matthew-Hunter segments, such as the 2013 Mw 8.0 and 2021 and 2023 Mw 7.7 events, also pose hazards in Vanuatu and New Caledonia. The resulting tsunamis reach the planned TamTam cable approximately 1 h after earthquake initiation, leaving limited time to respond if deemed destructive. Hazardous ocean conditions can be long lasting due to amplification and trapping of tsunami energy along island chains (Cheung et al., 2013). The resulting surges and currents can damage vessels, disrupt harbor operations, and cause excess sedimentation in waterways despite having minor inundation risks (Admire et al., 2014). The limited number of regional seismic and geodetic sensors in operation hampers earthquake and tsunami warning capabilities along the entire subduction zone. The deployment of continuous monitoring capabilities along the TamTam cable will contribute to event detection and rapid assessment, particularly along the southern Vanuatu subduction zone.
Being located within an active subduction zone presents a unique challenge to emergency management. The recent 17 December 2024 Mw 7.3 earthquake, ∼ 24 km west of Port Vila, caused 14 fatalities and 265 injuries, extensive damage in Port Vila, and long-term disruption to the tourism industry (World Bank, 2025). The earthquake occurred at a depth of ∼ 57 km within the subducting slab but still generated a tsunami with 29 cm amplitude at the Port Vila tide gauge (Roger, 2025). Its close proximity to the island resulted in little warning time, regardless of the availability of the TamTam SMART cable. From an emergency response perspective, the situation is similar to that posed by a local megathrust earthquake, such as the UNESCO scenarios considered here. As with all local tsunamis, effective public education and predetermined routes are essential to enable timely self-evacuation of coastal communities in response to natural warning signs of strong and prolonged ground shaking (Wood et al., 2023).
4.2 Sensor system and data
The seismic, pressure, and temperature sensors will be installed in separate modules along the TamTam subsea cable. The seismic accelerometers and broadband seismometers will be provided by Nanometrics (https://nanometrics.ca, last access: 10 November 2026), while the pressure and temperature sensors will be supplied by RBR (https://rbr-global.com, last access: 10 November 2026). Alcatel Submarine Networks (ASN) will integrate fabrication of the sensor modules into the cable manufacturing process through its Climate Change Nodes initiative. Ifremer will archive the sensor data for subsequent analysis and provide low-latency distribution to hazards monitoring agencies, including the Vanuatu Meteorology and Geo-hazards Department (VMGD) and Oceania Regional Seismic Network (ORSNET). The modeling approach outlined in Sect. 2 provides a framework to evaluate observed tsunami signals using finite-fault models derived from global seismic and regional DART records. The cable sensors, in turn, can provide early warning and confirmation of local events while supplying additional data streams to existing networks to improve source characterization and tsunami forecasts for nearby population centers (e.g., Gusman et al., 2022).
Deployment of the TamTam SMART cable requires careful consideration of its resilience in this tectonically active region. General industry guidance calls for sufficient slack in submarine cables deployed across continental margins to account for seafloor conditions and seismically induced ground motion. Typical practice allows 0.5 %–1 % slack over deep, sedimented seafloor, increasing to 1 %–2 % on continental shelves and slopes to accommodate rougher bathymetry and installation tolerance. Across major active subduction faults, a more conservative design may provide 2 %–5 % local slack together with geometric accommodations, such as gentle S-curves, to enhance cable resilience (Nick Koopalethes, personal communication, 2026). Site-specific design parameters, including expected coseismic slip and recurrence characteristics, can guide selecting an appropriate combination of cable slack, routing geometry, and protective measures to achieve an adequate safety margin. As with other seafloor cables equipped with in-line instruments, the sensor orientations will need to be accurately determined after deployment.
With seismic waves arriving well ahead of tsunami waves, rapid tsunami assessment could begin using the cable seismic observations. Subsequent tsunami signals recorded by sensors seaward of the insular shelves are weakly affected by resonance, allowing them to provide general indications of potential impact and to corroborate inferences from seismic observations. Caution is warranted for earthquakes near the sensors. Large dynamic ground displacements may interfere with the operation of motion sensors laid on sediments. The short-period ground displacements, velocities, and accelerations are not yet well constrained at the sensor sites. Following deployment, ground motion models can be developed to characterize both the regional propagation path and short-period ground motion at the site. For sensors within a rupture zone, bottom-pressure records should be corrected for effects of coseismic vertical seafloor displacement before being converted to sea-surface elevation. In addition, seismic noise in pressure records may obscure signals of initial tsunami arrivals, as observed in near-field DART measurements (e.g., An et al., 2017; Bai et al., 2022, 2023a). The issue has been alleviated by the fourth-generation DART system deployed in the New Zealand network through separation of high-frequency seismic noise from tsunami signals (Fry et al., 2020). Similar post-processing of SMART pressure records should therefore be incorporated into the automated data workflow.
4.3 Emergency management
Vanuatu is an island nation in the Southwest Pacific comprising 83 islands along an 800–900 km archipelago. The Vanuatu Meteorology and Geo-hazards Department (VMGD) is the government agency with the mandate to monitor meteorological and geological hazards, including volcanoes, earthquakes, and tsunamis, and to provide early warning information to the public. VMGD has an established geological monitoring network consisting of 15 plus seismic stations distributed across the six provinces of Vanuatu. Broadband sensors and established telemetry transmission to the VMGD data center enable near real-time detection of seismic events. The installation of tide gauges near the coastline of some islands assists with tsunami monitoring. However, the detection range is limited to Vanuatu's coastal waters and does not extend regionally or to the subduction zone.
The National Disaster Management Office (NDMO) is responsible for the response to and recovery from any disaster and for activation of the National Emergency Operations Center with advice from VMGD. Having a well-established hierarchy of working groups from the national to provincial and community levels allows coordinated pre-disaster awareness and outreach efforts and transfer of response and recovery efforts to the government and partner organizations post-disaster. The effectiveness of preparedness and mitigation measures developed is a result of the availability of the real-time seismic and historical data maintained by VMGD. This is now augmented by synthetic tsunami and long-period seismic data from three recent large earthquakes and tsunamis as well as the UNESCO-IOC maximum scenario along with its subevents for hazard assessment and long-term planning.
The deployment of the TamTam SMART cable and integration of its real-time data into VMGD's monitoring network will greatly enhance the current early warning system. The temperature, pressure, and seismic data from the four SMART nodes made available by Ifremer will feed additional information to the current system providing earthquake detection parameters and tsunami threat analysis in and around the subduction zone. Acquiring such data will complement existing monitoring systems and support preparedness and mitigation efforts developed by NDMO, resulting in a well-informed and prepared country. The benefits will extend across the Southwest Pacific, while the observations will be of great interest to the international research community.
The finite fault models for the 2013 Mw 8.0 Santa Cruz Islands earthquake and the 2021 and 2023 Mw 7.7 earthquakes southeast of the Loyalty Islands were derived from inversions of global seismic records. Poorly constrained rupture parameters were iteratively refined through nonhydrostatic tsunami modeling until computed signals satisfactorily matched DART and tide gauge records (Lay et al., 2013; Robert et al., 2025). To illustrate the agreement without reproducing the full data sets, Fig. A1 presents selected teleseismic P-wave observations from a range of azimuths alongside predictions using one-dimensional velocity models for the three events. The synthetics generally reproduce the timing, polarity, and dominant pulses of the observed P waves, although some differences remain in peak amplitudes and later oscillations. Figure A2 compares the observed and computed waveforms and spectra at selected DART stations with strong signals of the respective tsunamis. The computed waveforms capture the leading crest–trough sequences as well as amplitudes of later arrivals. The spectra tend to underrepresent the observed long-period energy, which is likely mixed with background oscillations not included in the tsunami modeling. The overall agreement between observations and synthetics supports the modeling approach used to predict tsunami signals at the TamTam site from the three recent events and the UNESCO scenarios (Figs. 5 and 8).
The TamTam sensors will record distant earthquakes in the Vanuatu subduction zone through propagation paths along the arc affected by variable bathymetry, slab structure, and sedimentary wedge complexities. Detailed structural models in the region have not been developed due to the paucity of stations. A simplified approach, which involves point-source representations of the finite-fault models and a one-dimensional standard Earth model (PREM; Dziewonski and Anderson, 1981), provides synthetic seismic motions at the TamTam site for the 2013, 2021, and 2023 earthquakes and the UNESCO scenarios (Figs. 6, 9, and 10). There is no operating seismic station in close proximity for direct calibration of the path effects. To assess the performance of the simplified approach, Fig. A3 compares observations from the three recent earthquakes with synthetics at broadband seismic stations G.SANVU (Espiritu Santo, Vanuatu; 15.45° S, 167.20° E), G.NOUC (Port Laguerre, New Caledonia; 22.10° S, 166.31° E), and ND.KOUNC (Koumac, New Caledonia; 20.56° S, 164.26° E). The synthetics have been low-pass filtered at 40 s to account for the overall source spectrum roll-off associated with spatiotemporal extents of the ruptures. The observations at SANVU involve paths along the island arc and display late scattered or multi-pathed surface wave arrivals not predicted by the one-dimensional model. There is general agreement in the Pn and Rg arrival times and overall amplitudes, but the dispersion of the larger Rayleigh waves is not accurately modeled for this island arc setting. These comparisons indicate that the synthetics in Figs. 6, 9 and 10 provide first-order predictions of long-period ground motions that might be observed at TamTam but are not sufficiently detailed to assess higher-frequency signals influenced by regional bathymetry and subsurface structure.

Figure A1Comparison of observed (black lines) and modeled (red lines) teleseismic broadband P waves at different azimuths for the 2013 Mw 8.0 Santa Cruz Islands earthquake and the 2021 and 2023 Mw 7.7 earthquakes southeast of the Loyalty Islands (adapted from Lay et al., 2013, and Robert et al., 2025). The finite-fault models in Fig. 2a, b, and c were respectively used for the modeling. Waveforms for a given event are on common amplitude scales.

Figure A2Comparison of recorded (black lines) and computed (red lines) tsunami time series and spectra at DART stations (adapted from Lay et al., 2013, and Robert et al., 2025). (a) The 2013 Mw 8.0 Santa Cruz Islands earthquake. (b) The 2021 Mw 7.7 earthquake southeast of the Loyalty Islands. (c) The 2023 Mw 7.7 earthquake southeast of the Loyalty Islands. The finite-fault models in Fig. 2a, b, and c were used to model the three events, respectively. DART station locations are shown in Fig. 1a.

Figure A3Comparison of observed (black lines) and synthetic (red lines) ground displacement time series at regional broadband seismic stations for the 2013 Mw 8.0 Santa Cruz Islands earthquake and the 2021 and 2023 Mw 7.7 earthquakes southeast of the Loyalty Islands. Point-source representations of the finite-fault models shown in Fig. 2a, b, and c are used for the calculations. Seismic station locations are shown in Fig. 1b. Numbers in degrees indicate epicentral distances.
The NEOWAVE code for tsunami modeling may be requested from the corresponding author for academic research. The SYNGINE seismic wave simulator is available online (https://service.iris.edu/irisws/syngine/1/, last access: 6 November 2026).
The digital elevation model used in this study is available at GEBCO (https://www.gebco.net/data-products/historical-data-sets, last access: 10 November 2026).
KC: Conceptualization, Methodology, Investigation, Writing – original draft, review and editing, Project Administration. YY: Methodology, Investigation, Software, Formal analysis, Data curation, Visualization, Writing – review and editing. TL: Methodology, Investigation, Software, Formal analysis, Data curation, Visualization, Writing – original draft, review and editing. MF: Writing – original draft, review and editing. JN: Writing – original draft, review and editing. BH: Writing – review and editing, Project Administration.
The contact author has declared that none of the authors has any competing interests.
Publisher's note: Copernicus Publications remains neutral with regard to jurisdictional claims made in the text, published maps, institutional affiliations, or any other geographical representation in this paper. The authors bear the ultimate responsibility for providing appropriate place names. Views expressed in the text are those of the authors and do not necessarily reflect the views of the publisher.
The authors thank the two anonymous reviewers for their constructive criticisms; Charlotte Rowe, Los Alamos National Laboratory, and Laurent Foulonneau, Pacific Peering, for the helpful comments on the manuscript; and Nick Koopalethes, GBS Inc., for guidance on industry practice for cable route planning. SOEST Contribution No. 12210.
The Gordon and Betty Moore Foundation funded this study through grant no. GBMF10787 to the University of Hawaii with subawards to Subsea Data Systems and Vanuatu Meteorology and Geo-hazards Department. T. Lay was supported by the National Science Foundation under grant number EAR-1802364.
This paper was edited by Rachid Omira and reviewed by two anonymous referees.
Admire, A. R., Dengler, L. A., Crawford, G. B., Uslu, B. U., Borrero, J. C., Greer, S. D., and Wilson, R. I.: Observed and Modeled Currents from the Tohoku-oki, Japan and other Recent Tsunamis in Northern California, Pure Appl. Geophys., 171, 3385–3403, https://doi.org/10.1007/s00024-014-0797-8, 2014.
An, C., Cai, C., Zheng, Y., Meng, L., and Liu, P.: Theoretical solution and applications of ocean bottom pressure induced by seismic seafloor motion, Geophys. Res. Lett., 44, 10272–10281, https://doi.org/10.1002/2017GL075137, 2017.
Aranguiz, R., Catalán, P. A., Cecioni, C., Bellotti, G., Henriquez, P., and González, J.: Tsunami resonance and spatial pattern of natural oscillation modes with multiple resonators, J. Geophys. Res.-Oceans, 124, 7797–7816, https://doi.org/10.1029/2019JC015206, 2019.
Bai, Y., Liu, C., Lay, T., Cheung, K. F., and Ye, L.: Optimizing a model of coseismic rupture for the 22 July 2020 Mw 7.8 Simeonof earthquake by exploiting acute sensitivity of tsunami excitation across the shelf break, J. Geophys. Res.-Sol. Ea., 127, e2022JB024484, https://doi.org/10.1029/2022JB024484, 2022.
Bai, Y., Liu, C., Lay, T., Cheung, K. F., and Yamazaki, Y.: Fast and slow intraplate ruptures during the 19 October 2020 magnitude 7.6 Shumagin earthquake, Nat. Comm., 14, 2015, https://doi.org/10.1038/s41467-023-37731-2, 2023a.
Bai, Y., Yamazaki, Y., and Cheung, K. F.: Intercomparison of hydrostatic and nonhydrostatic modeling for tsunami inundation mapping, Phys. Fluids, 35, 077111, https://doi.org/10.1063/5.0152104, 2023b.
Cheung, K. F., Bai, Y., and Yamazaki, Y.: Surges around the Hawaiian Islands from the 2011 Tohoku tsunami, J. Geophys. Res.-Oceans, 118, 5703–5719, https://doi.org/10.1002/jgrc.20413, 2013.
Cleveland, K. M., Ammon, C. J., and Lay, T.: Large earthquake processes in the northern Vanuatu subduction zone, J. Geophys. Res.-Sol. Ea., 119, 8866–8883, https://doi.org/10.1002/2014JB011289, 2014.
Davies, G. and Griffin, J.: The 2018 Australian Probabilistic Tsunami Hazard Assessment, Record 2018/41, Geoscience Australia, Canberra, https://doi.org/10.11636/Record.2018.041, 2018.
Dziewonski, A. M. and Anderson, D. L.: Preliminary reference Earth model, Phys. Earth Planet. Int., 25, 297–356, https://doi.org/10.1016/0031-9201(81)90046-7, 1981.
Fry, B., McCurrach, S.-J., Gledhill, K., Power, W., Williams, M., Angove, M., Arcas, D., and Moore, C.: Sensor network warns of stealth tsunamis, Eos, 101, https://doi.org/10.1029/2020EO144274, 2020.
Gusman, A. R., Roger, J., Power, W., Fry, B., and Kaneko, Y.: The 2021 Loyalty Islands earthquake (Mw 7.7): Tsunami waveform inversion and implications for tsunami forecasting for New Zealand, Earth Space Sci., 9, e2022EA002346, https://doi.org/10.1029/2022EA002346, 2022.
Hartzell, S. H. and Heaton, T. H.: Inversion of strong ground motion and teleseismic waveform data for the fault rupture history of the 1979 Imperial Valley, California, earthquake, B. Seismol. Soc. Am., 73, 1553–1583, https://doi.org/10.1785/BSSA07306A1553, 1983.
Heidarzadeh, M., Harada, T., Satake, K., Ishibe, T., and Gusman, A. R.: Comparative study of two tsunamigenic earthquakes in the Solomon Islands: 2015 Mw 7.0 normal-fault and 2013 Santa Cruz Mw 8.0 megathrust earthquakes, Geophys. Res. Lett., 43, 4340–4349, https://doi.org/10.1002/2016GL068601, 2016.
Howe, B. M., Arbic, B. K., Aucan, J., Barnes, C. R., Bayliff, N., Becker, N., Butler, R., Doyle, L., Elipot, S., Johnson, G. C., Landerer, F., Lentz, S., Luther, D. S., Müller, M., Mariano, J., Panayotou, K., Rowe, C., Ota, H., Song, Y. T., Thomas, M., Thomas, P. N., Thompson, P., Tilmann, F., Weber, T., and Weinstein, S.: SMART cables for observing the global ocean: science and implementation, Front. Mar. Sci., 6, 424, https://doi.org/10.3389/fmars.2019.00424, 2019.
Howe, B. M., Angove, M., Aucan, J., Barnes, C. R., Barros, J. S., Bayliff, N., Becker, N. C., Carrilho, F., Fouch, M. J., Fry, B., Jamelot, A., Janiszewski, H., Kong, L. S. L., Lentz, S., Luther, D. S., Marinaro, G., Matias, L. M., Rowe, C. A., Sakya, A. E., Salaree, A., Thiele, T., Tilmann, F. J., von Hillebrandt-Andrade, C., Wallace, L., Weinstein, S., and Wilcock, W.: SMART subsea cables for observing the earth and ocean, mitigating environmental hazards, and supporting the blue economy, Front. Earth Sci., 9, 775544, https://doi.org/10.3389/feart.2021.775544, 2022.
Ioualalen, M., Pelletier, B., and Solis Gordillo, G.: Investigating the March 28th 1875 and the September 20th 1920 earthquakes/tsunamis of the Southern Vanuatu arc, offshore Loyalty Islands, New Caledonia, Tectonophysics, 709, 20–38, https://doi.org/10.1016/j.tecto.2017.05.006, 2017.
Kikuchi, M. and Kanamori, H.: Inversion of complex body waves, B. Seismol. Soc. Am., 72, 491–506, https://pubs.geoscienceworld.org/ssa/bssa/article/72/2/491/118251/Inversion-of-complex-body-waves (last access: 10 November 2026), 1982.
Lay, T., Ye, L., Kanamori, H., Yamazaki, Y., Cheung, K. F., and Ammon, C. J.: The February 6, 2013 Mw 8.0 Santa Cruz Islands earthquake and tsunami, Tectonophysics, 608, 1109–1121, https://doi.org/10.1016/j.tecto.2013.07.001, 2013.
Li, L. and Cheung, K. F.: Numerical dispersion in non-hydrostatic modeling of long-wave propagation, Ocean Modell., 138, 68–87, https://doi.org/10.1016/j.ocemod.2019.05.002, 2019.
Munger, S. and Cheung, K. F.: Resonance in Hawaii waters from the 2006 Kuril Islands Tsunami, Geophys. Res. Lett., 35, L07605, https://doi.org/10.1029/2007GL032843, 2008.
Okada, Y.: Surface deformation due to shear and tensile faults in a half-space, B. Seismol. Soc. Am., 75, 1135–1154, https://doi.org/10.1785/BSSA0750041135, 1985.
Paris, R., Pelletier, B., Roger, J., Wassmer, P., and Sabatier, P.: Sedimentary evidence of tsunamis in New Caledonia, southwest Pacific, Mar. Geol., 463, 107116, https://doi.org/10.1016/j.margeo.2023.107116, 2023.
Robert, W. H., Yamazaki, Y., Cheung, K. F., and Lay, T.: Tsunami variability for the 2021 megathrust and 2023 outer rise Mw 7.7 earthquakes southeast of the Loyalty Islands, J. Geophys. Res.-Oceans, 130, e2024JC021880, https://doi.org/10.1029/2024JC021880, 2025.
Roger, J.: Numerical simulation of the tsunami triggered by the 17 December 2024 Port Vila, Vanuatu, Mw 7.3 earthquake, EGU General Assembly 2025, Vienna, Austria, 27 Apr–2 May 2025, EGU25-7588, https://doi.org/10.5194/egusphere-egu25-7588, 2025.
Roger, J., Pelletier, B., Duphil, M., Lefèvre, J., Aucan, J., Lebellegard, P., Thomas, B., Bachelier, C., and Varillon, D.: The Mw 7.5 Tadine (Maré, Loyalty Islands) earthquake and related tsunami of 5 December 2018: seismotectonic context and numerical modeling, Nat. Hazards Earth Syst. Sci., 21, 3489–3508, https://doi.org/10.5194/nhess-21-3489-2021, 2021.
Roger, J. H. M. and Pelletier, B.: A brief history of tsunamis in the Vanuatu Arc, Nat. Hazards Earth Syst. Sci., 24, 3461–3478, https://doi.org/10.5194/nhess-24-3461-2024, 2024.
Satake, K.: Inversion of tsunami waveforms for the estimation of a fault heterogeneity: Method and numerical experiments, J. Phys. Earth, 35, 241–254, 1987.
Tanioka, Y. and Satake, K.: Tsunami generation by horizontal displacement of ocean bottom, Geophys. Res. Lett., 23, 861–864, https://doi.org/10.1029/96GL00736, 1996.
UNESCO-IOC: Expert Meeting on Tsunami Sources, Hazards, Risk and Uncertainties Associated with the Vanuatu, Solomon and New Britain Subduction Zones, Port Vila, Vanuatu, 14–17 May 2024, Workshop Report 315, UNESCO, Paris, France, https://unesdoc.unesco.org/ark:/48223/pf0000392442.locale=en (last access: 10 November 2026), 2025.
Wood, N., Peters, J., Cheung, K. F., Yamazaki, Y., Calvo, D., and Guard, C.: Modeling non-structural strategies to reduce pedestrian evacuation times for mitigating local tsunami threats in Guam, Int. J. Disast. Risk Re., 95, 103859, https://doi.org/10.1016/j.ijdrr.2023.103859, 2023.
World Bank: Global Rapid Post-Disaster Damage Estimation Report: The December 17, 2024 Mw 7.3 Earthquake in Port Vila, Vanuatu. Global Facility for Disaster Reduction and Recovery, World Bank, Washington, DC, http://hdl.handle.net/10986/42820, 2025.
Yamazaki, Y., Kowalik, Z., and Cheung, K. F.: Depth-integrated, non-hydrostatic model for wave breaking and run-up, Int. J. Numer. Meth. Fluids, 61, 473–497, https://doi.org/10.1002/fld.1952, 2009.
Yamazaki, Y., Cheung, K. F., and Kowalik, Z.: Depth-integrated, non-hydrostatic model with grid nesting for tsunami generation, propagation, and run-up, Int. J. Numer. Meth. Fluids, 67, 2081–2107, https://doi.org/10.1002/fld.2485, 2011.
Yamazaki, Y., Bai, Y., Goo, L. L., Cheung, K. F., and Lay, T.: Nonhydrostatic modeling of tsunamis from earthquake rupture to coastal impact, J. Hydraul. Eng., 149, 04023033, https://doi.org/10.1061/JHEND8.HYENG-13388, 2023.
Ye, L., Gong, W., Lay, T., Kanamori, H., and Chen, X.: Shallow megathrust rupture during the 10 February 2021 Mw 7.7 Southeast Loyalty Islands Earthquake Sequence, Seism. Rec., 1, 154–163, https://doi.org/10.1785/0320210035, 2021.