
the Creative Commons Attribution 4.0 License.
the Creative Commons Attribution 4.0 License.
 | 04 Aug 2026
Drought propagation and ecosystem resilience in a peri-urban catchment of Berlin-Brandenburg
Polina Franke
Aryan Goswami
Márk Somogyvári
Climate change intensifies pressure on water resources, making it essential to understand how drought severity affects both surface and groundwater systems and their impact on vegetation. Local studies can offer critical insights into ecosystem responses and help to support targeted adaptation strategies. This study investigates the drought dynamics and their effects on surface water, groundwater, and vegetation across the Tegeler Fliess catchment in Berlin/Brandenburg from November 2008 to April 2021. Calculating drought indices for atmospheric, hydrological and groundwater drought, namely the Standardized Precipitation Index (SPI), the Standardized Surface Water Level Index (SSWLI) and the Standardized Groundwater Level Index (SGLI), respectively, the analysis identifies station-specific drought events and their propagation across three locations: Schildow, Luebars, and Tegel. The three indices allow us to take a closer look at the differences and the propagation of drought processes over different parts of the hydrological system. The study also assesses the impact of drought on vegetation health using the Normalized Difference Vegetation Index (NDVI). Our results strongly differ at different locations: the peri-urban area (Tegel) experienced the most extreme and prolonged groundwater droughts. In contrast, groundwater in the nature reserve and fen meadow area (Schildow) experienced more moderate occurrences of drought. Thus, this area remained more resilient but faced significant surface water stress. Agricultural land (Luebars) displayed variability in both surface and groundwater responses, with surface water systems being more resilient. NDVI analysis revealed little to no observable effect with only moderate changes in vegetation throughout the study period, showing resilience despite severe drought conditions from 2018 to 2020. Spearman correlation tests did not show any significant relationship between NDVI and drought indices, while Granger causality tests revealed that SPI, and for some stations also SSWLI, significantly Granger-caused NDVI with a lag of one month. These findings highlight the need for localized drought management strategies tailored to both surface and groundwater resources, alongside enhanced vegetation monitoring that goes beyond traditional indices like NDVI.
- Article
(6471 KB) - Full-text XML
-
Supplement
(1851 KB) - BibTeX
- EndNote


The phenomenon of global warming is having a significant impact on our planet, with observable consequences already affecting the Berlin/Brandenburg region. Studies show that extreme heat waves and dry spells will likely become increasingly frequent and intense across Europe by the end of the 21st century (Spinoni et al., 2018; Grillakis, 2019). The increasing pressure of climate change on water resources highlights the need to understand its effects on surface and groundwater systems, as well as its impact on vegetation. Understanding the relationship between drought severity and vegetation response as climate change intensifies is critical for ensuring ecosystem resilience and managing precious water resources. Ecosystems show varying capacities in withstanding frequent drought occurrences. However, as droughts become longer and more spatially extended under climate change, in the long run, they will likely lead to ecosystem degradation and the disappearance of crucial ecosystem services (Crausbay et al., 2017).
Although often associated with abundant surface water bodies, Berlin/Brandenburg is characterized by a tight water budget, with low annual precipitation relative to its temperate humid climate and high atmospheric demand through evapotranspiration, especially in the spring and summer months (Köstner at el., 2007; Germer et al., 2011; Kahlenborn et al., 2021). This makes this inherently water-limited region, which is heavily reliant on both surface and groundwater systems, particularly vulnerable to droughts (Cullmann et al., 2022), presenting a compelling case for an empirical study. Brandenburg is one of the states with the strongest water deficit and highest drought risk in Germany (Schindler et al., 2007). The 2018 drought was the most severe on record since 1951 (Helmholtz Centre for Environmental Research, 2023), with over 90 % of the agricultural area being severely or highly affected (Ihinegbu and Ogunwumi, 2022). Droughts in the region have cascading effects, including water stress, declining groundwater tables, increased fire risk, and significant reductions in agricultural productivity (Reyer et al., 2012). For example, Bloch et al. (2015) reported a 20 % annual yield loss in legume-grass swards due to drought. However, despite these impacts, research on the hydrological and hydrogeological aspects of droughts and their combined effects on vegetation health in Brandenburg remains limited, highlighting the need for more interdisciplinary and region-specific studies (Germer et al., 2011).
Small catchments, such as the Tegeler Fliess in Brandenburg, are more vulnerable to climate change than larger river systems (Blöschl et al., 2007).
The Tegeler Fliess is a tributary of the river Havel located in the north of Berlin. This stream crosses a diverse landscape of different land uses consisting of various nature reserves, fen meadows, calcareous tufa terrain, agricultural land and peri-urban settlements (Berliner Senatsverwaltung für Stadtentwicklung, 2025). There are several surface and groundwater monitoring stations along the stream, so data availability is good. Yet, few studies have examined droughts in this particular region using this data. For instance, Pohle et al. (2025) analysed the drought years 2018–2023 in Berlin and found that meteorological drought propagated into soil moisture and hydrological drought. Smaller rivers, such as the Tegeler Fliess, dried up, while larger rivers reversed their flow direction. Kuhlemann et al. (2020, 2022) used stable isotopes to capture urban hydrological processes during 2018–2019 and 2018–2020 in Berlin. Their analysis revealed strong evaporative losses and altered interactions between groundwater and surface water. Although these studies provided insight into hydrological dynamics, the coupled response of surface water, groundwater and vegetation to drought events in the Tegeler Fliess remains poorly understood. This study aims to fill this gap by analysing short-term drought variability at three sites along the Tegeler Fliess – Schildow, Luebars and Tegel – over 13 hydrological years from November 2008 to April 2021.
Given its multifaceted nature, a universal drought definition does not exist; rather, it depends on the perspective and objective of a study (Van Loon, 2015). To capture this complexity, a range of indices has been developed for different components of the hydrological cycle (Heim, 2002; Smakhtin and Schipper, 2008; Yihdego et al., 2019).
Meteorological drought is commonly assessed using indices such as the Standardized Precipitation Index (SPI) and the Standardized Precipitation-Evapotranspiration Index (SPEI). The SPI, introduced by McKee et al. (1993), is valued for its simplicity and effectiveness. It only requires precipitation data and is widely used to detect meteorological droughts across various timescales. However, its main limitation is that it does not take the effects of temperature or evapotranspiration into account, which have become increasingly important factors in the context of climate change. In contrast, the SPEI developed by Vicente-Serrano et al. (2010) incorporates both precipitation and potential evapotranspiration, offering a more comprehensive assessment of drought severity. The added complexity and data requirements of the SPEI, however, can restrict its application in regions where such data are scarce. SPI and SPEI are both recommended by the World Meteorological Organization for drought assessment (Svoboda and Fuchs, 2016). Studies show that although SPEI is more accurate due to its consideration of temperature, SPI and SPEI often provide comparable results (Pei et al., 2020; Ojha et al., 2021; Abu Arra and Şişman, 2024).
Hydrological drought indices include the Streamflow Drought Index (SDI) and the Standardized River Stage Index (SRSI). The SDI, as described by Nalbantis and Tsakiris (2009), monitors droughts characterised by reduced cumulative streamflow volumes over predefined time intervals. Though its effectiveness depends on the availability of reliable discharge data, which may not be available in certain catchments. When discharge data is unavailable, the SRSI offers an alternative by utilizing level data as a proxy and thereby enabling drought monitoring in ungauged basins (Zhong et al., 2022). It is important to note that water level measurements can be influenced by local channel morphology and may not always accurately reflect actual flow conditions.
For groundwater droughts, which are slow to develop but often take the longest to recover from, the Groundwater Drought Index (GDI) is commonly used. This index standardizes groundwater level anomalies to assess hydro-geological droughts (Bloomfield and Marchant, 2013). While the GDI is valuable for quantifying groundwater drought, its application is often limited by the sparse availability of groundwater data.
Each of these indices provides a different perspective on drought, and their combined use enables a more holistic understanding of drought dynamics across meteorological, hydrological, and hydrogeological domains. In this study, we use a three-month accumulation period to evaluate drought conditions based on the available data, following the works of McKee et al. (1993) and Bloomfield and Marchant (2013). This approach lets us analyse short-term drought patterns, compare indices across sites, and examine how meteorological factors influence surface and groundwater systems. We then combine these drought indices with long-term trend analysis and Granger Causality tests (Granger, 1969) to identify how droughts propagate and impact vegetation health (Zolghadr-Asli et al., 2021; Li et al., 2024; Xiao et al., 2025).
The objectives are twofold: to identify specific drought events and examine their propagation at individual stations as well as between stations, and to assess the impact of these droughts on vegetation health using the Normalized Difference Vegetation Index (NDVI) as an indicator of vegetation stress. By conducting a long-term trend analysis, we aim to better understand drought-vegetation dynamics over the study period. This study addresses the following research questions:
-
How do meteorological, hydrological, and hydrogeological droughts interact in the Tegeler Fliess catchment?
-
What long-term drought trends can be observed, and how do they impact vegetation stress?
-
Can time-lagged relationships between drought indices and vegetation health be identified?
By addressing these questions, this study contributes to a deeper understanding of drought dynamics and their implications for water resource management and ecosystem resilience along the Tegeler Fliess. The findings of this study are transferable to other peri-urban regions with similar environmental conditions, which may have poorer data availability.
The Tegeler Fliess is an approximately 30 km long stream that crosses the northern border between Berlin and Brandenburg. It is the tributary of the Havel River, and part of the Elbe River system. Its catchment area spans about 126 km2. The valley was formed after the last glacial maximum as a post-glacial meltwater channel. The main aquifer consists of fine sand beneath boulder clay, and the area is highly dependent on both surface and groundwater systems (Baugenossenschaft Freie Scholle zu Berlin eG, 2024; Berliner Senatsverwaltung für Stadtentwicklung, 2025). Most of the area lies within the Barnim Nature Park and touches the Westbarnim Landscape Conservation Area (LSG) in Brandenburg and the Tegeler Fliess LSG in Berlin, as well as the Tegeler Fliess Calcareous Tufa Nature Conservation Area (NSG) and the Tegeler Fliess Fens Nature Conservation Area (NSG). The river valley is registered as a Natura 2000-site in both federal states (NABU Berlin, 2024).
We selected three monitoring sites – Schildow, Luebars and Tegel – along the Tegeler Fliess because of long-term data availability and their representation of key ecological and land-use zones along the stream, as shown in Figs. 1 and 2. Furthermore, the groundwater profiles of the three sites reveal a diverse geological landscape.
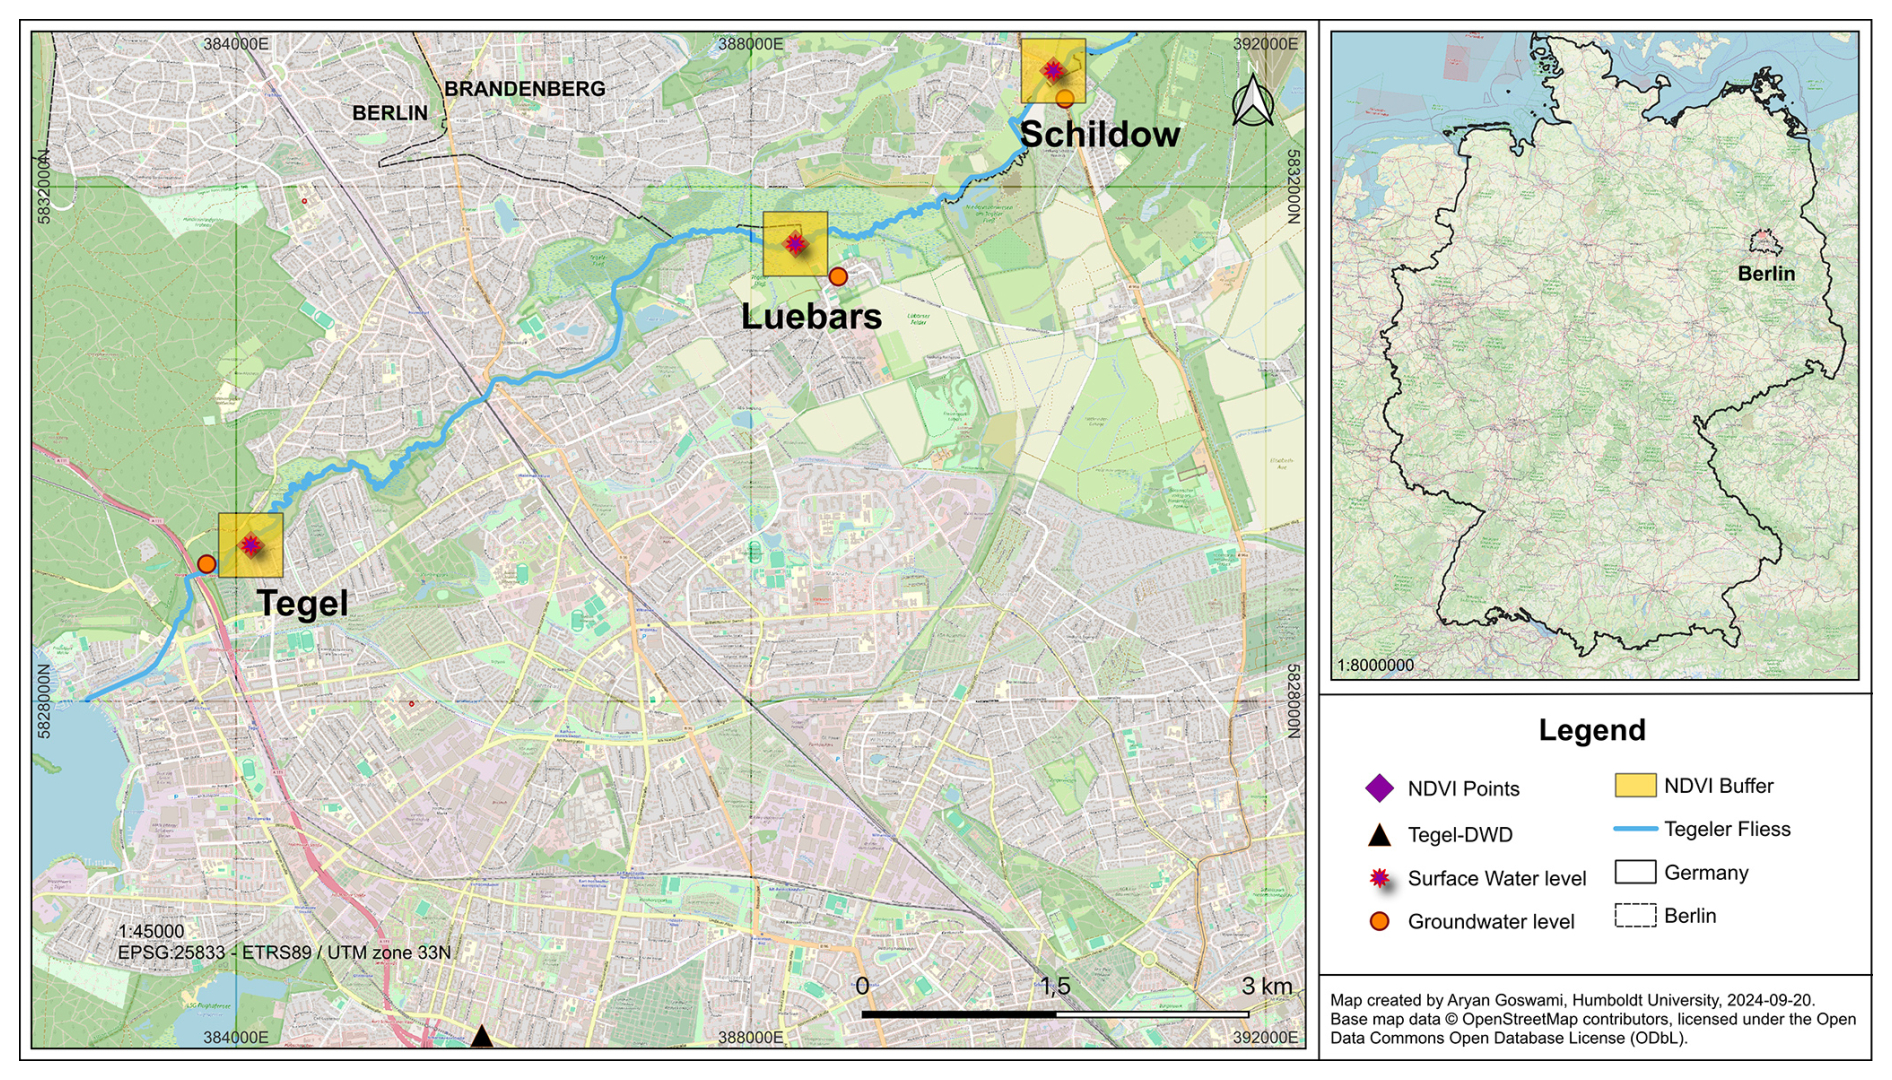
Figure 1Map of study area displaying the three sites – Schildow, Luebars, and Tegel – and locations of the monitoring stations for surface water and groundwater levels, as well as the NDVI buffer areas along the Tegeler Fliess (OpenStreetMap). The precipitation measurement station, Tegel-DWD, is located south of Tegel.
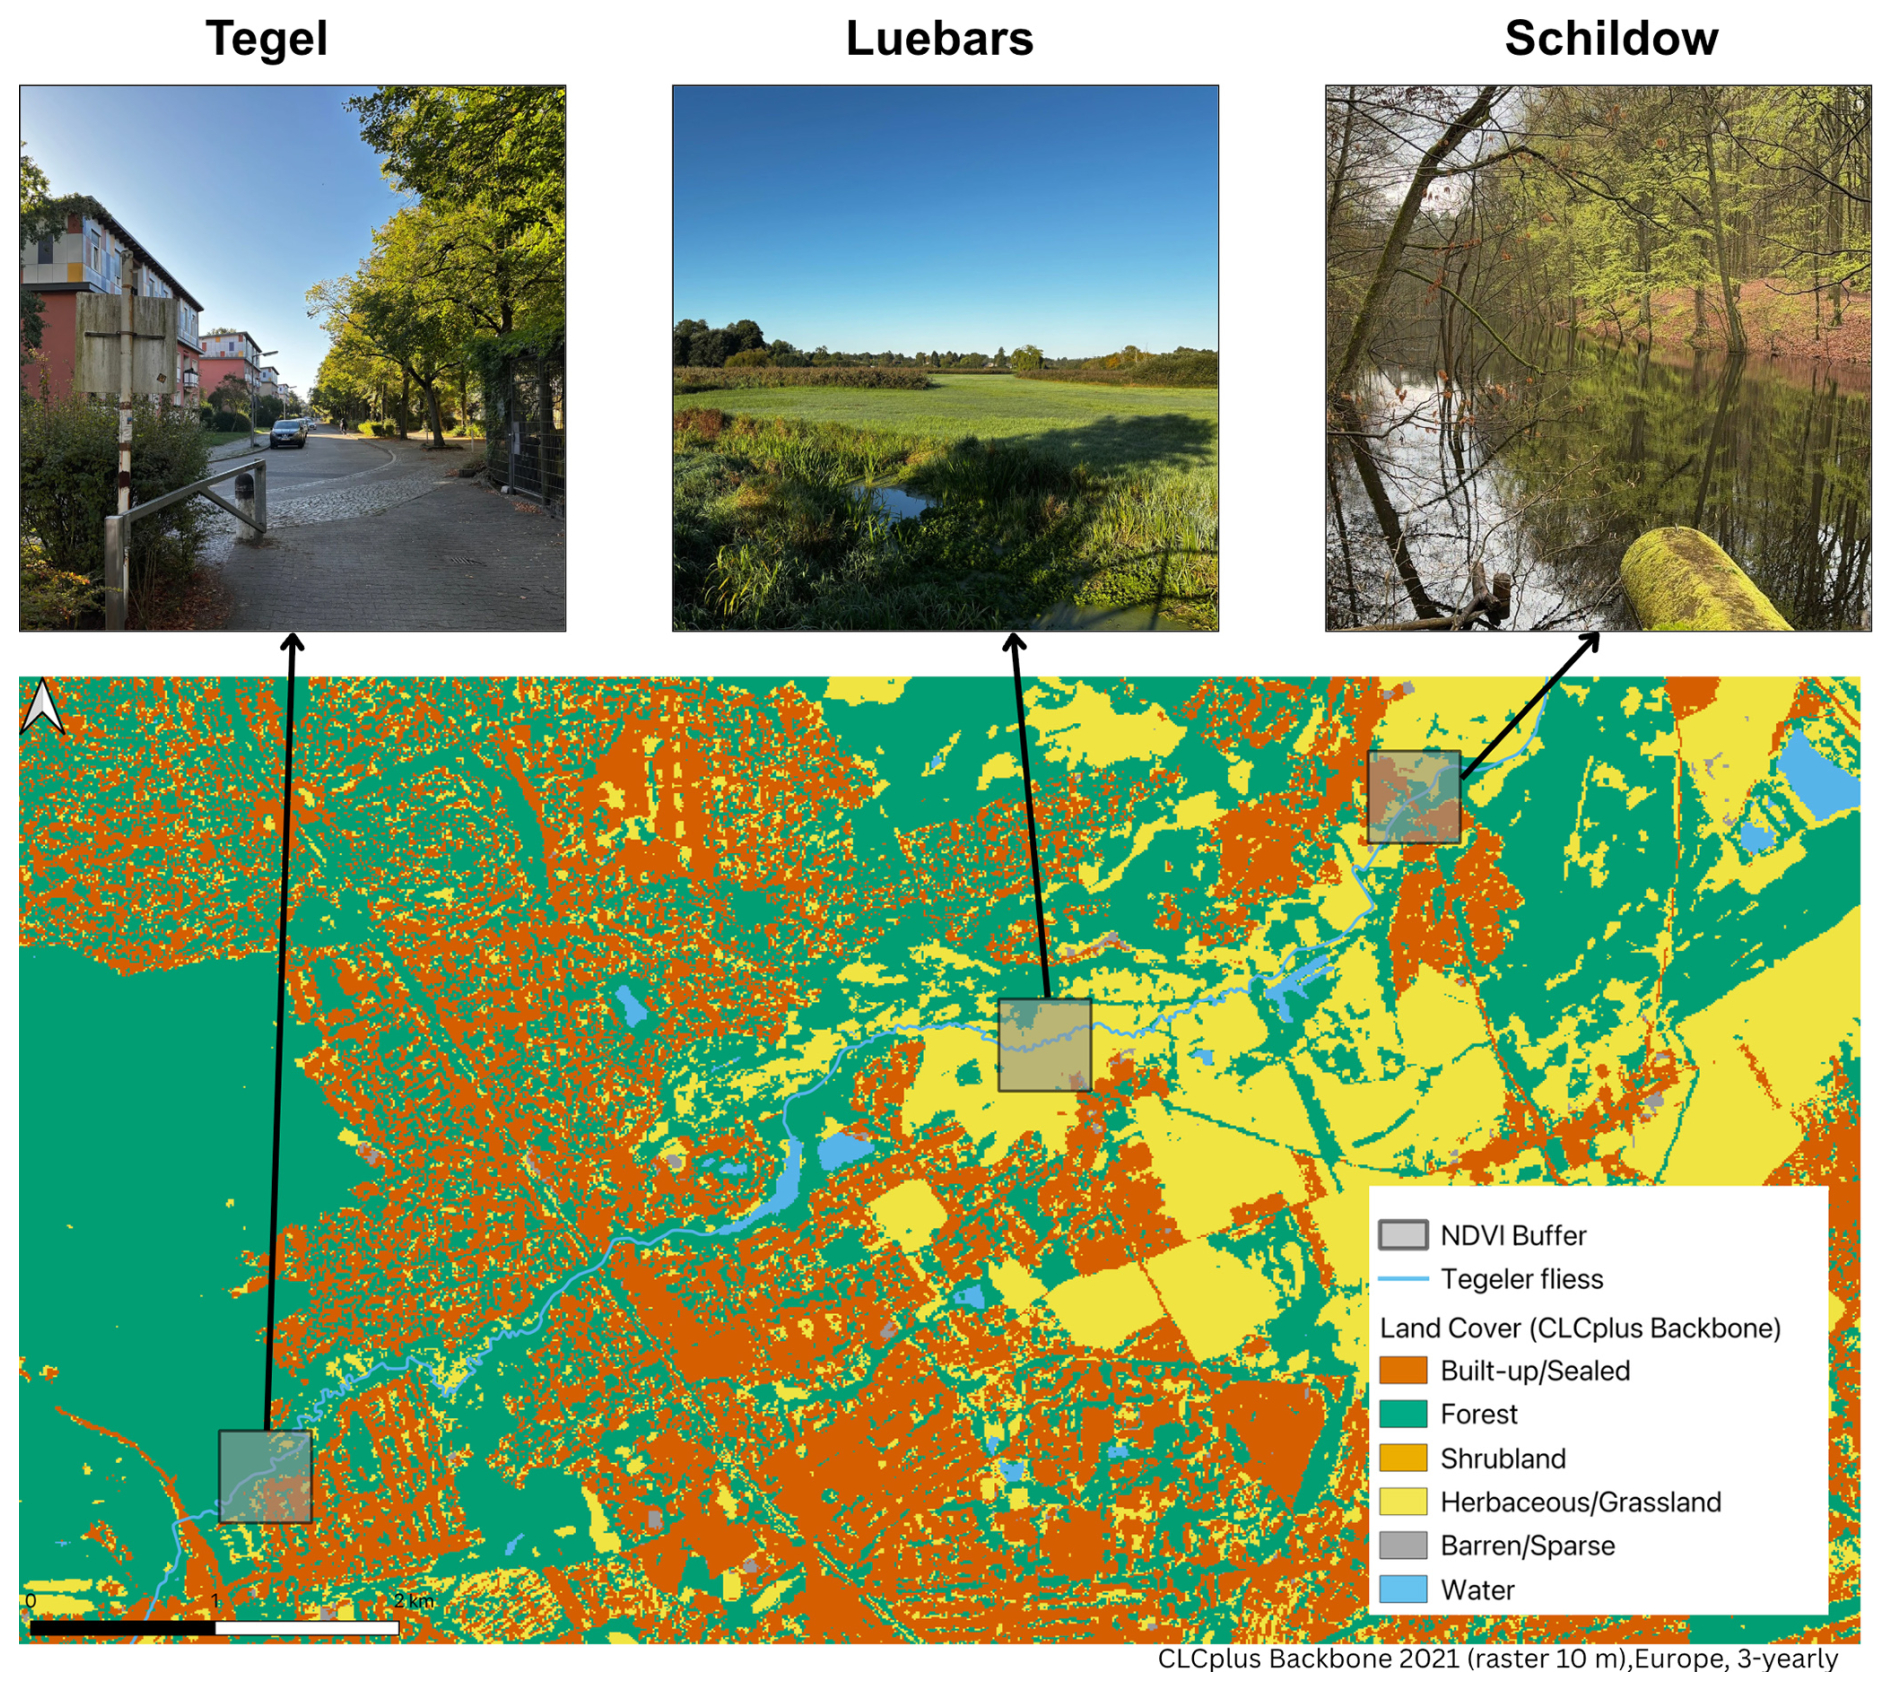
Figure 2Overview of the study area. The photos above show the typical landscapes near the study sites, the map below shows the land cover distribution along the Tegeler Fliess.
Schildow (surface elevation: 40.5 m a.s.l.) is characterized by a very heterogeneous landscape made up of small-scale agriculture, high tree cover, and remnants of fen meadow vegetation. The groundwater filter at Schildow is located at 9 m depth below surface (31.7 m a.s.l.) within a thick sand layer with some silt and low retention capacity.
At Luebars (surface elevation: 42.1 m a.s.l.), the surrounding land use is dominated by open agricultural fields and shrubland with only sparse tree cover. Detailed crop-type metadata for the study area and period were not available from our data sources, but the landscape suggests seasonal crops, which are common in Brandenburg, likely cereals and fodder grasses. The subsurface profile consists of a sand layer partially compacted with construction debris, followed by sandy glacial till up to approximately 16 m deep. This is underlain by fine, medium, and coarse sand, as well as gravel and coal-bearing material. The groundwater well filter is located at 18.2 m below surface (24 m a.s.l.) within a locally confined aquifer formed by regional geological processes (Tsypin et al., 2024; Pohle et al., 2025), which limits its recharge connectivity and distinguishes Luebars hydrologically from the other two sites.
Tegel (surface elevation: 37.3 m a.s.l.) represents the peri-urban end of the gradient, with managed green spaces and tree-lined infrastructure adjacent to build-up areas. The environment is likely influenced by municipal upkeep and irrigation. The groundwater well filter lies at 16.5 m below surface (21 m a.s.l.) and consists of layered sand deposits without an overlying confining unit. This indicates an unconfined aquifer with a relatively direct connection to atmospheric processes and a strong hydraulic connection to the stream.
Porosity logs were unavailable for all three sites, making it difficult to definitively assess their impact on drought index calculations. However, all three aquifers are primarily composed of similar medium-sized sand, suggesting comparable porosity.
2.1 Conceptual Model of Drought Propagation
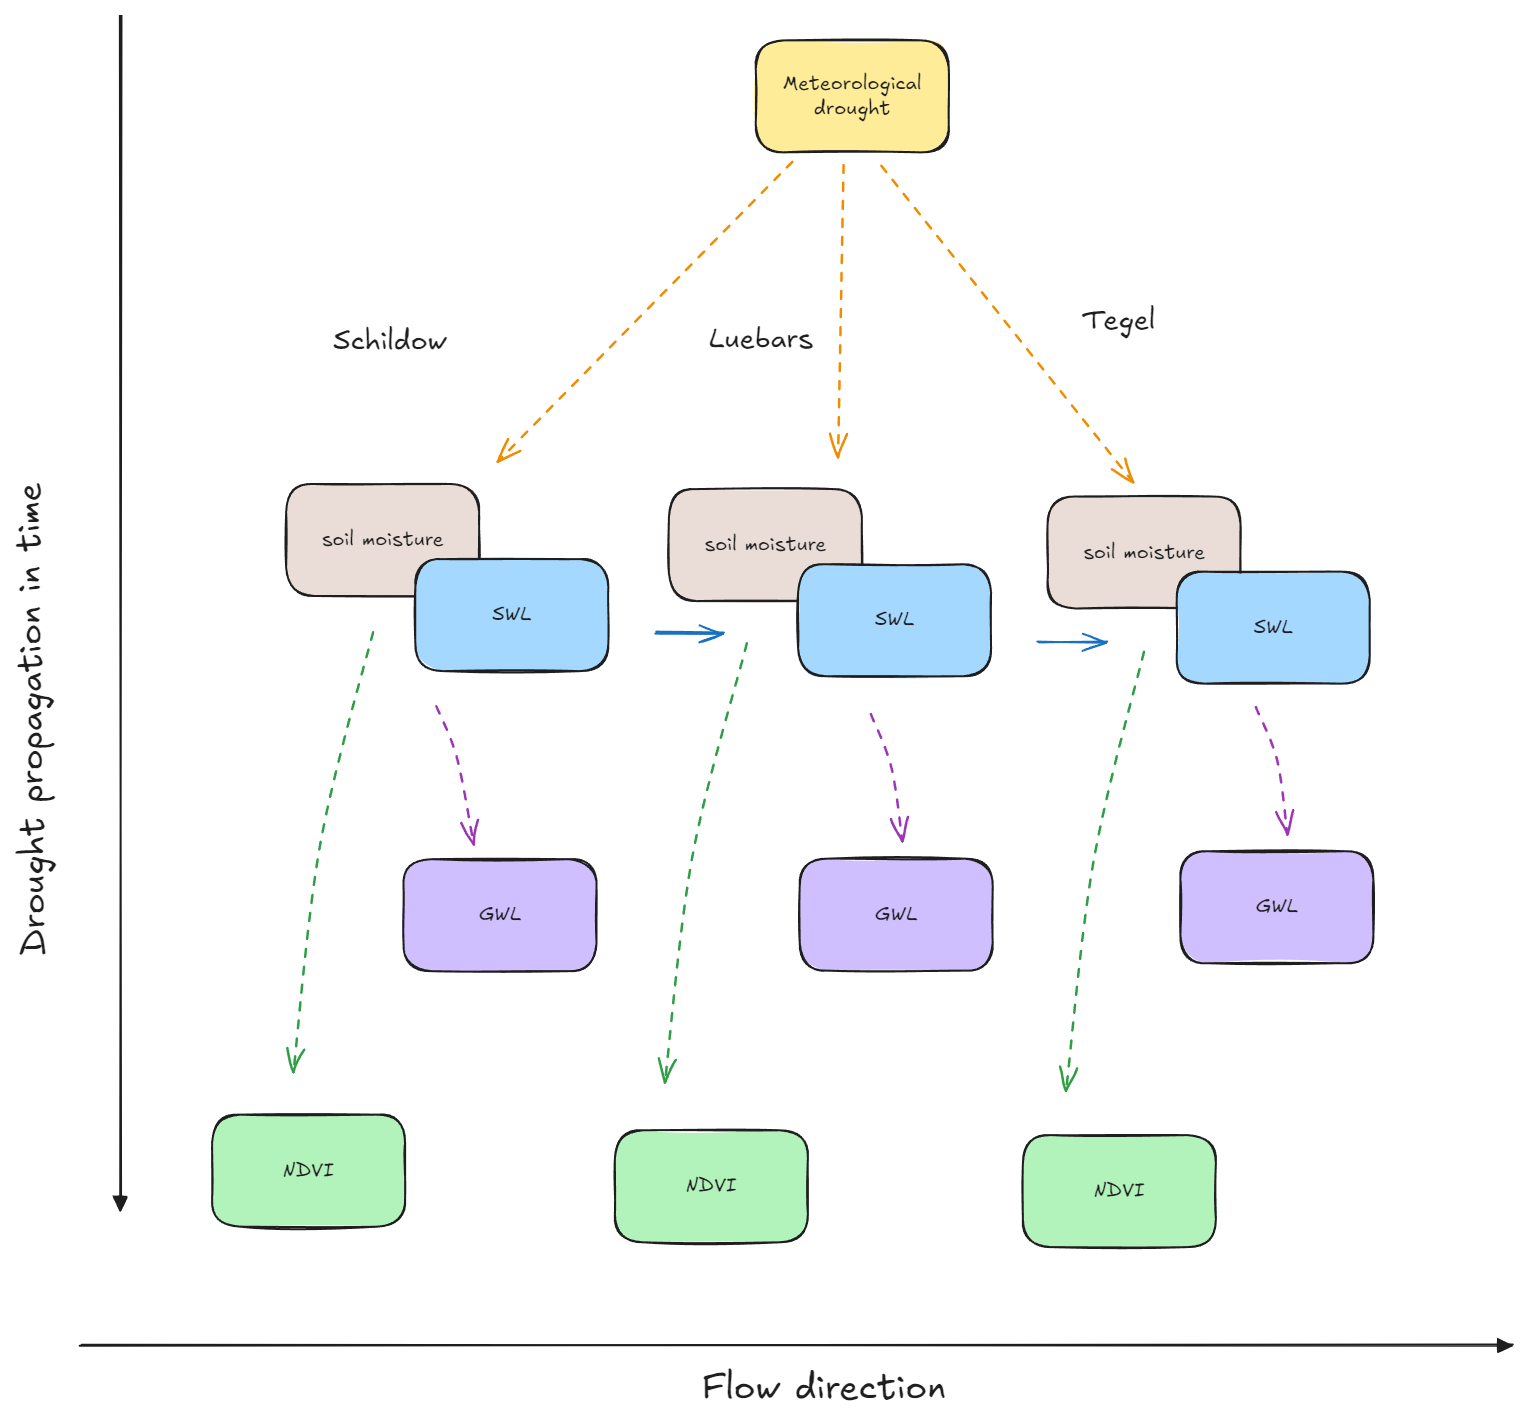
Figure 3 presents the conceptual model of drought propagation within the catchment: across different domains and along the stream. A meteorological drought could trigger droughts at the surface level, via the reduction of soil moisture content and streamflow (hydrological drought). Hydrological drought also propagates downstream along the river. Later in time, a reduction in recharge can lead to drought in the groundwater. This is a slow process, as the average response times of the groundwater table in the region are around 1 month (see Somogyvári et al., 2024, 2025). The reduced available soil moisture (and in the case of deep-rooted plants reduced groundwater table) can also lead to a drought in vegetation.
In the following, we will present how we analyzed the drought propagation over the different domains based on the available datasets. We used the conceptual model as a roadmap to try to infer the relations of the different drought types at the different sites.
2.2 Data Collection and Processing Tools
Data pre-processing and all analysis steps were performed using R statistical software (version 4.4.1) (R Core Team, 2024) (see Sect. 2.4). The study period covers 13 hydrological years from November 2008 to April 2021, chosen after data availability. An overview of the data used, the data sources and the official names of the measurement sites as called by the data provider – or in the case of the NDVI data, the coordinates used to extract mean NDVI values – are summarized in Table 1.
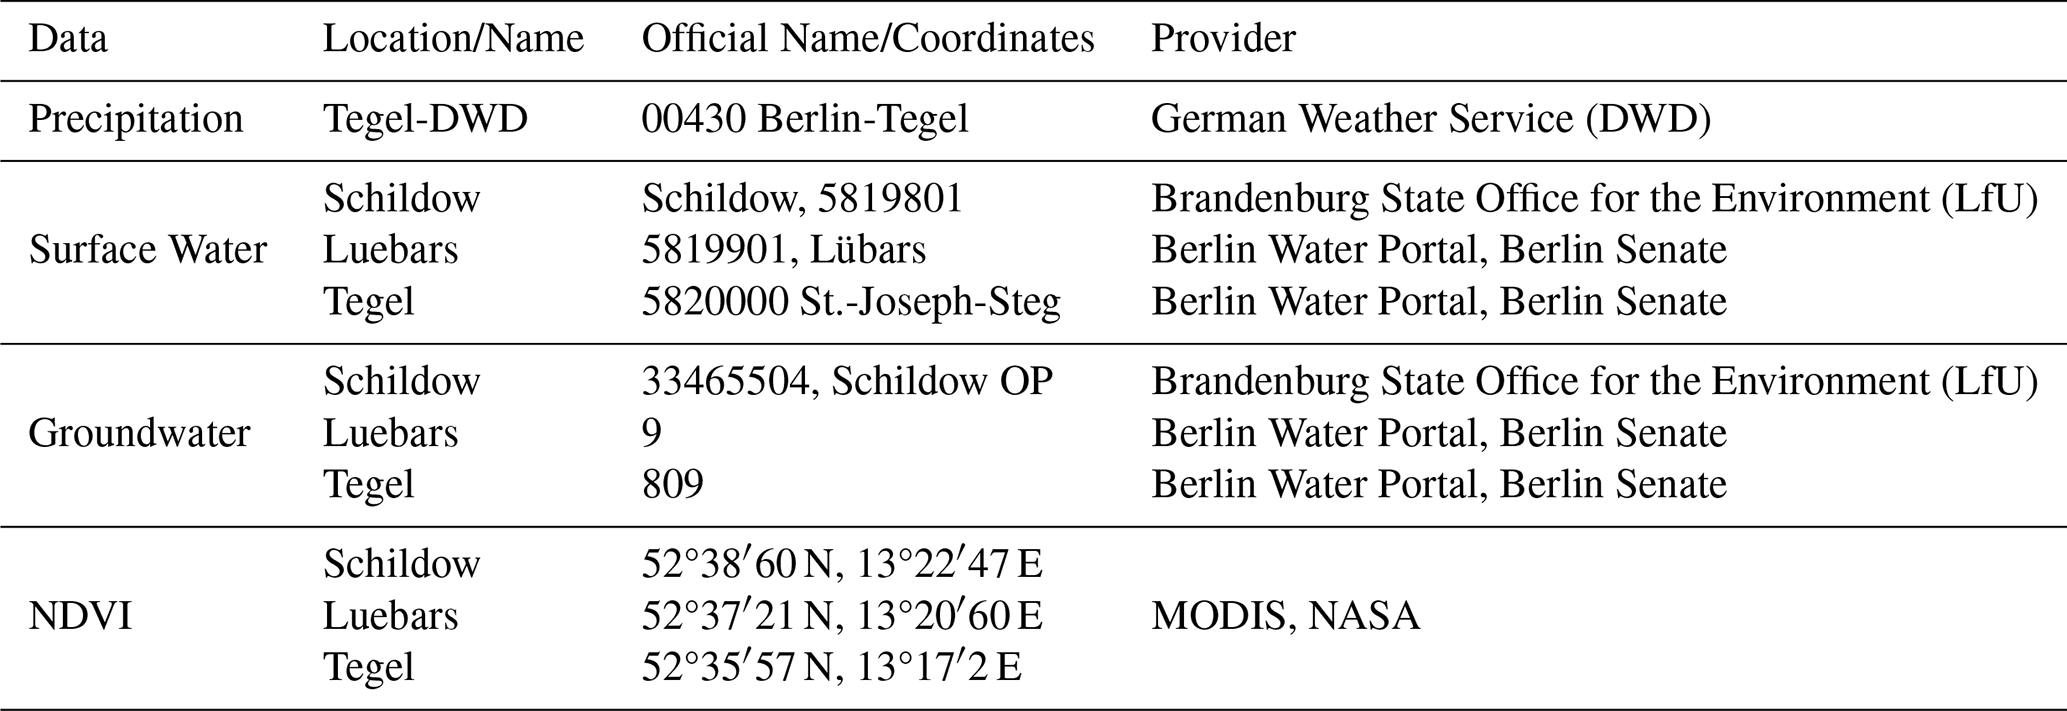
Daily precipitation measurements were obtained from the Berlin-Tegel station via the German Weather Service (Deutscher Wetterdienst, DWD) using the R package “rdwd” (Boessenkool, 2023). The dataset is assigned DWD’s quality measure QN9, indicating that while it is complete, some parameters may still require correction. Given the short distances between stations within the Tegeler Fliess catchment area, Berlin-Tegel was used to represent precipitation across the entire study area. This approach was taken for the sake of simplicity, but also due to the lack of nearby measurement sites in close proximity to data records over the study period. Spatial distribution in precipitation across the study sites was assessed using the gridded CER v2 dataset (Bart et al., 2024), confirming low spatial variability and suggesting negligible heterogeneity in this lowland setting (see Fig. S7 in the Supplement).
Daily surface water and groundwater level measurements were obtained from two regional water management authorities (see Table 1) depending on the station’s location. Groundwater level data for Luebars and Tegel are available at daily resolution and contain only minor gaps, whereas groundwater level measurements at Schildow are provided at weekly resolution. At Schildow, groundwater levels were typically recorded four to five times per month (115 out of 150 months), with three measurements available in 31 months, most likely due to temporary technical issues. The only larger gap of missing records occurs between November 2008 and February 2009 at the beginning of the study period. To harmonize all groundwater level time series to the same daily temporal resolution, the datasets with missing values were linearly interpolated (see Fig. S1).
To evaluate the potential impact of localized anthropogenic factors – specifically construction and land use change – on surface and groundwater dynamics, high-resolution historical satellite imagery from Google Earth was visually inspected for the study period. Despite the sites being located near urban/peri-urban settings, no significant construction activity, large-scale urban expansion, or extensive surface sealing was observed in the immediate vicinity of the groundwater wells at Schildow, Luebars, or Tegel.
Vegetation health was assessed using MODIS NDVI (product MOD13Q1, L3 validation stage) at a spatial resolution of 250 m and a temporal resolution of 16 d, accessed using the R package “MODIS Tools” (Hufkens, 2023). The 250 m resolution represents a compromise at the sub-catchment level. A key challenge is the mixed-pixel problem in peri-urban zones, where one cell may merge signals from infrastructure, vegetation, and agricultural land. Chen et al. (2018) and Jimenez et al. (2022) showed this can weaken the NDVI response in such areas. To represent vegetation health at each site, a point was selected near each station (coordinates given in Table 1) and the mean NDVI was calculated within a 500 m buffer (see Fig. 1). Sampling points were placed in locations dominated by vegetation to minimize the influence of mixed pixels. Land cover within a 500 m buffer around each station was assessed to account for the influence of local vegetation and surface characteristics on the NDVI signal. The primary classification relied on the European Environment Agency’s CLCplus Backbone 2021 dataset, a 10 m resolution raster (European Environment Agency, 2021) supplemented by visual assessment using the HCMGIS plugin in QGIS, since automated classifiers can miss small-scale features. High-resolution Google Satellite imagery was used to verify field structures, vegetation patterns, and built-up areas at each site, ensuring a more accurate representation of factors influencing the NDVI signal.
2.3 Drought and Vegetation Indices Calculation
As outlined in the introduction, various indices exist for assessing different drought types. In this study, drought is defined as a period of at least one month during which water availability is significantly below average, resulting in a deficit in its respective domain: precipitation deficit (meteorological drought), reduced surface water levels (hydrological drought), or reduced groundwater levels (hydrogeological drought). To capture these aspects, we applied the SPI for meteorological drought, the Standardized Surface Water Level Index (SSWLI) as a proxy for hydrological drought, and the Standardized Groundwater Level Index (SGLI) for groundwater drought. Each of these indices was selected to provide a consistent, standardized assessment of drought conditions, facilitating direct comparison and enabling a comprehensive analysis of drought propagation. The following subsections describe the calculation procedure and application of each index.
2.3.1 Standardized Precipitation Index (SPI)
The SPI standardises precipitation anomalies by fitting a gamma distribution to the precipitation data and then transforming it to a normal distribution. The gamma distribution is chosen for its ability to model the typically skewed nature of precipitation data, especially in semi-arid regions (McKee et al., 1993). We aggregated daily precipitation data into monthly totals to calculate SPI over a three-month period (SPI3). The three-month timescale is particularly relevant for short-term droughts that affect water supplies, ecosystems, and agriculture (Stagge et al., 2015). The “SPEI” R package (Beguería and Vicente-Serrano, 2023) was used to calculate SPI3. In the “SPEI” R package, the gamma distribution fitting and transformation process is automated, ensuring consistent calculation across datasets and allowing SPI values to be easily compared between different time periods and regions.
2.3.2 Standardized Surface Water Level Index (SSWLI)
The SSWLI is calculated by standardizing deviations of observed surface water levels from their long-term mean, following the same statistical approach as the SPI using the SPEI R package, replacing the input with river levels. A three-month accumulation period (SSWLI3) was used to capture short-term hydrological droughts relevant for water resource management and ecosystem response.
Due to the unavailability of discharge data at two of the three monitoring stations along the Tegeler Fliess, we employed the SSWLI as a proxy for hydrological drought. A similar approach has been used by Zhong et al. (2022) for ungauged rivers with satellite data, that was able to monitor drought propagation in river systems. By standardizing surface water levels, the resulting index allowed us to assess the intensity of hydrological drought in a way that is directly comparable to meteorological drought (Vicente-Serrano et al., 2012; Bloomfield and Marchant, 2013). Note however, that this approach can affect the accuracy of hydrological drought characterization, as river levels (especially in smaller streams) are more susceptible to nonlinear behavior.
2.3.3 Standardized Groundwater Level Index (SGLI)
The Standardized Groundwater Level Index (SGLI) extends the SPI methodology to groundwater level data, allowing for the assessment of hydrogeological drought. The SGLI, as applied in this study, is based on the index introduced by Bloomfield and Marchant (2013), which standardizes groundwater level time series to characterize groundwater droughts. This approach aligns with SPI and SSWLI. Standardizing deviations from the historical mean allows the SGLI to provide a consistent metric for assessing periods of groundwater scarcity. Similarly to SPI3 and SSWLI3, SGLI was also calculated over a three-month period (SGLI3).
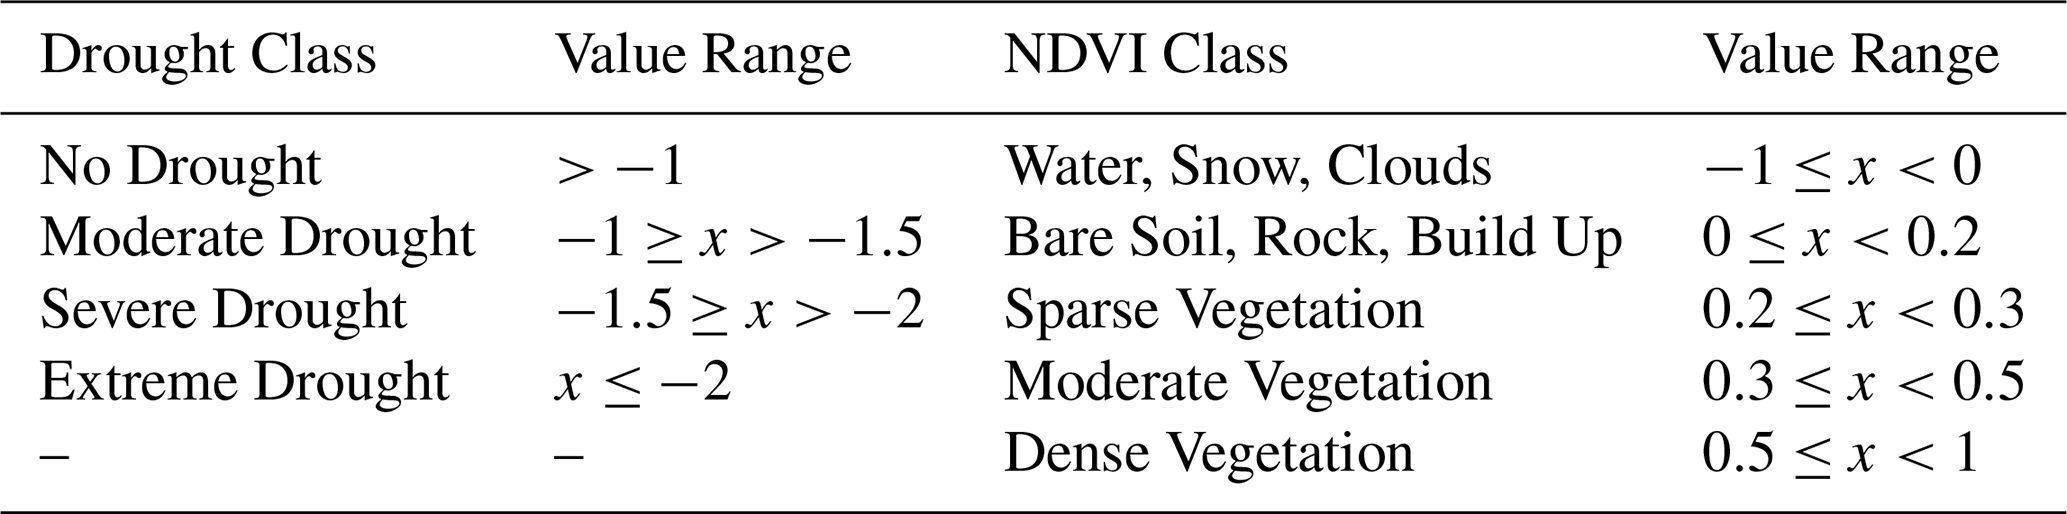
Drought classes were used to categorize the severity of drought conditions based on standard thresholds of different drought indices (see Table 2). For this study, we classified drought events according to the standardized values of SPI3, SSWLI3 and SGLI3, following common classification systems in the drought literature (McKee et al., 1993; Nalbantis and Tsakiris, 2009). A drought index value of ≤−1 indicates at least moderate drought. This is when conditions are at least one standard deviation below the historical mean and significantly drier than usual. Values between −1.5 and −2 classified as severe, while values below −2 as an extreme drought.
2.3.4 Normalized Difference Vegetation Index (NDVI)
The Normalized Difference Vegetation Index (NDVI) is a remotely sensed proxy for plant productivity (Nemani et al., 2003) and is thus a widely used metric for assessing vegetation health and its response to drought (Bachmair et al., 2018; Kloos et al., 2021). It is a standardized value based on the inverse relationship of red and near-infrared reflectance and thus provides continuous monitoring of the “greenness” of the photosynthetically active biomass of the plant canopy cover (Tucker, 1979; Jensen, 2013, p. 384). We also classified NDVI values into different classes based on the range of the index to assess vegetation health and its response to drought. NDVI values range from −1 to +1, with higher values indicating denser and healthier vegetation and lower values indicating non-vegetated surfaces. The NDVI classification lacks a universally accepted standard, so the vegetation classes were adapted based on De La Iglesia Martinez and Labib (2023). This approach stems from the observation that the relationship between NDVI and vegetation density is non-linear, with changes in the lower NDVI range (e.g. 0.2 to 0.3) reflecting more significant increases in green cover and vegetation types than equivalent changes in the higher NDVI range (e.g. 0.6 to 0.7) (ibid.). This finding justifies the uneven distribution of our vegetation classes, as the sensitivity of NDVI varies across its range. The thresholds capture meaningful vegetation transitions while reflecting how changes in NDVI affect green cover. This uneven distribution is further supported by the NDVI distribution per station, as shown in Fig. S3.
2.4 Statistical Tests and Measures
After calculating the different drought indices, different statistical tests were applied to compare them with each other. A Spearman correlation test was performed to assess potential relationships between drought indices (SPI3, SSWLI3, SGLI3) and NDVI across all stations. Spearman's rank correlation is a non-parametric measure used to determine the strength and direction of association between two variables. It is particularly useful in this context as it does not assume a normal distribution and can detect monotonic relationships. This test was chosen to investigate whether lower Drought Index values correspond to lower NDVI values and vice versa.
For trend analysis, the Mann-Kendall test was applied to each time series to identify statistically significant trends in SPI3, SSWLI3 and SGLI3 over the 13-year study period. This non-parametric test was chosen due to its robustness in detecting monotonic trends (either increasing or decreasing) in time series data that are not normally distributed. The test was performed using the “Kendall” R package (McLeod, 2022).
Additionally, drought occurrences were counted for each index and station. To assess how drought conditions propagate between compartments, propagation rates and conditional probabilities were calculated between meteorological (SPI3), hydrological (SSWLI3), and hydrogeological (SGLI3) droughts. Here, “upstream” and “downstream” refer to the sequence of compartments (compare Fig. 3) and not the geographic location.
The Granger causality test was used to assess the time-lagged relationships between drought indices and vegetation stress. Granger (1969) introduced the Granger causality test originally within the field of economics as a statistical method for determining whether one time series can predict another. Since then, the test has gained widespread application across various disciplines, including ecosystem science and hydrology, due to its computational simplicity (Papagiannopoulou et al., 2017; Kong et al., 2018; Singh and Borrok, 2019; Li et al., 2024). The test checks whether information from one time series (e.g. SPI) improves the prediction of another time series (e.g. NDVI) beyond what could be predicted from past values of the latter alone (Shojaie and Fox, 2022). The “lmtest” package (Zeileis and Hothorn, 2002) and the “vars” package (Pfaff, 2008) were used, with lag periods ranging from 1 to 6 months to allow for delayed vegetation responses to drought conditions. Granger causality was used to determine whether different drought indices predict each other or influence future NDVI values, providing insight into the interaction between drought propagation and ecosystem response.
3.1 Precipitation and Water Level Dynamics
In Fig. 4 the general statistics of the input data: precipitation, surface water and groundwater levels are shown. The precipitation patterns at the Tegel-DWD station averaged 45 mm month−1, with occasional heavy rainfall events exceeding 100 mm. These heavy rainfall events are likely to contribute to localized water level surges as can be seen in Fig. 3. However, both the linear and non-parametric trend analyses indicate no significant long-term change in precipitation (R2=0.001, p=0.67, MK p=0.51), confirming overall stable rainfall conditions over the study period.
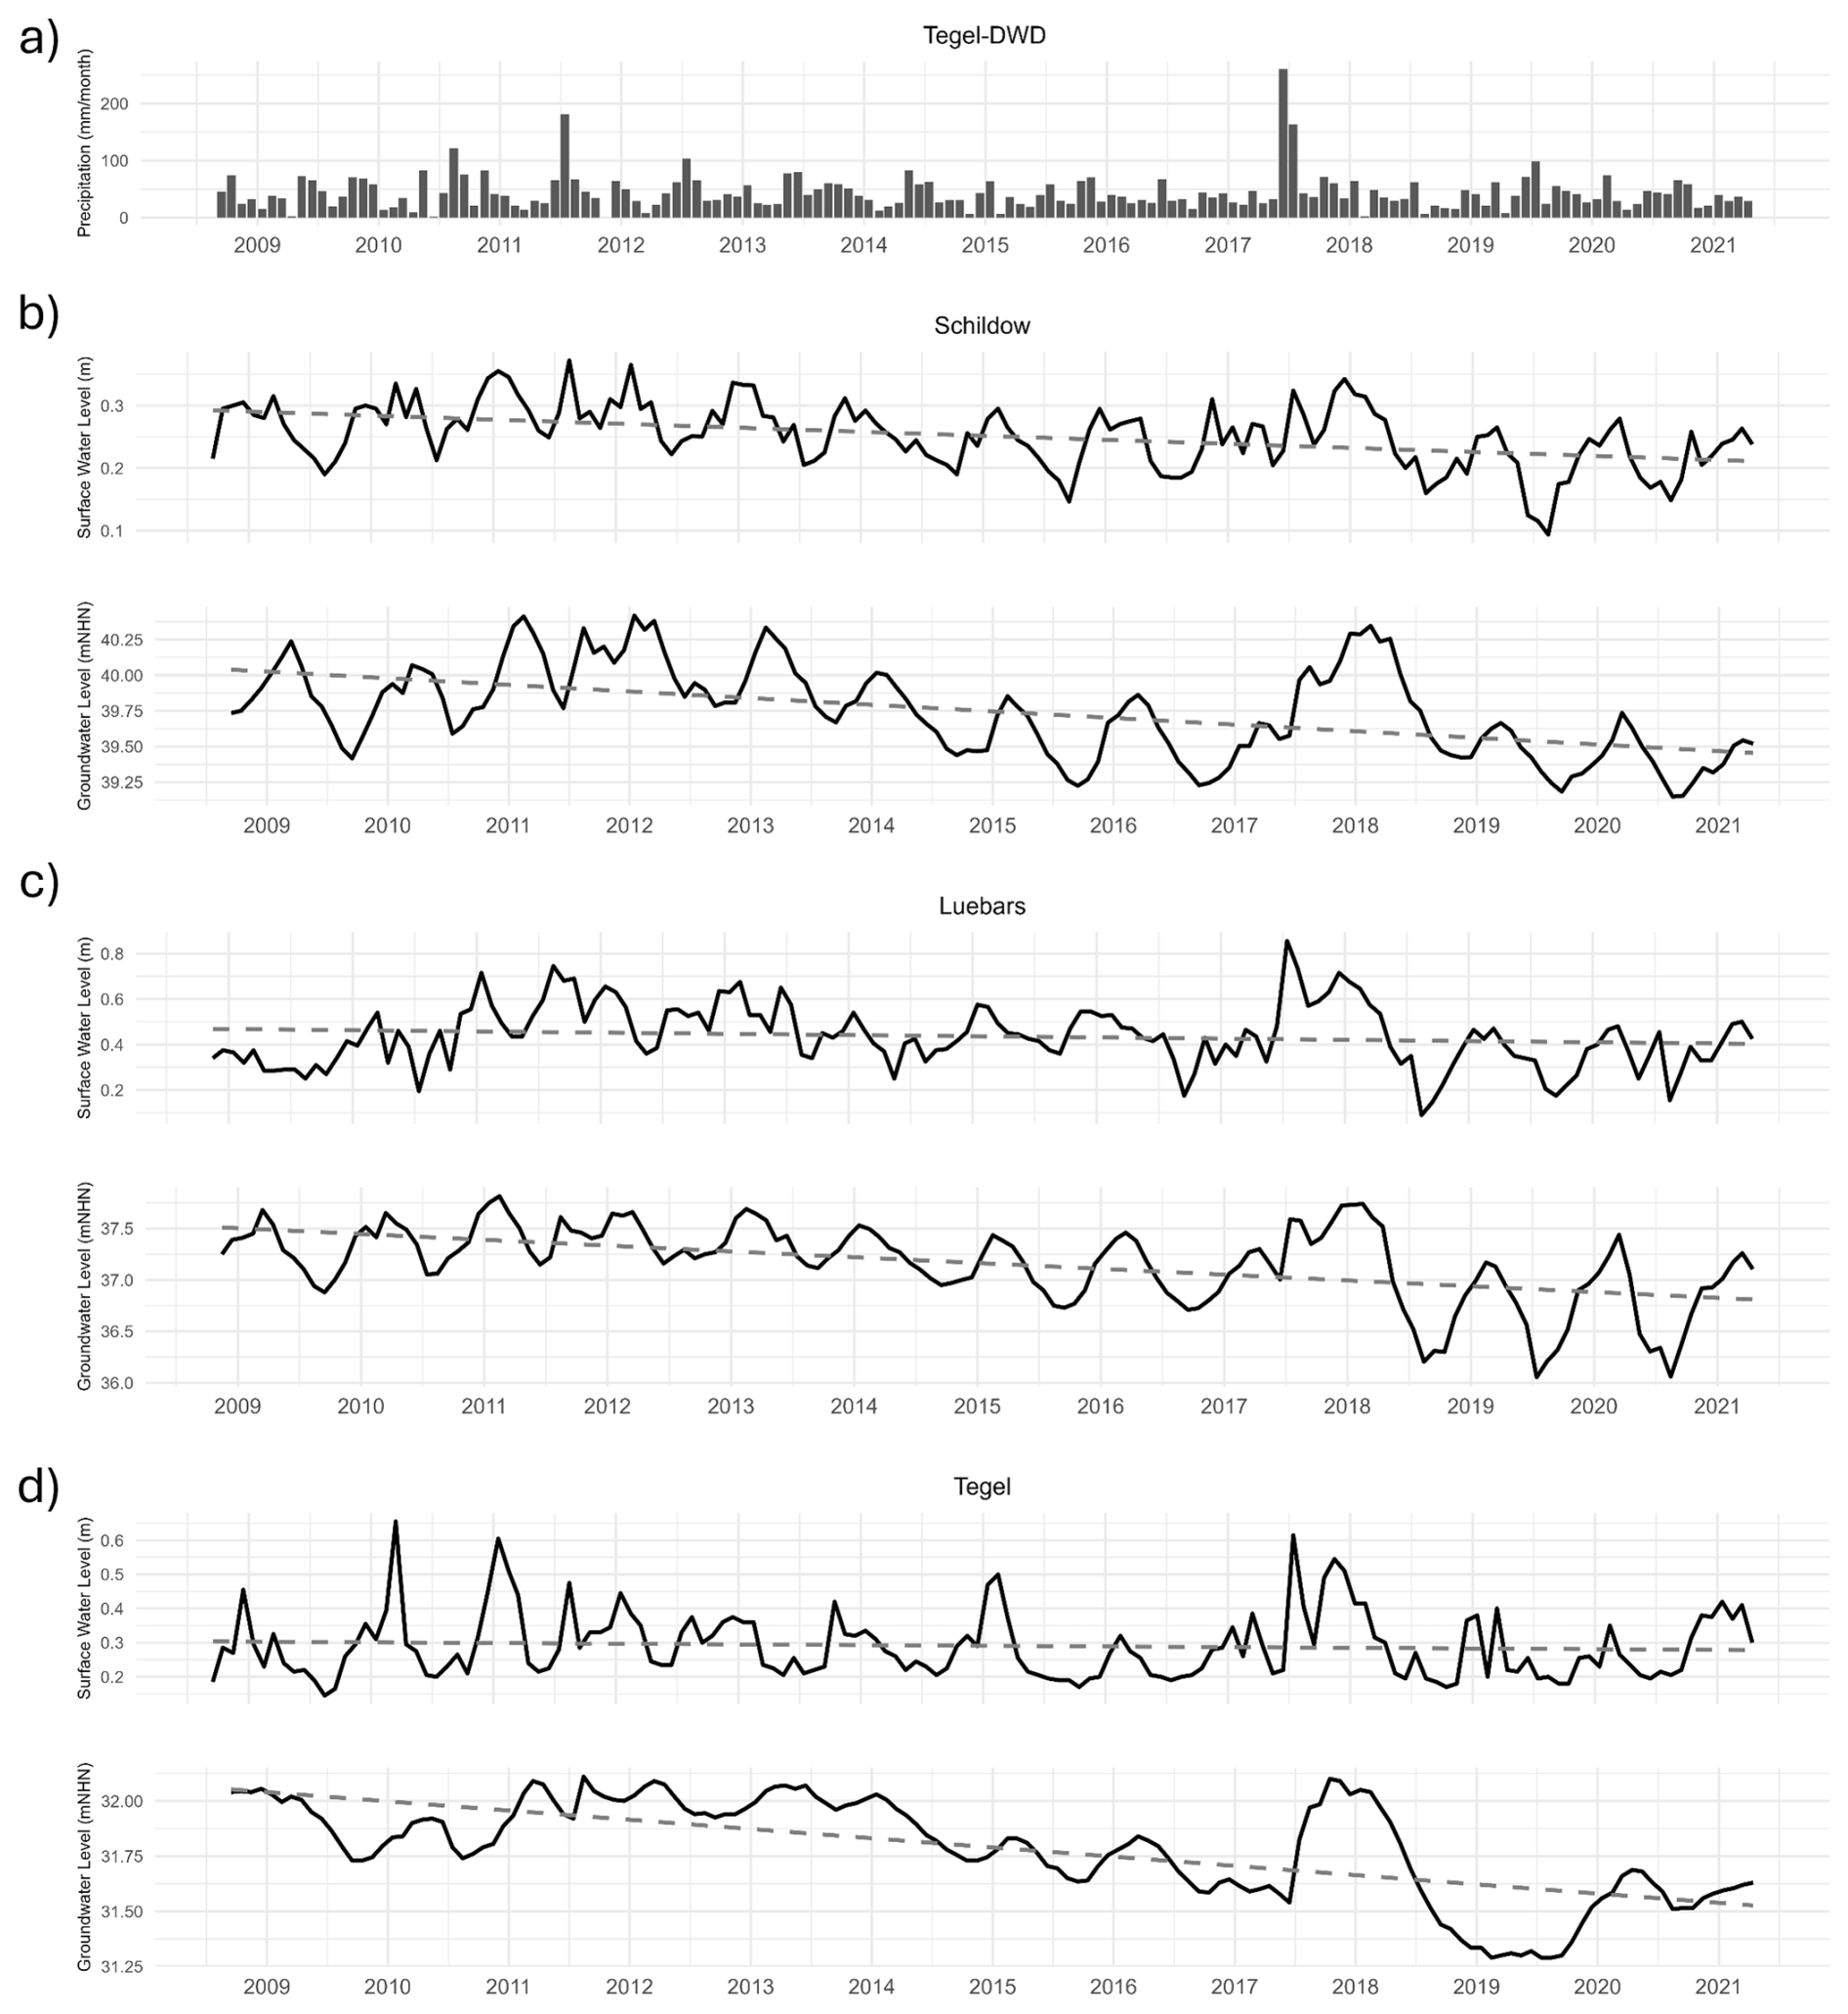
Figure 4Observation time series used in the analysis: (a) monthly precipitation sums at Tegel-DWD (black bars), and monthly mean surface water and groundwater levels (solid black lines) at Schildow (b), Luebars (c) and Tegel (d). Dashed gray lines indicate long-term linear trends.
Comparing surface and groundwater levels, however, reveals the variation across sites. Surface water levels at Luebars fluctuated between 0.35 and 0.55 m, visually showing the greatest variability between stations. Despite these fluctuations, Luebars exhibits only a weak and statistically not significant decline in surface water levels (R2=0.02, p=0.08). In contrast, Schildow displays more stable surface water levels, averaging around 0.23 m, but shows a significant decreasing trend (R2=0.21, p<0.001, MK) throughout the study period. The Tegel station had a similar mean surface water level, but greater variability, indicating possible site-specific differences in hydrological behavior. At Tegel, no consistent trend was detected (R2=0.006, p=0.36). Tegel and Luebars displayed the highest surface water level variability with Coefficient of Variation (CV) of 30.9 % and 33.9 % respectively, with Schildow being the lowest at 20.4 %. Higher CV values may indicate less stability in water-level conditions, potentially due to factors like localized hydro-climatic influences, different water management practices, etc.
Groundwater levels showed further variability between stations. Schildow recorded the highest median groundwater level at about 40 m a.s.l., while Tegel recorded the lowest, with a difference of 8 m along the river. These observations underline the variability of water availability in the study region, which is likely to be influenced by local environmental conditions and hydrological patterns specific to each station. The trend analyses confirm a consistent and significant groundwater decline across all stations (Schildow: R2=0.28, MK; Luebars: R2=0.29, MK; Tegel: R2=0.47, MK; all p<0.05), indicating a depletion of subsurface storage which is not explained by precipitation trends. A full statistical summary is presented in Table S1 in the Supplement.
3.2 Drought Variability
3.2.1 Drought Propagation and Station-Specific Drought Responses
The stations show distinct trends in meteorological, surface water and groundwater drought indices, which translate to varying drought propagation patterns and highlight localized hydrological stress.
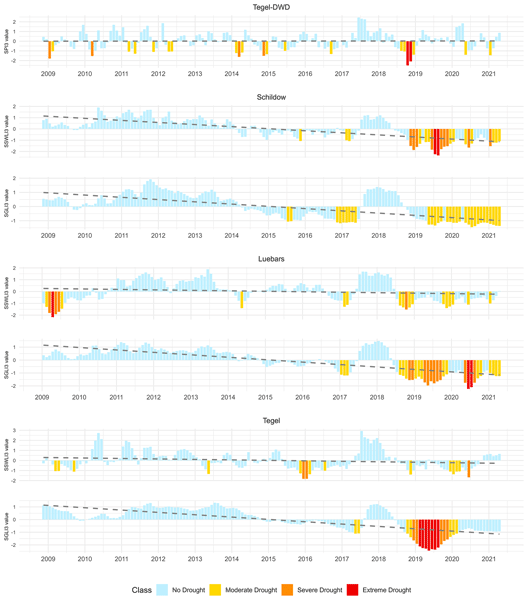
At Tegel-DWD, the SPI3 plot in Fig. 5, shows relatively stable meteorological conditions between 2009 and 2017 with a moderate-severe drought returning almost every year. The precipitation-rich period between mid-2017 and mid-2018 is reflected in high SPI3 values, consistent with precipitation peaks in Fig. 4. However, a significant shift occurs in 2018, when SPI3 drops below −2, marking an extreme meteorological drought spanning several months, before meteorological conditions get back close to how they were before the drought event of 2018/2019. The absence of a significant trend in SPI3 (R2=0, p=0.92; MKp=0.90) confirms that water availability through precipitation remained stable over the study period. This suggests, that subsequent hydrological changes are not directly linked to declining precipitation.
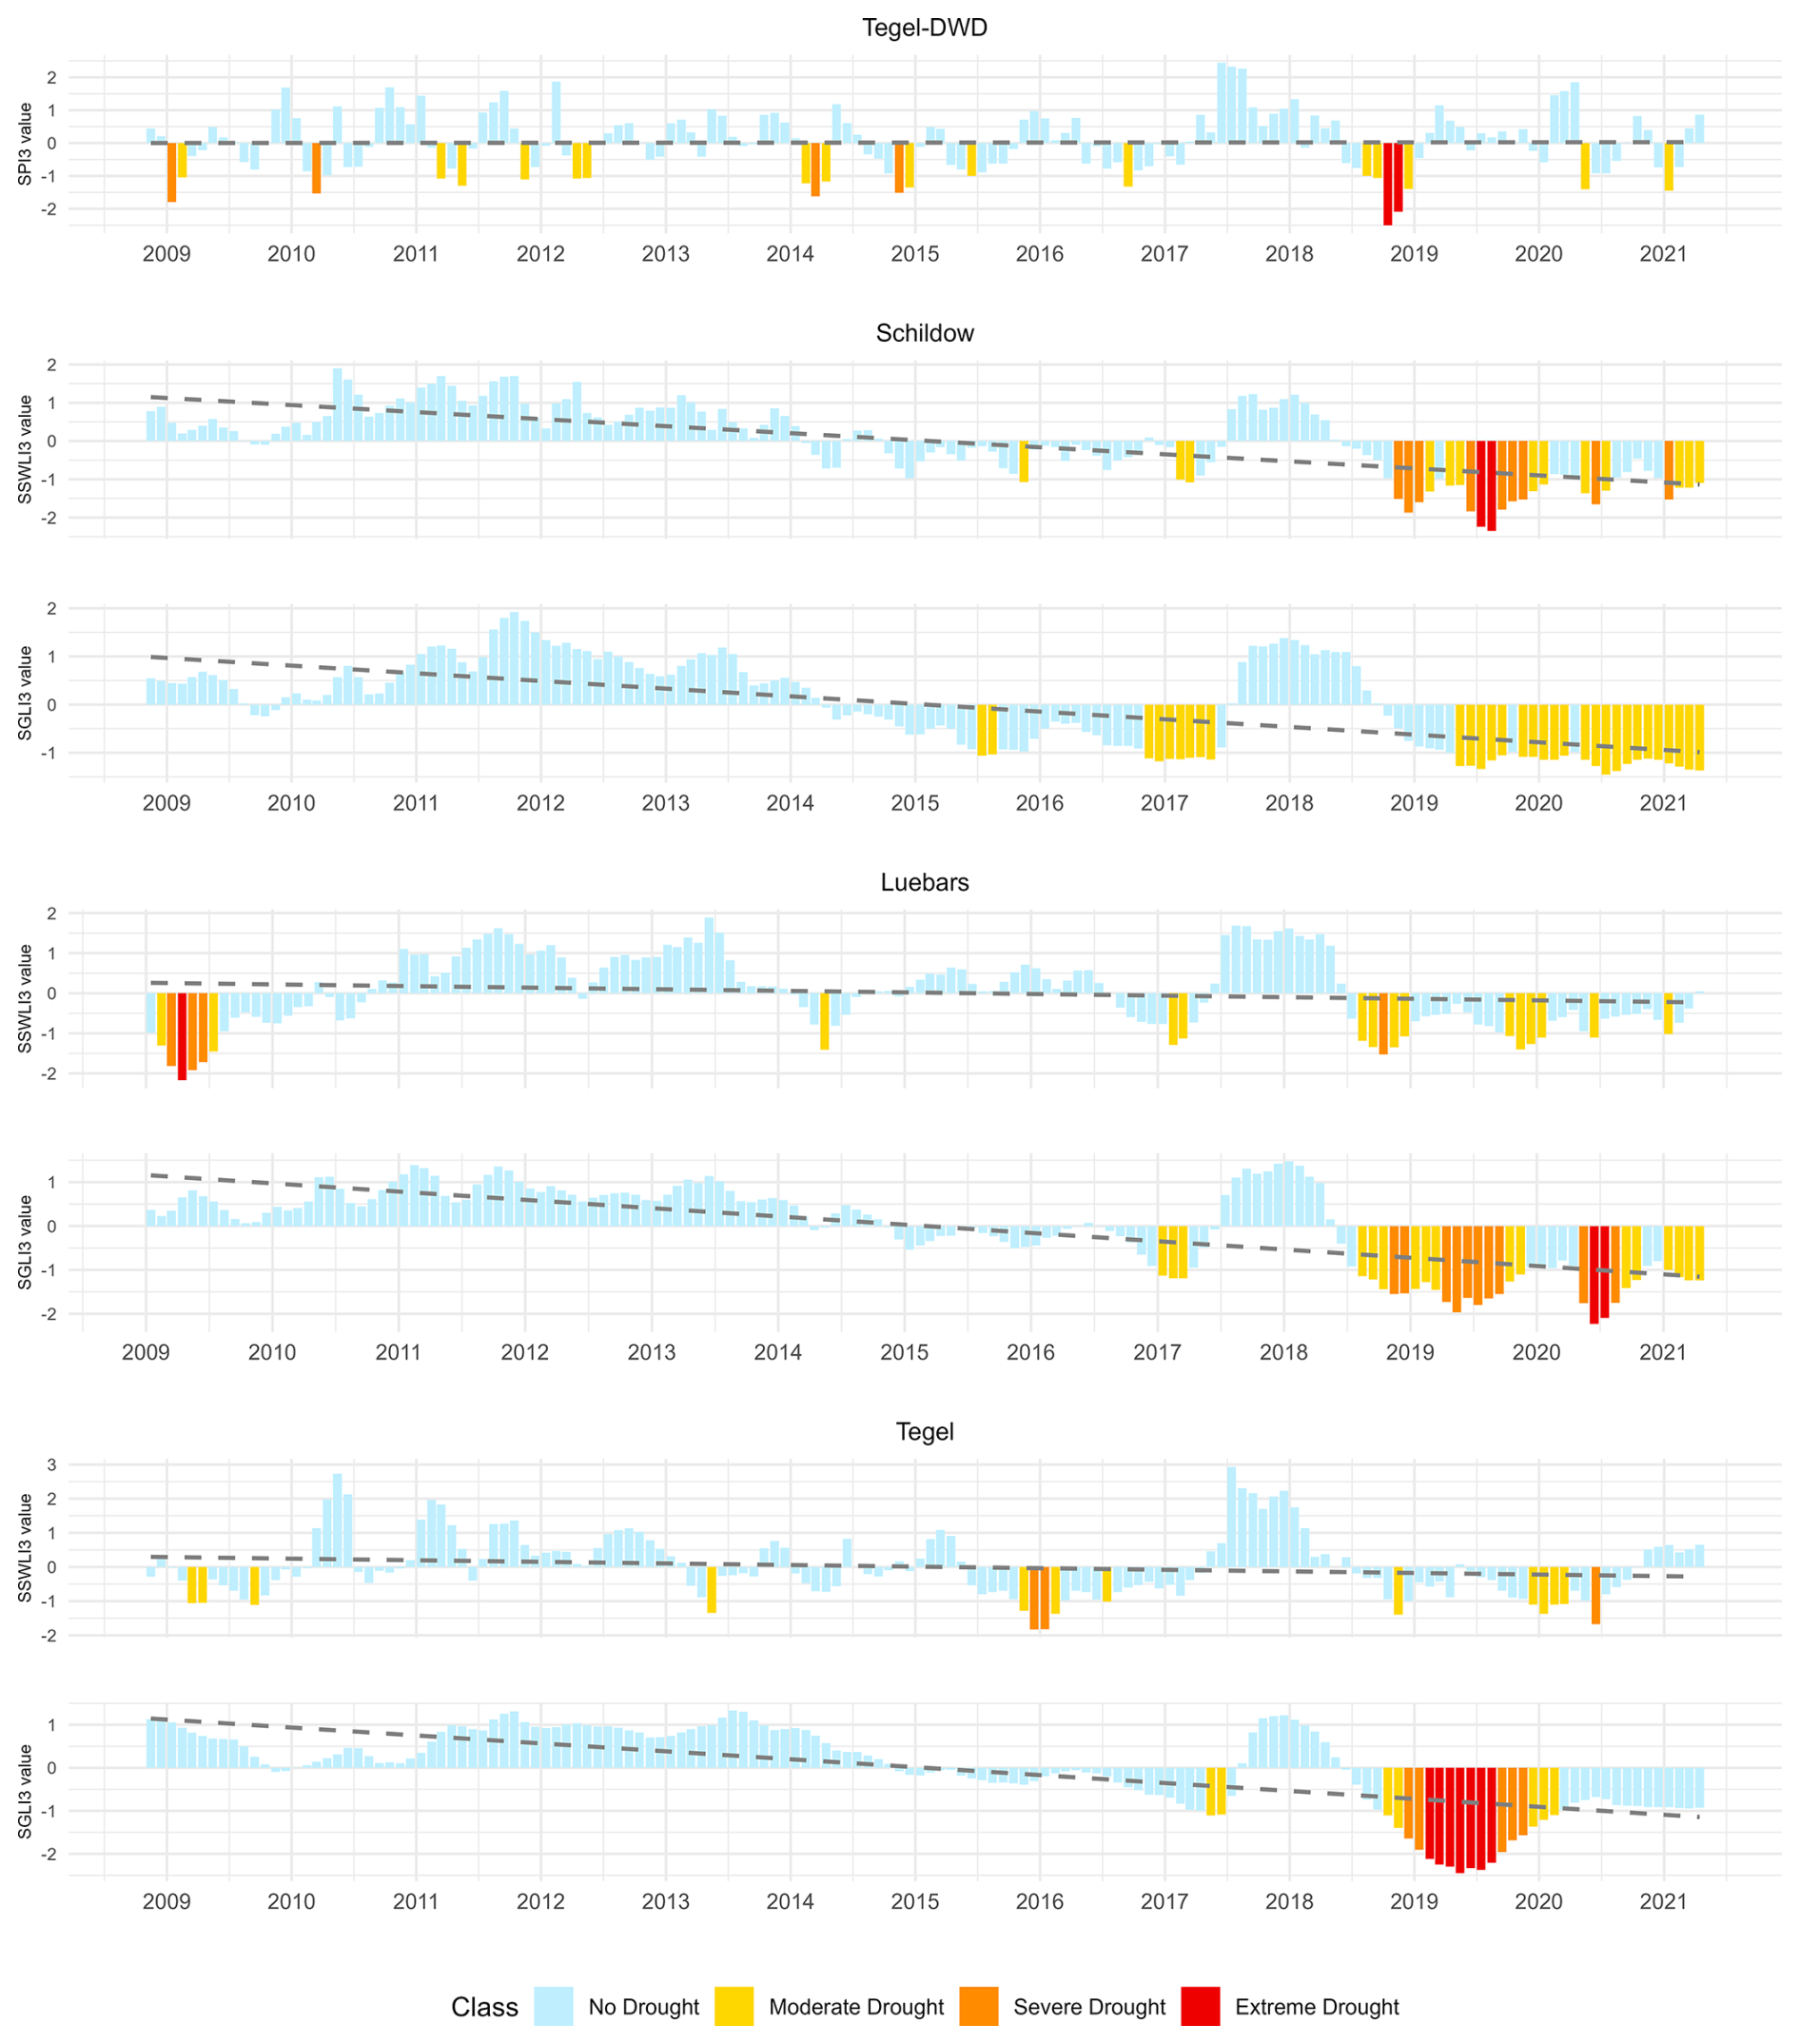
Figure 5Time series of standardized drought indices across the study sites. The top panel shows the SPI3 at Tegel-DWD and the remaining panels display the SSWLI3 and SGLI3 for Schildow, Luebars, and Tegel. Bars are color-coded by drought class (no, moderate, severe, extreme), and dashed gray lines indicate long-term linear trends.
At Schildow, hydrological and groundwater drought intensify over the course of the study period as is revealed by the indices. Surface water levels remained stable between 2008 and 2013. However, from 2014 onward, drought periods became more frequent and severe, reaching a peak after 2018, with SSWLI3 values falling below −2. This pattern is supported by a significant negative trend (R2=0.5, MKτ=−0.50, p<0.001).
In terms of groundwater, Schildow experienced moderate droughts from around 2015, after a period of no droughts from 2008 to 2014, based on SGLI3 data. Between 2014 and 2016, mild but consistent groundwater droughts were observed, with SGLI3 values hovering around −1, indicating dry periods. From 2018 onward, Schildow experienced prolonged groundwater stress, with SGLI3 values consistently below −1 until 2020. The SGLI3 trend confirms this decline (R2=0.39, MKτ=−0.47, p<0.001). Although no extreme groundwater droughts were recorded, the frequent moderate droughts suggest a lasting impact on the region's groundwater resources. Out of 150 months, Schildow recorded 26 hydrological and 31 groundwater drought months. More than 70 % of the hydrological droughts were followed by a groundwater drought within one month, while meteorological droughts propagated to hydrological droughts only in about 23 % of the cases. This finding is supported by the conditional probability of a downstream drought occurring given that there was an upstream drought, compared to the probability of a downstream drought occurring even if there was no upstream drought: P(SSWLI3|SPI3) =23 % vs. P(SSWLI3|no SPI3) =15 %, whereas P(SGLI3|SSWLI3) =74 % vs. P(SGLI3|no SSWLI3) =11 %. This indicates a limited meteorological influence, but a strong downward propagation.
SSWLI3 data in Luebars shows different extremes. Between 2008 and 2010 there was a prolonged drought, with several months characterized by severe dry conditions (SSWLI3 values between −1.5 and −2). After 2010, there was an improvement in surface water conditions, as indicated by positive SSWLI3 values, reflecting the absence of drought, which lasted until around 2014 (similarly to Schildow). From 2014 onward, shorter but recurring drought periods appear of moderate to severe intensity between 2018 and 2021. These observations align with the trend results showing only a weak and statistically not significant decline (R2=0.02, p=0.06; MKτ=−0.12).
The SGLI3 timeseries in Luebars shows a lot of similarities with the SSWLI3 curve in Schildow. Between 2008 and 2010, SGLI3 values remained positive, indicating the absence of groundwater drought. However, after 2015 there was a shift towards lower SGLI3 values signaling the onset of drought conditions. While groundwater drought persisted, its intensity was relatively lower compared to surface water scarcity. Between mid-2018 and 2020, there was a period of drought where groundwater scarcity worsened, with SGLI3 values below −1.5 or lower on several occasions from late 2019 to 2020. This period also saw several consecutive months of drought, signaling a considerable impact on local groundwater resources. This decline is statistically significant (R2=0.52, MKτ=−0.49, p<0.001). In total, Luebars experienced 20 surface water and 29 groundwater drought months. Propagation analysis shows that 36 % of meteorological droughts resulted in hydrological drought within one month, while 45 % of hydrological droughts were followed by groundwater drought within the same time frame. Conditional probabilities confirm this pattern: P(SSWLI3|SPI3) = 36 %, P(SSWLI3|no SPI3) = 10 % and P(SGLI3|SSWLI3) =45 %), P(SGLI3|no SSWLI3) =16 %. This demonstrates that, at Luebars, hydrological droughts often emerge independently of immediate meteorological influences, but can quickly propagate to groundwater.
At Tegel, hydrological droughts are generally less persistent, but highly variable. Initially, between 2008 and 2011, the SSWLI3 fluctuated between negative and positive values, indicating periods of drought alternating with periods of recovery. However, after 2013 the drought periods became more frequent and more severe. From mid-2015 to 2016, Tegel experienced surface water shortages, with SSWLI3 values falling below −1.5, indicating severe drought conditions during this period, with consistently negative SSWLI3 values over a prolonged period. One interesting anomaly at this site is the SSWLI3 drought in 2016 which is not visible in any other locations, and cannot be linked to a meteorological drought directly. Based on our available information we can only speculate on the reason behind this event, but a targeted study would be required for a better understanding. The long-term trend in hydrological drought is weak but significant (R2=0.03, p=0.03; MKτ=−0.14, p=0.01). The Tegel site shows resilience in the sense of having the fastest recovery times of the three sites, but the severity within the shorter times could be equal, or higher.
The SGLI3 data for Tegel show a sustained period of groundwater depletion, which contrasts with surface water resources. From 2008 to mid-2014, the SGLI3 remained mostly positive, indicating normal groundwater levels. However, from 2015 onward, a prolonged period of groundwater scarcity appeared, with SGLI3 values dipping into negative values, indicating the onset of drought conditions. In 2019 and 2020, Tegel experienced an extended period of drought, with SGLI3 falling below −2. Overall, 15 hydrological and 19 groundwater drought months were recorded, indicating a shorter drought persistence compared to Schildow and Luebars. The long-term trend for SGLI3 is statistically strong (R2=0.50, MKτ=−0.50, p<0.001) and confirms ongoing groundwater decline. Propagation rates are the lowest among the stations, with only 14 % of meteorological droughts translating into hydrological droughts, and 20 % of hydrological droughts further leading to groundwater droughts within the time frame of one month. Conditional probabilities confirm these findings, with P(SSWLI3|SPI3) =14 % and P(SGLI3|SSWLI3) =20 %, being both close to their no-drought baselines with P(SSWLI3|no SPI3) =9.5 % and P(SGLI3|no SSWLI3) =12 %. This indicates a weak connection between drought stages.
Drought propagation differs clearly between stations. Schildow shows strong downward propagation from surface water to groundwater, Luebars shows moderate coupling, and Tegel weak linkage with rapid recovery. These patterns indicate that despite stable meteorological conditions, there is increasing hydrological and groundwater drought intensity over time.
3.2.2 Comparative Drought Dynamics across Stations
Comparing the different sites, we see different responses to meteorological and hydrological stress. Between 2018 and 2020, SSWLI3 values often fell below −1 at all three sites. However, the groundwater systems at Luebars and Tegel responded more strongly to drought conditions, with SGLI3 values falling below −1.5 during the same period. This suggests a higher vulnerability of the groundwater to drought stress than surface water systems, which were more resilient to such short-term fluctuations.
In contrast, Schildow showed more resilience in its groundwater systems compared to Luebars or Tegel. Schildow's surface water systems suffered severely during the drought between 2018 and 2020. Its groundwater systems did not experience any extreme events and only experienced moderate drought stress. This suggests that Schildow's groundwater systems are less vulnerable to drought impacts, even though surface water systems experienced higher levels of stress. The Mann-Kendall test for Schildow's SSWLI3 confirmed a significant downward trend (MKτ=−0.5, p<0.001), reflecting a long-term decline in surface water availability that was less pronounced in groundwater systems.
Tegel showed the highest degree of both intensity and duration of groundwater droughts. Groundwater droughts at Tegel lasted the longest, with 17 consecutive months in 2019 and 2020. In contrast to Luebars and Schildow systems at Tegel were more susceptible to prolonged droughts, showing slower recovery and greater stress. Granger causality tests at Tegel also revealed a strong relationship between meteorological drought (SPI3) and both surface and groundwater systems, with an p≪0.05, highlighting the sensitivity of Tegel's hydrological systems to meteorological conditions.
In summary, Tegel experienced the most severe and prolonged groundwater droughts, while Schildow showed more resilience in its groundwater systems despite severe surface water droughts. Luebars displayed the greatest variability in both surface and groundwater responses, with surface water systems being more resilient compared to their groundwater systems. These observations underline the varying vulnerability of stations along the Tegeler Fliess to drought, likely influenced by different local environmental conditions and/or water system uses.
3.3 Vegetation Response over Time
To investigate the impact of droughts on the vegetation, satellite-based NDVI data is used. The NDVI timeseries for the three sites are shown in Fig. 6. The seasonal variation of the vegetation in a cool temperate climate is evident from the NDVI values at all stations, with pronounced peaks in the summer months and dips in the winter months. Throughout the study period, NDVI values predominantly fall within the moderate to dense vegetation classes, indicating generally healthy vegetation. This resilience is consistent across Schildow, Luebars and Tegel, with Luebars and Tegel showing a slight advantage in vegetation health with 110 and 101 months of dense vegetation respectively. Schildow showed 96 months of dense vegetation, still within a healthy range but slightly lower than the other stations. Despite occasional fluctuations, NDVI values show a slight greening trend over time, although statistical tests did not yield significant results. For example, the Mann-Kendall test for NDVI at Schildow showed a MKτ=0.066 and p=0.23, suggesting that the greening trend, while present, is weak and not statistically significant.
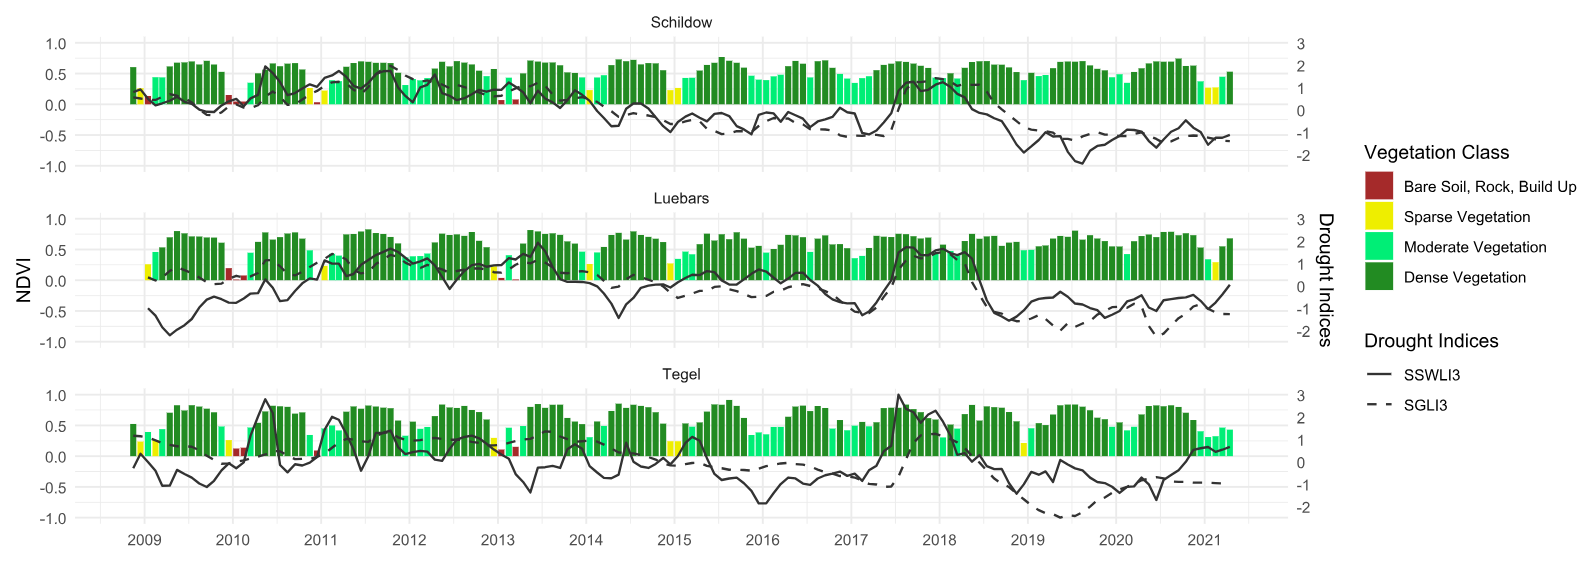
Figure 6NDVI classes with SSWLI3 and SGLI3 time series at the stations Schildow, Luebars, and Tegel.
In particular, the early years of the study (2009–2011) show instances where vegetation fell into the Bare Soil or Rock/Build-Up classes, especially during the winter months. However, from 2014 these classes no longer occurred. This could indicate an increase in vegetation cover or an improvement in overall stability. Studies demonstrating higher growth rates in high-density regions with increasing air temperatures and decreasing precipitation provide evidence in favor of this, indicating that vegetation may profit from these circumstances in specific urban environments (Dahlhausen et al., 2018). Furthermore, the German Weather Service (DWD) (2024) shows a rising trend in Berlin's winter air temperatures during the same time period, which highlights the possibility of more resilient and stable vegetation in milder winters. An even more plausible explanation however is the presence of long-lasting snow cover in the winter months. German weather service data shows snow cover in the winters of 2010 and 2011 at the Tegel station. While there are no direct DWD snow measurements at the stations Schildow and Luebars, the regional climate and landscape characteristics suggest that similar snow conditions likely prevailed at these sites as well. The proximity of the stations and the absence of significant topographic differences support this assumption.
Luebars and Tegel were particularly affected by an SSWLI3 drought between 2009 and 2010, which seemed to coincide with reduced vegetation health in the following winter months. However, this relationship was not consistently observed, as winter months with lower NDVI values sometimes occurred without preceding drought events. After 2018, all stations experienced significant periods of drought, as reflected in the SSWLI3 and SGLI3 indices. SSWLI3 and SGLI3 values frequently fell below −1, indicating moderate to severe drought conditions. Despite these persistent droughts, NDVI values remained in the moderate to dense vegetation classes, suggesting a degree of vegetation resilience in these ecosystems. However, Schildow and Tegel showed prolonged periods of stress where the vegetation took a little longer to recover, as indicated by longer periods in the sparse or moderate vegetation classes.
The NDVI data point to overall stable vegetation conditions and a weak evidence of long-term greening, despite recurring drought periods. These observations are further supported by statistical analyses.
Spearman correlation tests between NDVI and the drought indices (SSWLI3, SGLI3 and SPI3) showed no significant results, with correlation coefficients close to zero at all stations. This lack of strong correlation suggests that vegetation health, as represented by NDVI, may not directly reflect drought conditions in these ecosystems. However, Granger causality tests revealed more nuanced relationships. At Schildow, the combination of SPI3 and SSWLI3 was a significant predictor of NDVI with a lag of 1 month, with p≪0.05. SPI3 alone was also a significant predictor of NDVI at this station, although the combination of SPI3 and SSWLI3 performed better. At Luebars, SPI3 alone was found to be a significant predictor of NDVI with a lag of 1 month, while at Tegel, the combination of SPI3 and SSWLI3 also gave the best results, with p≪0.05.
While these data suggest some predictive relationships, it is important to note that satellite-based NDVI may be too coarse to adequately capture localized vegetation responses to drought. In-situ measures of vegetation health could provide more precise insights and supplement satellite-derived indices in these analyses.
In summary, while meteorological drought events, particularly after 2018, are clearly reflected in the SSWLI3 and SGLI3 indices, they do not appear to have a direct and immediate impact on vegetation health as measured by NDVI. Instead, ecosystems at these stations show a degree of resilience: vegetation is either not affected by or quickly recovers after periods of drought. The statistical tests reinforce the idea that while SPI3 and SSWLI3 may influence vegetation health, the overall relationship between drought indices and NDVI remains complex and non-linear across stations.
4.1 Drought Dynamics and Interconnections of Drought Types
The stations along the Tegeler Fliess – Schildow, Luebars and Tegel – showed unique responses to drought stress over the study period, despite their geographical proximity. While the Tegel surface water system experienced moderate to severe droughts from 2015 to 2020, the groundwater system faced more sustained stress. Schildow experienced more severe surface water droughts but had relatively stable groundwater levels. Luebars showed the greatest variability, with severe groundwater drought but more resilient surface water conditions.
At all stations, surface water droughts manifested and receded more quickly than groundwater droughts, which showed a delayed but longer-lasting response. For example, during the 2008–2010 and 2018–2020 droughts in Luebars, there was a decline in surface water levels followed by a lasting strain on groundwater resources, suggesting that it takes time for groundwater levels to recover once they have been depleted. Similarly, in Schildow, surface water droughts occurred rapidly with declining precipitation, but groundwater droughts developed more gradually, suggesting that these systems absorb cumulative meteorological impacts over time. The main differences between these sites are primarily driven by their unique local environments, with the Tegel station situated in a peri-urban landscape that is influenced by a nearby densely developed urban area. In such an environment, the great amount of sealed surfaces put a lot of stress on groundwater resources via disturbed recharge processes (Zink et al., 2017). Visual assessment of historical satellite imagery confirmed that no large-scale urban expansion or significant changes in surface sealing occurred directly near the wells during the study period (2008–2021). This increases confidence that the most severe groundwater drought impacts observed at Tegel are predominantly a response to hydrological stress.
While Tegel experienced the most severe groundwater stress, Schildow was more vulnerable to surface water droughts. Note that this could be an artefact from the methodology, as at the most upstream station river levels are the most sensitive to external influences. However the first half of the timeseries show similar drought dynamics, which indicates consistency in the methodology across the stations. Schildow is located in an open agricultural area, which implies a more direct connection with the atmospheric conditions. This resulted in a much faster hydrological drought dynamics, with droughts setting in and recovering faster than at the other sites. These fast recoveries however are not reflected in the groundwater: here, this site suffers the longest drought periods, with slightly mitigated impacts. These findings imply that drought monitoring programs should be tailored to the specific vulnerability of each site to ensure that both surface and groundwater resources are properly managed.
These results align with those of Van Loon (2015), who observed that groundwater droughts often persist after meteorological droughts and surface water droughts have ended. The propagation of drought, from meteorological to hydrological drought via soil moisture was shown in Berlin on a catchment level by Pohle et al. (2025). Our results show that this propagation is observable on a smaller scale, but emphasizes the importance of local factors in relation to drought resilience. Furthermore, the prolonged period of groundwater depletion in Tegel is comparable to the patterns observed by Nalbantis and Tsakiris (2009) in Spain, where groundwater systems were highly vulnerable to prolonged drought conditions. The downward trend in SPI3 observed in Grillakis (2019) highlights the increasing vulnerability to meteorological droughts across Europe due to changing precipitation patterns under climate change and could become relevant for our study site in the future, even though no significant trend in SPI3 was observed during our study period.
It is also important to note, that the three sites are located in hydrogeologically very different settings. Most notably, the aquifer at the Luebars site is an isolated local aquifer body, with limited recharge connections to the atmosphere. The Schildow site also features a thick isolating layer above the aquifer, which contributes to the observed higher resilience. This emphasizes the importance of recharge processes on groundwater resources of the region, and shows the importance to further investigate these processes in the region.
4.2 Impact of Drought on Vegetation
Despite the occurrence of severe and prolonged droughts, particularly from 2018 to 2020, vegetation along the Tegeler Fliess showed notable resilience. NDVI values generally remained within the moderate to dense vegetation classes, indicating that vegetation was not strongly impacted during periods of hydrological and hydrogeological drought. The heterogeneous land cover at the sites likely contributed to the inconsistent vegetation responses observed across stations. Applying a remotely sensed index like MODIS NDVI to a catchment as small and heterogenous as the Tegeler Fliess raises the question of scale. Precedent exist for using MODIS at this level: Buras et al. (2021) effectively tracked forest drought stress across Germany by pairing NDVI with drought indices, and Liu et al. (2024) used similar indicators to investigate vegetation lag times across broad climate areas. The key difference, however, lies in the spatial uniformity of those study areas. In transitional, peri-urban landscapes like the Tegeler Fliess, the 250 m resolution represents a coarse tool. One averaged MODIS pixel may blend the spectral signature of a dense forest, irrigated suburban lawn, and sealed surfaces. This is the classic mixed-pixel problem and it constitutes a fundamental limitation in this context, suggesting that the findings from the NDVI analysis should be interpreted with caution.
To validate the MODIS-based NDVI results, we also analysed NDVI based on Landsat data, which offer higher spatial resolution (30 m) compared to MODIS (250 m). However, the Landsat record contained many temporal gaps due to cloud cover and limited revisit frequency, while MODIS provided more consistent temporal coverage. For the most part, both datasets aligned well (see Fig. S4), except for a systematic discrepancy during winter months, which is interesting but not relevant to this study’s objectives.
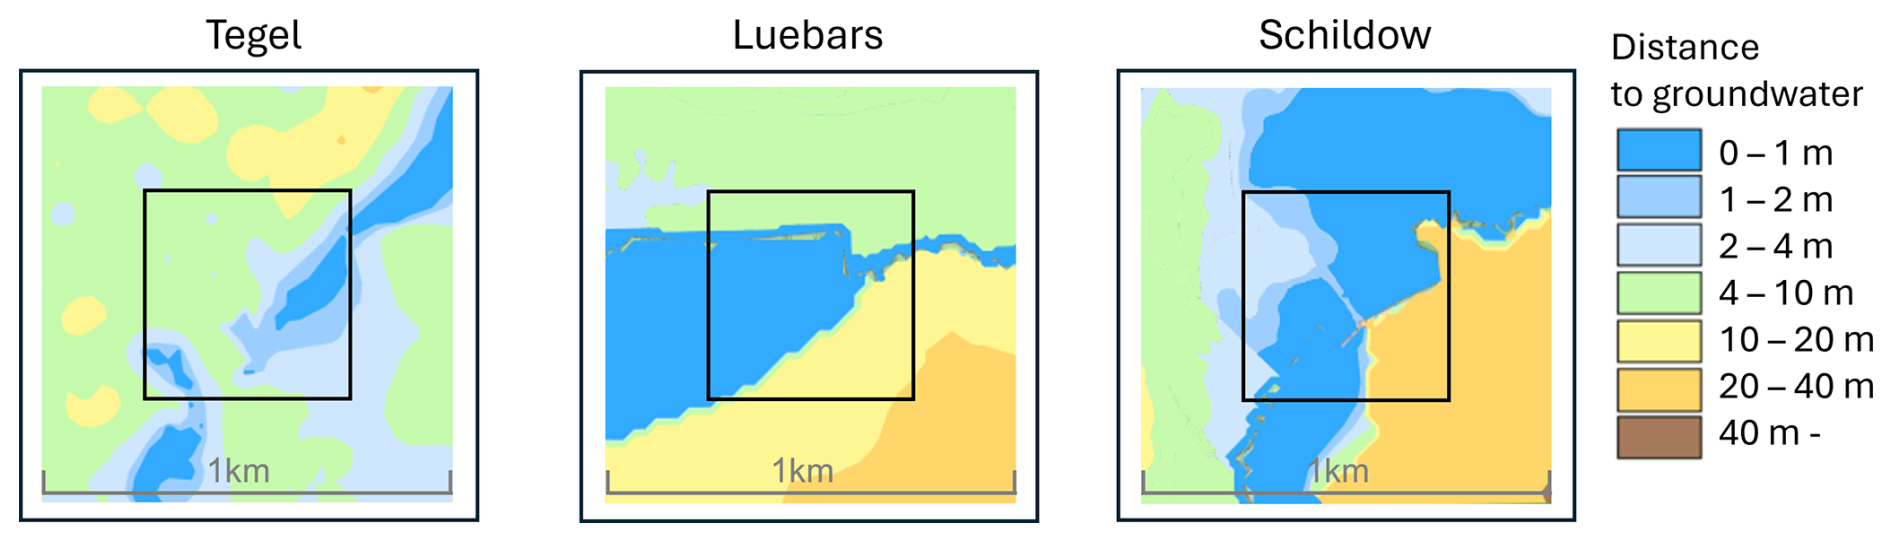
Granger causality tests showed that SPI3 and SSWLI3 influenced NDVI at several stations, particularly at Schildow and Tegel. However, SGLI3 did not show a significant relationship with NDVI. These results suggest that precipitation and surface water played a more critical role in maintaining vegetation than groundwater. The weak correlation between drought indices and NDVI indicates resilience within the ecosystem, shaped by multiple factors, including vegetation type, soil moisture, groundwater depth, and land management practices. In the regions around Schildow and Luebars, the NDVI remained stable despite hydrological and groundwater drought conditions. The structural complexity of the land cover likely fostered a more nuanced ecosystem response compared to more uniform environments. The small distance to the groundwater table near the stream allowed deep rooted plants to use groundwater resources directly as a buffer during drought periods with low soil moisture (see Fig. 7). While this connection could weaken as groundwater levels decrease, no such severance occurred during the study period. Regional-scale studies however warn of a general decreasing trend in groundwater levels (Heudorfer et al., 2024; Somogyvári et al., 2024), therefore the investigation of the groundwater-vegetation relationship stays relevant for future research.
While water infrastructure like trench networks near the agricultural fields in Luebars are present, these structures were primarily designed for drainage and to accelerate surface runoff. Without active retention measures, these networks do not increase resilience and may even exacerbate vulnerability to hydrological extremes. Therefore, the observed resilience of the local vegetation is primarily dependent on the shallow groundwater availability rather than surface water redistribution. Monitoring of vegetation health should go beyond the use of NDVI, as this index alone may not capture the extent of water stress, particularly in agricultural areas. Adaptive management strategies should therefore focus on balancing the needs of natural ecosystems and agricultural activities, which can further exacerbate water depletion in times of drought.
The divergence between drought indices and NDVI observed in this study is consistent with findings from similar regions, where vegetation resilience or human intervention (e.g. irrigation) mitigated the effects of drought (Gessner et al., 2023). This suggests that in peri-urban catchments such as the Tegeler Fliess, the response of vegetation to drought is more complex and may require more detailed, long-term studies that consider both natural and anthropogenic factors.
Although historical satellite imagery suggested that localized land use changes did not considerably influence the observed dynamics, the analysis lacked precise local data on specific anthropogenic activities, such as subsurface pumping rates, development permits, or changes in storm water infrastructure. The absence of such data limited the quantification of human impacts on water level dynamics. Furthermore, the classification of NDVI values into vegetation classes based on De La Iglesia Martinez and Labib (2023) may not fully capture the complexity of vegetation dynamics, as any fixed classification scheme simplifies the continuous and context-dependent nature of vegetation responses.
The linear interpolation applied to harmonize groundwater level time series introduced a potential source of uncertainty, particularly at Schildow, where measurements were recorded at weekly and not daily resolution. However, because drought indices were calculated on a monthly basis, the influence of short-term interpolation on index values is expected to be minimal. The only substantial gap at the beginning of the study period (November 2008 to February 2009) falls outside the main drought events discussed and does not affect their interpretation.
The vegetation resilience observed across the stations suggests that the natural ecosystems in the Tegeler Fliess area remained relatively robust during periods of water scarcity. The study period ending in April 2021 may not have been long enough to capture the delayed vegetation responses to the prolonged drought conditions of 2018–2020. The time frame of our study was limited by the availability of complete data sets. Even though some measurements date as far back as 1945, the surface water level station at Luebars began recording in 2008 and precipitation measurements were discontinued at the site in 2021. This is a key limitation, as the study period of 13 years may not fully capture longer-term climate cycles that influence drought patterns.
Most of the discussed limitations could be addressed by increasing the amount of in-situ data collected on the water-vegetation interactions, showing that site-specific monitoring is a core element of understanding the impacts of climate change in such settings (and how the declining number of such stations is an issue; Vörösmarty et al., 2000; Tourian et al., 2022).
Droughts are intensifying due to climate change, impacting water systems and vegetation. This study examined drought patterns in the Tegeler Fliess area by analyzing meteorological droughts and their impact on surface water and groundwater systems from 2008 to 2021.
Several significant droughts were observed during this period. The most severe droughts occurred between 2018 and 2020. The results showed that surface water systems responded quickly to changes in precipitation (SPI3), with rapid onset and recovery phases. At the same time, groundwater systems experienced prolonged droughts and slower recovery times. In particular, Tegel groundwater experienced a severe 17-month drought from 2019 to 2020, while Schildow showed more resilience in groundwater levels but showed stress in surface water systems. Luebars showed variability in surface water responses, but its groundwater systems appeared more vulnerable in recent years. Vegetation health, as measured by NDVI values, remained relatively stable throughout the study, with moderate to dense vegetation classes persisting throughout the study period. The lack of significant correlation between drought indices and NDVI suggests a complex, non-linear relationship between water availability and vegetation response, with some ecosystems showing resilience, particularly during shorter droughts.
This study demonstrated that standardized drought indices, derived from routinely available meteorological, hydrological, and remote sensing data, can effectively characterize drought propagation across multiple hydrological compartments at the local scale. The methodology is transferable to comparable peri-urban catchments, bridging the gap between large-scale drought assessment frameworks and site-specific hydrological contexts.
Future research should extend this work by using more long-term datasets or incorporating additional drought indicators, such as soil moisture or temperature-based indices. The investigation of soil moisture is especially important, as its dynamic is a key element to understand the vegetation response to drought conditions and to understand how ecosystems could recover from prolonged drought. In addition, higher resolution data or a vegetation index that better accounts for different vegetation types and conditions would improve the accuracy of monitoring vegetation health. Integrating human factors such as land use and irrigation practices could also improve our understanding of how anthropogenic activities affect water availability and vegetation resilience in peri-urban environments such as the Tegeler Fliess.
The used surface water and groundwater data can be accessed at the water portal of the Berlin Senate https://wasserportal.berlin.de/stationen_start.php (SenMVKU, 2026) and at the water portal of Brandenburg: https://apw.brandenburg.de/ (LfU, 2026). Precipitation data is openly accessible from the German Weather Service (DWD) https://opendata.dwd.de/climate_environment/CDC/ (last access: 6 October 2025). Code is available upon request from the corresponding author.
The supplement related to this article is available online at https://doi.org/10.5194/nhess-26-3617-2026-supplement.
PF and AG carried out the data collection and the analysis. All authors contributed to the writing and editing of the manuscript.
The contact author has declared that none of the authors has any competing interests.
Publisher's note: Copernicus Publications remains neutral with regard to jurisdictional claims made in the text, published maps, institutional affiliations, or any other geographical representation in this paper. The authors bear the ultimate responsibility for providing appropriate place names. Views expressed in the text are those of the authors and do not necessarily reflect the views of the publisher.
This article is part of the special issue “Current and future water-related risks in the Berlin–Brandenburg region”. It is not associated with a conference.
This study was funded through the Einstein Research Unit “Climate and Water under Change” from the Einstein Foundation Berlin and Berlin University Alliance under grant no. ERU-2020-609.
This research has been supported by the Einstein Stiftung Berlin (grant no. ERU-2020-609).
This open-access publication was funded by the Humboldt-Universität zu Berlin.
This paper was edited by Pedro Alencar and reviewed by Erik Nixdorf and two anonymous referees.
Abu Arra, A. and Şişman, E.: A comprehensive analysis and comparison of SPI and SPEI for spatiotemporal drought evaluation, Environ. Monitor. Assess., 196, 980, https://doi.org/10.1007/s10661-024-13127-7, 2024. a
Bachmair, S., Tanguy, M., Hannaford, J., and Stahl, K.: How well do meteorological indicators represent agricultural and forest drought across Europe?, Environ. Res. Lett., 13, 034042, https://doi.org/10.1088/1748-9326/aaafda, 2018. a
Bart, F., Schmidt, B., Wang, X., Holtmann, A., Meier, F., Otto, M., and Scherer, D.: The Central Europe Refined analysis version 2 (CER v2): evaluating three decades of high-resolution precipitation data for the Berlin-Brandenburg metropolitan region, Meteorol. Z., 33, 339–363, https://doi.org/10.1127/metz/2024/1233, 2024. a
Baugenossenschaft Freie Scholle zu Berlin eG.: Tegeler Fliess, https://www.freiescholle.de/siedlungen/tegeler-fliess/, last access: 26 September 2024. a
Berliner Senatsverwaltung für Stadtentwicklung (Eds.): Natura 2000-Gebiet Tegeler Fließtal, https://www.berlin.de/sen/uvk/natur-und-gruen/naturschutz/natura-2000/natura-gebiete/tegeler-fliesstal/, last access: 11 July 2025. a, b
Bloch, R., Wechsung, F., Heß, J., and Bachinger, J.: Climate change impacts of legume-grass swards: implications for organic farming in the Federal State of Brandenburg, Germany, Reg. Environ. Change, 15, 405–414, https://doi.org/10.1007/s10113-014-0656-2, 2015. a
Bloomfield, J. P. and Marchant, B. P.: Analysis of groundwater drought building on the standardised precipitation index approach, Hydrol. Earth Syst. Sci., 17, 4769–4787, https://doi.org/10.5194/hess-17-4769-2013, 2013. a, b, c, d
Blöschl, G., Ardoin-Bardin, S., Bonell, M., Dorninger, M., Goodrich, D., Gutknecht, D., Matamoros, D., Merz, B., Shand, P., and Szolgay, J.: At what scales do climate variability and land cover change impact on flooding and low flows?, Hydrol. Process., 21, 1241–1247, https://doi.org/10.1002/hyp.6669, 2007. a
Beguería, S., and Vicente-Serrano, S. M.: SPEI: Calculation of the Standardized Precipitation-Evapotranspiration Index, R package version 1.8.1, CRAN [code], https://doi.org/10.32614/CRAN.package.SPEI, 2023. a
Boessenkool, B.: rdwd: Select and Download Climate Data from “DWD” (German Weather Service), R package version 1.8.0, CRAN [code], https://doi.org/10.32614/CRAN.package.rdwd, 2023. a
Buras, A., Rammig, A., and Zang, C. S.: The European Forest Condition Monitor: Using remotely sensed NDVI to track forest stress across Europe, Front. Plant Sci., 12, 689220, https://doi.org/10.3389/fpls.2021.689220, 2021. a
Chen, X., Wang, D., Chen, J., Wang, C., and Shen, M.: The mixed pixel effect in land surface phenology: A simulation study, Remote Sens. Environ., 211, 338–344, https://doi.org/10.1016/j.rse.2018.04.030, 2018. a
Crausbay, S. D., Ramirez, A. R., Carter, S. L., Cross, M. S., Hall, K. R., Bathke, D. J., Betancourt, J. L., Colt, S., Cravens, A. E., Dalton, M. S., Dunham, J. B., Hay, L. E., Hayes, M. J., McEvoy, J., McNutt, C. A., Moritz, M. A., Nislow, K. H., Raheem, N., and Sanford, T.: Defining ecological drought for the twenty-first century, B. Am. Meteorol. Soc., 98, 2543–2550, https://doi.org/10.1175/BAMS-D-16-0292.1, 2017. a
Cullmann, A., Sundermann, G., Wägner, N., von Hirschhausen, C. R., and Kemfert, C.: Water resources in Germany: Increasingly polluted and regionally overused, DIW Weekly Report, 12, 307–315, https://doi.org/10.18723/diw_dwr:2022-49-1, 2022. a
Dahlhausen, J., Rötzer, T., Biber, P., Uhl, E., and Pretzsch, H.: Urban climate modifies tree growth in Berlin, Int. J. Biometeorol., 62, 795–808, https://doi.org/10.1007/s00484-017-1481-3, 2018. a
De La Iglesia Martinez, A., and Labib, S. M.: Demystifying normalized difference vegetation index (NDVI) for greenness exposure assessments and policy interventions in urban greening, Environ. Res., 220, 115155. https://doi.org/10.1016/j.envres.2022.115155, 2023. a, b
German Weather Service (DWD): German Climate Atlas, https://www.dwd.de/EN/climate_environment/climateatlas/climateatlas_node.html, last access: 28 January 2024. a
European Environment Agency (EEA): CLCplus Backbone 2021 (10 m raster) – Europe, Copernicus Land Monitoring Service [data set], https://land.copernicus.eu/en/products/clc-backbone (last access: 20 October 2025), 2021. a
Germer, S., Kaiser, K., Bens, O., and Hüttl, R. F.: Water balance changes and responses of ecosystems and society in the Berlin-Brandenburg region – a review, DIE ERDE – J. Geogr. Soc. Berlin, 142, 65–95, https://doi.org/10.12854/erde-142-43, 2011. a, b
Gessner, U., Reinermann, S., Asam, S., and Kuenzer, C.: Vegetation Stress Monitor— Assessment of drought and temperature-related effects on vegetation in Germany analyzing MODIS time series over 23 years, Remote Sens., 15, 5428, https://doi.org/10.3390/rs15225428, 2023. a
Granger, C. W.: Investigating causal relations by econometric models and cross-spectral methods, Econometrica: J. Eco. Soc., 37, 424–438, https://doi.org/10.2307/1912791, 1969. a, b
Grillakis, M. G.: Increase in severe and extreme soil moisture droughts for Europe under climate change, Sci. Total Environ., 660, 1245–1255, https://doi.org/10.1016/j.scitotenv.2019.01.001, 2019. a, b
Heim Jr., R. R.: A review of twentieth-century drought indices used in the United States, B. Am. Meteorol. Soc., 83, 1149–1166, https://doi.org/10.1175/1520-0477-83.8.1149, 2002. a
Helmholtz Centre for Environmental Research: Drought Monitor Germany, https://www.ufz.de/index.php?en=37937 (last access: 25 September 2024), 2023. a
Heudorfer, B., Liesch, T., and Broda, S.: On the challenges of global entity-aware deep learning models for groundwater level prediction, Hydrol. Earth Syst. Sci., 28, 525–543, https://doi.org/10.5194/hess-28-525-2024, 2024. a
Hufkens, K.: The MODISTools package: an interface to the MODIS Land Products Subsets Web Services, Zenodo [code], https://doi.org/10.5281/zenodo.7551165, 2023. a
Ihinegbu, C. and Ogunwumi, T.: Multi-criteria modelling of drought: a study of Brandenburg Federal State, Germany, Model. Earth Syst. Environ., 8, 2035–2049, https://doi.org/10.1007/s40808-021-01197-2, 2022. a
Jackson, R. B., Canadell, J., Ehleringer, J. R., Mooney, H. A., Sala, O. E., and Schulze, E. D.: A global analysis of root distributions for terrestrial biomes, Oecologia, 108, 389–411, https://doi.org/10.1007/BF00333714, 1996.
Jensen, J.: Remote sensing of the environment: An Earth resource perspective, Pearson Education, Limited, https://ebookcentral.proquest.com/lib/kbdk/detail.action?docID=5173657 (last access: 7 November 2024), 2013. a
Jimenez, R. B., Lane, K. J., Hutyra, L. R., and Fabian, M. P.: Spatial resolution of Normalized Difference Vegetation Index and greenness exposure misclassification in an urban cohort, J. Expo. Sci. Env. Epid., 32, 213–222, https://doi.org/10.1038/s41370-022-00409-w, 2022. a
Kahlenborn, W., Porst, L., Voss, M., Fritsch, U., Renner, K., Zebisch, M., Wolf, M., Schönthaler, K., and Schauser, I.: Climate Impact and Risk Assessment 2021 for Germany – Summary, Umweltbundesamt, Dessau-Roßlau, https://www.umweltbundesamt.de/sites/default/files/medien/479/publikationen/cc_27-2021_climate_impact_and_risk_assessment_2021_for_germany_english_summary_bf.pdf (last access: 29 December 2024), 2021. a
Kuhlemann, L. M., Tetzlaff, D., and Soulsby, C.: Urban water systems under climate stress: An isotopic perspective from Berlin, Germany. Hydrol. Process., 34, 3758–3776, https://doi.org/10.1002/hyp.13850, 2020. a
Kuhlemann, L. M., Dubbert, M., Pätzold, S., and Cuntz, M.: The imprint of hydroclimate, urbanization and catchment connectivity on the stable isotope dynamics of a large river in Berlin, J. Hydrol., 613, 128335, https://doi.org/10.1016/j.jhydrol.2022.128335, 2022. a
Kloos, S., Yuan, Y., Castelli, M., and Menzel, A.: Agricultural drought detection with MODIS-based vegetation health indices in Southeast Germany, Remote Sens., 13, 3907, https://doi.org/10.3390/rs13193907, 2021. a
Kong, D., Miao, C., Duan, Q., Lei, X., and Li, H.: Vegetation-climate interactions on the Loess Plateau: A nonlinear Granger causality analysis, J. Geophys. Res.-Atmos., 123, 11068–11079, https://doi.org/10.1029/2018JD029036, 2018. a
Köstner, B., Surke, M., and Bernhofer, C.: Klimadiagnose der Region Berlin/Barnim/Uckermark/Uecker-Randow für den Zeitraum 1951–2006, Materialien der Interdisziplinären Arbeitsgruppe Zukuftsorientierte Nutzung ländlicher Räume LandInnovation, Berlin-Brandenburgische Akademie der Wissenschaften, 18, Berlin, https://edoc.bbaw.de/opus4-bbaw/frontdoor/deliver/index/docId/767/file/21zdHy5mOp5M.pdf (last access: 24 June 2026), 2007. a
LfU (Landesamt für Umwelt Brandenburg) (Eds.): Auskunftsplattform Wasser (APW), Potsdam, https://apw.brandenburg.de/, last access: 13 November 2024. a
Li, Z., Sun, F., Wang, H., Wang, T., and Feng, Y.: Detecting the interactions between vegetation greenness and drought globally, Atmos. Res., 304, 107409, https://doi.org/10.1016/j.atmosres.2024.107409, 2024. a, b
Liu, M., Zhang, X., Liao, J., and Zhu, Y.: Time-lag and accumulation responses of vegetation growth to climate extremes in China, Sci. Total Environ., 945, 174084, https://doi.org/10.1016/j.scitotenv.2024.174084, 2024. a
McKee, T. B., Doesken, N. J., and Kleist, J.: The relationship of drought frequency and duration to time scales, Proceedings of the 8th Conference on Applied Climatology, 17, 179–183, https://www.droughtmanagement.info/literature/AMS_Relationship_Drought_Frequency_Duration_Time_Scales_1993.pdf (last access: 24 June 2026), 1993. a, b, c, d
McLeod, A.: Kendall: Kendall Rank Correlation and Mann-Kendall Trend Test, R package version 2.2.1, CRAN [code], https://doi.org/10.32614/CRAN.package.Kendall, 2022. a
NABU Berlin: Das Tegeler Fließtal, Naturschatz im Norden Berlins, https://berlin.nabu.de/stadt-und-natur/naturschutz-berlin/18942.html, last access: 9 December 2024. a
Nalbantis, I. and Tsakiris, G.: Assessment of hydrological drought revisited, Water Resour. Manage., 23, 881–897, https://doi.org/10.1007/s11269-008-9305-1, 2009. a, b, c
Nemani, R. R., Keeling, C. D., Hashimoto, H., Jolly, W. M., Piper, S. C., Tucker, C. J., Myneni, R. B., and Running, S. W.: Climate-driven increases in global terrestrial net primary production from 1982 to 1999, Science, 300, 1560–1563, https://doi.org/10.1126/science.1082750, 2003. a
Ojha, S. S., Singh, V., and Roshni, T.: Comparison of meteorological drought using SPI and SPEI, Civil Eng. J., 7, 2130–2149, https://doi.org/10.28991/cej-2021-03091783, 2021. a
Papagiannopoulou, C., Miralles, D. G., Dorigo, W. A., Verhoest, N. E. C., Depoorter, M., and Waegeman, W.: Vegetation anomalies caused by antecedent precipitation in most of the world, Environ. Res. Lett., 12, 074016, https://doi.org/10.1088/1748-9326/aa7145, 2017. a
Pei, Z., Fang, S., Wang, L., and Yang, W.: Comparative analysis of drought indicated by the SPI and SPEI at various timescales in Inner Mongolia, China, Water, 12, 1925, https://doi.org/10.3390/w12071925, 2020. a
Pfaff, B.: VAR, SVAR and SVEC models: Implementation within R package vars, J. Stat. Softw., 27, https://www.jstatsoft.org/v27/i04/ (last access: 15 March 2026), 2008. a
Pohle, I., Zeilfelder, S., Birner, J., and Creutzfeldt, B.: The 2018–2023 drought in Berlin: impacts and analysis of the perspective of water resources management, Nat. Hazards Earth Syst. Sci., 25, 1293–1313, https://doi.org/10.5194/nhess-25-1293-2025, 2025. a, b, c
R Core Team: R: A language and environment for statistical computing, R Foundation for Statistical Computing, Vienna, Austria, https://www.R-project.org/ (last access: 15 March 2026), 2024. a
Reyer, C., Bachinger, J., Bloch, R., Hattermann, F. F., Ibisch, P. L., Kreft, S., Lasch, P., Lucht, W., Nowicki, C., Spathelf, P., Stock, M., and Welp, M.: Climate change adaptation and sustainable regional development: A case study for the Federal State of Brandenburg, Germany, Reg. Environ. Change, 12, 523–542. https://doi.org/10.1007/s10113-011-0269-y, 2012. a
SenMVKU (Senatsverwaltung für Mobilität, Verkehr, Klimaschutz und Umwelt) (Eds.): Wasserportal Berlin, Messstellenauswahl, Berlin, https://wasserportal.berlin.de/stationen_start.php, last access: 13 November 2024. a
SenStadt (Senatsverwaltung für Stadtentwicklung, Bauen und Wohnen Berlin) (Eds.): Geoportal Berlin, Flurabstand des Grundwassers in Metern 2005, Berlin, https://gdi.berlin.de/viewer/main/, last access: 17 March 2026. a
Schindler, U., Steidl, J., Müller, L., Eulenstein, F., and Thiere, J.: Drought risk to agricultural land in Northeast and Central Germany, J. Plant Nut. Soil Sci., 170, 357–362, https://doi.org/10.1002/jpln.200622045, 2007. a
Shojaie, A. and Fox, E. B.: Granger causality: A review and recent advances, Annu. Rev. Stat. Appl., 9, 289–319, https://doi.org/10.1146/annurev-statistics-040120-010930, 2022. a
Singh, N. K. and Borrok, D. M.: A Granger causality analysis of groundwater patterns over a half-century, Sci. Rep., 9, 12828. https://doi.org/10.1038/s41598-019-49278-8, 2019. a
Smakhtin, V. U. and Schipper, E. L. F.: Droughts: The impact of semantics and perceptions, Water Pol., 10, 131–143, https://doi.org/10.2166/wp.2008.036, 2008. a
Somogyvári, M., Scherer, D., Bart, F., Fehrenbach, U., Okujeni, A., and Krueger, T.: A hybrid data-driven approach to analyze the drivers of lake level dynamics, Hydrol. Earth Syst. Sci., 28, 4331–4348, https://doi.org/10.5194/hess-28-4331-2024, 2024. a, b
Somogyvári, M., Brill, F., Tsypin, M., Rihm, L., and Krueger, T.: Regional-scale groundwater analysis with dimensionality reduction, Nat. Hazards Earth Syst. Sci., 25, 4613–4628, https://doi.org/10.5194/nhess-25-4613-2025, 2025. a
Spinoni, J., Vogt, J. V., Naumann, G., Barbosa, P., and Dosio, A.: Will drought events become more frequent and severe in Europe?, Int. J. Climatol., 38, 1718–1736, https://doi.org/10.1002/joc.5291, 2018. a
Stagge, J. H., Kohn, I., Tallaksen, L. M., and Stahl, K.: Modeling drought impact occurrence based on meteorological drought indices in Europe, J. Hydrol., 530, 37–50, https://doi.org/10.1016/j.jhydrol.2015.09.039, 2015. a
Svoboda, M. D. and Fuchs, B. A.: Handbook of drought indicators and indices (Vol. 2), World Meteorological Organization (WMO) and Global Water Partnership (GWP), Geneva, 52 pp., ISBN 978-92-63-11173-9, 2016. a
Tourian, M. J., Elmi, O., Shafaghi, Y., Behnia, S., Saemian, P., Schlesinger, R., and Sneeuw, N.: HydroSat: geometric quantities of the global water cycle from geodetic satellites, Earth Syst. Sci. Data, 14, 2463–2486, https://doi.org/10.5194/essd-14-2463-2022, 2022. a
Tsypin, M., Cacace, M., Guse, B., Güntner, A., and Scheck-Wenderoth, M.: Modeling the influence of climate on groundwater flow and heat regime in Brandenburg (Germany), Front. Water, 6, 1353394, https://doi.org/10.3389/frwa.2024.1353394, 2024. a
Tucker, C. J.: Red and photographic infrared linear combinations for monitoring vegetation, Remote Sens. Environ., 8, 127–150, 1979. a
Van Loon, A. F.: Hydrological drought explained, Wiley Interdisciplinary Reviews: Water, 2, 359–392, https://doi.org/10.1002/wat2.1085, 2015. a, b
Vicente-Serrano, S. M., Beguería, S., and López-Moreno, J. I.: A multiscalar drought index sensitive to global warming: The standardized precipitation evapotranspiration index, J. Climate, 23, 1696–1718, https://doi.org/10.1175/2009JCLI2909.1, 2010. a
Vicente-Serrano, S. M., López-Moreno, J. I., Beguería, S., Lorenzo-Lacruz, J., Azorin-Molina, C., and Morán-Tejeda, E.: Accurate computation of a streamflow drought index, J. Hydrol. Eng., 17, 318–332, https://doi.org/10.1061/(ASCE)HE.1943-5584.0000433, 2012. a
Vörösmarty, C. J., Green, P., Salisbury, J., and Lammers, R. B.: Global water resources: vulnerability from climate change and population growth, Science, 289, 284–288, 2000. a
Xiao, L., Guo, C., Zheng, C., Lu, Z., Khan, M. A., Zhou, J., and Wu, X.: Dense vegetation as a natural buffer: Mitigating and decelerating drought propagation, J. Environ. Manage., 389, 126027, https://doi.org/10.1016/j.jenvman.2025.126027, 2025. a
Yihdego, Y., Vaheddoost, B., and Al-Weshah, R. A.: Drought indices and indicators revisited, Arab. J. Geosci., 12, 1–12, https://doi.org/10.1007/s12517-019-4237-z, 2019. a
Zeileis, A. and Hothorn, T.: lmtest: Diagnostic checking in regression relationships, R News, 2, 7–10, https://CRAN.R-project.org/doc/Rnews/ (last access: 17 March 2026), 2002. a
Zhong, R., Zhao, T., Chen, X., and Jin, H.: Monitoring drought in ungauged areas using satellite altimetry: The Standardized River Stage Index, J. Hydrol., 612, 128308, https://doi.org/10.1016/j.jhydrol.2022.128308, 2022. a, b
Zink, M., Kumar, R., Cuntz, M., and Samaniego, L.: A high-resolution dataset of water fluxes and states for Germany accounting for parametric uncertainty, Hydrol. Earth Syst. Sci., 21, 1769–1790, https://doi.org/10.5194/hess-21-1769-2017, 2017. a
Zolghadr-Asli, B., Enayati, M., Pourghasemi, H. R., Naghdyzadegan Jahromi, M., and Tiefenbacher, J. P.: Application of Granger-causality to study the climate change impacts on depletion patterns of inland water bodies, Hydrol. Sci. J., 66, 1767–1776, https://doi.org/10.1080/02626667.2021.1944633, 2021. a