the Creative Commons Attribution 4.0 License.
the Creative Commons Attribution 4.0 License.
 | 30 Jun 2026
The catastrophic floods in 2008, 2010 and 2020 in western Ukraine: Hydrometeorological processes and the role of upper-level dynamics
Moshe Armon
Michael Sprenger
Heini Wernli
Western Ukraine has encountered significant challenges due to three extensive summer rainfall events and major floods in July 2008, July 2010, and June 2020, resulting in numerous fatalities and substantial economic damage. This study investigates the hydrometeorological conditions, as well as the atmospheric processes, that led to these three devastating flood events in the basins of the Tisza, Prut, Siret, and Dniester rivers in western Ukraine. Emphasis is placed on the role of upper-level potential vorticity (PV) structures, analyzed through two complementary approaches: (1) case studies linking the surface weather evolution with upper-level PV dynamics, and (2) a climatological composite analysis on the link between precipitation and upper-level PV, including 22 heavy precipitation events in the period 2000–2022, using reanalysis (ERA5) and satellite-based (IMERG) datasets. The results show that all three floods were driven by multi-day heavy precipitation events, which differed in intensity, spatial extent, and dominant forcing mechanisms. The 2008 event was the most severe, associated with a PV cutoff, intense moisture transport, and extreme precipitation, leading to river levels surpassing historical records. In contrast, the heavy precipitation in July 2010 was driven primarily by direct upper-level dynamic forcing and less moisture transport, which probably caused more localized flooding. The flood in 2020 was notable for its hydrological complexity and evolved more rapidly than the 2008 flood. This event was characterized by remote PV influence, with moisture advection and mesoscale processes playing a more prominent role. In all cases, a persistent atmospheric block hindered the eastward movement of PV structures, maintaining quasi-stationary conditions of prolonged precipitation and moist low-level flow continuously advected against the Carpathian Mountains. Also worth noting, both the 2010 and 2020 events were preceded by several episodes of prolonged precipitation, resulting in saturated soil, gradually increasing river levels and creating favorable conditions for subsequent flooding. The climatological analysis further confirms the strong association between upper-level PV structures and heavy precipitation in the region: 64 % of them are associated with a PV streamer, 23 % with a PV cutoff, and 13 % with combined occurrences of PV streamers and cutoffs. The amplitude and frequency of upper-level PV cutoffs and streamers associated with the heavy precipitation events are largest over eastern Europe, particularly in Romania and Slovenia, pointing out the significance of PV dynamics for heavy precipitation and flood generation in western Ukraine.
- Article
(34827 KB) - Full-text XML
-
Supplement
(1243 KB) - BibTeX
- EndNote


Floods constitute a high-impact natural hazard world-wide and are likely to cause even greater damage in a warmer climate (e.g., Blöschl et al., 2019; Gudmundsson et al., 2021). According to a World Economic Forum report, they pose the highest acute risk of climate-induced deaths and could kill as many as 8.5 million people by 2050 (World Economic Forum, 2024). Rapidly forming and sudden floods, so-called flash floods, often cause severe damage. There is growing evidence that these events are becoming increasingly frequent (Alberton et al., 2017; Blöschl et al., 2017; Didovets et al., 2019). In recent decades, floods and flash floods have severely affected many parts of the world and their meteorological causes were studied thoroughly: for instance, Pakistan, India and China in summer 2010 (Houze et al., 2011; Martius et al., 2012; Thayyen et al., 2013), southern Iran in 2019–2020 (Miri et al., 2023), the Negev desert in southern Israel in 2018 (Rinat et al., 2021), in the contiguous USA (Chu et al., 2025) and Southeast Brazil (Mantovani et al., 2024) and Northern Africa (Armon et al., 2025) in 2023. For Europe, a review of climate change projections of 1-d precipitation extremes and floods (Madsen et al., 2014) indicated a general increase in extreme precipitation under a future climate, consistent with the observed trends, although its influence on floods is more complicated (Blöschl et al., 2019; Sharma et al., 2018). Prominent recent examples in Europe are floods in Valencia in 2024 (Morote et al., 2025), in Austria, Germany and the Czech Republic in the same year (Riboldi et al., 2026), in the Emilia-Romagna in June 2023 (Dorrington et al., 2024) and in Palermo in July 2020 (Francipane et al., 2021), as well as the central European floods in August 2002 (Ulbrich et al., 2003) and in June 2013 (Grams et al., 2014). Within this broader European context, eastern Europe has also experienced recurrent large-scale flooding, notably in May 2010 (Winschall et al., 2014; Romanescu and Stoleriu, 2017), when the Ukrainian Carpathians were among the most affected regions (ICPDR, 2012). The Carpathians represent one of the most flood-prone mountainous regions in Europe, particularly along the Tisza River basin on the southern slopes and the Dniester River basin on the northeastern slopes. Major floods in these areas have been observed multiple times in the last 50 years (Stefanyshyn, 2022; Snizhko et al., 2023). The last three catastrophic floods and heavy precipitation events in western Ukraine in 2008, 2010, and 2020, affected much of the catchments in the Carpathian region. They caused many fatalities and produced major economic disruptions (State Agency of Water Resources of Ukraine, 2025), and are therefore investigated in detail in this study. For instance, in 2008, as reported by the World Health Organization (WHO report, 2021) and the State Agency of Water Resources of Ukraine, the consequences of the flood included the death of 39 people. Approximately 41 000 residential buildings and 34 000 ha of agricultural land were submerged. The flood also caused significant infrastructure damage, destroying 671 km of highways, 561 pedestrian bridges, 31 km of protective dams and 29 km of coastal fortifications. The total damages from this flood in the Carpathian region amounted to around UAH 2 billion, corresponding at the time to about USD 300 million. This event is considered one of the most severe floods in western Ukraine during the past 60 years. In 2010, as reported by the official assessment (Ukraine Floods: Final Report, 2011), the disaster affected nearly 40 000 people, resulting in five fatalities. A total of 347 settlements were impacted, approximately 15 000 ha of agricultural land were inundated, and 272 highway and 251 pedestrian bridges were destroyed. The total economic damage from the 2010 flood in western Ukraine was estimated to exceed UAH 900 million, i.e., a bit less than half of the damage incurred by the event in 2008. In 2020, according to the Ukrainian Red Cross Society (URCS) and Caritas (Ukraine Floods: Final Report, 2020), a rapid rise of the water levels led to the flooding of 349 settlements and 14 300 houses. The floods also caused damage to over 940 km of roads, more than 140 km of bank protection, and over 300 bridges. More than 55 000 people were affected by the disaster, with 39 000 of those in the hardest-hit Ivano-Frankivsk region, where three fatalities were reported. The estimated damage from the disaster was at least UAH 4 billion, corresponding at the time to about USD 150 million, i.e., about half of the damage cost estimated for the most severe event in 2008.
As in other mountainous regions of Europe (e.g., in the Alps, Stucki et al., 2012; Lenggenhager et al., 2018), heavy precipitation in the Carpathian region is often closely linked to the presence of specific upper-level flow features like cutoff low-pressure systems (COLs, Nieto et al., 2008) and surface cyclones (Agayar et al., 2024), atmospheric blocks (Sousa et al., 2017; Lenggenhager and Martius, 2019), and the influence of orography (Kholiavchuk and Cebulska, 2019; Torma and Giorgi, 2020). To improve our understanding and the ability to predict floods, it is important to investigate the key large-scale dynamic processes that lead to the heavy precipitation associated with these events. COLs are formed because of Rossby wave breaking (RWB), which may occur when a Rossby wave strongly amplifies and undergoes a nonlinear evolution. One type of Rossby wave breaking, the anticyclonic wave breaking, typically culminates in the formation of narrow high-amplitude troughs, which are often referred to as potential vorticity (PV) streamers (Martius et al., 2006; Moore et al., 2019), and COLs (or PV cutoffs, Portmann et al., 2021). COLs are usually identified as regions on isentropic surfaces where PV values exceed 2 PVU and are isolated from the main stratospheric high-PV reservoir. PV cutoffs are inherently the same phenomenon as COLs (Bell and Bosart, 1993). Since some COLs are relatively long-lived and stationary, they can play an essential role in the formation of multi-day precipitation extremes (Porcu et al., 2003; Givon et al., 2024) and are potential dynamical precursors of unusually long-lasting wet spells (Röthlisberger et al., 2022). These large-scale features typically develop several days before the onset of heavy precipitation and are generally more predictable than local precipitation itself, as suggested for instance by Massacand et al. (1998) and shown in the detailed analysis of the Emilia-Romagna flood in 2023 by Dorrington et al. (2024). Therefore, incorporating PV diagnostics provides valuable dynamical context for identifying synoptic conditions favorable for persistent or extreme rainfall. As a result, monitoring PV structures may improve medium-range predictability and extend the lead time of flood early-warning systems, complementing precipitation forecasts that often remain uncertain at longer lead times.
This study explores the atmospheric processes leading to the three most recent catastrophic floods in the basins of the Tisza, Dniester, Prut, and Siret in western Ukraine in the summers of 2008, 2010, and 2020. The reasons for these floods have been investigated in some studies, but they mostly focused on specific regions or individual events. For instance, Kovalets et al. (2015) studied the flood event in the Uzh river basin in July 2008 using a mesoscale meteorological and distributed hydrological model chain. Pirnach et al. (2010) considered microphysical mechanisms leading to the heavy precipitation for the same event. The meteorological causes and socio-economic consequences of the events were studied for the lower part of the Siret and Prut river basins in Romania (Romanescu et al., 2018; Ionita and Nagavciuc, 2021). However, a comprehensive analysis and comparison of the three events, with a focus on the larger-scale dynamical precursors that incorporate relevant climatological aspects, has yet to be conducted. Thus, the goals of this article are: (i) to investigate the hydrological and meteorological characteristics of the catastrophic floods of 2008, 2010 and 2020 in western Ukraine; (ii) to study the key large-scale flow features and how the upper-level PV evolved during those floods; (iii) to identify potential differences among these flood events; and (iv) to examine the events in a broader climatological context.
After providing a concise overview of the data and methods in Sect. 2, we describe the main aspects of the three heavy precipitation events in Sect. 3. This main part of the study includes a hydrological overview, analysis of precipitation observations, an overview of the large-scale and local-scale flow characteristics. A climatological analysis is presented in Sect. 4. Finally, we discuss and summarize the main outcomes of our study in Sects. 5 and 6.
2.1 Study area
The four main rivers in the Ukrainian Carpathians, Tisza, Prut, Siret, and Dniester are part of the Danube and Dniester catchments (see Table S1 in the Supplement). These catchments, along with the topography of the study region, are marked in Fig. 1. The Tisza basin spans across five countries: Ukraine, Romania, Slovakia, Hungary, and Serbia and is the largest sub-basin within the Danube basin (19.5 % of the total area). The Ukrainian segment of the Tisza catchment covers 12 810 km2 and is entirely situated within the Transcarpathia region. Climatologically, the eastern part receives the highest precipitation with up to 1500 mm annually. Precipitation gradually decreases towards the lowlands to approximately 700 mm. According to hydrological observations, during floods, the water level can rise by 5–6 m (Stefanyshyn, 2022). The Prut is a left tributary of the Danube with a length of 299 km within the borders of Ukraine. It originates on the northeastern slopes of the Carpathians at an altitude of 1750 m. In the mountainous part of the basin, annual precipitation reaches up to 1000 mm. The Siret is another left tributary of the Danube, meeting the Danube approximately 187 km from its source near Galati, Romania. The upper part of the basin within Ukraine is situated in the eastern Carpathians. Typically, flooding in the Siret catchment occurs in March in association with snow melting. However, during rainfall-induced floods, the maximum water levels tend to exceed those observed during the spring floods. The highest annual peak discharges occur during the warm season and are characterized by rapid and intensive development, what also is typical for Tisza and Prut basins. For example, according to Moskalenko and Malytska (2021), the time interval between the onset of the precipitation core and the flood peak for catchments with an area of 1000–1200 km2 does not exceed 6–10 h. Finally, the Dniester is the largest river in western Ukraine and Moldova. It originates in the Ukrainian Carpathians (the height of the river source is 760 m), traverses Moldova, and empties into the Black Sea. Peak discharges of the Dniester are primarily attributed to either the spring thaw or extensive heavy precipitation in summer and autumn.
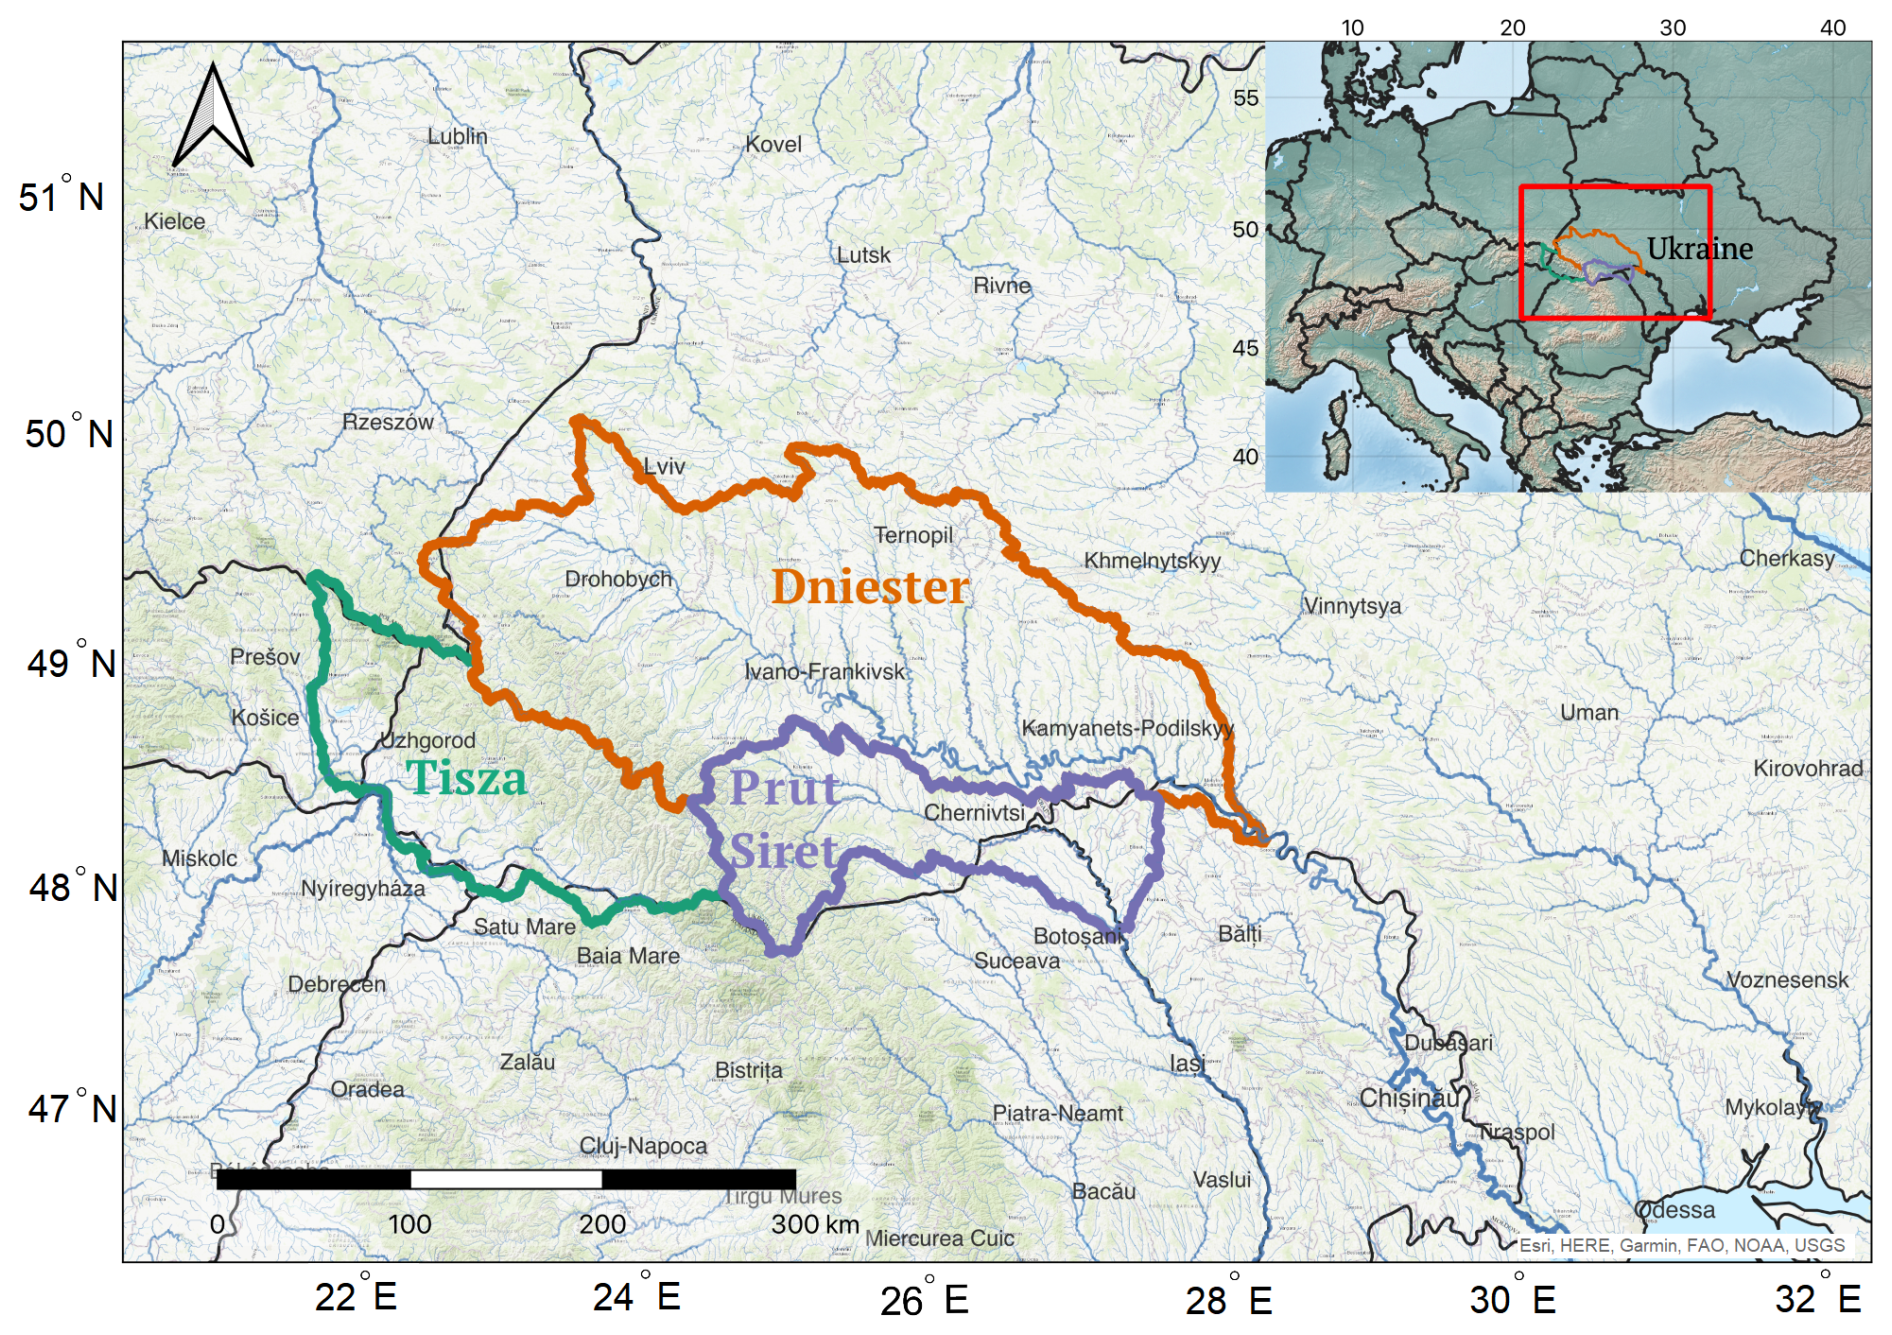
Figure 1Drainage map of the study region, showing the catchments of rivers Dniester, Tisza, Prut and Siret, as well as their major tributary rivers. Source: NaturalEarth (https://www.naturalearthdata.com/, last access: 11 January 2025), and ESRI World Topo map (Sources: Esri, HERE, Garmin, FAO, NOAA, USGS, ©OpenStreetMap contributors, and the GIS User Community | Powered by Esri). To delineate the catchments used in this study, we aggregated catchments from the hydroSHEDS V1 database (Zoom level = 7; Lehner et al., 2008).
Floods occur throughout the entire summer season in the river's upper stretches. During flood events, the water level in the Dniester rises rapidly, often at a rate of 50–60 cm h−1. In the case of major floods, the water level peaks within 1–2 d (Vyshnevskyi and Kutsiy, 2022).
2.2 Data and methods
For this study, we use multiple datasets. Absolute water level values during floods were obtained from the hydrological observations for those periods provided by the Department of Hydrological Forecasts of the Ukrainian Hydrometeorological Center. Data from 66 automatic gauges were used. From these measurements, we defined flood magnitude (M, in %) as the ratio between the specific flood depth compared to the maximum historically observed depth as follows.
where Hmax is the maximum height of the specific flood, the historic minimum level is Hminh and the historic maximum height is Hmaxh.
Values M>100 % denote events that exceed the previously recorded maximum height of the river. Given that full historical records, continuous discharge measurement, and flood return periods could not be obtained, we used flood magnitude as a measure for the severity of the event. It is important to note the reported flood magnitude addresses river depth rather than discharge. Given a linear increase in river depth, we can expect a linear increase in river cross-section and a power law increase in water flow velocity (e.g., Chow, 1959).
To evaluate the amount of rainfall, we used daily precipitation observations from 21 meteorological stations. Because of the convective nature of some of the highest precipitation events in this area, we supplemented the station data with satellite-based precipitation fields from the Final Run IMERG V07 dataset (Huffman et al., 2023), which estimates global surface precipitation rates at a high spatial resolution of 0.1° every 30 min. The IMERG dataset was selected for precipitation analysis owing to its higher spatial resolution and more accurate representation of precipitation intensity compared to ERA5. For reference, precipitation distributions from ERA5 for the three flood events are presented in the Supplement (Fig. S1).
The synoptic evolution during the core period of the floods is investigated with daily sequences of isentropic PV charts and maps of mean sea level pressure, equivalent potential temperature at 850 hPa, and geopotential height at 500 hPa. For this, we used the global atmospheric reanalysis dataset of the European Centre for Medium-Range Weather Forecasts ERA5 (Hersbach et al., 2020). All fields were interpolated to a regular grid with a spatial resolution of 0.5° longitude × 0.5° latitude and available with a temporal resolution of 1 h. To investigate the dynamical processes in terms of PV, stratospheric PV streamers and PV cutoffs were identified every hour on different isentropes following the methodology of Wernli and Sprenger (2007), but we will focus on PV at 330 K, a usually convenient isentrope to study mid-latitude flow dynamics in summer (Hoskins et al., 1985). PV is calculated in the standard way, as the scalar product of the vorticity vector and the gradient of potential temperature, divided by density (Holton and Hakim, 2013). Both IMERG and ERA5 cover the period 2000–2022, which allows for a coherent investigation of the link between PV structures and heavy precipitation observed by satellite. Synoptic charts focusing on the core period of the floods are presented in Figs. 5, 8, 9, and 12, while the Video Supplement illustrates atmospheric processes associated with these events in a broader spatio-temporal context.
3.1 Selection of cases
To obtain a first impression of the temporal evolution of precipitation and the associated upper-level PV dynamics during the three events, Fig. 2 shows time series of precipitation and the occurrence of PV streamers and cutoffs, covering the period from 30 d before the onset of each event to 5 d after its end. The area with PV in southeastern Europe is defined as the region between 15–35° E and 40–55° N (see Fig. 13, brown box). The frequency of PV structures during extreme precipitation days is quantified using binary () masks, where a value of 1 is assigned to grid points located within a PV streamer or cutoff, and 0 otherwise. The cases differ in terms of the time evolution of precipitation and share similarities in terms of upper-level PV structures. The method to determine the link between precipitation and the PV structures is described in more detail in Sect. 4.
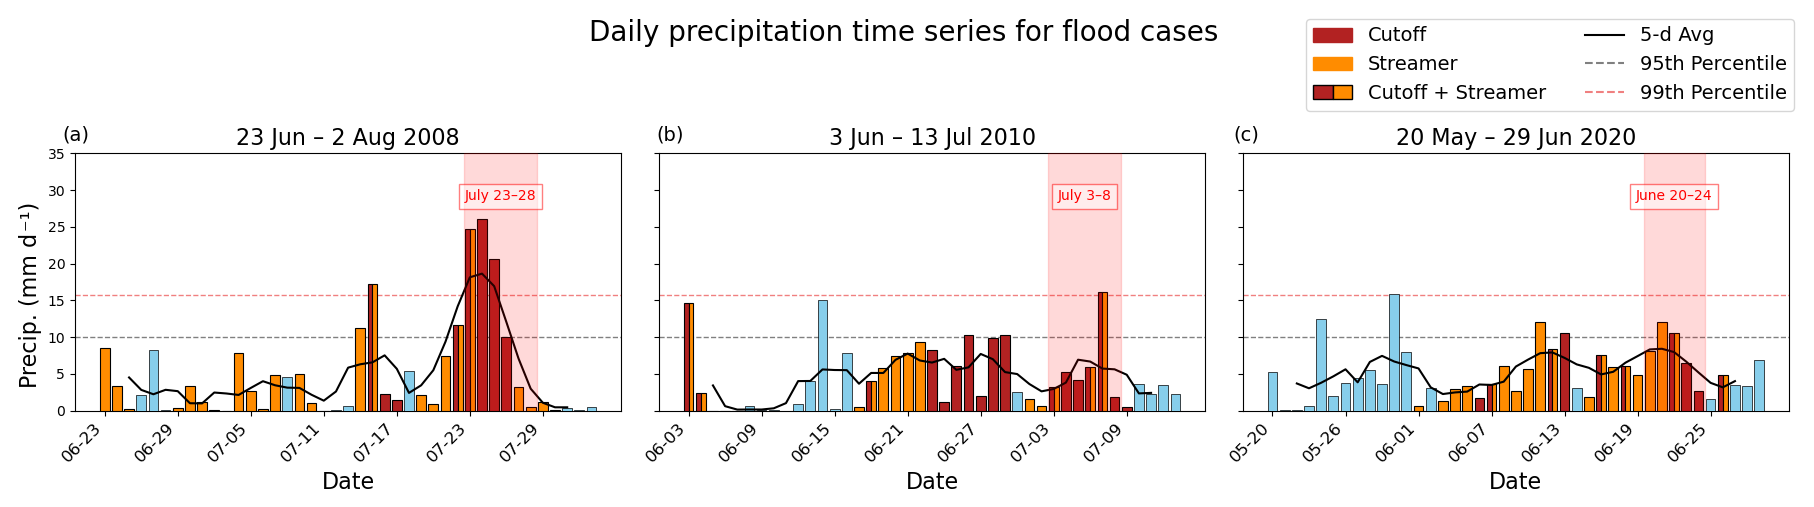
Figure 2Time series of daily precipitation from IMERG, averaged in the rectangular box (15–35° E and 40–55° N), for the three case studies (the main flood events are marked by pink shading). The bars are color-coded to distinguish between precipitation events related to PV cutoffs (red), PV streamers (orange), a combination of the two (red and orange), and those not related to PV structures (blue). The black line shows a 5 d rolling average, and the grey and pink dashed lines denote the 95th and 99th percentiles of climatological summer precipitation, respectively.
The first event (Fig. 2a), on 23–28 July 2008, is the most intense, with three consecutive days far exceeding the 99th precipitation percentile at the onset of the flood event. The month before the event had several wet episodes, but accumulated precipitation during the pre-event phase was clearly smaller than for the other two events. The main event was initiated by the formation of a PV streamer that transformed into a PV cutoff, which persisted during the extreme precipitation period. The second event (Fig. 2b), on 3–8 July 2010, also features 1 d with extreme precipitation beyond the 99th percentile, but during the event onset, averaged precipitation was modest and clearly below the 95th percentile. However, this event was linked to an extended, about two-week period of heavy precipitation with persistent PV structures before the flood, which acted as a preconditioning phase of the hydrological extreme. Both during this preconditioning phase and the main flood event, precipitation was related with upper-level PV features. The third event (Fig. 2c), on 20–24 June 2020, had an even longer, about 4-week long preconditioning phase, again at most times associated with an upper-level PV structure, and eventually, like the 2nd case, comparatively modest precipitation (2 d above the 95th percentile) during the flood event itself. This extended preconditioning period contributed to soil saturation and the accumulation of conditions favorable to flooding. The following sections provide a more in-depth description of the three events, based on observations of river discharge and precipitation, and a more detailed analysis of the large-scale flow evolution.
3.2 The Case of 23–28 July 2008
3.2.1 Hydrological overview
According to the State Agency of Water Resources of Ukraine (2025), in late July 2008, an extreme rain flood occurred in western Ukraine (most severely in the Carpathian region), which, in terms of hydrological characteristics, was close to the historical high flood that occurred in this area in June 1969. Settlements in the valleys of the Dniester and Prut suffered from significant damage where flood magnitudes reached particularly high values. The flood could have been even more extensive, had it not been for the Dniester reservoir (marked as a black rectangle in Fig. 3) reducing the water inflow into the lower part of the Dniester catchment. The inflow into the reservoir was the largest in its history, with a maximum value of 5680 m3 s−1 (and an output discharge from the reservoir of 3400 m3 s−1) on 27 July. Figure 3 shows that in the Dniester basin the calculated flood magnitude exceeded 50 % at many Carpathian hydrological stations, and, at certain gauges near Ivano-Frankivsk it exceeded 100 %, reaching a maximum of 339 % further west at Skole. In the Prut and Siret basins, all stations experienced floods with magnitudes between 67 % and 100 %, with the highest value noted at Yablynytsya in the southwest of the catchment. In the Tisza basin, 32 out of 34 hydrological stations indicated floods, with magnitudes between 35 % and 100 %, with the highest value observed at Velykyi Bychkiv.
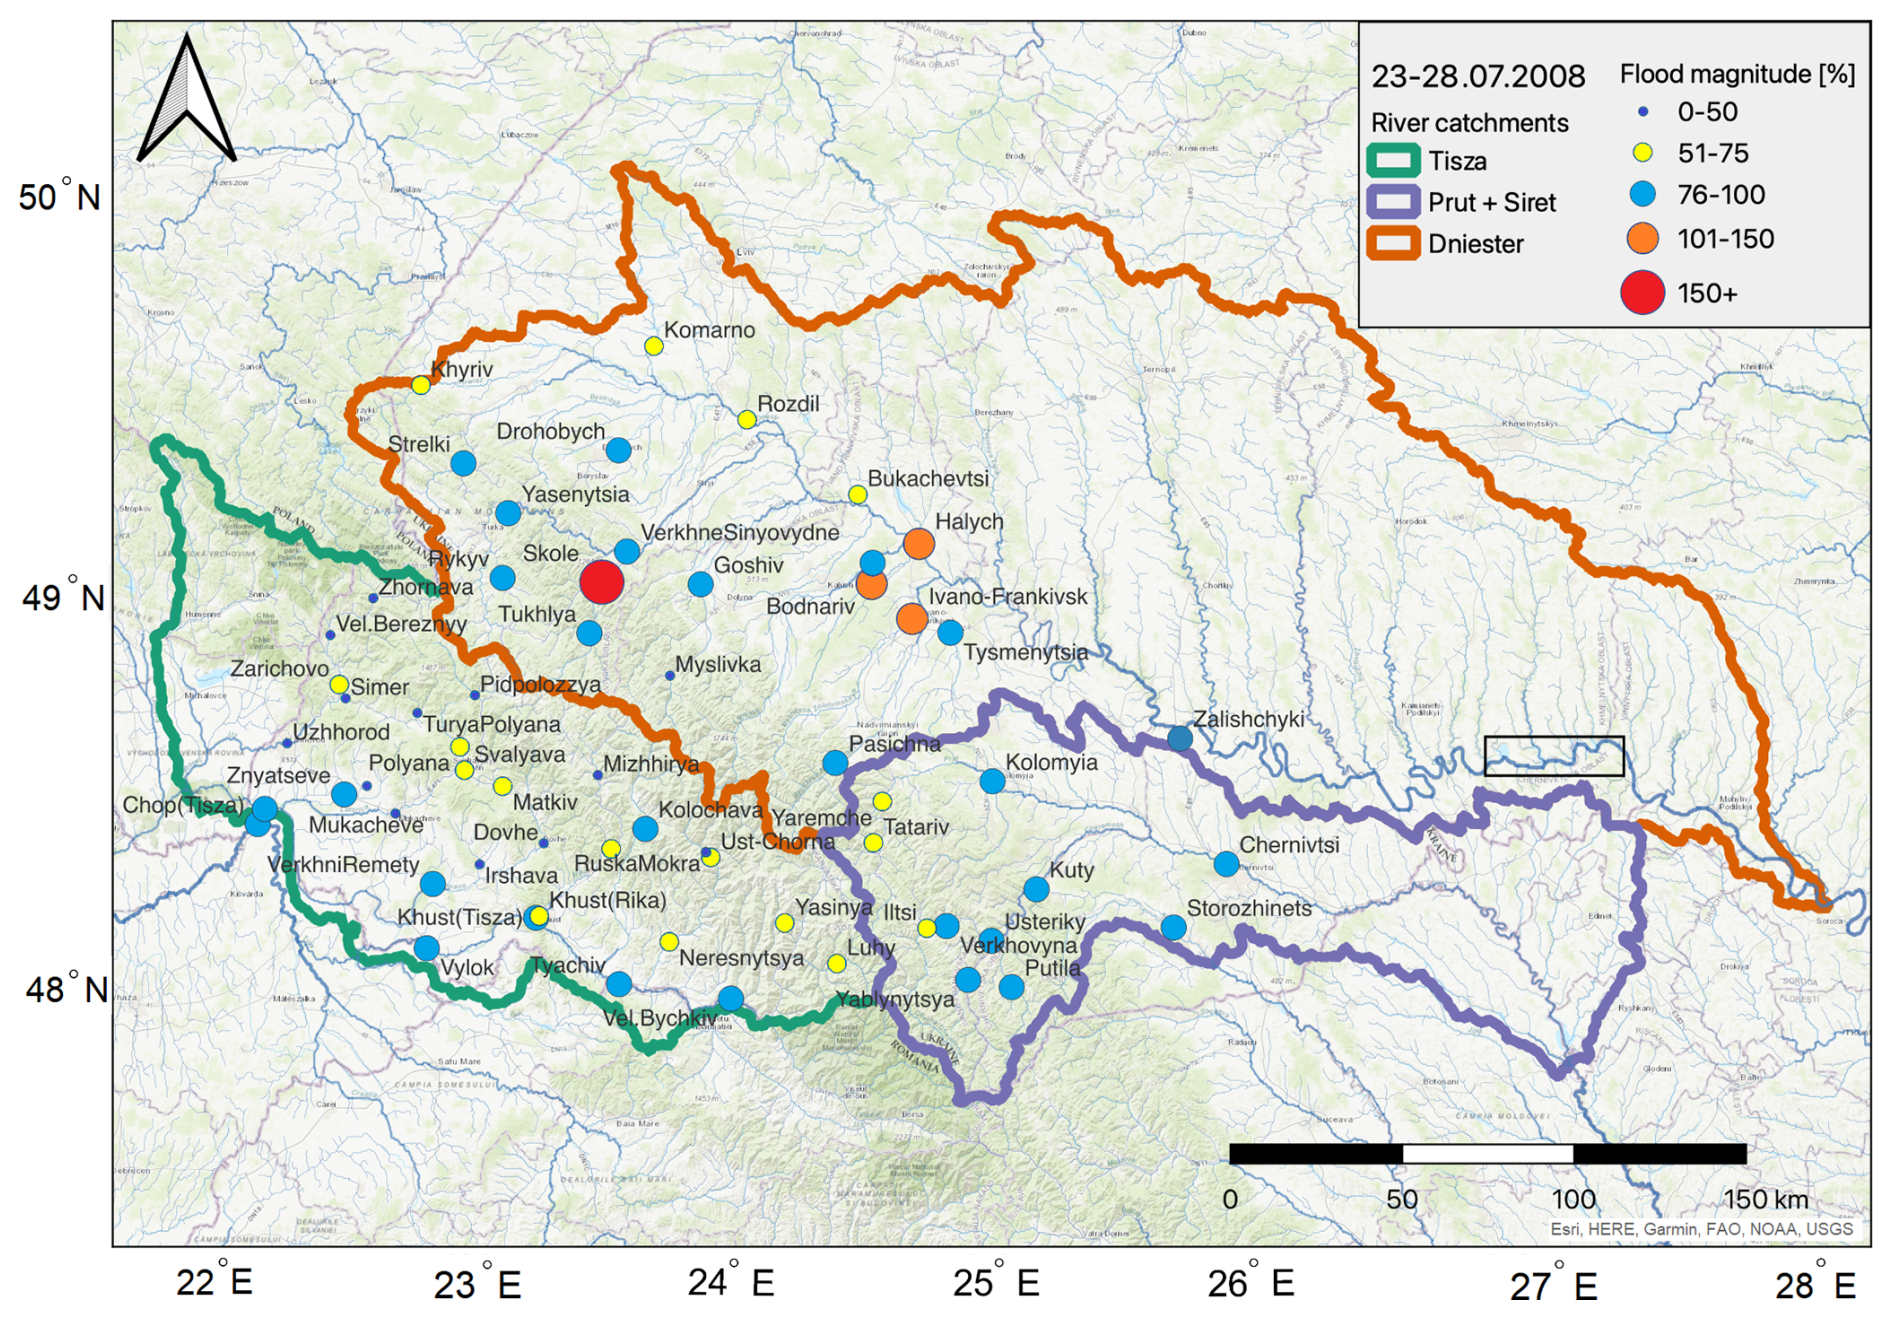
Figure 3Map of the flood-affected areas in three catchments in western Ukraine in July 2008. Orange and red dots mark flood magnitudes M>100 %; light blue, yellow and dark blue dots <100 % at the gauging stations. The black rectangle marks the location of the Dniester reservoir. Source: NaturalEarth (https://www.naturalearthdata.com/, last access: 11 January 2025), and ESRI World Topo map (Sources: Esri, HERE, Garmin, FAO, NOAA, USGS, ©OpenStreetMap contributors, and the GIS User Community | Powered by Esri). To delineate the catchments used in this study, we aggregated catchments from the hydroSHEDS V1 database (Zoom level =7; Lehner et al., 2008).
3.2.2 Observed precipitation
In the last 10 d of July 2008, heavy rainfall impacted the northwestern part of Ukraine. According to IMERG data, between 23–28 July, accumulated precipitation amounted to approximately 180 mm in the Prut and Siret catchments, 160 mm in the Dniester catchment, and around 120 mm in the Tisza River area (Fig. 4a). Maximum rainfall intensity recorded during this period reached 4–7 mm h−1 averaged over the Prut and Dniester River basins. The area impacted by precipitation exceeding 100 mm encompassed all three catchments (Fig. 4b). The first rainfall peak occurred on 23 July, with maximum precipitation recorded in the upper reaches of the Dniester, Prut, and Siret catchments, triggering a sharp rise in water levels in the rivers. The second precipitation maximum, recorded on 24–25 July, produced the highest rainfall intensity and affected all river basins. The third and final peak, occurring on 26 July, was largely restricted to the Tisza and Dniester basins. This 4-d precipitation sequence led to maximum inflow into the lower reaches of the Dniester on 27 July (see Sect. 3.2.1). An analysis of the spatial correspondence between IMERG data and surface observations showed satisfactory results. However, higher precipitation totals were recorded at individual stations compared to the spatially averaged estimates from IMERG. For instance, Yaremche in the Prut catchment recorded 324 mm of rain between 23–27 July, nearly double the normal July precipitation (Fig. S3a). This indicates that IMERG struggles to capture high-intensity, short-duration events in complex terrain.
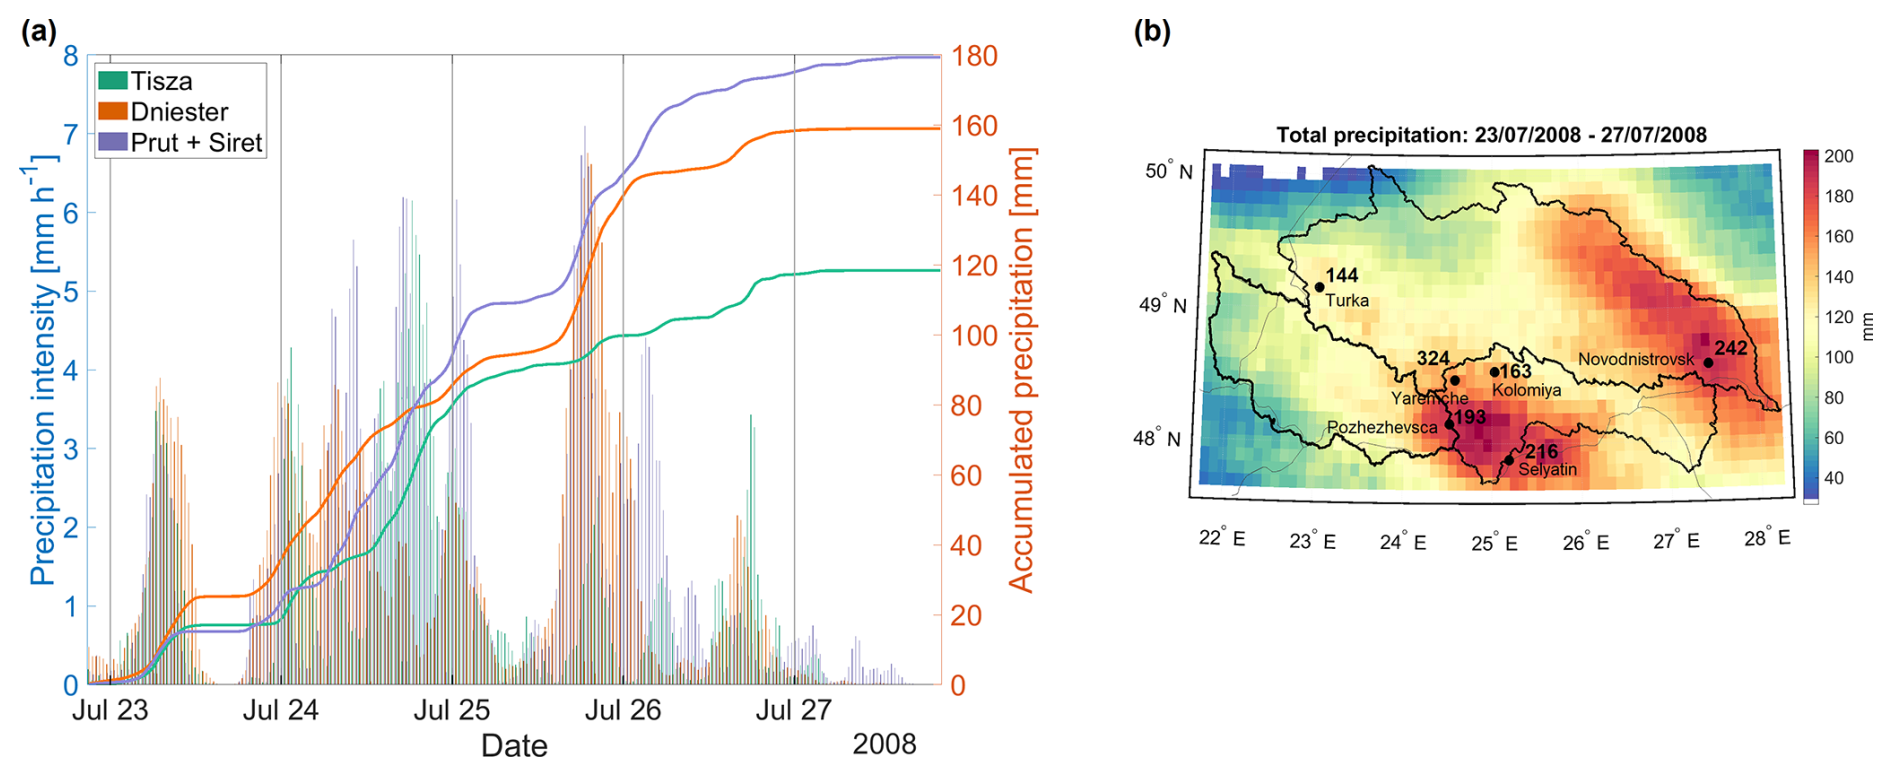
Figure 4Precipitation intensity and accumulation during the 2008 flood in western Ukraine (from IMERG). (a) Half hourly (left axis, bars) and accumulated (right axis, lines) precipitation averaged over each catchment, the black ticks along the x axis indicate 00:00 UTC of the respective day; (b) spatial distribution of 5 d accumulated precipitation in the study area. Numbers are accumulated precipitation values based on observations from meteorological stations (black dots indicate station locations).
In Novodnistrovsk in the Dniester catchment, precipitation reached 242 mm between 23 and 26 July, which is 2.5 times the monthly climatological average. Several other stations recorded precipitation amounts that surpassed historical daily maximum records.
Thus, in late July 2008, northwestern Ukraine experienced intense precipitation, with accumulated totals exceeding
100 mm across the Prut, Siret, Dniester, and Tisza catchments, triggering rapid river level rises, leading to peak inflow in the lower Dniester. At three gauge stations, specifically Yaremche, Novodnistrovsk, and Pozhezhevsca reported totals exceeded historical records.
3.2.3 Synoptic and PV analysis
At 12:00 UTC on 23 July 2008 (Fig. 5a, b), a quasi-stationary surface trough stretched from the Black Sea towards western Ukraine and the Balkans, and a broad upper-level trough extended from Scandinavia over southeastern Europe, where a closed circulation center had formed over the Balkans on the previous day (not shown). The driver of this process was Rossby wave breaking over central Europe leading to the formation of a PV streamer with high PV values (8–10 PVU) over the Balkans, which advected comparatively cool air over eastern Europe, including the flood regions in western Ukraine (red rectangle). The northern flank of the streamer on the 330 K isentrope was located along 50° N, affecting western and southwestern Ukraine (Fig. 5a). During the next hours, parts of the PV streamer separated from the main stratospheric high PV-reservoir, resulting in a PV cutoff at 330 K (see also Fig. 2a), and a COL over southeastern Europe by 18:00 UTC on 23 July (not shown).
During the subsequent 24 h, the PV cutoff remained stationary over southeastern Europe, reaching maximum intensity (8–11 PVU) over Serbia, Romania, and Bulgaria at all isentropic levels,pointing to its deep vertical extent (PV on 330 K is shown in Fig. 5c). This cutoff was completely surrounded by tropospheric air with near-zero PV values, and an area of heavy precipitation was located northeast of it. The strong southeasterly flow established between the PV cutoff and the downstream ridge advected warm and humid air into western Ukraine (Fig. 5d).
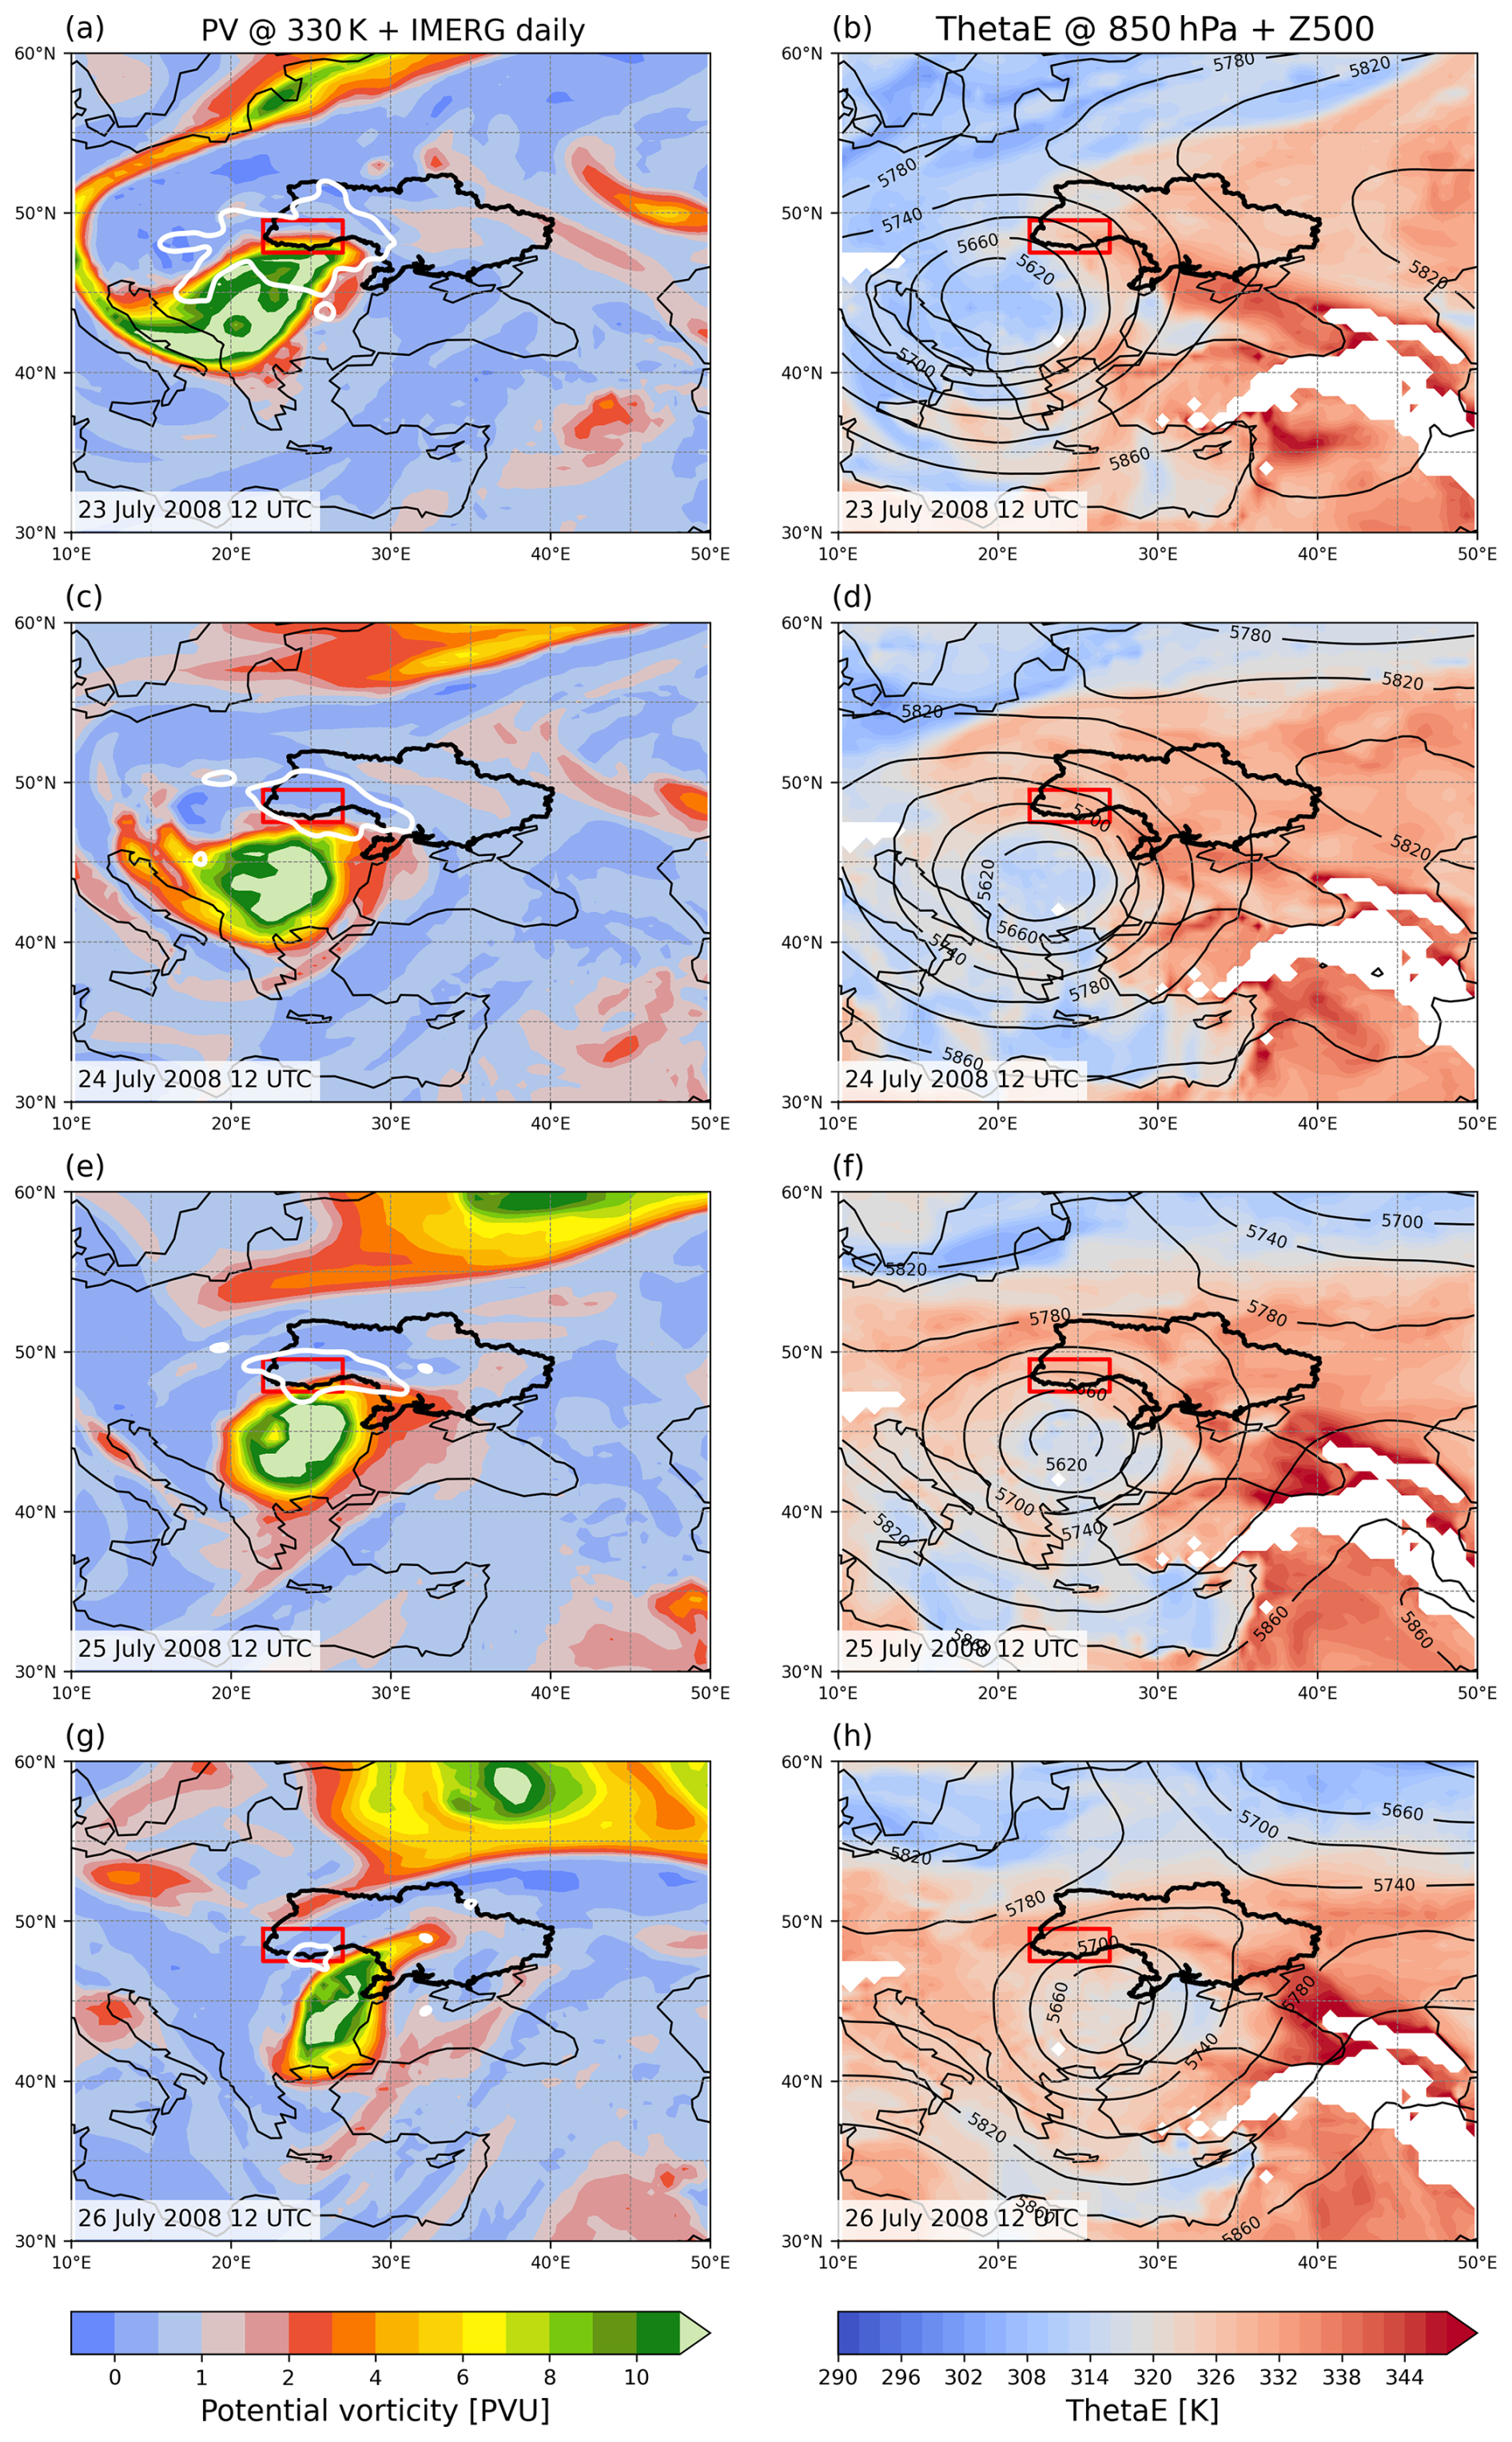
Figure 5Flood event on 23–27 July 2008 (see dates in bottom left of panels), based on ERA5. (a, c, e, g) show PV on 330 K (colour shading) and precipitation (white contours for 15 mm d−1; (b, d, f, h) show 850 hPa equivalent potential temperature (colour shading every 2 K) and 500 hPa geopotential height (black contours, every 40 m). The red rectangle highlights the region affected by the flood.
The horizontal low-tropospheric flow was directed perpendicular to the eastern Carpathians and persisted for a few days, causing forced orographic ascent along the eastern slope, which in turn, amplified precipitation. These weather conditions resulted in peak rainfall across all catchments on 24 July (Fig. 4a) and well-defined frontal cloud systems can be seen in the IR satellite image (Fig. S4a). On 25 July, the Scandinavian and southeastern blocking persisted, as well as the PV cutoff over western Ukraine (Fig. 5e, f), which appeared as a broad, quasi-circular cloud system (Fig. S4b). The isolation of a cold air pool over Bulgaria beneath the cutoff facilitated the advection of relatively cold air into the lower troposphere. This, combined with the ascent of warm air along the northeastern flank of the cutoff (Fig. 5f), enhanced low-level convergence and triggered intense precipitation from 18:00 UTC on 25 July. Similar large-scale conditions prevail 1 d later, on 26 July (Fig. 5g, h). The cyclonic system over Romania begins to weaken, and at the same time, the PV cutoff shifts southeastward toward the Black Sea but continues to influence the flood-affected regions. Precipitation is still generated, particularly along the western and northwestern flanks of the system. On 27 July, the PV cutoff deformed into an elongated PV filament and shifted to the east along the north coast of the Black Sea associated with the decay of the COL over southeastern Europe (not shown). Despite this, a minor area of precipitation over the flood-affected region persisted throughout the day.
Thus, Rossby wave breaking and the formation of an intense PV streamer were key in the development of a quasi-stationary PV cutoff (or COL) over eastern Europe. The eastward and northward movement of the COL was significantly hindered by a blocking system over the eastern European plain and Scandinavia. This COL persisted for approximately 4 d, continuously generating sustained precipitation predominantly along its northern flank, directly over the impacted areas. In addition, the orientation of the low-level horizontal flow was primarily perpendicular to the Carpathian Mountains, promoting orographic lifting on the windward slopes, and thus enhancing cloud formation and rainfall rates. In turn, the persistent precipitation and associated latent heat release in the mid-troposphere, might have contributed to upper-level ridge amplification and likely reinforced the blocking pattern (Pfahl et al., 2015).
3.3 The Case of 3–8 July 2010
The flooding in western Ukraine in July 2010 is one of numerous extreme weather events that unfolded during that year globally, including episodes of intense rainfall and flooding, as already noted in the Introduction, and the Russian heat wave and wildfires in July and August (Matsueda, 2011; Dole et al., 2011; Lau and Kim, 2012). While these extreme events are commonly addressed individually, it is plausible that some of them are interconnected. The focus here is on the connection between the Ukrainian flood event and the Russian heatwave. In the summer of 2010, the blocking anticyclone in Eurasia, associated with the Russian heatwave, persisted for about 50 d (Schneidereit et al., 2012). According to Trenberth and Fasullo (2012), a series of blocking anticyclones, manifesting as negative upper-level PV anomalies, prevented storms and frontal systems from reaching western Russia. The blocks persisted throughout July, and the blocking frequency reached values of twice the climatological frequency (Matsueda, 2011).
3.3.1 Hydrological overview
According to ICPDR (2012), this event was the final and most severe in a series of significant floods that affected western Ukraine and neighboring countries, including Poland, the Czech Republic, Slovakia, Hungary, Austria, and Serbia, between 10 May and 10 July 2010. In Ukraine, most severely impacted were the Uzhhorod, Chernivtsi, and Ivano-Frankivsk regions, which experienced precipitation totals in a few days equivalent to 2–4 months of climatological rainfall, resulting in a dramatic rise in river water levels. In the Dniester River basin, flood magnitudes reached 50 %–100 % at several stations and even 150 % at Skole and Bodnariv (Fig. 6).
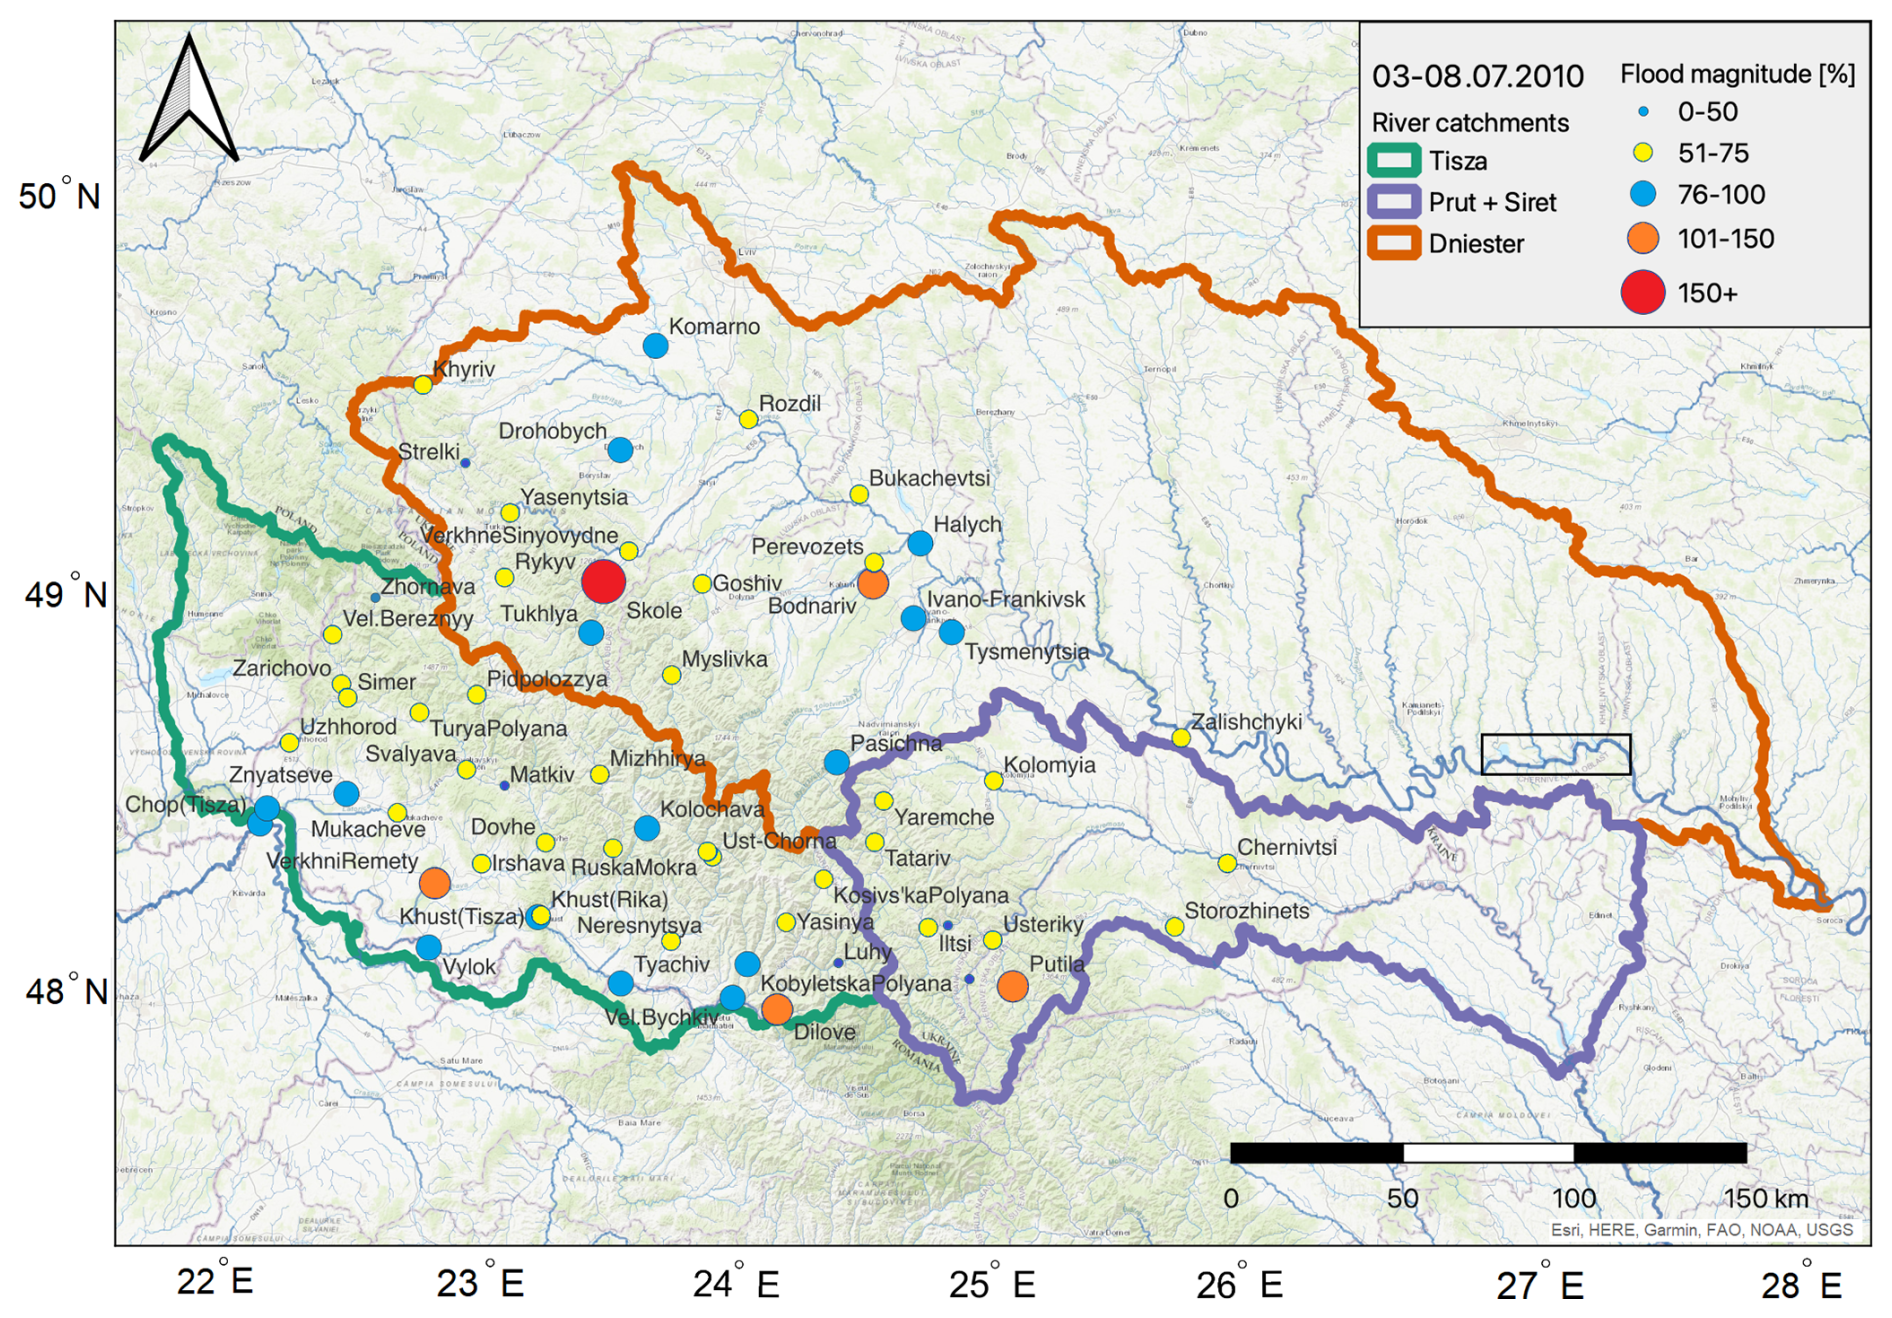
Figure 6As Fig. 3, but for the event on 3–8 July 2010. Source: NaturalEarth (https://www.naturalearthdata.com/, last access: 11 January 2025), and ESRI World Topo map (Sources: Esri, HERE, Garmin, FAO, NOAA, USGS, ©OpenStreetMap contributors, and the GIS User Community | Powered by Esri). To delineate the catchments used in this study, we aggregated catchments from the hydroSHEDS V1 database (Zoom level =7; Lehner et al., 2008).
In the Prut and Siret river basins, flood magnitudes reached 50 %–70 % at nine stations, and 100 % at Putyla. This flood affected the entire Tisza River basin, with flood magnitudes exceeding 50 % at all monitoring sites and values of about 100 % at Dilove and Khust. A series of rainfall-induced flood waves were recorded at the Dniester reservoir, with a maximum inflow of 3800 m−3 s−1 on 10 July (State Agency of Water Resources of Ukraine, 2025).
3.3.2 Observed precipitation
In May–July 2010, in the pre-flood period, precipitation occurred in several multi-day episodes, ultimately contributing to catastrophic flooding across central and eastern Europe (Romanescu and Stoleriu, 2017). In western Ukraine, the heavy rainfall events began in mid-May 2010, followed by a few additional waves of prolonged, high-intensity rainfall on 3–4, 13–16 and 18–30 June (Fig. 2b). Although these events fall outside the primary scope of this study, they warrant mention because they are significant as precondition processes that prepared the hydrological system for the catastrophic flooding observed at the beginning of July 2010 in western Ukraine.
In the latter half of May, the synoptic situation was characterized by a low-pressure system, related to PV cutoff, over central Europe and Italy, which then moved eastwards and reached southeast Europe (Bissolli et al., 2011). There it remained stationary and transported subtropical warm and moist air northwards from North Africa and the eastern Mediterranean towards the Carpathian Mountains. This induced orographically enhanced heavy precipitation in eastern Europe, including Western Ukraine. In Ukraine, the flood covered part of the Lviv and Ivano-Frankivsk regions, and most of the Zakarpattia region. High flood levels were recorded at the lower Tisza and Latorytsa. On 20 May Latorytsa at Chop reached 701 cm (the historical maximum being 750 cm) (ICPDR, 2012). A similar synoptic pattern occurred in late June, when another low-pressure system, also associated with a PV cutoff (Fig. 2b), induced intense rainfall over the same region. From 16 to 30 June, the Prut River Basin in Ukraine experienced 232 mm of precipitation, which is equivalent to 6 months' average rainfall, leading to a series of floods in the upper Prut basin (ICPDR, 2012). The final rainfall episode took place between 3–8 July, triggering extensive flooding in the Tisza, Dniester, Prut, and Siret River catchments, particularly affecting the Ivano-Frankivsk region. IMERG precipitation data indicated maximum accumulated rainfall over this period of approximately 60 mm in the Tisza catchment, 51 mm in the Dniester, and 46 mm in the Prut and Siret catchments (Fig. 7a). On 3–4 July, precipitation intensity remained relatively low, with averaged values around 0.5–1 mm h−1 across all three river basins.
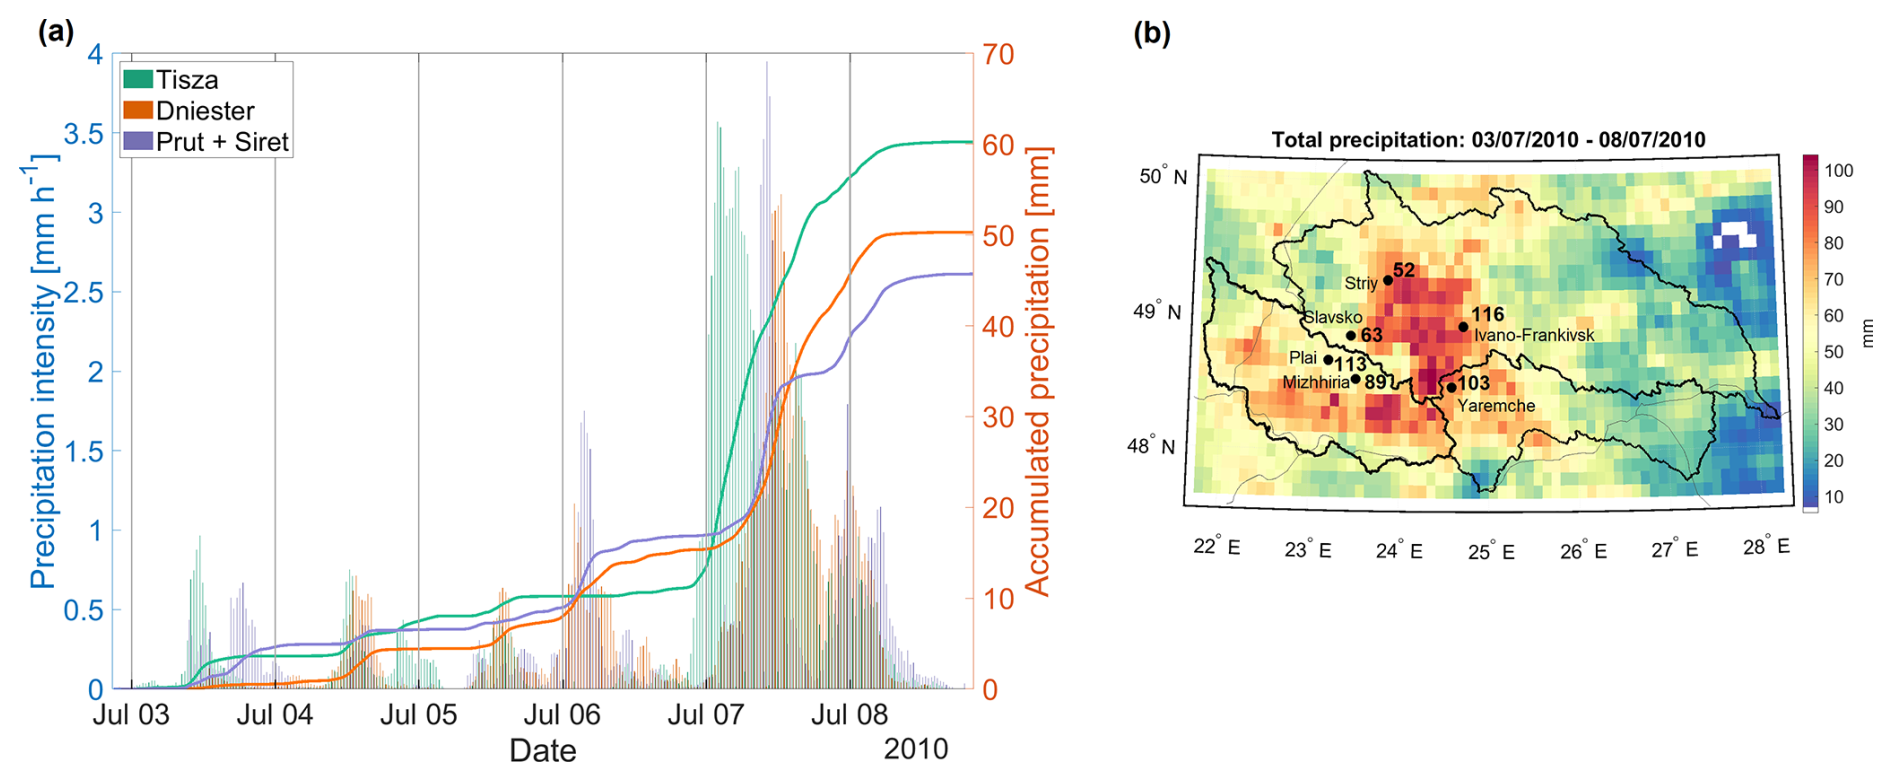
Figure 7As Fig. 4, but for the flood event on 3–8 July 2010.
During 7 July, peak precipitation intensity rose significantly in all three catchments, reaching 4 mm h−1 in the Dniester and Prut regions. The spatial pattern of rainfall during this event is complex. It features elongated precipitation bands across western Ukraine, impacting not only the Tisza and Prut catchments and upper reaches of the Dniester basin but also extending further north (Fig. 7b). According to station observations, the 24-h accumulated precipitation registered at Ivano-Frankivsk exceeded the July climatological precipitation by a factor of 1.2 (Fig. S3b).
In summary, precipitation accumulation during the 2010 flood occurred in several distinct periods, leading to increased soil moisture and a gradual increase in river water levels, as noted by Berghuijs et al. (2019). This served as a primary catalyst for large-scale flooding across much of Europe. The final precipitation episode, which occurred between 3–8 July, showed relatively moderate precipitation intensity peaking on 7 July.
3.3.3 Synoptic and PV analysis
On 3 July 2010, a surface anticyclone was located over the Scandinavian Peninsula and Baltic region (Fig. 8a), aligned with the presence of an upper-level ridge above Scandinavia (not shown). Meanwhile, an upper-level trough, stretching from northeastern Russia (Fig. 8b), advected cold air into western Ukraine. This trough is associated with a strong COL with high PV values (6–11 PVU), which formed due to an anticyclonic Rossby wave breaking downstream of the Scandinavian block (not shown) directly above the flood area (red rectangle in Fig. 8).
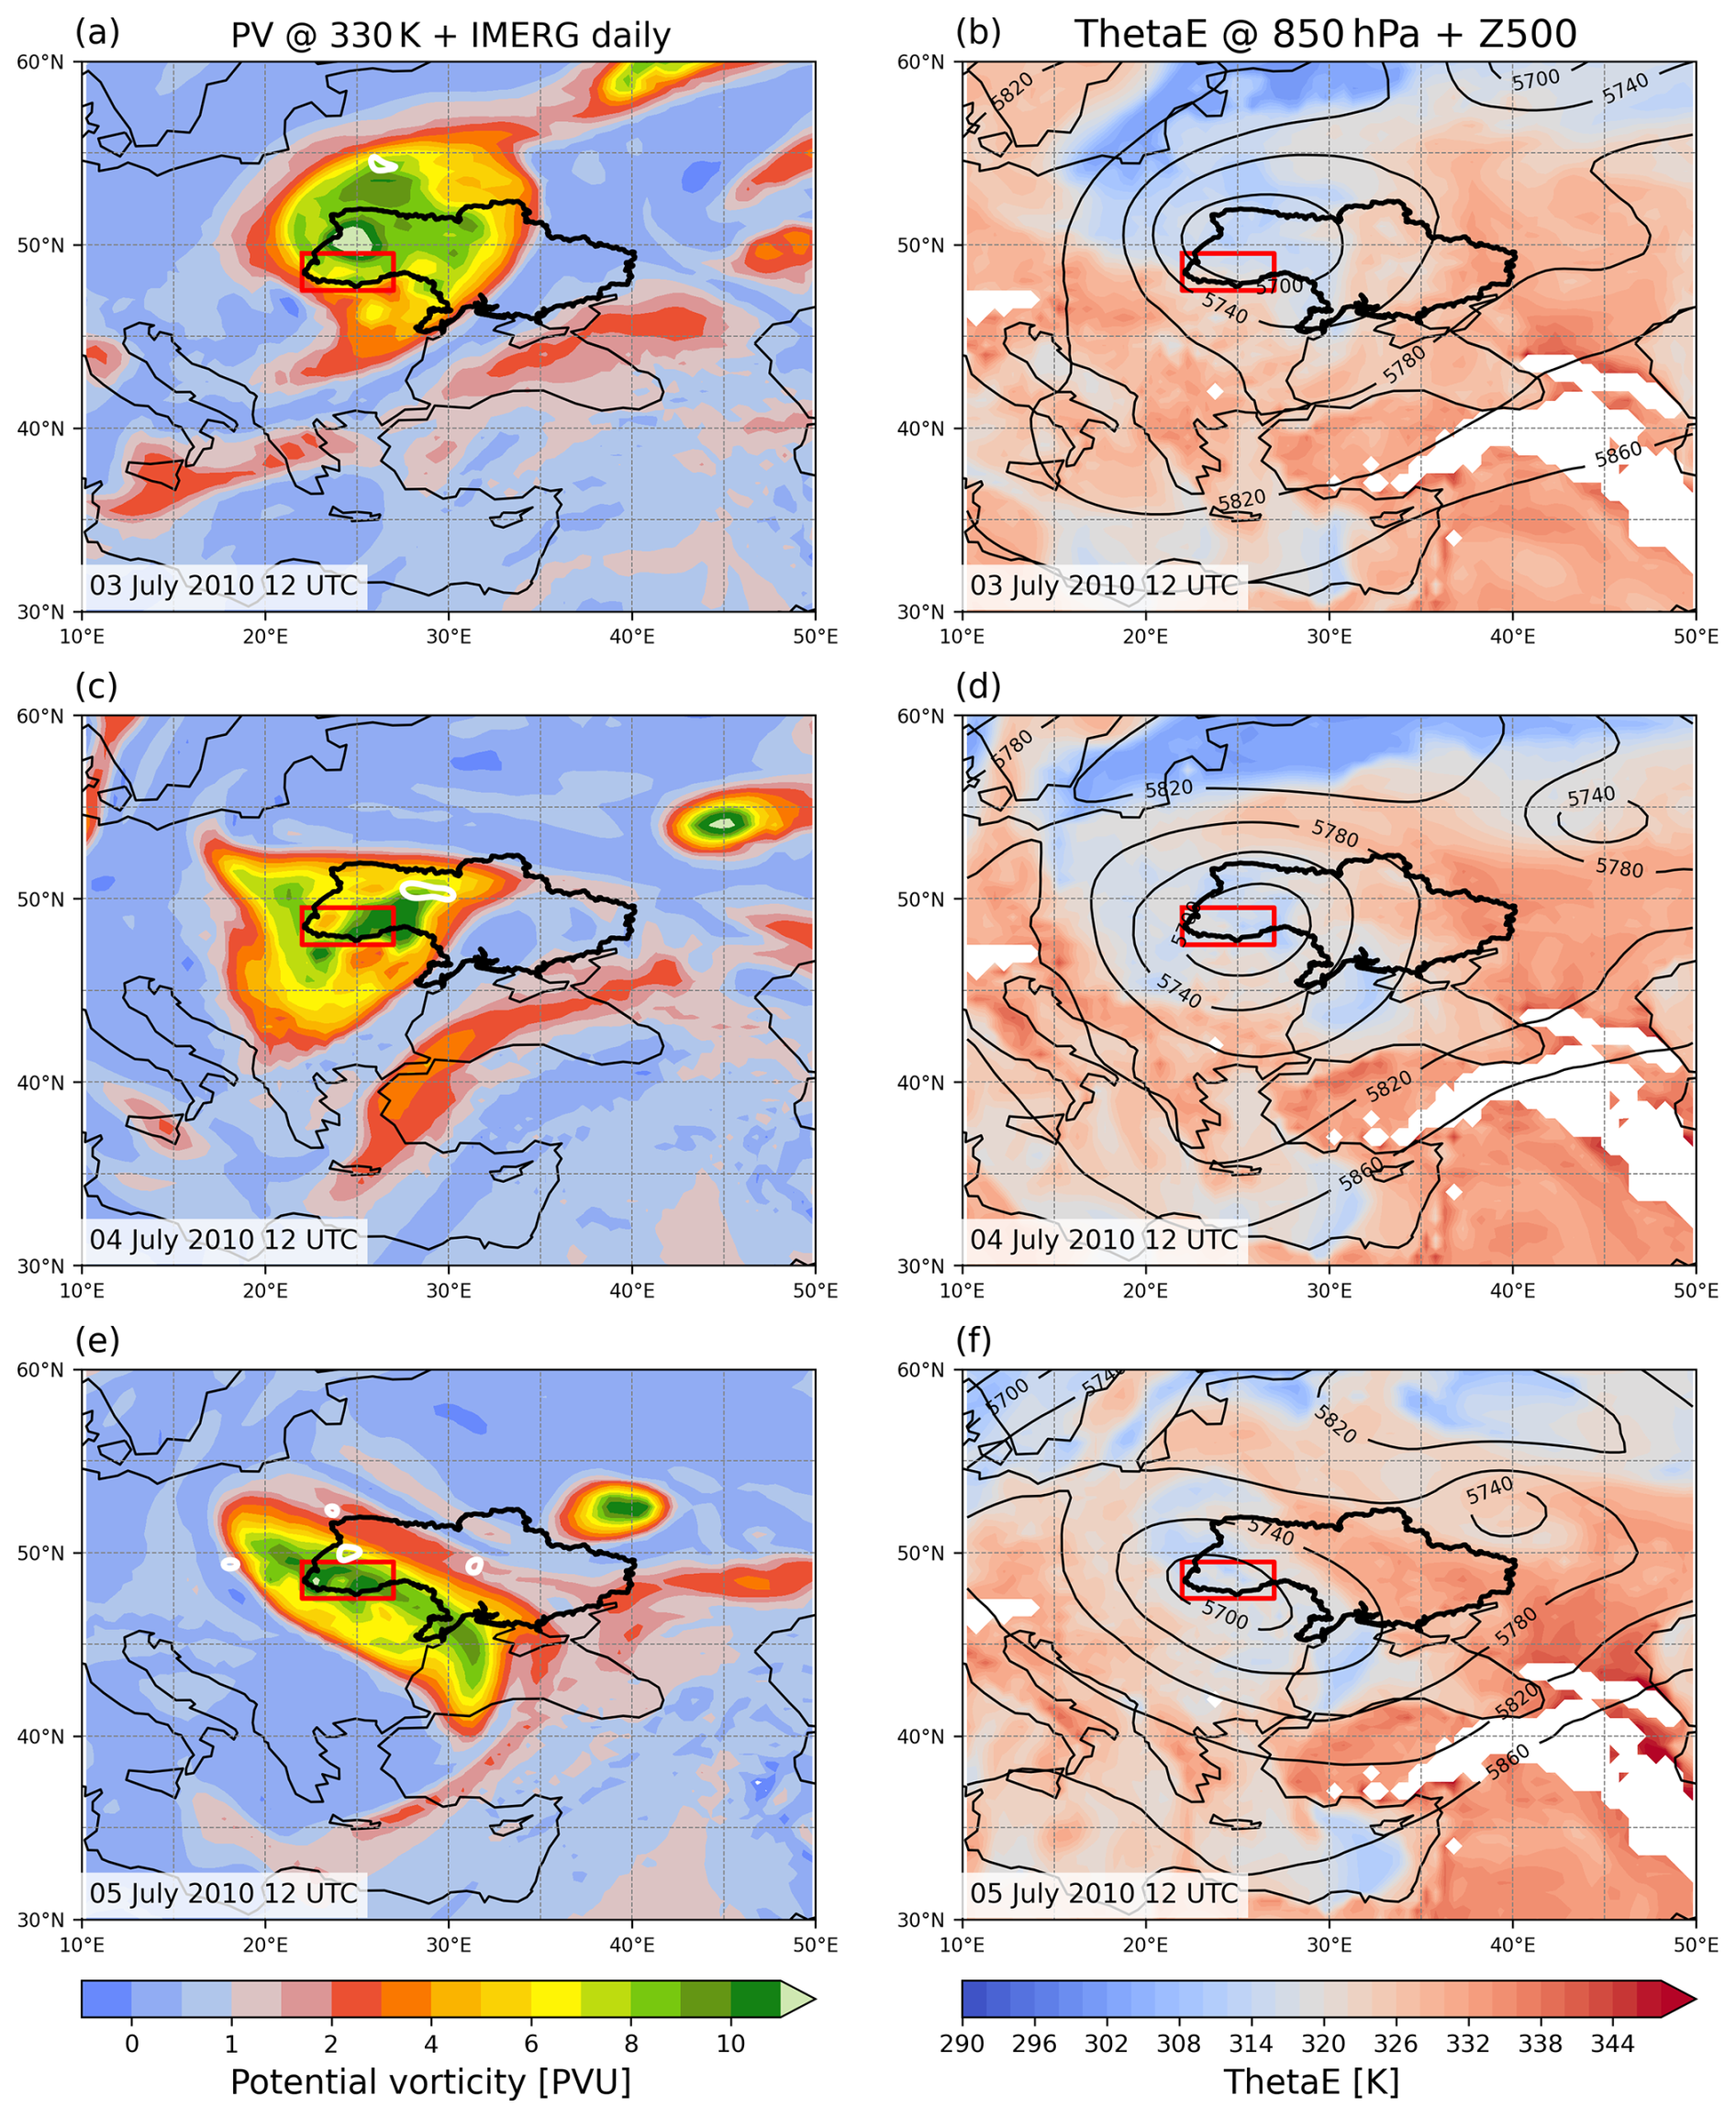
Figure 8As Fig. 5, but for 3–5 July 2010.
The presence of the COL can also be inferred from the satellite image at 12:00 UTC (Fig. S5a), showing a broken frontal cloud band with clusters of deep convective clouds over the flood region, and cloud-free zones near the center of the COL, indicating dry upper-level stratospheric air. On 4 July (Fig. 8c, d) the PV cutoff maintained a quasi-stationary position over western Ukraine, showing only a slight decrease in intensity. Despite this weakening, the system remained dynamically active, continuously generating cyclonic circulation and moisture convergence in the lower troposphere by advecting warm and moist air toward a baroclinic zone. A low-level cold-air core associated with the COL was identified only over western Ukraine, likely indicating the onset of an occlusion process, leading to an increase in precipitation intensity after 12:00 UTC. On 5 July, the PV structure evolved into a stretched, northwest–southeast–oriented structure, while still anchored quasi-stationarily over southwestern Ukraine, maintaining intense PV values of 9–11 PVU on 330 K (Fig. 8e). 1 d later, the PV cutoff, now in the form of a long, narrow PV filament stretching along 50° N, moved south of the flood area and precipitation rates began to decline after 12:00 UTC. Importantly, during the same period, a next high-PV trough extending from Scandinavia to the Black Sea intensified meridionally, giving rise to a new, elongated PV streamer west of the main precipitation zone (Fig. 9a, c), approximately 24 h prior to the precipitation peak.
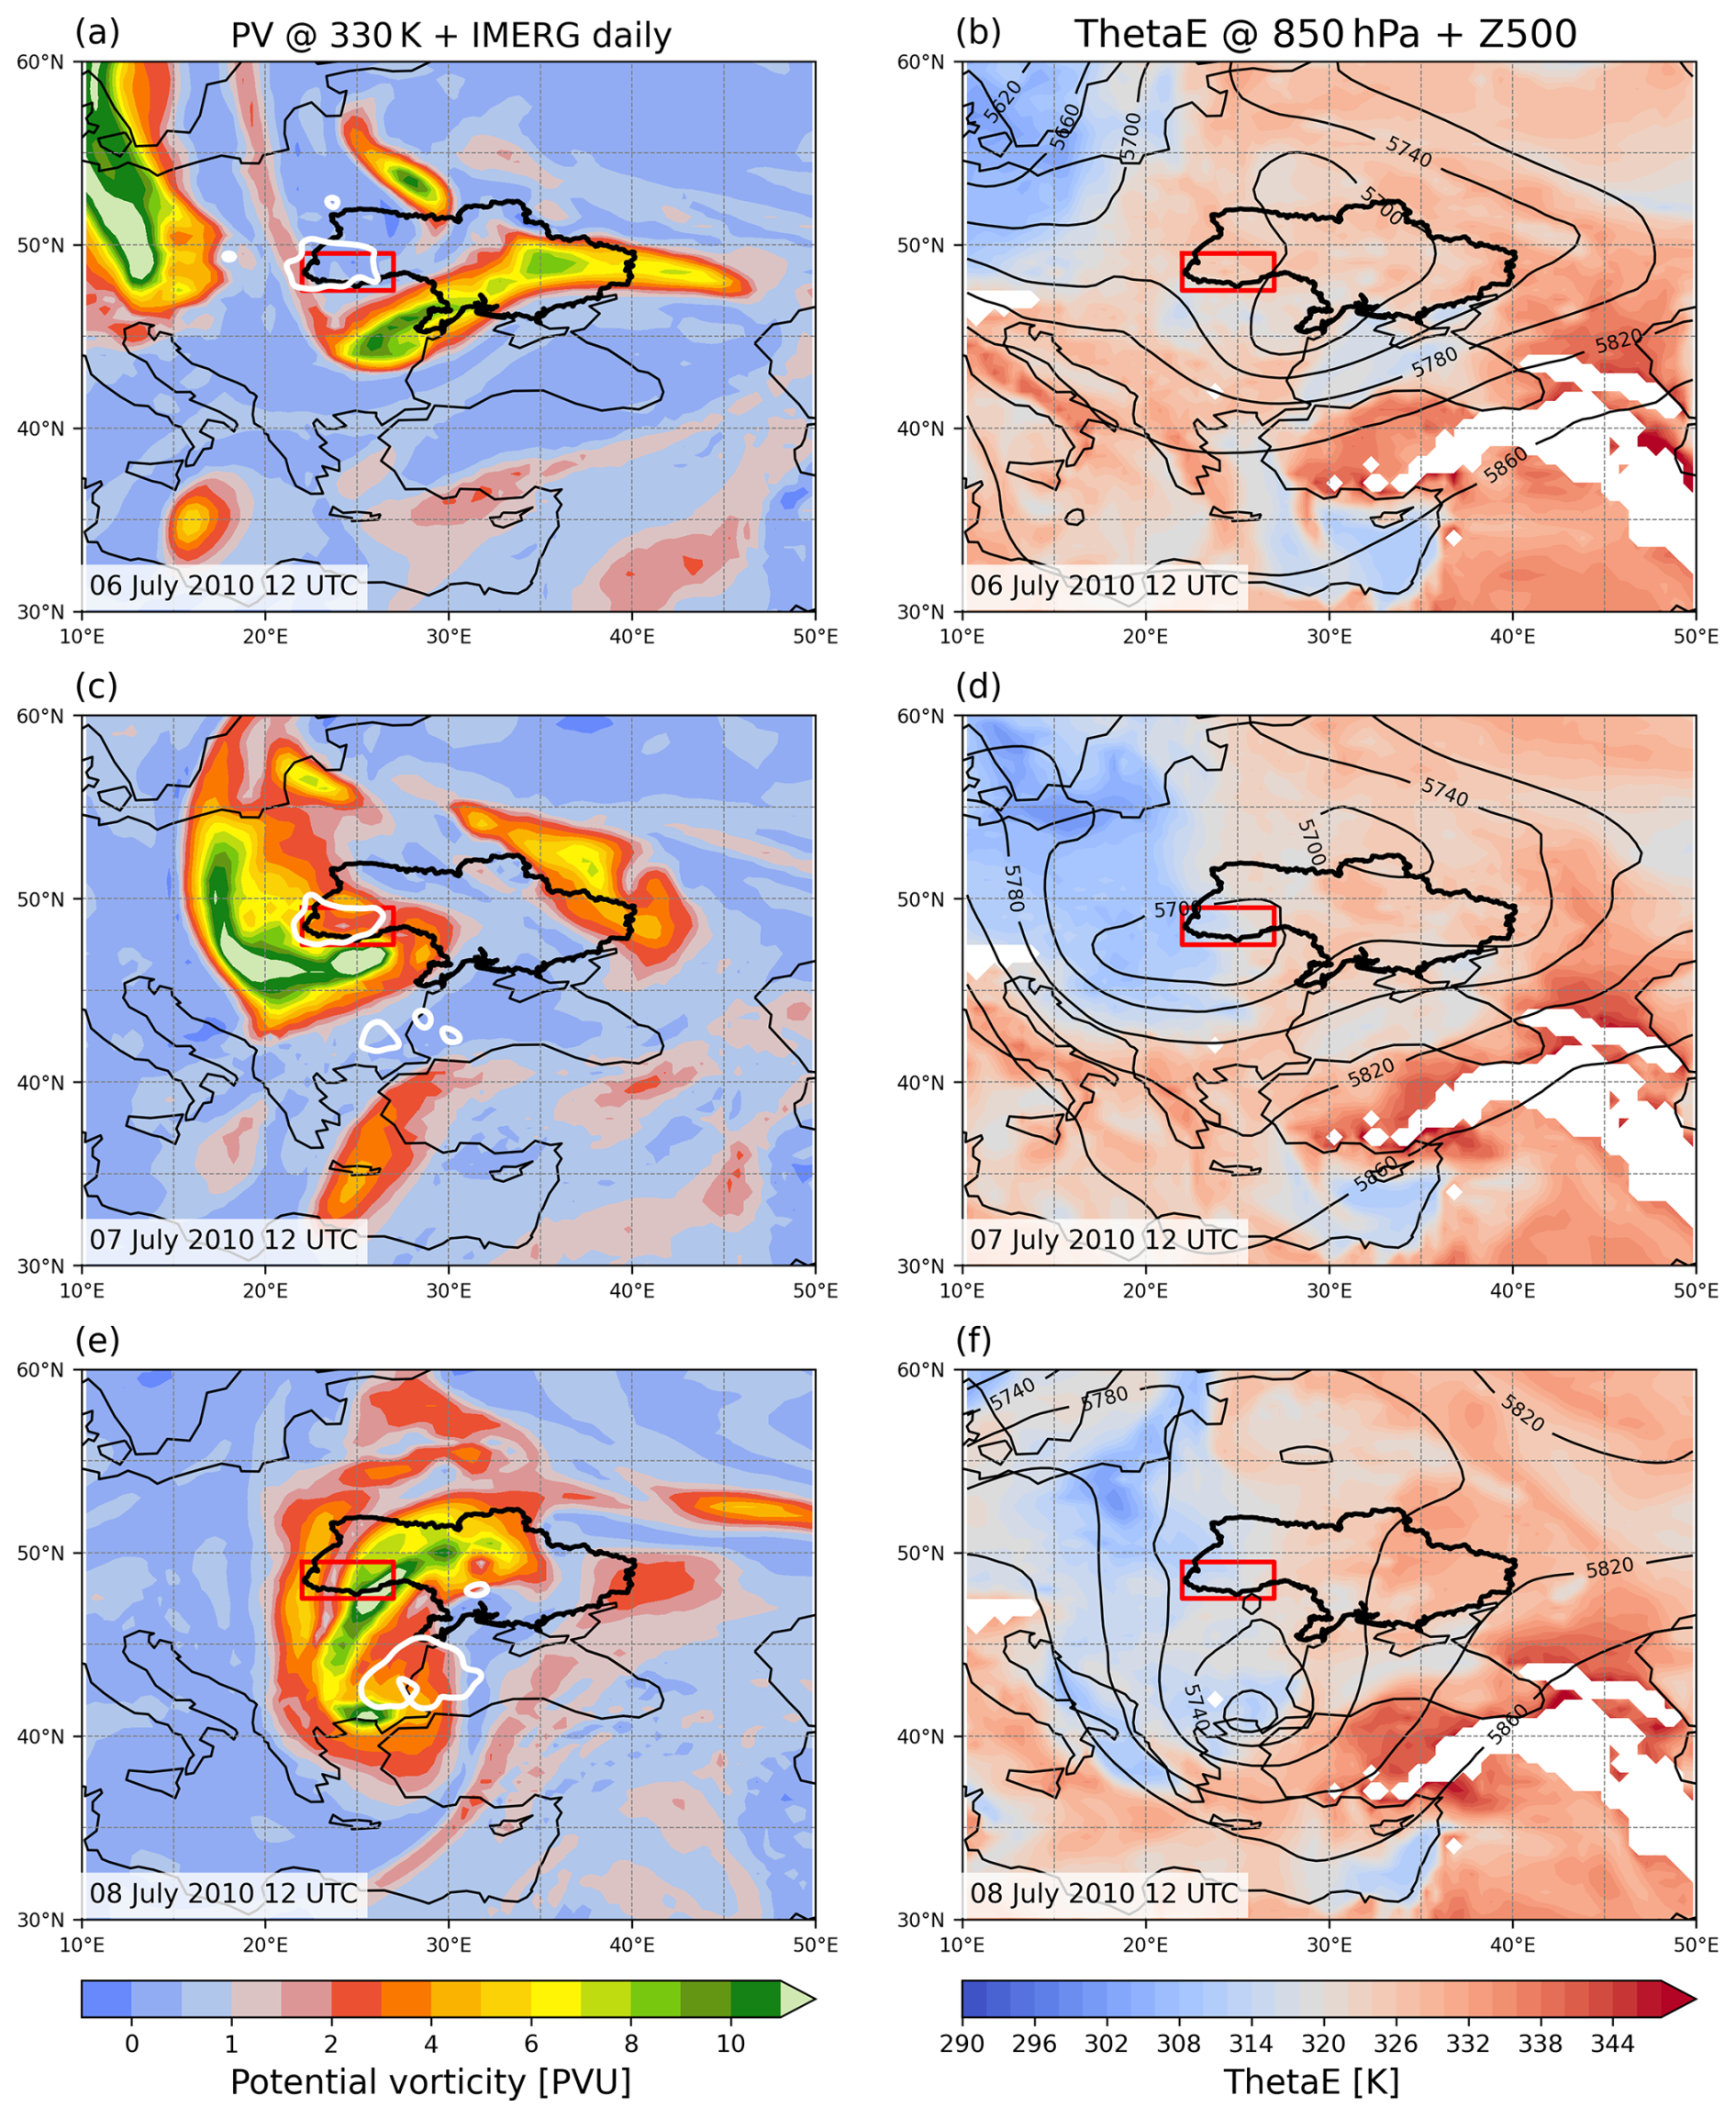
Figure 9As Fig. 5, but for 6–8 July 2010.
On 7 July, the geopotential height field at 500 hPa shows two distinct low-pressure cores (Fig. 9d). One core was located over Romania and southwestern Ukraine, associated with the newly developing PV streamer, while the other formed towards the northeast of Ukraine, linked to the remnant PV cutoff from the previous period (Fig. 9c). The new PV streamer also induced strong cold-air advection, intensifying low-level baroclinicity due to the interaction with potentially unstable moist and warm air masses transported from the southeast. This process, combined with forced orographic ascent along the Carpathian Mountains, contributed to the development of strong convective activity over the target region. This is supported by IR satellite image, which reveals a well-defined, cyclonically curved cloud spiral (Fig. S5b), with enhanced cloud tops on the poleward side, indicative of strong convection. This system produced the most intense precipitation recorded during the entire 6-d period in the flood regions.
On 8 July, the trough over Ukraine narrowed (Fig. 9f) and the PV cutoff shifted southward (Fig. 9e). However, it remained dynamically relevant and continued to exert a strong influence on the flood-affected region. In particular, the pronounced PV gradient and the associated strong northerly winds (not shown) along the western flank of the cutoff persisted over the Carpathian Mountains, supporting precipitation during the first part of 8 July. However, as the cutoff core moved further south toward the Marmara Sea (not shown), its influence over the Carpathian region diminished, leading to a gradual weakening and ending of precipitation.
Thus, at the beginning of July 2010, two episodes of Rossby wave breaking occurred, which, in turn, led to meridionally oriented stratospheric PV streamers, that consequently evolved into PV cutoffs. During the first 3 d, a PV cutoff over the flood region formed due to anticyclonic RWB downstream of the Scandinavian blocking anticyclone. The second PV cutoff evolved from cyclonic RWB, which occurred over the next few days in parallel to the intensification of the western Russian atmospheric block. These quasi-persistent blocking features north of Ukraine helped the PV structures to remain stationary over western Ukraine for 6 d, thus enabling the continuous transport of moisture-laden air into the region. This air was forced to ascend through both baroclinicity and the Carpathian orography.
3.4 The Case of 20–24 June 2020
3.4.1 Hydrological overview
The flood in June 2020 was notable for its hydrological complexity and its more rapidly evolution than the 2008 flood. The flood began in mid-June due to intense precipitation in the region and the highlands of the Carpathians during late May and the first half of June. The flood magnitude across the Tisza River basin varied between 50 %–75 %, except in some southwestern and southern stations, where it reached 100 % (Fig. 10).
The flood magnitude in the tributaries of the Prut, Siret, and Dniester catchments ranged from 50 % to 100 %, reflecting significant hydrological variability across the region. Notably, at the Iltsi station in the Prut and Siret River catchment, peak discharge reached 276 m−3 s−1. According to data from the Boris Sreznevsky Central Geophysical Observatory, Ukraine (2021), this value is approximately 1.5 times higher than the historical maximum of 192 m−3 s−1, which was recorded twice in 1969 and 1996. At the stations Myslivka (in the Dniester basin) and Ruska Mokra (in the Tisza basin), the maximum flood levels were comparable to those observed during the July 2008 floods. However, in the rest of the Carpathian region, the 2020 flood peaks were lower than those recorded during the floods of July 2008 and 2010.
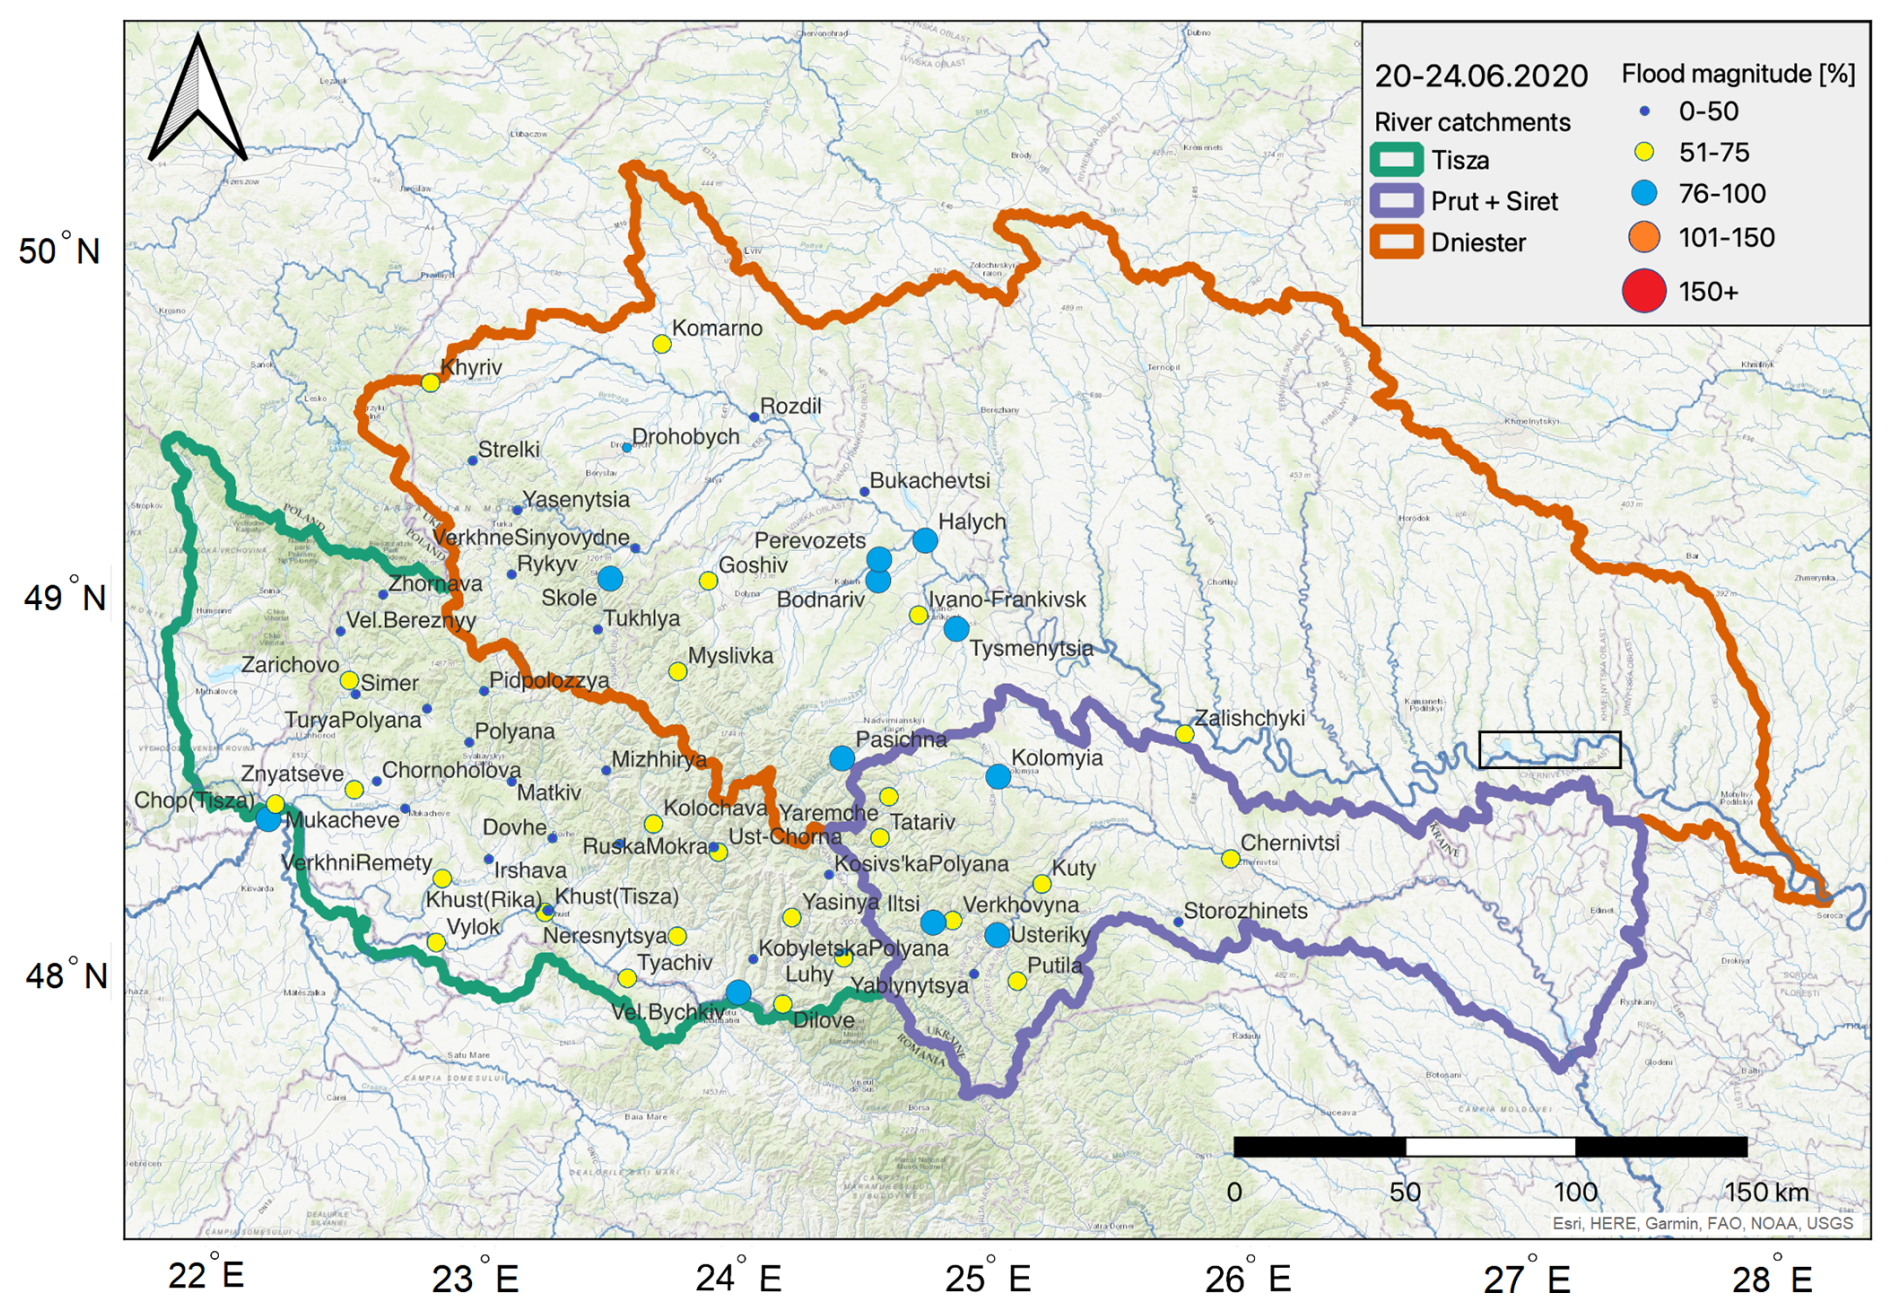
Figure 10As Fig. 3, but for the event on 20–24 June 2020. Source: NaturalEarth (https://www.naturalearthdata.com/, last access: 11 January 2025), and ESRI World Topo map (Sources: Esri, HERE, Garmin, FAO, NOAA, USGS, ©OpenStreetMap contributors, and the GIS User Community | Powered by Esri). To delineate the catchments used in this study, we aggregated catchments from the hydroSHEDS V1 database (Zoom level =7; Lehner et al., 2008).
3.4.2 Observed precipitation
The precipitation registered between 20 and 24 June 2020 in the western region of Ukraine led to flooding, but one should keep in mind that this event was preceded by a prolonged period of rainfall since late May. According to IMERG data, the highest accumulated precipitation totals during this period were recorded in the Prut and Siret River catchments, with values reaching approximately 80 mm in the Ivano-Frankivsk region (Fig. 11a). In comparison, precipitation totals in the Dniester and Tisza River basins were approximately 65 and 57 mm, respectively.
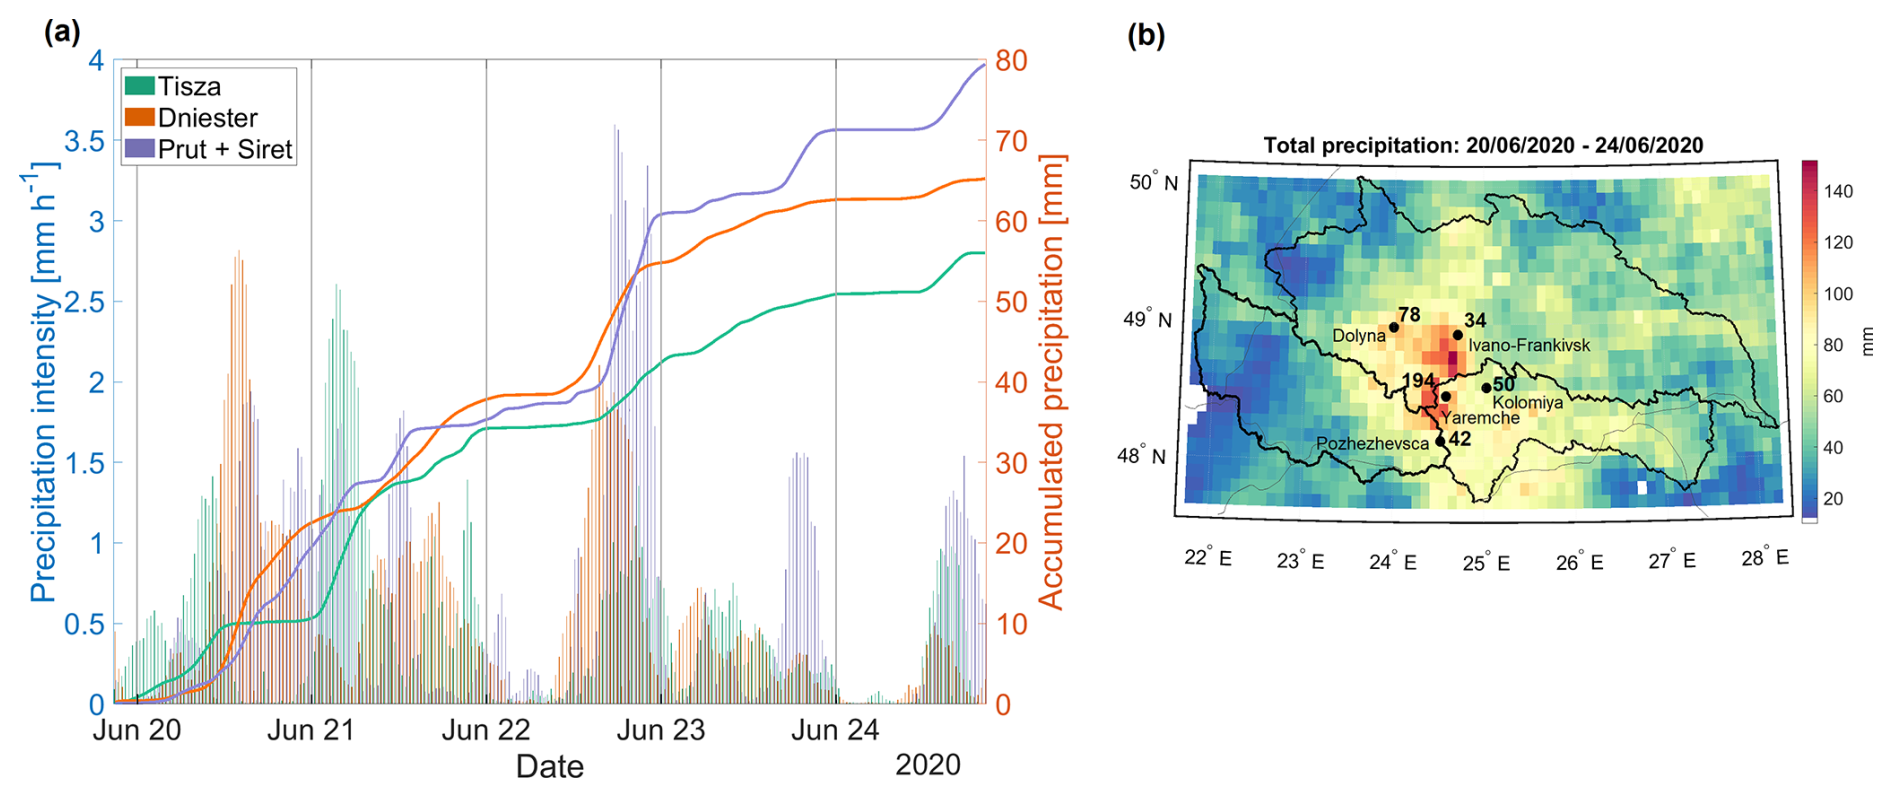
Figure 11As Fig. 4, but for the flood event on 20–24 June 2020.
On 20 June, the first peak in rainfall intensity was recorded across all three catchments, triggering a rapid rise in water levels and intensified streamflow, especially in the mountainous regions of the Carpathians, except for the left-bank tributaries of the Dniester. The largest rainfall intensities occurred 2 d later, on the night from 22 to 23 June.
The spatial distribution of 5 d accumulated precipitation reveals two maxima, one located in the Chernivtsi region and another in the Ivano-Frankivsk region (Fig. 11b). This result is consistent with observations at surface stations. In the Ivano-Frankivsk region, several stations recorded extreme daily precipitation totals. For instance, at Kolomyia and Dolina, approximately 50 % of the climatological June rainfall fell within a single day. Furthermore, at Yaremche, the 3-d accumulated rainfall reached 194 mm, which exceeded the monthly climatology by 23 % (Fig. S3c).
3.4.3 Synoptic and PV analysis
The synoptic situation on 20 June 2020 featured an upper-level trough that extended from northern Europe across southeastern Europe into Asia Minor, while a high-pressure ridge stretched from the Caspian Sea toward Scandinavia (Fig. 12a, b). This large-scale flow configuration enabled the advection of warm and moist air from Asia Minor and the Black Sea toward Ukraine. To the west of the upper-level trough, cold air was advected from the northwest to Slovakia, Hungary, and western Ukraine. This intrusion of cold air was associated with a meridionally elongated and narrow PV streamer, with PV values ranging between 8 and 11 PVU on 330 K. The northern edge of this PV streamer was located over the Tisza catchment, inducing a southeasterly flow at low levels and triggering convection along an elongated band clearly identifiable in IR-image (Fig. S6a).
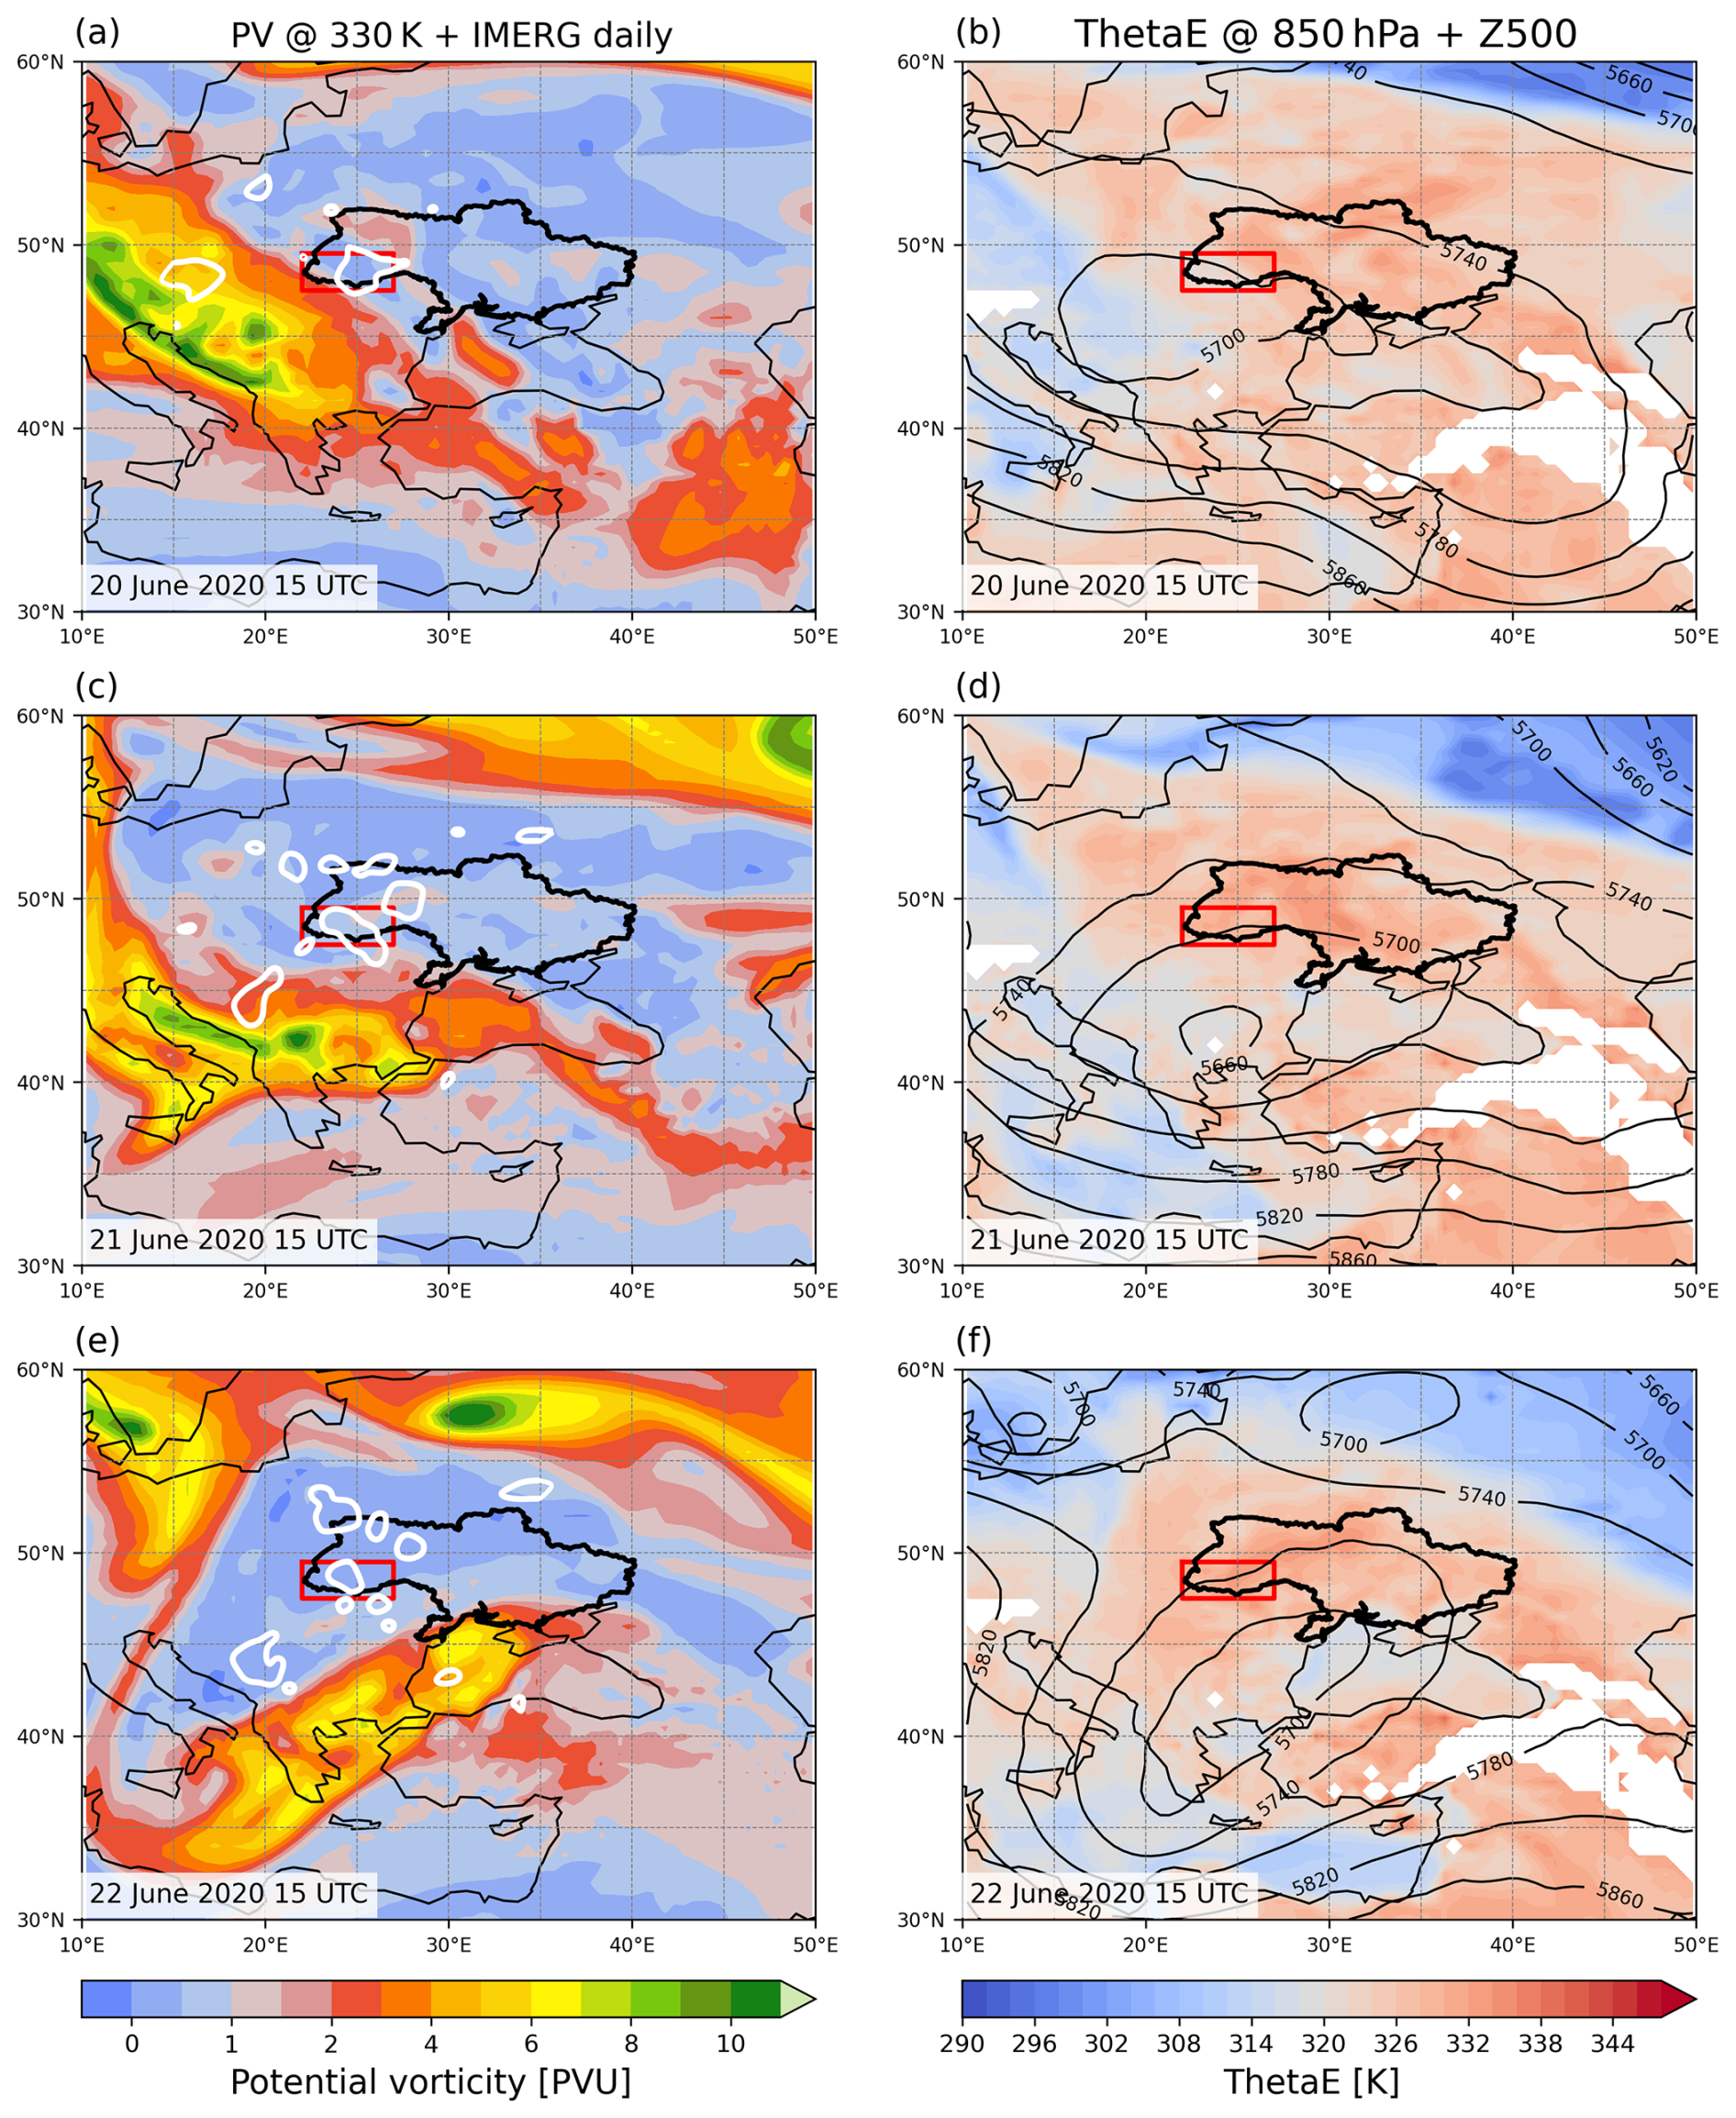
Figure 12As Fig. 5, but for the flood event on 20–22 June 2020.
In the next 36 h, the PV streamer changed its orientation, moved south, and weakened in intensity (Fig. 12c, e), which is also visible in the position of the COL (Fig. 12d, f). This led to a weakening of dynamical forcing for ascent over western Ukraine and increased static stability in the region, and, consequently, precipitation reduced in all three considered catchments (Fig. 11a). Late on 22 June, a next PV feature started to move south from the Baltic Sea towards Poland. Its southern tip was characterized by very high PV values on 330 K (>10 PVU at 15:00 UTC on 23 June), widespread clouds (Fig. S6b) and intense precipitation over western Ukraine (Fig. 11a). Most likely this process was enforced by the continuous advection of warm and moist air at low levels (note the high values of equivalent potential temperature over Ukraine, induced by the remnants of the former PV streamer, now located over the Black Sea (not shown).
In summary, the cause of heavy and prolonged precipitation during the flood period in June 2020 was a combination of two Rossby wave breaking events and intense transport of warm and moist air to the affected region. Although the main forcing originated from comparatively remote PV features, they provided the large-scale advection of humid and warm air from the Black Sea region to the Carpathian. Locally, orographic lifting contributed to the development and organization of convective systems in the flood region.
The investigation of the upper-level dynamics in terms of PV of the three flood events in the previous sections revealed the importance of PV streamers and PV cutoffs that were affecting western Ukraine near the peak times of precipitation. This finding is per se not surprising, as it is consistent with the results from our climatological analysis of heavy precipitation events in Ukraine (Agayar et al., 2024) and from many former studies about the dynamics of heavy precipitation events in other parts of the world, as summarized in the introduction. However, our impression was that the PV features related to the three catastrophic flood events studied here, were particularly intense. To check this hypothesis, we performed an additional climatological analysis. To quantify how unusual the PV structures during the flood events were, we studied the temporal evolution of summer (JJA) precipitation in the target domain in western Ukraine and the associated PV structures in the period from 2000 to 2022 (Fig. S2).
First, heavy precipitation events were identified as days when the accumulated precipitation averaged in the domain, indicated again by the red box in Fig. 13, exceeded the 99th percentile of all daily precipitation in summer. This approach identified 22 heavy precipitation days during the 23 summers, including the three case-study floods. Next, we identified PV streamers and PV cutoffs associated with these events on 330 K, which covered at least 20 % of the extended domain shown by the brown box in Fig. 13. The rationale for using a much larger box to identify associated PV features is the fact that they have a far-field effect and as shown for the detailed case studies above, PV features outside of the flood area can affect precipitation in the flood area via advection and forcing for ascent.
Figure 13Composites of PV cutoffs and streamers on 330 K related to 22 heavy precipitation events in western Ukraine (red box) in summer; (a) shows the mean PV field (amplitude, in PVU) and (b) the frequency of PV streamers/cutoffs in %. The brown box is used for the selection of PV features (see text for details).
This analysis of precipitation and PV features shows that 67 % of all summer days with precipitation were related to an upper-level PV structure on 330 K (when using our criterion of 20 % coverage of the larger box). However, all 22 heavy precipitation events were linked with a PV structure: 23 % with a cutoff only, 64 % with only a streamer, and 13 % with both a streamer and a cutoff. A day is defined as “both” when at least one cutoff event and one streamer event, each exceeding a cover threshold of 20 %, occur on the same calendar day.
Figure 13 shows maps of the mean PV cutoff and streamer amplitude and frequency on 330 K for the 22 periods. The amplitude reveals the averaged PV structure and intensity (Fig. 13a), while the frequency indicates the percentage of heavy precipitation time steps that are associated which a PV structure at a particular grid point (Fig. 13b). The climatological PV pattern on 330 K resembles cyclonic wave breaking and has a coherent meridionally-aligned spatial structure extending from northern Europe towards the Balkans (Fig. 13a). The target region in western Ukraine is located east of the averaged stratospheric PV structures. The shape of the averaged PV pattern implies that the tropospheric flow induced by this pattern has a strong southerly component towards the Carpathian Mountains. The PV amplitude is relatively high, ranging from 6 to 7 PVU, and has a clear maximum over eastern Europe that is co-located with the frequency peak (Fig. 13b). The mean frequency of PV features attains values of 60 %–70 % in this region, with local peaks over Romania and Slovenia, where values reach 80 % (Fig. 13b). These results confirm the strong influence of PV dynamics on extreme precipitation, suggesting that PV streamers and cutoffs are typical dynamical precursors of heavy precipitation episodes in eastern Europe, and in particular in western Ukraine. It is worth noting that according to the climatological investigation by Portmann (2020), the Baltic Sea region is a primary genesis area for the formation of PV cutoffs. Our study shows that they are of primary importance for heavy precipitation in western Ukraine and in particular for the three flood events discussed in detail.
For all heavy precipitation events (Fig. S7), including three flood cases, the associated PV features have a more intense amplitude than the PV climatological composite related to HPE (Fig. 13a). Therefore, the difference fields in Fig. 14d–f reveal marked positive PV anomalies with values up to 8 PVU relative to the climatology for all 22 heavy precipitation events (Fig. 13a).
Figure 14(a, b, c) PV on 330 K on the peak precipitation day and MSLP (black contours, every 5 hPa), and (d, e, f) differences of (a, b, c) and the PV climatology for 22 extreme precipitation events in western Ukraine shown in Fig. 13a.
Here, for each event, we focus on the time of maximum precipitation. At this stage, the upper-level PV field shows PV cutoffs on 330 K in all three cases. Despite this common feature, the location, intensity, and shape of the PV anomalies substantially differ between the cases, thus also highlighting the different ways how the cutoffs influences precipitation formation.
The PV cutoff for the case in July 2008 – the most intense in terms of precipitation and river discharge – shows the largest PV anomaly (with a circular shape) exceeding 8 PVU south of the target region over Romania (Fig. 14a, d). A PV cutoff anomaly is clearly localized over Romania and has a quasi-circular shape. The heavy precipitation in the flood area is related to the destabilizing effect of the northern flank of the PV cutoff anomaly. In July 2010, the PV anomaly is more elongated and amounts to 7–8 PVU in a narrow band extending directly to the flood-impacted area, thereby providing strong dynamical forcing for the event through both baroclinicity and the Carpathian orography (Fig. 14b, e). By contrast, in June 2020, the differences in location and shape between the composite PV structure and the case (Fig. 14c, f) are significant and dynamically meaningful. The PV cutoff has a lower amplitude, an elongated shape and it is shifted southeastward. This displacement suggests a more indirect role of the southern PV cutoff in triggering precipitation during this case. It facilitated a more zonally oriented transport of moisture toward the flood-affected region, while the direct dynamic influence of the upper-level PV anomaly on vertical ascent was limited or negligible. In the detailed discussion above, we however highlighted also the potential role of the next PV cutoff, which starts to form northwest of the target area.
Severe flooding is often caused by one or multiple episodes of heavy precipitation. According to Breugem et al. (2020), the severity of flood events depends on several rainfall characteristics, like accumulated precipitation, rainfall duration, peak rainfall intensity, average rainfall rate, and the spatial scale. Despite the moderate hourly rainfall intensities averaged over the catchments (not exceeding 4.5 mm h−1) observed during all three flood events, the prolonged duration of precipitation and also high rainfall intensity in specific points resulted in significant cumulative rainfall and ultimately caused flooding. At some gauging stations, total rainfall amounts during the 5-d flood episodes in July 2008 and June 2020 exceeded the average July precipitation by more than a factor of two. Notably, the flood of 2008 was generated by one 5-d period of heavy precipitation, while the 2010 and 2020 floods were produced by a sequence of several but less intense rainfall episodes, leading to soil saturation and a gradual increase in river water levels.
The scale of heavy precipitation events is an essential characteristic because it affects the scale of the flooding potential (Konrad, 2001, Morin and Yakir, 2014; Boers et al., 2016; Armon et al., 2022). An analysis of the spatial distribution of precipitation during the three flood events, based on the IMERG dataset, revealed that the area with precipitation exceeding 100 mm was significantly more extensive during the 2008 flood than in July 2010 and June 2020. However, as Brunner (2023) pointed out, the relationship between the spatial distribution of precipitation and the flood extent and location is not one-to-one. Evidence of this is seen in the differing spatial impacts of each event: while all three basins experienced flooding, the 2010 event was largely confined to the Tisza basin and as well as in the upper Dniester region, whereas in 2020, flooding predominantly affected the Prut and Siret basins, as well as part of the Dniester catchment. The most significant increases in river levels occurred in July 2008, when the highest levels approached historical records, while the flood at the end of June 2020 did not surpass the inundation levels seen in 2008 and 2010. The negative impacts of the three floods were not only due to the heavy precipitation but were likely exacerbated by human activities in the river catchments and on the slopes of the Carpathians. Issues such as the development of riverside areas without compliance with current regulations, clogging of riverbeds, especially in the primary hydrographic network (including streams and streams within settlements), and reduced capacity of drainage systems contributed to the severity of the flooding (State Agency of Water Resources of Ukraine, 2025).
To understand the large-scale processes and PV dynamics underlying the three major flood events in western Ukraine, it is useful to first consider the climatological context. As already noted in Sect. 4, the contribution of PV structures to summer precipitation and precipitation extremes is rather high in the study domain. This is consistent with several studies. For example, Rimbu et al. (2016) investigated the reasons for the high frequency of extreme summer precipitation in Romania and the eastern Mediterranean. Porcú et al. (2007) also emphasized that PV cutoffs are highly relevant for precipitation in the Mediterranean and surrounding regions. Agayar et al. (2024) found that during summer extreme precipitation events in Ukraine, a moderately intense positive PV anomaly is typically located over southeastern Europe. Since the horizontal moisture transport is a major factor distinguishing precipitation severity (e.g., Froidevaux and Martius, 2016), extreme rainfall events in western Ukraine typically occur when the PV structure directly interacts with enhanced local moisture and regional orography, leading to strong localized convection. Thus, the findings from the regional climatology of PV steamers and cutoffs conditional on heavy precipitation events presented in Sect. 4, are consistent with previous studies. This climatology served to assess the extremity of the PV structures related to our selected flood cases.
The synoptic storylines of the devastating floods presented in Sect. 3 included PV streamers, PV cutoffs (or COLs), and blocking anticyclones. The atmospheric flow in the 2008 and 2020 flood events was shaped by the interaction between a trough from the northeast and two blocking systems upstream and downstream of the trough: the anticyclone to the north and a ridge over the East European Plain to the east of the target region. In July 2010, a synoptic configuration similar to the two other cases was observed during the first few days, however, with a less intensive impact of the high-pressure system northward from the study region. However, the amplification of the western Russian anticyclone led to a reversal of the trough orientation from northeast to northwest, which ensured the stationarity of the blocking anticyclone against the mean flow. These large-scale configurations in all three cases induced Rossby wave breaking, which is known to occur frequently in such synoptic conditions (Kautz et al., 2022). The resulting high-amplitude PV streamers, followed by cutoff formation, established a sustained easterly low-level flow against the Carpathian barrier, potentially forcing orographic lifting. Combined with large-scale forcing for ascent due to the PV cutoffs, this led to a favorable mesoscale environment for convection and prolonged heavy rainfall over western Ukraine. Such amplification of heavy precipitation by the interaction between Rossby wave breaking and low-level moist flow toward an orographic barrier frequently results in heavy precipitation, which is also reported from flood events in other regions, for instance, in Central Europe (Hofstätter et al., 2018) and in the Alps (Piaget et al., 2015).
In this study, we investigated the hydrometeorological and large-scale atmospheric dynamic factors contributing to three catastrophic flooding events in western Ukraine in July 2008, July 2010, and June 2020. Additionally, we analysed the regional summer climatology of upper-level PV structures and precipitation, to put the three case studies in a broader context. To this end, three different analyses were performed, which address: (1) the hydrometeorological causes of the floods; (2) the surface weather evolution and upper-level PV structures associated with the events; and (3) a composite analysis of stratospheric PV streamers and PV cutoffs on the 330K isentropic surface during 22 heavy precipitation events in western Ukraine, identified between 2000 and 2022. The questions posed in the introduction can now be answered as follows:
-
The floods of 2008, 2010, and 2020 in the Carpathian region were driven by heavy precipitation events of varying intensity, spatial extent and duration. The 2008 flood was the most severe, with river levels surpassing historical records at several hydrological stations and 5-d accumulated rainfall amounts reaching extreme values, exceeding the July average by a factor of two in some areas. The 2010 flood, although less widespread, heavily affected the Tisza catchment and the upper Dniester basin. The 2020 flood did not reach the levels seen in 2008 in most areas, except at two gauge stations, where river levels exceeded previous peaks by up to 50 %. Both the 2010 and 2020 events were preceded by several episodes of prolonged precipitation, resulting in saturated soil, gradually increasing river levels and creating favorable conditions for subsequent flooding. The duration and high cumulative precipitation amounts, despite moderate area-mean hourly intensities, were one of the key factors in all three floods, highlighting the importance of their assessment for flood prediction.
-
A key synoptic feature contributing to the initiation of heavy precipitation during the flood events was the presence of an upper-level trough extending from the north or northeast of the East European Plain toward southeastern Europe. In all three cases, the large-scale configuration induced Rossby wave breaking, resulting in the development of high amplitude PV streamers, followed by the formation of PV cutoffs (cutoff lows) over the target region. Remote blocking anticyclones, both upstream and downstream, most likely played a role in impeding the eastward movement of these cutoff cyclones, allowing them to remain quasi-stationary over the region for an extended period (flood of 2008) or to occur repeatedly within a few days in the same region (floods of 2010 and 2020). The interaction of the larger-scale flow with the Carpathian Mountains oriented and anchored the low-tropospheric moist air flow towards the topographic barrier, significantly increasing the likelihood of prolonged and intense precipitation over the flood-prone regions in western Ukraine.
-
While all three flood events shared a common upper-level PV pattern leading to large-scale forcing for ascent and low-level moisture advection, the involved PV cutoffs differ substantially in terms of shape, amplitude, and evolution. The most severe flood in 2008 was associated with a particularly intense PV cutoff, whose PV values exceeded the composite mean of the PV features associated with all heavy precipitation events in more than two decades by more than 8 PVU. It remained fairly stationary and led to intense rainfall in western Ukraine on four consecutive days. In contrast, the PV cutoffs associated with the two other flood events were less stationary, less intense, and less circular in shape, and indeed the 2010 and 2020 flood events featured the passage of two consecutive upper-level PV cutoffs during the considered 5-d precipitation phase.
-
The climatological analysis of the PV structures associated with 22 heavy precipitation events in western Ukraine in the summers of 2000–2022 confirms the expected strong link. Notably, 67 % of all days with precipitation in the target region were associated with a PV streamer or PV cutoff, while all heavy precipitation events were linked with a prominent PV structure: 23 % were related to a PV cutoff, 64 % to a PV streamer, and 13 % to a combined occurrence of PV streamer and PV cutoffs. The amplitude of the composite PV structure on 330 K over Eastern Europe is relatively high (6–7 PVU) and shows a robust geographical pattern, with frequency peaks reaching up to 80 % in Romania and Slovenia (indicating relatively weak spatial variability of the PV structures). The PV anomalies related to the three catastrophic flood events support this pattern: in July 2008, a strong, localized PV cutoff over Romania exceeded climatological values by over 8 PVU; in July 2010, an elongated PV anomaly extended across the flood region, surpassing climatology by 7–8 PVU; in June 2020, the weaker and southeast-shifted PV anomaly did not directly overlay the flood zone, indicating a more remote influence.
Overall, the findings of this study confirm that upper-level PV streamers and cutoffs are key drivers of extreme summer precipitation in the Carpathian region, and their structure, amplitude, and spatial alignment play a critical role in determining the location and intensity of flood-inducing rainfall events.
ERA5 data is openly available at https://doi.org/10.1002/qj.3803 (Hersbach et al., 2020). IMERG data is openly available at https://doi.org/10.5067/GPM/IMERG/3B-HH/07 (Huffman et al., 2023). The observational data used for this study can be requested from the Ukrainian Hydrometeorological Center (https://www.meteo.gov.ua/en/Dani-avtomatichnikh-hidrolohichnikh-postiv, last access: 5 December 2024). ERA5 data is openly available at https://doi.org/10.1002/qj.3803 (Hersbach et al., 2020) and Copernicus Climate Change Service, (https://doi.org/10.24381/cds.143582cf, Copernicus Climate Change Service, 2023)
To illustrate the RWB lifecycle and synoptic-scale development, we show upper-level PV distributions and 850 hPa equivalent potential temperature at 6-h intervals throughout each case. Video supplements are available online at the AV Portal of TIB Hannover: https://doi.org/10.5446/73098 (Agayar, 2026a), https://doi.org/10.5446/73097 (Agayar, 2026b), https://doi.org/10.5446/73096 (Agayar, 2026c), https://doi.org/10.5446/73095 (Agayar, 2026d), https://doi.org/10.5446/73094 (Agayar, 2026e), https://doi.org/10.5446/73093 (Agayar, 2026f).
The supplement related to this article is available online at https://doi.org/10.5194/nhess-26-3025-2026-supplement.
EA, MS and HW designed the study, EA performed the analysis, and wrote the manuscript with support from HW. Visualizations were produced by EA and MA. All authors contributed to the interpretation and discussion of the results.
The contact author has declared that none of the authors has any competing interests.
Publisher's note: Copernicus Publications remains neutral with regard to jurisdictional claims made in the text, published maps, institutional affiliations, or any other geographical representation in this paper. The authors bear the ultimate responsibility for providing appropriate place names. Views expressed in the text are those of the authors and do not necessarily reflect the views of the publisher.
EA would like to extend its sincere appreciation to Perevozchykov Illia, the head of the Department of Hydrological Forecasts at the Ukrainian Hydrometeorological Center, for providing observation data. We would also like to thank two anonymous reviewers for their helpful comments.
EA was supported by the Swiss National Science Foundation (grant no. 212026 and 216775). MA was supported by the Swiss National Science Foundation (grant no. TMPFP2_216989), by the Med World Consortium, funded by the Council for Higher Education in Israel, and by Israel Science Foundation research grant (ISF’s No. 4089/25) and the Maimonides Fund’s Future Scientists Center.
This paper was edited by Matthias Schlögl and reviewed by two anonymous referees.
Agayar, E.: The catastrophic floods in 2008, 2010 and 2020 in western Ukraine: Hydrometeorological processes and the role of upper-level dynamics, Copernicus Publications [video], https://doi.org/10.5446/73098, 2026a.
Agayar, E.: The catastrophic floods in 2008, 2010 and 2020 in western Ukraine: Hydrometeorological processes and the role of upper-level dynamics, Copernicus Publications [video], https://doi.org/10.5446/73097, 2026b.
Agayar, E.: The catastrophic floods in 2008, 2010 and 2020 in western Ukraine: Hydrometeorological processes and the role of upper-level dynamics, Copernicus Publications [video], https://doi.org/10.5446/73096, 2026c.
Agayar, E.: The catastrophic floods in 2008, 2010 and 2020 in western Ukraine: Hydrometeorological processes and the role of upper-level dynamics, Copernicus Publications [video], https://doi.org/10.5446/73095, 2026d.
Agayar, E.: The catastrophic floods in 2008, 2010 and 2020 in western Ukraine: Hydrometeorological processes and the role of upper-level dynamics, Copernicus Publications [video], https://doi.org/10.5446/73094, 2026e.
Agayar, E.: The catastrophic floods in 2008, 2010 and 2020 in western Ukraine: Hydrometeorological processes and the role of upper-level dynamics, Copernicus Publications [video], https://doi.org/10.5446/73093, 2026f.
Agayar, E., Aemisegger, F., Armon, M., Scherrmann, A., and Wernli, H.: Precipitation extremes in Ukraine from 1979 to 2019: climatology, large-scale flow conditions, and moisture sources, Nat. Hazards Earth Syst. Sci., 24, 2441–2459, https://doi.org/10.5194/nhess-24-2441-2024, 2024.
Alberton, M., Andresen, M., Citadino, F., Egerer, H., Fritsch, U., Götsch, H., Hoffmann, C., Klemm, J., Mitrofanenko, A., Musco, E., Noellenburg, N., Pettita, M., Renner, K., and Zebisch, M.: Outlook on climate change adaptation in the Carpathian mountains, United Nations Environment Programme, GRID-Arendal and Eurac Research, Nairobi, Vienna, Arendal and Bolzano, https://gridarendal-website-live.s3.amazonaws.com/production/documents/:s_document/368/original/MP_Carpathians_lores.pdf?1507791467 (last access: 9 November 2024), 2017.
Armon, M., Marra, F., Enzel, Y., Rostkier-Edelstein, D., Garfinkel, C. I., Adam, O., Dayan, U., and Morin, E.: Reduced Rainfall in Future Heavy Precipitation Events Related to Contracted Rain Area Despite Increased Rain Rate, Earth's Futur., 10, 1–19, https://doi.org/10.1029/2021ef002397, 2022.
Armon, M., Shmilovitz, Y., and Dente, E.: Anatomy of a Foreseeable Disaster: Lessons from the 2023 Dam-Breaching Flood in Derna, Libya, Sci. Adv., 11, https://doi.org/10.1126/sciadv.adu2865, 2025.
Bell, G. D. and Bosart, L. F.: A Case Study Diagnosis of the Formation of an Upper-Level Cutoff Cyclonic Circulation over the Eastern United States., Mon. Wea. Rev., 121, 1635–1655, https://doi.org/10.1175/1520-0493(1993)121<1635:ACSDOT>2.0.CO;2, 1993.
Berghuijs, W. R., Harrigan, S., Molnar, P., Slater, L. J., and Kirchner, J. W.: The relative importance of different flood-generating mechanisms across Europe, Water Resour. Res., 55, 4582–4593, https://doi.org/10.1029/2019WR024841, 2019.
Bissolli, P., Friedrich, K., Rapp, J., and Ziese, M: Flooding in eastern central Europe in May 2010 – reasons, evolution and climatological assessment, Weather, 66, 147–153, https://doi.org/10.1002/wea.759, 2011.
Blöschl, G., Hall, J., Parajka, J., Perdigão, R. A. P., Merz, B., Arheimer, B., Aronica, G. T., Bilibashi, A., Bonacci, O., Borga, M., Čanjevac, I., Castellarin, A., Chirico, G. B., Claps, P., Fiala, K., Frolova, N., Gorbachova, L., Gül, A., Hannaford, J., Harrigan, S., Kireeva, M., Kiss, A., Kjeldsen, T. R., Kohnová, S., Koskela, J. J., Ledvinka, O., Macdonald, N., Mavrova-Guirguinova, M., Mediero, L., Merz, R., Molnar, P., Montanari, A., Murphy, C., Osuch, M., Ovcharuk, V., Radevski, I., Rogger, M., Salinas, J. L., Sauquet, E., Šraj, M., Szolgay, J., Viglione, A., Volpi, E., Wilson, D., Zaimi, K., and Živković, N.: Changing climate shifts timing of European floods, Science, 357, 588–590, https://doi.org/10.1126/science.aan2506, 2017.
Blöschl, G., Hall, J., Viglione, A., Perdigão, R. A. P., Parajka, J., Merz, B., Lun, D., Arheimer, B., Aronica, G. T., Bilibashi, A., Boháč, M., Bonacci, O., Borga, M., Čanjevac, I., Castellarin, A., Chirico, G. B., Claps, P., Frolova, N., Ganora, D., Gorbachova, L., Gül, A., Hannaford, J., Harrigan, S., Kireeva, M., Kiss, A., Kjeldsen, T. R., Kohnová, S., Koskela, J. J., Ledvinka, O., Macdonald, N., Mavrova-Guirguinova, M., Mediero, L., Merz, R., Molnar, P., Montanari, A., Murphy, C., Osuch, M., Ovcharuk, V., Radevski, I., Salinas, J. L., Sauquet, E., Šraj, M., Szolgay, J., Volpi, E., Wilson, D., Zaimi, K., and Živković, N.: Changing climate both increases and decreases European river floods, Nature, 573, 108–111, https://doi.org/10.1038/s41586-019-1495-6, 2019.
Boers, N., Bookhagen, B., Marwan, N., and Kurths, J.: Spatiotemporal characteristics and synchronization of extreme rainfall in South America with focus on the Andes Mountain range, Clim. Dynam., 46, 601–617, https://doi.org/10.1007/s00382-015-2601-6, 2016.
Borys Sreznevskyi Central Geophysical Observatory, Ukraine: Review of weather and natural hydrometeological phenomena on the territory of Ukraine in 2020, https://data.gov.ua/package/eb52e916-ad25-4f67-a113-b7bdebf5f3c2 (last access: 20 December 2024), 2021.
Breugem, A. J., Wesseling, J. G., Oostindie, K., and Ritsema, C. J.: Meteorological aspects of heavy precipitation in relation to floods – An overview, Earth-Sci. Rev., 204, 103171, https://doi.org/10.1016/j.earscirev.2020.103171, 2020.
Brunner, M. I.: Floods and droughts: a multivariate perspective, Hydrol. Earth Syst. Sci., 27, 2479–2497, https://doi.org/10.5194/hess-27-2479-2023, 2023.
Chow, Van Te: Open-Channel Hydraulics, New York: McGraw-Hill, 350 pp., https://ru.scribd.com/document/684578636/19-Ven-Te-Chow-Open-Channel-Hydraulics-Mcgraw-Hill (last access: 26 May 2025), 1959.
Chu, L., Warren, J. L., Spatz, E. S., Lowe, S., Lu, Y., Ma, X., Ross, J. S., Krumholz, H. M., and Chen, K.: Floods and cause-specific mortality in the United States applying a triply robust approach, Nat. Commun., 16, 2853, https://doi.org/10.1038/s41467-025-58236-0, 2025.
Copernicus Climate Change Service: Complete ERA5 global atmospheric reanalysis. Copernicus Climate Change Service (C3S) Climate Data Store (CDS) [data set], https://doi.org/10.24381/cds.143582cf, 2023.
Didovets, I., Krysanova, V., Bürger, G., Snizhko, S., Balabukh, V., and Bronstert, A.: Climate change impact on regional floods in the Carpathian region, J. Hydrol., 22, 100590, https://doi.org/10.1016/j.ejrh.2019.01.002, 2019.
Dole, R., Hoerling, M., Perlwitz, J., Eischeid, J., Pegion, P., Zhang, T., Quan, X.-W., Xu, T., and Murray, D.: Was there a basis for anticipating the 2010 Russian heat wave?, Geophys. Res. Lett., 38, L06702, https://doi.org/10.1029/2010GL046582, 2011.
Dorrington, J., Wenta, M., Grazzini, F., Magnusson, L., Vitart, F., and Grams, C. M.: Precursors and pathways: dynamically informed extreme event forecasting demonstrated on the historic Emilia-Romagna 2023 flood, Nat. Hazards Earth Syst. Sci., 24, 2995–3012, https://doi.org/10.5194/nhess-24-2995-2024, 2024.
Francipane, A., Pumo, D., Sinagra, M., La Loggia, G., and Noto, L. V.: A paradigm of extreme rainfall pluvial floods in complex urban areas: the flood event of 15 July 2020 in Palermo (Italy), Nat. Hazards Earth Syst. Sci., 21, 2563–2580, https://doi.org/10.5194/nhess-21-2563-2021, 2021.
Froidevaux, P. and Martius, O.: Exceptional integrated vapour transport toward orography: an important precursor to severe floods in Switzerland, Quart. J. Roy. Meteor. Soc., 142, 1997–2012, https://doi.org/10.1002/qj.2793, 2016.
Givon, Y., Hess, O., Flaounas, E., Catto, J. L., Sprenger, M., and Raveh-Rubin, S.: Process-based classification of Mediterranean cyclones using potential vorticity, Weather Clim. Dynam., 5, 133–162, https://doi.org/10.5194/wcd-5-133-2024, 2024.
Grams, C. M., Binder, H., Pfahl, S., Piaget, N., and Wernli, H.: Atmospheric processes triggering the central European floods in June 2013, Nat. Hazards Earth Syst. Sci., 14, 1691–1702, https://doi.org/10.5194/nhess-14-1691-2014, 2014.
Gudmundsson, L., Boulange, J., Hong X. Do, Gosling, S. N., Grillakis, M. G., Koutroulis, A. G., Leonard, M., Liu, J., Schmied, H. M., Papadimitriou, L., Pokhrel, Y., Seneviratne, S. I., Satoh, Y., Thiery, W., Zhang, S. W. X., and Zhao, H.: Globally observed trends in mean and extreme river flow attributed to climate change, Science, 371, 1159–1162, https://doi.org/10.1126/science.aba3996, 2021.
Hersbach, H., Bell, B., Berrisford, P., Hirahara, S., Horányi, A., Muñoz-Sabater, J., Nicolas, J., Peubey, C., Radu, R., Schepers, D., Simmons, A., Soci, C., Abdalla, S., Abellan, X., Balsamo, G., Bechtold, P., Biavati, G., Bidlot, J., Bonavita, M., De Chiara, G., Dahlgren, P., Dee, D., Diamantakis, M., Dragani, R., Flemming, J., Forbes, R., Fuentes, M., Geer, A., Haimberger, L., Healy, S., Hogan, R. J., Hólm, E., Janisková, M., Keeley, S., Laloyaux, P., Lopez, P., Lupu, C., Radnoti, G., de Rosnay, P., Rozum, I., Vamborg, F., Villaume, S., and Thépaut, J.-N.: The ERA5 global reanalysis, Quart. J. Roy. Meteor. Soc., 146, 1999–2049, https://doi.org/10.1002/qj.3803, 2020.
Hofstätter, M., Lexer, A., Homann, M., and Blöschl, G.: Large-scale heavy precipitation over central Europe and the role of atmospheric cyclone track types, Int. J. Climatol., 38, e497–e517, https://doi.org/10.1002/joc.5386, 2018.
Holton, J. R. and Hakim, G. J.: An Introduction to Dynamic Meteorology, 5th Edn., Academic Press, Cambridge, 552 p., https://doi.org/10.1016/C2009-0-63394-8, 2013.
Hoskins, B., McIntyre, M., and Robertson, A.: On the use and significance of isentropic potential vorticity maps, Q. J. Roy. Meteorol. Soc., 111, 877–946, https://doi.org/10.1256/smsqj.47001, 1985.
Houze, R. A., Rasmussen, K. L., Medina, S., Brodzik, S. R., and Romatschke, U.: Anomalous Atmospheric Events Leading to the Summer 2010 Floods in Pakistan, Bull. Amer. Meteor. Soc., 92, 291–298, https://doi.org/10.1175/2010BAMS3173.1, 2011.
Huffman, G. J., Stocker, E. F., Bolvin, D. T., Nelkin, E. J., and Tan, J.: GPM IMERG Final Precipitation L3 Half Hourly 0.1° × 0.1° V07, Greenbelt, MD, Goddard Earth Sciences Data and Information Services Center (GES DISC), https://doi.org/10.5067/GPM/IMERG/3B-HH/07, 2023.
ICPDR 2012: Floods in the Danube River Basin 2010, Brief overview of key events and lessons learned, https://www.icpdr.org/sites/default/files/nodes/documents/icpdr_flood_report_2010.pdf (last access: 5 September 2024), 2012.
Ionita, M. and Nagavciuc, V.: Extreme Floods in the Eastern Part of Europe: Large-Scale Drivers and Associated Impacts, Water, 13, 1122, https://doi.org/10.3390/w13081122, 2021.
Kautz, L.-A., Martius, O., Pfahl, S., Pinto, J. G., Ramos, A. M., Sousa, P. M., and Woollings, T.: Atmospheric blocking and weather extremes over the Euro-Atlantic sector – a review, Weather Clim. Dynam., 3, 305–336, https://doi.org/10.5194/wcd-3-305-2022, 2022.
Kholiavchuk, D. and Cebulska, M.: The highest monthly precipitation in the area of the Ukrainian and the Polish Carpathian Mountains in the period from 1984 to 2013, Theor. Appl. Climatol., 138, 1615–1628, https://doi.org/10.1007/s00704-019-02910-z, 2019.
Konrad, C. E.: The Most Extreme Precipitation Events over the Eastern United States from 1950 to 1996: Considerations of Scale, J. Hydrometeor., 2, 309–325, https://doi.org/10.1175/1525-7541(2001)002<0309:TMEPEO>2.0.CO;2, 2001.
Kovalets, I. V., Kivva, S. L., and Udovenko, O. I.: Usage of the WRF/DHSVM model chain for simulation of extreme floods in mountainous areas: a pilot study for the Uzh River Basin in the Ukrainian Carpathians, Nat. Hazards, 75, 2049–2063, https://doi.org/10.1007/s11069-014-1412-0, 2015.
Lau, W. K. M. and Kim, K.-M.: The 2010 Pakistan flood and Russian heat wave: Teleconnection of hydrometeorologic extremes, J. Hydrometeorol., 13, 392–403, https://doi.org/10.1175/JHM-D-11-016.1, 2012.
Lenggenhager, S. and Martius, O.: Atmospheric blocks modulate the odds of heavy precipitation events in Europe, Clim. Dynam., 53, 4155–4171, https://doi.org/10.1007/s00382-019-04779-0, 2019.
Lenggenhager, S., Croci-Maspoli, M., Brönnimann, S., and Martius, O.: On the dynamical coupling between atmospheric blocks and heavy precipitation events: A discussion of the southern Alpine flood in October 2000, Q. J. Roy. Meteorol. Soc., 145, 719, https://doi.org/10.1002/qj.3449, 2018.
Lehner, B., Verdin, K., and Jarvis, A.: New global hydrography derived from spaceborne elevation data, Eos, Transactions, AGU, 89, 93–94, https://hdl.handle.net/10568/88952 (last access: 11 January 2025), 2008.
Madsen, H., Lawrence, D., Lang, M., Martinkova, M., and Kjeldsen, T. R.: Review of trend analysis and climate change projections of extreme precipitation and floods in Europe, J. Hydrol., 519, 3634–3650, https://doi.org/10.1016/j.jhydrol.2014.11.003, 2014.
Massacand, A. C., Wernli, H., and Davies, H. C.: Heavy precipitation on the Alpine southside: An upper-level precursor, Geophys. Res. Lett., 25, 1435–1438, https://doi.org/10.1029/98GL50869, 1998.
Mantovani, J., Alcântara, E., Pampuch, L. A., Baião, C. F. P., Park, E., Custódio, M. S., Gozzo, L. F., and Bortolozo, C. A.: Assessing flood risks in the Taquari-Antas Basin (Southeast Brazil) during the September 2023 extreme rainfall surge, Nat. Hazards, 1, 9, https://doi.org/10.1038/s44304-024-00009-8, 2024.
Martius, O., Zenklusen, E., Schwierz, C., and Davies, H. C.: Episodes of Alpine heavy precipitation with an overlying elongated stratospheric intrusion: a climatology, Int. J. Climatol., 26, 1149–1164, https://doi.org/10.1002/joc.1295, 2006.
Martius, O., Sodemann, H., Joos, H., Pfahl, S., Winschall,A., Croci-Maspoli, M., Graf, M., Madonna, E., Mueller, B., Schemm, S., Sedlácek, J., Sprenger, M., and Wernli, H.: The role of upper-level dynamics and surface processes for the Pakistan flood of July 2010, Q. J. R. Meteorol. Soc., 139, 675, https://doi.org/10.1002/qj.2082, 2012.
Matsueda, M.: Predictability of Euro-Russian blocking in summer of 2010, Geophys. Res. Lett., 38, L06801, https://doi.org/10.1029/2010GL046557, 2011.
Miri, M., Raziei, T., Zand, M., and Kousari, M. R.: Synoptic aspects of two flash flood-inducing heavy rainfalls in southern Iran during 2019–2020, Nat. Hazards, 115, 2655–2672, https://doi.org/10.1007/s11069-022-05658-4, 2023.
Moore, B. J., Keyser, D., and Bosart, L. F.: Linkages between extreme precipitation events in the central and eastern United States and Rossby wave breaking, Mon. Wea. Rev., 147, 3327–3349, https://doi.org/10.1175/MWR-D-19-0047.1, 2019.
Morin, E. and Yakir, H.: Hydrological impact and potential flooding of convective rain cells in a semi-arid environment, Hydrol. Sci. J., 59, 1353–1362, https://doi.org/10.1080/02626667.2013.841315, 2014.
Morote, Á.-F., Tévar, B., and Olcina, J.: The 2024 Floods in Valencia (Spain): Case Study of Flood Risk Education in a Primary Education Setting, GeoHazards, 6, 30, https://doi.org/10.3390/geohazards6020030, 2025.
Moskalenko, S. and Malytska, L.: Peak maxima on the rivers of the Prut and Siret basins (within Ukraine), Acta Hydrol. Slovaca, 22, https://doi.org/10.31577/ahs-2021-0022.02.0021, 2021.
Nieto, R., Sprenger, M., Wernli, H., Trigo, R. M., and Gimeno, L.: Identification and Climatology of Cut-off Lows near the Tropopause, Ann. NY Acad. Sci., 1146, 256–290, https://doi.org/10.1196/annals.1446.016 , 2008.
Pfahl, S., Schwierz, C., Croci-Maspoli, M., Grams, C. M., and Wernli, H.: Importance of latent heat release in ascending air streams for atmospheric blocking, Nat, Geosci,, 8, 610–614, https://doi.org/10.1038/ngeo2487, 2015.
Piaget, N., Froidevaux, P., Giannakaki, P., Gierth, F., Martius, O., Riemer, M., Wolf, G., and Grams, C. M.: Dynamics of a local Alpine flooding event in October 2011: moisture source and large-scale circulation, Q. J. R. Meteorol. Soc., 141, 1922–1937, https://doi.org/10.1002/qj.2496, 2015.
Pirnach, G., Belyi, T., Shpyg, V., and Dudar, S.: Heavy precipitation in Eastern Carpathian and microphysical mechanisms of their formation, The 13-th Conference on Cloud Physics, 28, https://ams.confex.com/ams/pdfpapers/170141.pdf (last access: 8 October 2025), 2010.
Porcu, F., Caracciolo, C., and Prodi, F.: Cloud systems leading to flood events in Europe: an overview and classification, Meteorol. Appl., 10, 217–227, https://doi.org/10.1017/S1350482703003025, 2003.
Porcú, F., Carrassi, A., Medaglia, C. M., Prodi, F., and Mugnai, A.: A study on cut-off low vertical structure and precipitation in the Mediterranean region, Meteorol. Atmos. Phys., 96, 121–140, https://doi.org/10.1007/s00703-006-0224-5, 2007.
Portmann, R.: The life cycles of potential vorticity cut-offs, Climatology, predictability and high impact weather, Doctoral dissertation, ETH Zurich, https://doi.org/10.3929/ethz-b-000466735, 2020.
Portmann, R., Sprenger, M., and Wernli, H.: The three-dimensional life cycles of potential vorticity cutoffs: a global and selected regional climatologies in ERA-Interim (1979–2018), Weather Clim. Dynam., 2, 507–534, https://doi.org/10.5194/wcd-2-507-2021, 2021.
Riboldi, J., Noyelle, R., Agayar, E., Binder, H., Federer, M., Hartmuth, K., Sprenger, M., Thurnherr, I., and Vishnupriya, S.: Storm Boris (2024) in the current and future climate: a dynamics-centered contextualization, and some lessons learnt, Weather Clim. Dynam., 7, 65–87, https://doi.org/10.5194/wcd-7-65-2026, 2026.
Rimbu, N., Stefan, S., Busuioc, A., and Georgescu, F.: Links between blocking circulation and precipitation extremes over Romania in summer, Int. J. Climatol., 36, 369–376, https://doi.org/10.1002/joc.4353, 2016.
Rinat, Y., Marra, F., Armon, M., Metzger, A., Levi, Y., Khain, P., Vadislavsky, E., Rosensaft, M., and Morin, E.: Hydrometeorological analysis and forecasting of a 3 d flash-flood-triggering desert rainstorm, Nat. Hazards Earth Syst. Sci., 21, 917–939, https://doi.org/10.5194/nhess-21-917-2021, 2021.
Romanescu, G. and Stoleriu, C. C.: Exceptional floods in the Prut basin, Romania, in the context of heavy rains in the summer of 2010, Nat. Hazards Earth Syst. Sci., 17, 381–396, https://doi.org/10.5194/nhess-17-381-2017, 2017.
Romanescu, G., Mihu-Pintilie, A., Stoleriu, C. C., Carboni, D., Paveluc, L. E., and Cimpianu, C. I.: A Comparative Analysis of Exceptional Flood Events in the Context of Heavy Rains in the Summer of 2010: Siret Basin (NE Romania) Case Study, Water, 10, 216, https://doi.org/10.3390/w10020216, 2018.
Röthlisberger, M., Scherrer, B., de Vries, A. J., and Portmann, R.: The role of cyclones and potential vorticity cutoffs for the occurrence of unusually long wet spells in Europe, Weather Clim. Dynam., 3, 733–754, https://doi.org/10.5194/wcd-3-733-2022, 2022.
Schneidereit, A., Schubert, S., Vargin, P., Lunkeit, F., Zhu, X., Peters, D. H. W., and Fraedrich, K.: Large-Scale Flow and the Long-Lasting Blocking High over Russia: Summer 2010, Mon. Wea. Rev., 140, 2967–2981, https://doi.org/10.1175/MWR-D-11-00249.1, 2012.
Sharma, A., Wasko, C., and Lettenmaier, D. P.: If Precipitation Extremes Are Increasing, Why Aren't Floods?, Water Resour. Res., 54, 8545–8551, https://doi.org/10.1029/2018WR023749, 2018.
Snizhko, S., Bertola, M., Ovcharuk, V., Shevchenko, O., Didovets, I., and Blöschl, G.: Climate impact on flood changes – an Austrian-Ukrainian comparison, J. Hydrol. Hydromech., 71, 3, 271–282, https://doi.org/10.2478/johh-2023-0017, 2023.
Sousa, P. M., Trigo, R. M., Barriopedro, D., Soares, P. M. M., Ramos, A. M., and Liberato, M. L. R.: Responses of European precipitation distributions and regimes to different blocking locations, Clim. Dyn., 48, 1141–1160, https://doi.org/10.1007/s00382-016-3132-5, 1280, 2017.
State Agency of Water Resources of Ukraine: Floods of 2008, 2010 and 2020 – consequences and damages, https://www.davr.gov.ua/news/pavodki-2008-2010-ta-2020-rokiv--naslidki-ta-zbitki, last access: 27 May 2025.
Stefanyshyn, D. V.: What could we have learnt from the previous flood data to predict losses caused by the 1980, 1986, and 1998 catastrophic floods in Ukrainian Transcarpathian?, Environ. Saf. Nat. Resour., 43, 81–109, https://doi.org/10.32347/2411-4049.2022.3.81-109, 2022.
Stucki, P., Rickli, R., Bronnimann, S., Martius, O., Wanner, H., Grebner, D., and Luterbacher, J.: Weather patterns and hydro-climatological precursors of extreme floods in Switzerland since 1868, Meteorologische Z., 21, 531–550, https://doi.org/10.1127/0941-2948/2012/368, 2012.
Thayyen, R. J., Dimri, A. P., Kumar, P., and Agnihotri, G.: Study of cloudburst and flash floods around Leh, India, during August 4–6, 2010, Nat. Hazards, 65, 2175–2204, https://doi.org/10.1007/s11069-012-0464-2, 2013.
Torma, C. and Giorgi, F.: On the evidence of orographical modulation of regional fine scale precipitation change signals: The Carpathians, Atmos. Sci. Lett., 21, e967, https://doi.org/10.1002/asl.967, 2020.
Trenberth, K. E. and Fasullo, J. T.: Climate extremes and climate change: The Russian heat wave and other climate extremes of 2010, J. Geophys. Res., 117, D17103, https://doi.org/10.1029/2012JD018020, 2012.
Ukraine Floods: Final Report, https://reliefweb.int/report/ukraine/ukraine-floods-dref-operation-no-mdrua005-final-report (last access: 10 May 2024), 2011.
Ukraine Floods: Final Report, https://reliefweb.int/report/ukraine/ukraine-floods-final-report-dref-operation-n-mdrua010 (last access: 15 May 2024), 2020.
Ulbrich, U., Brücher, T., Fink, A., Leckebusch, G., Krüger, A., and Pinto, J.: The central European floods in August 2002. Part I: rainfall periods and flood development, Weather, 58, 371–376, https://doi.org/10.1256/wea.61.03B, 2003.
Vyshnevskyi, V. I. and Kutsiy, A. V.: Long-term changes in the water regim of revers in Ukraine, Kyiv, Naukova dumka, 252, https://er.nau.edu.ua/handle/NAU/56293 (last access: 10 June 2025), 2022.
Wernli, H. and Sprenger, M.: Identification and ERA15 climatology of potential vorticity streamers and cut-offs near the extratropical tropopause, J. Atmos. Sci., 64, 1569–1586, https://doi.org/10.1175/JAS3912.1, 2007.
Winschall, A., Pfahl, S., Sodemann, H., and Wernli, H.: Comparison of Eulerian and Lagrangian moisture source diagnostics – the flood event in eastern Europe in May 2010, Atmos. Chem. Phys., 14, 6605–6619, https://doi.org/10.5194/acp-14-6605-2014, 2014.
World Economic Forum: Quantifying the impact of climate change on human health, https://www.weforum.org/publications/quantifying-the-impact-of-climate-change-on-human-health/, last access: 11 September 2024.
World Health Organization: Floods in Moldova, Romania and Ukraine (summer 2008), https://www.ifrc.org/docs/appeals/08/MDR67003eu1.pdf (last access: 8 September 2024), 2021.
- Abstract
- Introduction
- Study area, data and methods
- Case studies of extreme floods
- Anomalous PV structures during cases
- Discussion
- Conclusions
- Data availability
- Video supplement
- Author contributions
- Competing interests
- Disclaimer
- Acknowledgements
- Financial support
- Review statement
- References
- Supplement