the Creative Commons Attribution 4.0 License.
the Creative Commons Attribution 4.0 License.
 | 11 Jun 2026
A high-resolution framework for urban pluvial flood risk mapping
Anastasia Vogelbacher
Malte von Szombathely
Marc Lennartz
Benjamin Poschlod
Jana Sillmann
This study presents a high-resolution framework for assessing climate-related risk at the building scale by implementing the IPCC risk concept, defining risk as a function of vulnerability, exposure and hazard. The framework focuses on pluvial flood risk related to people's well-being and mobility. Hazard is driven by a 100-year rainfall event (36 mm h−1), modelled with a hydrodynamic flood simulation incorporating topography, drainage capacity, and land use. Exposure is differentiated by impact type, considering residents on ground floors for well-being and building proximity to flooded streets for mobility and accessibility. Social vulnerability is quantified using socioeconomic indicators such as age, income, and education. The framework is demonstrated using empirical data from Hamburg, Germany, identifying risk hotspots where high social vulnerability coincides with elevated flood exposure. To support practical implementation, we introduce a Python-based ArcGIS pluvial flood risk toolbox that enables automated, building-level risk mapping. The transparent and flexible design makes the framework transferable to other cities, supporting climate adaptation planning and risk-informed decision-making.
- Article
(8258 KB) - Full-text XML
-
Supplement
(15590 KB) - BibTeX
- EndNote


More than half of the world's population (55 %) currently resides in urban areas, a figure projected to increase to 68 % by 2050 (United Nations, 2019). Urbanization, coupled with climate change, intensifies the risk of pluvial flooding, especially in strongly sealed cities where intense rainfall leads to small-scale, rapid flooding events (Fereshtehpour and Najafi, 2025; Arnbjerg-Nielsen et al., 2013; Scalenghe and Marsan, 2009). Climate change already exacerbates short-duration rainfall extremes (Lang and Poschlod, 2024), with further intensification expected under warming scenarios (Fowler et al., 2021).
While Hamburg, Germany, is well known for severe storm-surges in the past (De Guttry and Ratter, 2022), recent pluvial rainfall events gained attention by city stakeholders and the media (Boettcher et al., 2025; Osuide, 2022). The city of Hamburg focuses endeavours for sustainable rainwater management by developing concepts (e.g. Rainwater Infrastructure Adaptation project (RISA), Freie und Hansestadt Hamburg, Behörde für Umwelt, Klima, Energie und Agrarwirtschaft, 2026) collaboratively with the participation of several municipal stakeholders. Two major and local past rainfall events in the city located in Lohbrügge (2018) and Barmbek (2024) motivated this study. Both extreme events (Schmitt, 2016) caused severe flooding, infrastructure damage, major traffic disruptions and evacuations of a few families due to sinkholes (Deutscher Wetterdiens (DWD), 2021). Recent studies emphasize the importance of understanding these extreme events at high temporal and spatial resolutions, as they significantly influence urban flood risk assessments (Sillmann et al., 2024). While several modelling approaches for pluvial flood hazard and vulnerability assessment exist, their effectiveness depends heavily on data availability and local conditions (Cea and Costabile, 2022; Bulti and Abebe, 2020; Nkwunonwo et al., 2020). High-resolution models are essential for credible risk assessments and effective flood management strategies (Rehman et al., 2019; Fritsch et al., 2016).
Previous work on high-resolution flood risk management mainly focused on the hazard component, e.g. by integrating high-resolution flood modelling (Bertsch et al., 2022). However, only a few cases expanded the hazard-focused view by incorporating additional variables into the risk estimation, such as susceptibility and exposure at the basin scale (Devi et al., 2025; Afifi et al., 2019) or the building usage to estimate the damage potential (Bhola et al., 2020). Other studies linked citizen science to flood modelling (Assumpção et al., 2018). Notably, certain projects have used physically-based damage modelling approaches to quantify risk more precisely (e.g. Gentile et al., 2022), providing valuable insights for urban flood risk management. However, the integration of all three variables, hazard, exposure and (social) vulnerability remains largely unaddressed on this scale.
Building on these advances, the availability of high-resolution flood simulations requires water managers and adaptation planners to access targeted insights from these extensive datasets, beyond simple overlays of layers such as flood extents, population distributions, and social vulnerability metrics. Our approach addresses this need by quantifying the combined effects of social vulnerability, exposure, and hazard, thereby enabling the identification of risk hotspots to support adaptation planning. The proposed framework emphasizes user-friendly, stakeholder-oriented tools and goes beyond existing approaches. It provides a generic method for assessing pluvial flood risk by following the Intergovernmental Panel on Climate Change (IPCC) risk definition from the Fifth Assessment Report, which conceptualizes risk as a function of hazard, exposure, and vulnerability (IPCC, 2014). To tailor this framework for an urban context, we adapt the social vulnerability concept articulated by von Szombathely et al. (2023), specifically focusing on its application to pluvial flood hazards on a building-resolving scale. This approach emphasizes the importance of understanding social dynamics in risk assessments, aligning with recent research efforts that aim to integrate hazard-specific vulnerability profiles within urban settings (Alves et al., 2021). Central to this effort is the creation of a stakeholder-informed Python-based ArcGIS toolbox designed to generate flood risk maps, supporting urban stakeholders in flood risk management. We introduce two pluvial flood risk indices: one for well-being and one for mobility and accessibility. The well-being index measures risks to human well-being, including injuries and, in extreme cases, fatalities. It also accounts for material damage and costly, time-consuming repairs. The mobility index assesses limits on entering or leaving buildings. It also reflects disruptions to critical infrastructure and access to care and medication during emergencies. Both indices are classified in relative classes depending on the buildings included in the study area. This allows for the identification of relative risk hotspots that absolute metrics might miss, especially in areas with overall moderate risk. This framework demonstrates a transferable approach through an example using building-specific data, where the dataset is synthetically generated but informed by data from a city quarter in Hamburg. It aims to support reproducible urban flood risk assessments, enabling stakeholders and risk managers to assess flood risk holistically at the building level. We follow the FAIR Principles (Findable, Accessible, Interoperable, Reusable), ensuring that both data and methods are transparently shared and can be used effectively by other cities (Wilkinson et al., 2016). With this approach, we aim to bridge the gap between technical flood hazard modelling and decision-oriented risk management, enabling more informed, transparent, and holistic urban flood risk planning.
For this analysis, we use the ArcGIS Pro Software (Environmental Systems Research Institute (ESRI), 2023) and the Python programming language (Python Software Foundation, 2026) to ensure both professional functionality and open-source adaptability. ArcGIS Pro is a license-based software and for this analysis, the advanced license is used. Since ESRI products are widely used among the involved stakeholders, the primary application presented here is based on the ArcGIS Pro environment. More specifically, we employ the Model Builder tool, which enables users to sequence geoprocessing tools and package them into reproducible workflows, also known as toolsets, which are organized within a toolbox. This approach allows others to easily replicate the analytical steps described in this study.
To ensure transparency and facilitate open-source data replication, all models created using the Model Builder were also exported as Python scripts, allowing users to run or modify them outside the ArcGIS environment.
2.1 Input data
In this case study, we make use of hydrodynamic model simulations of urban flood water levels, which are complemented by empirical socio-economic data from a single statistical unit (neighbourhood) in Hamburg. While the hydrodynamic simulations are available at high spatial resolution, socio-economic data are typically only provided as aggregated values on the neighbourhood scale. In Hamburg, statistical units are sub-regions reflecting a grouping of neighbouring building blocks that are assumed to be broadly similar in terms of their building and socio-structural characteristics (Freie und Hansestadt Hamburg, Statistikamt Nord, 2024). For this case study, we synthesized a plausible building-level realization of socio-economic and exposure data, to capture spatial variability within a city quarter.
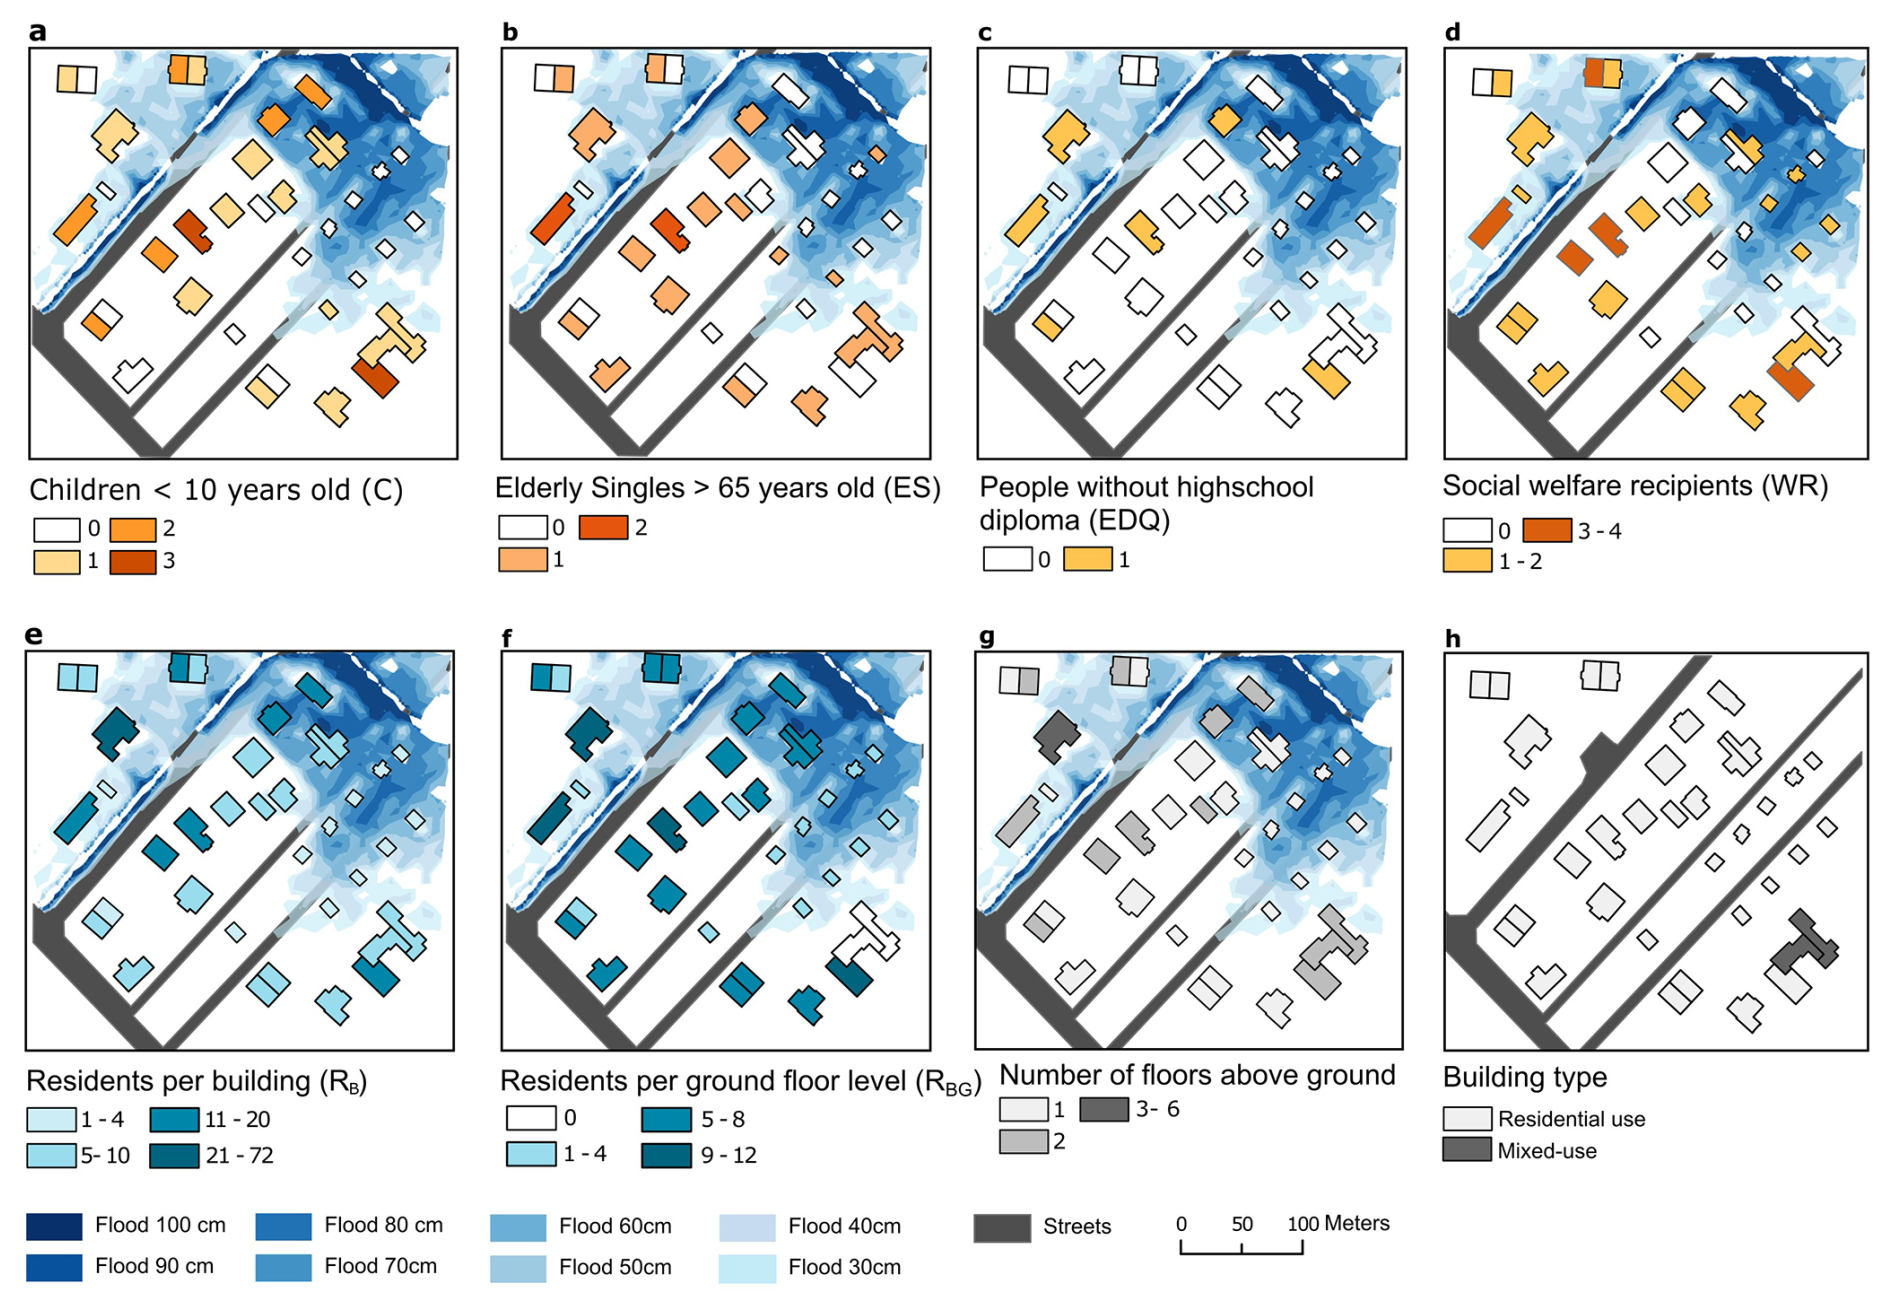
Figure 1Underlying input data for the risk map framework. The first row (a–d) includes social vulnerability parameters, whereas the bottom row (e–h) shows exposure related variables. Hazard related variables are depicted as flooding depths between 30 and 100 cm and is omitted in panel (h) to fully show the street network, created using ArcGIS Pro (ESRI, 2023 | Powered by Esri).
The dataset shown in Fig. 1 includes indicators of social vulnerability and exposure. Social vulnerability is represented by the number of children and elderly single residents (Fig. 1a–b) as a sensitivity component, as well as residents who left school within the past three years without obtaining a high school diploma (equivalent to the German Abitur) (Fig. 1c) and social welfare recipients, representing the coping-capacity component. These indicators are described in more detail in Sect. 2.2.
In addition, Fig. 1e–h present building-related data, including the number of residents per building and per ground floor (international first floor), building height, and building use. The area is primarily composed of residential buildings, with a small number of mixed-use buildings, where the ground floor is used for commercial purposes and the upper floors for housing.
This realization was developed using expert knowledge gathered during three stakeholder workshops involving local authorities (Table S1 in the Supplement summarizes the participating institutions). Population and social data were distributed to individual buildings reproducing the aggregated values for the whole statistical unit. While the here applied dataset is publicly available (Vogelbacher et al., 2025), high-resolution social data of this kind is rare.
To address this, we included a simple disaggregation tool within the toolbox, which is not used in this study. This tool distributes population linearly according to the living space of each building, while social characteristics are assigned equally across buildings within a statistical area. We acknowledge that this disaggregation scheme is a limitation potentially leading to an underestimation of local risk, where more sophisticated methodologies offer improved disaggregation (Sapena et al., 2022; Pajares et al., 2021; Wardrop et al., 2018). The underlying indices and proxy data used in this analysis are described in the following.
2.2 Social vulnerability: Socio-economic data
As socio-economic data is often available at aggregated scales, the toolbox offers the functionality to disaggregate the data equally across a statistical unit (von Szombathely et al., 2023). As shown by von Szombathely et al. (2023), both sensitivity and coping capacity are key components of social vulnerability, and the age structure of an area plays an especially important role (Fekete, 2009; Cutter et al., 2003). Authors in von Szombathely et al. (2023) highlight the particular role of children and elderly singles, since they are particularly dependent on external help and less mobile. This became even clearer in past flooding events in Germany (Ahr Valley, June 2021), where mainly elderly and disabled people were affected by the flood event (Kosanic et al., 2022). Therefore, two age-based variables have been defined to address the sensitivity aspect of the social vulnerability index: (a) the elderly singles variable defined as people older than 65 years living alone and (b) children younger than 10 years, who generally need more assistance and may have difficulty understanding evolving situations based on their cognitive and reading skills von Szombathely et al. (2023). For our example, we created a realization at the building-level based on expert knowledge, distributing aggregated population numbers and social data from statistical units (neighbourhood) to the building level.
The second component in social vulnerability is coping capacity, as financial resources are crucial in disaster situations (Cutter et al. 2003). Based on data availability, eligibility for social welfare is used as a proxy for poverty and the likely need for external support (Holand et al., 2011). Additionally, the educational status is considered, since one ability to understand and improve a situation is closely related to ones coping capacity to an extreme event (described in more detail in the underlying works of Cutter, 2024; von Szombathely et al., 2023; Cutter et al., 2003). In Hamburg, this data is part of the official socio-spatial monitoring system (Freie und Hansestadt Hamburg, Behörde für Stadtentwicklung und Wohnen, 2024) designed to identify neighbourhoods with low social status and considers the number of residents who left school without a high school diploma (equivalent to German “Abitur”) within the last 3 years (Freie und Hansestadt Hamburg, Behörde für Stadtentwicklung und Wohnen, 2023, 2024; Freie und Hansestadt Hamburg, Behörde für Stadtentwicklung und Wohnen, 2023, 2024; Freie und Hansestadt Hamburg, Statistikamt Nord, 2024). This information is the only available data source providing information on the high school level for the case study example.
2.3 Exposure: Residents and building data
We define two distinct exposure variables, one related to mobility and accessibility and one related to well-being which we describe in more detail in Sect. 3.1.2 and 3.2.2. Due to data protection regulations, information on the number of residents in each building is not publicly available for German cities, like Hamburg. Instead, the latest population data is reported at the statistical unit level (neighbourhood scale) based on the year 2023 (Freie und Hansestadt Hamburg, Statistikamt Nord, 2024). Hence, we distribute the number of residents to the buildings of the case study guided by the living space of the buildings. We additionally include the number of above-ground floors and their primary function (residential or mixed-use, sourced from the official land register (ALKIS) provided by the city of Hamburg (Freie und Hansestadt Hamburg, Landesbetrieb Geoinformation und Vermessung, 2020).
2.4 Hazard: Modelled flood level data and street data
Simulations of pluvial flooding are provided by Hamburg's water supply and wastewater disposal company HAMBURG WASSER on behalf of and in cooperation with the Hamburg Ministry for Environment, Climate, Energy and Agriculture (Behörde für Umwelt, Klima, Energie und Agrarwirtschaft; BUKEA). Our case study example is based on the pluvial flood scenario triggered by a design rainfall of 36 mm h−1 reflecting a 100-year event (Freie und Hansestadt Hamburg, Behörde für Umwelt, Klima, Energie und Agrarwirtschaft, 2024) assuming a uniform probability of occurrence throughout the urban area with a resolution of 1 m2. Thereby, the 36 mm of rainfall are distributed along the 60 min period as Euler-II type design storm (Wartalska et al., 2020) as suggested by the German Association for Water, Wastewater and Waste (Deutsche Vereinigung für Wasserwirtschaft, Abwasser und Abfall (DWA), 2024).
The pluvial flood simulations are conducted using hydrodynamic model simulations that account for surface runoff, soil infiltration capacity, surface interception, and the capacity of the public sewer network. Therefore, the two-dimensional surface runoff model VISDOM (Blöschl et al., 2024; Buttinger-Kreuzhuber et al., 2019, 2022a, b; Waser et al., 2011) is bidirectionally coupled with the Storm Water Management Model (SWMM; Rossman and Simon, 2022), which one-dimensionally represents the sewer system. Model simulations were performed using a digital terrain model with a spatial resolution of 1 m, explicitly incorporating retention basins and drainage ditches. Clogging effects of inlets and drains are not represented in the simulations.
For the spatial analysis, any road network can be used. In this example we use road data obtained from the official land register (ALKIS) provided by the city of Hamburg (Freie und Hansestadt Hamburg, Landesbetrieb Geoinformation und Vermessung, 2020).
Table 1 provides an overview of the data used and their respective sources. An excerpt of input data is shown in Fig. S1 in the Supplement.
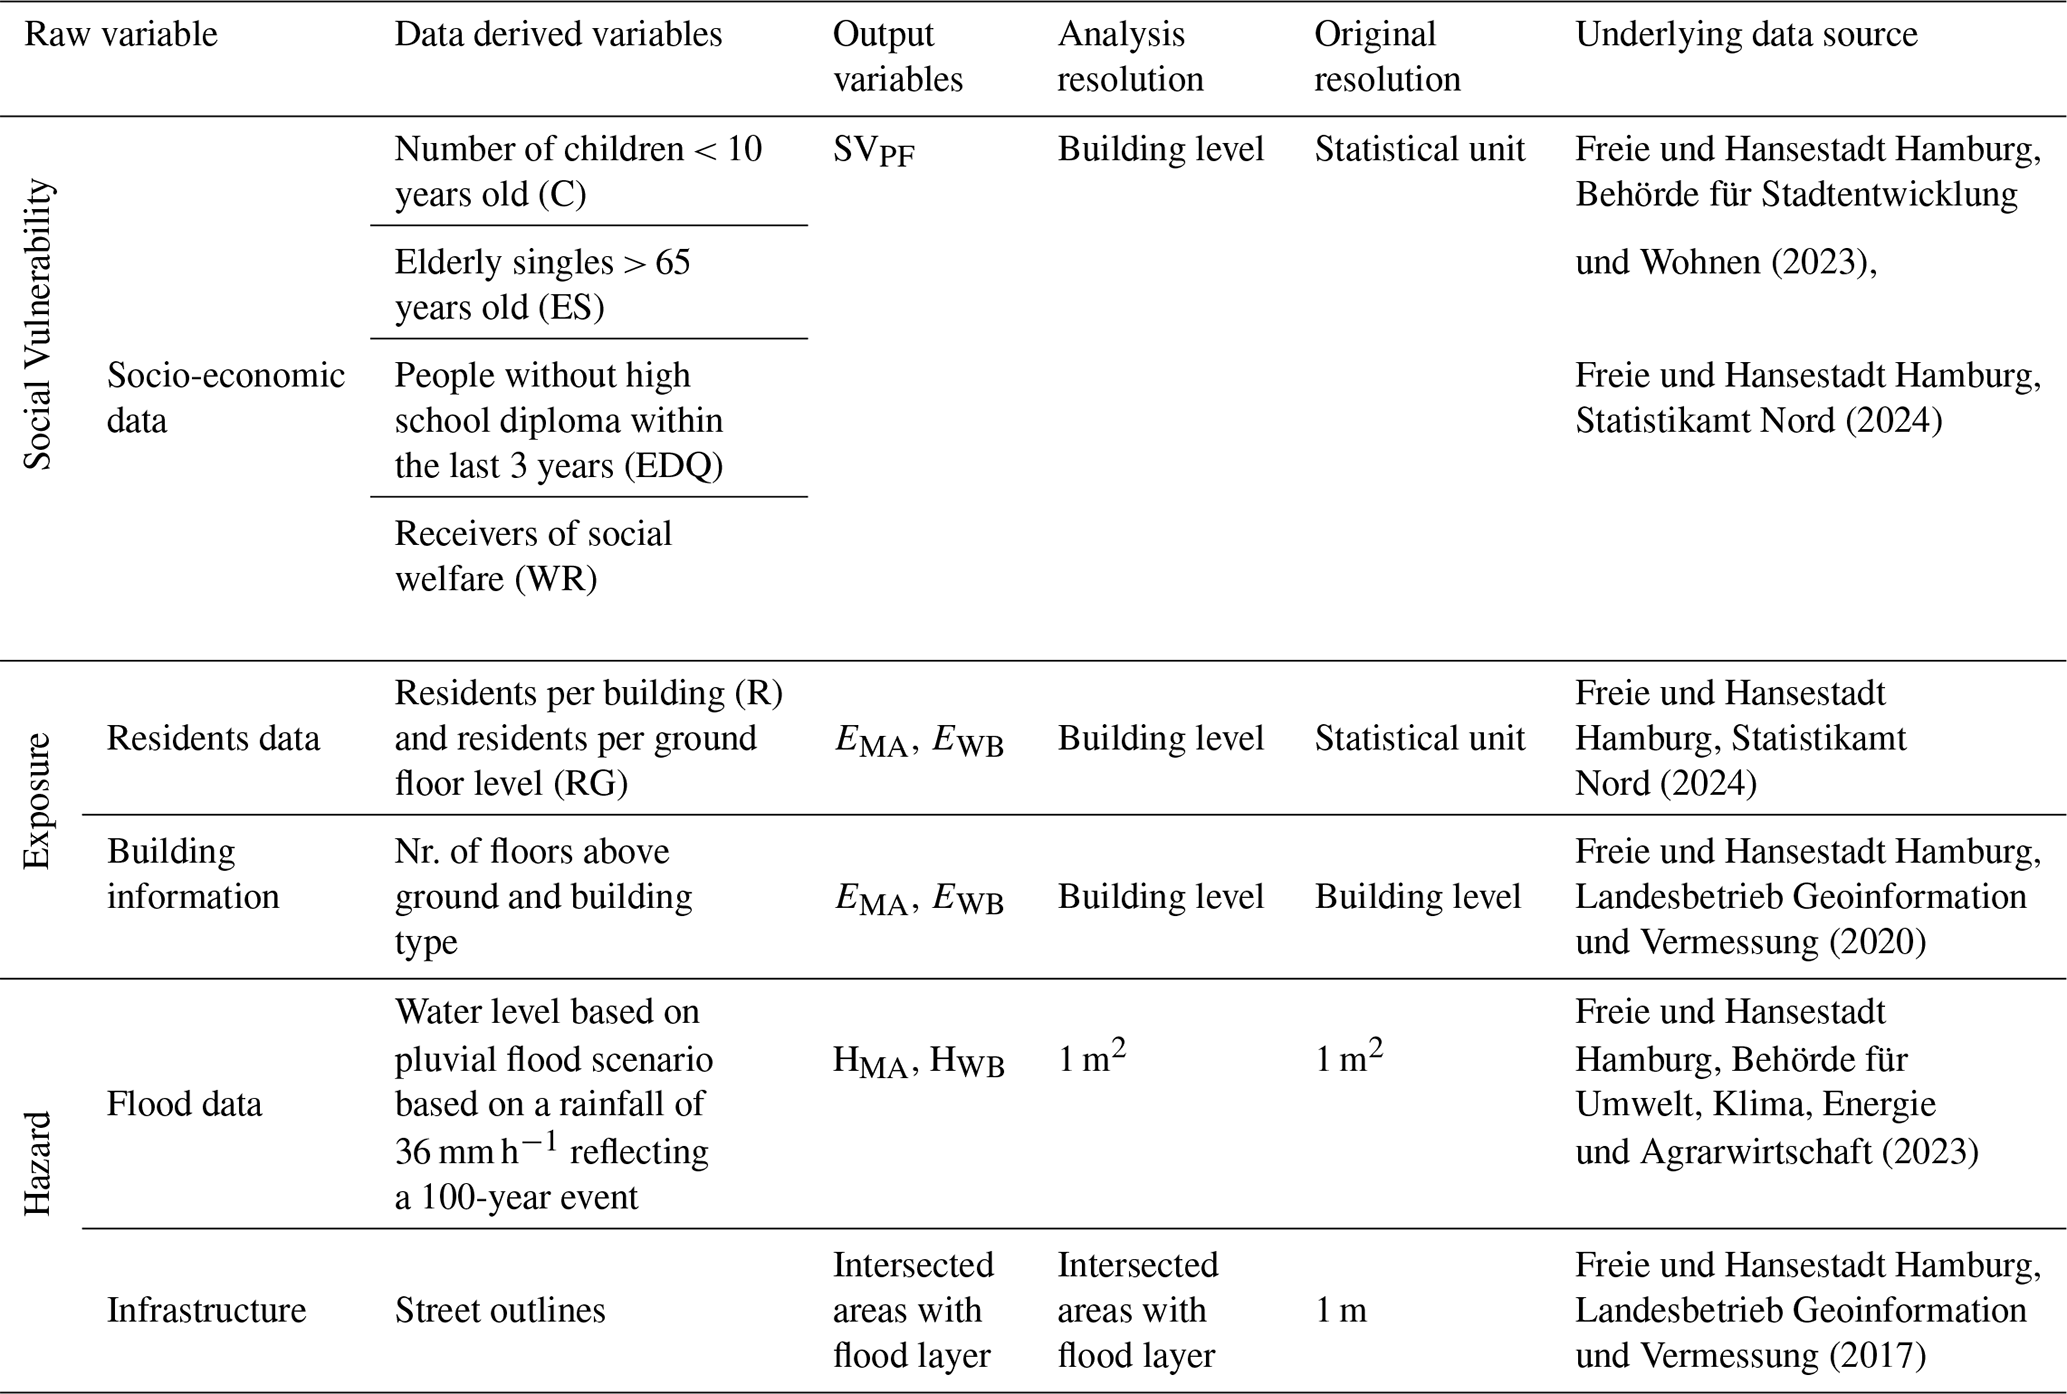
The applied input data and overall structure of the here presented methodology is presented in Fig. 2. The figure illustrates the methodological framework developed to assess pluvial flood risk (PFR) by integrating Social Vulnerability (SV), Exposure (E), and Hazard (H). Each component is processed separately based on its native data structure and subsequently harmonized to a common spatial resolution (building polygons) before the final risk calculation.
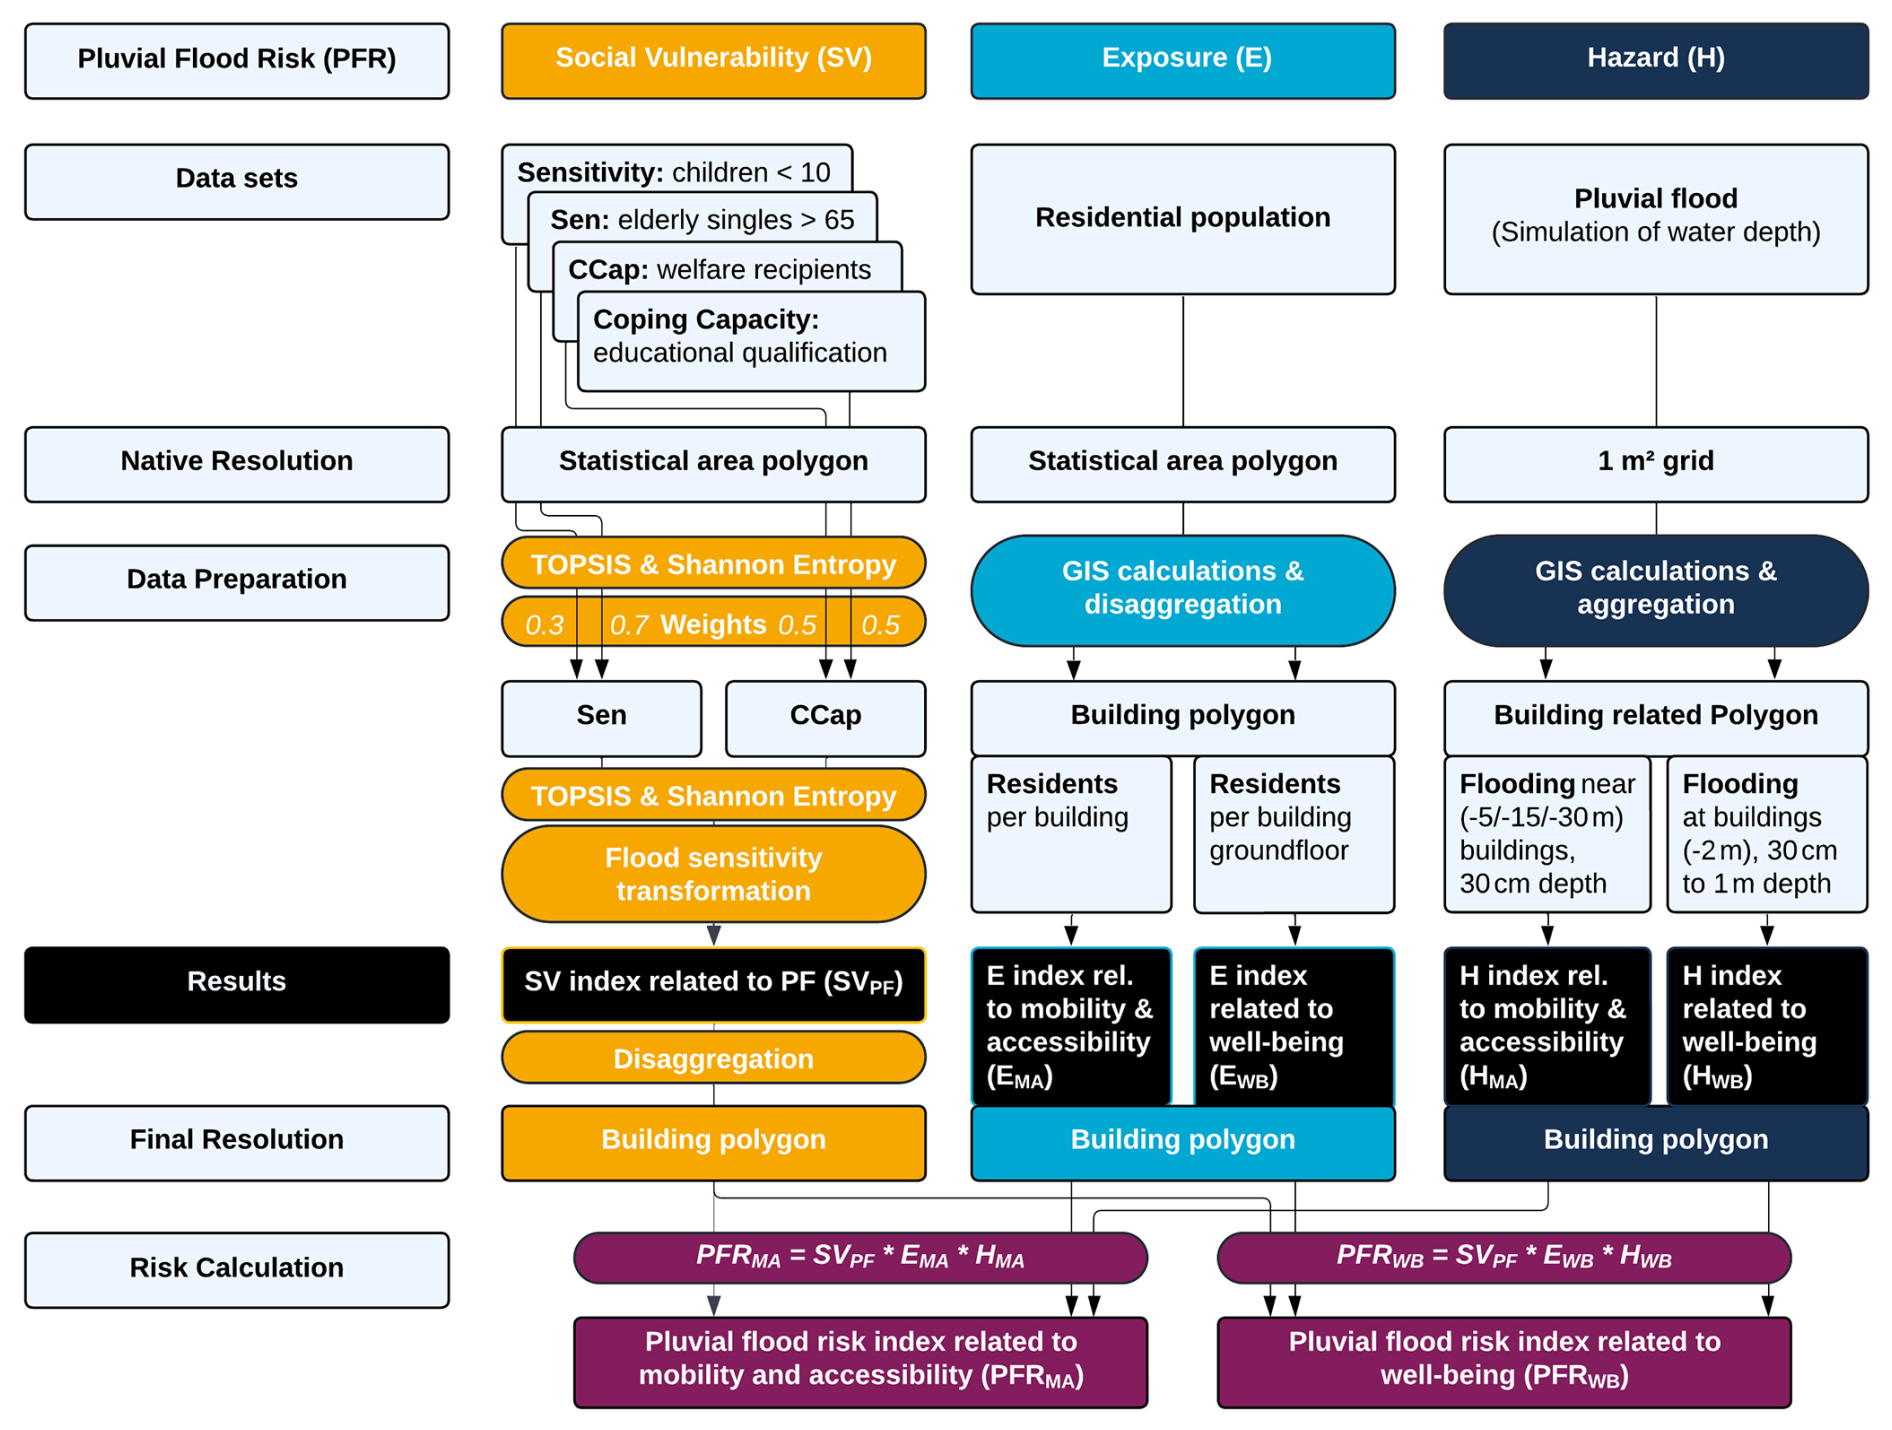
Figure 2Overview of the applied methodology for calculating pluvial flood risk at the household level in an exemplary urban environment. Colours and labels indicate the individual components and processing steps of the risk calculation.
The structure of the framework also serves as the structure for this section. Section 3.1 describes the conceptual design and data preparation for each column. Section 3.2 then shows the exact calculation and implementation in the ArcGIS toolbox.
3.1 Underlying concepts and data pre-processing
3.1.1 Social vulnerability
The concept of social vulnerability (SV) is based on the selection of socio-economic variables that are related to each other. An increase in any of these variables should lead to higher vulnerability. The assigned variables should is categorized as either Sensitivity or Coping Capacity in the context of flood events. For the calculation of SV, we followed the procedure presented in von Szombathely et al. (2023), where SV is calculated considering the coping capacity and sensitivity, both represented with equal importance (0.5,0.5). These weights are based on an analytical hierarchy process (AHP) and local expert opinions. All weights in either the group of sensitivity or coping capacity have to add up to one. In the case study, sensitivity is defined by assigning a weight of 0.7 to children under 10 years old (C) and 0.3 to elderly singles over 65 years old (ES). For coping capacity, equal importance (0.5) are used between the number of residents who left school without a high school diploma within the previous three years (EDQ) as well as recipients of social welfare (WR).
Since we include several variables that contribute to a combined flood risk index, it is important to consider how these variables interact to create a comprehensive assessment of flood risk. While the alternatives can be easily ranked based on a single attribute, combining all attributes into a single index requires special techniques. One method in flood risk analysis is the Technique for Order Performance by Similarity to an Ideal Solution (TOPSIS) (Hwang and Yoon, 1981) which has been applied in several flood risk analysis' (Pathan et al., 2022; Ekmekcioğlu et al., 2021; Rafiei-Sardooi et al., 2021; Nguyen et al., 2020; Yang et al., 2018) and was applied in this work in addition to the methodology presented (von Szombathely et al., 2023). This technique quantifies for each alternative (A1–A8 in Fig. 3) the relative distance to the positive ideal (A+ in Fig. 3) and negative ideal (A− in Fig. 3) and ranks them accordingly.
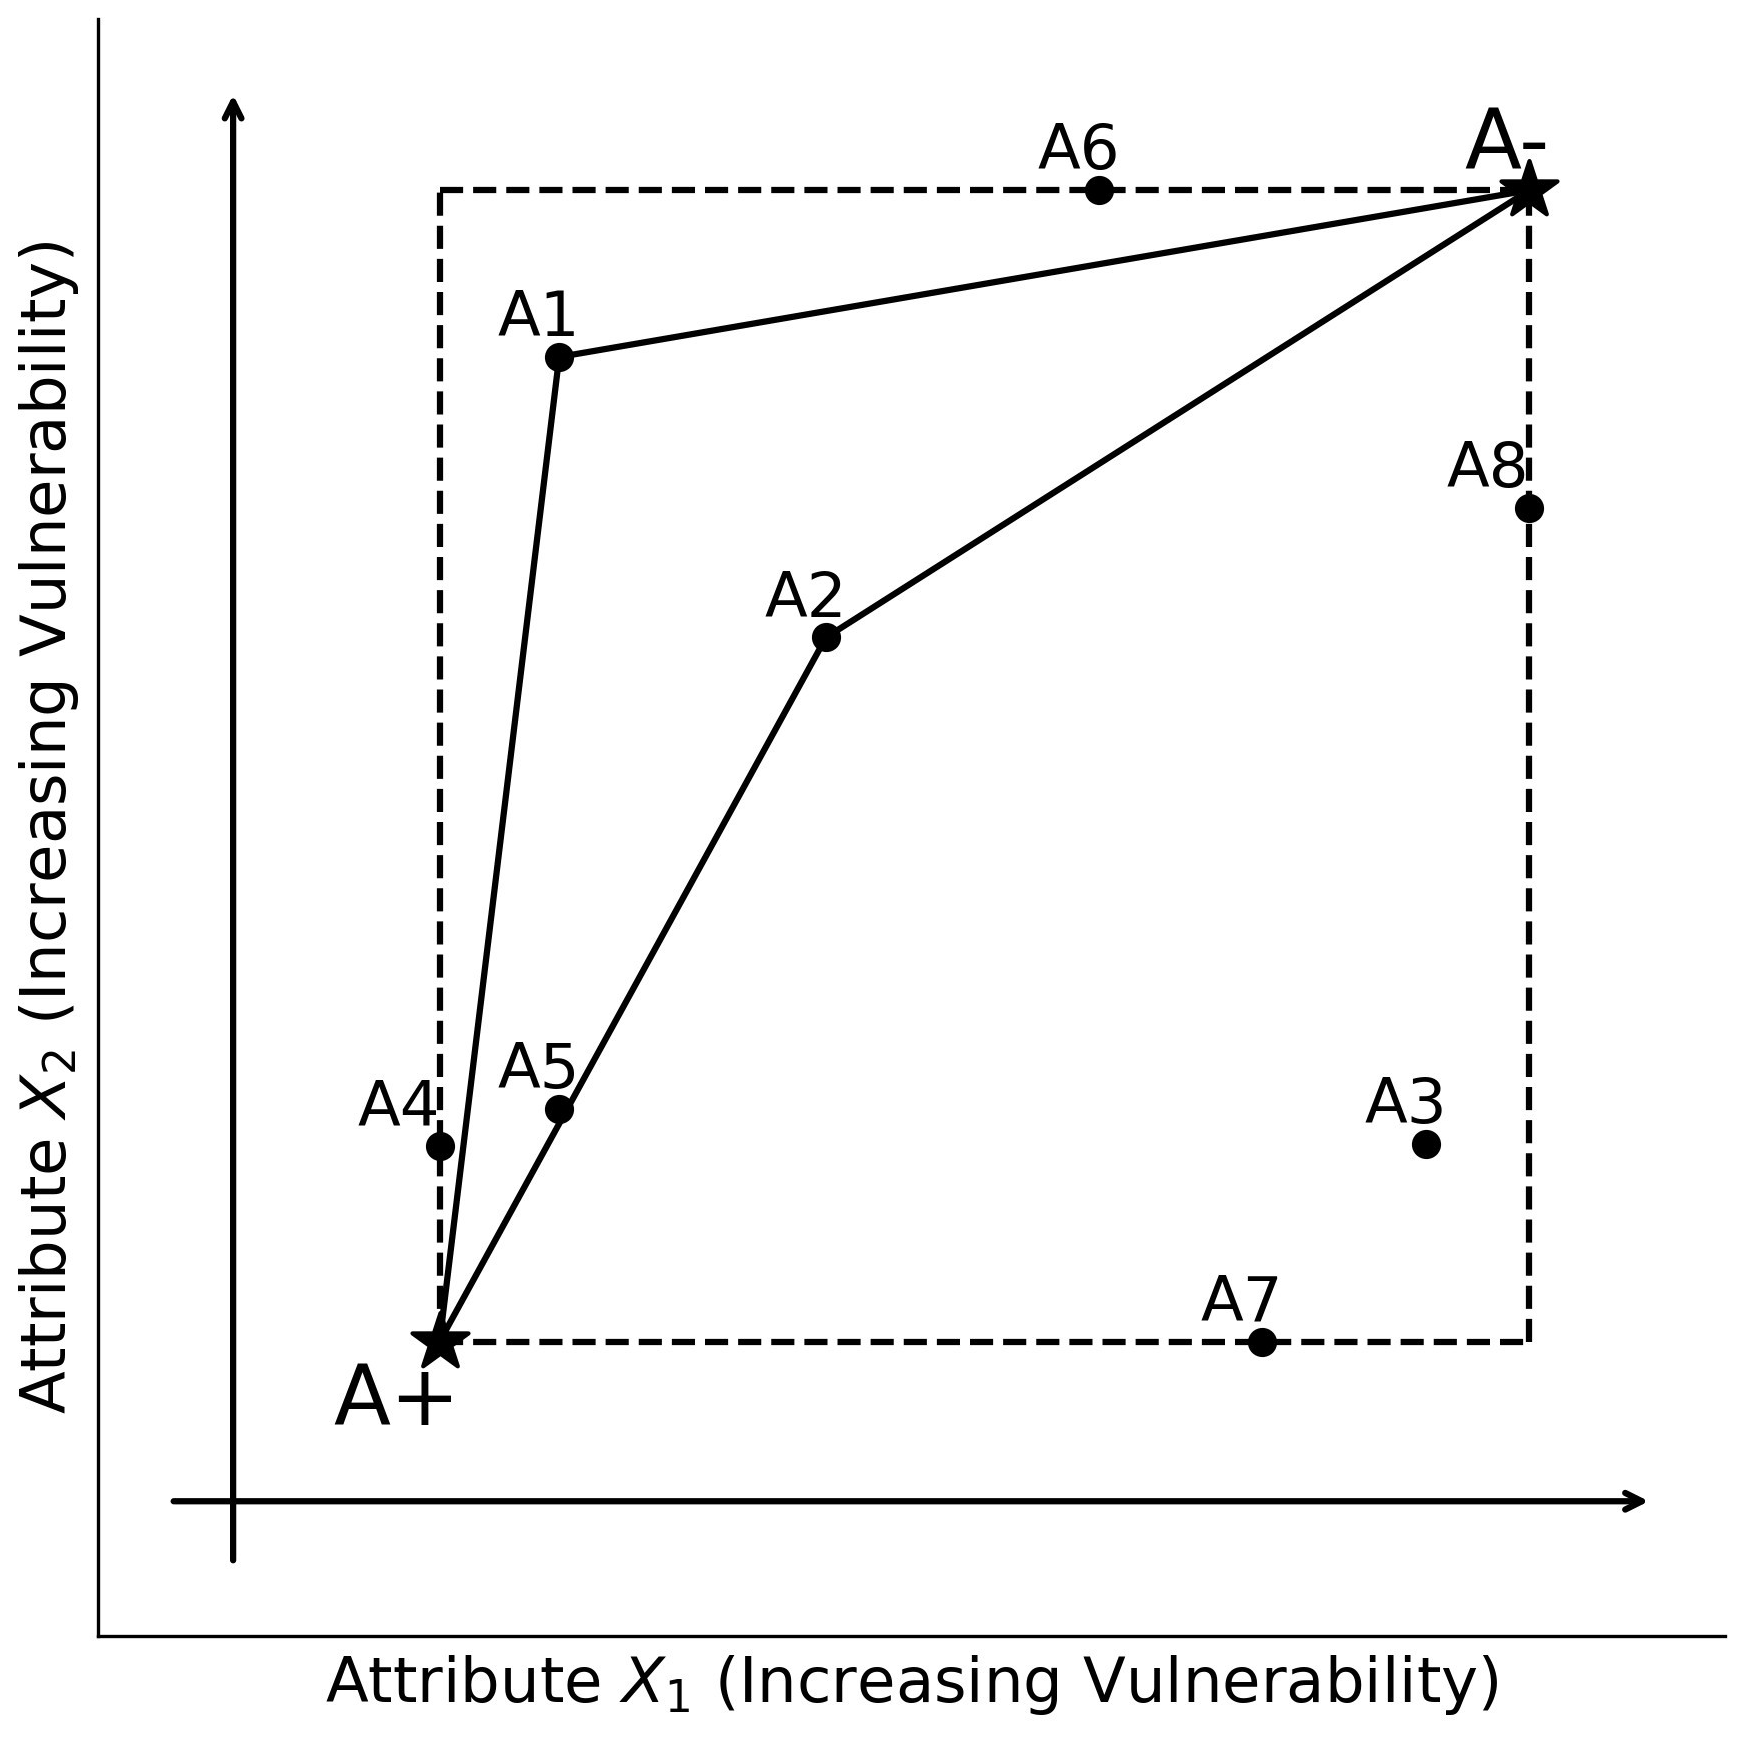
Figure 3Conceptual description of social vulnerability (adapted from Dyson, 2017). A− and A+ represent negative and positive ideals of the vector space (dashed lines) spanned by the smallest and largest attributes of the alternatives (A1 to A8). The solid lines depict the distance between two example points (A1 and A2) to either ideal point.
The TOPSIS method can compare attributes with differing units and is able to incorporate specific weights for each attribute (derived from AHP, see above), which scales the respective axis (X, Y, Fig. 3) and adjusts the distance between the respective values and the maximum (A−) and minimum (A+). Therefore, the values assigned to each alternative can also be interpreted geometrically: for each attribute, the maximum (A−) and minimum (A+) values define two ideal points within a multidimensional space (in our example: two-dimensional, since SV consists of Coping Capacity and Sensitivity). The number of dimensions is equal to the number of different attributes. Then each alternative occupies a place in space. Lastly, we can calculate the relative Euclidean distance to the negative and positive ideal (A−, A+ see Fig. 3).
Heterogeneity may be a driving factor in the way attributes contribute to the final risk index. This is not considered in the TOPSIS approach but can be compensated by applying the Shannon Entropy method (Shannon, 1948). Other studies have already applied this concept in a flood risk context (Malekinezhad et al., 2021; Yang et al., 2018). In our analysis, both the TOPSIS and the Shannon Entropy methods are applied to estimate Sensitivity, Coping Capacity and the Social Vulnerability Index (SVI). In short, the weights determined using the AHP method (from von Szombatehly et al., 2023) are incorporated into the TOPSIS algorithm (as described above), and the TOPSIS results are then further weighted using the Shannon entropy approach.
The distribution of the Social Vulnerability Index depends on the distribution of the initial socio-economic data. Since we do not assume that flood risk scales linearly with the SVI, we include an additional transformation (flood sensitivity transformation). By considering hazard, exposure and social vulnerability as risk (IPCC, 2014) observations with “no” social vulnerability would correspond to zero risk. In the case of the proposed SVI depending on age, social welfare and the high school diploma, zero values of the SVI are possible on the building scale. To prevent that this leads to zero risk, a value of a quarter mean of the SV value is added to the SV value. Additionally, we place an additional emphasis on the most vulnerable groups by squaring the SVI. This is a subjective choice based on expert knowledge, which has been shown to improve statistical models in assessing flood related social vulnerability (Rufat et al., 2019). We acknowledge the possible variations of resulting risk based on this transformation and show the effect of varying transformation thresholds as well as squaring the SVI on the overall estimated risk within the sensitivity analysis (Sect. 4.3).
3.1.2 Exposure
In line with the IPCC framework, we define exposure as the presence of people in areas that may be adversely affected by pluvial flooding. In this study, exposure is assessed in relation to the residential population and their places of residence. Since different flood hazards have varying impacts, we differentiate between hazards to mobility restrictions and accessibility and hazards to well-being, leading to two distinct exposure concepts:
- 1.
Exposure related to mobility and accessibility (EMA). Includes all residents of a given building, as flooding can affect their ability to enter or exit the premises.
- 2.
Exposure related to well-being (EWB). Considers only individuals residing on the ground floor, as they are directly affected by water entering the building.
For the case that population data is not present on building level but, we provide a sub-tool within the toolbox, which can allocate population data at the building level, assuming a uniform population distribution within each statistical unit. The total population is then distributed among residential buildings in proportion to their available living space. In the case of mixed-use buildings, we assume that the first floor (equivalent to ground floor) is dedicated to commercial use and does not contribute to the residential living area. This method improves the spatial accuracy of our exposure assessment by ensuring a more realistic distribution of inhabitants.
3.1.3 Hazard
In this study, we consider urban pluvial flooding as the hazard. We define water level thresholds based on existing studies on pluvial flooding (Lazzarin et al., 2022; Bhola et al., 2020; Calianno et al., 2013;) and building regulations (Bignami et al., 2019). Following the two distinct exposure concepts we define two pluvial flood hazards:
- 1.
Hazard related to well-being (HWB). Water levels between 30 cm and 1 m with 10 cm increments directly adjacent to buildings, to assess the potential for damage and danger to well-being.
- 2.
Hazard related to mobility and accessibility (HMA). 30 cm as a threshold for flooding near buildings, to evaluate how flooding impacts movement and access in affected areas.
We used water levels of equal to or higher than 30 cm as a lower threshold, as they obstruct evacuation and rescue, enhance the occurrence of street blocking and stranded vehicles, and significantly reduce safe movement in flooded areas (Lazzarin et al., 2022; Calianno et al., 2013). In the context of a design rainfall event with an intensity of 36 mm h−1 (corresponding to a 100-year return period; Schmitt, 2016) this threshold captures realistic near-building inundation depths that threaten well-being and accessibility, even at moderate flow velocities (0.5–2 m s−1) typical of such events (Landesanstalt für Umwelt, Messungen und Naturschutz Baden-Württemberg (LUBW), 2016).
3.1.4 Risk
Building on the previously established data indices, flood risk at the building level is assessed using the IPCC Risk Assessment framework (IPCC, 2014), which integrates hazard, exposure, and vulnerability to quantify risks associated with pluvial flooding. This approach enables a detailed evaluation of flood-related impacts on mobility and accessibility and well-being in Hamburg. Based on this conceptual decision to define two different approaches to hazard and exposure, we ultimately calculate two different risk indices:
- 1.
Pluvial flood risk to well-being (PFRWB)
- 2.
Pluvial flood risk to mobility and accessibility (PFRMA)
3.2 Toolbox architecture and model development
To adopt the theoretical concepts into reproducible workflows, we made use of the ArcGIS Pro (V.3.2.0) model builder (ESRI, 2023). We created a Risk Map Toolbox (Vogelbacher et al., 2025), which contains all calculation steps needed to represent the here shown results. The tools are stored in three toolsets, following the presented structure of the IPCC including Vulnerability, Exposure and Hazard (Fig. 4). For the final risk calculation, a script-based tool is added, as well as an optional tool which calculates the boundary classes used for the applied visualization.
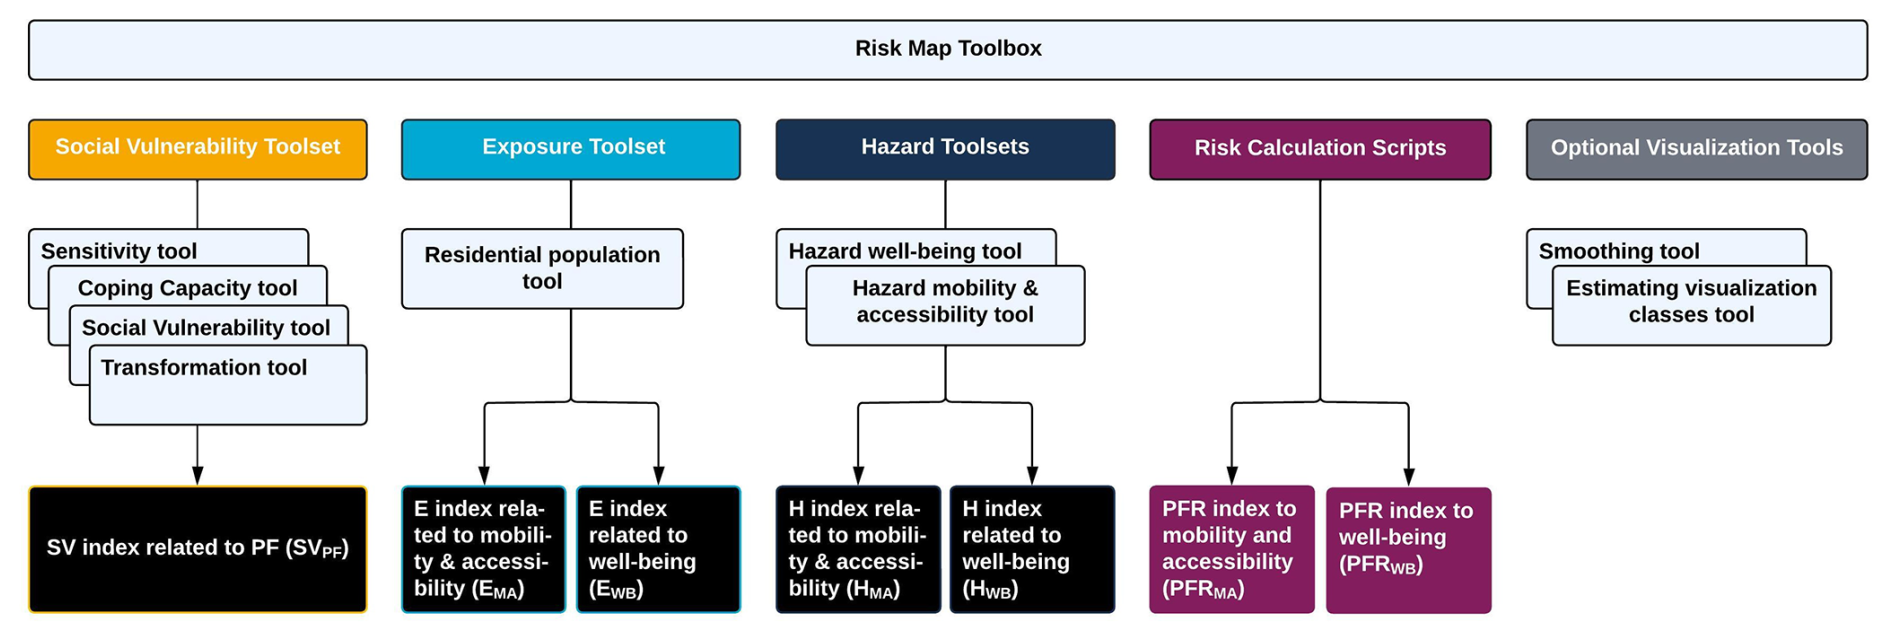
Figure 4Outline of the Risk Map Toolbox. The coloured boxes represent the corresponding risk parameters (Social Vulnerability, Exposure, Hazard, and Risk Calculation), containing toolsets and scripts for the respective calculation steps. Black boxes represent the result(s) of each toolset, necessary for the risk calculation (dark purple boxes). For an overview of the appearance in ArcGIS and the actual user interfaces, please refer to Fig. S2.
3.2.1 Social vulnerability toolset
The SV toolset calculates Sensitivity, Coping Capacity, and the SV index using TOPSIS, and its transformed version using the flood sensitivity transformation tool. Each vulnerability tool allows adjustment of the weights for Sensitivity and Coping Capacity. Within each group, the weights must sum to one and can be modified in the toolbox (Eqs. 1–3).
where the TOPSIS procedure is represented as FTOPSIS for the coping capacity (CCi), and Sensitivity (Si), for each alternative (building) i.
In more detail, to apply TOPSIS, all attributes are normalized (Eq. 4), and then multiplied with the specific weight. The normalization of each alternative can be expressed as:
where zij is the normalized attribute and xij reflects the unweighted value for the ith alternative (buildings) and jth attribute (relative share of C, ES, WR, EDQ).
The maximum and minimum values for each attribute define two ideal points in a multidimensional space (Eq. 5). We can calculate the relative Euclidean distance to this negative and positive ideal (A−, A+ see Fig. 3). Generally speaking for alternative Ai with n different attributes, let zij be the normalized attribute then:
with n attributes, where zij is the normalized attribute and j reflects the unweighted attribute for the i alternative.
Additionally, we apply the Shannon Entropy method. The idea of the Shannon Entropy method is to multiply the final risk index with an entropy-index between 1 and 2, where 1 indicates complete homogeneity and 2 indicates total inhomogeneity across different attributes. More specifically, for m alternatives with n attributes, where zij is the normalized attribute and j reflects the unweighted attribute for the ith alternative, the entropy Ui is calculated following Eq. (6):
The effect of heterogeneity depends on the specific context and its application should be evaluated individually for each hazard scenario. Hence, our toolbox offers the user to choose if Shannon Entropy shall be applied (please see additional screenshots of the tool user interfaces provided in Fig. S3a to c).
Finally, we perform two additional transformations, addressing the specific data distribution of SV (flood sensitivity transformation): (a) to prevent that zero SV values lead to zero risk, a value of a quarter mean of the SV value is added to the SV value, and (b) to mitigate the skewed social vulnerability data, we square social vulnerability values to emphasize on the most vulnerable (see Eq. 7). This threshold should be evaluated individually for different hazards or cities. Hence, our toolbox offers the user to apply different thresholds if needed (no, half or one mean value)
with the Entropy Ui, and the previously calculated social vulnerability value (SV).
All four tools are coded in Python and were incorporated within the ArcGIS framework. An exemplary outline of the calculated values is depicted in Fig. S4. We show the sensitivity to changes of this threshold within the sensitivity analysis.
3.2.2 Exposure toolsets
The calculation of Exposure contains one tool (see Fig. 4) including several sub-tools which are linked to one-another. The full workflow exported from the toolbox can be viewed in Fig. S5. First, both input data, the available data based on the statistical unit and the building information are combined (see Fig. S6a to c). Then, the available living area per building is calculated based on the following equation (Fig. S6d and e) (Eq. 8).
where AB is the area of each building (in m2), Fl being the number of floors of the corresponding building and B the building type, (B = 1 for residential, B = 2 for mixed use, containing no residents on the base floor level but in the upper levels), and AP for the area (in m2) of each building.
Following the two previously mentioned exposure concepts of EMA, including all residents of a given building and EWB, considering only individuals residing on the ground floor level, the subsequent Eqs. (9) and (10) are used to obtain EMA and EWB.
with AB being the area in m2 of each house, ALSU the total living area in m2 within the statistical unit and RSU, the overall number of residents living in the corresponding statistical unit (SU).
With building type (B = 1 for residential, B = 2 for mixed use) and the number of floors in the corresponding house (Fl).
The corresponding tools are shown in Fig. S6e to i. An excerpt of the resulting attribute table after implementing the exposure calculation is depicted in Fig. S7.
3.2.3 Hazard toolsets
The calculation of the hazard is two-fold, one toolset is developed for the calculation of the hazard to mobility and accessibility and one for the hazard to well-being.
The assessment of the hazard to well-being is carried out in two stages (see Fig. S8). The first tool computes the areas of intersection between all flood-depth layers between 30 and 100 cm (with 10 cm increments) and the affected buildings (see Fig. S8a and c). To account for potential water intrusion near buildings, we applied a 2 m buffer around all buildings, which was determined based on the native 1 m resolution of the flood simulation, expert knowledge, and stakeholder workshops in Hamburg, as well as following the approach of von Szombathely et al. (2025).
The second tool (as shown in Fig. S8b) calculates the hazard to well-being (HWB) following a cumulative distribution function (CDF; Φ) of the log-normal distribution with μ = 0 and σ = 0.25.
We derive the hazard index with
where A2 m, i as the fraction of the flooded area within a 2 m buffer at the water level i (in centimeter).
The toolset of the well-being hazard considers all potential flood-layers included in the corresponding input folder. In the sensitivity analysis, we therefore discuss the sensitivity of the applied method using a lower flooding threshold (20 cm). An example of the resulting output table is shown in Fig. S9.
The assessment of the hazard to mobility and accessibility includes two tools. Using the first tool (see Fig. S10a and c), we determine the areas of intersection, expressed in square meters (labelled with A) and percentages (labelled with P), between the flood hazard layer and (a) a 5 m buffer around each building, representing the feasibility of accessing the building, and (b) 15 m and (c) 15-to-30 m buffers around affected buildings, capturing potential intersections with the road network.
The second tool (Fig. S10b) includes the calculation of the actual hazard as described in von Szombathely et al. (2025), where the hazard index related to mobility and accessibility (HMA) is calculated using the maximum value derived from the Eq. (13).
There, A5 m, 30 cm refers to the fraction of area within a 5 m buffer, which is flooded above a 30 cm water level. R15 m, 30 cm and R30 m, 30 cm describe the fraction of road area within a 15 m buffer and 15-to-30 m buffer, respectively, which are flooded above a 30 cm water level.
To ensure relevant insights into surrounding road conditions and to exclude greater hazard ratings due to small flooded road areas, only flooded road areas exceeding 4 m2 are included. A schematic drawing (Fig. 5) depicts the applied buffers and intersections applied. Figure S11 shows an excerpt of the resulting HMA values.
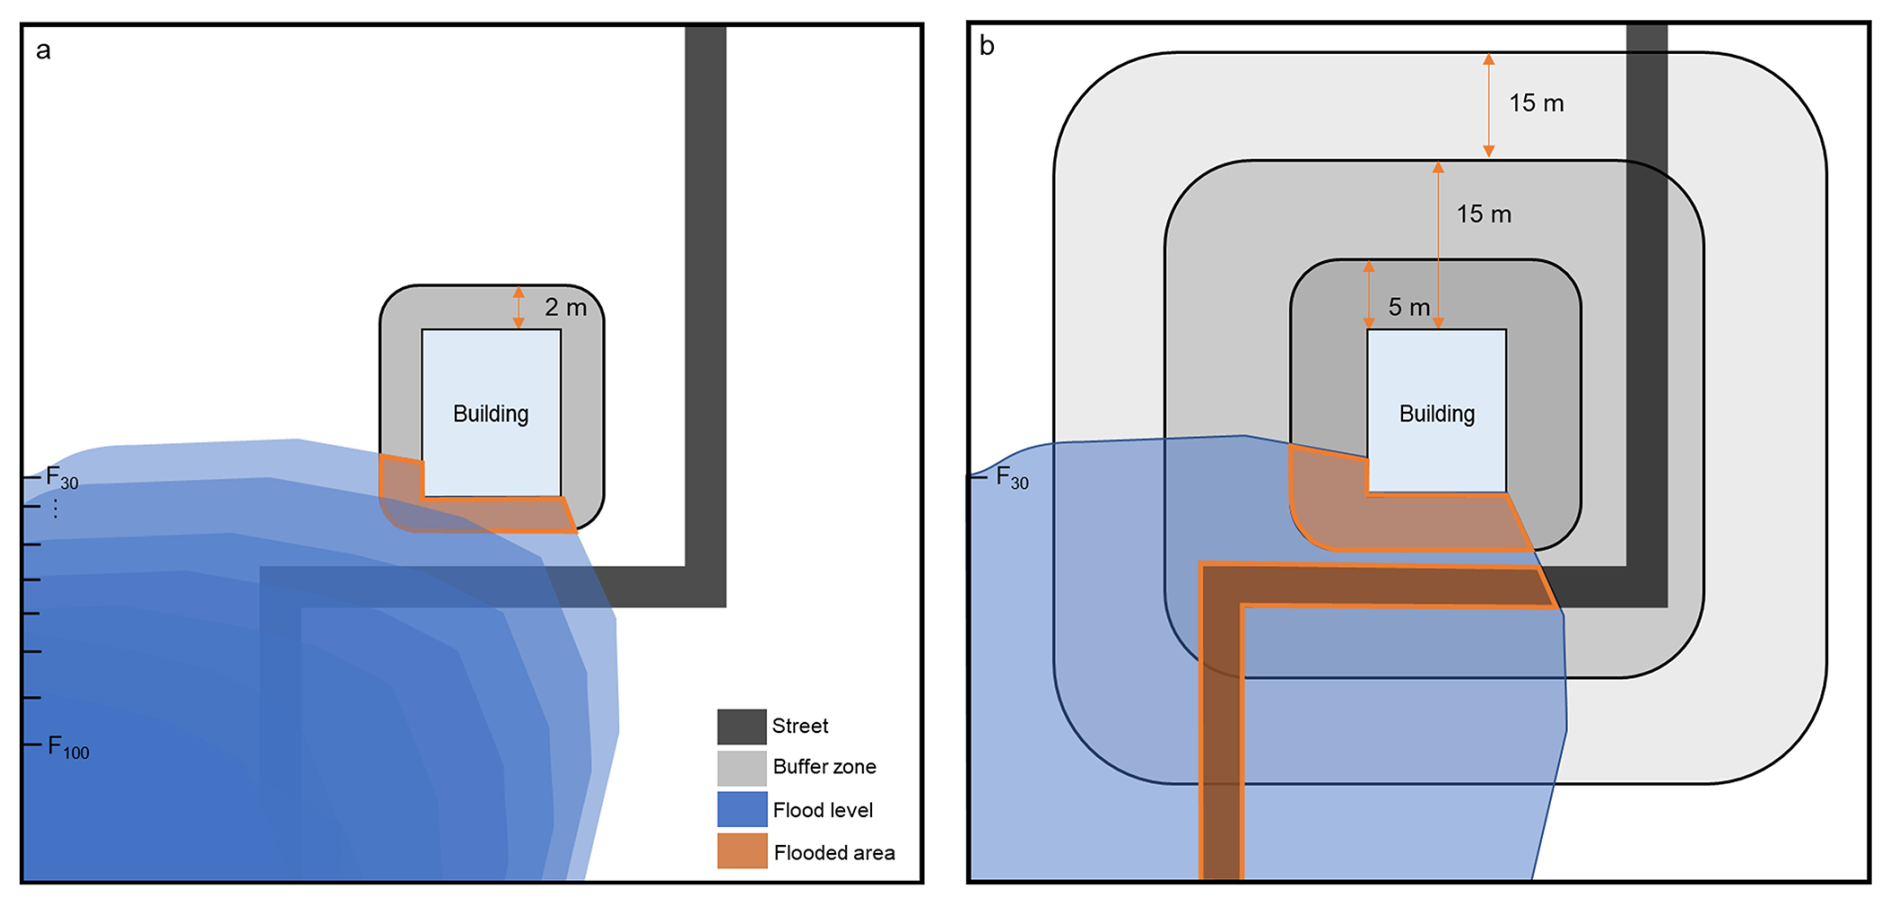
Figure 5Schematic of the hazard concept. Panel (a) shows the schematic for the hazard of well-being, including flood levels (F) between 30 to 100 cm and a 2 m buffer around a building to assess water at the building as a threat to well-being (b) depicts the framework for the hazard of mobility and accessibility using a 5, 15 and 15–30 m buffer around a building at a 30 cm flood level, taking into account high water levels on streets and blocked access to a building. Orange color highlights the flooded buffer around the building and the flooded road area.
3.2.4 Risk tool
In a final calculation, the calculated sub-indices for social vulnerability, exposure and hazard are linked to obtain two specific risks during pluvial flooding events, one related to well-being (PFRWB) and the other one related to mobility and accessibility (PFRMA).
The PFRWB is calculated as:
where SVPF reflects the social and economic characteristics that influence flood resilience, EWB considers the number of ground-floor residents, as those are most vulnerable to direct flood impacts, and HWB measures the likelihood and severity of floodwater intrusion at the ground floor level. Exponents a, b, and c reflects their corresponding (optional) weights.
The PFRMA is calculated as:
With SVPF reflecting the social and economic characteristics influencing flood resilience, EMA considering the number of residents, and HMA representing how flooding impacts movement and access in affected areas. Within the toolbox, we provide further options by selecting the exponent for each sub-index (hazard, exposure and social vulnerability), which allows for further specific weighting of the sub-indices in the final risk assessment (see Fig. S12). An excerpt of the resulting risk values and related sub-indices is shown in Fig. S13. Additionally, we provide a tool to estimate the visualization classes (no risk to very high risk) based on an iterative mean-based filtering process. In this context, the absolute values themselves are not decisive, rather, the relative gradations between them determine the risk structure (see Fig. S14). This approach ensures that the classification of risk classes reflects the data's internal structure.
The resulting pluvial flood risk is provided by assessing the risk to well-being (Fig. 6) and risk to mobility and accessibility (Fig. 7).
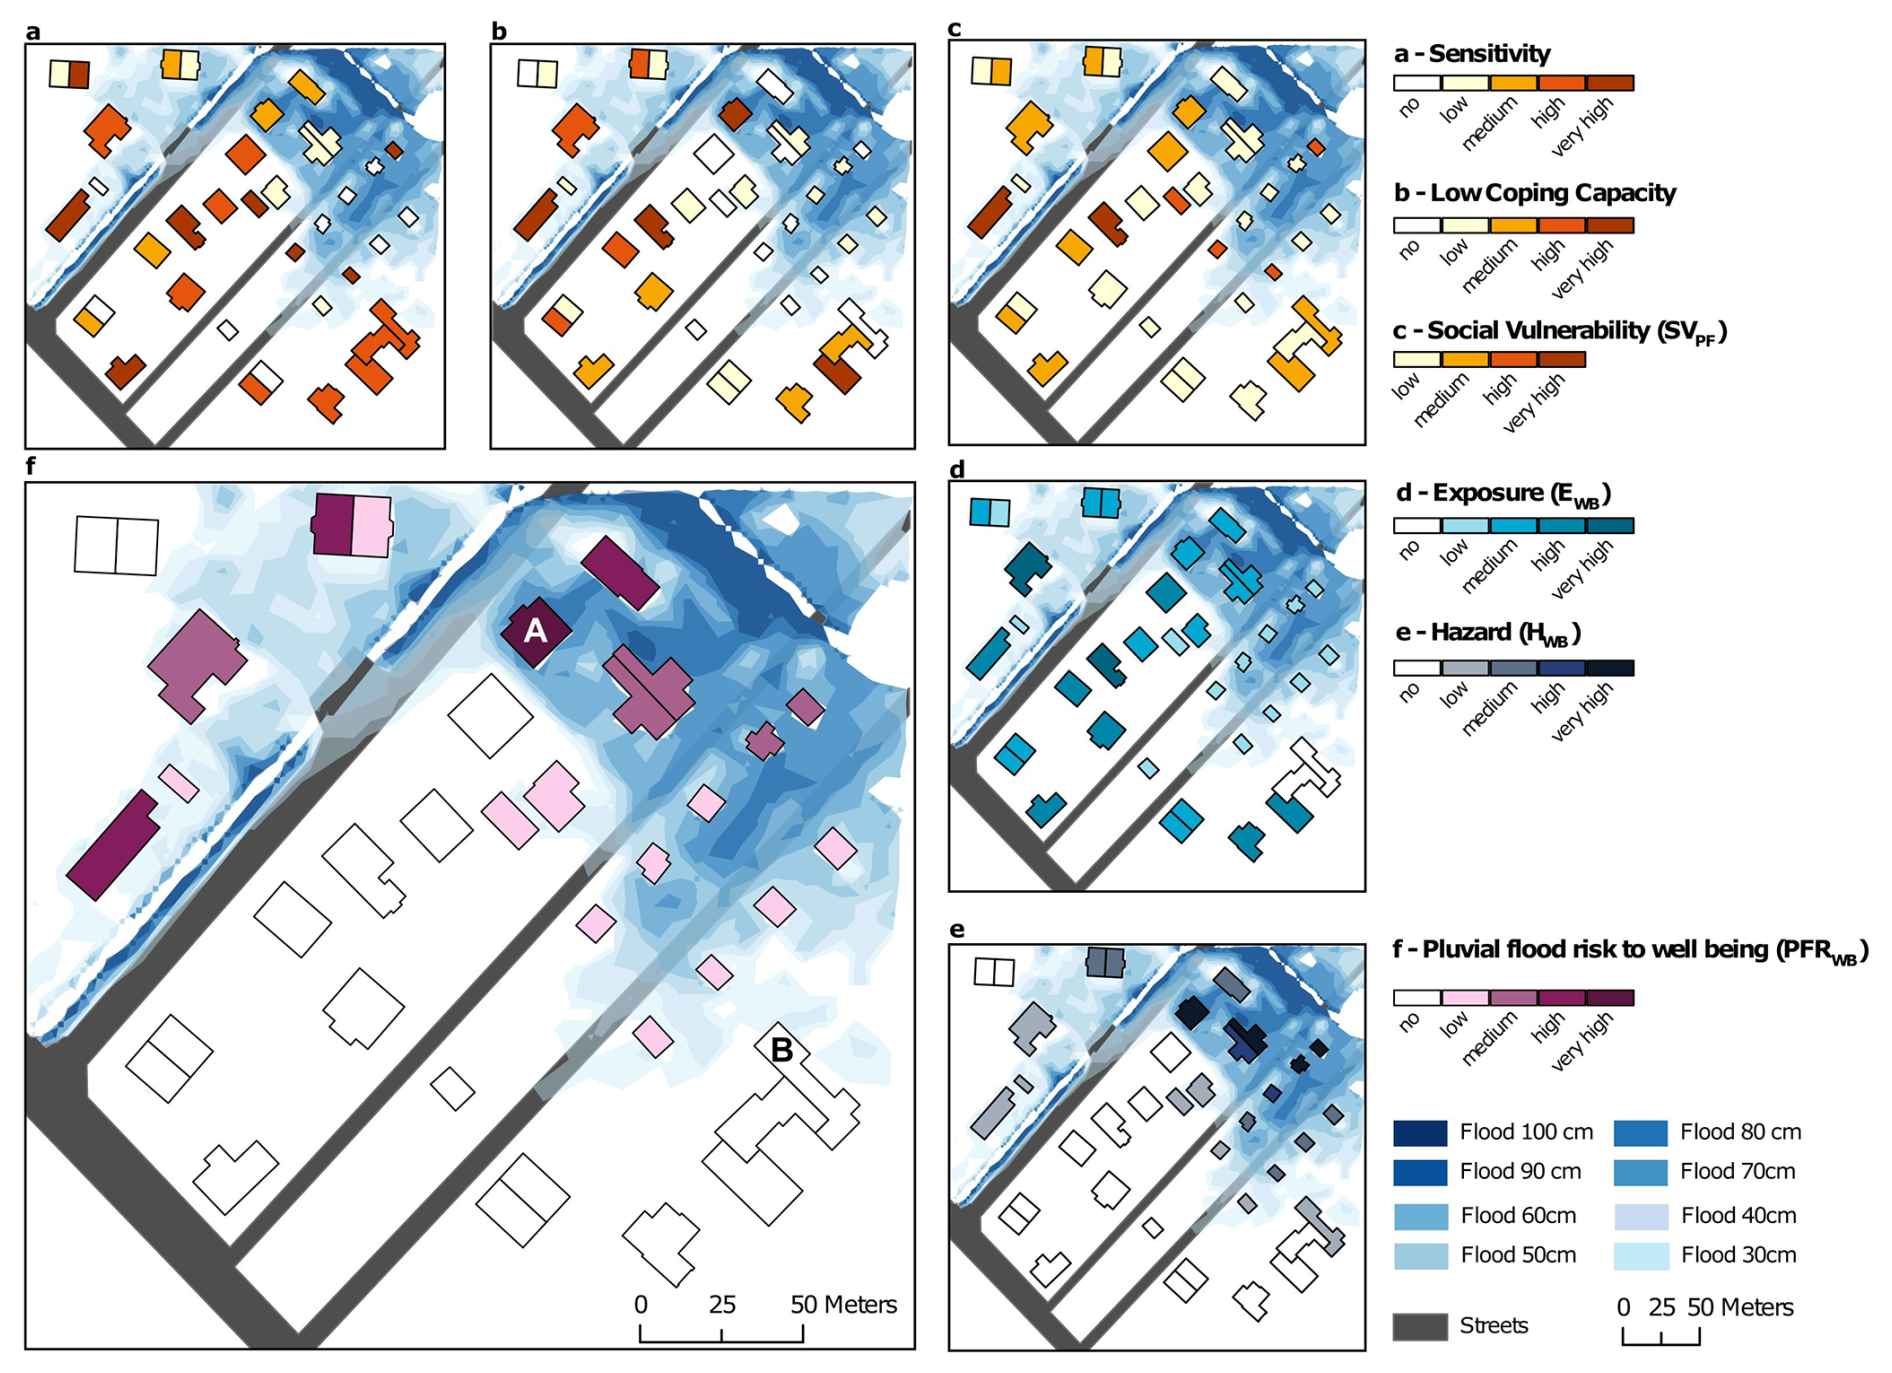
Figure 6Pluvial flood risk to well-being. Panel (a) shows sensitivity based on the presence of young children and elderly singles. Panel (b) depicts the coping capacity and panel (c) the combination of both leading to the transformed social vulnerability index. Panel (d) shows the exposure as the number of residents of the ground level per building, panel (e) depicts the hazard based on the 30–100 cm flood levels and panel (f) shows the final pluvial flood risk to well-being, created using ArcGIS Pro (ESRI, 2023 | Powered by Esri).
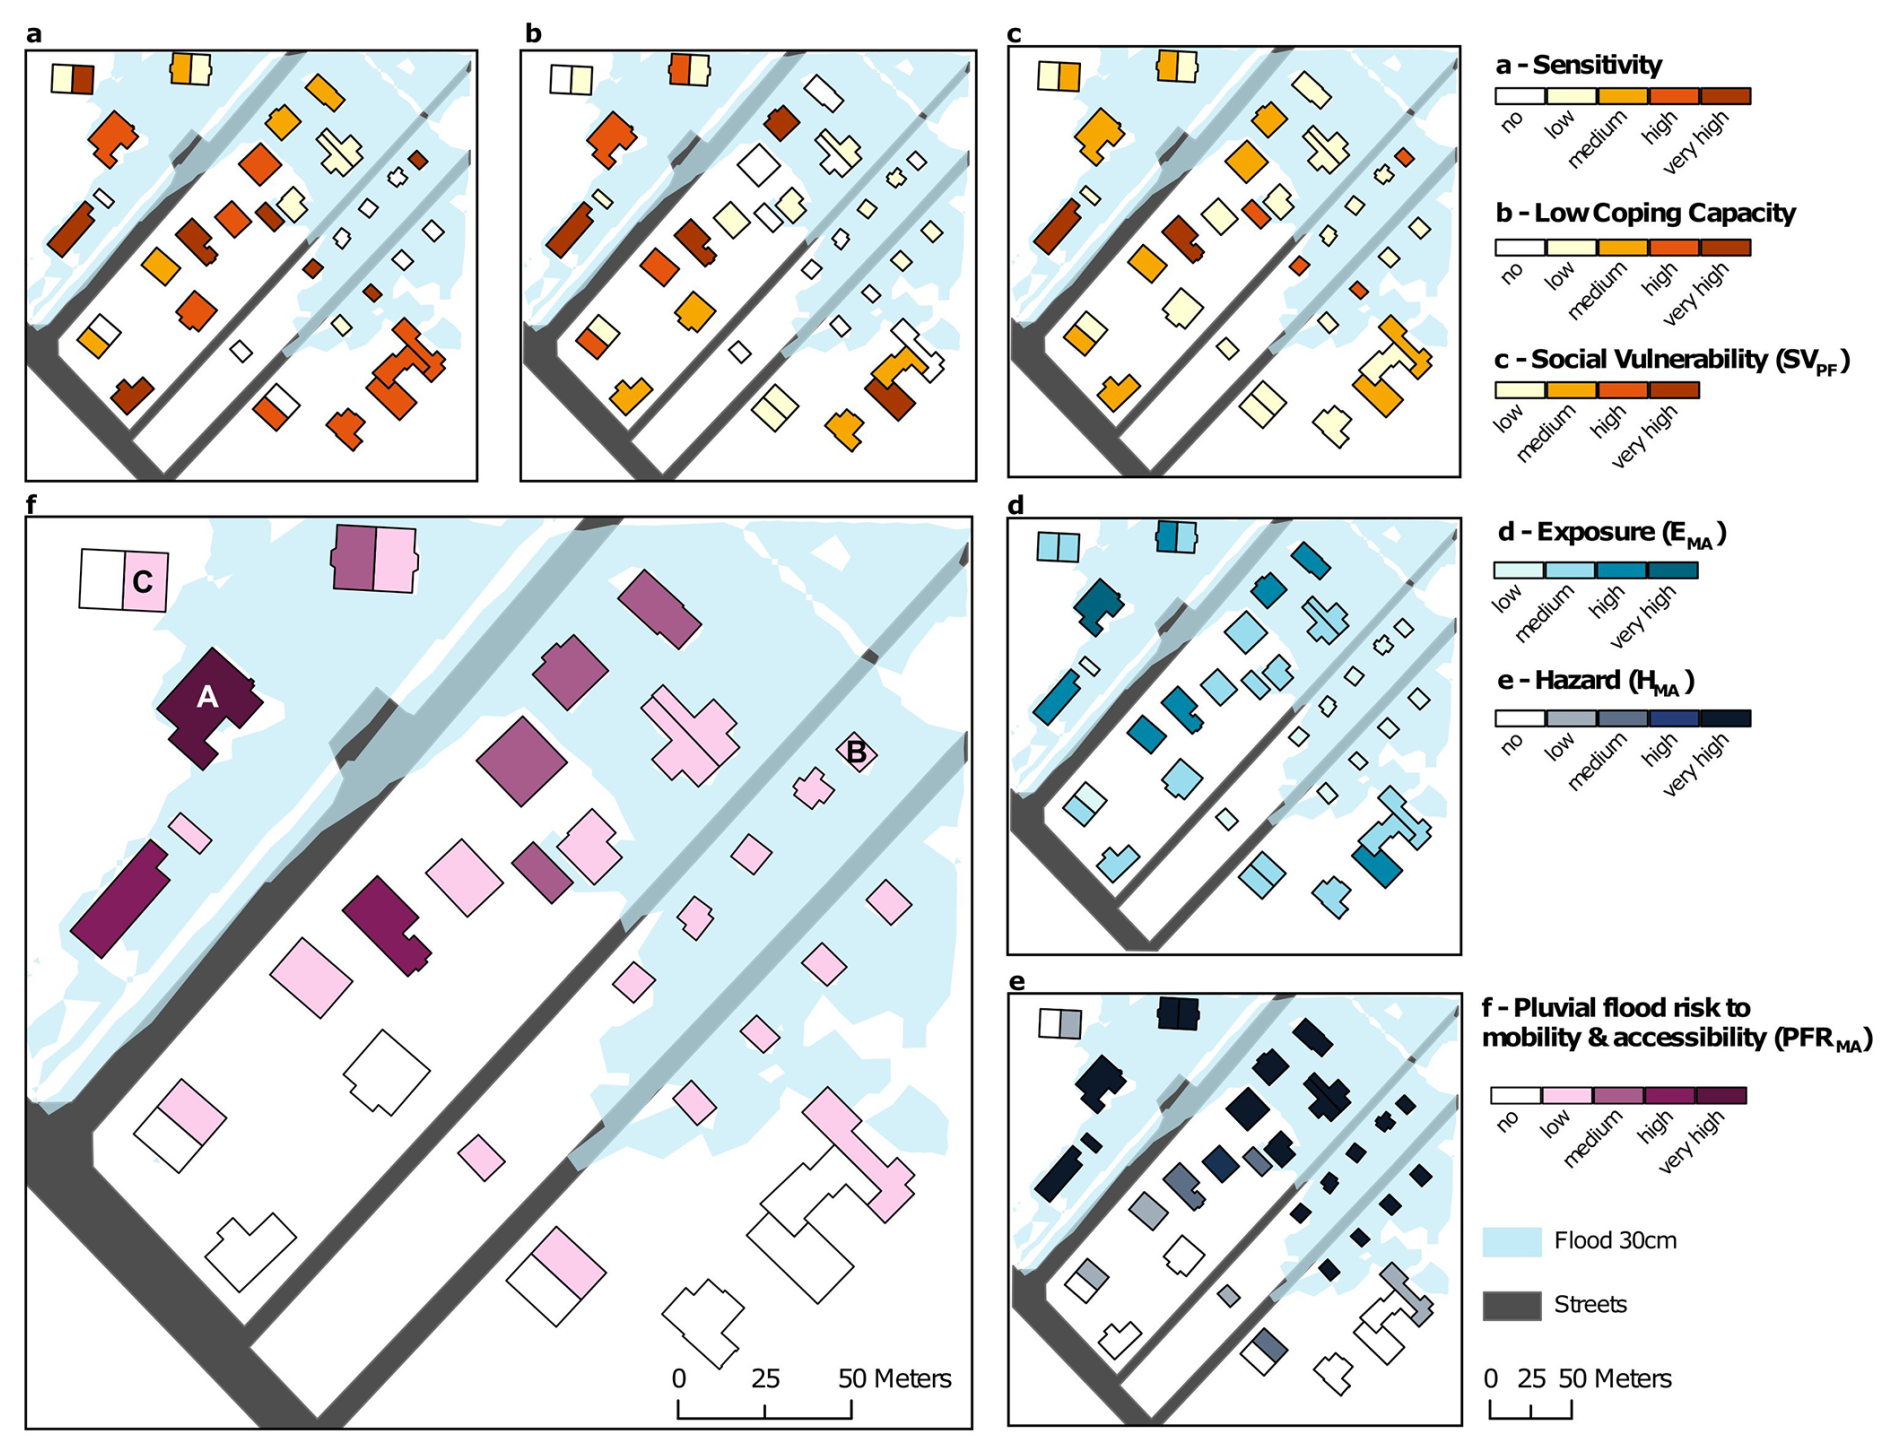
Figure 7Pluvial flood risk to mobility and accessibility. Panel (a) shows sensitivity based on the presence of young children and elderly singles. Panel (b) depicts the coping capacity and panel (c) the product of both leading to the transformed social vulnerability index. Panel (d) shows the exposure as the number of residents per building, panel (e) depicts the hazard based on the 30 cm flood level and panel (f) shows the final pluvial flood risk to mobility and accessibility, created using ArcGIS Pro (ESRI, 2023 | Powered by Esri).
4.1 Risk to well-being
Using this example case study, we first present the pluvial flood risk to well-being as calculated by integrating social vulnerability, exposure and hazard. The composition of social vulnerability reveals how SV emerges from the interaction between sensitivity and coping capacity. Social vulnerability becomes high or very high for buildings with elevated sensitivity, for example due to the presence of young children or elderly residents living alone (indicated by darker red shades in Fig. 6a). However, SV can be reduced where low coping capacity is low (Fig. 6b), resulting in an overall medium level of social vulnerability to pluvial flooding (Fig. 6c). For the estimation of pluvial flood risk to well-being, exposure is limited to residents living on the ground floor, such as in mixed-use buildings with offices or stores on the ground level and apartments above. This highlights a potential limitation of this framework, where based on the building scale, case specific information is not captured, such as the building's entry side, the likelihood of water intrusion into the basement, or the feasibility of implementing protective measures. However, the presented toolbox allows users to adjust the weighting of individual parameters, for instance by applying a higher weight to the sub-index to better reflect specific conditions where necessary. Overall, the resulting risk map for well-being captures spatially differentiated patterns and helps identify areas where targeted adaptation measures may be required.
4.2 Risk to mobility and accessibility
Figure 7 presents the risk to mobility and accessibility with a focus on the street network under a flood depth of 30 cm. While social vulnerability remains identical to the assessment of risk to well-being (Fig. 7a to c), the exposure is defined differently and now considers all residents per building (Fig. 7d). The corresponding hazard (Fig. 7e) considers the flooded areas in close vicinity to the house (5 m) as well as flooded street segments located within distances of 15 and 15–30 m.
The application of the pluvial flood risk toolbox revealed higher risks for buildings in close vicinity to flooded areas and streets, especially, where high exposure and high hazard categories coincide. This is exemplified by the building assigned to the highest risk class (see Building A in Fig. 7f). Notably, buildings with higher exposure, in this example due to larger building size (leading to possibly larger intersections with flooded areas) are assigned higher risk categories than smaller buildings with lower exposure, such as the single-family homes along the two streets (Example building B in Fig. 7f).
Some buildings (see e.g. Building B in Fig. 7f) were attributed a low risk to mobility and accessibility, even though for some houses the social vulnerability and hazard category were classified as high. In this case, it is a mixed-use building, so we get an EWB of 0, which in turn results in “no risk”.
Besides the impact of the (relatively) low exposure, this captures a limitation of the framework when applied to a small example area with a high hazard level. It is related to the calculation of risk-classes, for which a mean-based classification was applied to capture the distribution in the (example) area. Due to the high level of hazard in the study area, a relatively high share of houses is assigned with risk to mobility. If considering this framework for a whole city, the risk categories will be shifted (see for example von Szombathely et al., 2025). On the one hand, the relative risk assessment is a limitation, as the value itself cannot be interpreted (Russo et al., 2019). On the other hand, the relative nature of the framework allows to capture the heterogeneity of the input data and provides a base for relative prioritization of necessary adaptation measures. Using this synthesized example, we examine the behavior of the risk calculation on building level for typical urban building types, such as a city quarter in Hamburg. Semi-detached houses, consisting of two identical units sharing a common wall, show a distinct response within this framework. Within the toolbox we account for this by excluding the building area from the buffered area. This may increase the relative inundated area in the 5 m buffer, resulting in a higher risk. This is exemplified by building C (Fig. 7f), which exhibits an elevated hazard classification, whereas the adjacent building receives a lower or no risk classification, due to the lack of water (hazard) within the buffered zone. Note that for two semi-detached houses the risk index would change if they are counted as one single building. In such cases, careful interpretation by stakeholders and city management on a case-by-case basis is required.
Nevertheless, this approach provides a viable framework for calculating high-resolution risk, effectively capturing both risks to well-being as well as to mobility and accessibility. The automated calculation implemented in the provided toolbox enables the transfer of this approach to real-world case studies and facilitates its application across different urban settings.
4.3 Sensitivity, validation, and transferability of the approach
The toolbox provides a framework for calculating explicit flood risk indicators but requires several context-dependent assumptions regarding parameter values and transformations. These choices can be flexibly adjusted, influencing the resulting risk indices. As the index classification is meaningful only in a relative sense, we assess its sensitivity by comparing changes in average relative risk across groups of buildings with similar risk characteristics.
For the calculation of the SV index the choice of lower threshold for the flood susceptibility transformation is adjustable. Adding a threshold to the SVI ensures that social vulnerability never reaches zero within the risk framework, which would otherwise eliminate risk entirely. Since vulnerability depends on multiple socioeconomic factors, individuals can only become more or less vulnerable but never entirely invulnerable to pluvial flooding. We see that the at-risk buildings are much less sensitive to the choice of threshold added (see Fig. 8a and d), while the lowest risk class is particularly susceptible to changes across all scenarios, not just those affecting the SVI itself. This holds for both the PFRWB as well as PFRMA with the most at-risk group being about half as sensitive as the least at-risk group. In more detail, adjusting additional thresholds for the SVI, which would alter the vulnerability classification, has a greater impact on mobility and accessibility risk than on well-being risk. This occurs because mobility depends more sensitively on discrete threshold exceedances that define accessible and inaccessible areas, respectively skewed distribution and increases the weight of cases with extremely high SVI values. Thereby the SVI achieves a higher impact on the total risk, which is comparable to the impact of the hazard and exposure. We emphasize that the transformation power can be set by the user according to the needs of the respective risk assessment. Again, both the PFRWB and the PFRMA show that at-risk buildings have a lower sensitivity to the exponent. For the least at-risk buildings, risk values halve for each increase of the exponent. The inverted trend for the high-risk class in Fig. 8e is due to the very small number of buildings (n = 2) in this class, both with a very high social vulnerability, which explains the apparent reversal in trend in this particular case.
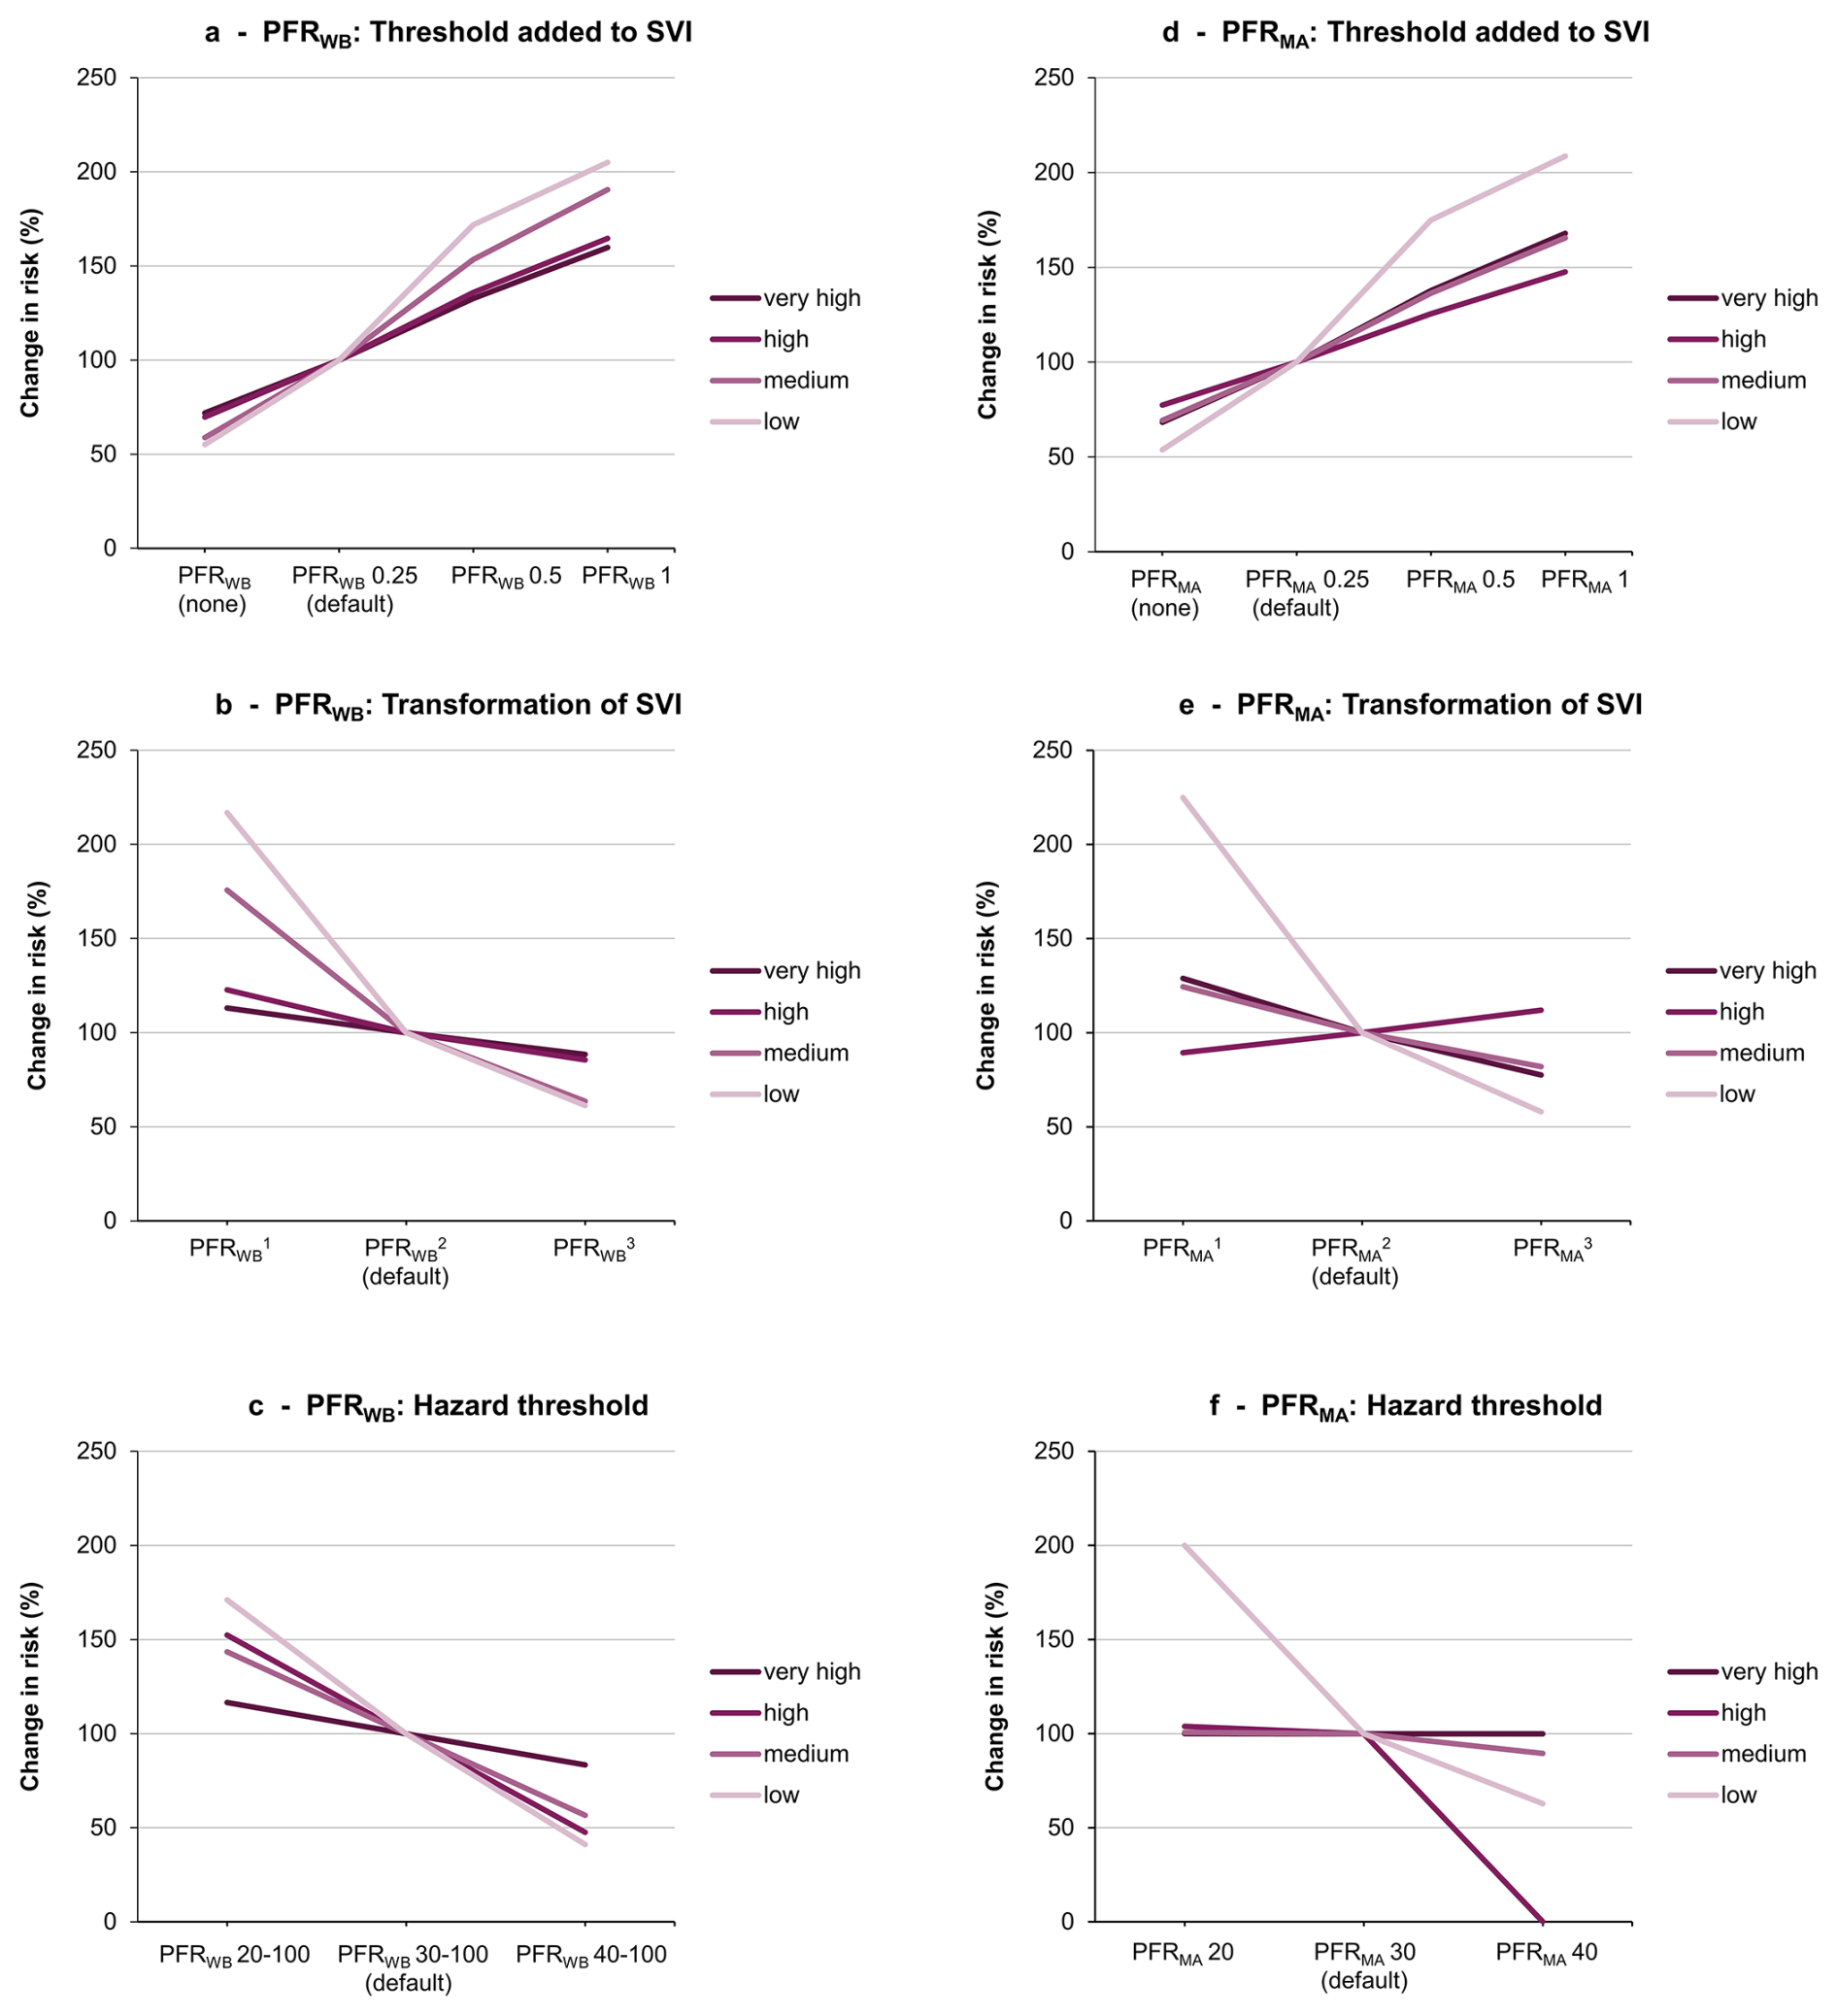
Figure 8Sensitivity analysis of the Pluvial Flood Risk (PFR) results. Panels (a) and (d) show the effect of adding a threshold to the social vulnerability index (SVI) results; panels (b) and (e) show the effect of alternative SVI transformations; and panels (c) and (f) show the effect of varying the hazard range. Results are shown for four levels of the outcome variable (very high, high, medium, and low; corresponding to the figures in the results section). Default parameter settings are indicated on the x axes.
Finally, the range of flood depths in the hazard layer influences the overall risk distribution. We therefore illustrate how each risk class responds to varying hazard ranges (Fig. 8c, f). For HWB, we test the sensitivity of flood depths between 20 and 100 cm as well as between 40 and 100 cm (Fig. 8c and f). Reducing the hazard range lowers total risk simply by covering less area (as shown in Fig. 5), though these changes affect well-being risk more substantially than mobility risk. Again, we can see that the group with the lowest overall risk is more sensitive to changes. One exception here is the “very high” risk building category in PFRMA, which is empty at an entry threshold of 40 cm and therefore drops to 0. Similar effects can be expected when adjusting the flood depth used to calculate the HMA, with high-risk buildings having lower sensitivities in regards to their PFRMA. However, individual buildings may have very high sensitivities regardless of their original risk value.
To sum up, patterns are consistent across different classes of PFR results, with larger deviations observed for “low” categories under alternative thresholds, transformations, and hazard ranges.
4.3.1 Validation and contextualization of model results
To contextualize the results, we qualitatively compare the simulated rainfall scenario to two recent heavy rainfall events in Hamburg (years of 2018 and 2024). The event in Lohbrügge (10 May 2018) was a local convective downpour with intensities above the 100-year return period. The event caused severe flooding, infrastructure damage, major traffic disruptions and evacuations due to sinkholes (Deutscher Wetterdienst (DWD), 2021). The Barmbek event (2 June 2024) reached intensities of the 100-year return period used in this study and slightly above triggering over 800 operations of the local fire brigades. There, traffic disruptions, power outages, and flooded basements, stores and underground parking garages were reported (Gaertner et al., 2024; Scheiwe and Schwieger, 2024)
4.3.2 Transferability of the method
The development of the presented toolbox was developed in close cooperation with city stakeholders in Hamburg. Various agencies (see Table S3 for details) were actively involved in its development through three stakeholder workshops and are the main beneficiaries of the toolbox. The toolbox is therefore mainly designed for cities, where similar data is available. In Germany, high-resolution pluvial flood simulations are or will soon be available across the country (Wimmer and Hovenbitzer, 2025; Wimmer et al., 2023). In addition, high-resolution urban flood maps are available from the EU project REACHOUT for the cities of Athens, Milano, Logrono, Gdynia (Staccione and Pal, 2024). Beyond Europe, there are high-resolution simulations available for New York (Department of Environmental Protection NYC (DEP), 2024), Los Angeles (Sanders et al., 2022), Miami (Sanders et al., 2025), and Houston (Schubert et al., 2022).
Recent advances enabling faster flood simulations (Van Den Bout et al., 2023) and flood simulations driven by artificial intelligence (Li et al., 2025) may further increase data availability and therefore transferability of our framework globally. For the availability of population data and social data, we acknowledge limitations due to data protection and privacy, which vary by country or commune, while high-resolution data might be available at least internally within the local authorities. Recent developments of global building data, including the area and height of buildings on a meter resolution (Zhu et al., 2025) could support future adaptations of the toolbox.
While this study provides a comprehensive framework for the assessment of pluvial flood risk in urban areas at the building level, several limitations must be accounted for:
-
The estimation of risk including social vulnerability and exposure requires a high data resolution and current data. For the applied methodology, socio-economic data at the building resolution are required. Alternatively, data with coarser resolution can be disaggregated to the building level with the help of the toolsets provided in the pluvial flood risk toolbox. Disaggregation was applied for the analysis of pluvial flood risks in the city of Hamburg (von Szombathely et al., 2025). By providing the toolbox along with its input data structure and code, we enable its transferability and adaptability to other regions, including those with coarser data, as demonstrated in this work.
-
The delineation of risk to pluvial floods at building-resolution requires several assumptions and case dependent adaptations which were highlighted in this study. By designing the toolbox to allow adjustments of hazard thresholds, the weighting of individual risk parameters, as well as the consideration of Shannon Entropy, we aim to explicitly highlight those aspects where context-specific decisions are required and expert knowledge or collaborations with local stakeholders can be beneficial.
-
Pluvial floods may affect socially vulnerable groups disproportionately larger or smaller than indicated by the SVI. We mitigate this by using an additional transformation, the flood sensitivity transformation. For our case example, we used the default values which were defined through a co-creation process with city authorities and informed by expert knowledge. However, we acknowledge that thresholds depend on local context and on the socio-economic data available and consequently they may have to be adapted to the individual study area.
-
The representation of results on building scale may create an impression of false precision, as several important building-specific details cannot be adequately captured, such as the building's entry side, the likelihood of water intrusion into the basement, or the feasibility of implementing protective measures.
-
The hazard indices do not consider flow velocities. In principle, water level or inundation depth are the main outputs of urban flood models, and therefore generally available for urban pluvial flood assessments (Guo et al., 2021). However, flow velocities might be relevant for mobility (Pregnolato et al., 2017) and damage to well-being (Jonkman and Penning-Rowsell, 2008) and would improve future approaches of pluvial flood risk mapping.
-
Although our risk implementation follows the IPCC risk framework, the model does not account for temporal changes or time dependent responses to the risk (introduced in AR6, IPCC, 2023). While the modelled hazard incorporates technical measures like sewer infrastructure and retention measures, the framework could be extended to include further responses. These responses could include resettlement (exposure), flood education or financial aid (social vulnerability), and could be incorporated within the framework by either modifying the data inputs (e.g., adjusted water levels, population, or social data) or updating core components (e.g., coping capacity effects). Future enhancements could integrate agent-based modelling (Peng et al., 2023) or dynamic urban flood risk assessment (He et al., 2023). Including emergency response measures and long-term adaptation strategies would strengthen the model's applicability for decision-makers.
We have outlined a possible approach for adapting the IPCC risk framework to urban environments and for estimating pluvial flood risk at the building scale. Using a small synthetical case study based on empirical data from Hamburg, we demonstrated that shifting the spatial scale from sub-city units to individual buildings is generally feasible with the available data. However, working at this finer resolution requires several assumptions outlined in this study, such as differentiating risks based on exposure type, and applying generalizations where input data are not available at building scale, which is often the case given current data resolutions. To our knowledge, this represents the first publicly available application of the IPCC framework at the building level in an urban context and showcases some challenges and opportunities with implementing this conceptual framework in a local context with empirical data. This finer level of granularity has the potential to significantly enhance the accuracy of urban risk assessments and support decision-making regarding disaster risk management and climate adaptation. The framework and toolbox, developed in close collaboration with city stakeholders through co-creation processes, enables such downscaling and provides a transferable structure that can be applied to other cities as well. Due to its four-part structure, the toolbox can be adapted to other hazards, such as heat, though several adjustments of the risk parameters would be required and lies beyond the scope of this analysis.
While we do not claim that this is the optimal implementation, the framework offers a transparent method to quantify risk, determined by the risk for mobility and accessibility and risk to well-being. Our results underline the need for high-resolution and openly accessible data to meaningfully integrate hazard and exposure, a combination not extensively documented in previous work. Given the increasing frequency and intensity of extreme events in the future (Seneviratne et al., 2023) incorporating social vulnerability and hazard-dependent exposure into risk assessments is essential. The framework presented here offers municipal institutions a basis for identifying adaptation measures that go beyond a sole focus on the hazard and thus provide valuable guidance for urban flood risk management.
The toolbox presented in this outline, including the tools and input data needed to calculate the presented risk maps are provided in Zenodo: https://doi.org/10.5281/zenodo.19860733 (Vogelbacher et al., 2025).
The supplement related to this article is available online at https://doi.org/10.5194/nhess-26-2765-2026-supplement.
AV: writing – original draft, methodology, formal analysis, data curation. investigation, visualization, conceptualization. MvS: writing – review and editing, methodology, formal analysis, visualization, conceptualization. ML: writing – review and editing, methodology, data curation, conceptualization. BP: writing – review and editing, methodology, conceptualization. JS: writing – review and editing, conceptualization, resources.
The contact author has declared that none of the authors has any competing interests.
Publisher's note: Copernicus Publications remains neutral with regard to jurisdictional claims made in the text, published maps, institutional affiliations, or any other geographical representation in this paper. The authors bear the ultimate responsibility for providing appropriate place names. Views expressed in the text are those of the authors and do not necessarily reflect the views of the publisher.
The authors thank the Deutsche Forschungsgemeinschaft (DFG, German Research Foundation) under Germany’s Excellence Strategy – EXC 2037 “CLICCS – Climate, Climatic Change, and Society” – Project Number: 390683824. Resources provided by the Institute of Geo-Hydroinformatics at Hamburg University of Technology and advice for fair data guidelines provided by the FAIR2Adapt project (Horizon Europe Framework Programme, grant agreement No. 101188256) are greatly acknowledged.
This research has been supported by the Deutsche Forschungsgemeinschaft (grant no. 390683824).
This paper was edited by Kai Schröter and reviewed by Charlotta Mirbach and one anonymous referee.
Afifi, Z., Chu, H.-J., Kuo, Y.-L., Hsu, Y.-C., Wong, H.-K., and Ali, M. Z.: Residential Flood Loss Assessment and Risk Mapping from High-Resolution Simulation, Water, 11, https://doi.org/10.3390/w11040751, 2019.
Alves, P. B. R., Djordjević, S., and Javadi, A. A.: An integrated socio-environmental framework for mapping hazard-specific vulnerability and exposure in urban areas, Urban Water J., 18, 530–543, https://doi.org/10.1080/1573062X.2021.1913505, 2021.
Arnbjerg-Nielsen, K., Willems, P., Olsson, J., Beecham, S., Pathirana, A., Bülow Gregersen, I., Madsen, H., and Nguyen, V.-T.-V.: Impacts of climate change on rainfall extremes and urban drainage systems: a review, Water Sci. Technol., 68, 16–28, https://doi.org/10.2166/wst.2013.251, 2013.
Assumpção, T. H., Popescu, I., Jonoski, A., and Solomatine, D. P.: Citizen observations contributing to flood modelling: opportunities and challenges, Hydrol. Earth Syst. Sci., 22, 1473–1489, https://doi.org/10.5194/hess-22-1473-2018, 2018.
Bertsch, R., Glenis, V., and Kilsby, C.: Building level flood exposure analysis using a hydrodynamic model, Environ. Modell. Softw., 156, 105490, https://doi.org/10.1016/j.envsoft.2022.105490, 2022.
Bhola, P. K., Leandro, J., and Disse, M.: Building hazard maps with differentiated risk perception for flood impact assessment, Nat. Hazards Earth Syst. Sci., 20, 2647–2663, https://doi.org/10.5194/nhess-20-2647-2020, 2020.
Bignami, D. F., Rosso, R., and Sanfilippo, U.: Flood Proofing in Urban Areas, edited by: Springer Cham, Springer International Publishing AG, 268 pp., https://doi.org/10.1007/978-3-030-05934-7, 2019.
Blöschl, G., Buttinger-Kreuzhuber, A., Cornel, D., Eisl, J., Hofer, M., Hollaus, M., Horváth, Z., Komma, J., Konev, A., Parajka, J., Pfeifer, N., Reithofer, A., Salinas, J., Valent, P., Výleta, R., Waser, J., Wimmer, M. H., and Stiefelmeyer, H.: Hyper-resolution flood hazard mapping at the national scale, Nat. Hazards Earth Syst. Sci., 24, 2071–2091, https://doi.org/10.5194/nhess-24-2071-2024, 2024.
Boettcher, M., Grawe, D., Fröhle, P., and Waldeier, I.: Development of a high-resolution model system for assessing an urban flood event in past and future climate, 12th International Conference on Urban Climate, Rotterdam, The Netherlands, 7–11 Jul 2025, ICUC12-573, https://doi.org/10.5194/icuc12-573, 2025.
Bulti, D. T. and Abebe, B. G.: A review of flood modeling methods for urban pluvial flood application, Model. Earth Syst. Environ., 6, 1293–1302, https://doi.org/10.1007/s40808-020-00803-z, 2020.
Buttinger-Kreuzhuber, A., Horváth, Z., Noelle, S., Blöschl, G., and Waser, J.: A fast second-order shallow water scheme on two-dimensional structured grids over abrupt topography, Adv. Water Resour., 127, 89–108, https://doi.org/10.1016/j.advwatres.2019.03.010, 2019.
Buttinger-Kreuzhuber, A., Konev, A., Horváth, Z., Cornel, D., Schwerdorf, I., Blöschl, G., and Waser, J.: An integrated GPU-accelerated modeling framework for high-resolution simulations of rural and urban flash floods, Environ. Modell. Softw., 156, 105480, https://doi.org/10.1016/j.envsoft.2022.105480, 2022a.
Buttinger-Kreuzhuber, A., Waser, J., Cornel, D., Horváth, Z., Konev, A., Wimmer, M. H., Komma, J., and Blöschl, G.: Locally Relevant High-Resolution Hydrodynamic Modeling of River Floods at the Regional Scale, Water Resour. Res., 58, e2021WR030820, https://doi.org/10.1029/2021WR030820, 2022b.
Calianno, M., Ruin, I., and Gourley, J. J.: Supplementing flash flood reports with impact classifications, J. Hydrol., 477, 1–16, https://doi.org/10.1016/j.jhydrol.2012.09.036, 2013.
Cea, L. and Costabile, P.: Flood Risk in Urban Areas: Modelling, Management and Adaptation to Climate Change. A Review, Hydrology, 9, 50, https://doi.org/10.3390/hydrology9030050, 2022.
Cutter, S. L.: The origin and diffusion of the social vulnerability index (SoVI), Int. J. Disast. Risk Re., 109, 104576, https://doi.org/10.1016/j.ijdrr.2024.104576, 2024.
Cutter, S. L., Boruff, B. J., and Shirley, W. L.: Social Vulnerability to Environmental Hazards, Soc. Sci. Quart., 84, 242–261, https://doi.org/10.1111/1540-6237.8402002, 2003.
De Guttry, C. and Ratter, B.: Expiry date of a disaster: Memory anchoring and the storm surge 1962 in Hamburg, Germany, Int. J. Disast. Risk Re., 70, 102719, https://doi.org/10.1016/j.ijdrr.2021.102719, 2022.
Department of Environmental Protection NYC (DEP): NYC Stormwater Flood Maps, NYC Open Data [data set], https://data.cityofnewyork.us/Environment/NYC-Stormwater-Flood-Maps/9i7c-xyvv/about_data (last access: 1 December 2025), 2024.
Deutsche Vereinigung für Wasserwirtschaft, Abwasser und Abfall (DWA) (Ed.): Bewertung der hydraulischen Leistungsfähigkeit von Entwässerungssystemen, Januar 2024., Deutsche Vereinigung für Wasserwirtschaft, Abwasser und Abfall, Hennef, Germany 45 pp., 2024.
Deutscher Wetterdienst (DWD) (Ed.): Klimareport Hamburg, Behörde für Umwelt, Klima, Energie und Agrarwirtschaft, Offenbach am Main, Deutschland, 56 pp., ISBN 978-3-88148-530-2, 2021.
Devi, K., Reddy, C. C., Rahul, K., Khuntia, J. R., and Das, B. S.: A holistic methodology for evaluating flood vulnerability, generating flood risk map and conducting detailed flood inundation assessment, Sci. Rep., 15, 28253, https://doi.org/10.1038/s41598-025-13025-z, 2025.
Dyson, B.: Integration of Life Cycle Assessment Into Decision-Analytic Approaches for Sustainable Technologies, in: Encyclopedia of Sustainable Technologies, Elsevier, 81–89, https://doi.org/10.1016/B978-0-12-409548-9.10037-5, 2017.
Ekmekcioğlu, Ö., Koc, K., and Özger, M.: Stakeholder perceptions in flood risk assessment: A hybrid fuzzy AHP-TOPSIS approach for Istanbul, Turkey, Int. J. Disast. Risk Re., 60, 102327, https://doi.org/10.1016/j.ijdrr.2021.102327, 2021.
ESRI (Environmental Systems Research Institute): ArcGIS Pro, Version 3.2.0, ESRI [software], https://www.esri.com/en-us/arcgis/products/arcgis-pro/overview (last access: 1 June 2026), 2023.
Fekete, A.: Validation of a social vulnerability index in context to river-floods in Germany, Nat. Hazards Earth Syst. Sci., 9, 393–403, https://doi.org/10.5194/nhess-9-393-2009, 2009.
Fereshtehpour, M. and Najafi, M. R.: Urban stormwater resilience: Global insights and strategies for climate adaptation, Urban Climate, 59, 102290, https://doi.org/10.1016/j.uclim.2025.102290, 2025.
Freie und Hansestadt Hamburg, Behörde für Stadtentwicklung und Wohnen: Sozialmonitoring Integrierte Stadtteilentwicklung – Karten- und Tabellenband 2023, 32 pp., https://www.hamburg.de/resource/blob/286264/30117a83fe60f77cbd7344274fa5beb4/d-sozialmonitoring-bericht-2023-data.pdf (last access: 1 June 2026), 2023 (in German).
Freie und Hansestadt Hamburg, Behörde für Stadtentwicklung und Wohnen: Sozialmonitoring Integrierte Stadtteilentwicklung – Bericht 2024, 31 pp., https://www.hamburg.de/resource/blob/1008718/43ed5565389b54c7af103ba038b658b0/d-sozialmonitoring-bericht-2024-data.pdf (last access: 1 June 2026), 2024 (in German).
Freie und Hansestadt Hamburg, Behörde für Umwelt, Klima, Energie und Agrarwirtschaft: Starkregengefahrenkarte Hamburg, Version 23.06.2025, MetaVer [data set], https://metaver.de/trefferanzeige?cmd=doShowDocument&docuuid=F16CFE63-C4C4-4D76-A7EF-C08581E30C6E#metadata_info (last access: 23 June 2025), 2023 (in German).
Freie und Hansestadt Hamburg, Behörde für Umwelt, Klima, Energie und Agrarwirtschaft: Technisches Informationsblatt Starkregengefahrenkarte Hamburg, 15 pp., https://www.hamburg.de/resource/blob/173730/5270f2cb96a1e 41b5e45b64f84aa853e/d-technischesinformationsblatt-srgk-data.pdf (last access: 2 May 2024), 2024 (in German).
Freie und Hansestadt Hamburg, Behörde für Umwelt, Klima, Energie und Agrarwirtschaft: RISA Hamburg, https://www.risa-hamburg.de (last access: 11 March 2026), 2026 (in German).
Freie und Hansestadt Hamburg, Landesbetrieb Geoinformation und Vermessung: INSPIRE HH Verkehrsnetze ALKIS, Version 3.2, MetaVer [data set], https://metaver.de/trefferanzeige?cmd=doShowDocument&docuuid=1BD1BACC-6E6C-40E2-9B29-3B851CD6CFB5 (last access:2 May 2025), 2017 (in German).
Freie und Hansestadt Hamburg, Landesbetrieb Geoinformation und Vermessung: INSPIRE HH Gebäude ALKIS, Version 3.2, MetaVer [data set], https://metaver.de/trefferanzeige?docuuid=0C4AD3A9-ECC4-4936-92FD-18E21DFA9234 (last access:2 May 2025), 2020 (in German).
Freie und Hansestadt Hamburg, Statistikamt Nord: Bevölkerung in Hamburg am 31.12.2023, Statistik Nord [data set], https://www.statistik-nord.de/zahlen-fakten/hamburger-melderegister/bevoelkerungsstand#c6618 (last access: 2 May 2025), 2024 (in German).
Fowler, H. J., Lenderink, G., Prein, A. F., Westra, S., Allan, R. P., Ban, N., Barbero, R., Berg, P., Blenkinsop, S., Do, H. X., Guerreiro, S., Haerter, J. O., Kendon, E. J., Lewis, E., Schaer, C., Sharma, A., Villarini, G., Wasko, C., and Zhang, X.: Anthropogenic intensification of short-duration rainfall extremes, Nature Reviews Earth & Environment, 2, 107–122, https://doi.org/10.1038/s43017-020-00128-6, 2021.
Fritsch, K., Assmann, A., and Tyrna, B.: Long-term experiences with pluvial flood risk management, E3S Web Conf., 7, 04017, https://doi.org/10.1051/e3sconf/20160704017, 2016.
Gaertner, R., De Vincenzi, I., and Lübbe, E.: Wie im Ahrtal: Regen in Hamburg erreicht Katastrophen-Ausmaß, MOPO, https://www.mopo.de/hamburg/hitze-und- gewitter-mit-starkregen-und-hagel-im-norden-erwartet/ (last access: 20 March 2026), 28 June 2024 (in German).
Gentile, R., Cremen, G., Galasso, C., Jenkins, L. T., Manandhar, V., Menteşe, E. Y., Guragain, R., and McCloskey, J.: Scoring, selecting, and developing physical impact models for multi-hazard risk assessment, Int. J. Disast. Risk Re., 82, 103365, https://doi.org/10.1016/j.ijdrr.2022.103365, 2022.
Guo, K., Guan, M., and Yu, D.: Urban surface water flood modelling – a comprehensive review of current models and future challenges, Hydrol. Earth Syst. Sci., 25, 2843–2860, https://doi.org/10.5194/hess-25-2843-2021, 2021.
He, H., Li, R., Pei, J., Bilodeau, J.-P., and Huang, G.: Current overview of impact analysis and risk assessment of urban pluvial flood on road traffic, Sustain. Cities Soc., 99, 104993, https://doi.org/10.1016/j.scs.2023.104993, 2023.
Holand, I. S., Lujala, P., and Rød, J. K.: Social vulnerability assessment for Norway: A quantitative approach, Norsk Geogr. Tidsskr., 65, 1–17, https://doi.org/10.1080/00291951.2010.550167, 2011.
Hwang, C.-L. and Yoon, K.: Multiple Attribute Decision Making, Springer, Berlin, Heidelberg, https://doi.org/10.1007/978-3-642-48318-9, 1981.
IPCC (Intergovernmental Panel On Climate Change): Climate Change 2014: Impacts, Adaptation, and Vulnerability. Part A: Global and Sectoral Aspects. Contribution of Working Group II to the Fifth Assessment Report of the Intergovernmental Panel on Climate Change, edited by: Field, C. B., Barros, V. R., Dokken, D. J., Mach, K. J., Mastrandrea, M. D., Bilir, T. E., Chatterjee, M., Ebi, K. L., Estrada, Y. O., Genova, R. C., Girma, B., Kissel, E. S., Levy, A. N., MacCracken, S., Mastrandrea, P. R., and White, L. L., Cambridge University Press, Cambridge, United Kingdom and New York, NY, USA, 1132 pp., ISBN 978-1-107-64165-5, 2014.
IPCC (Intergovernmental Panel On Climate Change): Annex I: Glossary, edited by: edited by: Reisinger, A., Cammarano, D., Fischlin, A. Fuglestvedt, J. S., Hansen, G., Jung, Y., Ludden, C., Masson-Delmotte, V., Matthews, R., Mintenbeck, J. B. K., Orendain, D. J., Pirani, A., Poloczanskaa, E., and Romero, J., in: Climate Change 2023: Synthesis Report. Contribution of Working Groups I, II and III to the Sixth Assessment Report of the Intergovernmental Panel on Climate Change, edited by: Core Writing Team, Lee, H., and Romero, J., IPCC, Geneva, Switzerland, 119–130, https://doi.org/10.59327/IPCC/AR6-9789291691647.002, 2023.
Jonkman, S. N. and Penning-Rowsell, E.: Human Instability in Flood Flows1, J. Am. Water Resour. As., 44, 1208–1218, https://doi.org/10.1111/j.1752-1688.2008.00217.x, 2008.
Kosanic, A., Petzold, J., Martín-López, B., and Razanajatovo, M.: An inclusive future: disabled populations in the context of climate and environmental change, Curr. Opin. Env. Sust., 55, 101159, https://doi.org/10.1016/j.cosust.2022.101159, 2022.
Landesanstalt für Umwelt, Messungen und Naturschutz Baden-Württemberg (LUBW) (Ed.): Leitfaden Kommunales Starkregenrisikomanagement in Baden-Württemberg, Stand August 2016, Karlsruhe, 64 pp., ISBN 978-3-88251-391-2, 2016.
Lang, A. and Poschlod, B.: Updating catastrophe models to today's climate – An application of a large ensemble approach to extreme rainfall, Climate Risk Management, 44, 100594, https://doi.org/10.1016/j.crm.2024.100594, 2024.
Lazzarin, T., Viero, D. P., Molinari, D., Ballio, F., and Defina, A.: Flood damage functions based on a single physics- and data-based impact parameter that jointly accounts for water depth and velocity, J. Hydrol., 607, 127485, https://doi.org/10.1016/j.jhydrol.2022.127485, 2022.
Li, Z., Zhou, Z., Wang, H., Li, X., Shi, X., Xiao, J., Yang, Z., Sun, M., Li, X., and Jia, H.: Artificial intelligence-incorporated prediction for urban flooding processes in the past 20 years: A critical review, Environ. Modell. Softw., 192, 106525, https://doi.org/10.1016/j.envsoft.2025.106525, 2025.
Malekinezhad, H., Sepehri, M., Pham, Q. B., Hosseini, S. Z., Meshram, S. G., Vojtek, M., and Vojteková, J.: Application of entropy weighting method for urban flood hazard mapping, Acta Geophys., 69, 841–854, https://doi.org/10.1007/s11600-021-00586-6, 2021.
Nguyen, H. X., Nguyen, A. T., Ngo, A. T., Phan, V. T., Nguyen, T. D., Do, V. T., Dao, D. C., Dang, D. T., Nguyen, A. T., Nguyen, T. K., and Hens, L.: A Hybrid Approach Using GIS-Based Fuzzy AHP–TOPSIS Assessing Flood Hazards along the South-Central Coast of Vietnam, Applied Sciences, 10, 7142, https://doi.org/10.3390/app10207142, 2020.
Nkwunonwo, U. C., Whitworth, M., and Baily, B.: A review of the current status of flood modelling for urban flood risk management in the developing countries, Scientific African, 7, e00269, https://doi.org/10.1016/j.sciaf.2020.e00269, 2020.
Osuide, E. E.: Implementation of measures to mitigate the risk of pluvial flooding in urban areas, Model. Earth Syst. Environ., 8, 2897–2910, https://doi.org/10.1007/s40808-021-01308-z, 2022.
Pajares, E., Muñoz Nieto, R., Meng, L., and Wulfhorst, G.: Population Disaggregation on the Building Level Based on Outdated Census Data, ISPRS Int. J. Geo-Inf., 10, 662, https://doi.org/10.3390/ijgi10100662, 2021.
Pathan, A. I., Girish Agnihotri, P., Said, S., and Patel, D.: AHP and TOPSIS based flood risk assessment- a case study of the Navsari City, Gujarat, India, Environ. Monit. Assess., 194, 509, https://doi.org/10.1007/s10661-022-10111-x, 2022.
Peng, Y., Rodriguez Lopez, J. M., Santos, A. P., Mobeen, M., and Scheffran, J.: Simulating exposure-related human mobility behavior at the neighborhood-level under COVID-19 in Porto Alegre, Brazil, Cities, 134, 104161, https://doi.org/10.1016/j.cities.2022.104161, 2023.
Pregnolato, M., Ford, A., Glenis, V., Wilkinson, S., and Dawson, R.: Impact of Climate Change on Disruption to Urban Transport Networks from Pluvial Flooding, J. Infrastruct. Syst., 23, 04017015, https://doi.org/10.1061/(ASCE)IS.1943-555X.0000372, 2017.
Python Software Foundation: Python language reference, Version 3.9.18, Python Software Foundation [software], https://www.python.org (last access: 1 June 2026), 2026.
Rafiei-Sardooi, E., Azareh, A., Choubin, B., Mosavi, A. H., and Clague, J. J.: Evaluating urban flood risk using hybrid method of TOPSIS and machine learning, Int. J. Disast. Risk Re., 66, 102614, https://doi.org/10.1016/j.ijdrr.2021.102614, 2021.
Rehman, S., Sahana, M., Hong, H., Sajjad, H., and Ahmed, B. B.: A systematic review on approaches and methods used for flood vulnerability assessment: framework for future research, Nat. Hazards, 96, 975–998, https://doi.org/10.1007/s11069-018-03567-z, 2019.
Rossman, L. and Simon, M.: Storm Water Management Model User's Manual Version 5.2, U.S. Environmental Protection Agency, Washington, DC, EPA/600/R-22/030, 2022.
Rufat, S., Tate, E., Emrich, C. T., and Antolini, F.: How Valid Are Social Vulnerability Models?, Ann. Am. Assoc. Geogr., 109, 1131–1153, https://doi.org/10.1080/24694452.2018.1535887, 2019.
Russo, S., Sillmann, J., Sippel, S., Barcikowska, M. J., Ghisetti, C., Smid, M., and O'Neill, B.: Half a degree and rapid socioeconomic development matter for heatwave risk, Nat. Commun., 10, 136, https://doi.org/10.1038/s41467-018-08070-4, 2019.
Sanders, B. F., Schubert, J. E., Kahl, D. T., Mach, K. J., Brady, D., AghaKouchak, A., Forman, F., Matthew, R. A., Ulibarri, N., and Davis, S. J.: Large and inequitable flood risks in Los Angeles, California, Nat. Sustain., 6, 47–57, https://doi.org/10.1038/s41893-022-00977-7, 2022.
Sanders, B. F., Schubert, J. E., Martin, E.-M. H., Wang, S., Sukop, M. C., and Mach, K. J.: A fast flood inundation model with groundwater interactions and hydraulic structures, Adv. Water Resour., 204, 105057, https://doi.org/10.1016/j.advwatres.2025.105057, 2025.
Sapena, M., Kühnl, M., Wurm, M., Patino, J. E., Duque, J. C., and Taubenböck, H.: Empiric recommendations for population disaggregation under different data scenarios, PLoS ONE, 17, e0274504, https://doi.org/10.1371/journal.pone.0274504, 2022.
Scalenghe, R. and Marsan, F. A.: The anthropogenic sealing of soils in urban areas, Landscape Urban Plan., 90, 1–10, https://doi.org/10.1016/j.landurbplan.2008.10.011, 2009.
Scheiwe, H. and Schwieger, N.: Schwere Unwetter: Teile Hamburgs überflutet – Verletzte bei Blitzeinschlag in Dresdner Supermarkt, rnd, https://www.rnd.de/panorama/schwere-unwet ter-teile-hamburgs-ueberflutet-verletzte-bei-blitzeinschlag-in- dresdner-supermarkt-NCKGDIXNLRKERH3QHOVTAJ2NDQ. html (last access: 20 March 2026), 28 June, 2024 (in German).
Schmitt, T. G.: Site-specific rainfall depths in the rain storm severity index concept RSI12 in the context of risk communication according to DWA-M 119 [Ortsbezogene Regenhöhen im Starkregenindexkonzept SRI12 zum Anwendungskontext Risikokommunikation in DWA-M 119], KA – Korrespondenz Abwasser, 63, 965–967, November 2016 (in German).
Schubert, J. E., Luke, A., AghaKouchak, A., and Sanders, B. F.: A Framework for Mechanistic Flood Inundation Forecasting at the Metropolitan Scale, Water Resour. Res., 58, e2021WR031279, https://doi.org/10.1029/2021WR031279, 2022.
Seneviratne, S. I., Zhang, X., Adnan, M., Badi, W., Dereczynski, C., Di Luca, A., Ghosh, S., Iskandar, I., Kossin, J., Lewis, S., Otto, F., Pinto, I., Satoh, M., Vicente-Serrano, S. M., Wehner, M., and Zhou, B.: Climate Change 2021 – The Physical Science Basis: Working Group I Contribution to the Sixth Assessment Report of the Intergovernmental Panel on Climate Change, 1st edn., Cambridge University Press, https://doi.org/10.1017/9781009157896, 2023.
Shannon, C. E.: A Mathematical Theory of Communication, Bell Syst. Tech. J., 27, 379–423, https://doi.org/10.1002/j.1538-7305.1948.tb01338.x, 1948.
Sillmann, J., Raupach, T. H., Findell, K. L., Donat, M., Alves, L. M., Alexander, L., Borchert, L., De Amorim, P. B., Buontempo, C., Fischer, E. M., Franzke, C. L., Guan, B., Haasnoot, M., Hawkins, E., Jacob, D., Mahon, R., Maraun, D., Morrison, M. A., Poschlod, B., Ruane, A. C., Shampa, Stephenson, T., Van Der Wel, N., Wang, Z., Zhang, X., and Županić, J.: Climate extremes and risks: links between climate science and decision-making, Front. Clim., 6, 1499765, https://doi.org/10.3389/fclim.2024.1499765, 2024.
Staccione, A. and Pal, J. S.: Urban pluvial flood maps under different green cover scenarios, Version 1, Zenodo [data set], https://doi.org/10.5281/zenodo.14035876, 2024.
United Nations, Department of Economic and Social Affairs, https://www.un.org/en/desa/68-world-population-projected-live -urban-areas-2050-says-un (last access: 1 June 2026), 2019.
Van Den Bout, B., Jetten, V. G., Van Westen, C. J., and Lombardo, L.: A breakthrough in fast flood simulation, Environ. Modell. Softw., 168, 105787, https://doi.org/10.1016/j.envsoft.2023.105787, 2023.
Vogelbacher, A., von Szombathely, M., Lennartz, M., Poschlod, B., and Sillmann, J.: Urban Pluvial Flood Risk Toolbox, Version 2, Zenodo [code], https://doi.org/10.5281/zenodo.19860733, 2025.
von Szombathely, M., Hanf, F. S., Bareis, J., Meier, L., Oßenbrügge, J., and Pohl, T.: An Index-Based Approach to Assess Social Vulnerability for Hamburg, Germany, Int. J. Disast. Risk Sc., 14, 782–794, https://doi.org/10.1007/s13753-023-00517-7, 2023.
von Szombathely, M., Behrens, J., Hanf, F. S., Lennartz, M., Nayak, S., Oßenbrügge, J., Poschlod, B., Scheffran, J., Vogelbacher, A., and Sillman, J.: Urban Pluvial Flood Risk Mapping: A High-Resolution Assessment for the City of Hamburg, SSRN, [preprint], https://doi.org/10.2139/ssrn.5231006, 2025.
Wardrop, N. A., Jochem, W. C., Bird, T. J., Chamberlain, H. R., Clarke, D., Kerr, D., Bengtsson, L., Juran, S., Seaman, V., and Tatem, A. J.: Spatially disaggregated population estimates in the absence of national population and housing census data, P. Natl. Acad. Sci. USA, 115, 3529–3537, https://doi.org/10.1073/pnas.1715305115, 2018.
Wartalska, K., Kaźmierczak, B., Nowakowska, M., and Kotowski, A.: Analysis of Hyetographs for Drainage System Modeling, Water, 12, 149, https://doi.org/10.3390/w12010149, 2020.
Waser, J., Fuchs, R., Ribičić, H., and Blöschl, G.: Visuelle Aktionsplanung im Hochwassermanagement mit Visdom, Forum für Hydrologie und Wasserbewirtschaftung, 30, 280–286, 2011 (in German).
Wilkinson, M. D., Dumontier, M., Aalbersberg, Ij. J., Appleton, G., Axton, M., Baak, A., Blomberg, N., Boiten, J.-W., da Silva Santos, L. B., Bourne, P. E., Bouwman, J., Brookes, A. J., Clark, T., Crosas, M., Dillo, I., Dumon, O., Edmunds, S., Evelo, C. T., Finkers, R., Gonzalez-Beltran, A., Gray, A. J. G., Groth, P., Goble, C., Grethe, J. S., Heringa, J., 't Hoen, P. A. C., Hooft, R., Kuhn, T., Kok, R., Kok, J., Lusher, S. J., Martone, M. E., Mons, A., Packer, A. L., Persson, B., Rocca-Serra, P., Roos, M., van Schaik, R., Sansone, S.-A., Schultes, E., Sengstag, T., Slater, T., Strawn, G., Swertz, M. A., Thompson, M., van der Lei, J., van Mulligen, E., Velterop, J., Waagmeester, A., Wittenburg, P., Wolstencroft, K., Zhao, J., and Mons, B.: The FAIR Guiding Principles for scientific data management and stewardship, Sci. Data, 3, 160018, https://doi.org/10.1038/sdata.2016.18, 2016.
Wimmer, L. and Hovenbitzer, M.: Introducing a Nationwide High-Resolution Pluvial Flood Map: A New Tool for Risk Assessment and Emergency Management in Germany, Abstr. Int. Cartogr. Assoc., 9, 43, https://doi.org/10.5194/ica-abs-9-43-2025, 2025.
Wimmer, L., Hovenbitzer, M., Lenk, M., Katz, E.-C., and Engel, M.: Hinweiskarte Starkregengefahren: Ein Projekt des Bundes und der Länder, KW Korrespondenz Wasserwirtschaft, 2023 (16), Nr. 11, 732–737, https://doi.org/10.3243/kwe2023.11.001, 2023 (in German).
Yang, W., Xu, K., Lian, J., Ma, C., and Bin, L.: Integrated flood vulnerability assessment approach based on TOPSIS and Shannon entropy methods, Ecol. Indic., 89, 269–280, https://doi.org/10.1016/j.ecolind.2018.02.015, 2018.
Zhu, X. X., Chen, S., Zhang, F., Shi, Y., and Wang, Y.: GlobalBuildingAtlas: an open global and complete dataset of building polygons, heights and LoD1 3D models, Earth Syst. Sci. Data, 17, 6647–6668, https://doi.org/10.5194/essd-17-6647-2025, 2025.