the Creative Commons Attribution 4.0 License.
the Creative Commons Attribution 4.0 License.
 | 03 Jun 2026
Capturing the complete landslide–debris-rich flood continuum for accurate inventory, susceptibility and exposure mapping – lessons from Cyclone Idai
Antoine Dille
Olivier Dewitte
Jente Broeckx
Koen Verbist
Andile Sindiso Dube
Jean Poesen
Matthias Vanmaercke
In mountainous regions, intense rainfall can trigger thousands of landslides within hours. The drivers that control the occurrence of such landslides, and the methods for predicting the zones susceptible to their initiation have been extensively studied. Yet, for many of the most severe disasters associated with these landslide events, the main impacts on local communities occurred far from the source areas where most modelling efforts are focused. Sediments mobilized high on slopes by rainfall-triggered landslides can be transported many kilometres downstream, causing significant impacts along their path, while also feeding river systems with large amounts of sediments and consequently increasing flood risks. Such chain of cascading hazards significantly increases the destructive potential of landslides as well as their impact zone. Effective risk mitigation must therefore address not just susceptibility to initiation but also landslide mobility and hazard interactions – yet such studies remain rare.
With this work, we emphasize the importance of capturing what we refer to as the landslide–debris-rich flood continuum (landslide source, runout and related debris-rich floods) for accurate inventory, susceptibility and exposure mapping when landslide mobility is high – as it is often the case for extreme rainfall events. We apply this approach in two districts of eastern Zimbabwe (> 8000 km2), severely impacted by Cyclone Idai in March 2019. Using simple, replicable methods, we mapped over 14 000 (mostly) shallow landslides and 94 km2 of debris-rich flood-affected zones. These data informed detailed susceptibility and exposure models that distinguish between the processes involved. Our results show that around 226 000 individuals live in areas of moderate to high susceptibility to landslide or debris-rich floods – closely matching official figures of those affected by the cyclone. Notably, landslide sources account for only about one-fifth of this total exposure. This highlights the need to consider the entire hazard continuum. Our approach also exemplifies how simple, open-access tools and data can be highly effective for hazard and risk analyses across of the globe.
- Article
(17009 KB) - Full-text XML
- BibTeX
- EndNote


1.1 Context and objectives
Mountainous regions typically feature closely interconnected earth surface processes linked to hillslope material mobilization. These interactions increase the potential for cascading hazards, and consequently the overall risks faced by local communities (Cutter, 2018; Gill et al., 2020; Gill and Malamud, 2014; Jacobs et al., 2016; Lee et al., 2024; Tilloy et al., 2019; Yanites et al., 2025). Landslides are a striking example of this. Their most significant impact on populations and infrastructure often occurs not at the source, but through the transfer and deposition of the landslide material in downslope areas and channels where communities are commonly located (Mergili et al., 2018, 2019; Milledge et al., 2019; Roback et al., 2018). It is through this sequence of interconnected, sediment-transporting processes that many landslide events turn into disasters (Lee et al., 2024; Mergili et al., 2019; Wallace et al., 2022).
Two key factors determine the role of landslides in cascading hazards (Roback et al., 2018): (i) mobility, indicated by runout distance and volume (Iverson et al., 2015; Legros, 2002); and (ii) connectivity, or how much landslide material enters river channels (Wohl et al., 2019). Mobility – and destructive potential – is typically amplified by mixing hillslope material with large runoff volumes during intense rainfall and by erosion and entrainment of additional material like soils, rocks and, vegetation (Iverson and Ouyang, 2015; Pudasaini and Krautblatter, 2021). These mechanisms can turn landslides triggered high on hillslopes into high-mobility debris-rich flows that transport slope material several kilometres downstream from the source area (Iverson et al., 1997; McGuire et al., 2024) and ultimately contribute to the formation of debris-rich (flash) floods (Bennett et al., 2025; Croissant et al., 2017; Slater et al., 2015). Together, these cascading effects expand both the destructive potential and impact zones of the initial landslides (e.g., Jacobs et al., 2016).
Such a continuous sequence of linked sediment-gravity flows (landslides) and fluid-gravity flows (debris to water floods) exemplifies a chain of cascading land hazards – a topic that has received growing attention in recent literature (e.g., Tilloy et al., 2019; Brenna et al., 2020; Gill et al., 2020; Keck et al., 2024; Arango-Carmona et al., 2025; Yanites et al., 2025). The cascading land hazards framework (Yanites et al., 2025) broadly encompasses all linked chains of processes that move water and sediment across Earth's surface, in which one event directly influences the likelihood or intensity of another. This differs from compounding hazards, which refers to co-occurrence and amplification of events that are statistically independent (Yanites et al., 2025). Identifying and constraining such cascading chain of hazard is critical for comprehensive risk assessment (De Angeli et al., 2022; Cutter, 2018; Gill and Malamud, 2014). Although the importance of these interactions has long been recognized (e.g., van Westen et al., 2006), they remain underrepresented in hazard, risk and exposure assessments (Gill et al., 2020; Sharma et al., 2023; de Vilder et al., 2024). Despite growing landslide susceptibility research (e.g., Reichenbach et al., 2018; Merghadi et al., 2020), the vast majority of studies remain focused on landslide initiation, often overlooking mobility and cascading effects (Di Napoli et al., 2021). A number of exceptions exist (e.g., Kritikos and Davies, 2015; Fan et al., 2017; Melo et al., 2019; Mergili et al., 2019; Di Napoli et al., 2021; Van Den Bout et al., 2022; Zhou et al., 2022; Dubey et al., 2023; Keck et al., 2024), but they typically rely on complex and data-demanding models that constrain them to small-case studies (Fan et al., 2017; Mergili et al., 2019). Likewise, exposure mapping – i.e. the identification of populations and infrastructure at risk – remains a relatively underexplored dimension of (cascading) hazard research (Emberson et al., 2020; Lin et al., 2023).
Here, we demonstrate the value of explicitly considering the cascading chain of hazards encompassing landslides to debris-rich floods for inventory, susceptibility, and exposure mapping alongside extreme triggering events. We show the benefits of our approach in two districts of eastern Zimbabwe, severely impacted by Cyclone Idai in March 2019, where landslide and flood hazards data remain scarce. Using simple, replicable methods, we offer insights into this extreme event's consequences, producing comprehensive products to guide land use planning, mitigation, and risk reduction in the region.
1.2 The 2019 Cyclone Idai and its associated landslides in eastern Zimbabwe
Cyclone Idai (Fig. 1a) ranks among the deadliest storms ever recorded in the southern hemisphere (Devi, 2019). In March 2019, it caused widespread flooding across Mozambique, Malawi, and Zimbabwe, resulting in thousands of fatalities and affecting over three million people – many already in need of humanitarian assistance (Chatiza, 2019). In eastern Zimbabwe, the extreme rainfall (300–450 mm between 15–19 March – nearly half the region's annual average of ∼ 1000 mm; IMERG-GPM satellite estimates (Huffman et al., 2019), see Fig. 1a) triggered thousands of highly mobile landslides that severely impacted mountain communities in the Chimanimani and Chipinge districts (e.g., Chatiza, 2019; Chanza et al., 2020).
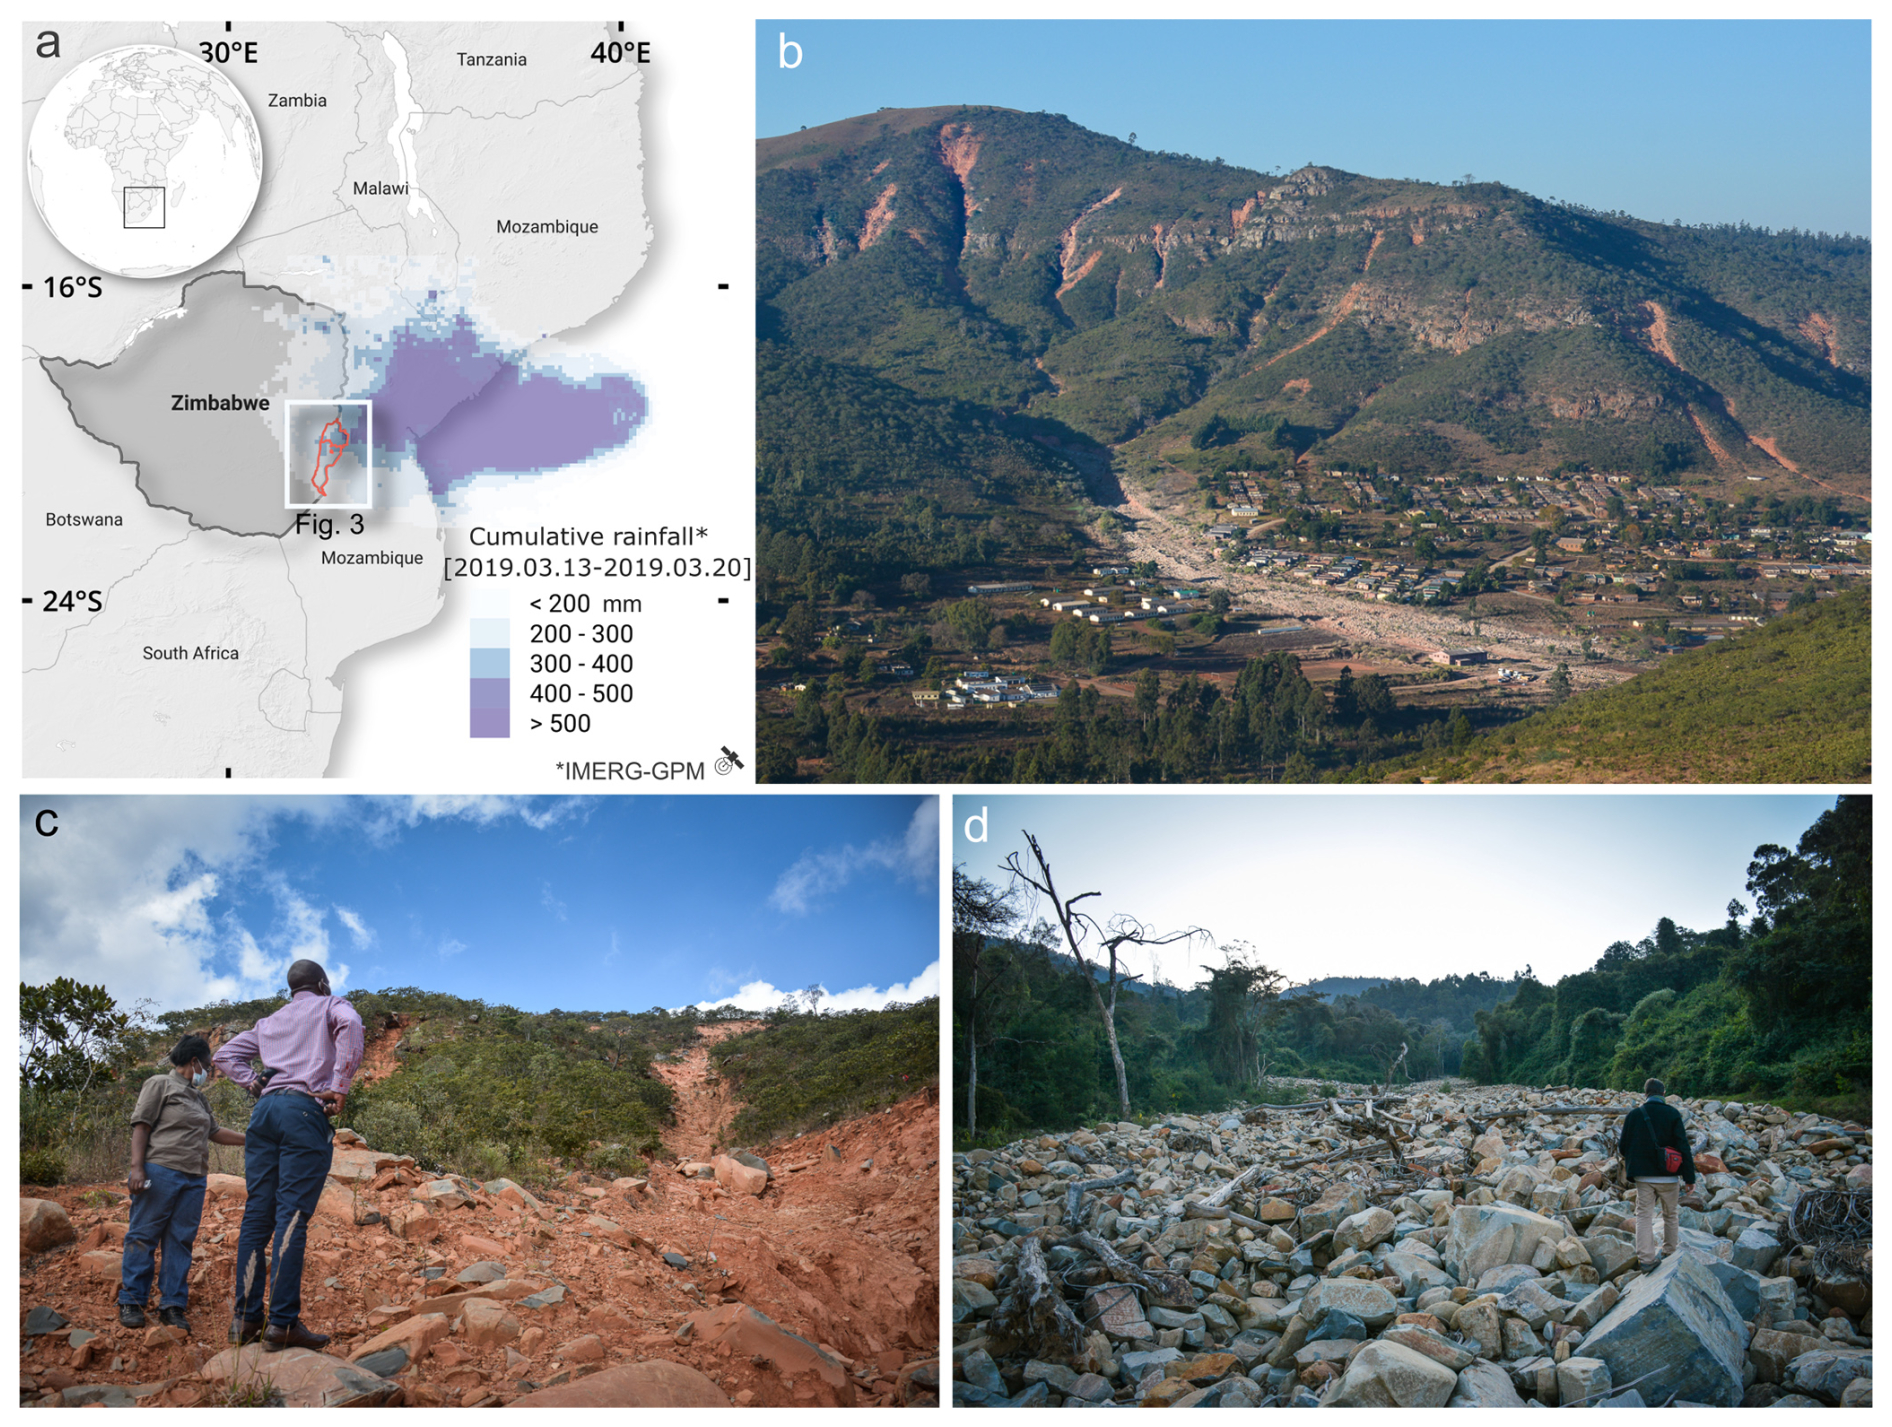
Figure 1Landslides and debris-rich flood triggered by Cyclone Idai in eastern Zimbabwe (a) Cumulative rainfall from 13–20 March 2019, estimated by IMERG-GPM satellite (0.1° × 0.1° resolution; Huffman et al., 2019). Focus districts in eastern Zimbabwe are highlighted in red. (b) Highly mobile landslides triggered by Cyclone Idai near Ngangu Township, Chimanimani (July 2021), with (c) zoom on their runout zones and (d) related debris-rich flood deposits. (b) shows clear debris trails from shallow landslides, with evidence of erosion and entrainment, particularly visible in panel (c), which contributed to severe impacts in Chimanimani Town. Photos taken ∼ 2.5 years after the event (© M. Vanmaercke).
Beyond human and infrastructural losses, the geomorphic impacts – ranging from sediment redistribution to disrupted ecosystem services – were substantial (Das and Wegmann, 2022). Most landslides consisted of shallow soil/regolith and debris slides/avalanches, typically initiating on steep, clay-rich, deeply weathered slopes (Das and Wegmann, 2022; see Fig. 1bc). These shallow landslides were often highly mobile, with the frequent transitions to debris flows. These flows carved clear debris trails from the hillslope into main river channels, with evident signs of material erosion and entrainment (Fig. 1b, c). Ultimately, they fed into sediment-laden floods that impacted communities tens of kilometres downstream (Fig. 1d). This cascading sequence – from landslide initiation to debris flows and sediment-rich floods – was central to the disaster's scale, highlighting the need to explicitly analyse such hazard chains for effective mitigation.
Our work focuses on the Chimanimani and Chipinge districts in eastern Zimbabwe, home to approximately 560 000 inhabitants (Zimbabwe National Statistics Agency, 2022) across ∼ 8600 km2. These were the most severely affected districts in Zimbabwe, also hosting the majority of landslides triggered by Cyclone Idai. As in much of the Global South – and particularly in Africa – this region suffers from a lack of research on geo-hydrological hazards and risks (Broeckx et al., 2018; Dewitte et al., 2022).
1.3 Introducing the concept of landslide – debris-rich flood continuum
The cascading land hazards framework is intentionally broad (Yanites et al., 2025). To more precisely describe the tightly coupled and progressive sequence of sediment-transporting phenomena observed alongside Idai, we introduce the concept of the landslide–debris-rich flood continuum. We distinguish three interconnected stages, marked by decreasing sediment-to-water ratios: landslide source, runout, and debris-rich flood (Fig. 2). While these stages typically occur successively along topographic profiles, their boundaries remain porous in terms of process classification – potentially encompassing a range of mass movement types, including shallow soil and debris slides, debris avalanches, debris flows, hyperconcentrated flows, debris floods, and (debris-rich) (flash) floods (e.g., Hungr et al., 2014; Church and Jakob, 2020). The landslide source refers to the failure zone, where material detaches from the slope. Runout zones are typically channelized paths where entrainment and deposition occur, often influenced by runoff and/or the merging of multiple slope failures. Finally, debris-rich floods involve water-dominated flows in high order channels, but that are capable of transporting slope material far beyond the immediate vicinity of the landslides and their runout (Fig. 2).
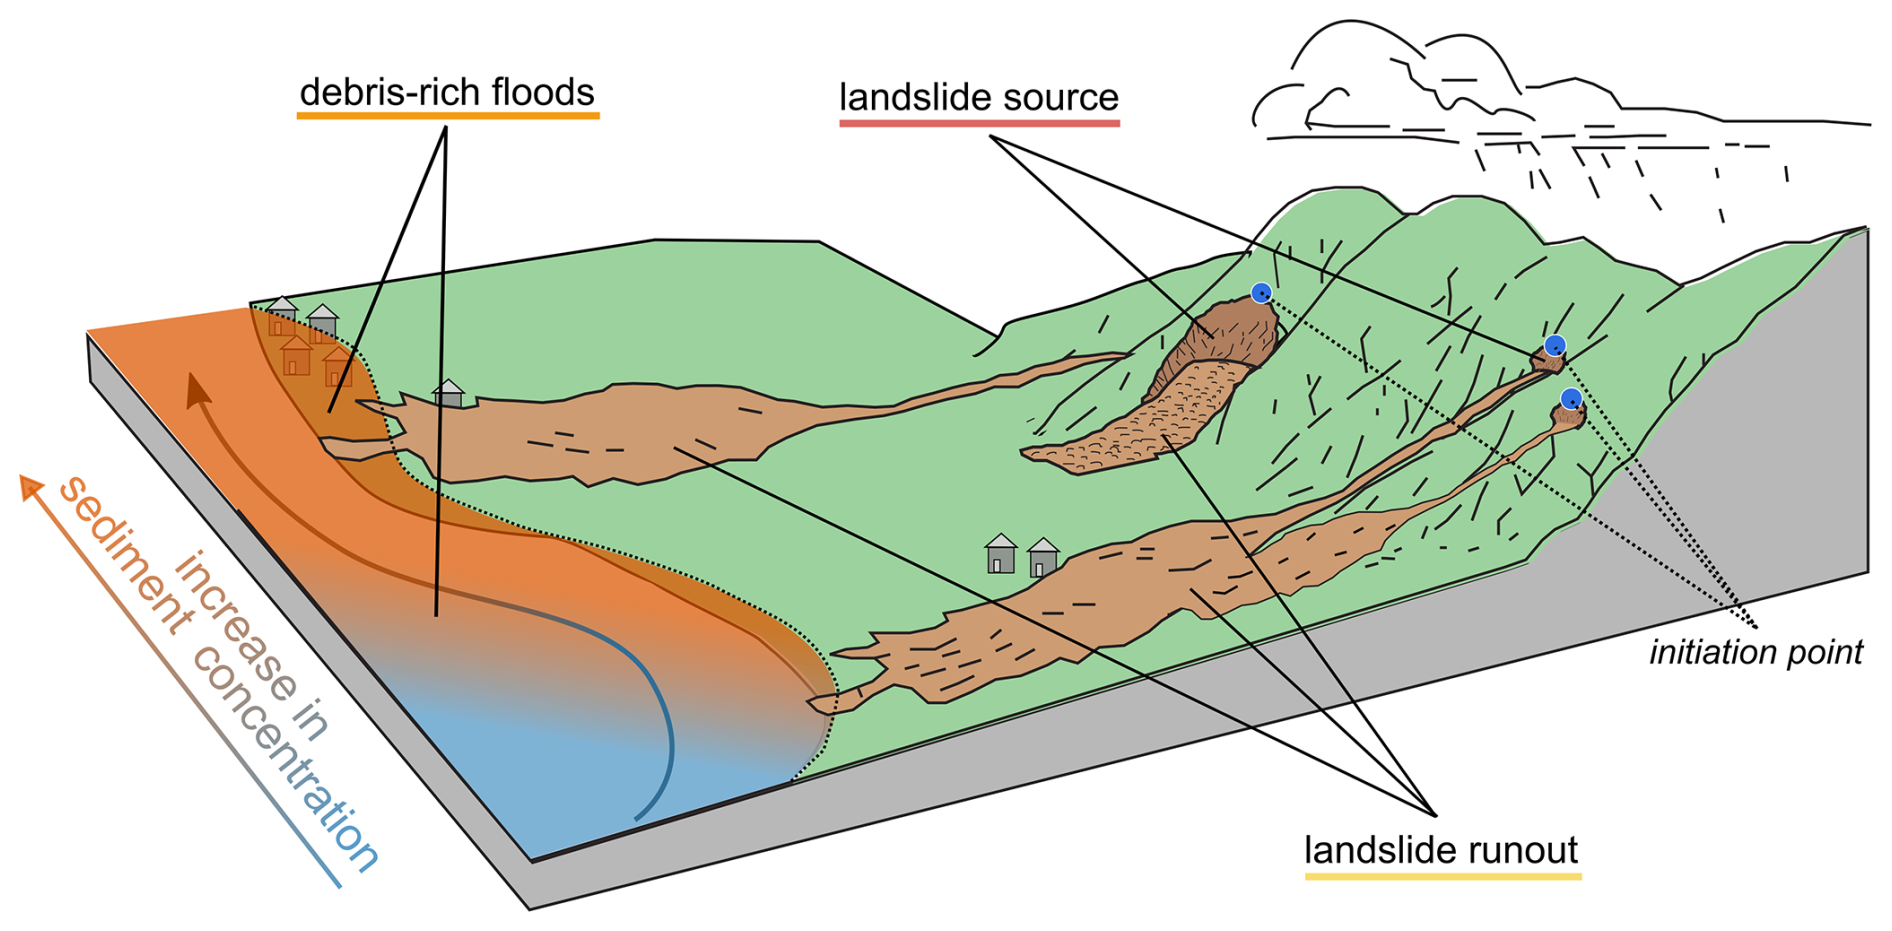
Figure 2Illustration and definition of the landslide–debris-rich flood continuum, showing landslide source, landslide runout, and associated debris-rich flood zones as mapped in this study. Locations of the initiation points used during the manual inventory (INV_02-POINT) are also indicated. Adapted from Highland and Bobrowsky (2008).
2.1 Mapping the zones affected by Idai
We followed a three-step methodology to map and classify the areas affected by Cyclone Idai. First, we manually mapped parts of the two districts to build a reference inventory for training and validation. Second, we automatically identified all the zones impacted based on satellite images. Third, we classified these zones according to the process at play (i.e., landslide source, runout, or debris-rich flood).
2.1.1 Step 1: manual mapping for model training and validation (INV_01-POLY, INV_02-POINT)
We first created two manually mapped datasets to train and validate subsequent products. INV_01-POLY consists of a detailed classification of affected and unaffected zones over ∼ 1300 km2(∼ 15 % of the study area), using 3-m resolution PlanetScope imagery from late March–early April 2019 (Fig. 3a). We mapped 1240 landslide source zones (2.3 km2; avg. size 1860 m2), 200 runout zones (3.3 km2; avg. size 16 700 m2), and 54 debris-rich flood deposits (27 km2; avg. size 482 000 m2), along with ∼ 1265 km2 of unaffected areas. INV_02-POINT is a point dataset of ∼ 14 900 landslide initiation points across the full study area, digitized using very-high-resolution Google Earth imagery (April 2019–June 2021), with points placed at the headscarp of each landslide (see FigS. 2, 3b).
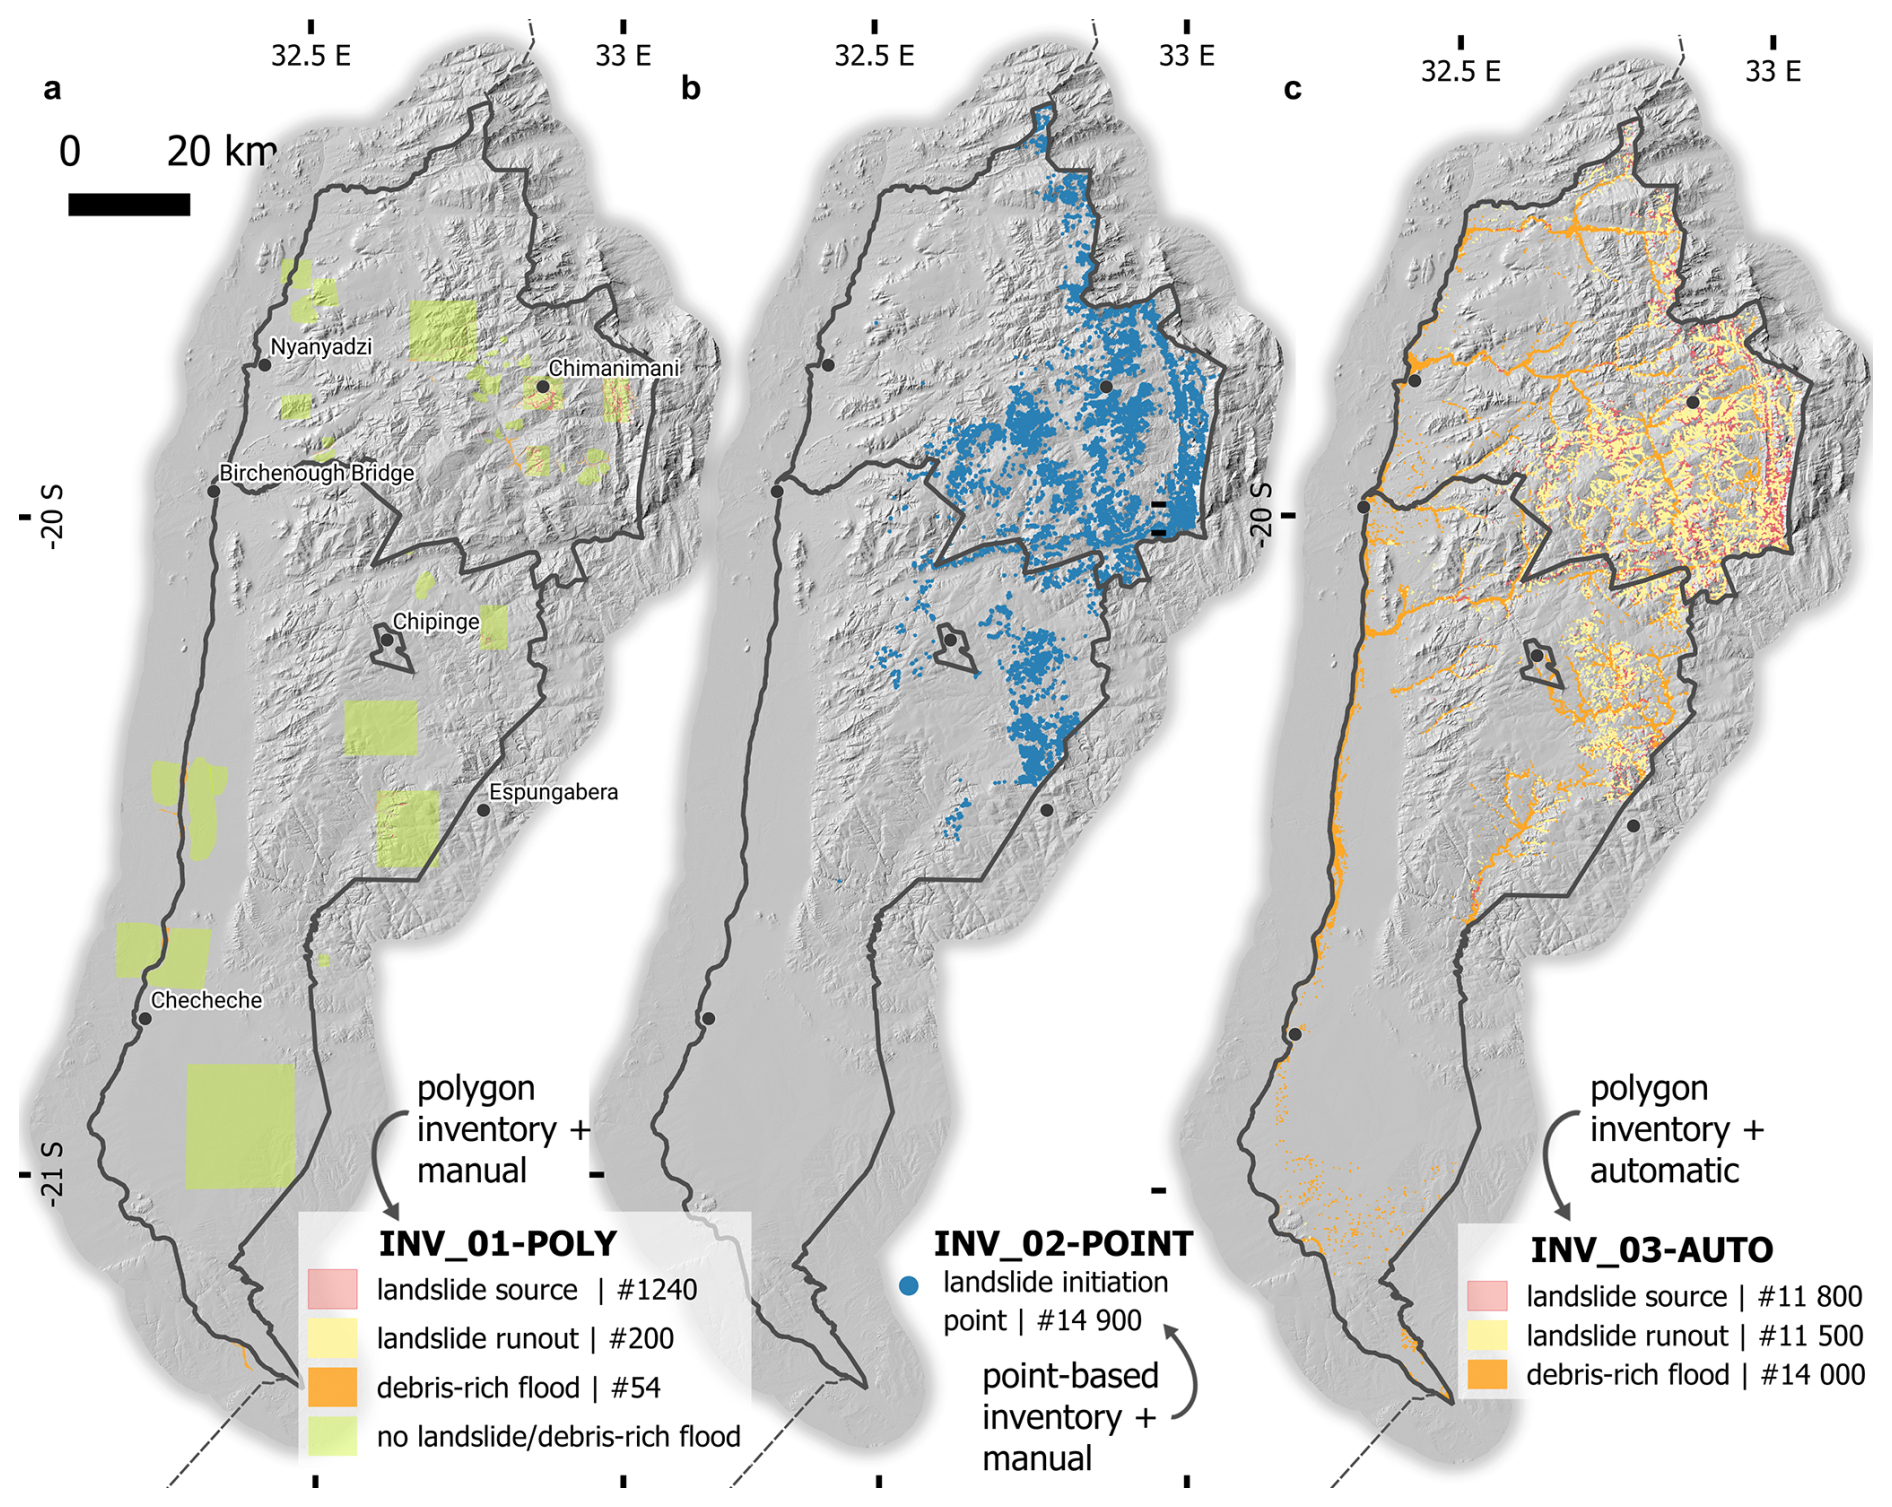
Figure 3Inventory and classification of landslide source, runout and debris-rich flood. (a) Manual polygon-based inventory (INV_01-POLY) of parts of the two districts, used for training and validating the logistic regression model (cf. Sect. 2.1.3 and 2.2). (b) Manual inventory of landslides initiation points triggered by Idai across the entire two districts (INV_02-POINT), with each point representing a single landslide. (c) Automatic inventory of the classified impacted zones for the two entire districts (INV_03-AUTO).
2.1.2 Step 2: automatic detection of affected zones
We compared Normalized Difference Vegetation Index (NDVI) on pre- and post-event Sentinel-2 satellite images to map impacted areas. This simple metric proved sufficient for accurate delineation as the affected zones had a clear visual and spectral signature immediately following the events. To perform this analysis, we used the open-source HazMapper application (Scheip and Wegmann, 2021) in Google Earth Engine, which generates “greenest-pixel” composites over one-month periods before and after mid-March 2019. This approach reduces the influence of clouds and phenological variability by retaining only the highest NDVI value per pixel within the time window.
The resulting NDVI gain/loss maps, produced at a 10-m resolution (Sentinel-2 resolution), were compared with INV_01-POLY to determine an optimal threshold for delineating impacted areas. Six NDVI thresholds (from −8 % to −18 %) were tested; a threshold of −12 % yielded the best performance, correctly identifying 97 % of mapped landslide source, runout, and debris-rich flood zones, with omission and commission errors of 0.55 % and 2.6 %, respectively. The small omission error indicates that nearly all impacted areas were captured, while the slightly higher commission error was primarily due to unrelated deforestation activities occurring within the one-month analysis window. These false positives, which had a typical signature, were manually removed.
2.1.3 Step 3: classification of affected zones (INV_03-AUTO)
We developed a multinomial logistic regression model to classify the automatically detected impacted zones into three process types: landslide source, runout, and debris-rich flood (INV_03-AUTO; see Figs. 2, 3c). The model, implemented in Python using the Scikit-learn library (Pedregosa et al., 2011), was trained on the INV_01-POLY dataset using a cross-entropy loss function. To address class imbalance (e.g., the larger spatial extent of debris-rich flood deposits), we applied the Synthetic Minority Oversampling Technique (SMOTE) to oversample minority classes and downsample the majority class. 70 % of the mapped pixels were used for training and 30 % for testing.
To differentiate between the various processes occurring along the slope profile, we selected predictors that capture where mass is likely to be mobilized, transported, or deposited. These are primarily topographic factors that reflect slope geometry, drainage, and terrain position. Predictors for the model were derived from the Copernicus GLO-30 digital elevation model (DEM, see Table 1) but we do not expect large differences in end-results with other DEMs of similar resolution and accuracy. Specifically we used: (i) local downward relief (calculated within a 200 m radius); (ii) topographic wetness index (TWI); (iii) topographic position index (TPI) over 300 m radius (Weiss, 2000); (iv) normalized steepness index (Ksn), capturing slope and upstream contributing area characteristics (Vanmaercke et al., 2020); (v) flow accumulation, weighted by a continental landslide susceptibility map (Broeckx et al., 2018) to give more importance to drainage paths likely to receive material from upslope failures; and (vi) forest cover and forest loss (2014–2018) from Hansen et al. (2013), reflecting vegetation-related controls on slope stability in tropical regions (e.g., Depicker et al., 2021a, 2021b). All predictors were normalized (mean-centered and scaled by standard deviation) and calculated at original 30-m DEM resolution. The classification was performed with upsampled predictors to exploit the 10-m resolution map of impacted zones derived from Sentinel-2 data.
Table 1Landslide predictors used in the logistic regression models for both inventory classification (Sect. 2.1.3) and susceptibility analyses (Sect. 2.2), grouped by theme following Reichenbach et al. (2018).
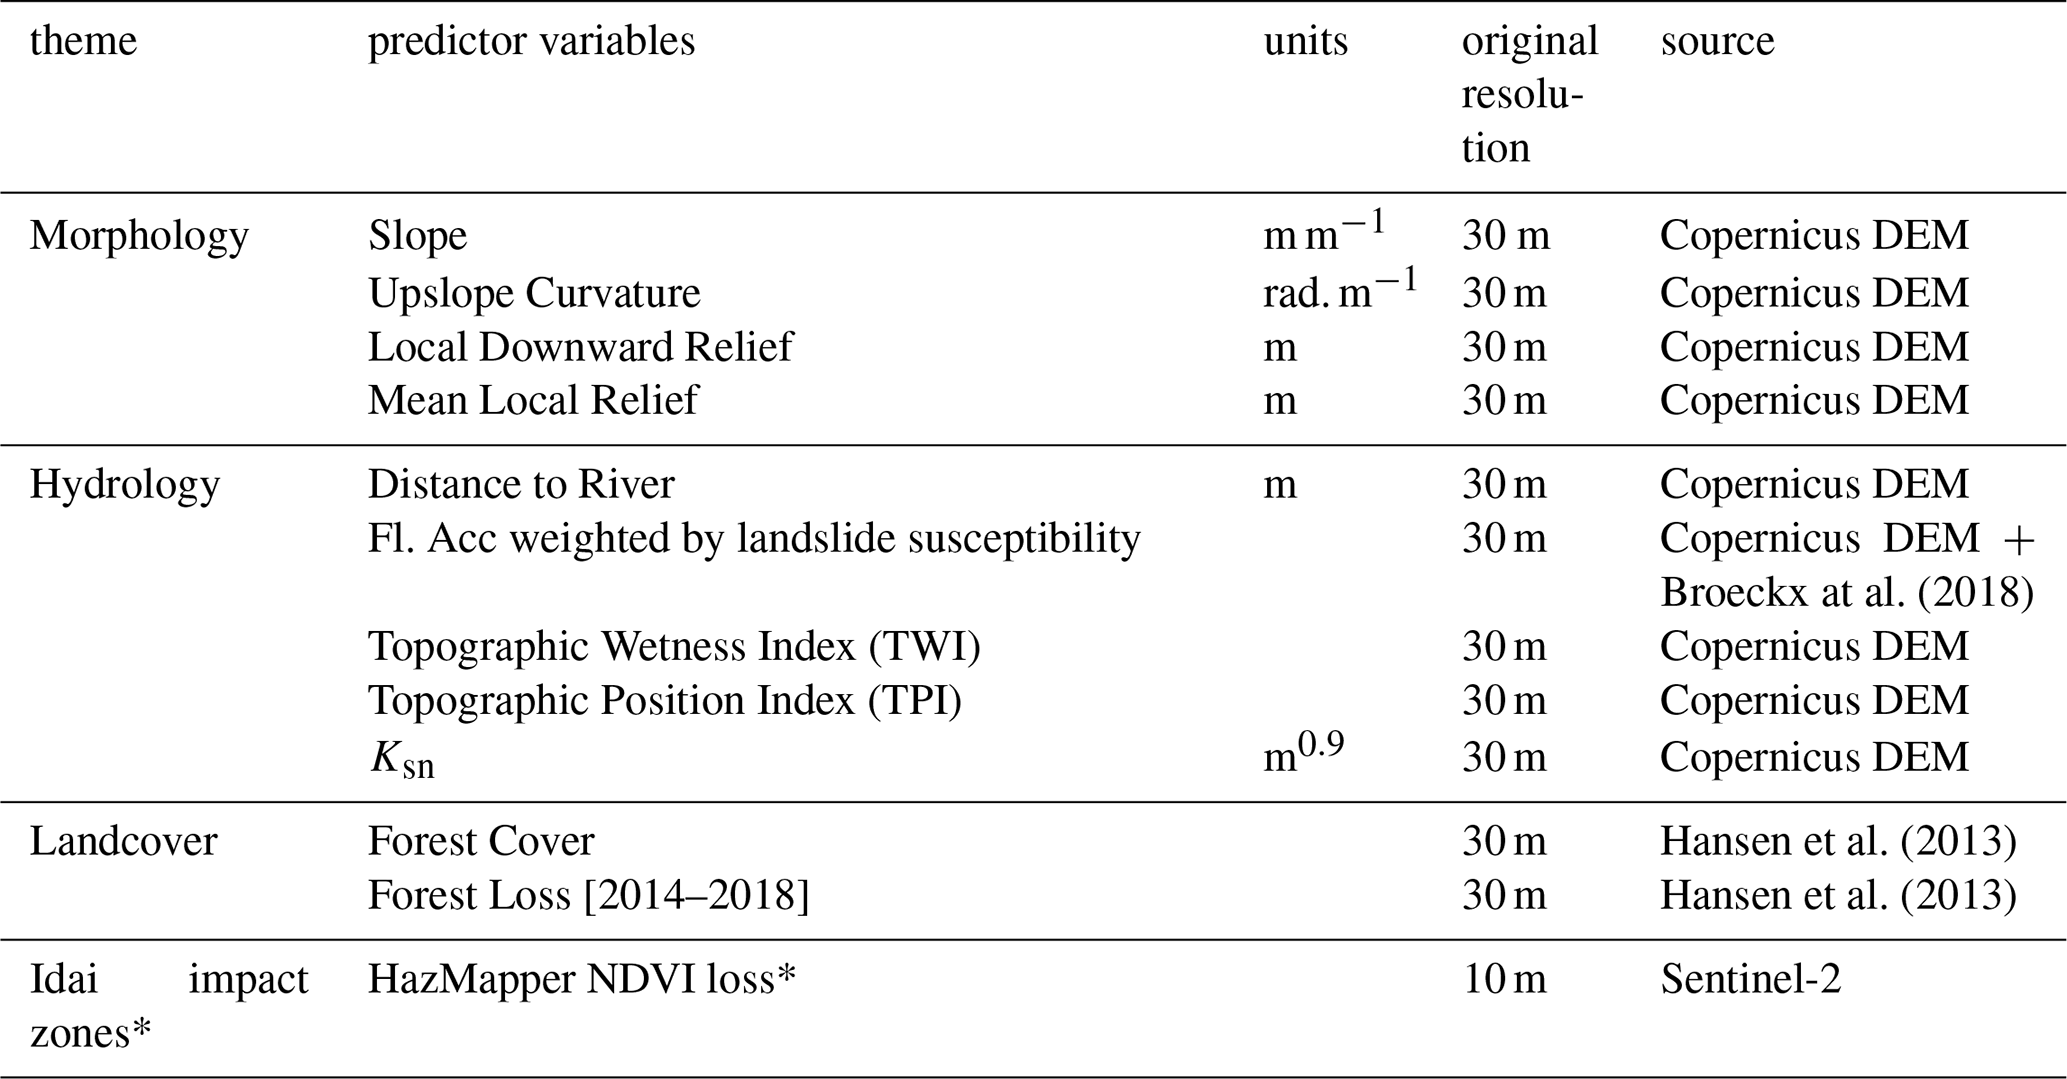
Note: HazMapper NDVI loss* was used only for the classification model, see Sect. 2.2 .
To address potential multicollinearity among predictors, we applied a three-step procedure: (1) Pearson correlation analysis to flag variable pairs with , (2) Variance Inflation Factor (VIF) computation to identify variables with VIF > 10, and (3) iterative removal of highly collinear variables based on both criteria. Model performance was then compared across three feature sets: (i) all predictors, (ii) predictors with collinear variables removed, and (iii) the top-5 features from univariate tests. As the full predictor set delivered the highest test accuracy, all variables were retained for final model training and susceptibility mapping.
Model performance was evaluated using receiver operating characteristic (ROC) curves, precision–recall curves, and prediction rate curves. ROC curves quantify the ability to separate classes through the area under the curve (AUC), while precision–recall curves provide complementary insight, being more sensitive to omission errors (i.e., false negatives), offering additional information on class-wise prediction accuracy. Prediction rate curves were also used, given their relevance for assessing the spatial predictive power of susceptibility models (e.g., Zêzere et al., 2017). They illustrate the proportion of landslides expected to fall within a given susceptibility class, thereby providing an actual measure of the model's success rate.
To assess the role of individual predictors, we also trained univariate models and computed ROCuni scores, averaged over 10-fold cross-validation (Depicker et al., 2020), with higher values reflecting stronger class discrimination. Additionally, the influence of predictors in the multivariate model was quantified using odds ratios (OR), derived from the three process models and calculated with 10-fold cross-validation. Finally, model stability was tested through repeated cross-validation using the full set of predictors, revealing minimal coefficient variability (<1 %), suggesting robust model performance.
2.2 Assessing the landscape susceptibility
We applied a similar modelling approach as in Sect. 2.1.3 to assess the susceptibility of each pixel of the two districts to one of the three processes in the landslide – debris-rich flood continuum (or none). The logistic regression model uses the same environmental predictors as before (Table 1), except for the HazMapper-calculated NDVI loss, which was excluded to avoid overfitting to Idai event. Collinearity and feature-selection analyses were repeated, and ultimately all features were used. For interpretability and cross-model comparison, susceptibility values were classified into five categories: very low, low, moderate, high, and very high, following Stanley and Kirschbaum (2017). Each category contains twice as many pixels as the next highest, ensuring consistency across models and highlighting the most susceptible areas. In addition to accuracy metrics obtained from validation pixels from the manual polygon inventory (INV_01-POLY), we assessed model predictions against the automatically generated inventory of thousands of landslides and debris-rich floods from Sect. 2.1.3 (INV_03-AUTO), which was not used for susceptibility model construction. This inventory provides a large, spatially unbiased dataset covering the entire study area (compared to the ∼ 15 % coverage by INV_01-POLY), though being built on a large-impact event may marginally reduce predictive performance for smaller, more isolated occurrences.Note that the debris-rich flood susceptibility model was restricted to mountainous areas, where sediment-laden flows are most likely; farther downstream, sediment concentrations decrease and flash floods behave differently, making them harder to assess with our available data and approach. Flat areas, known to artificially inflate model performance (Brenning, 2012), were also excluded from the landslide source zone analysis.
2.3 Mapping the population and building exposure
Exposure assessment seeks to identify population and infrastructure at risk, in order to prioritize risk management and future mitigation efforts (Dubey et al., 2023; Emberson et al., 2020). This is achieved by intersecting the susceptibility with population distribution and building/infrastructure footprints. We produced exposure estimates for each of the three susceptibility models: landslide source, runout, and debris-rich flood (Sect. 2.2). In terms of elements potentially at risk, we considered the population (density and individual buildings) and key infrastructure (roads, bridges, schools, health centres; Fig. A1). For this, we combined (typically incomplete) OpenStreetMap building data with Facebook High Resolution Population Density Maps (30×30 m estimates; last updated 2022; Tiecke et al., 2017) and Google Open Buildings (individual footprints; last updated 2022; Sirko et al., 2021), retaining only buildings with > 65 % confidence. Infrastructure data were obtained from the UNESCO Regional Office for Southern Africa (mostly from digitized areal imagery) and combined with OpenStreetMap. Overlaying these datasets with susceptibility maps resulted in pixel-based exposure maps for both districts and classifications of exposure levels for individual buildings and infrastructure. Additionally, population and building data were compared to observed extent of Idai impacts to assess consistency between exposure estimates and figures reported by NGOs and government sources.
3.1 Idai's impacts inventory
We identified 130 km2 impacted by landslides and debris-rich floods (∼ 1.5 % of the total area of 8600 km2; Fig. 4). Most landslides occurred in eastern Chimanimani, which is more mountainous and received higher rainfall totals (average 330 mm, with ∼ 1300 km2 receiving > 350 mm between 15–19 March 2019 based on satellite estimates). In contrast, rainfall over Chipinge averaged 230 mm, with no areas exceeding 330 mm (IMERG-GPM satellite estimates; Fig. 5a).
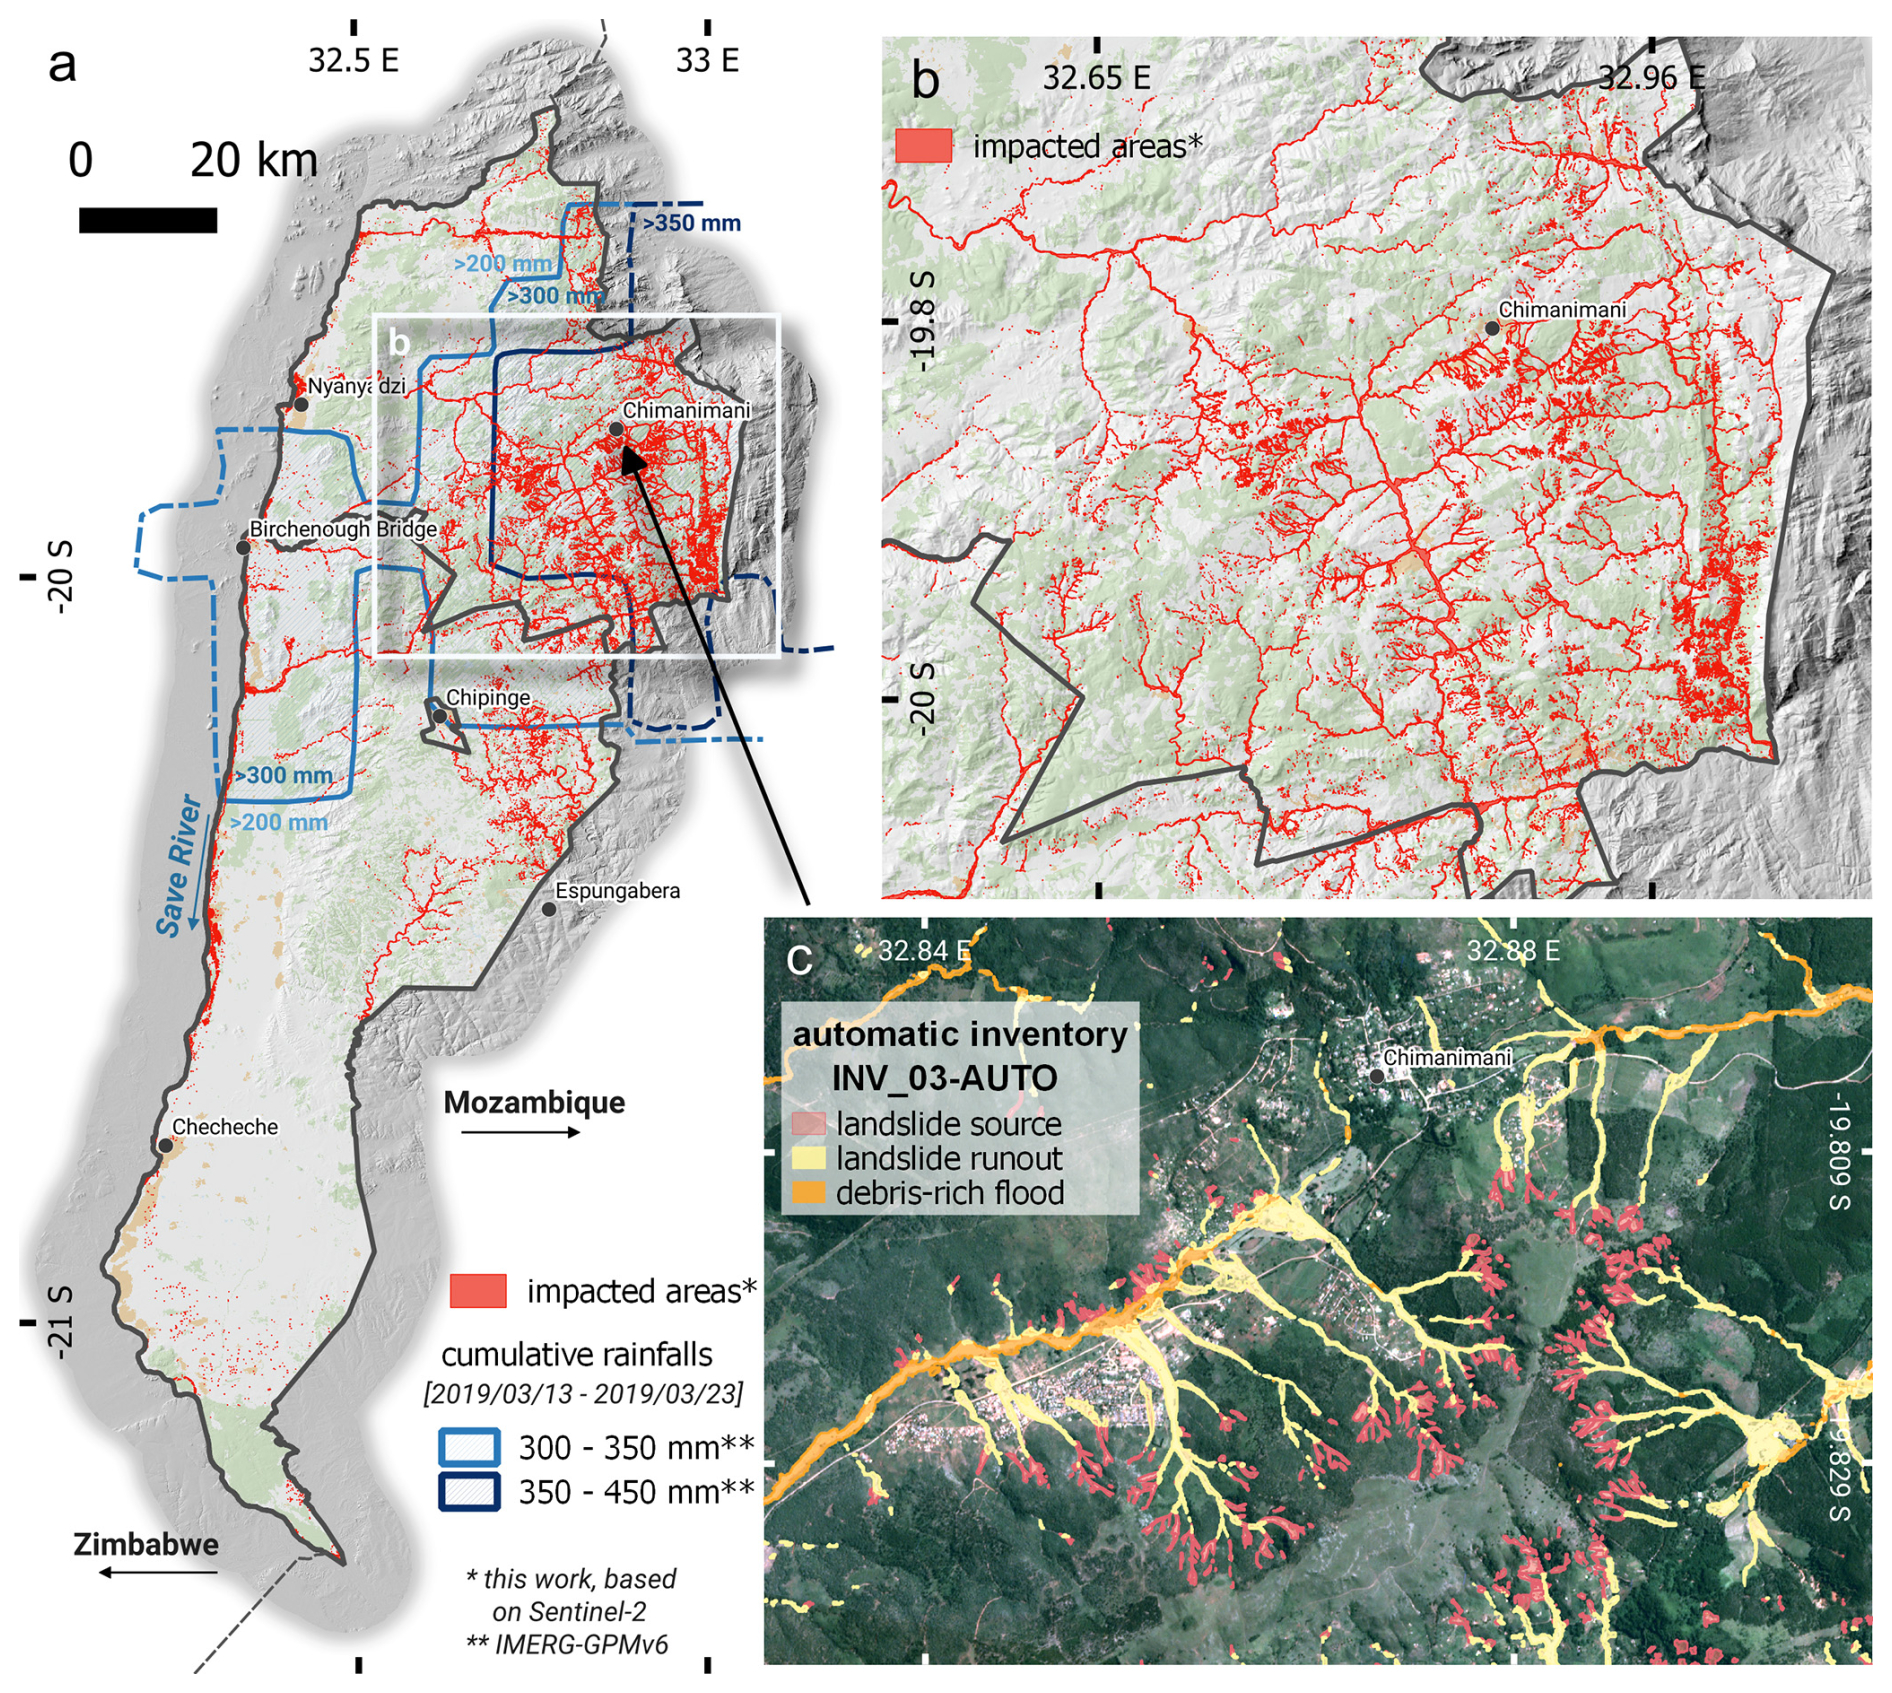
Figure 4Automatically detected impacted areas and classification (INV_03-AUTO). (a) Red zones indicates areas affected by landslides or debris-rich floods (i.e., zones where the vegetation has been damaged, removed and/or covered by sediments) alongside Idai for Chimanimani (North) and Chipinge (South) districts. These zones were identified by comparing of pre and post-event Sentinel-2 composites. Pale blue and dark blue contours show cumulative rainfall > 300 and > 350 mm (satellite estimates) from 13–20 March 2019; other areas received ≥200 mm. (b) Zoom on impacted areas in Chimanimani district. Elongated shapes indicate debris-rich flood zones, while small features on upper hillslopes are landslides; long runouts often connect the two. (c) Detailed zoom on Ngangu Township, Chimanimani, showing automatic classification of landslide source, runout, and debris-rich flood (INV_03-AUTO). Definitions of these zones are illustrated in Fig. 2.
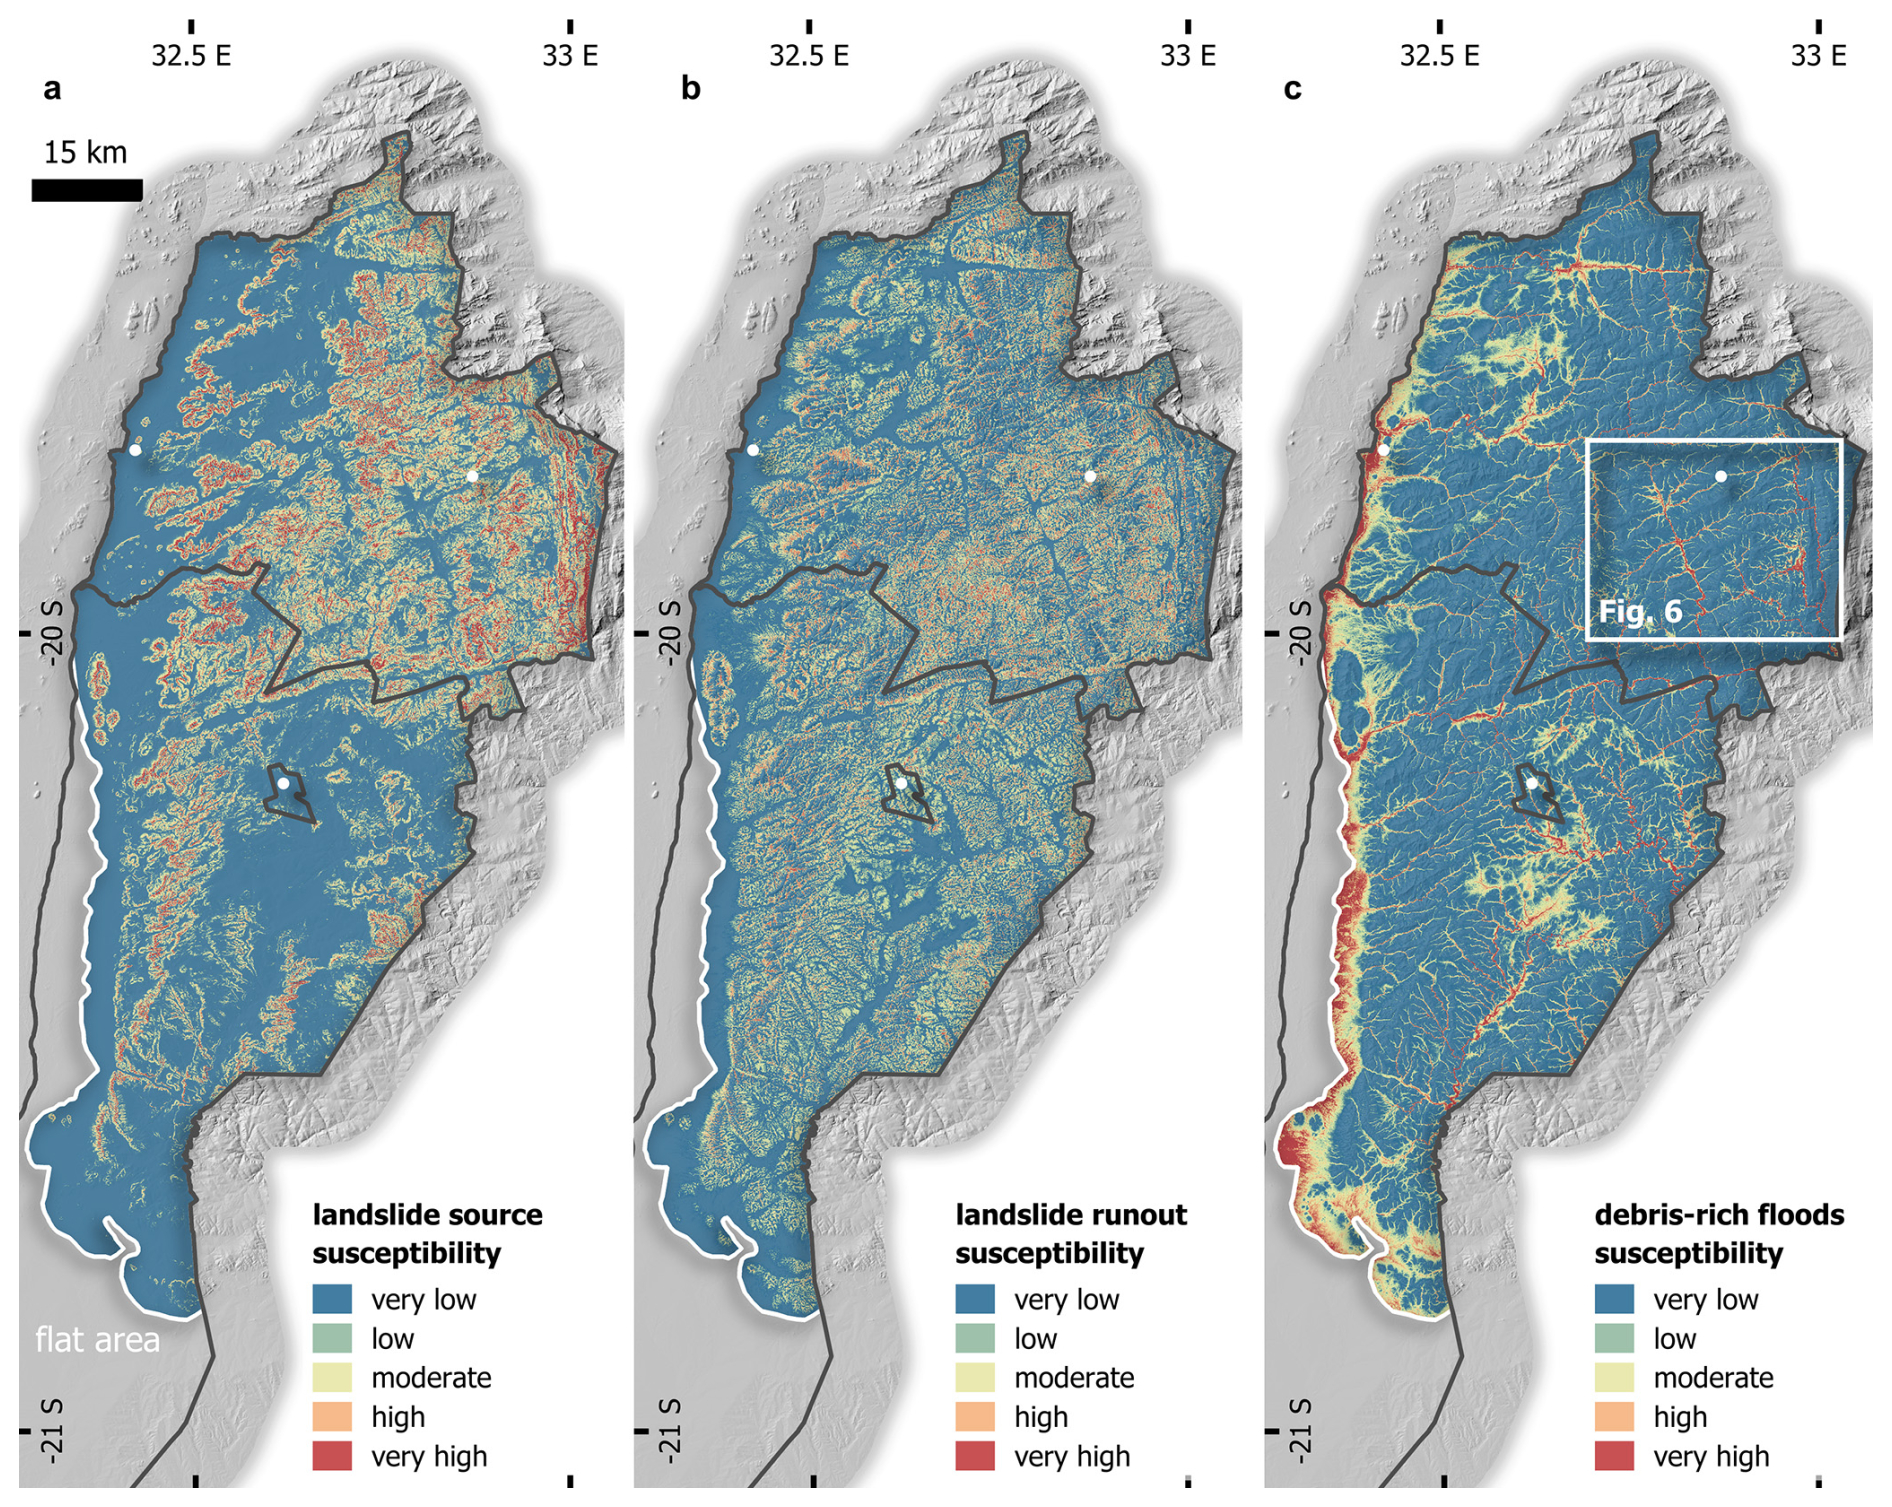
Figure 5Susceptibility maps. Maps showing susceptibility to (a) landslide source, (b) landslide runout and (c) debris-rich flood in Chimanimani and Chipinge districts.
Automatic classification (INV_03-AUTO, Fig. 4c) detected 11 800 landslide source areas (mean 1450 m2, median 600 m2, total 17.3 km2), 11 500 runout areas (mean 1500 m2, median 500 m2, total 17.1 km2), and 14 000 debris-rich flood areas (mean 6700 m2, median 800 m2, total 94 km2). Most landslide-affected zones are in Chimanimani (31 km2, 91 %), while debris-rich flood zones are more evenly distributed (51 km2 vs. 43 km2 in Chipinge), mainly along rivers draining high landslide-density areas. High landslide density areas are also typically associated with long runout zones, which channelled large sediment volumes from hillslopes into rivers.
The logistic regression classifier performed well, achieving validation AUCs of 0.90 for runout, 0.94 for source, and 0.97 for debris-rich floods. Adding HazMapper NDVI gain/loss as a predictor increased AUCs to 0.94–0.98, especially improving separation between runout and debris-rich flood classes. Precision–recall scores ranged from 0.73 (runout) to 0.91 (debris-rich floods), improving to 0.82–0.94 with HazMapper NDVI. Most misclassifications occurred between landslide source and runout classes. About 11 000 of the 14 900 manually inventoried landslide initiation points (INV_02-POINT) lie within 100 m of an automatic source area (73.8 %, INV_03-AUTO). Automatic delineation also identified 21 % fewer sources, reflecting both missed landslides and amalgamation of adjacent ones (Marc and Hovius, 2015).
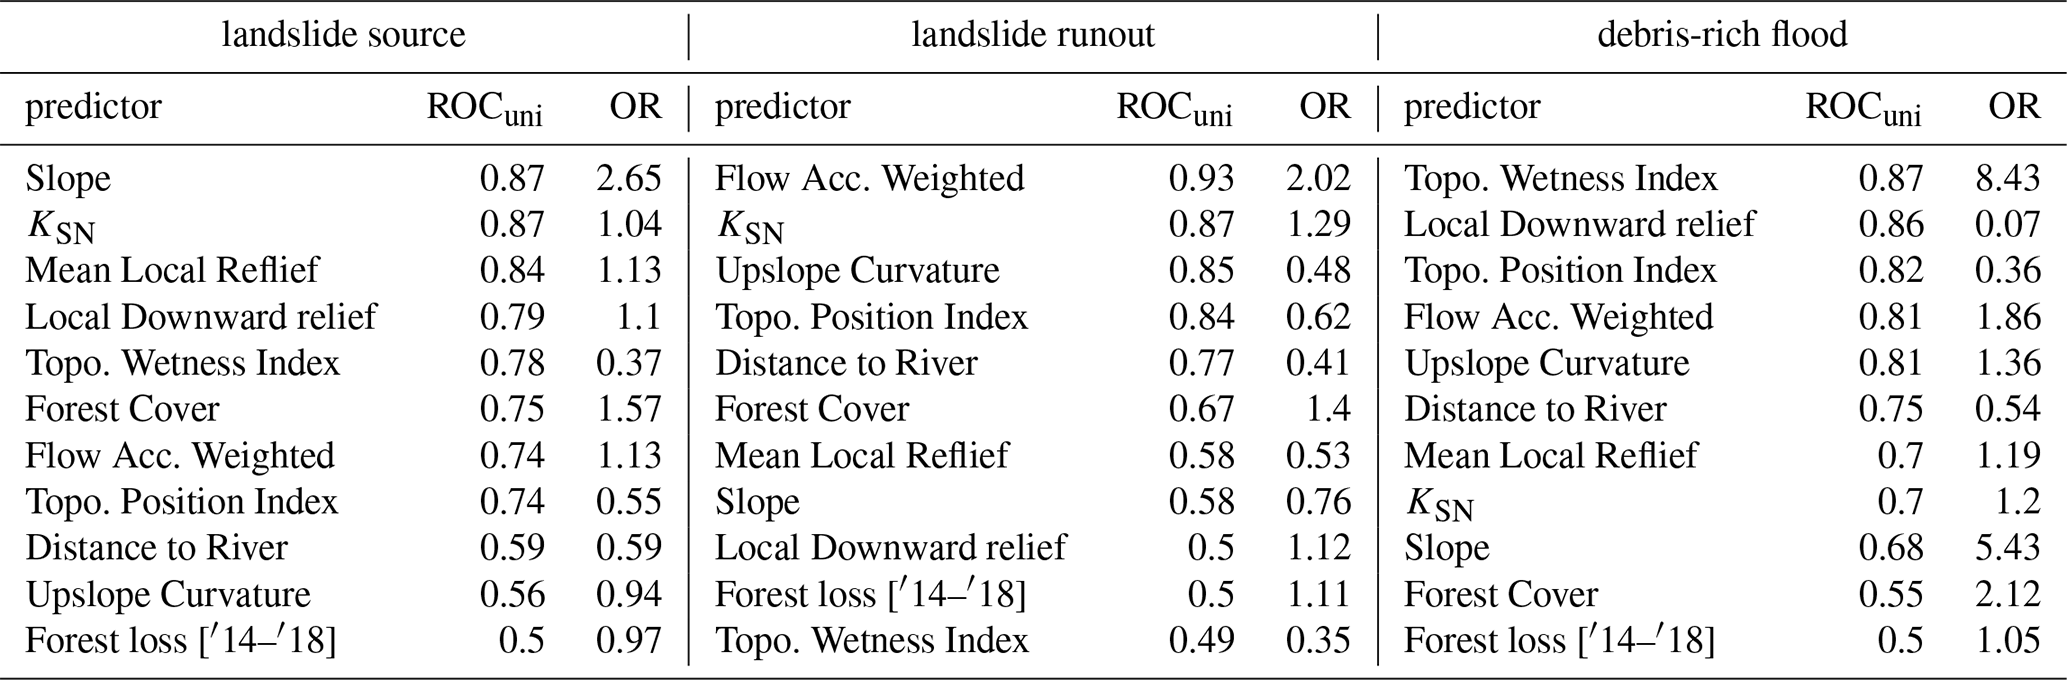
Topographic variables were found key predictors (Table 2): slope for landslide source, susceptibility weighted flow accumulation for runout, and local downward relief plus topographic wetness index (TWI) for debris-rich floods. Though a weak predictor on its own, TWI was also an important (negative) predictor for source and runout zones. Forest cover (but not recent loss) had no individual predictive power yet contributed to multivariate models. Conversely, Ksn was a strong individual predictor for source and runout, but was less influential in the multivariate model.
Table 2Predictor importance. The relative importance of the predictors (Table 1) for modelling each process individually is assessed through comparison of univariate AUC ROCuni. The odds ratios (OR) are derived from multivariate model and calculated with 10-fold cross-validation (CV).
3.2 Susceptibility
The susceptibility models for the three distinct processes (Figs. 5 and 6) highlight how different hazards clearly affect specific landscape zones. A clear gradient emerges with altitude and slope, shaping the susceptibility to landslide sources, landslide runout, and debris-rich floods. Prediction rate curves indicate that, over an unspecified time frame, 83 % of future runout zones are expected to fall within the 20 % of the study area identified as most susceptible. Predictive accuracy is even higher for landslide sources (87 %) and debris-rich floods (95 %).
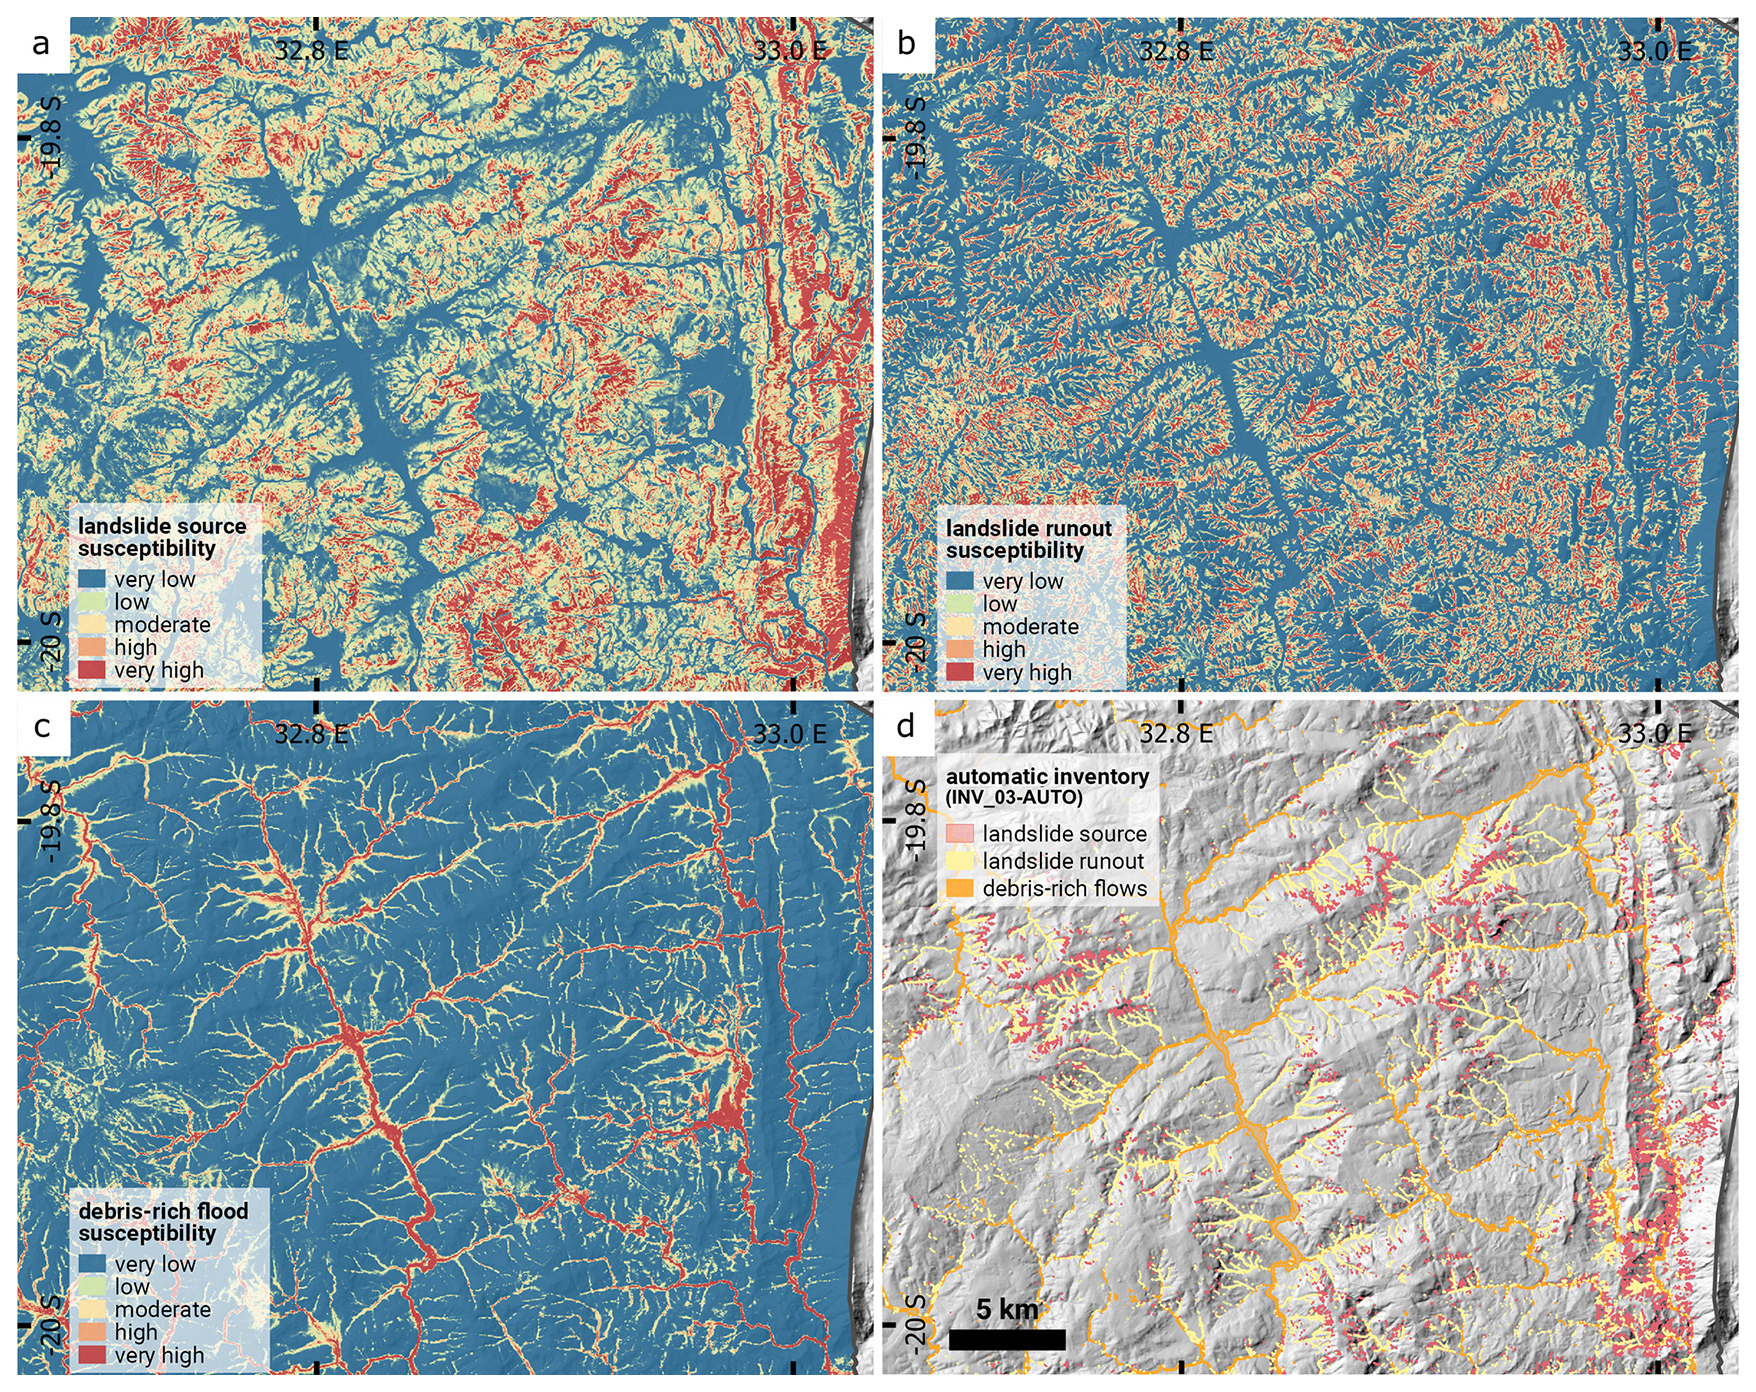
Figure 6Susceptibility maps – zoom on Chimanimani. Maps showing susceptibility to being a (a) landslide source area, (b) landslide runout zone and (c) debris-rich flood zone. (d) Automatic inventory (INV_03-AUTO) of landslides and debris-rich floods in the same area. The extent of the area shown here is indicated in Fig. 5c.
3.3 Exposure
Many settlements in the two districts exhibit high exposure (Fig. 7), with an uneven spatial distribution of the population creating notable contrasts between susceptibility and exposure maps. Importantly, these figures highlight significant discrepancies in exposure to the three processes around the landscape. As expected, areas with the highest exposure to landslides and runout are predominantly located in the mountainous regions. In contrast, areas west of the two districts, along the main streams, show high population and building exposure to debris-rich floods.
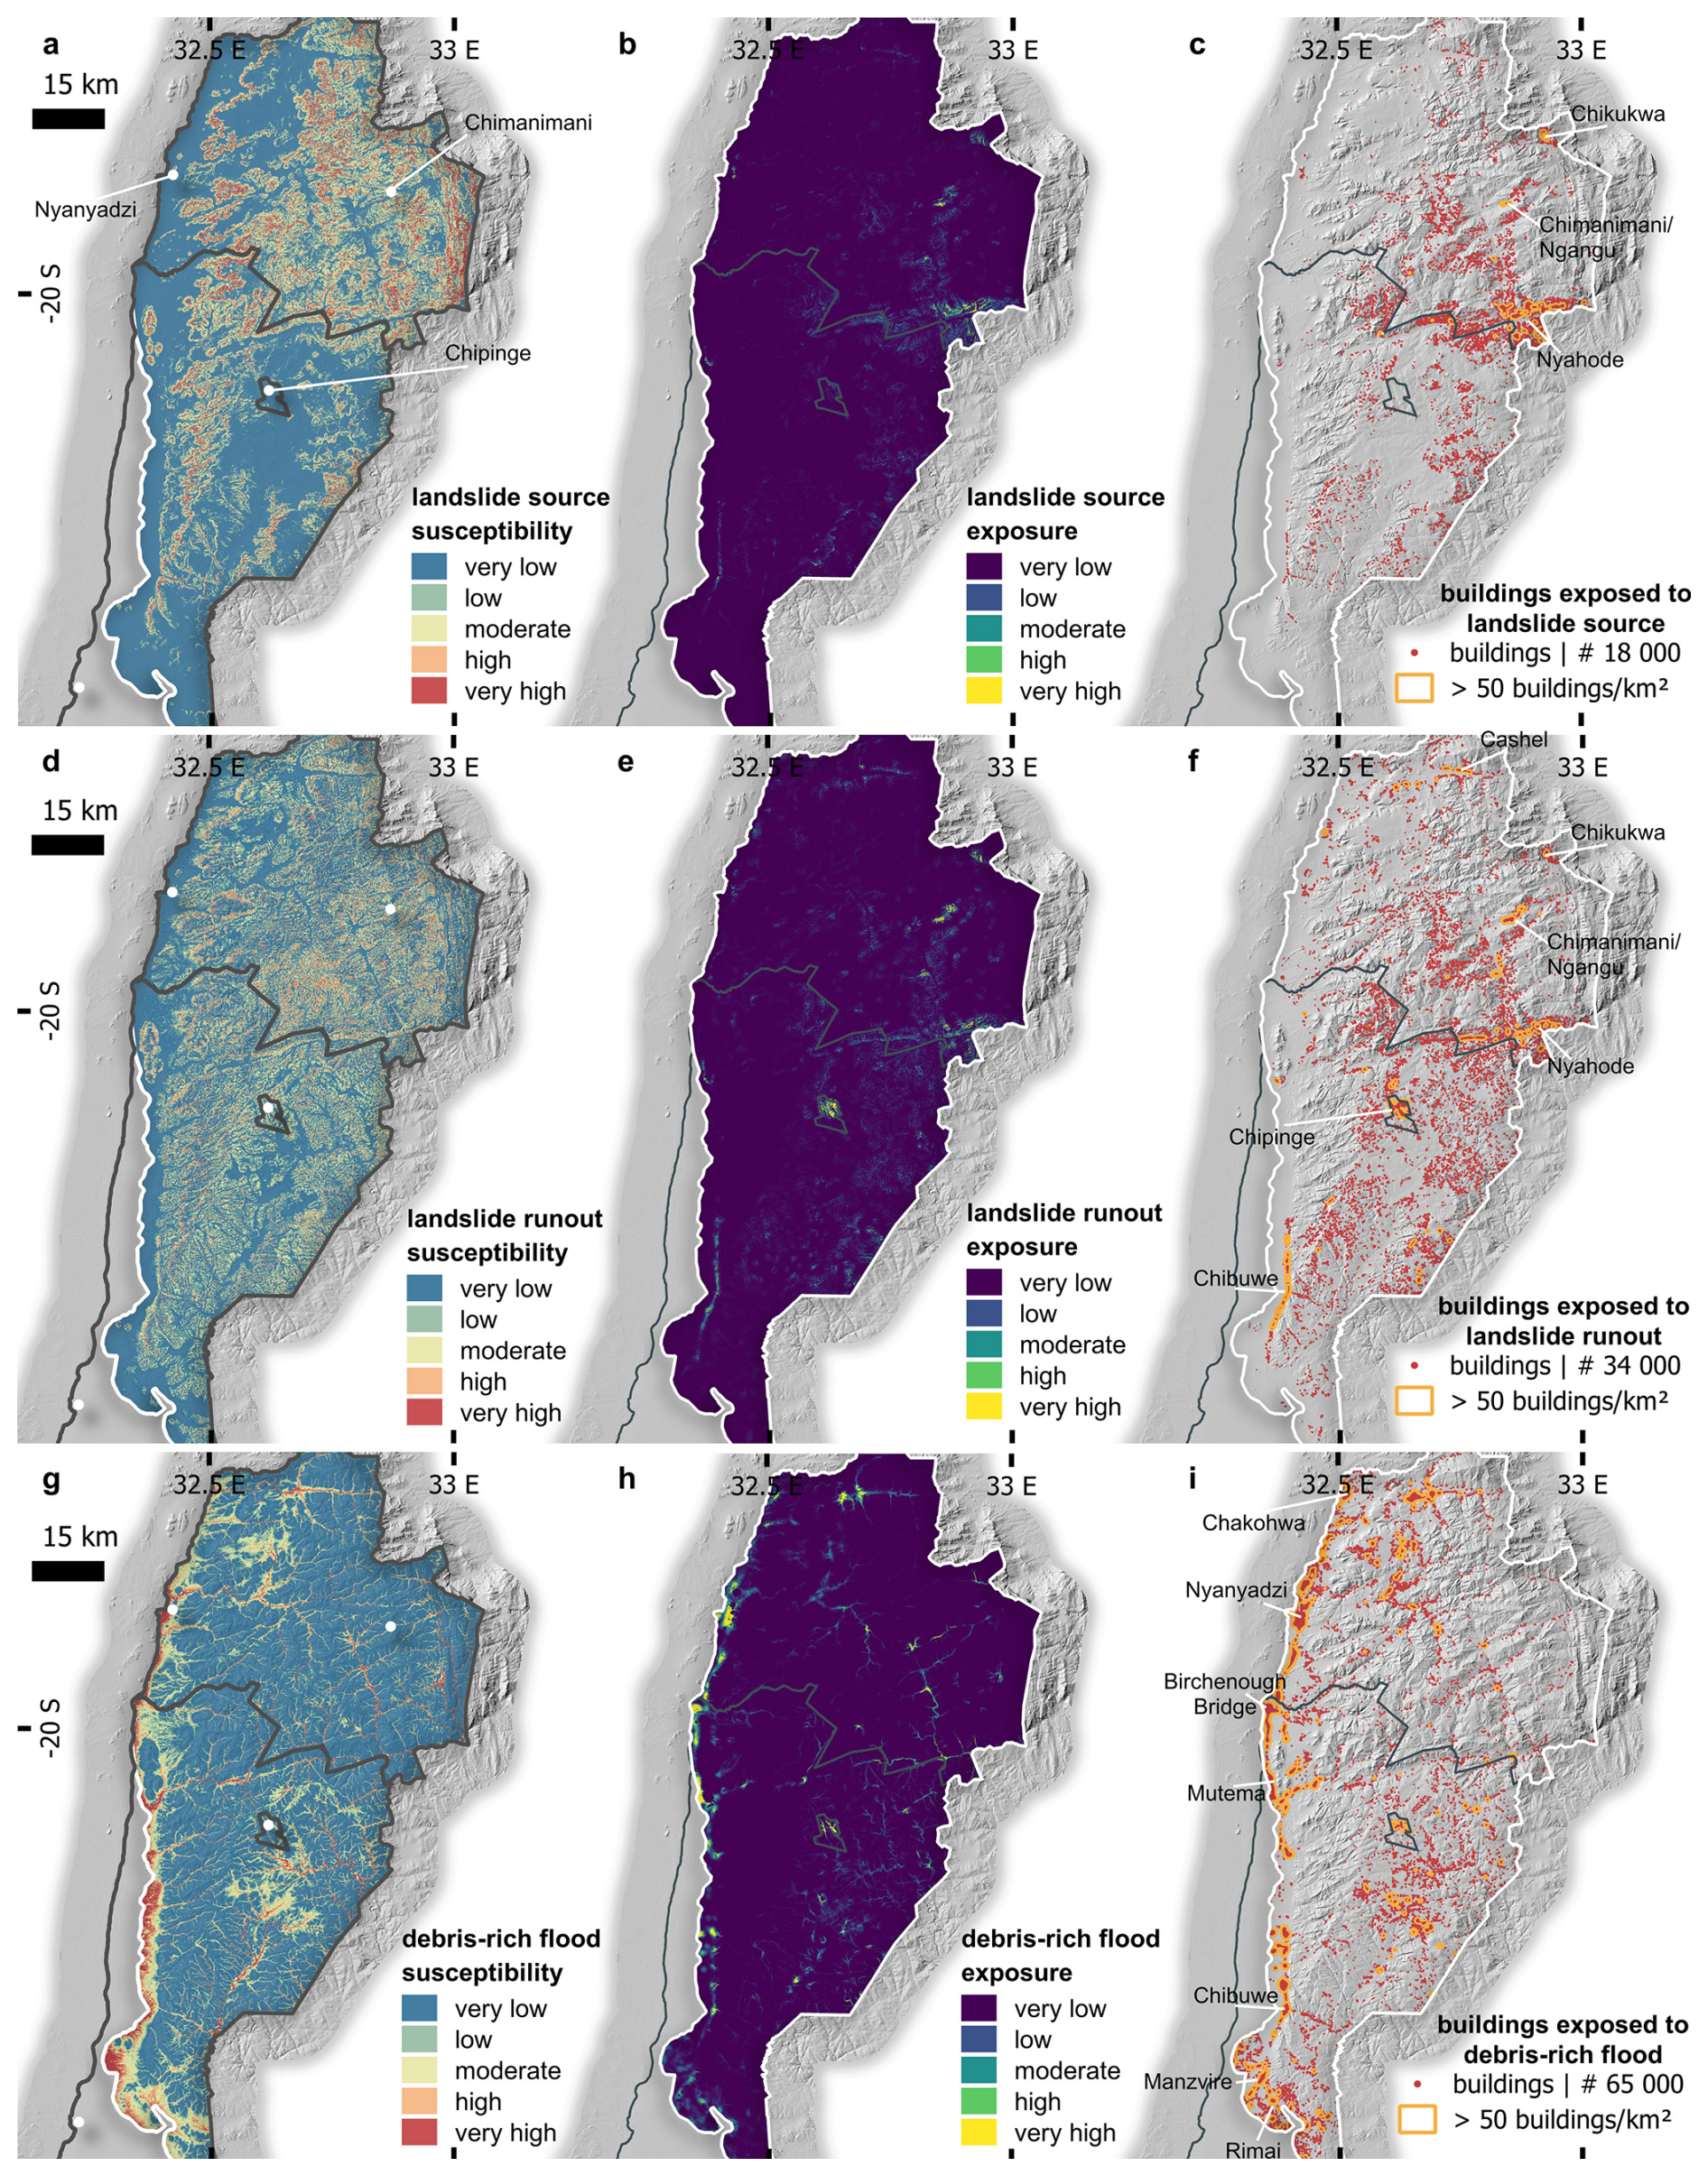
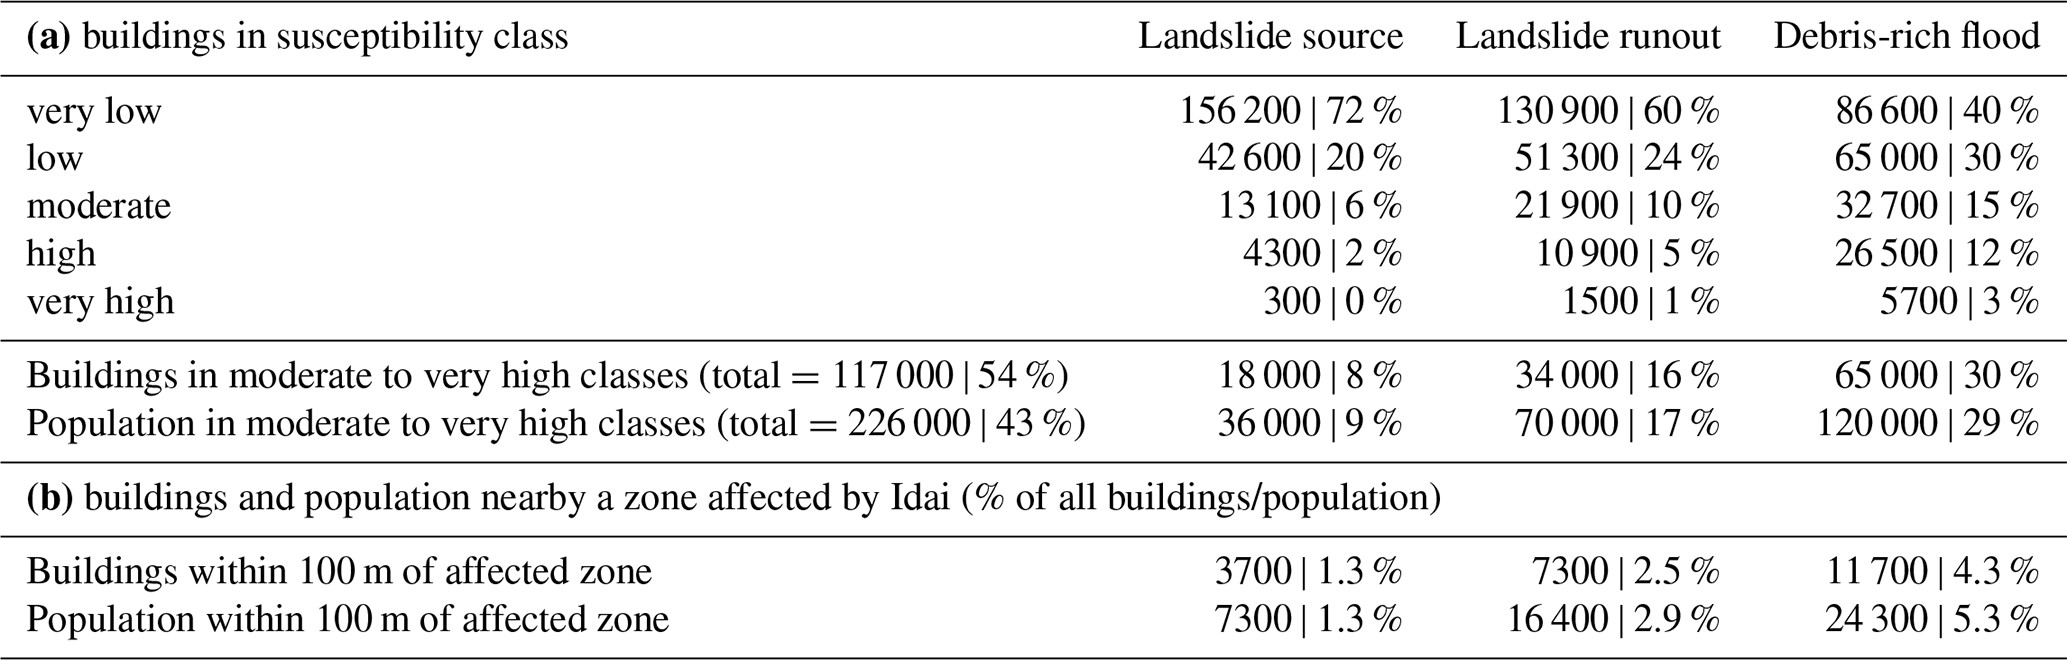
Figure 7Susceptibility and exposure levels. Susceptibility, population and building exposure to (a)–(c). landslide source, (d)–(f). landslide runout, (g)–(i). debris-rich flood. Hotspots of building exposure (> 50 buildings per km2) are circled in orange. # indicates estimates of the number of buildings in moderate to very high exposure zones. Colour scales are comparable across the susceptibility and exposure maps.
Because most people settle in relatively flat areas near streams and floodplains, much more individuals and buildings are exposed to landslide runout and debris-rich flood than to landslide sources (Table 3a). Overall, 29 % of the population (∼ 120 000 people) and 30 % of buildings (∼ 65 000) lie in zones with moderate to very high susceptibility to debris-rich floods, which account for only 11 % of the study area. For landslide runout, the exposed share is lower, with 17 % of the population and 16 % of buildings within susceptible zones covering 9.6 % of the area. Exposure is lowest for landslide source susceptibility, where 9 % of the population and 8 % of buildings are located in zones covering 9.7 % of the study area. Intersecting our detailed polygon inventory (INV_03-AUTO) with the mapped affected areas (Fig. 4a, b) further shows that about 23 000 buildings and 48 000 people – roughly 8 % of all buildings and 8.5 % of the population in Chimanimani and Chipinge districts (Zimbabwe National Statistics Agency, 2022) – are located within 100 meters of affected areas (Table 3b). Exposure of key infrastructures is substantial, with at least 60 % for each type located in moderate or higher susceptibility zones – higher percentage than that of all buildings. Details and breakdowns by infrastructure type are provided in Appendix A.
Table 3Estimating exposure of buildings and population. (a) Distribution of the number of buildings in the different susceptibility classes. The total number of buildings (Google Open Buildings, last updated in 2022; Sirko et al., 2021) and people (Facebook High Resolution Population Density Maps, last updated in 2022; Tiecke et al., 2017) located in moderate to very-high susceptibility areas is also provided. (b) Number of buildings and people in a zone affected by landslide source, runout or debris-rich flood alongside Idai in March 2019.
We mapped 130 km2 (1.5 % of the two districts) as being directly affected by landslides or debris-rich floods, with 14 900 individual landslide initiation points – remarkably high for a single event (e.g., see Emberson et al., 2022). The severity of the impacts triggered by Idai (see Sect. 1.2 and e.g., Chatiza, 2019; Devi, 2019) reflects both the region's high population density and vulnerability, and the cascading chain of processes we described as the landslide–debris-rich flood continuum.
Our estimates suggest that ∼ 226 000 people live in areas of moderate to high susceptibility to landslides and debris-rich floods (Table 3a) – nearly half the district population. These numbers closely match official figures of individuals affected by Idai (192 000–270 000; Chatiza, 2019; IFRC, 2020). Notably, exposure to landslide sources account for less than one-fifth of total exposed people and buildings, while landslide runouts affect about twice as many, and debris-rich floods over three times as many (Table 3). This pattern results from the concentration of settlements along gently sloping, higher-order channels prone to landslide runout and flooding (Mergili et al., 2018, 2019; Milledge et al., 2019; Roback et al., 2018), and underlines a critical point: effective risk reduction demands accounting for the entire landslide–debris-rich flood continuum.
Our work illustrates how large parts of a landscape can have low likelihoods of landslide initiation but can nonetheless be very exposed to landslide-derived material, particularly during rare but extreme events. Yet, most landslide inventories, susceptibility or exposure assessments still focus only on landslide initiation (Emberson et al., 2022; Milledge et al., 2019; Reichenbach et al., 2018), introducing major uncertainties in estimates of landslide frequency, size, and overall hazard and risk (Bhuyan et al., 2025; Emberson et al., 2022; Tanyaş et al., 2017; van Westen et al., 2006). Likewise, highly mobile landslides can deliver substantial sediment loads, amplifying both immediate and delayed flood risk (Bennett et al., 2025; Croissant et al., 2017; Slater et al., 2015). This highlights the need to integrate geomorphological hazards into flood risk evaluation (Brenna et al., 2023; Slater et al., 2015).
The sequence of processes at hillslope level – landslides on steep mountain ridges, runouts in flow accumulation zones directly downslope, and debris-rich floods in low-relief, high topographic wetness areas – nevertheless enables the development of simple yet accurate statistical models using only a few and easy to obtain topographic predictors. Accuracy assessment attests high accuracy in identifying affected areas, classifying process stages, and estimating susceptibility and exposure. Most confusion occurs between landslide source and runout, which is expected since these stages belong to the same process where sediment scouring and deposition may follow one another and for which even manual delineation is complex. Because all three stages share similar spectral signatures but occur at distinct locations along the hillslope, topographic predictors proved decisive. Expectedly (e.g., Milledge et al., 2019; Emberson et al., 2022), slope, local downward relief and topographic wetness index emerged as strong predictors (Table 2), with the last two indicating where landslide-derived sediments tend to accumulate. Weighted flow accumulation was likewise a key predictor of runout, primarily highlighting channels draining susceptible slopes. It is already effective despite the coarse susceptibility model used for weighting, and its performance could likely be improved by incorporating regional or landslide source-specific models. By contrast, neither deforestation nor forest cover had a significant role in predicting sources or runouts (e.g. Maki Mateso et al., 2023), suggesting limited land-cover influence on landslide occurrence; at least in the case of Idai. Similar patterns are reported for other extreme rainfall-triggered (e.g., Marc et al., 2018) or earthquake-triggered landslide events (e.g., Wenchuan; Fan et al., 2018), and major flash floods (Merz et al., 2021), where trigger magnitude and distribution outweigh land-use effects. Finally, while more advanced approaches (e.g., object-based mapping such as ALADIM; Deprez et al., 2022) or physically-based models of landslide runouts (e.g., Mergili et al., 2019; Wallace et al., 2022; Keck et al., 2024) may provide incremental gains, our simple workflow delivers fast, flexible, and transparent results – a crucial advantage for both researchers and decision-makers (Amatya et al., 2023; Dahal and Lombardo, 2023). The design of the model around simple morphological and hydrological variables available globally also favours its replicability in other data-scarce regions.
The cascading chain of hazard triggered by Cyclone Idai is not unique. Yet, as long as risk management strategies continue to focus on isolated hazards rather than their cascading effects, human and natural systems will remain vulnerable to interacting processes (Gill et al., 2020; Sharma et al., 2023) responsible for some of the world's most devastating disasters (Lee et al., 2024; Mergili et al., 2019; Wallace et al., 2022). This may also help explain why disaster risk reduction policies often appear ineffective (Nohrstedt et al., 2021). This challenge is particularly acute in tropical mountain regions, where cascading processes are frequent and rural communities highly vulnerable – especially in underreported areas such as Africa (Arango-Carmona et al., 2025; Dewitte et al., 2021; Sekajugo et al., 2024).
This study provides a strong reminder of the need to move beyond a narrow focus on landslide initiation and to account for the entire landslide–debris-rich flood continuum for effective risk mitigation, particularly in the context of extreme climatic events like Cyclone Idai. Using simple and replicable methods, we mapped over 14 000 landslides and developed susceptibility and exposure models for two districts in eastern Zimbabwe. We estimate that ∼ 226 000 people live in areas of moderate to high susceptibility, closely matching official figures of those affected by Cyclone Idai. Crucially, in the two districts, the main impacts on local communities often occurred far downstream from the landslide initiation areas, with sediment transfer via high-mobility landslides and debris-rich floods significantly amplifying the destructive potential and impact zones.
Our assessment shows that landslide initiation alone accounts for just one-fifth of the total exposure, underscoring the need to consider not only initiation but also subsequent mass movement and flood processes for accurate hazard and exposure assessment. Moreover, since runout and debris-rich flood zones are strongly controlled by flow accumulation and river patterns (weighted by susceptibility), they can be predicted with reasonable precision at the regional scale using limited input data. Overall, our findings demonstrate that integrating the concept of landslide–debris-rich flood continuum into hazard assessments is essential for effective mitigation but also relatively straightforward. We also show that, even in data-poor regions, simple approaches based on open-access tools and datasets can yield valuable, actionable insights.
Beyond the fundamental scientific contribution, this study was designed from the outset with disaster risk management in mind. The resulting landslide hazard and exposure maps developed for this extreme event directly informed practice: by identifying critical educational and health institutions at risk, they enabled a targeted multi-hazard analysis of 15 schools in the region, ultimately producing individual risk profiles and actionable investment criteria (UNESCO Intergovernmental Hydrological Program, 2021). This illustrates how such an approach can translate into concrete risk reduction measures, offering a replicable path for other disaster-prone regions across the Global South.
Analysis of the exposure of key infrastructures (Fig. A2), shows that a minimum of 60 % of all the infrastructure per type are located in zones with moderate or higher susceptibility to landslides and debris-rich floods. Only 14 (out of 188) bridges are located in zones with low susceptibility to landslide runout or debris rich floods. It is 22 (out of 61) for health facilities, 56 (out of 150) for primary schools and 19 (out of 48) for secondary schools for the three processes. It is also noteworthy that in zones of moderate to very high susceptibility, the proportion of key infrastructure at risk, including schools, health facilities, and bridges, is higher than that of all buildings.
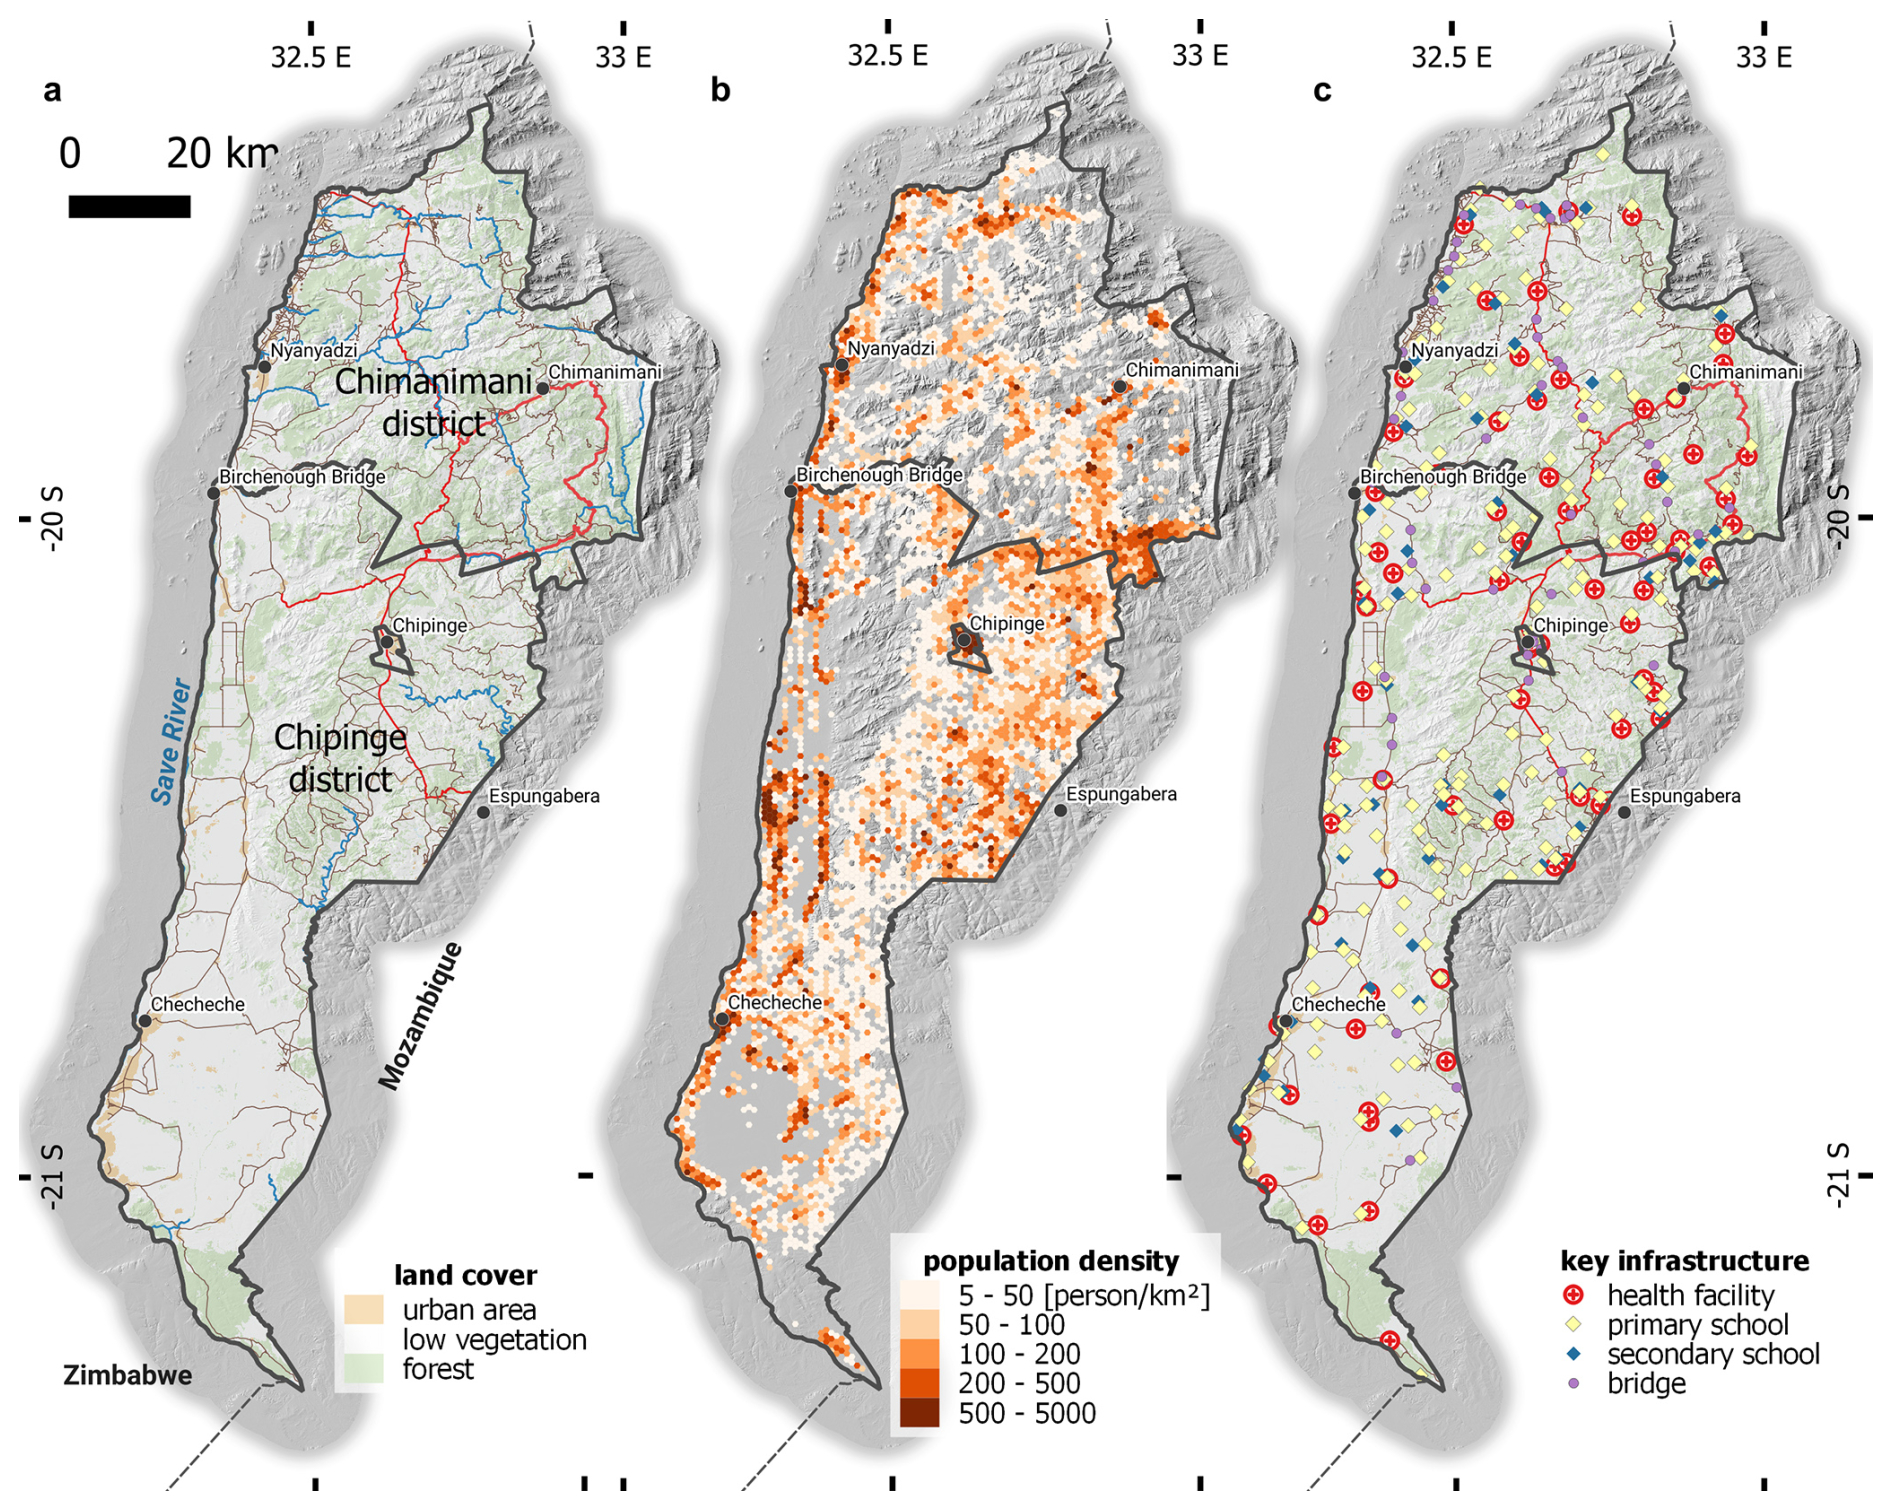
Figure A1Land cover, population density and key infrastructure in Chimanimani and Chipinge districts. These layers were used to calculate the population and infrastructure exposure to landslide and debris-rich flood. Land cover: ©ESA; population: ©Facebook High Resolution Population Density Maps; key infrastructure: ©UNESCO and ©OpenStreetMap contributors 2024. Distributed under the Open Data Commons Open Database License (ODbL) v1.0.
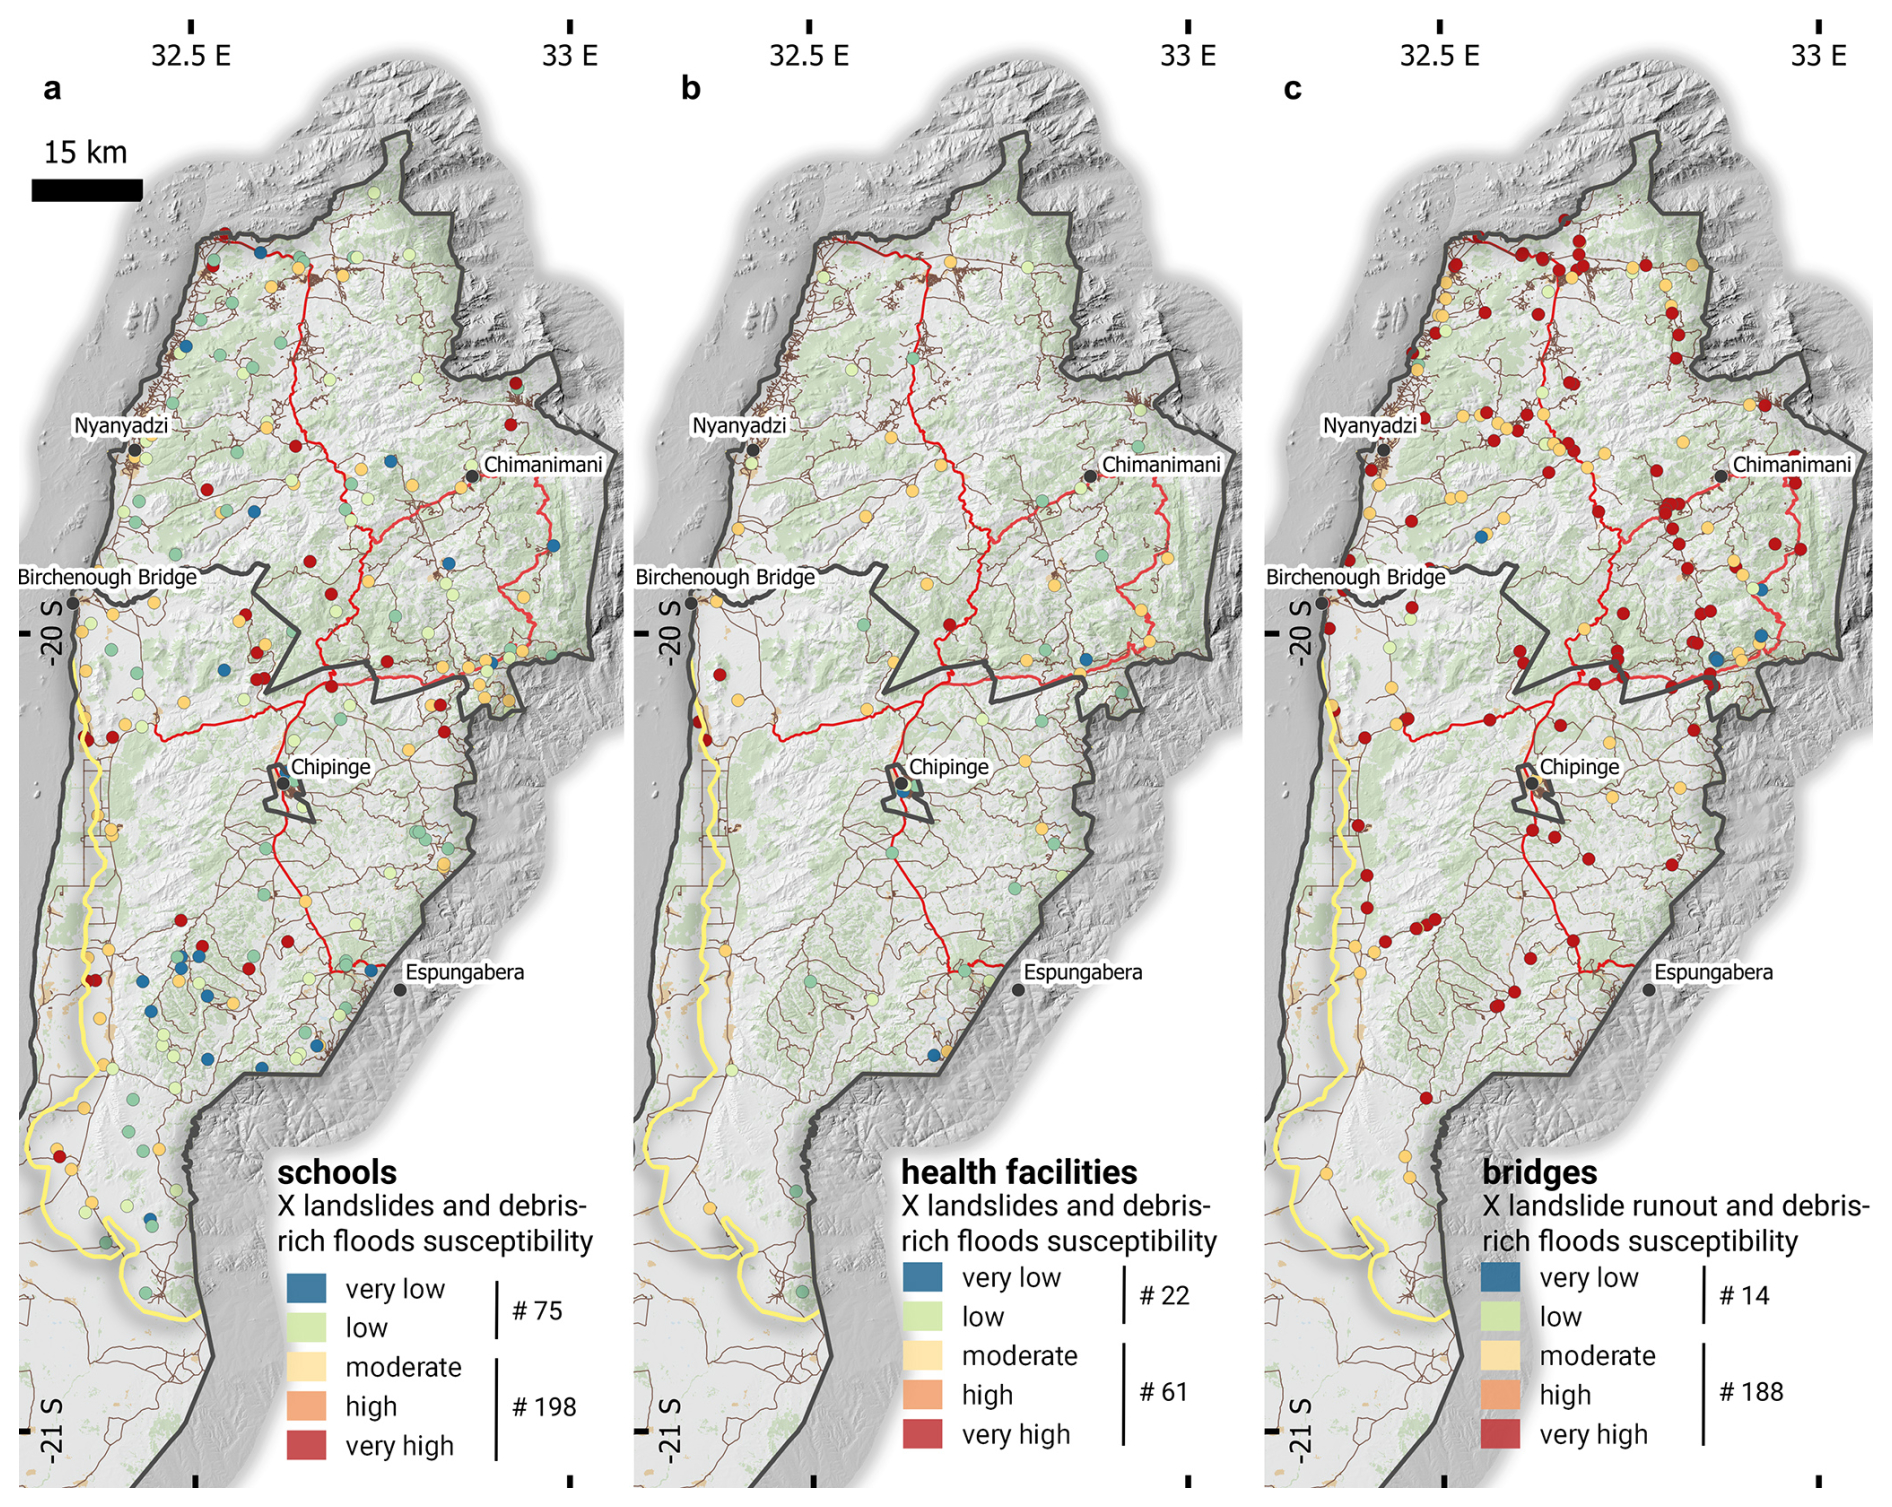
Figure A2Infrastructure exposure. (a) Level of exposure of schools to landslides (source and runout) and debris-rich-floods. (b) Level of exposure of health facilities to landslides (source and runout) and debris-rich-floods. (c) Level of exposure of bridges to landslide runouts and debris-rich-floods. The # numbers indicate how many infrastructures are exposed per susceptibility classes. Bridge data ©OpenStreetMap contributors 2024. Distributed under the Open Data Commons Open Database License (ODbL) v1.0.
The landslide and debris-rich flood inventories, susceptibility and exposure maps, and location of buildings in moderate to high exposure maps are available for download from UNESCO IHP Water Information Network System (https://doi.org/10.63253/nii4g2ac; Royal Museum for Central Africa, 2026). Sentinel data are made available by ESA through e.g. the Copernicus Data Space Ecosystem (https://dataspace.copernicus.eu/, last access: 2 June 2026). All computer codes used in this work are available from the authors upon reasonable request.
A.D., M.V. and O.D. conceived the study; A.D. processed and analysed the data and created the figures. A.D. wrote the manuscript, with main inputs from O.D., M.V., and J.P.; M.V., K.V. and A.S.D. participated in the field campaign. J.B. created the point-based landslide inventory. K.V. coordinated the BE-RESILIENT project. All the authors contributed to the final version of the paper.
At least one of the (co-)authors is a member of the editorial board of Natural Hazards and Earth System Sciences. The peer-review process was guided by an independent editor, and the authors also have no other competing interests to declare.
Publisher's note: Copernicus Publications remains neutral with regard to jurisdictional claims made in the text, published maps, institutional affiliations, or any other geographical representation in this paper. The authors bear the ultimate responsibility for providing appropriate place names. Views expressed in the text are those of the authors and do not necessarily reflect the views of the publisher.
The authors thank the local authorities who facilitated data collection and fieldwork in eastern Zimbabwe.
This work was carried out within the framework of the UNESCO project BE-RESILIENT Zimbabwe, as part of Zimbabwe Idai Recovery Project funded by the World Bank and managed by the UNOPS. We also acknowledge support from BELSPO STEREO-IV LACTOSE project (project no. SR/00/403) and internal funds from the Royal Museum for Central Africa.
This paper was edited by Mihai Niculita and reviewed by two anonymous referees.
Amatya, P., Scheip, C., Déprez, A., Malet, J. P., Slaughter, S. L., Handwerger, A. L., Emberson, R., Kirschbaum, D., Jean-Baptiste, J., Huang, M. H., Clark, M. K., Zekkos, D., Huang, J. R., Pacini, F., and Boissier, E.: Learnings from rapid response efforts to remotely detect landslides triggered by the August 2021 Nippes earthquake and Tropical Storm Grace in Haiti, Nat. Hazards, https://doi.org/10.1007/s11069-023-06096-6, 2023.
Arango-Carmona, M. I., Voit, P., Hürlimann, M., Aristizábal, E., and Korup, O.: Hillslope torrential hazard cascades in tropical mountains, Nat. Hazards Earth Syst. Sci., 25, 3641–3663, https://doi.org/10.5194/nhess-25-3641-2025, 2025.
Bennett, G. L., Panici, D., Rengers, F. K., Kean, J. W., and Rathburn, S. L.: Landslide-channel feedbacks amplify channel widening during floods, npj Nat. Hazards, 2, 7, https://doi.org/10.1038/s44304-025-00059-6, 2025.
Bhuyan, K., Rana, K., Ozturk, U., Nava, L., Rosi, A., Meena, S. R., Fan, X., Floris, M., van Westen, C., and Catani, F.: Towards automatic delineation of landslide source and runout, Eng. Geol., 345, 107866, https://doi.org/10.1016/j.enggeo.2024.107866, 2025.
Brenna, A., Surian, N., Ghinassi, M., and Marchi, L.: Sediment–water flows in mountain streams: Recognition and classification based on field evidence, Geomorphology, 371, https://doi.org/10.1016/j.geomorph.2020.107413, 2020.
Brenna, A., Marchi, L., Borga, M., Zaramella, M., and Surian, N.: What drives major channel widening in mountain rivers during floods? The role of debris floods during a high-magnitude event, Geomorphology, 430, 108650, https://doi.org/10.1016/j.geomorph.2023.108650, 2023.
Brenning, A.: Improved Spatial Analysis and Prediction of Landslide Susceptibility: Practical Recommendations, in: Landslides and Engineered Slopes: Protecting Society Through Improved Understanding, edited by: Eberhardt, E., Froese, C., Turner, K., and Leroueil, S., CRC Press, 789–795, ISBN 0415621232, 2012.
Broeckx, J., Vanmaercke, M., Duchateau, R., and Poesen, J.: A data-based landslide susceptibility map of Africa, Earth-Science Rev., 185, 102–121, https://doi.org/10.1016/j.earscirev.2018.05.002, 2018.
Chanza, N., Siyongwana, P. Q., Williams-Bruinders, L., Gundu-Jakarasi, V., Mudavanhu, C., Sithole, V. B., and Manyani, A.: Closing the Gaps in Disaster Management and Response: Drawing on Local Experiences with Cyclone Idai in Chimanimani, Zimbabwe, Int. J. Disaster Risk Sci., 11, 655–666, https://doi.org/10.1007/s13753-020-00290-x, 2020.
Chatiza, K.: Cyclone Idai in Zimbabwe – An analysis of policy implications for post-disaster institutional development to strengthen disaster risk management, 30 pp., https://doi.org/10.21201/2019.5273, 2019.
Church, M. and Jakob, M.: What Is a Debris Flood?, Water Resour. Res., 56, 1–17, https://doi.org/10.1029/2020WR027144, 2020.
Croissant, T., Lague, D., Steer, P., and Davy, P.: Rapid post-seismic landslide evacuation boosted by dynamic river width, Nat. Geosci., 10, 680–684, https://doi.org/10.1038/ngeo3005, 2017.
Cutter, S. L.: Compound, Cascading, or Complex Disasters: What's in a Name?, Environ. Sci. Policy Sustain. Dev., 60, 16–25, https://doi.org/10.1080/00139157.2018.1517518, 2018.
Dahal, A. and Lombardo, L.: Explainable artificial intelligence in geoscience: a glimpse into the future of landslide susceptibility modeling [Preprint], Comput. Geosci., 176, 105364, https://doi.org/10.1016/j.cageo.2023.105364, 2023.
Das, R. and Wegmann, K. W.: Evaluation of machine learning-based algorithms for landslide detection across satellite sensors for the 2019 Cyclone Idai event, Chimanimani District, Zimbabwe, Landslides, 19, 2965–2981, https://doi.org/10.1007/s10346-022-01912-9, 2022.
De Angeli, S., Malamud, B. D., Rossi, L., Taylor, F. E., Trasforini, E., and Rudari, R.: A multi-hazard framework for spatial-temporal impact analysis, Int. J. Disaster Risk Reduct., 73, 102829, https://doi.org/10.1016/j.ijdrr.2022.102829, 2022.
Depicker, A., Jacobs, L., Mboga, N., Smets, B. B., Van Rompaey, A., Lennert, M., Wolff, E., Kervyn, F. F., Michellier, C., Dewitte, O., Govers, G., Rompaey, A. Van, Lennart, M., Kervyn, F. F., Michellier, C., Dewitte, O., and Govers, G.: Historical dynamics of landslide risk from population and forest-cover changes in the Kivu Rift, Nat. Sustain., 4, 965–974, https://doi.org/10.1038/s41893-021-00757-9, 2021a.
Depicker, A., Govers, G., Jacobs, L., Campforts, B., Uwihirwe, J., and Dewitte, O.: Interactions between deforestation, landscape rejuvenation, and shallow landslides in the North Tanganyika–Kivu rift region, Africa, Earth Surf. Dyn., 9, 445–462, https://doi.org/10.5194/esurf-9-445-2021, 2021b.
Deprez, A., Marc, O., Malet, J.-P., Stumpf, A., and Michéa, D.: ALADIM – A change detection on-line service for landslide detection from EO imagery, in: EGU General Assembly 2022, https://doi.org/10.5194/egusphere-egu22-3536, 2022.
Devi, S.: Cyclone Idai: 1 month later, devastation persists, Lancet, World Rep., 393, 1585, https://doi.org/10.1016/S0140-6736(19)30892-X, 2019.
de Vilder, S., Kelly, S., Buxton, R., Allan, S., and Glassey, P.: Landslide planning guidance reducing landslide risk through land-use planning, GNS Scienc., GNS Science, Lower Hutt, 77 pp., https://doi.org/10.21420/R2X8-FJ49, 2024.
Dewitte, O., Dille, A., Depicker, A., Kubwimana, D., Maki Mateso, J. -C., Mugaruka Bibentyo, T., Uwihirwe, J., and Monsieurs, E.: Constraining landslide timing in a data-scarce context: from recent to very old processes in the tropical environment of the North Tanganyika-Kivu Rift region, Landslides, 18, 161–177, https://doi.org/10.1007/s10346-020-01452-0, 2021.
Dewitte, O., Depicker, A., Moeyersons, J., and Dille, A.: Mass Movements in Tropical Climates, Treatise Geomorphol., 338–349, https://doi.org/10.1016/B978-0-12-818234-5.00118-8, 2022.
Di Napoli, M., Di Martire, D., Bausilio, G., Calcaterra, D., Confuorto, P., Firpo, M., Pepe, G., and Cevasco, A.: Rainfall-induced shallow landslide detachment, transit and runout susceptibility mapping by integrating machine learning techniques and gis-based approaches, Water (Switzerland), 13, 11–14, https://doi.org/10.3390/w13040488, 2021.
Dubey, S., Sattar, A., Goyal, M. K., Allen, S., Frey, H., Haritashya, U. K., and Huggel, C.: Mass Movement Hazard and Exposure in the Himalaya, Earth's Futur., 11, 1–18, https://doi.org/10.1029/2022EF003253, 2023.
Emberson, R., Kirschbaum, D., and Stanley, T.: New Global Characterization of Landslide Exposure, Nat. Hazards Earth Syst. Sci., 30, 1–21, https://doi.org/10.5194/nhess-2019-434, 2020.
Emberson, R., Kirschbaum, D. B., Amatya, P., Tanyas, H., and Marc, O.: Insights from the topographic characteristics of a large global catalog of rainfall-induced landslide event inventories, Nat. Hazards Earth Syst. Sci., 22, 1129–1149, https://doi.org/10.5194/nhess-22-1129-2022, 2022.
Fan, L., Lehmann, P., McArdell, B., and Or, D.: Linking rainfall-induced landslides with debris flows runout patterns towards catchment scale hazard assessment, Geomorphology, 280, 1–15, https://doi.org/10.1016/j.geomorph.2016.10.007, 2017.
Fan, X., Juang, C. H., Wasowski, J., Huang, R., Xu, Q., Scaringi, G., van Westen, C. J., and Havenith, H. B.: What we have learned from the 2008 Wenchuan Earthquake and its aftermath: A decade of research and challenges, Eng. Geol., 241, 25–32, https://doi.org/10.1016/j.enggeo.2018.05.004, 2018.
Gill, J. C. and Malamud, B. D.: Reviewing and visualizing the interactions of natural hazards, Rev. Geophys., 52, 680–722, https://doi.org/10.1002/2013RG000445, 2014.
Gill, J. C., Malamud, B. D., Barillas, E. M., and Guerra Noriega, A.: Construction of regional multi-hazard interaction frameworks, with an application to Guatemala, Nat. Hazards Earth Syst. Sci., 20, 149–180, https://doi.org/10.5194/nhess-20-149-2020, 2020.
Hansen, M. C., Potapov, P. V., Moore, R., Hancher, M., Turubanova, S. A., Tyukavina, A., Thau, D., Stehman, S. V., Goetz, S. J., Loveland, T. R., Kommareddy, A., Egorov, A., Chini, L., Justice, C. O., and Townshend, J. R. G.: High-Resolution Global Maps of 21st-Century Forest Cover Change, Science, 342, 850–853, https://doi.org/10.1126/science.1244693, 2013.
Highland, L. M. and Bobrowsky, P.: The Landslide Handbook – A Guide to Understanding Landslides, Landslides, 129, ISBN 978-141132226-4, 2008.
Hungr, O., Leroueil, S., and Picarelli, L.: The Varnes classification of landslide types, an update, Landslides, 11, 167–194, https://doi.org/10.1007/s10346-013-0436-y, 2014.
IFRC: Zimbabwe: Tropical Cycle Idai – Final Report, International Federation of Red Cross and Red Crescent Societies, 1–13, https://reliefweb.int/report/zimbabwe/zimbabwe-tropical-cyclone-idai-final-report-dref-operation (last access: 2 June 2026), 2020.
Iverson, R. M. and Ouyang, C.: Entrainment of bed material by Earth-surface mass flows: Review and reformulation of depth-integrated theory, Rev. Geophys., 53, 27–58, https://doi.org/10.1002/2013RG000447, 2015.
Iverson, R. M., Reid, M. E., and LaHusen, R. G.: Debris-flow mobilization from landslides, Annu. Rev. Earth Planet. Sci., 25, 85–138, 1997.
Iverson, R. M. M., George, D. L. L., Allstadt, K., Reid, M. E. E., Collins, B. D. D., Vallance, J. W., Schilling, S. P., Godt, J. W. W., Cannon, C. M. M., Magirl, C. S. S., Baum, R. L. L., Coe, J. a. A., Schulz, W. H. H., and Bower, J. B. B.: Landslide mobility and hazards: Implications of the 2014 Oso disaster, Earth Planet. Sci. Lett., 412, 197–208, https://doi.org/10.1016/j.epsl.2014.12.020, 2015.
Jacobs, L., Maes, J., Mertens, K., Sekajugo, J., Thiery, W., van Lipzig, N., Poesen, J., Kervyn, M., and Dewitte, O.: Reconstruction of a flash flood event through a multi-hazard approach: focus on the Rwenzori Mountains, Uganda, Nat. Hazards, 84, 851–876, https://doi.org/10.1007/s11069-016-2458-y, 2016.
Keck, J., Istanbulluoglu, E., Campforts, B., Tucker, G., and Horner-Devine, A.: A landslide runout model for sediment transport, landscape evolution, and hazard assessment applications, Earth Surf. Dynam., 12, 1165–1191, https://doi.org/10.5194/esurf-12-1165-2024, 2024.
Kritikos, T. and Davies, T.: Assessment of rainfall-generated shallow landslide/debris-flow susceptibility and runout using a GIS-based approach: application to western Southern Alps of New Zealand, Landslides, 12, 1051–1075, https://doi.org/10.1007/s10346-014-0533-6, 2015.
Lee, R., White, C. J., Adnan, M. S. G., Douglas, J., Mahecha, M. D., O'Loughlin, F. E., Patelli, E., Ramos, A. M., Roberts, M. J., Martius, O., Tubaldi, E., van den Hurk, B., Ward, P. J., and Zscheischler, J.: Reclassifying historical disasters: From single to multi-hazards, Sci. Total Environ., 912, 169120, https://doi.org/10.1016/j.scitotenv.2023.169120, 2024.
Legros, F.: The mobility of long-runout landslides, Eng. Geol., 63, 301–331, https://doi.org/10.1016/S0013-7952(01)00090-4, 2002.
Lin, Q., Steger, S., Pittore, M., Zhang, Y., Zhang, J., Zhou, L., Wang, L., Wang, Y., and Jiang, T.: Contrasting Population Projections to Induce Divergent Estimates of Landslides Exposure Under Climate Change, Earth's Futur., 11, 1–21, https://doi.org/10.1029/2023EF003741, 2023.
Maki Mateso, J.-C., Bielders, C. L., Monsieurs, E., Depicker, A., Smets, B., Tambala, T., Bagalwa Mateso, L., and Dewitte, O.: Characteristics and causes of natural and human-induced landslides in a tropical mountainous region: the rift flank west of Lake Kivu (Democratic Republic of the Congo), Nat. Hazards Earth Syst. Sci., 23, 643–666, https://doi.org/10.5194/nhess-23-643-2023, 2023.
Marc, O. and Hovius, N.: Amalgamation in landslide maps: effects and automatic detection, Nat. Hazards Earth Syst. Sci., 15, 723–733, https://doi.org/10.5194/nhess-15-723-2015, 2015.
Marc, O., Stumpf, A., Malet, J.-P., Gosset, M., Uchida, T., and Chiang, S.-H.: Initial insights from a global database of rainfall-induced landslide inventories: the weak influence of slope and strong influence of total storm rainfall, Earth Surf. Dynam., 6, 903–922, https://doi.org/10.5194/esurf-6-903-2018, 2018.
McGuire, L. A., Ebel, B. A., Rengers, F. K., Vieira, D. C. S., and Nyman, P.: Fire effects on geomorphic processes, Nat. Rev. Earth Environ., 41–79, https://doi.org/10.1038/s43017-024-00557-7, 2024.
Melo, R., Zêzere, J. L., Rocha, J., and Oliveira, S. C.: Combining data-driven models to assess susceptibility of shallow slides failure and run-out, Landslides, 16, 2259–2276, https://doi.org/10.1007/s10346-019-01235-2, 2019.
Merghadi, A., Yunus, A. P., Dou, J., Whiteley, J., ThaiPham, B., Bui, D. T., Avtar, R., and Abderrahmane, B.: Machine learning methods for landslide susceptibility studies: A comparative overview of algorithm performance, Earth-Science Rev., 207, 103225, https://doi.org/10.1016/j.earscirev.2020.103225, 2020.
Mergili, M., Emmer, A., Juřicová, A., Cochachin, A., Fischer, J. T., Huggel, C., and Pudasaini, S. P.: How well can we simulate complex hydro-geomorphic process chains? The 2012 multi-lake outburst flood in the Santa Cruz Valley (Cordillera Blanca, Perú), Earth Surf. Process. Landforms, 43, 1373–1389, https://doi.org/10.1002/esp.4318, 2018.
Mergili, M., Schwarz, L., and Kociu, A.: Combining release and runout in statistical landslide susceptibility modeling, Landslides, 16, 2151–2165, https://doi.org/10.1007/s10346-019-01222-7, 2019.
Merz, B., Blöschl, G., Vorogushyn, S., Dottori, F., Aerts, J. C. J. H., Bates, P., Bertola, M., Kemter, M., Kreibich, H., Lall, U., and Macdonald, E.: Causes, impacts and patterns of disastrous river floods, Nat. Rev. Earth Environ., 2, 592–609, https://doi.org/10.1038/s43017-021-00195-3, 2021.
Milledge, D. G., Densmore, A. L., Bellugi, D., Rosser, N. J., Watt, J., Li, G., and Oven, K. J.: Simple rules to minimise exposure to coseismic landslide hazard, Nat. Hazards Earth Syst. Sci., 19, 837–856, https://doi.org/10.5194/nhess-19-837-2019, 2019.
Nohrstedt, D., Mazzoleni, M., Parker, C. F., and Di Baldassarre, G.: Exposure to natural hazard events unassociated with policy change for improved disaster risk reduction, Nat. Commun., 12, https://doi.org/10.1038/s41467-020-20435-2, 2021.
Pedregosa, F., Varoquaux, G., Gramfort, A., Michel, V., Thirion, B., Grisel, O., Blondel, M., Prettenhofer, P., Weiss, R., Dubourg, V., and Vanderplas, J.: Scikit-learn: Machine Learning in Python, J. Mach. Learn. Res., 1, 2815–2830, 2011.
Pudasaini, S. P. and Krautblatter, M.: The mechanics of landslide mobility with erosion, Nat. Commun., 12, https://doi.org/10.1038/s41467-021-26959-5, 2021.
Reichenbach, P., Rossi, M., Malamud, B. D., Mihir, M., and Guzzetti, F.: A review of statistically-based landslide susceptibility models, Earth-Science Rev., 180, 60–91, https://doi.org/10.1016/j.earscirev.2018.03.001, 2018.
Roback, K., Clark, M. K., West, A. J., Zekkos, D., Li, G., Gallen, S. F., Chamlagain, D., and Godt, J. W.: The size, distribution, and mobility of landslides caused by the 2015 Mw7.8 Gorkha earthquake, Nepal, Geomorphology, 301, 121–138, https://doi.org/10.1016/j.geomorph.2017.01.030, 2018.
Royal Museum for Central Africa: Landslide Susceptibility and Exposure Assesment – Chimanimani and Chipinge districts, Zimbabwe, UNESCO [data set], https://doi.org/10.63253/nii4g2ac, 2026.
Scheip, C. M. and Wegmann, K. W.: HazMapper: a global open-source natural hazard mapping application in Google Earth Engine, Nat. Hazards Earth Syst. Sci., 21, 1495–1511, https://doi.org/10.5194/nhess-21-1495-2021, 2021.
Sekajugo, J., Kagoro-Rugunda, G., Mutyebere, R., Kabaseke, C., Mubiru, D., Kanyiginya, V., Vranken, L., Jacobs, L., Dewitte, O., and Kervyn, M.: Exposure and physical vulnerability to geo-hydrological hazards in rural environments: A field-based assessment in East Africa, Int. J. Disaster Risk Reduct., 102, 104282, https://doi.org/10.1016/j.ijdrr.2024.104282, 2024.
Sharma, S., Talchabhadel, R., Nepal, S., Ghimire, G. R., Rakhal, B., Panthi, J., Adhikari, B. R., Pradhanang, S. M., Maskey, S., and Kumar, S.: Increasing risk of cascading hazards in the central Himalayas, Nat. Hazards, 119, 1117–1126, https://doi.org/10.1007/s11069-022-05462-0, 2023.
Sirko, W., Kashubin, S., Ritter, M., Annkah, A., Bouchareb, Y. S. E., Dauphin, Y., Keysers, D., Neumann, M., Cisse, M., and Quinn, J.: Continental-Scale Building Detection from High Resolution Satellite Imagery, 1–15, https://doi.org/10.48550/arXiv.2107.12283, 2021.
Slater, L. J., Singer, M. B., and Kirchner, J. W.: Hydrologic versus geomorphic drivers of trends in flood hazard, Geophys. Res. Lett., 42, 370–376, https://doi.org/10.1002/2014GL062482, 2015.
Stanley, T. and Kirschbaum, D. B.: A heuristic approach to global landslide susceptibility mapping, Nat. Hazards, 87, 145–164, https://doi.org/10.1007/s11069-017-2757-y, 2017.
Tanyaş, H., van Westen, C. J., Allstadt, K. E., Anna Nowicki Jessee, M., Görüm, T., Jibson, R. W., Godt, J. W., Sato, H. P., Schmitt, R. G., Marc, O., and Hovius, N.: Presentation and Analysis of a Worldwide Database of Earthquake-Induced Landslide Inventories, J. Geophys. Res. Earth Surf., 122, 1991–2015, https://doi.org/10.1002/2017JF004236, 2017.
Tiecke, T. G., Liu, X., Zhang, A., Gros, A., Li, N., Yetman, G., Kilic, T., Murray, S., Blankespoor, B., Prydz, E. B., and Dang, H.-A. H.: Mapping the World Population One Building at a Time. World Bank, https://doi.org/10.1596/33700, 2017.
Tilloy, A., Malamud, B. D., Winter, H., and Joly-Laugel, A.: A review of quantification methodologies for multi-hazard interrelationships, Earth-Science Rev., 196, 102881, https://doi.org/10.1016/j.earscirev.2019.102881, 2019.
UNESCO Intergovernmental Hydrological Program: Comprehensive resilience building in the Chimanimani and Chipinge Districts, Paris, France, https://ihp-wins.unesco.org/dataset/comprehensive-resilience-building-in-the-chimanimani (last access: 2 June 2026), 2021.
van den Bout, B., Tang, C., van Westen, C., and Jetten, V.: Physically based modeling of co-seismic landslide, debris flow, and flood cascade, Nat. Hazards Earth Syst. Sci., 22, 3183–3209, https://doi.org/10.5194/nhess-22-3183-2022, 2022.
Vanmaercke, M., Chen, Y., Haregeweyn, N., De Geeter, S., Campforts, B., Heyndrickx, W., Tsunekawa, A., and Poesen, J.: Predicting gully densities at sub-continental scales: a case study for the Horn of Africa, Earth Surf. Process. Landforms, 45, 3763–3779, https://doi.org/10.1002/esp.4999, 2020.
van Westen, C. J., Van Asch, T. W. J. J., and Soeters, R.: Landslide hazard and risk zonation – why is it still so difficult?, Bull. Eng. Geol. Environ., 65, 167–184, https://doi.org/10.1007/s10064-005-0023-0, 2006.
Wallace, C. S., Santi, P. M., and Walton, G.: Scoring system to predict landslide runout in the Pacific Northwest, USA, Landslides, 19, 1449–1461, https://doi.org/10.1007/s10346-021-01839-7, 2022.
Weiss, A.: Topographic position and landforms analysis, ESRI User Conference, 227–245, https://env761.github.io/assets/files/tpi-poster-tnc_18x22.pdf (last access: last access: 2 June 2026), 2000.
Wohl, E., Brierley, G., Cadol, D., Coulthard, T. J., Covino, T., Fryirs, K. A., Grant, G., Hilton, R. G., Lane, S. N., Magilligan, F. J., Meitzen, K. M., Passalacqua, P., Poeppl, R. E., Rathburn, S. L., and Sklar, L. S.: Connectivity as an emergent property of geomorphic systems, Earth Surf. Process. Landforms, 44, 4–26, https://doi.org/10.1002/esp.4434, 2019.
Yanites, B. J., Clark, M. K., Roering, J. J., West, A. J., Zekkos, D., Baldwin, J. W., Cerovski-Darriau, C., Gallen, S. F., Horton, D. E., Kirby, E., Leshchinsky, B. A., Mason, H. B., Moon, S., Barnhart, K. R., Booth, A., Czuba, J. A., McCoy, S., McGuire, L., Pfeiffer, A., and Pierce, J.: Cascading land surface hazards as a nexus in the Earth system, Science, 388, https://doi.org/10.1126/science.adp9559, 2025.
Zêzere, J. L., Pereira, S., Melo, R., Oliveira, S. C., and Garcia, R. A. C.: Mapping landslide susceptibility using data-driven methods, Sci. Total Environ., 589, 250–267, https://doi.org/10.1016/j.scitotenv.2017.02.188, 2017.
Zhou, W., Qiu, H., Wang, L., Pei, Y., Tang, B., Ma, S., Yang, D., and Cao, M.: Combining rainfall-induced shallow landslides and subsequent debris flows for hazard chain prediction, Catena, 213, 106199, https://doi.org/10.1016/j.catena.2022.106199, 2022.
Zimbabwe National Statistics Agency: Population and housing census 2022, 163 pp., http://www.zimstat.co.zw/wp-content/uploads/Census/Zimbabwe_2022_PHC_Gender_thematic_FINAL_DRAFT_Jan_25.pdf (last access: 2 June 2026), 2022.