the Creative Commons Attribution 4.0 License.
the Creative Commons Attribution 4.0 License.
 | 01 Jun 2026
A single framework for assessing flash flood and landslide susceptibility: an application to the Mediterranean Liguria region, Italy
Alessia Riveros
Chamidu Gunaratne
Mario Martinelli
Frederiek Christianne Sperna Weiland
Flash floods and landslides have caused severe economic damages and loss of life, especially in mountainous regions. To support effective risk management there is a growing interest in multi-hazard assessment. In this study a globally applicable Machine Learning (ML) Framework for landslide and flash flood susceptibility mapping was applied and evaluated in the Italian region Liguria that is frequently and severely impacted by both hazards. A relatively dense inventory of past events was constructed to facilitate the training of the ML Framework. The analysis revealed substantial similarities in the causative factors for the two hazards. There is a considerable area of Liguria susceptible to both hazards, although flash floods most often occur in river valleys whereas landslide susceptibility is also high in the upper courses of river catchments. We found a very high susceptibility along the coastline where many villages and cities are located. The unified framework allows for the integration of different hazard types under a consistent modelling structure. This enhances the comparability of results and supports the development of integrated mitigation strategies for any region of interest.
- Article
(14532 KB) - Full-text XML
- BibTeX
- EndNote


Both flash floods and landslides have in the past led to severe economic damages and loss of life, especially in mountainous regions (Anon, 2024; Fedato et al., 2023; Gaume et al., 2009; Wood et al., 2016). There are indications that climate change, and the related changes in extreme rainfall events, will cause an increase in their intensity and frequency of occurrence (Terzi et al., 2019; Wood et al., 2016; Zander et al., 2022). Changes in socio-economic conditions, such as deforestation, land-use changes and occupation of flood prone areas, will likely contribute to further increases in economic loss (Hurtado-Pidal et al., 2022; Llasat, 2021; Muñoz-Torrero Manchado et al., 2022).
Landslides and flash floods share similar (pre-)conditions of occurrence, i.e. steep mountainous terrain, deforested and highly erodible slopes, low permeability, saturated soils and extreme rainfall as triggering factor (Borga et al., 2014; Terranova and Gariano, 2014). It is widely recognised that the impacts of multi-hazard events can surmount those of multiple single hazards (Gill and Malamud, 2014; Hochrainer-Stigler et al., 2023; UN, 2016; Zscheischler et al., 2018). As a consequence, there is a growing focus on multi-hazards within risk assessment to support improved risk management and adaptation planning (Adnan et al., 2025; Hochrainer-Stigler et al., 2023; Schlumberger et al., 2022).
A crucial step towards multi-hazard risk assessment is susceptibility mapping. Susceptibility maps help to identify regions that are more likely to face a given hazard and provide important input for disaster risk management and adaptation planning. The susceptibility presents the likelihood of the occurrence of an event in an area based on the local terrain conditions (Tiggeloven et al., 2025; Wilde et al., 2018). Susceptibility maps are typically generated with statistical methods or Machine Learning (ML) algorithms trained on a set of past events (Alarifi et al., 2022; Bui et al., 2019; Chowdhury, 2024; Elghouat et al., 2024; He et al., 2025; Khodaei et al., 2025; Luu et al., 2023; Pham et al., 2021; Shahabi et al., 2021; Wahba et al., 2024).
Our starting point is Tehrani et al. (2021) which originally developed a landslide detection ML model, and subsequently adapted it to a landslide susceptibility mapping framework. The latter has been extended in this study with (i) the inventory construction, (ii) the systematic inclusion of input layers relevant to flash floods and landslides, (iii) the assessment of multicollinearity between the layers, and (iv) the study of behaviour similarity between both hazards resulting in a unified susceptibility framework.
We applied the unified susceptibility framework to a region with contrasting geomorphological and climatic conditions, focussing on static conditioning factors. The sensitivity of the two hazards towards a similar set of driving factors is evaluated and the differences in resulting landslide versus flash flood susceptibility maps is analysed. Liguria, located in north-western Italy, provides an ideal case study due to its high susceptibility to both flash floods and landslides (Cassola et al., 2016; Cignetti et al., 2019; Faccini et al., 2015; Orefice and Innocenti, 2025), driven by steep terrain, short hydrological response times, and frequent high-intensity rainfall.
Although the framework is developed around global datasets, it requires local inventories of past hazard events to train the underlying machine learning algorithm. Due to the limited spatial and temporal extent and the relative remoteness of occurrence of both hazards such inventories are often incomplete or limited and thus influence the quality of the resulting susceptibility maps (Modrick and Georgakakos, 2015). For the relatively data rich region of Liguria we have access to three open archives of past landslide and flash flood events.
With this study, we specifically aimed to (1) evaluate the similarity in the causative factors for flash floods and landslides, (2) apply a susceptibility mapping algorithm consistently to both hazards, and (3) assess the accuracy of the resulting susceptibility maps.
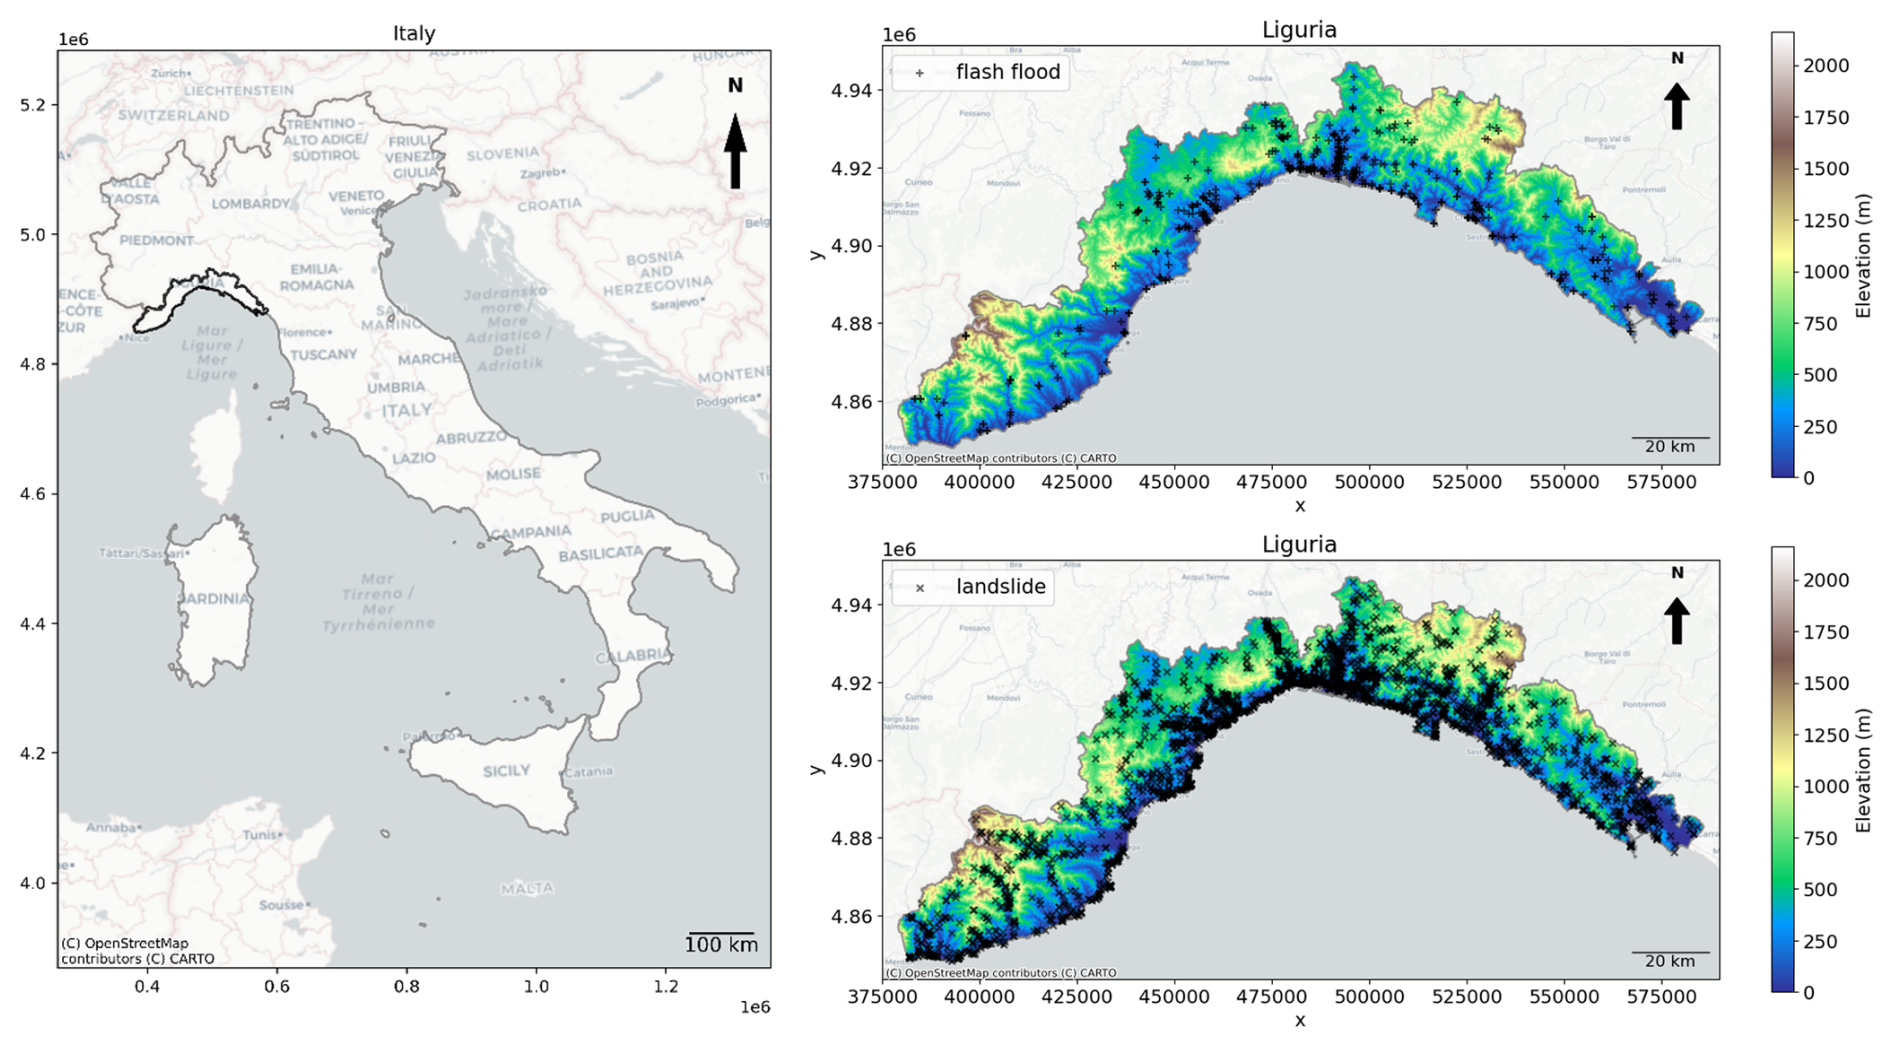
Figure 1Map showing the location of the Liguria region in Italy (left). Top-right (bottom-right) shows the overview of past flash flood (landslides) events in Liguria. Map source: © OpenStreetMap contributors.
Liguria is a region located in the Northwest of Italy (see Fig. 1) covering an area of 5410 km2. It is bordered by the Ligurian Sea to the South, by the Maritime Alps to the Northwest, and by the Apennines to the Northeast. Characterized by a Mediterranean climate, summers in Liguria are driest whereas falls are wettest. Fall exhibits a positive trend in terms of cumulative precipitation from the period of 1981–2010 with respect to 1961–1990 (Agrillo and Bonati, 2013). Annual precipitation varies from less than 600 mm with 50 rainy days per year on the west coast to more than 2000 mm and around 100 rainy days per year in the Apennines (Agrillo and Bonati, 2013). In a more recent study (Mazzoglio et al., 2025), the authors found that during 1916–2022, the 1 and 24 h maxima rainfall exhibit positive trends over Liguria, and the trend is exacerbated for the 99th quantile.
Due to Liguria's geographical location, it is characterized by steep slopes and mountainous terrain reaching a maximum of 2201 m a.s.l. The lithology is constituted mainly by claystones and clays (55 %) which has a tendency to split into thin, flat layers with low porosity, and by schist, phyllites, quartzites and marbles (14 %). The dominant land covers are closed forest (76 %) followed by cropland (14 %).
Liguria is characterized by small and medium size catchments ranging from 10 to 1000 km2 (Silvestro et al., 2018) and steep slopes resulting in high runoff ratios ranging approximately from 0.5 on the West to 0.75 on the East (Silvestro et al., 2018).
From 2013 to 2022, Liguria reported needing over 6.5 trillion euros (Gatto et al., 2023) to deal with hydrogeological disasters only for those events severe enough to trigger national level emergency.
3.1 Data
3.1.1 Flash Flood and Landslide Inventories
Flash Floods
In this study we define flash floods as high intensity short duration floods caused by storm durations of up to 48 h following the definition of Amponsah et al. (2018) on flash floods in Mediterranean regions. Other Mediterranean flash floods are defined as a short duration of less than 1 to 24 h (Gaume et al., 2009) but given the uncertainty in the inventory, it was deemed too restrictive. Only flash floods caused by hydrometeorological conditions or landslides are considered, those caused by infrastructure failure (e.g., dam breaches) are excluded. Historical flash floods have been retrieved from two sources: (1) the AVI (Gruppo Nazionale per la Difesa dalle Catastrofi Idrogeologiche, 1994), a database developed by the National Group for the Prevention of Hydrogeologic Hazards of the Italian National Research Council (CNR) which includes the ID, event type, date, river name, notes, hydrological data, cause and coordinates of floods recorded throughout Italy from 1951–1994 and is comprised of 244 flash floods points after processing.
In case of duplicate flash flood entries, where records shared the same point geometry and date but had different river names, one entry was retained unchanged and an additional point was added with updated coordinates located on the nearest point on the corresponding river, using river and stream data from Open Street Map (Open Street Map contributors, 2025). (2) ARPAL (Agenzia regionale per la protezione dell'ambiente ligure, 2024) provides a collection of PDF reports of significant meteorological and hydrological events by date in Liguria including point rainfall information, effects on the ground, and relevant damages from 2009 to 2024 leading to 282 flash flood points after processing.
We used a Large Language Model (LLM) – GPT-4O via the Azure OpenAI Service (Microsoft, 2025) to process ARPAL event reports summarizing past geohydrological hazards in the Liguria region, automatically extracting event information and generating structured outputs based on our predefined database schema. For the automated extraction of flash floods we framed the search corresponding to floods, as the exact term `flash flood' is never used in the reports. From these PDF documents, specific event details - including point rainfall amount, duration, flood type and coordinates – could automatically be extracted. Subsequently, we verified that each description corresponded to flash flood and removed the ones that did not.
The resulting flash flood events are displayed in Fig. 1 (top-right).
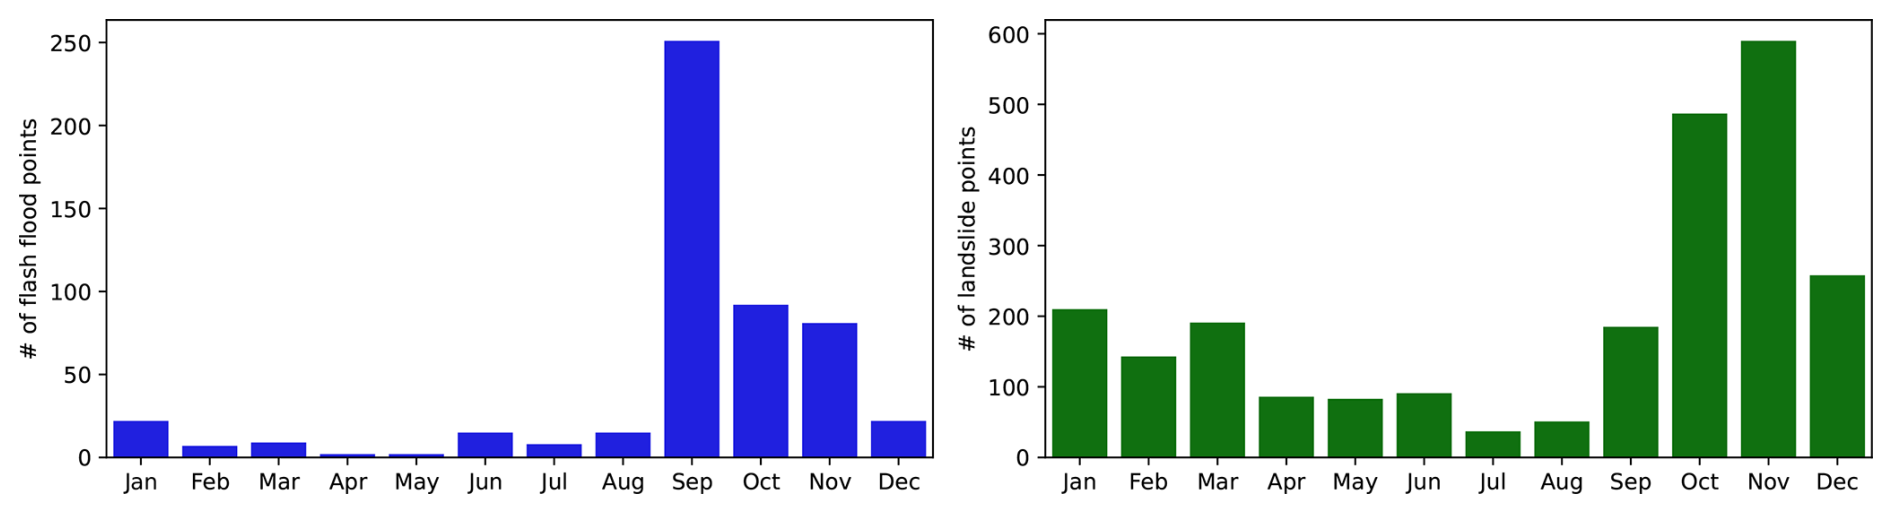
Figure 2Number of flash flood (left) from 1951–2024 and landslide (right) from 1940–2024 events in the created inventory sorted by calendar month.
Landslides
In this study only rainfall induced landslides are considered. Similarly to flash floods we used the (i) AVI database which included 620 landslides events along with their coordinates, id, cause, notes and date, and the (ii) ARPAL reports resulting in 93 landslide events. Both provide events at daily resolution. Additionally, we used the ITALICA (Italian rainfall-induced LandslIdes Catalogue) (Peruccacci et al., 2023) inventory with landslide id, coordinates and dates covering the period from 2002 to 2021. It comprises 1699 landslide events in Liguria, documented at hourly temporal resolution. As the landscape has altered over time due to human influences we decided to only include events reported after 1940. The resulting landslide events are displayed in Fig. 1 (bottom-right).
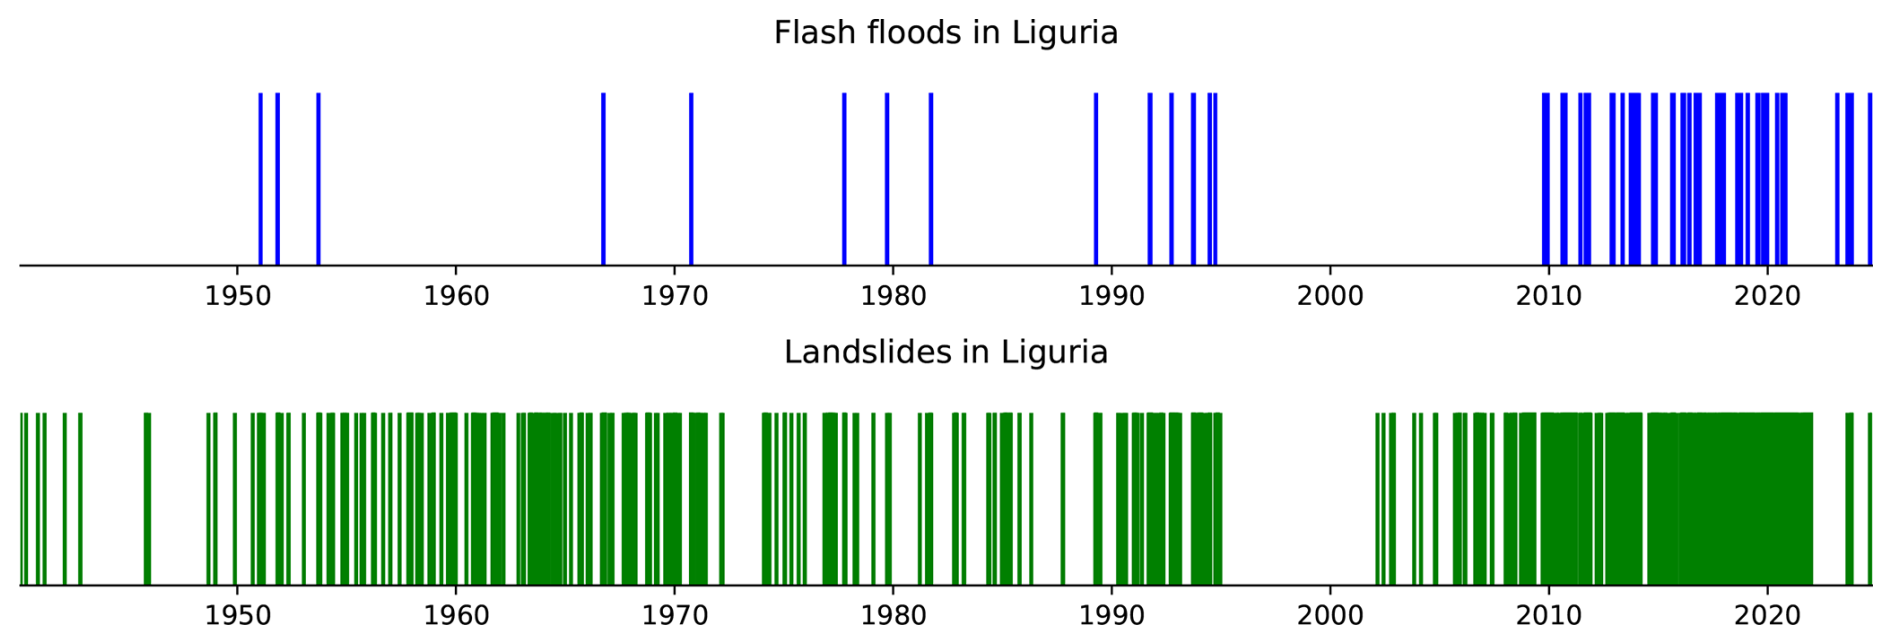
Figure 2 displays the distribution of flash flood (left) and landslide events (right) over the calendar months. For both hazards most events occurred in fall (September, October, November). Flash flood occurrence is highest in September, most likely because soils are dry and do not infiltrate well after a long dry summer season. Landslides are more spread out throughout the year. Figure 3 show the distribution of flash floods and landslides over the full inventory period (1940–2024).
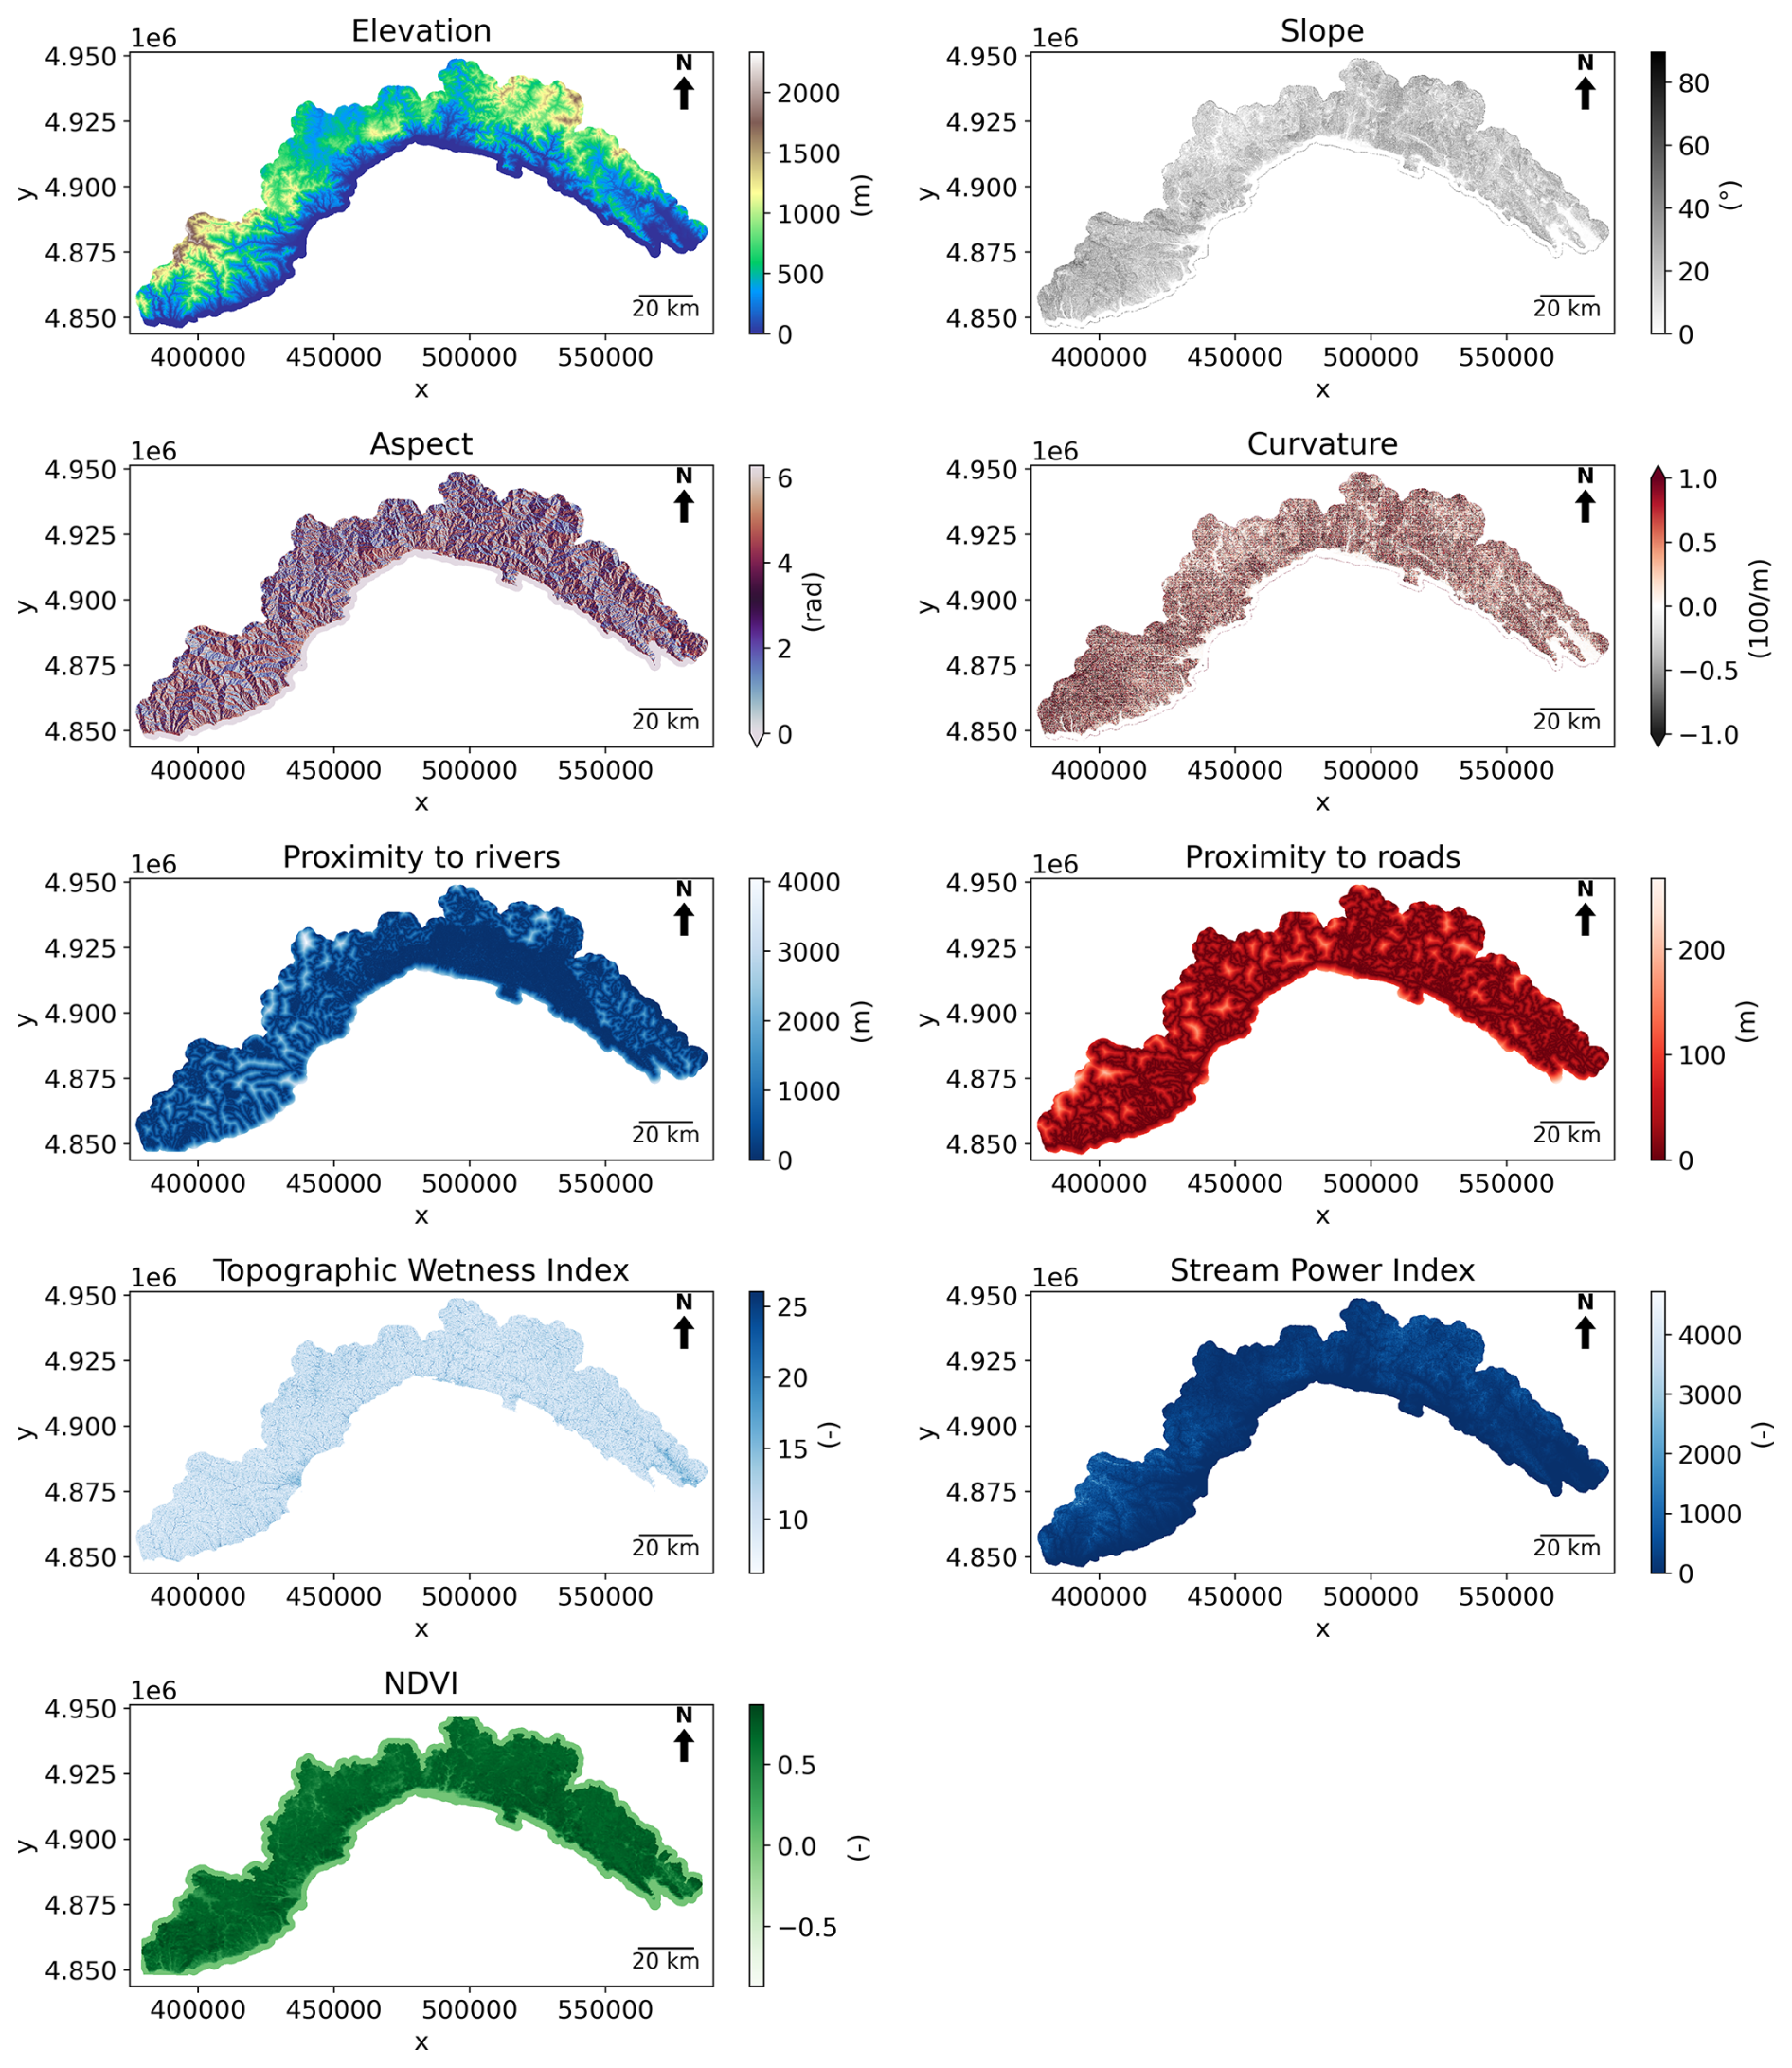
Figure 4Overview of landslide and flash flood numerical causative factor maps used as input for the ML algorithms.
3.2 Causative factors for flash floods and landslides
Based on a literature review, an initial set of landslides and flash flood causative factors was identified (Alarifi et al., 2022; Bui et al., 2019; Chowdhury, 2024; Elghouat et al., 2024; He et al., 2025; Khodaei et al., 2025; Luu et al., 2023; Pham et al., 2021; Rayamajhi et al., 2025; Shahabi et al., 2021; Wahba et al., 2024). These factors are listed in Table 1 and briefly described afterwards. Figures 4 and 5 provide a visual overview of the spatial distribution of these input layers, as used in the machine learning algorithm.
Table 1Overview of causative factors for landslides and flash floods and the data sources used.
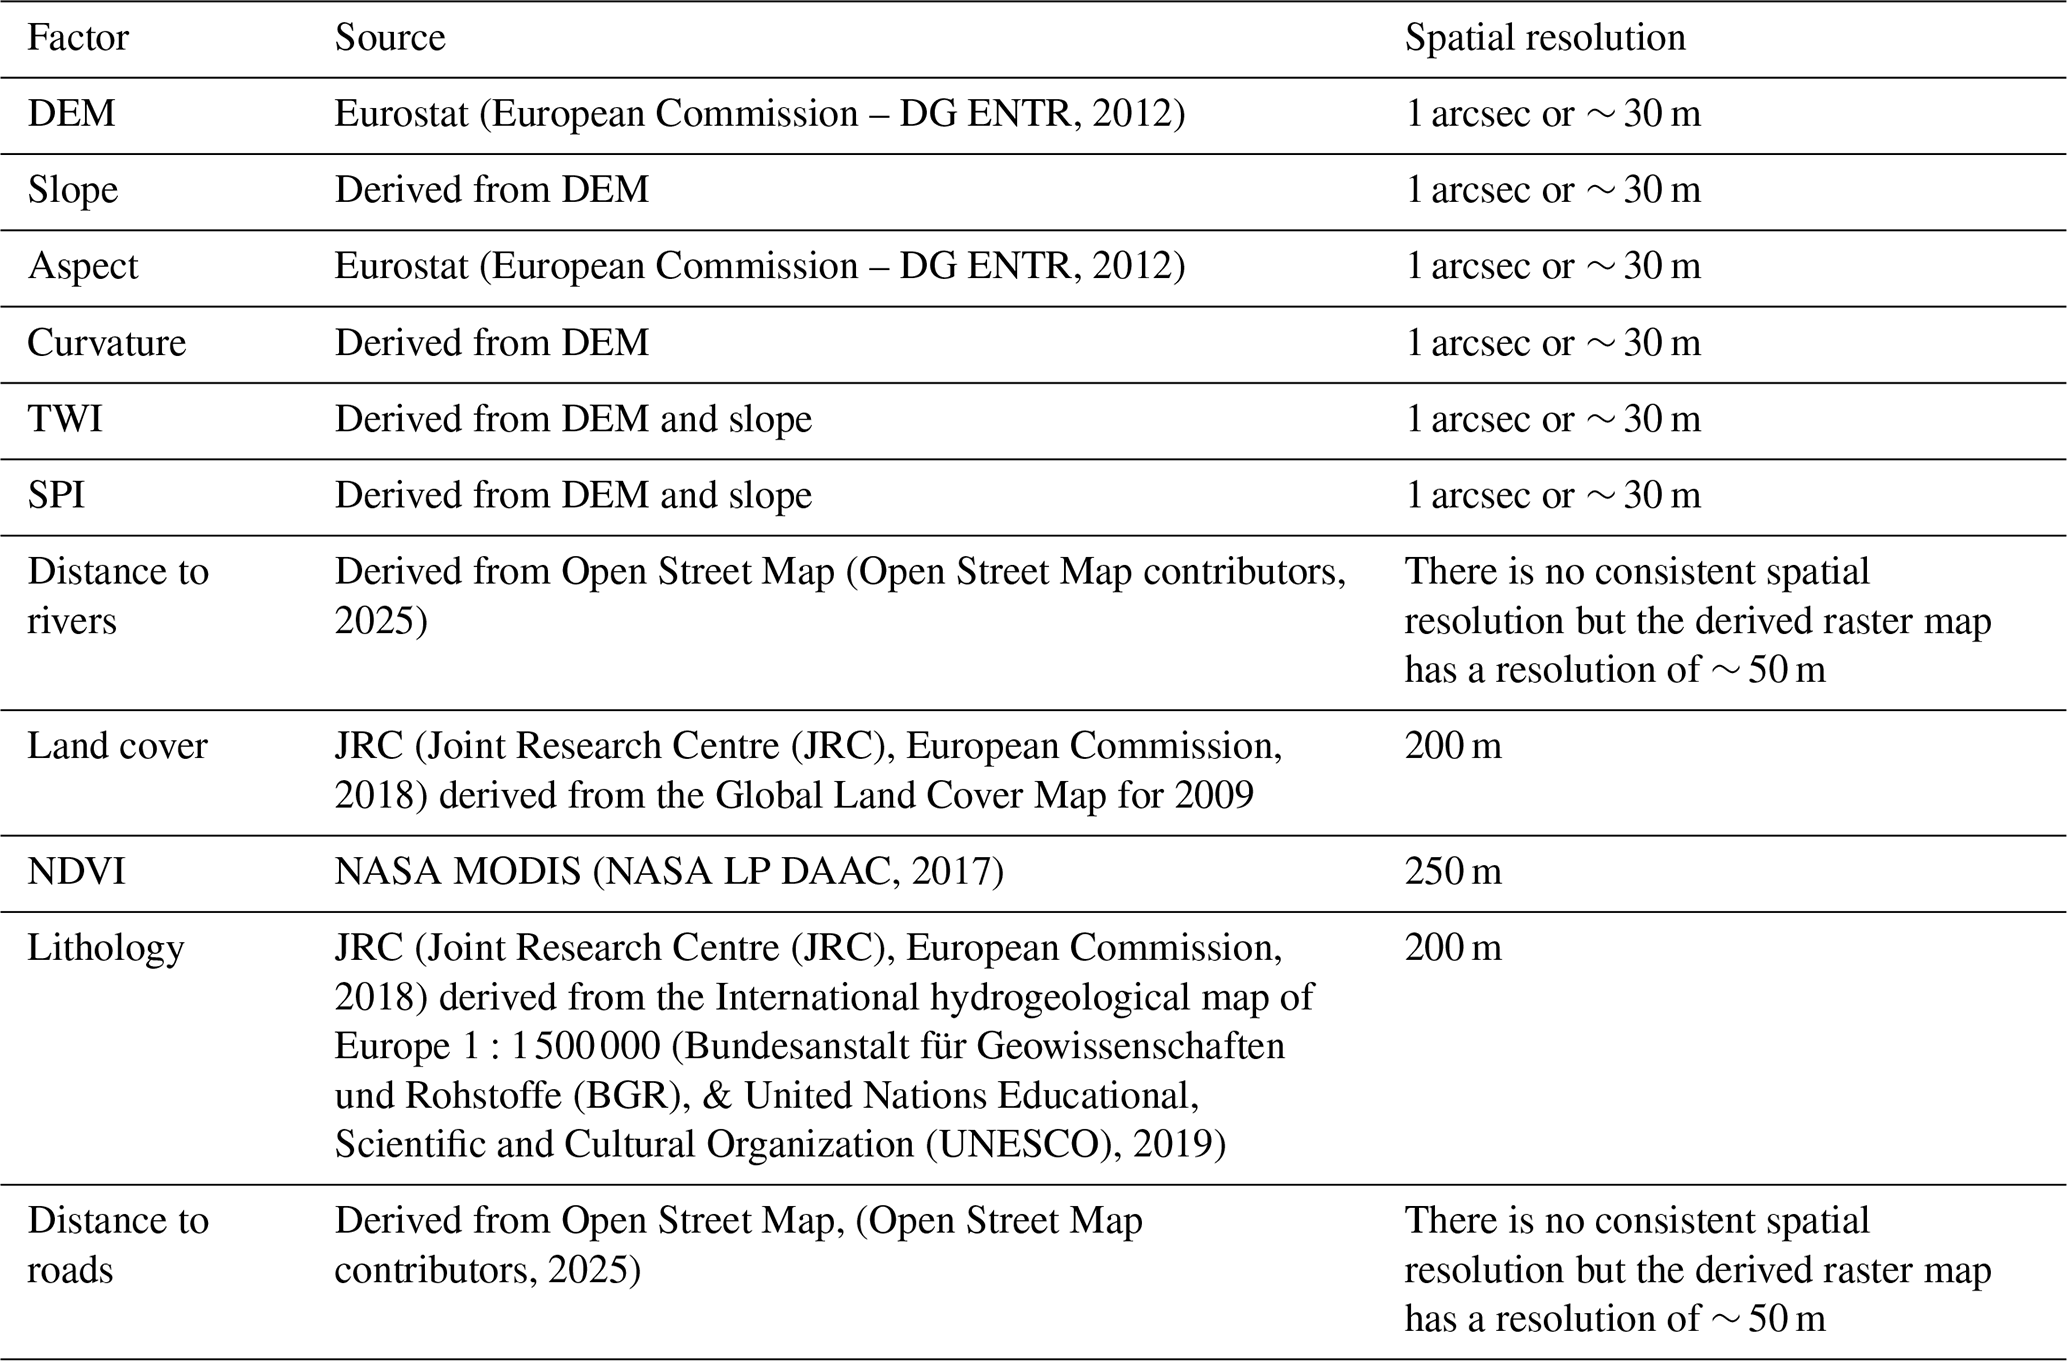
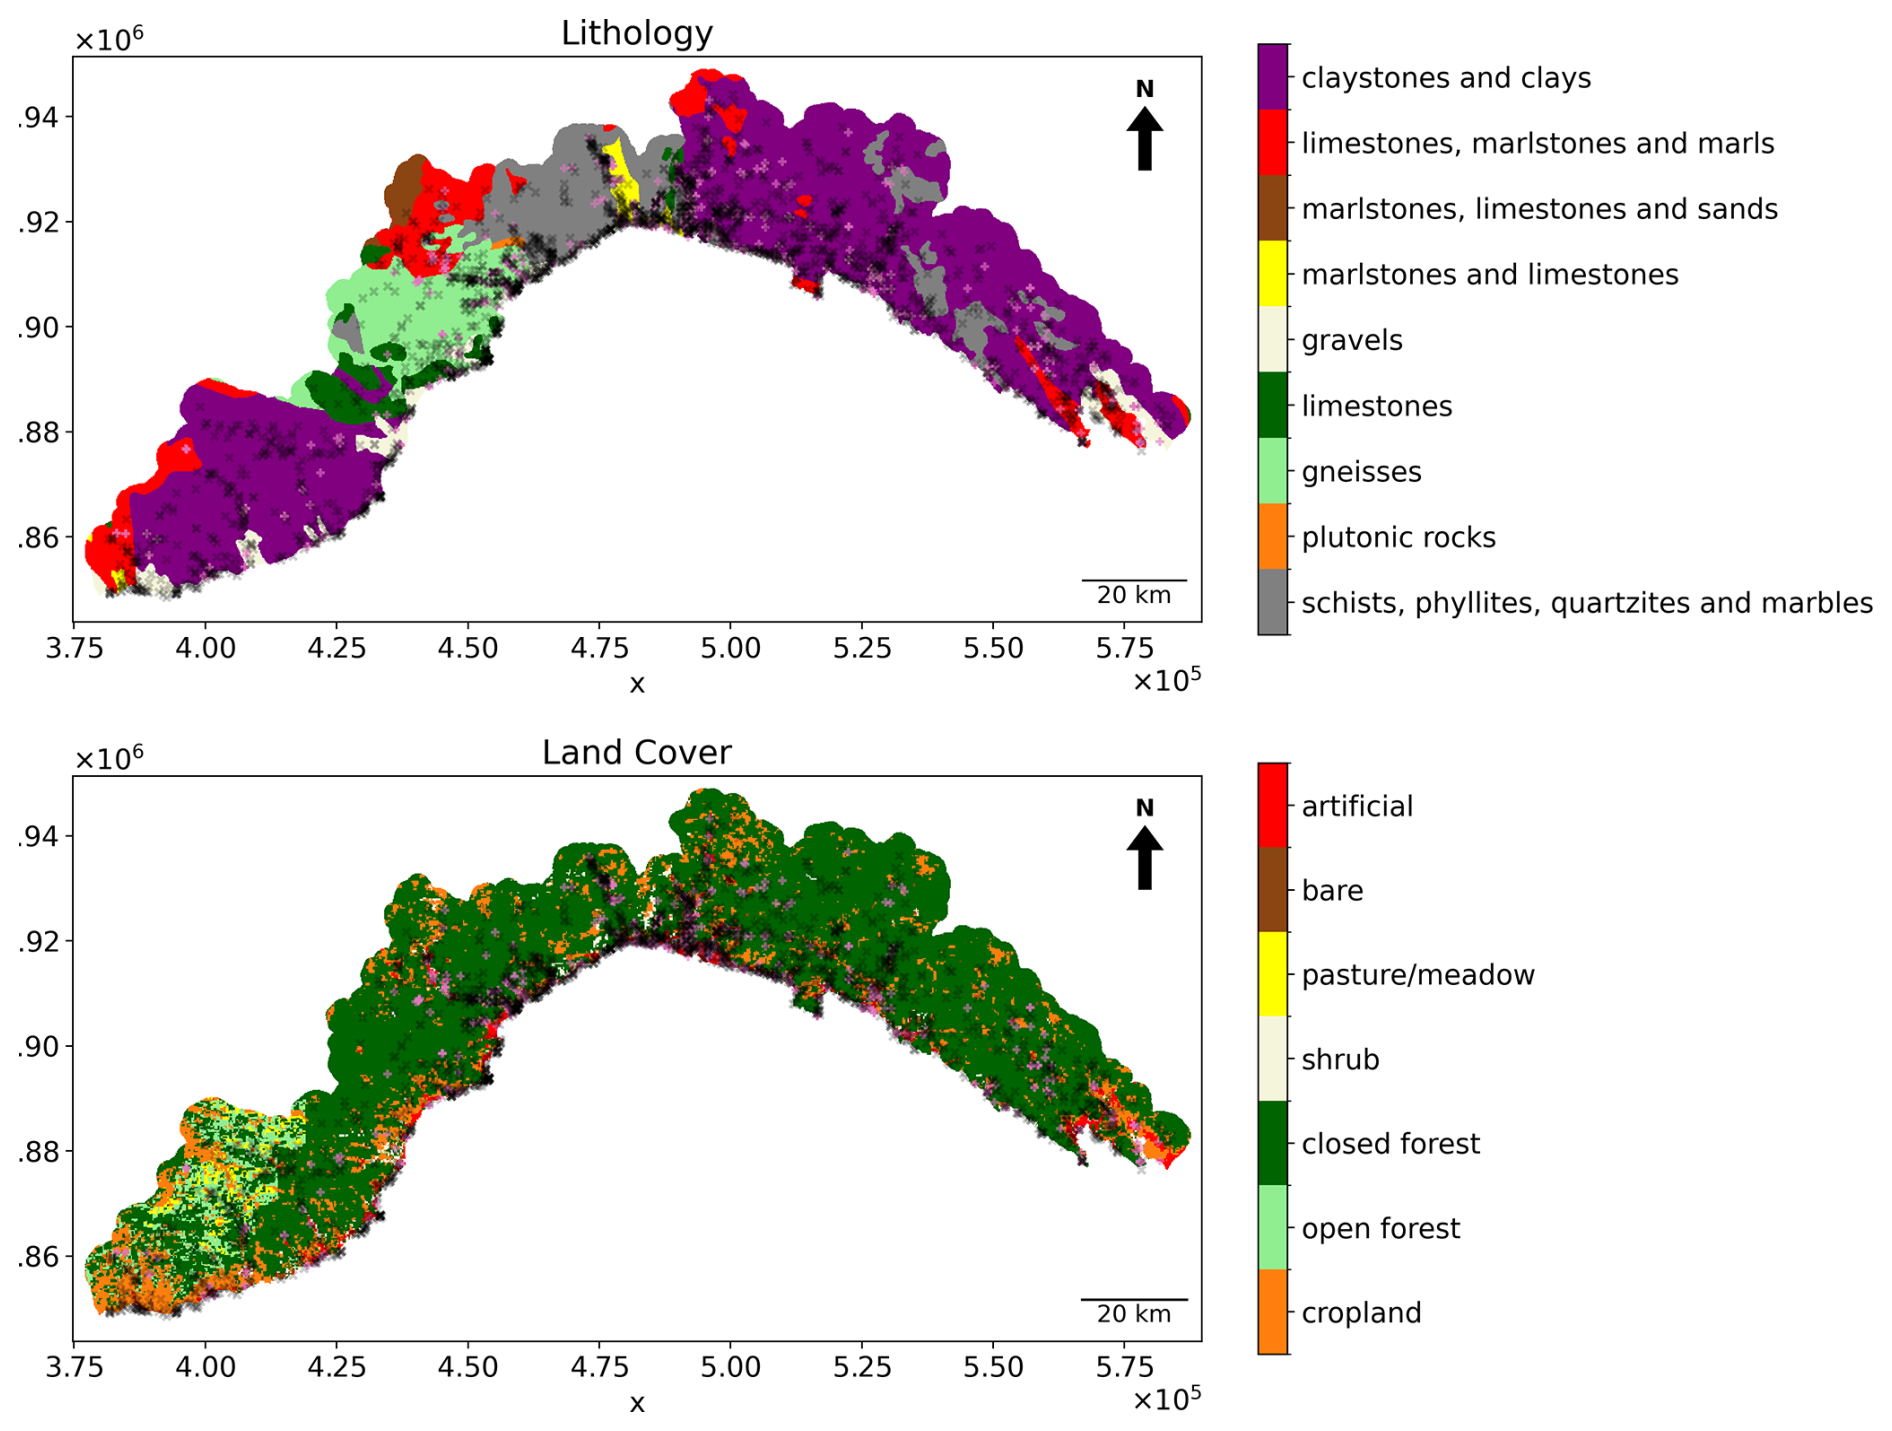
Figure 5Overview of landslide and flash flood categorical causative factor maps used as input for the ML algorithms.
Unlike other studies that include rainfall as a dynamic input variable in landslide susceptibility mapping (Ahmed et al., 2023; Lee et al., 2022), we chose not to incorporate rainfall data in our model. Although rainfall is a well-known trigger for both landslides and flash floods, its use as a predictive requires rainfall datasets with sufficient spatial and temporal resolution. This is particularly important in mountainous areas such as Liguria, where rainfall patterns are highly variable, and short-duration, high-intensity convective storms frequently occur. These are often not captured by coarse-resolution (coarser than 4 km) datasets, such as those provided by satellite-based or global reanalysis products e.g. ERA5 (Hersbach et al., 2020), CHIRPS (Funk et al., 2015), PERSIANN (Sorooshian et al., 2014), IMERG (Huffman et al., 2020). Moreover, the other input data used in this study – such as topography and land cover – are available at much finer resolutions (∼ 30–250 m). Such a mismatch between input resolutions can lead to inaccuracies in the model and reduce confidence in the resulting susceptibility maps. Future studies may incorporate dynamic rainfall information, provided that high-resolution precipitation datasets become available and are spatially consistent with the other model inputs.
Topographical factors
The elevation, slope, aspect, and curvature play an important role in the velocity and direction of surface runoff. They are related to the stability of slopes affecting the occurrence of landslide events and to the presence of valleys where floods are most likely to occur.
Hydrological factors
The Topographic Wetness Index (TWI), the Stream Power Index (SPI), and the proximity to river are proxies of the hydrological conditions of the landscape. The TWI is a proxy for determining the susceptibility of areas to (soil) saturation in hilly areas. It is defined in Beven and Kirby (1979) as:
where A is the drainage area per unit contour length and represents the water flow accumulation at a point i, and β is the local slope angle in radians at the same point. The SPI measures the erosive power of flowing water that increases with the steepness of the slope and the larger upstream accumulation area for water and is defined as:
Landscape factors
Land cover and the Normalized Difference Vegetation Index (NDVI), which quantifies the amount and health of vegetation, influence the infiltration capacity and stability of the topsoil, as well as the runoff speed.
Geologic factor
The subsurface lithology influences the water storage and the proneness or resistance to sliding movements.
Anthropogenic factor
The proximity to roads interferes with the slope stability and can also capture the bias to the recording frequency of landslide events.
3.3 Methods
This study was conducted following a stepwise framework. First, a multicollinearity assessment and a frequency ratio analysis were carried out to evaluate the relevance and consistency of the conditioning factors for both flash floods and landslides. Second, three machine learning models were calibrated and evaluated using identical conditioning factors and different inventories to produce flash flood and landslide susceptibility maps.
3.3.1 Multicollinearity and frequency ratio analysis
Variance Inflation Factor
In order to run the hazard susceptibility modelling, we must make sure the input variables (factors) are not collinear. High collinearity between factors decreases the model's interpretability and accuracy. Hence, we used the Variance Inflation Factor (VIF), specifically the variance_inflation_factor from Statsmodels statistical modelling and econometrics in Python (Seabold and Perktold, 2024) to quantify the collinearity of the input variables.
The VIF is a factor by which the correlations among the predictors or independent variables increase the variance:
where is the coefficient of determination for regressing the ith independent variable on all the other predictors. Hence, if the predictors are uncorrelated is equal to 0 and VIF equals one. VIF values between 1 and 5 indicate a low to moderate level of multicollinearity, values between 5 and 10 correspond to a moderate to high level of correlation, whereas values higher than 10 show a strong multicollinearity.
Frequency Ratio
To analyse the conditions that led to the occurrence of both past flash floods and past landslides, we used the frequency ratio (FR). In this study it is intended as a comparative tool between both hazards rather than being part of the susceptibility modelling. The frequency ratio is a method used to quantify the relationship between the spatial distribution of past hazard occurrences (e.g., flash floods or landslides) and individual classes of a causative factor. It is calculated as the ratio between the proportion of hazard pixels in a given class and the proportion of total area covered by that class.
where Fci is the number of pixels with flash floods (or landslides) for each class of each i variable, Fs the total number of pixels with flash floods (or landslides) in the study area, Aci the number of pixels for each class of each i variable, and As the total number of pixels in the study area.
A frequency ratio greater than 1 indicates a positive association between the class and the hazard occurrence (i.e., the hazard is more likely in that class), while a ratio less than 1 suggests a negative association. This method was applied separately for both landslides and flash floods, enabling comparison of how each hazard correlates with different classes of conditioning factors.
For continuous variables, we used the Jenks natural breaks classification (Jenks, 1967) via the Jenkspy: Fast Fisher-Jenks breaks for Python (Viry et al., 2024) to divide each variable into four classes sampling randomly 10 % of the data. This method minimizes intra-class variance and maximizes inter-class variance. Only for aspect and curvature, a manual classification based on geomorphological properties was used to make the results more intuitive, i.e. aspect was divided between flat, NE, SE, SW, NW while curvature was separated into concave, flat, and convex.
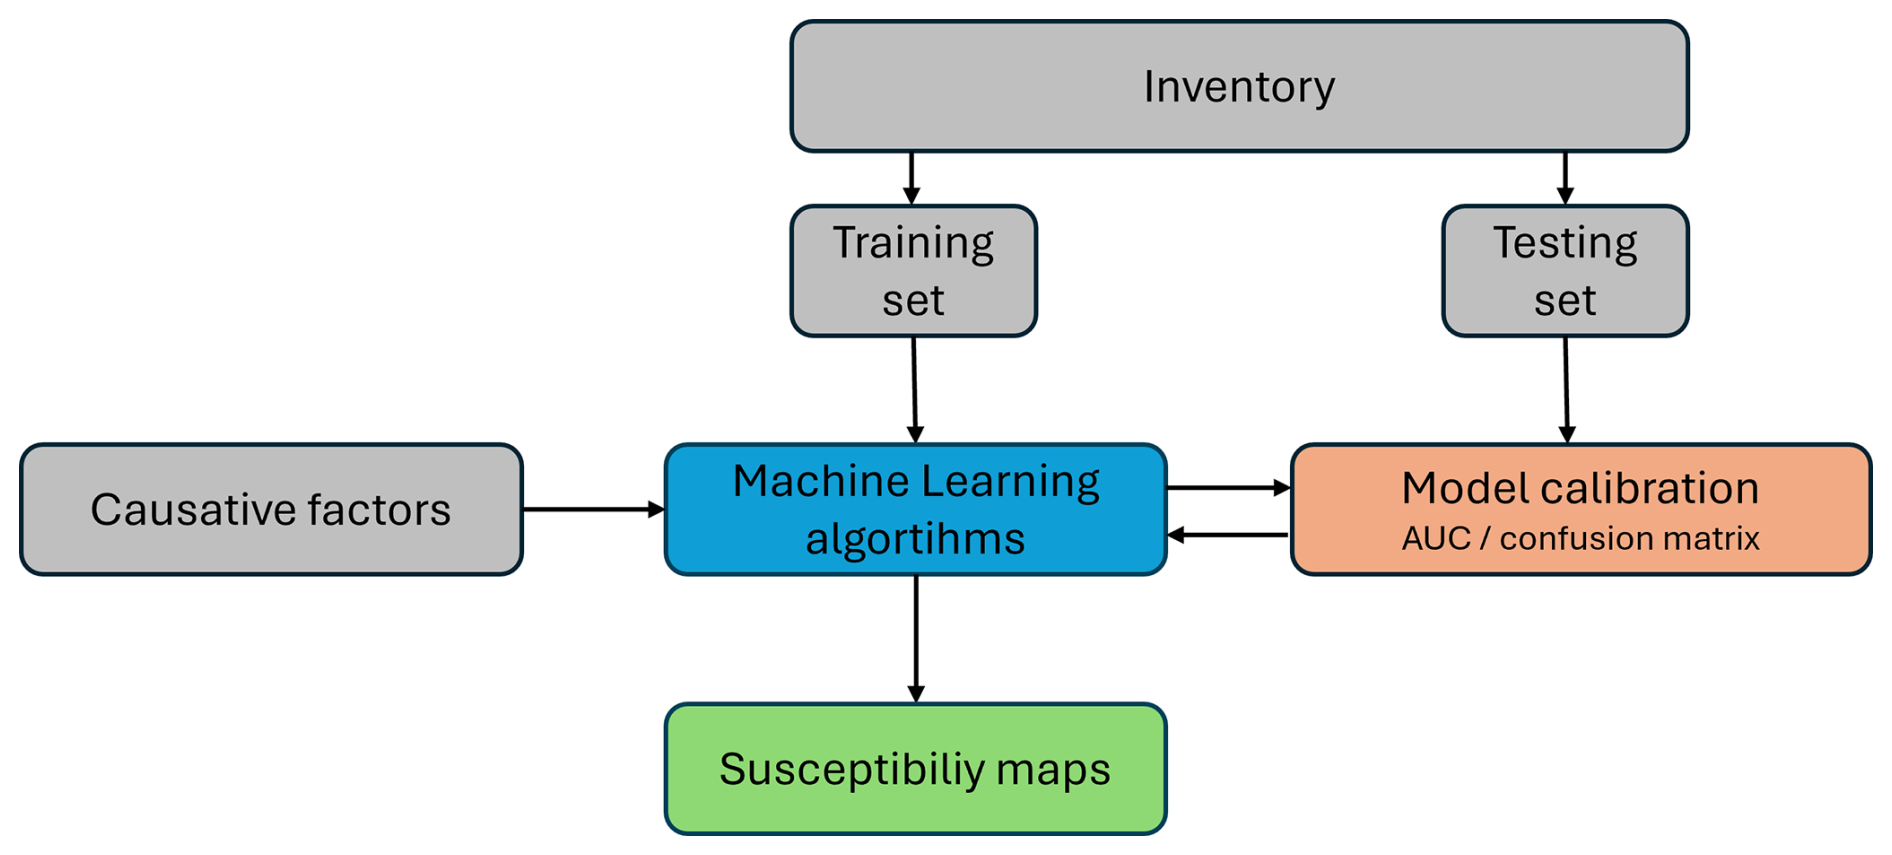
3.3.2 Hazard Susceptibility Modelling
The hazard susceptibility modelling framework (see Fig. 6) is a GIS tool programmed in Python that creates landslide and flash flood susceptibility maps using three different Machine Learning (ML) Models Logistic Regression (LR), Random Forest (RF) and, Support Vector Machine (SVM). These were computed using the LogisticRegression, RandomForestClassifier and the svm modules respectively from Scikit-Learn Machine Learning Python library (Pedregosa et al., 2011).
Based on the outcomes of the multicollinearity and frequency ratio analysis, an identical set of conditioning factors was used to train the machine learning models allowing for a consistent susceptibility assessment for both flash floods and landslides.
Logistic Regression (Cox, 1958) is a supervised machine learning algorithm especially used for binary classification problems. It uses a sigmoid function to predict the probability the input data belongs to one of the two classes.
The Random Forest (Breiman, 2001) is the most used machine learning algorithm, as it is a popular ensemble learning method that is widely used for classification and regression. It is a combined model that integrates multiple decision trees. The Random Forest involves two concepts: (1) random sampling of data points; (2) segmentation of nodes based on feature subsets. Each tree is trained on a sample of data points drawn at random, and these samples are drawn repeatedly. At each node, the decision tree will consider segmentation based on a part of the feature. The results from all decision trees are aggregated and the result of the Random Forest is obtained.
Support Vector Machine (Cortes and Vapnik, 1995) is a supervised machine learning algorithm used for classification and regression analysis. It is suitable for binary classification where it aims to find the best decision line or hyperplane separating the two classes. This is found when the distance or margin from the closest data points (support vectors) to the hyperplane is the largest. In case the data cannot be separated linearly, the input data is mapped into a higher dimensional space in which a boundary can be more easily obtained.
The framework is capable of taking in both user-defined inputs – for example, high-resolution LiDAR data – as well as keeping the option to rely on global and/or publicly available assets. All inputs are reprojected to a reference one defined by the user which in our case was the elevation input (1 arcsec).
The ML framework requires two types of input datasets. The first is the inventory of historical hazard occurrences – landslides or flash floods – provided in the form of spatial coordinates and timing. To account for the uncertainty in the exact location, the framework creates a 3×3 matrix around each point, this is definable by the user. This increases the number of positive samples relative to the original inventory. Additionally, we carried out a sensitivity test with a 1×1 and a 5×5 matrix, there are only minor differences, though not significant, for the flash floods susceptibility maps.
Although there is no universally accepted rule for dividing the dataset into training and testing subsets (Joseph, 2022), ratios of 80:20 or 70:30 ratio are commonly applied. In this study, the inventory was split using a 80:20 ratio to train and test the ML algorithm, respectively. The completeness of this inventory both in time and space is a main determining factor of the accuracy of the resulting susceptibility map.
The second type of input type includes the causative and triggering factors influencing hazard occurrence (see Sect. 3.1.2 Causative factors for flash floods and landslides). These include topographic, hydrological, geological, landscape, and anthropogenic variables that collectively define the susceptibility conditions across the study area.
The modelling workflow involves three main steps: model calibration, evaluation of the model's discriminatory power, and overall model performance assessment. The Scikit-Learn library (Pedregosa et al., 2011) was used for these three steps.
Model calibration
Prior to performance evaluation, the ML algorithm is calibrated to identify the optimal set of hyperparameters. The grid search method, specifically the GridSearchCV module, was employed to systematically test all possible parameter combinations and determine those yielding the highest predictive accuracy, as measured by the Area Under the Receiver Operating Characteristic (ROC) Curve (AUC). This ensures that hyperparameter selection is guided by the ability of the model to distinguish between hazard and non-hazard conditions, rather than a single-threshold accuracy score.
This process was complemented by a five-fold cross-validation resampling technique in which the data was split into five folds maintaining the same proportion of occurrences and non-occurrences within each fold. In each iteration, four folds were used for training and one for validation, cycling through all combinations to obtain an averaged performance score. The best-performing parameter configuration was then used to train the final models applied in subsequent analyses. The parameters tested are shown in Table B1 of Appendix B.
Evaluating the discriminatory power of the framework
After calibration, the models were evaluated for their ability to distinguish between the hazard and non-hazard conditions. The Receiver Operating Characteristic (ROC) and the Area Under the curve (AUC) metrics were used to evaluate the discriminatory power of the models.
The ROC curve represents a graphical plot of the model performance across all classification thresholds, showing the trade-off between the True Positive Rate (TPR) and False Positive Rate (FPR) at each threshold level. The AUC provides a single numerical measure summarizing this discriminatory power, i.e. the capacity to correctly distinguish landslide (or flash flood) from no-landslide (or flash flood) conditions.
An AUC value of 0.5 indicates random classification performance, while an AUC approaching 1.0 represents a model with excellent predictive capability (Uwihirwe et al., 2022).
Model performance evaluation
The predictive accuracy of each ML model is evaluated based on the AUC, the confusion matrix, the accuracy and the F1 score. The confusion matrix records the number of True Positives (TP, i.e., the number of times the event occurrence is correctly predicted), True Negatives (TN, i.e., the amount of correctly predicted non-occurrences), False Positives (FP, i.e., the model predicts an occurrence when there is none), and False Negatives (FN, i.e., the model does not predict an occurrence when there is one).
The accuracy of the model summarizes the proportion of correctly classified landslides (or flash floods) over the total number of landslides (or flash floods) and is calculated as:
Accuracy can be problematic for imbalanced datasets, i.e. few events (minority class) and many non-events (majority class), when the model correctly predicts the majority class while failing to predict the minority class. A more suitable metric for disproportionate datasets is the F1 score, which is the harmonic mean of precision and recall:
4.1 Analysis of the multicollinearity of causative factors
Figure 7 shows the calculated Variance Inflation Factor (VIF) for all selected causative factors. Only the Stream Power Index (SPI) exhibited moderate multicollinearity (VIF =5.7), while all other factors showed low level of multicollinearity. Therefore, all factors were included in the ML-models.
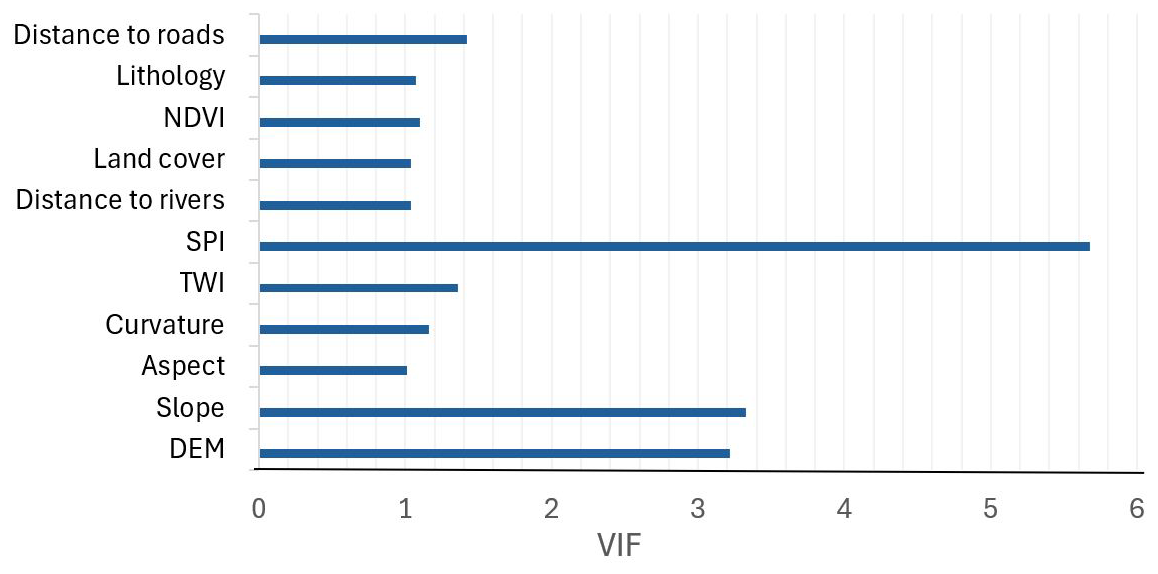
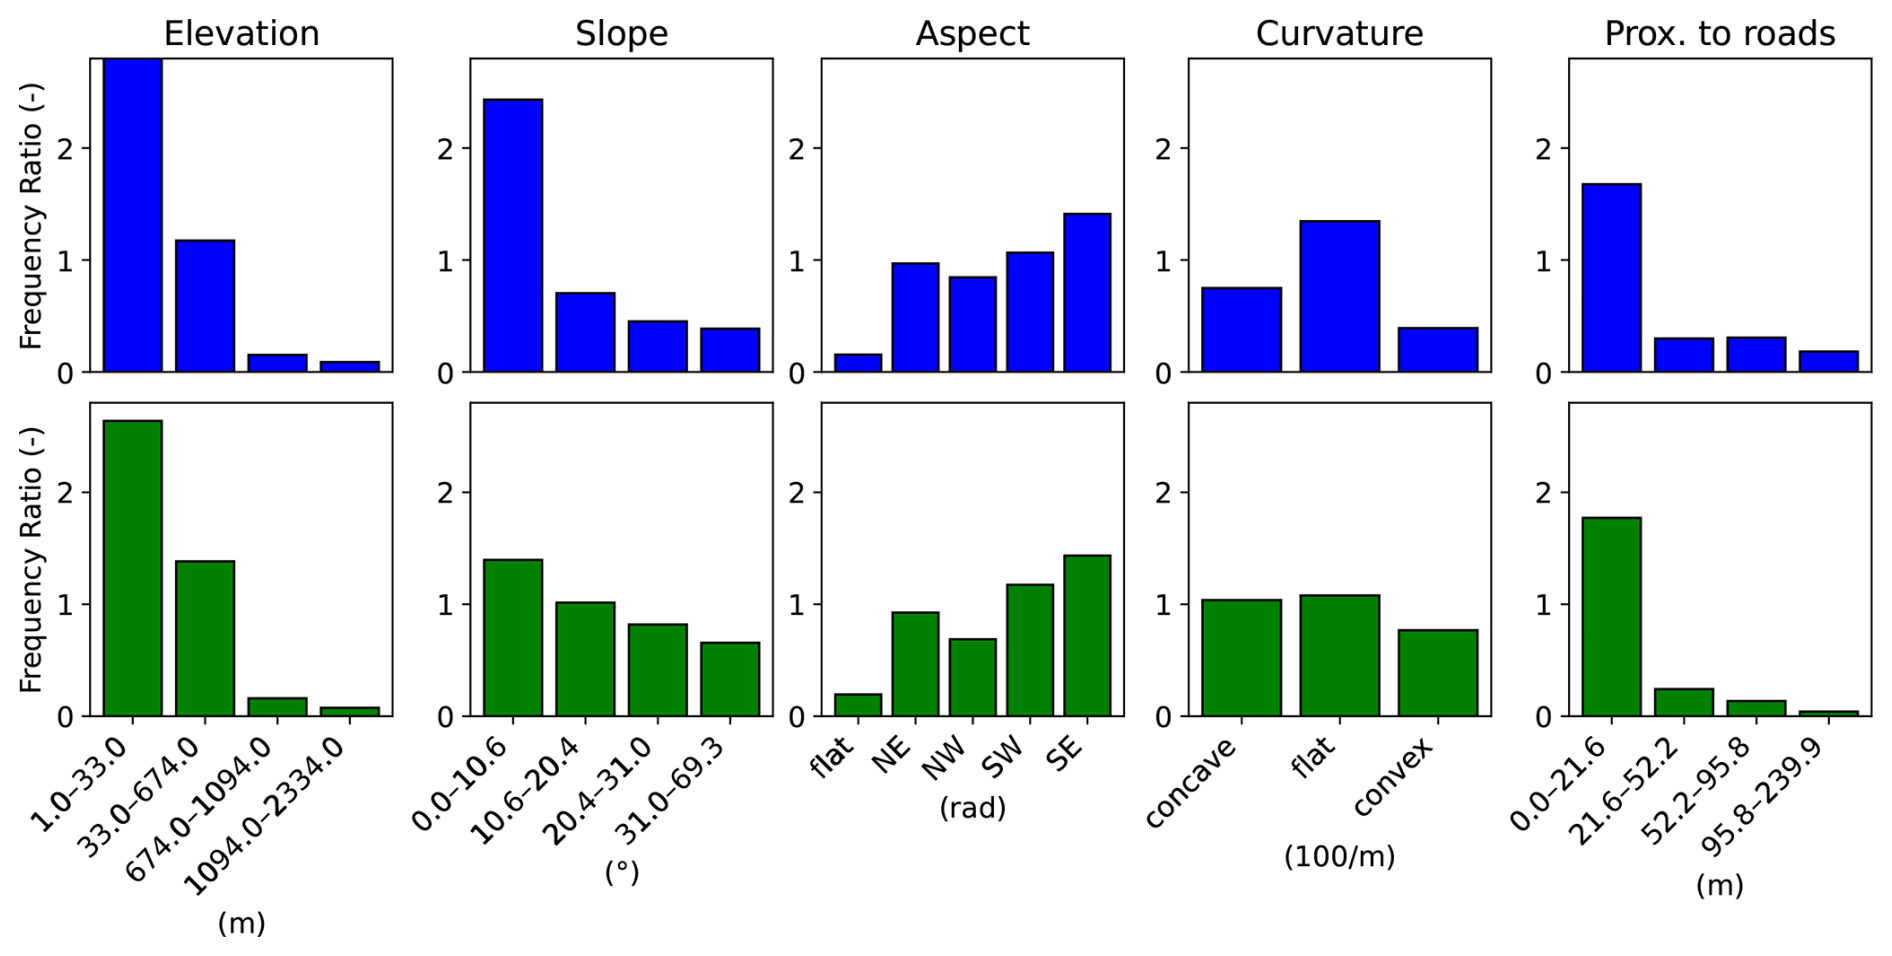
Figure 8Frequency ratio (FR) for flash floods (top) and landslides (bottom) for numerical variables.
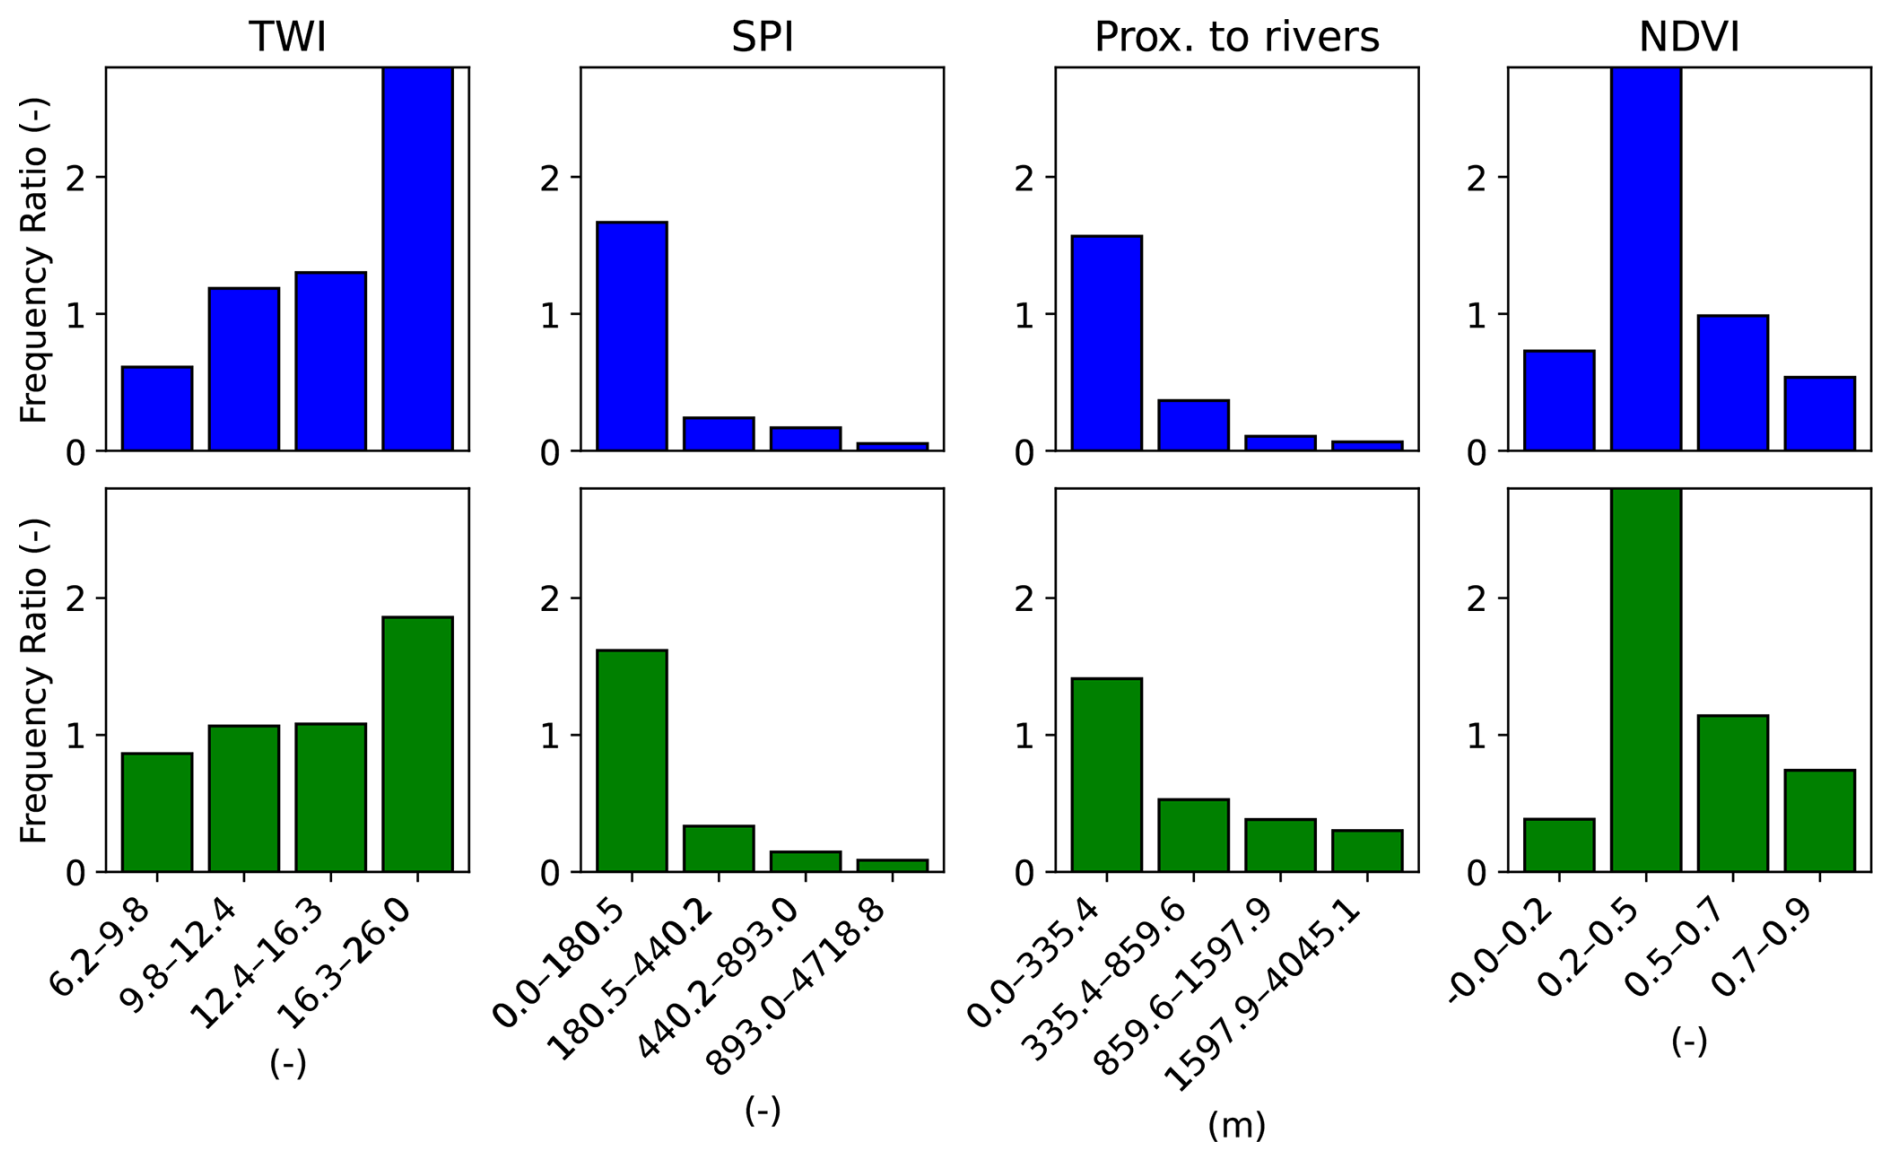
Figure 9Frequency ratio (FR) for flash floods (top) and landslides (bottom) for numerical variables continued.
4.2 Frequency Ratio Analysis
Figures 8 and 9 present the frequency ratio (FR) values for landslides and flash floods across numerical variables. Overall, the FR patterns were similar for both hazards.
Figure 8 shows that lower elevations and gentler slopes corresponded to higher likelihood of both flash floods and landslides occurrences. Although steep slopes tend to rapidly collect surface runoff, the water is accumulated in valleys. The differences in FR for landslides between slope classes is relatively small (0.5< FR <1.5) meaning that slope exerted a limited influence on landslide susceptibility in the study area. Regarding aspect, both flash floods and landslides are most likely to occur in areas facing South, and highly unlikely on flat surfaces. Convex surfaces such as hilltops and ridges are very unlikely (FR <0.5) for flash floods to occur and unlikely (FR <1) for landslides to occur on. On the contrary, flat areas were associated with the highest FR for flash floods. For areas close to roads (0–21.6 m) the FR is high (>1.5) for both flash floods and landslides and drastically drops for the larger distances.
In Fig. 9, we observe that for the Topographic Wetness Index (TWI), the highest FR values – areas that are most susceptible to saturation – correspond to the highest likelihood for both hazards. The FR decreases with decreasing TWI, a trend pronounced more for flash floods than for landslides. On the contrary, areas with low Stream Power Index (SPI) – lower erosive power of streams – exhibit the highest FR (∼ 1.6) for both hazards, with FR strongly decreasing as SPI increases. Proximity to rivers showed a clear spatial relationship: the closer to rivers, the higher the likelihood of both flood and landslides. This likelihood decreases sharply with distance. We obtained high FR values for areas with low NDVI (0.2–0.5), and with increasing NDVI values, we observed decreasing FR values.
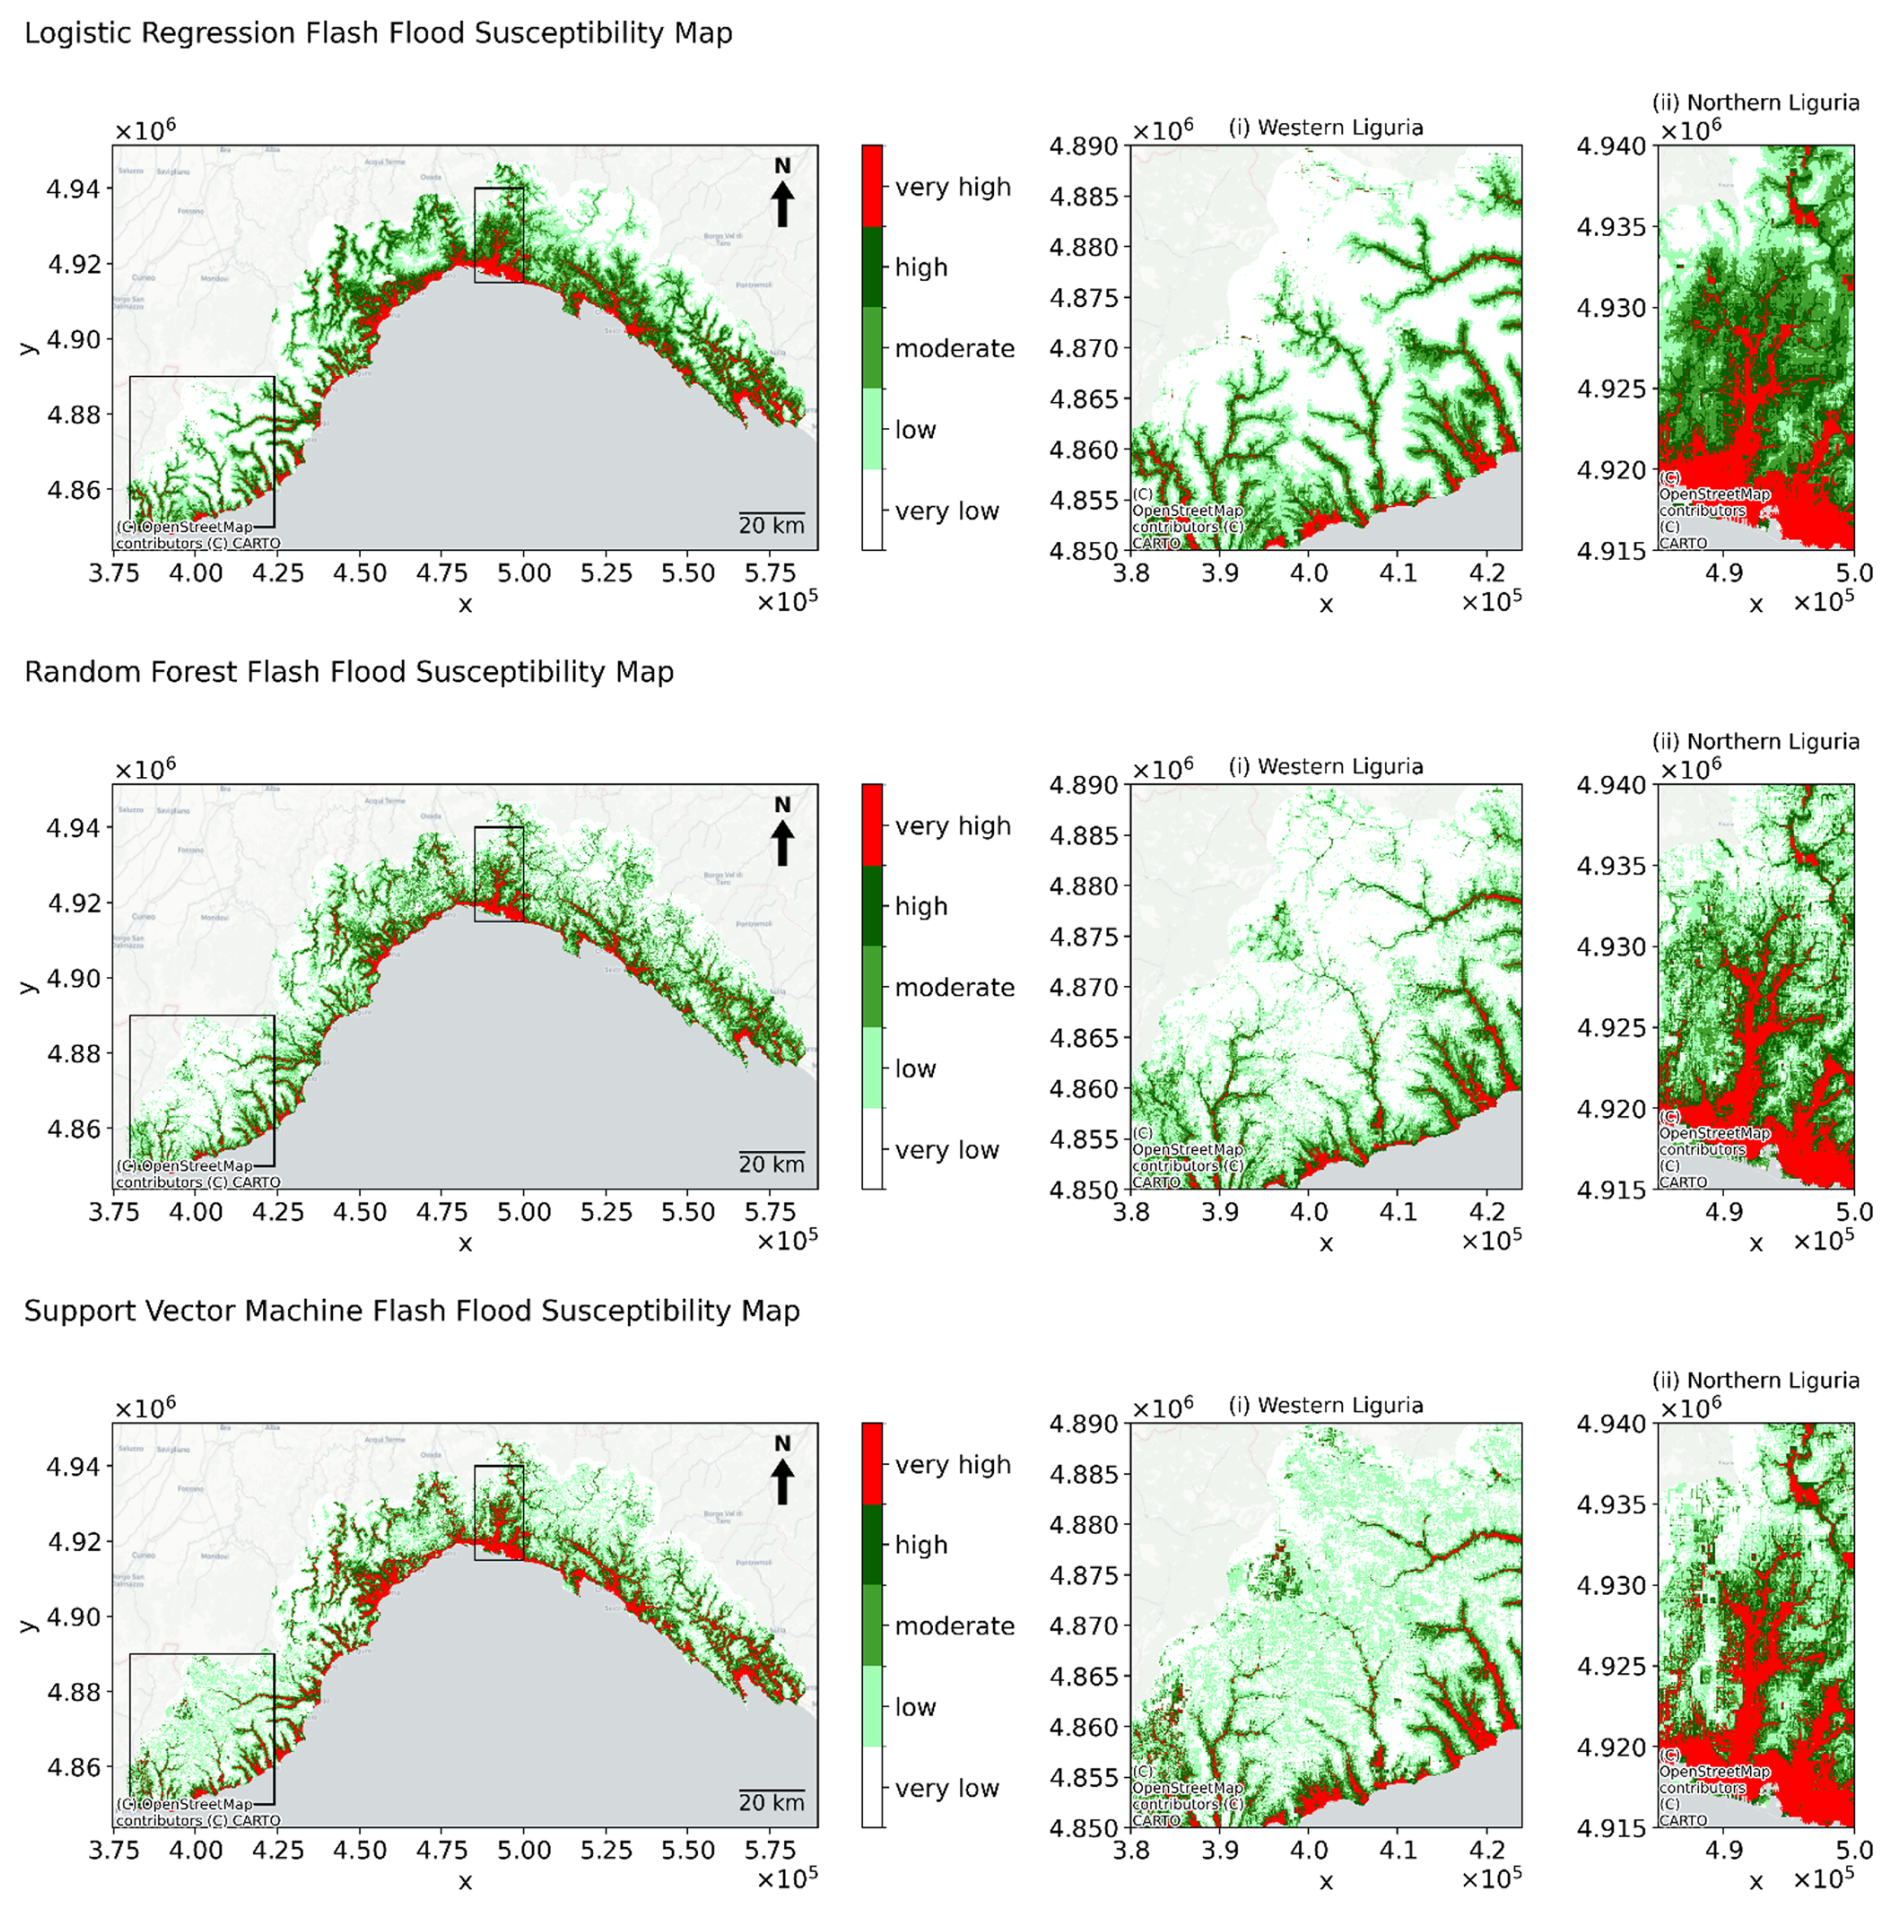
Figure 11Flash flood susceptibility maps for the three ML algorithms (Logistic Regression – top, Random Forest – middle, and Support Vector Machine – bottom). Map source: © OpenStreetMap contributors, OpenStreetMap.
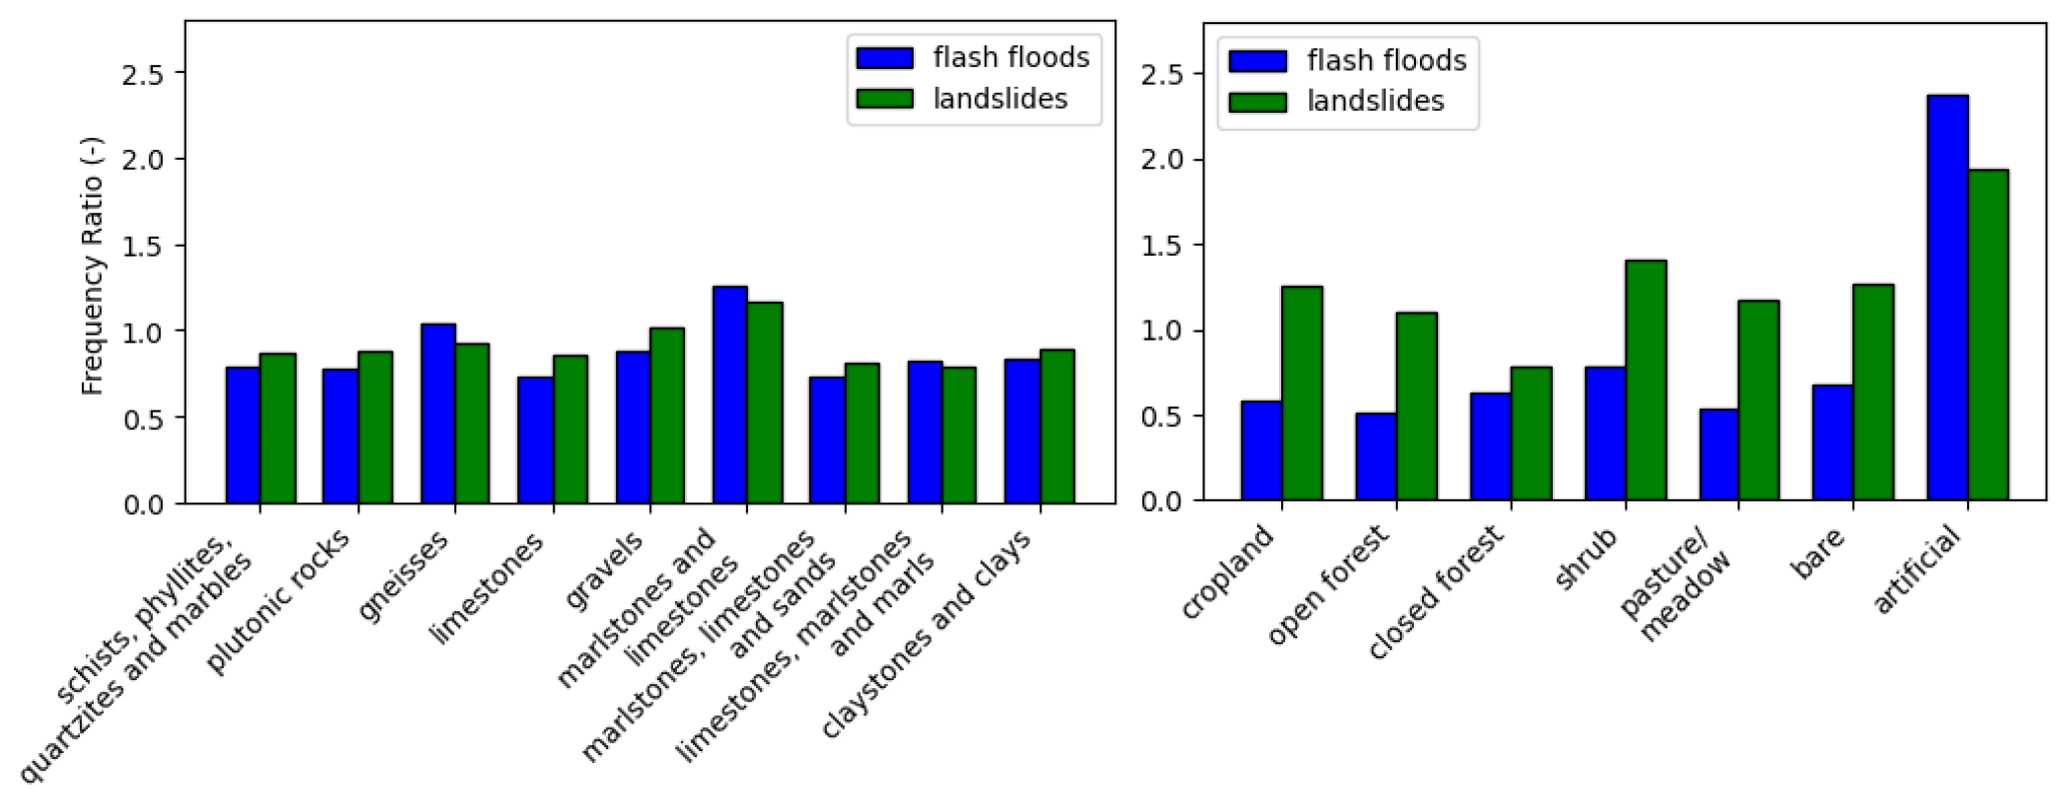
The influence of surface lithology and land cover on hazard occurrence is shown in Fig. 10. For lithology, the highest FR values for both hazards corresponded to marlstones and limestones which have low permeability. However, the FR for landslides and flash floods remained close to 1 (0.8–1.2 and 0.7–1.3 respectively) across all lithological classes, indicating that lithology exerted only a limited influence on landslide and flash flood occurrence in the study area. Regarding land cover, the highest FR values are found for artificial soils. Flash floods are unlikely to occur in the other land cover classes (FR <1) whereas landslide likelihood occurrence is more evenly distributed across land cover classes except for closed forest in which they are unlikely to occur (FR <1).
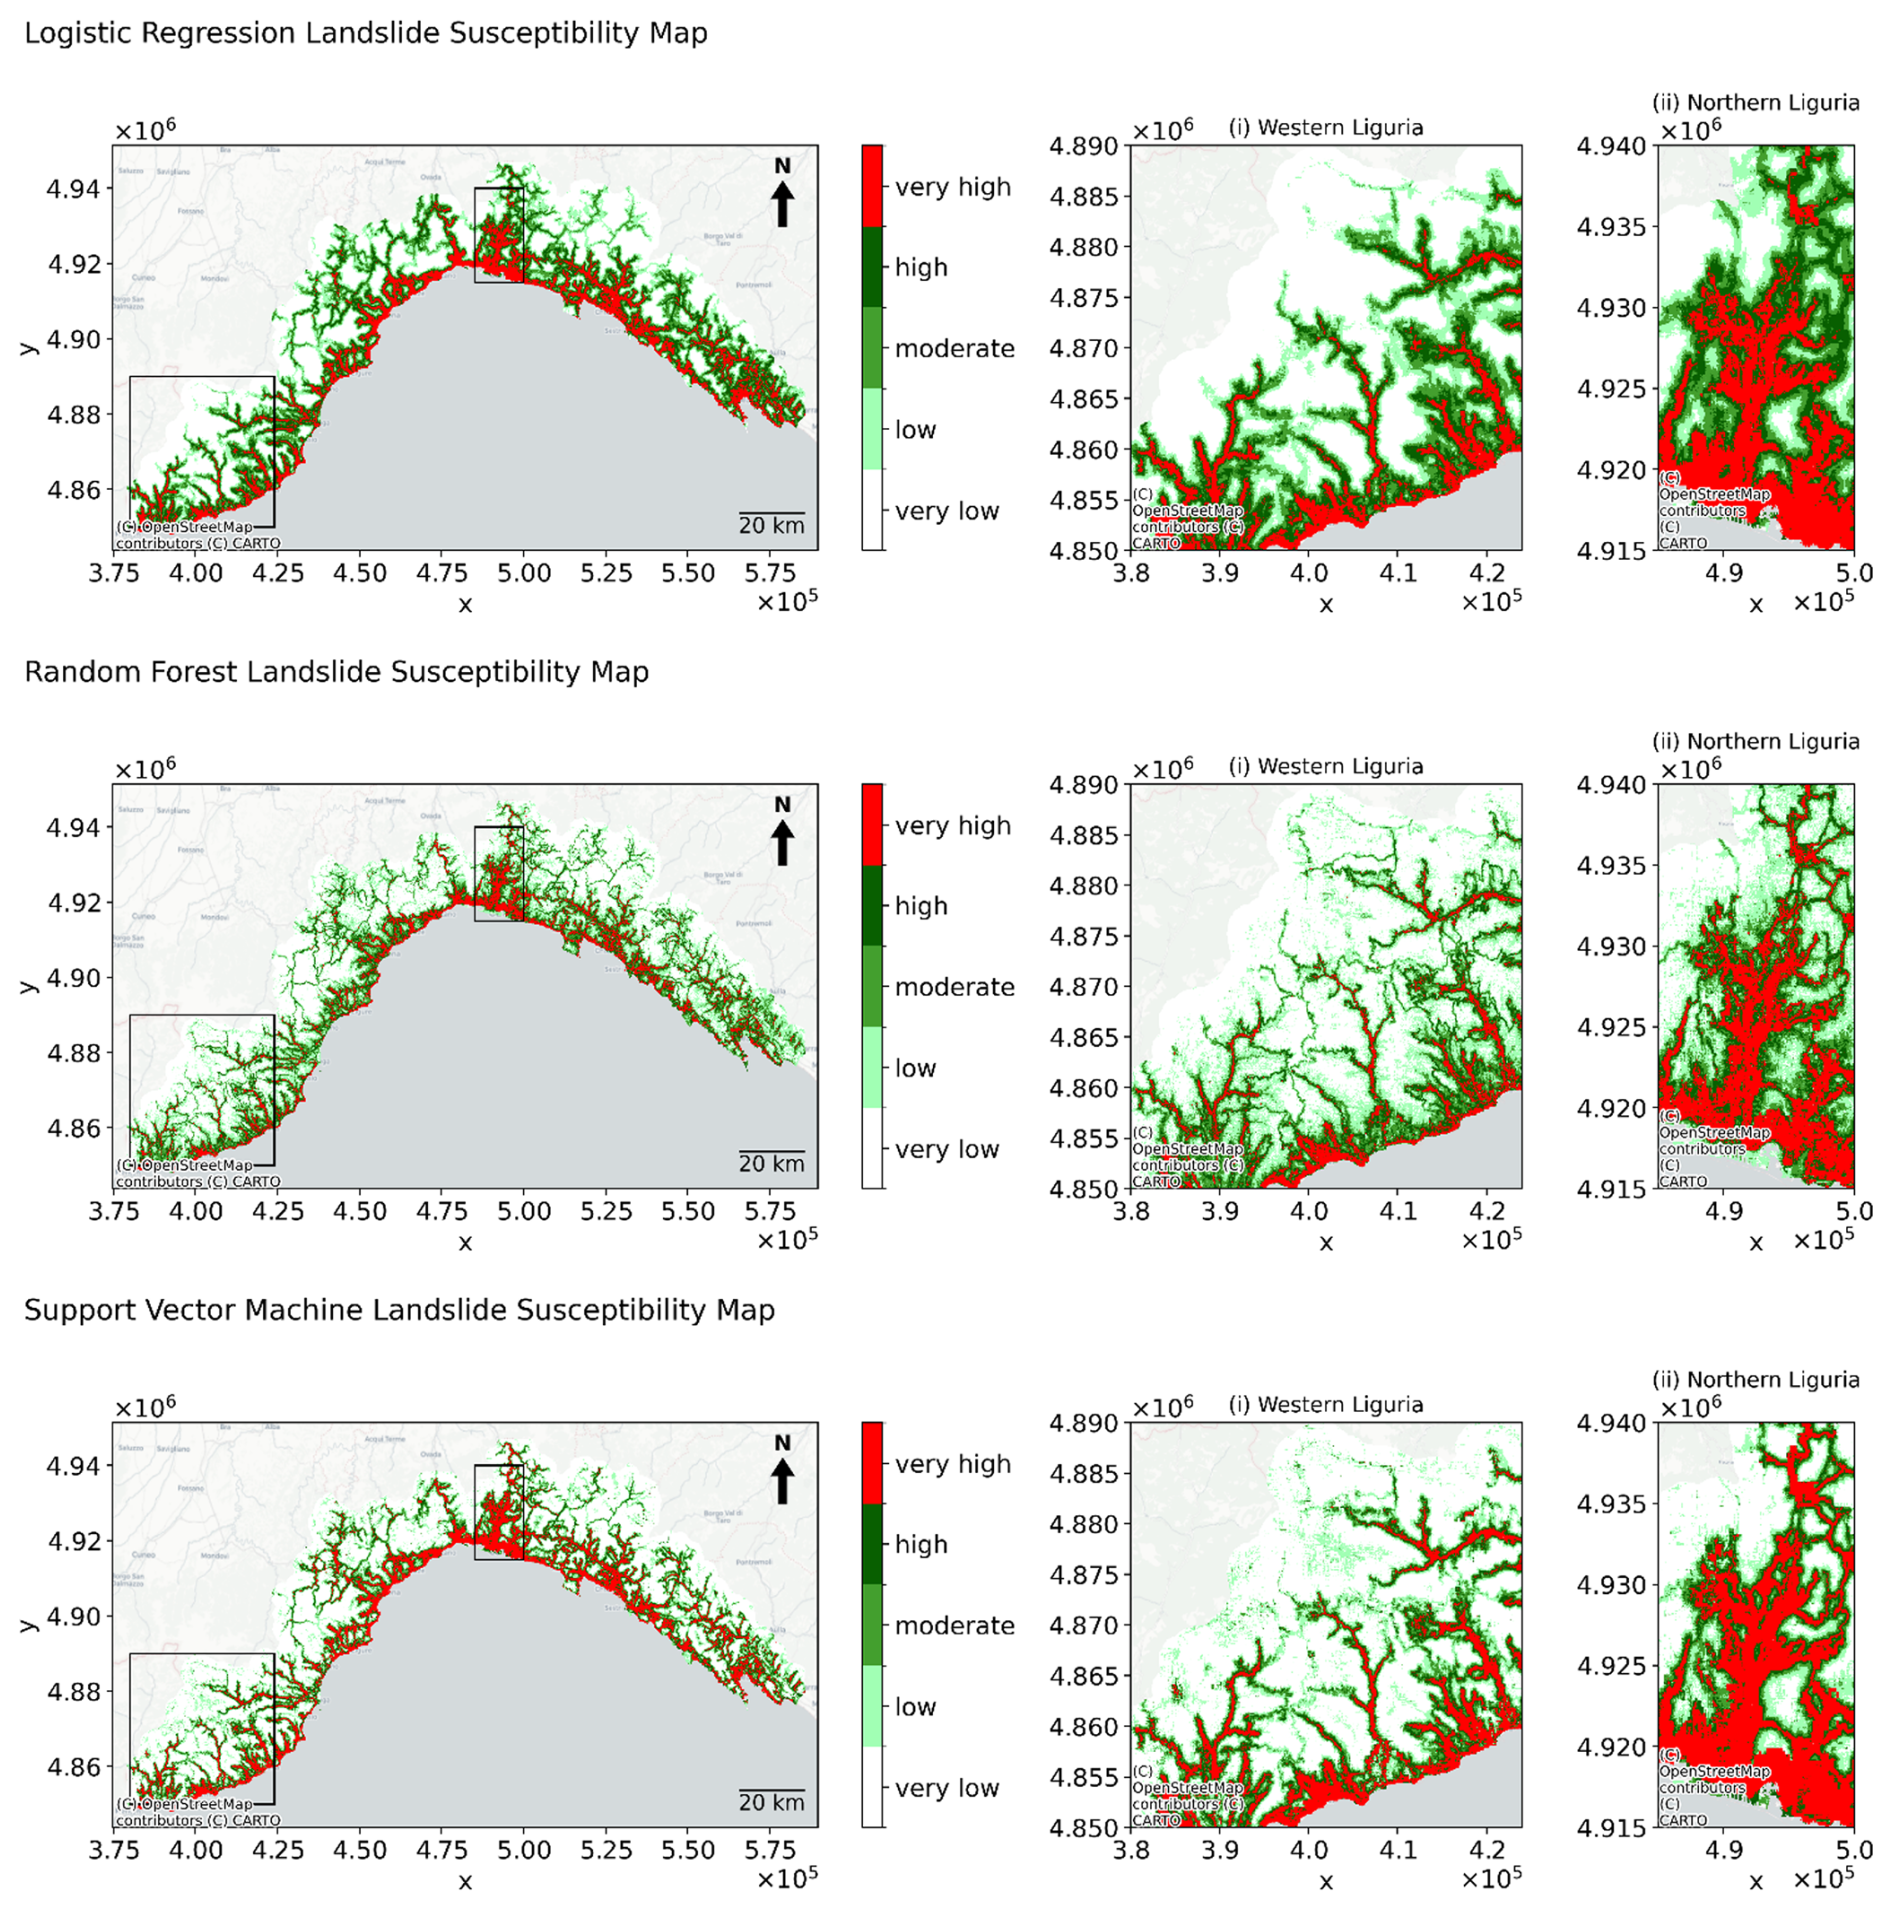
Figure 12Landslide susceptibility maps for the three ML algorithms (Logistic Regression – top, Random Forest – middle, and Support Vector Machine – bottom). Map source: © OpenStreetMap contributors, OpenStreetMap.
4.3 Hazard susceptibility maps
Figures 11 and 12 show the susceptibility maps for flash floods and landslides, respectively, for each of the ML models: Logistic Regression (LR), Random Forest (RF), and Support Vector Machine (SVM). The susceptibility maps obtained are continuous values ranging from 0 to 1 and have been reclassified into five discrete classes to improve interpretability of the outcomes using Jenks natural break (see Table A1 in the Appendix for the exact classes). The best parameters as given by the highest AUC together with the parameters tested are shown in Table B1 of Appendix B.
Overall, the maps follow a similar pattern for all algorithms and both hazard types. Along the coastline, areas of high susceptibility are widespread. Numerous villages and cities are located along this coast, including the historic city of Genoa, which has been repeatedly affected by severe flash floods in its urban valleys and by rainfall-induced landslides on the surrounding hills. Susceptibility is also high for both hazards along the Polcevera river valley, north of Genoa, (refer to Northern Liguria zoomed-in area) where extensive urbanization has led to the confinement or disappearance of natural waterways, ephemeral streams, and artificial channels, thereby increasing the likelihood and severity of catastrophic events (Faccini et al., 2015; Lanza, 2003).
Although there are many areas susceptible to both hazards, pronounced differences between flash floods and landslides occur in the Western part of the Liguria region (see Western Liguria zoomed-in area). Here the area with high landslide susceptibility is larger than the area with high flash flood susceptibility. This sector is characterized by relatively steep slopes (Fig. 4) and extensive crop land (Fig. 5), including vineyards. In case of non-permanent crops and frequent tillage, soil stability tends to be reduced (Giarola et al., 2024) leading to high occurrence of landslide events. In addition, the western Liguria region is driest part of the study area, with less than 600 mm yr−1, therefore leading to fewer flash floods recorded in the inventory.
Across all methods and ML algorithms, the total area identified as highly susceptible is larger for landslides than for flash floods. This difference largely reflects the characteristics of the two inventories (see Fig. 1). The landslide events are more widespread, particularly in the northern and western sector of Liguria, whereas flash flood events are concentrated in the lower valleys. The landslide inventory used in the study consisted of 2412 events, whereas we only have 526 historic flash flood events.
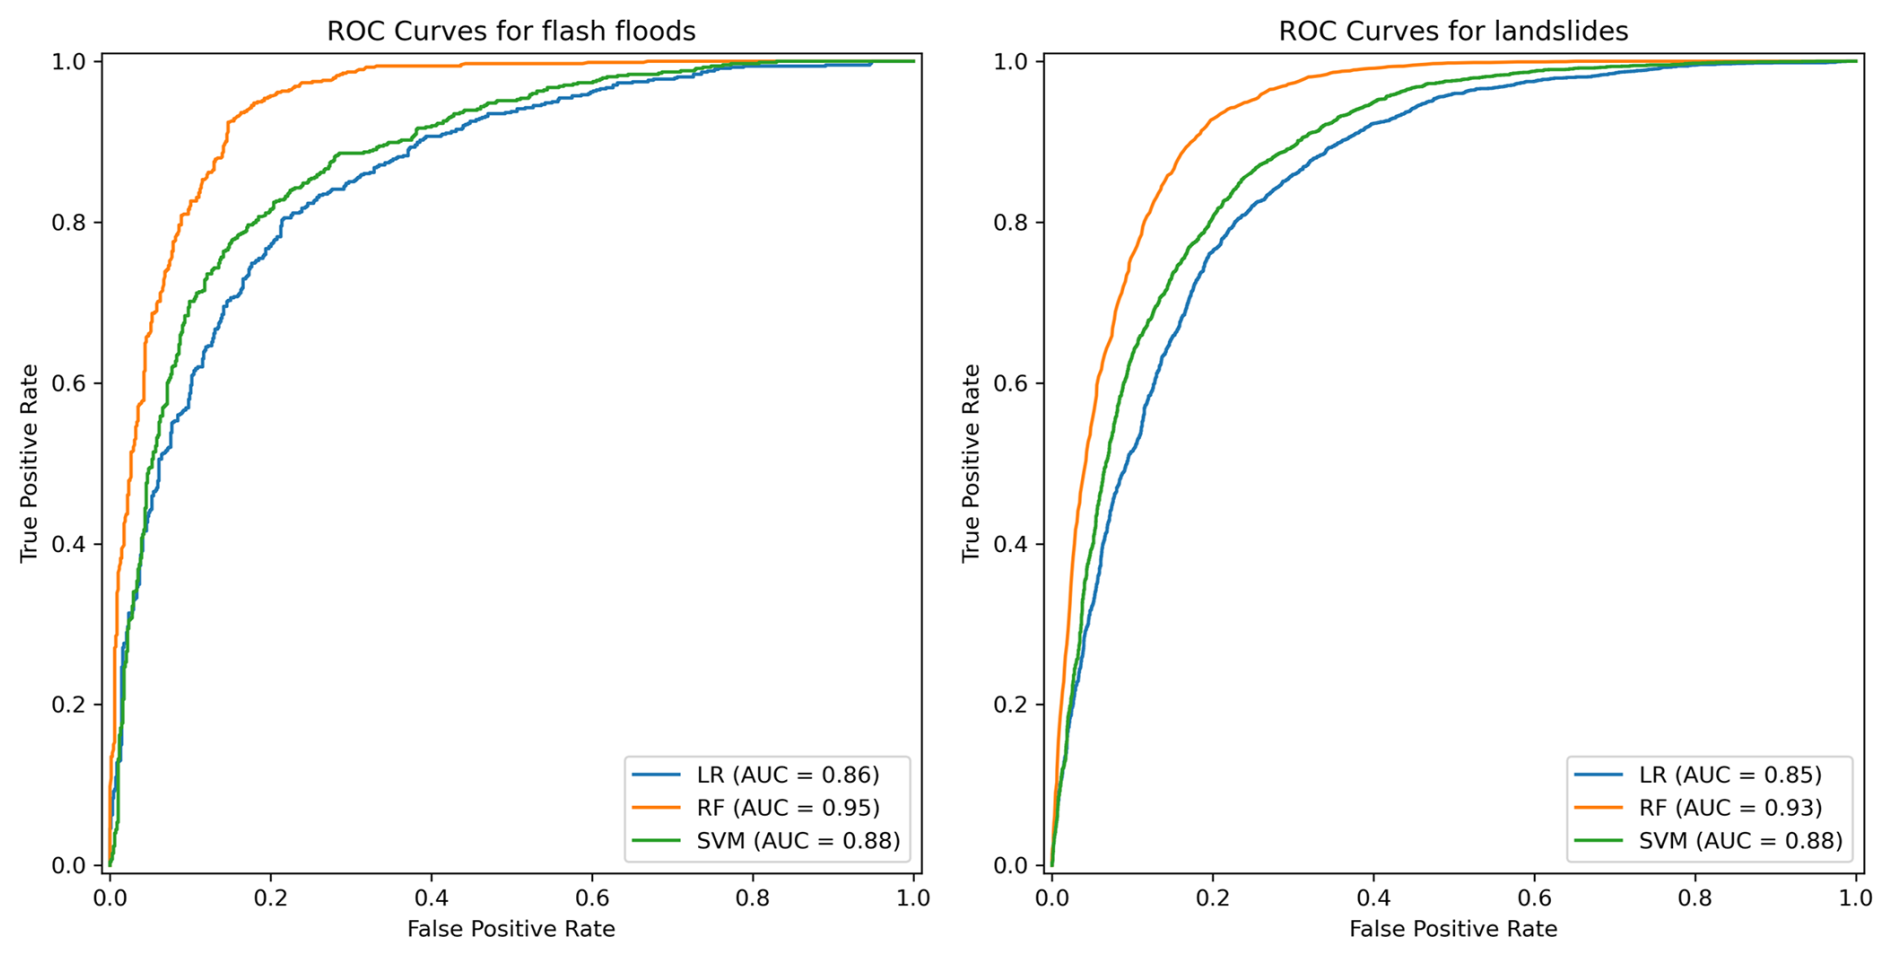
Figure 13Receiver operating characteristics (ROC) curves and the corresponding Area Under the Curve (AUC) for flash floods (left) and landslides (right) on the testing dataset for the three ML algorithms.
4.4 Model Performance and Discriminatory Power
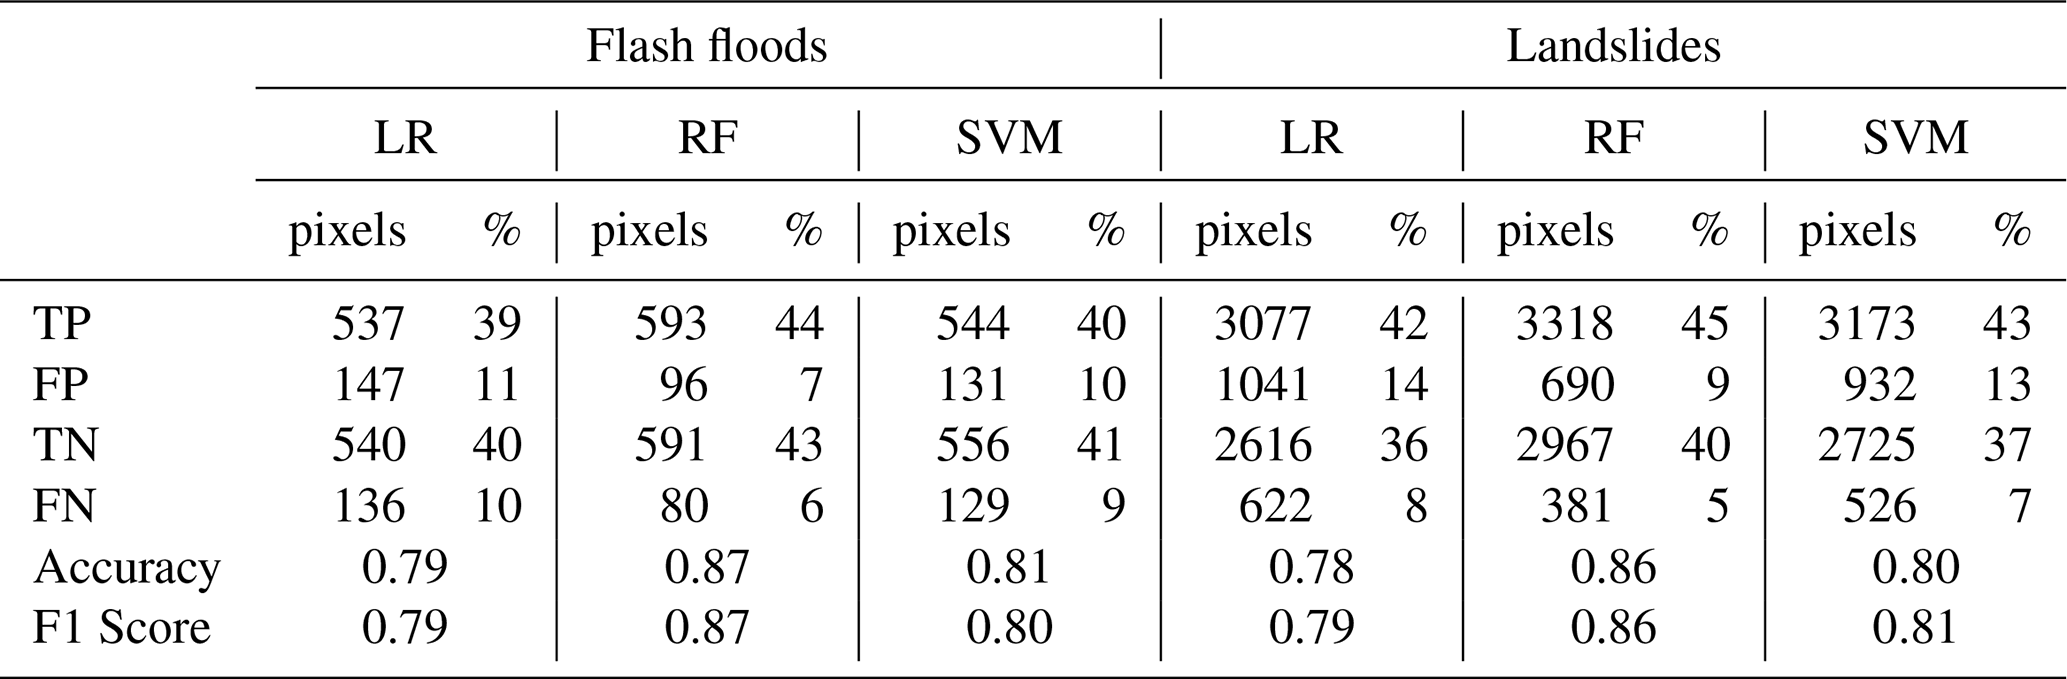
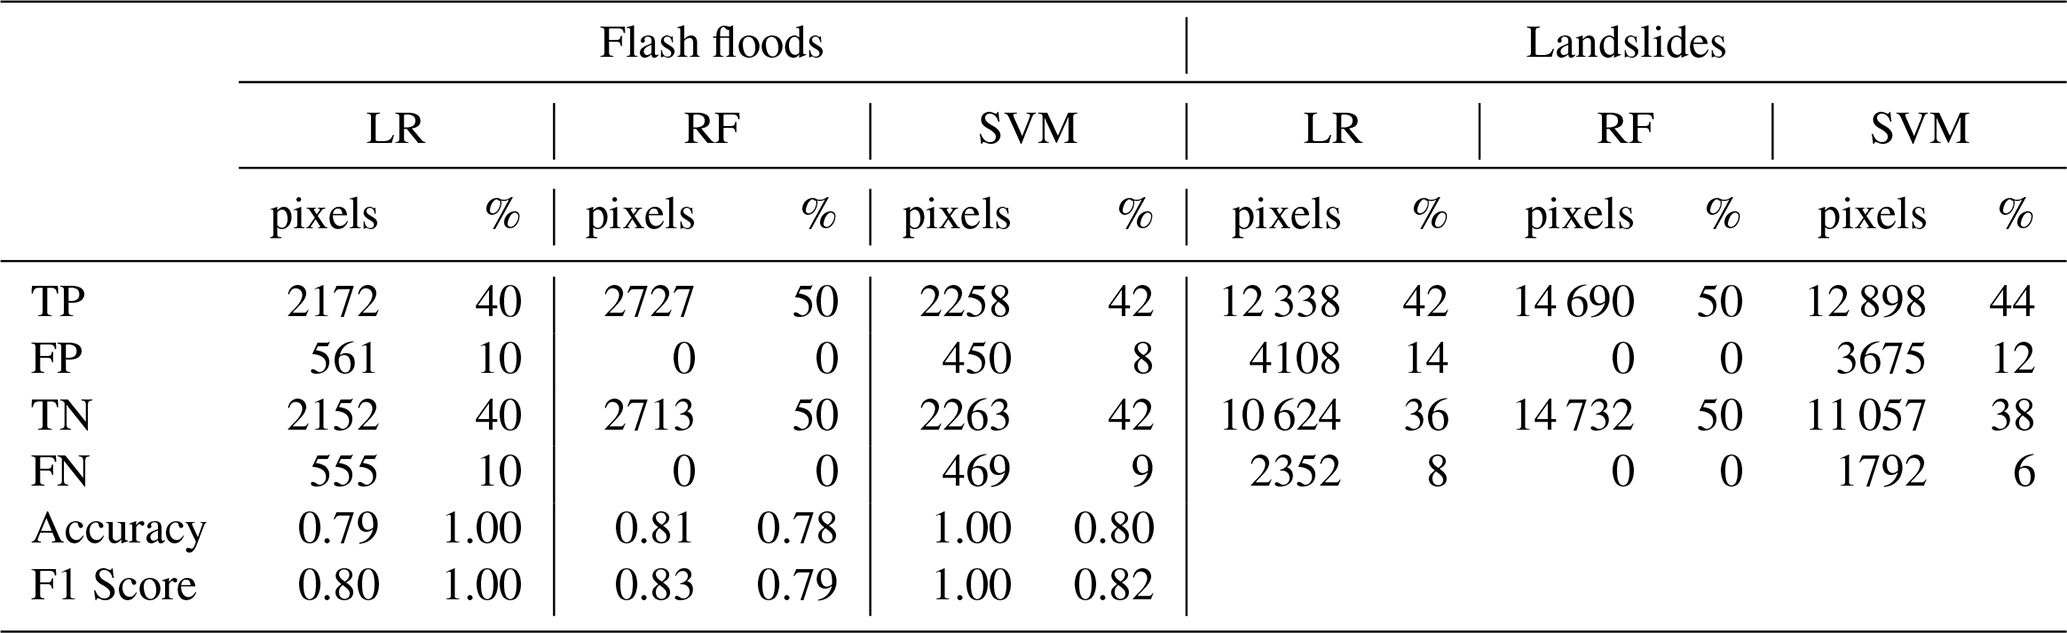
As discussed in Sect. 3.2.2 Hazard Susceptibility Modelling, the ML models were trained using area under the curve (AUC), tested and evaluated using the receiver operating characteristic (ROC) curve, the AUC, the confusion matrix, the accuracy score, and the F1 score. The ROC and the AUC for flash floods and landslides for each of the three ML models are shown in Fig. 13. For both hazards, we observe that the Random Forest (RF) achieved the highest results with an AUC of 0.95 and 0.93 for flash floods and landslides respectively whereas LR showed the poorest results. The confusion matrix which summarizes how many pixels (as defined in the reference dataset) were correctly predicted is shown in Table B2 of the Appendix B for the training dataset and in Table 2 for the testing dataset. The RF, exhibited the best results (flash floods, landslides) with the highest number of TP (593, 3318) and TN (591, 2967), and the lowest number of FP (96, 690) and FN (80, 381), followed by the SVM. The highest accuracy is achieved by the RF with values 0.87 and 0.86 for flash floods and landslides respectively. Similarly, the highest F1 score is attained by the RF with the exact values.
Table 2Confusion matrix and accuracy for each ML model derived for the testing dataset.
The frequency ratios and the hazard susceptibility maps (Figs. 8–12) obtained in this study provide new insights into the spatial patterns and drivers of both flood and landslide hazards in Liguria. In the following discussion, we analyse the performance of the adopted models, the spatial correspondence between flash floods and landslides, and the comparison with regional and continental susceptibility maps. We then address the influence of data completeness and model assumptions, before outlining the main limitations and implications for multi-hazard risk assessment.
5.1 Frequency ratio analysis
As indicated in Fig. 8 lower elevations and gentler slopes, e.g. valleys, had the highest likelihood of flash floods and landslides occurrences which agrees with previous studies on flash floods (Chowdhury, 2024; Elghouat et al., 2024; Pham et al., 2021; Rayamajhi et al., 2025). For landslides, however, the apparent preference, though limited, for gentle slopes is unexpected. This pattern may be partly influenced by the characteristics of the ITALICA landslide database. As noted by the database authors, landslides that took place in remote or uninhabited regions, or for which no institutional or media reports exist, are rarely included. Consequently, the inventory likely overrepresents events on gentler slopes and in lower-elevation areas near infrastructure, while underrepresenting those in steep, remote terrain. As to aspect, the orographic precipitation resulting from the Ligurian Sea partly explains the heavier rainfalls on South facing slopes contributing to an increase in both hazards. Figure 8 showed that flat areas were associated with the highest FR for flash floods, which was also observed in Chowdhury (2024). Similarly to our findings, Mancini et al. (2010) obtained the highest FR for landslides near the roads in Daunia, Italy located in the Apennines while highlighting the inventory bias.
Previous studies on flash floods (Chowdhury, 2024; Elghouat et al., 2024; Rayamajhi et al., 2025) have indicated as well that flood-prone areas exhibited high TWI values (Fig. 9). In line with our findings, Chowdhury (2024) obtained for flash floods the highest FR values for SPI values close to 0. The patterns we observed regarding proximity to rivers have been reported for other flash floods or floods studies too (Elghouat et al., 2024; Pham et al., 2021; Rayamajhi et al., 2025). We expected to obtain high FR values for areas with low NDVI values which correspond to bare soil or areas with limited vegetation and usually experience more frequent landslide and flash floods occurrences.
As pointed out in Fig. 10, the highest FR values are found for artificial soils. For flash floods this can be explained by the limited infiltration capacity whereas for landslides, we expect the human-made changes to topography and loss of vegetation in urban areas to play a bigger role. Indeed, urbanization increases landslide hazard (Johnston et al., 2021). Landslides were unlikely to occur in closed forest confirming that strong root cohesion and vegetation cover enhance slope stability.
5.2 Model performance and framework consistency
The unified framework applied in this study ensured methodological consistency between the analyses of flash floods and landslides, allowing the same set of conditioning factors and modelling procedures to be used for both hazards. All tested models showed good predictive capability, with Random Forest achieving the best overall performance (AUC =0.95, accuracy =87 %, F1 score =87 % for flash floods, and AUC =0.93, accuracy =86 %, and F1 score =86 % for landslides). Furthermore, as summarized in Table 2, the confusion matrix which allows a disaggregated view of the model performance, showed that all models – particularly the Random Forest – had promising results, i.e. high TP and TN while keeping the FP and the FN low. These findings are consistent with other studies that reported Random Forest as the most effective model for predicting the occurrence of flash floods and floods (e.g., Elghouat et al., 2024; Khodaei et al., 2025) and landslides (e.g., Youssef and Pourghasemi, 2021). The similarity in performance between the accuracy and the F1 scores likely arises from the use of the AUC metric for the model calibration. The susceptibility maps Figs. 11 and 12 revealed that the RF method is relatively conservative, identifying a smaller area as highly susceptible (red zone) compared to Logistic Regression (LR) and Support Vector Machine (SVM) models. This suggests that while RF offers superior classification performance, it tends to minimize false positives by restricting the extent of predicted high-susceptibility zones. The high performance achieved for both hazards confirm that the adopted set of conditioning factors can effectively describe both processes. This suggests that the same modelling structure can be successfully applied to different types of hazards, allowing a homogeneous multi-hazard evaluation across the regional scale.
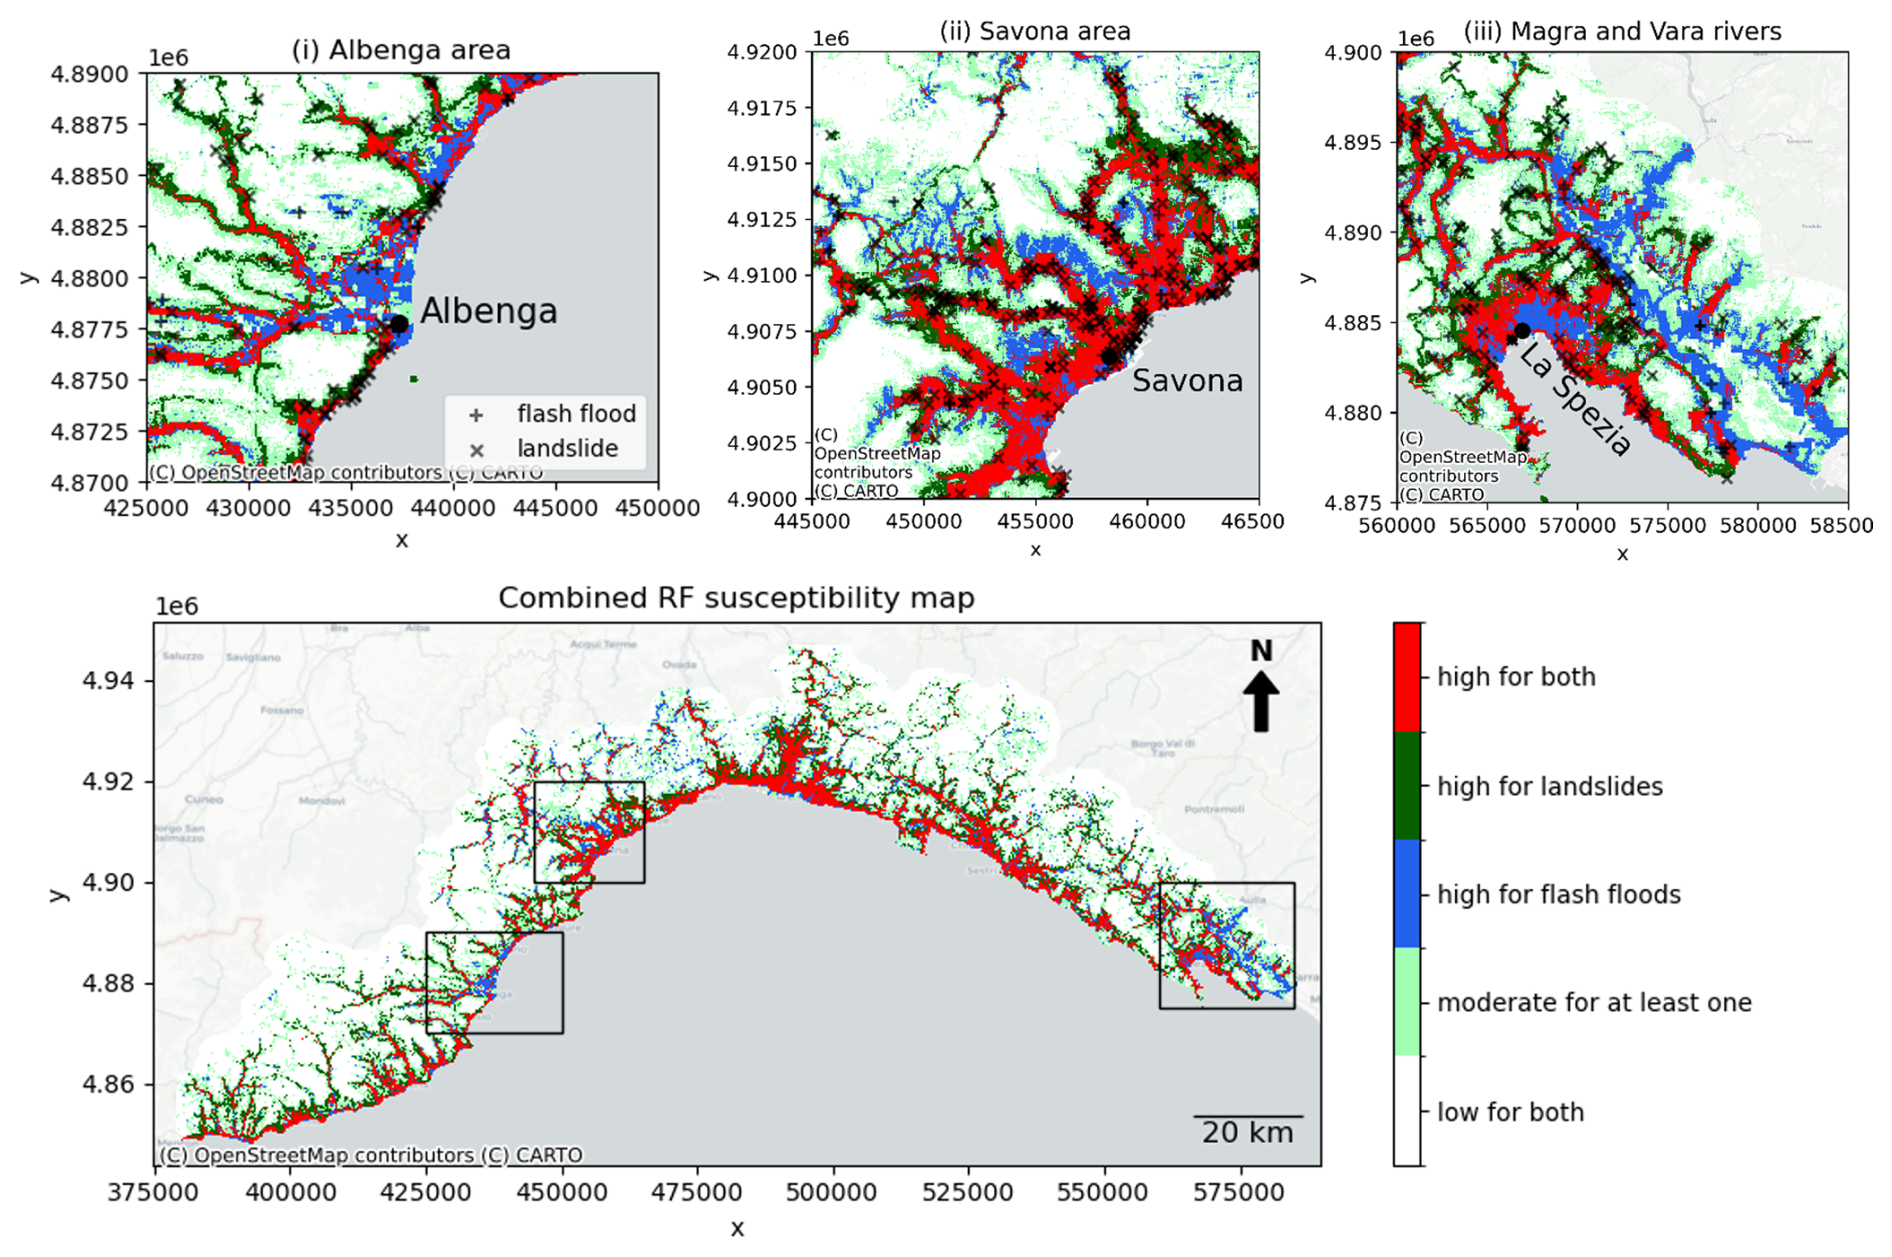
Figure 14Combined Random Forest susceptibility map. Map source: © OpenStreetMap contributors, OpenStreetMap.
5.3 Combined hazard susceptibility analysis
We overlaid the flash flood and landslide RF susceptibility maps into one as shown in Fig. 14 to identify areas susceptible to both. The classification used is found in Table of the Appendix A. There is a large overlap in terms of high susceptibility for both hazards mainly along the coast but also further inland along valleys (see DEM map in Fig. 4). The areas where the susceptibility is high for landslides but not for flash floods (dark green) is more spread out across Liguria as opposed to vice versa where the blue areas are mostly clustered in three areas (from left to right): (i) in the city of Albenga along the Centa River, (ii) close to Savona inland between two valleys, and (iii) along the Magra and Vara rivers including the surrounding urban areas (e.g. La Spezia). The higher precipitation received on the East (Sect. 2 Study Area) and the higher relative historical flash flood occurrences on the East (Fig. 1) can help explain the larger spatial extent of the rightmost blue cluster.
Nevertheless, the spatial susceptibility patterns for both hazards are mostly similar which is crucial to highlight as one hazard may amplify the other (Borga et al., 2014), e.g. a landslide may block a stream elevating the flood hazard. Gill and Malamud (2014) found that floods and landslides both trigger and increase each other's probability, hence, the importance of studying them together.
5.4 Spatial patterns and hazard interconnections
The susceptibility maps in Figs. 11 and 12 show a marked spatial correspondence between flash floods and landslides, mainly along the coastal areas and the main valleys of Liguria. These zones are characterized by steep slopes, low-permeability lithologies and strong anthropogenic pressure, which favour the simultaneous occurrence of both processes. Flash floods tend to be concentrated in low-elevation and urbanized valleys, whereas landslides extend toward the upper slopes and inland sectors. The two processes, although controlled by partly different conditions, share several predisposing factors. This confirms that they should be analysed within an integrated and unified framework. Our methodology, however, does not consider joined occurrence of flash floods and landslides as in e.g. Claassen et al. (2023) for which multi-hazard events are defined as events overlapping spatially with a time lag between their dates of occurrence. Due to the limited spatial scale of flash floods and landslides we expect a limited overlap but a more realistic event footprint could be studied such as slope units for landslides (Woodard et al., 2024) and sub catchments for flash floods (Yin et al., 2023).
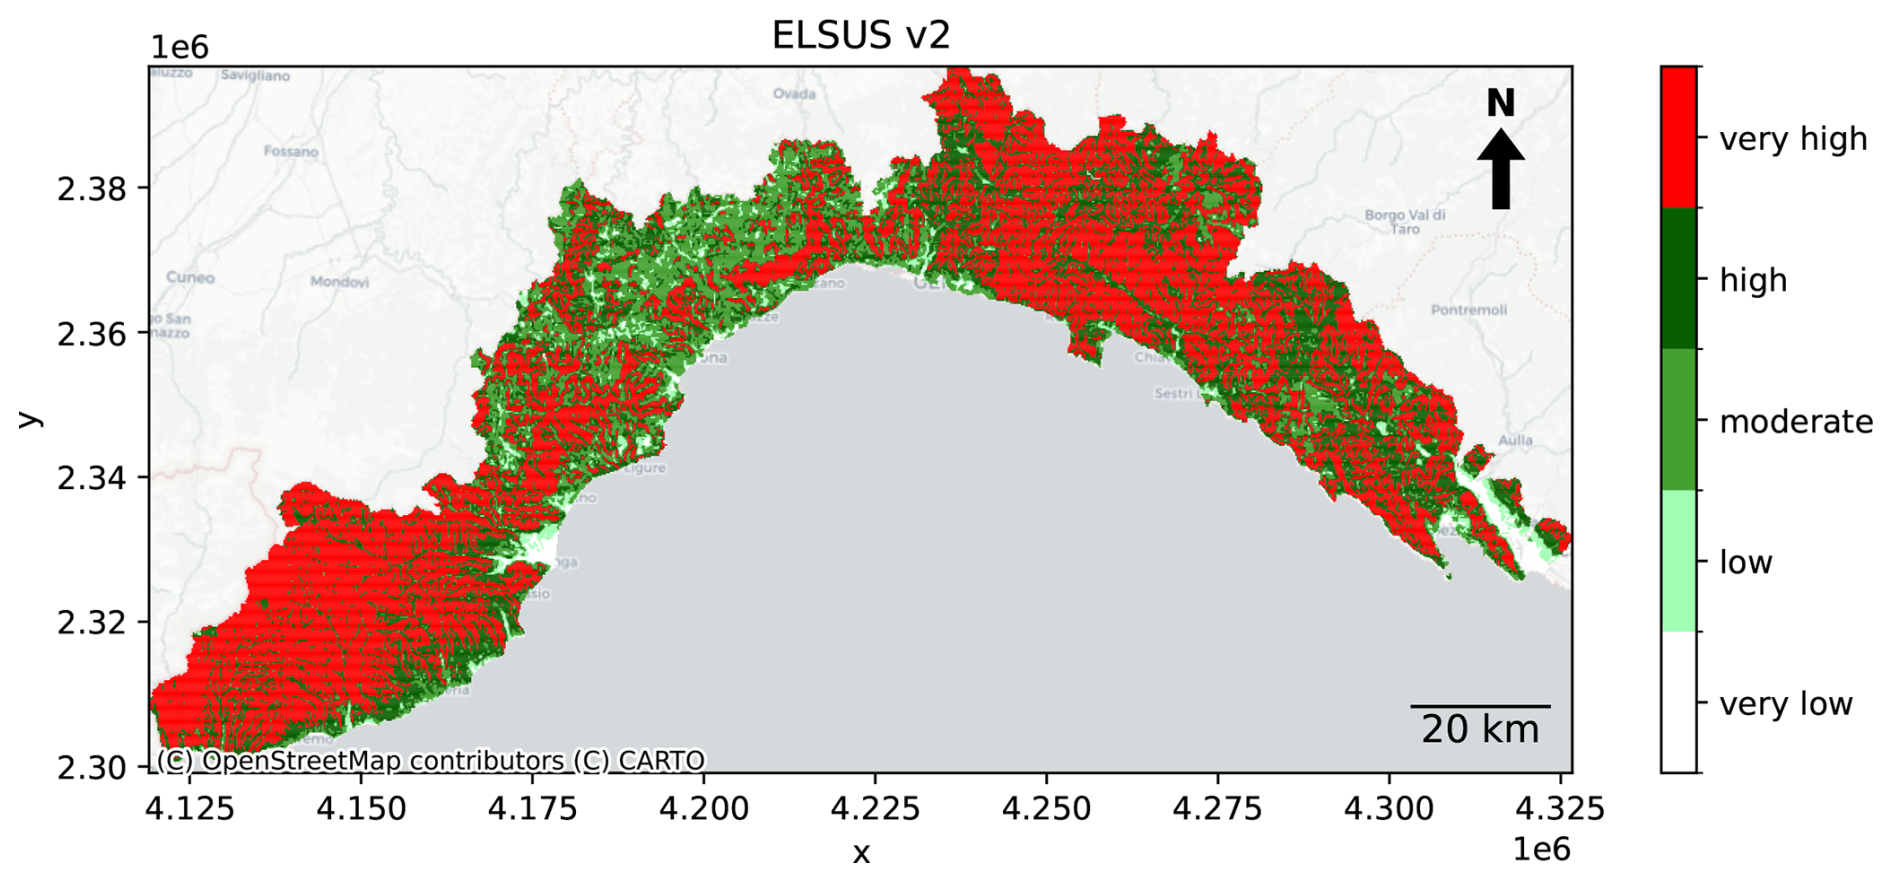
Figure 15Landslide susceptibility map for Liguria according to the European Landslide Susceptibility Map version 2 (ELSUS v2) (Joint Research Centre (JRC), European Commission, 2018; Wilde et al., 2018) original resolution is 200 m. Map source: © OpenStreetMap contributors, OpenStreetMap.
5.5 Comparison with European landslide susceptibility map
The generated Random Forest landslide susceptibility map was compared against the European Landslide Susceptibility Map version 2 (ELSUS v2) (Joint Research Centre (JRC), European Commission, 2018; Wilde et al., 2018) at a 200 m resolution. The ELSUS map was developed using elevation, climatic conditions, slope, sub-surface lithology, and land cover datasets. Compared to European regions, the geohydrological vulnerability of Liguria is particularly high (Faccini et al., 2015). This is evident from the ELSUS map, in which most of the region is classified as having high or very high susceptibility. The Western section nearly completely has a high susceptibility. For the coastline, landslide susceptibility is lower than in the here generated maps. Possibly, for the ELSUS map more emphasis was paid to the slope and elevation that are both lower in these areas, leading to a lower landslide susceptibility.
Nevertheless, because the ELSUS dataset provides continental-scale classes, the spatial granularity for small regions like Liguria is limited. Although our study also uses a globally applicable framework, by focusing on a specific region, a more detailed and locally representative susceptibility map could be generated.
5.6 Role of inventories and data completeness in framework transferability
The ML framework is globally applicable; however, the accuracy of the generated susceptibility maps remains highly dependent on the completeness of hazard inventories. In the Liguria region, the frequency of occurrence of events is relatively high, and records are generally well documented. Moreover, the inventory prepared for this study relied on multiple sources to increase the coverage in space and time partially minimizing the spatial bias (Bornaetxea et al., 2023). Nevertheless, biases remain in the spatial distribution of recorded events with more observations near roads and in lower-elevation areas, reflecting the greater accessibility and population density in these zones. As a consequence, the susceptibilities are potentially less reliable for remote areas. The influence of the spatial bias could be explored by removing part of the inventory contributing to it and assessing the difference in susceptibility outcomes (Steger et al., 2017).
In addition, the framework has been applied and trained on the full period of data availability at once (only excluding scattered events from before 1940), while especially land use changes such as urbanization may have affected the landslide susceptibility in the region over time. To verify that the long inventory does not introduce temporal inconsistencies that may affect our conclusion, we derived new susceptibility maps for both hazards using only the more recent events (2000–2024) (refer to Fig. 3). We found no significant changes in the susceptibility maps with more limited changes for landslides than for flash floods (figures not shown).
Previous studies (Free et al., 2022; Modrick and Georgakakos, 2015; Uwihirwe et al., 2022) have shown that in many other, especially remote, regions of the world the number of recorded events is substantially lower. Global inventories can fill some gaps but are often coarse, incomplete or inconsistent in spatial and temporal coverage. This will affect the training of the ML algorithm and its accuracy, limiting the transfer of the framework to other data rich regions, or the transfer of the trained framework to regions with similar terrain, meteorological conditions, land cover, soil types, and land use including degree of urbanization. To overcome the latter, transfer learning for landslides susceptibility modelling in dissimilar areas was applied by Wang et al. (2022) by using Domain Adaptation (DA) in which a latent feature space is defined where the source and target areas have the same distribution. In particular, we expect physics-informed predictors like TWI, SPI, slope, curvature to be more easily transferable (after aligning their distributions) to other regions. On the other hand, elevation, proximity to roads, proximity to rivers, NDVI, land cover, and lithology are region dependent and could be transferred to similar regions using e.g. Case-Based Reasoning (CBR) (Wang et al., 2022). Alternatively, they may be harmonized to represent properties rather than classes e.g. grain size instead of lithology classes. Aspect on its own is not an informative variable but could be rederived into Windward-Leeward Index (WLI) that incorporates the influence of orographic precipitation. Still, there may be other aspects like wetness, seasonality and variability of precipitation that are not similar between regions affecting the accuracy of the transferred framework.
For the current study, the added value of extending the national inventories (AVI and ITALICA) with a more local data (ARPAL), supported by the use of Large Language Models to enable automatic information extraction is highlighted. This approach worked for Liguria, but relied on the available institutional event reports. In more data-sparse regions, collecting event data would be more difficult, but LLMs could potentially be applied for mining newspapers, social media and global disaster report archives.
The exact definition of flash floods influences the number and specifications of the events considered in the final inventory and hence the susceptibility maps. We note that our definition of flash floods for the AVI database is more restrictive than that of Vennari et al. (2016) which focused on Campania (to the South but also extending from the Sea to the Apennine) where they assumed all floods in the AVI inventory to be flash floods except the ones in alluvial plains. In our case, we explicitly used the description and the precipitation duration (if available) to select flash flood events, consequently 1149 entries with dates and without duplicates were excluded.
5.7 Framework applications
In this study all conditioning factors were static. Including dynamic parameters would enhance the capacity of the models to capture transient conditions and could potentially even allow the framework to update susceptibility in near real time. Moreover the framework holds the potential to be applied in early warning applications, as we previously explored in Uwihirwe et al. (2022), using high-resolution forecasted, now-casted precipitation (short-term). The same holds for future climate change assessments using high resolution precipitation projections from convection-permitting climate models (Zander et al., 2022). The framework would anyhow benefit from higher resolution precipitation products as these capture better the effect of the high spatial variability in heterogeneous terrain (Lee et al., 2022).
By integrating dynamic rainfall information, the framework could further support early warning applications through the definition of rainfall-triggering thresholds for both landslides and flash floods. Such thresholds, defined in a deterministic or probabilistic manner, could be coupled with the susceptibility component to provide time-dependent hazard estimates during forecasted precipitation events.
Finally, the hazard maps could be adapted to account for projected changes in rainfall regimes. By modifying the frequency or magnitude of triggering precipitation events in line with climate change scenarios, the framework would allow assessment of potential changes in landslide and flash flood hazard under evolving climatic conditions. The detailed implementation of these dynamic extensions was considered beyond the scope of the current study but represents a logical direction for future research.
While the present study focuses on relative susceptibility, the proposed modelling structure can be extended towards hazard assessment by incorporating information on the probability of occurrence of landslides and flash floods. In this way, the spatial susceptibility patterns derived here could be translated into estimates of event probability over a given time horizon (Wu and Yeh, 2020).
5.8 Limitations and implications
Although the proposed approach produced promising results, several limitations should be acknowledged. The current framework relies on static conditioning factors and does not yet incorporate dynamic variables such as rainfall, soil moisture, or land-use change. Applying the framework for longer-term climate projections will be more complex as, next to the climate change induced rainfall changes, the landscape and vegetation will also be influenced by anthropogenic forces which are even more uncertain. This could potentially make soils more erodible, increase the impermeable surface or even further reduce the network of natural waterways (Stalhandske et al., 2024) and thus require changes in the static maps underlying the framework.
Here the framework was applied in a multi-hazard setting, assessing both landslide and flash flood susceptibility, unfortunately, the inventories for both hazards were not equally sized (526 for flash floods and 2412 events for landslides). As the susceptibility mapping was done for both hazards independently this imbalance between hazards may not have affected the accuracy that much. Yet, the imbalance of the events in the inventory over time, with an increased number of events for later periods (Fig. 3), suggests that there may have been many non-included events in the past. After training this imbalance may reduce the number of false-positive events, as the model's ability to distinguish non-events becomes stronger. This also requires an analysis of historic changes in the landscape. In the past a more natural system with possibly more vegetation and less infrastructure could have been less susceptible to landslides and flash floods, thus the imbalance may also have a natural cause.
The fewer occurrences of events – whether landslides or flash floods – with respect to non-events lead to a class imbalance which can cause bias in the ML model by predicting the event (majority class) more often. One approach to handle this imbalance is to under sample the majority class and/or oversample the minority class, the latter is the more common in hazard mapping. A popular method is the synthetic minority oversampling technique (SMOTE) which for each event finds the k nearest neighbours and generates a random event at the chosen neighbour creating new events along the segment between the original event and the chosen neighbour. Han and Semnani (2025), who confirm the challenges of addressing class imbalance in landslides, found the best overall results for gridded hyperspace even sampling with a variant of SMOTE. However, this method can potentially create physically unrealistic events. Another approach is to apply class weights or cost sensitive weighting (Chen et al., 2004) in which the model is penalized for misclassifying the minority class. This means that by balancing the classes, a trade-off occurs: an increase of TP to the detriment of creating more FP. As previously indicated, our confusion matrix results are quite positive, limiting but not removing the need of applying a trade-off which could be studied in future work.
Despite these limitations, the results demonstrate the potential of the proposed framework for regional multi-hazard susceptibility assessment.
In this study a globally applicable Machine Learning (ML) Framework for landslide and flash flood susceptibility mapping was applied and evaluated in the Italian region Liguria. The Framework supports multi-hazard analysis by enabling a one-to-one comparison indicating the areas most susceptible to either one or both hazard types. The resulting maps can help to identify where intervention or adaptation is most needed.
The framework was tested for Liguria, located in north-western Italy, which provided an ideal case study due to its high susceptibility to both flash floods and landslides. The application of the ML framework resulted in accuracies and F1 scores of 0.87 and 0.86, and AUC of 0.95 and 0.93 for flash flood and landslide prediction, respectively. The general pattern in the resulting susceptibility maps is comparable, although flash floods most often occur in river valleys and urban areas whereas landslide susceptibility is also high in the upper courses of river catchments along ephemeral streams. In Liguria, very high susceptibility occurs along the coastline, where many villages and cities are located. The proposed framework can be applied in any region of the world, although the accuracy remains dependent on the completeness and quality of local event inventories. This underlines the importance of continuously improving the documentation and reporting of hazardous events to support reliable and consistent multi-hazard assessments.
Beyond its application in Liguria, the unified framework provides a practical foundation for regional-scale risk management. Its ability to integrate different hazard types under a consistent modelling structure enhances the comparability of results and supports the development of integrated mitigation strategies. Future work should focus on incorporating dynamic variables such as rainfall change, as well as evaluating model performance under changing climate conditions.
Table A1Jenks breaks used for the flash flood and landslide susceptibility maps for the three ML algorithms.
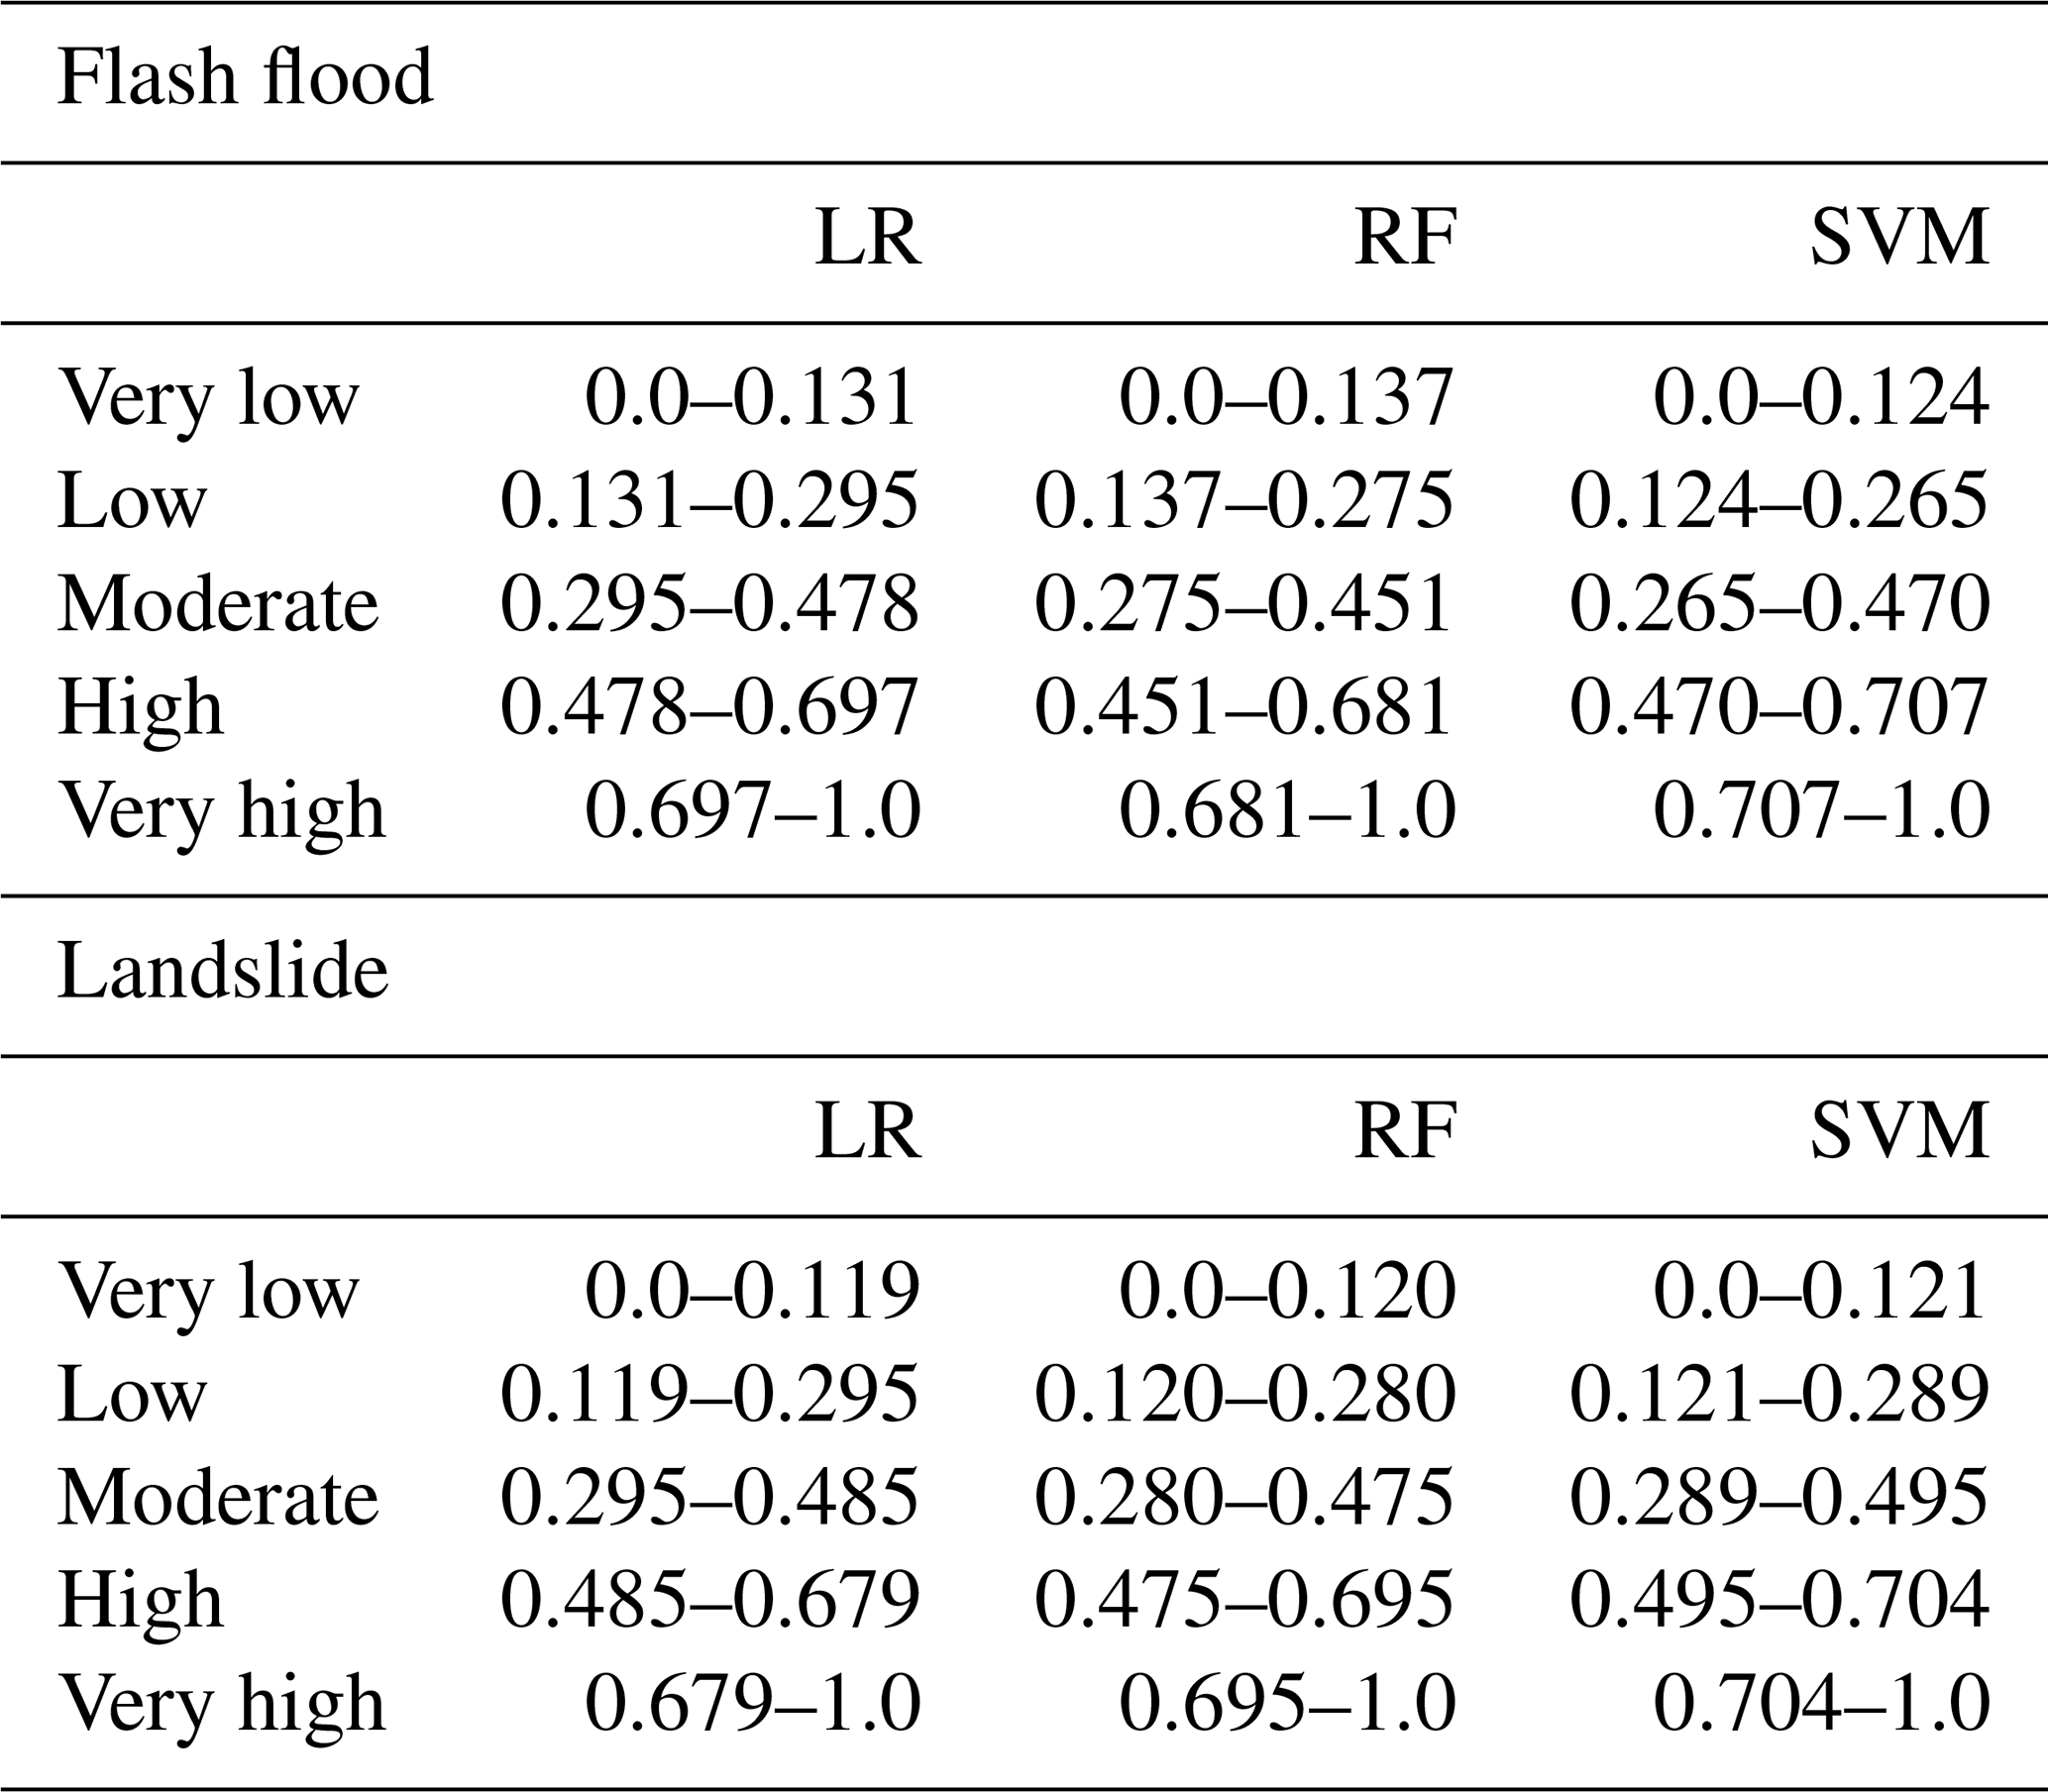
Table A2Classification used in the overlay of the RF flash flood and landslide susceptibility map.
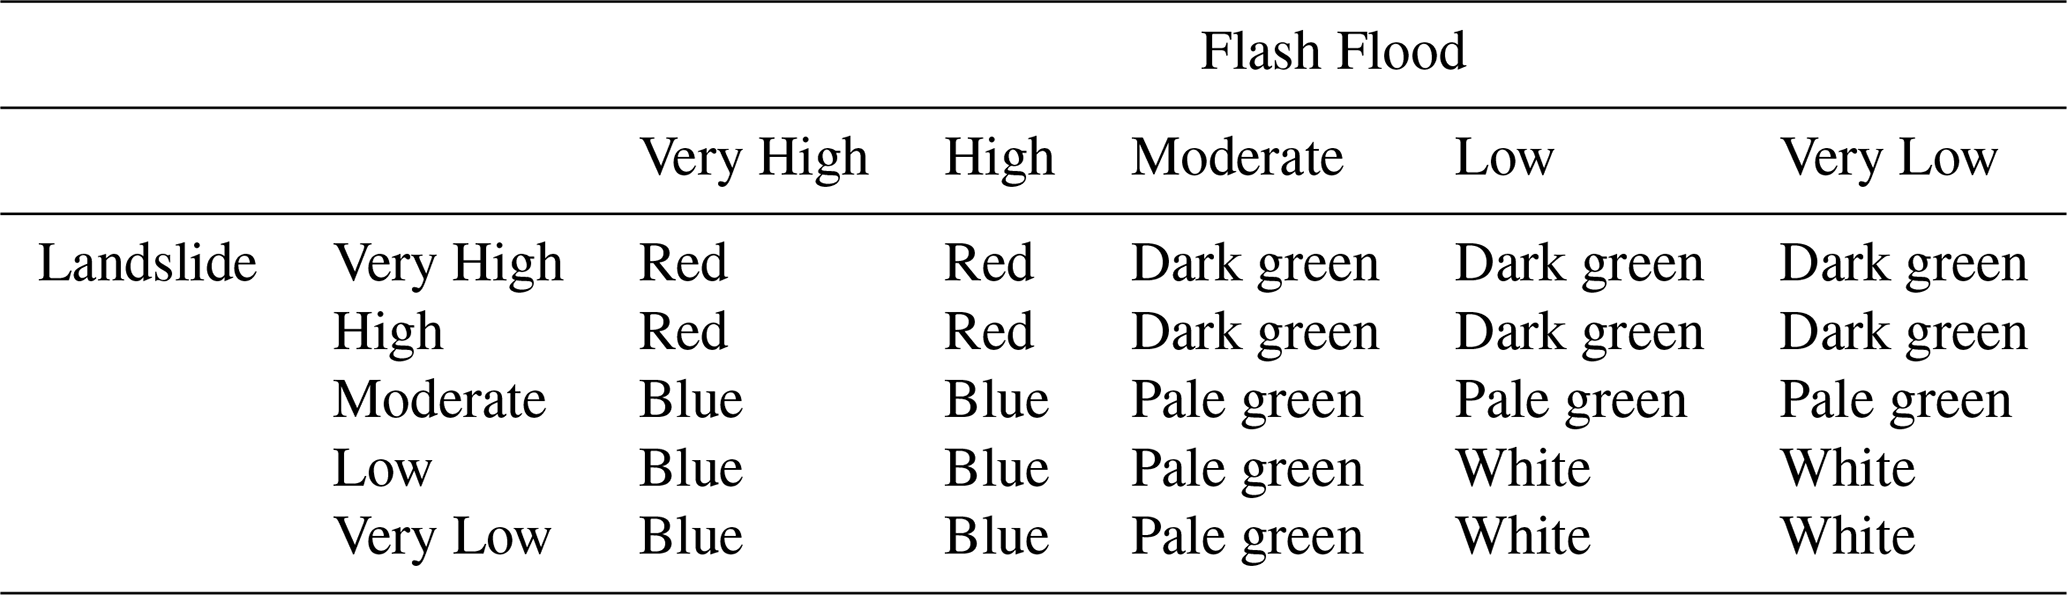
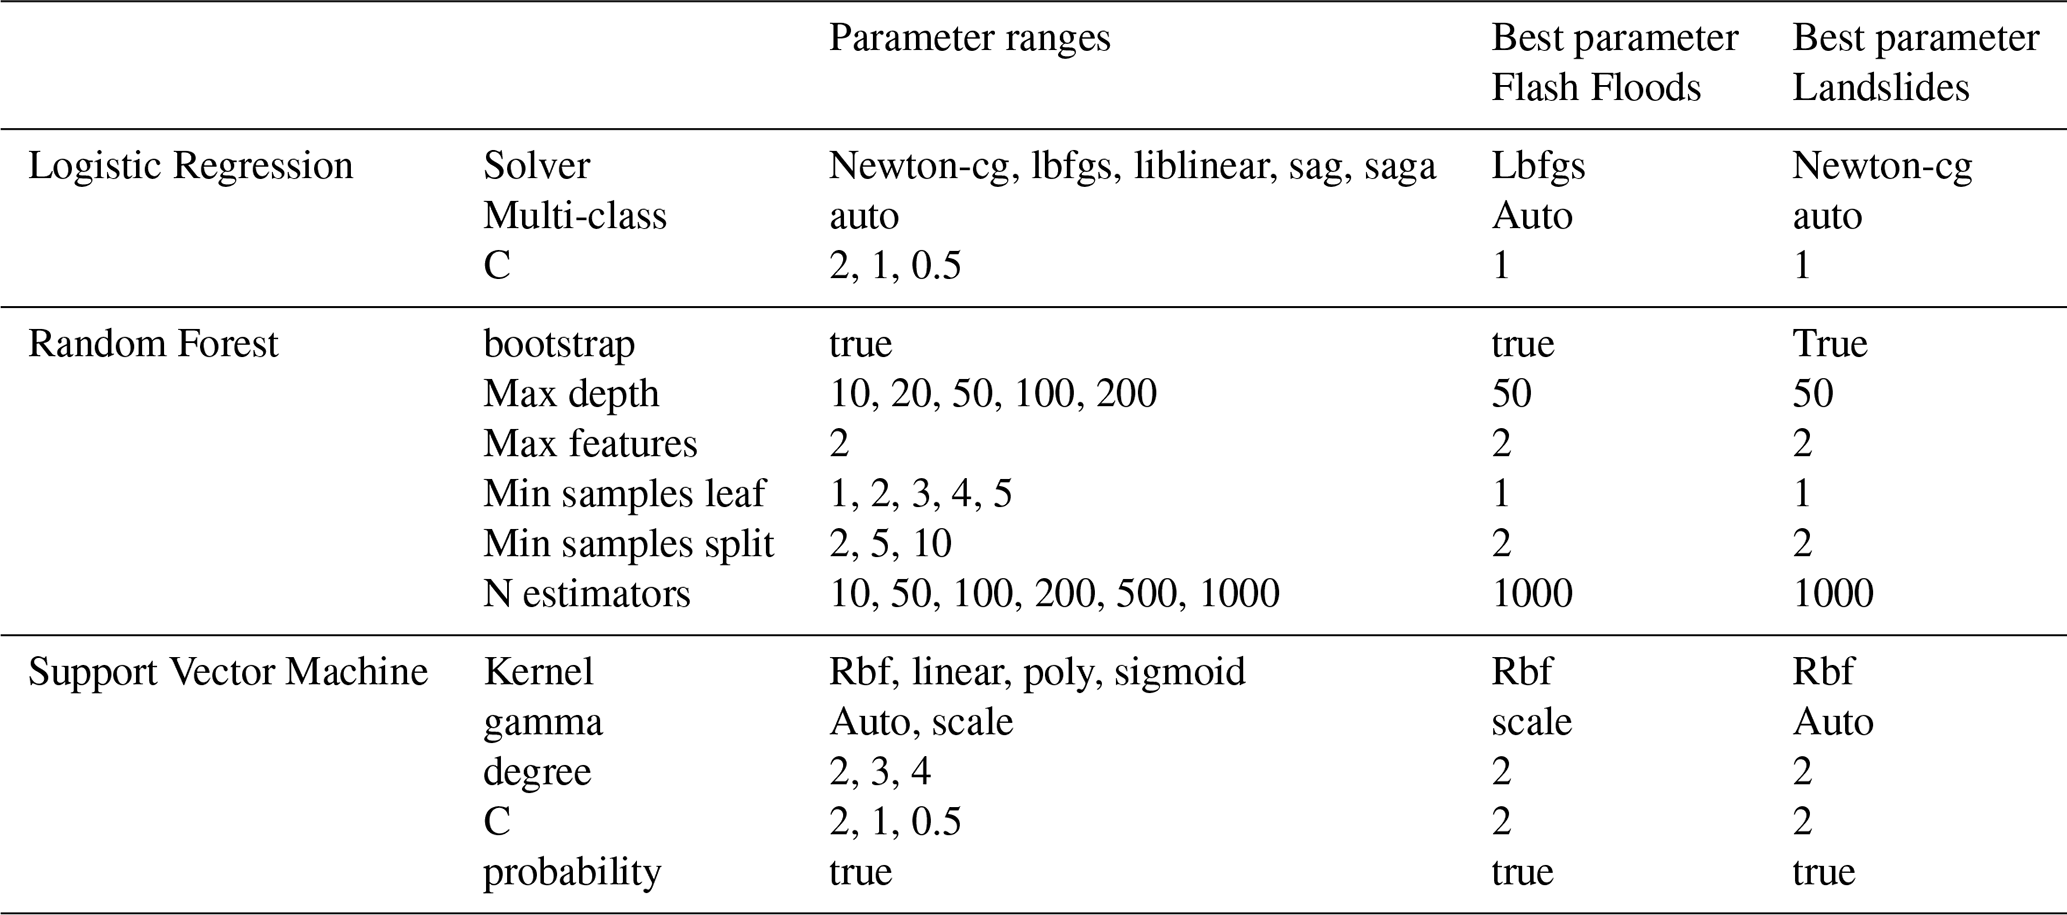
Table B2Pixel based confusion matrix and accuracy for each ML model derived for the training dataset.
The input data including the inventories and the code used to create the susceptibility maps in this study are available at Zenodo: (Gwee et al., 2026) https://doi.org/10.5281/zenodo.19726304 (fork of https://github.com/openearth/lhat/tree/main, last access: April 2026).
AR: conceptualization, data curation, formal analysis, visualization and writing. CG: conceptualization and data curation. MM: conceptualization, funding acquisition, supervision, investigation, methodology and writing. FSW: conceptualization, funding acquisition, supervision, methodology and writing.
The contact author has declared that none of the authors has any competing interests.
Publisher's note: Copernicus Publications remains neutral with regard to jurisdictional claims made in the text, published maps, institutional affiliations, or any other geographical representation in this paper. The authors bear the ultimate responsibility for providing appropriate place names. Views expressed in the text are those of the authors and do not necessarily reflect the views of the publisher.
We thank the editor and reviewers for their constructive feedback which enabled us to greatly improve this manuscript. The authors thank Jing Deng for running the LLM that enabled the extension of the flash flood and landslide inventories.
This research has been supported by the Horizon Europe Framework Programme, Horizon Europe Innovative Europe (grant no. 101074075) and supported by Deltares' strategic research funds (SITO-IS Moonshot 2: Safer from flooding).
This paper was edited by Timothy Tiggeloven and reviewed by Davide Mauro Ferrario and one anonymous referee.
Adnan, M. S. G., White, C., Perugini, E., Jensen, E. H., Barnie, T., Castillo, N., Arosio, M., Tubaldi, E., Roberts, M. J., Gaetani, M., Cha, Y., Weiland, F. S., Martinelli, M., and Douglas, J.: A comprehensive framework for quantifying diverse multi-hazard interactions, ESS Open Archive, https://doi.org/10.22541/essoar.174526074.45009802/v2, 8 May 2025.
Agenzia regionale per la protezione dell'ambiente ligure: Rapporti di eventi significativi, Agenzia regionale per la protezione dell'ambiente ligure, Genova, Agenzia regionale per la protezione dell’ambiente ligure (ARPAL) https://www.arpal.liguria.it/tematiche/meteo/pubblicazioni-bis/rapporti-di-eventi-significativi.html (last access: 26 May 2025), 2024.
Agrillo, G. and Bonati, V.: Atlante climatico della Liguria, ARPAL, https://www.arpal.liguria.it/contenuti_statici/clima/atlante/Atlante_climatico_della_Liguria.pdf (last access: 26 May 2025), 2013.
Ahmed, M., Tanyas, H., Huser, R., Dahal, A., Titti, G., Borgatti, L., Francioni, M., and Lombardo, L.: Dynamic rainfall-induced landslide susceptibility: A step towards a unified forecasting system, Int. J. Appl. Earth Obs., 125, 103593, https://doi.org/10.1016/j.jag.2023.103593, 2023.
Alarifi, S. S., Abdelkareem, M., Abdalla, F., and Alotaibi, M.: Flash Flood Hazard Mapping Using Remote Sensing and GIS Techniques in Southwestern Saudi Arabia, Sustainability, 14, 14145, https://doi.org/10.3390/su142114145, 2022.
Amponsah, W., Ayral, P.-A., Boudevillain, B., Bouvier, C., Braud, I., Brunet, P., Delrieu, G., Didon-Lescot, J.-F., Gaume, E., Lebouc, L., Marchi, L., Marra, F., Morin, E., Nord, G., Payrastre, O., Zoccatelli, D., and Borga, M.: Integrated high-resolution dataset of high-intensity European and Mediterranean flash floods, Earth Syst. Sci. Data, 10, 1783–1794, https://doi.org/10.5194/essd-10-1783-2018, 2018.
Anon: The EM-DAT Emergency Events Database Archive, Université Catholique de Louvain, https://doi.org/10.14428/dvn/i0ltph, 2024.
Beven, K. J. and Kirkby, M. J.: A physically based, variable contributing area model of basin hydrology / Un modèle à base physique de zone d'appel variable de l'hydrologie du bassin versant, Hydrol. Sci. B., 24, 43–69, https://doi.org/10.1080/02626667909491834, 1979.
Borga, M., Stoffel, M., Marchi, L., Marra, F., and Jakob, M.: Hydrogeomorphic response to extreme rainfall in headwater systems: Flash floods and debris flows, J. Hydrol., 518, 194–205, https://doi.org/10.1016/j.jhydrol.2014.05.022, 2014.
Bornaetxea, T., Remondo, J., Bonachea, J., and Valenzuela, P.: Exploring available landslide inventories for susceptibility analysis in Gipuzkoa province (Spain), Nat. Hazards, 118, 2513–2542, https://doi.org/10.1007/s11069-023-06103-w, 2023.
Breiman, L.: Random Forests, Mach. Learn., 45, 5–32, https://doi.org/10.1023/A:1010933404324, 2001.
Bui, D. T., Tsangaratos, P., Ngo, P.-T. T., Pham, T. D., and Pham, B. T.: Flash flood susceptibility modeling using an optimized fuzzy rule based feature selection technique and tree based ensemble methods, Sci. Total Environ., 668, 1038–1054, https://doi.org/10.1016/j.scitotenv.2019.02.422, 2019.
Bundesanstalt für Geowissenschaften und Rohstoffe (BGR), & United Nations Educational, Scientific and Cultural Organization (UNESCO): International Hydrogeological Map of Europe 1:1 500 000 (v1.2), https://metadata.europe-geology.eu/record/basic/341255A9-180F-4BF9-B96F-D085339EA86D (last access: 26 May 2026), 2019.
Cassola, F., Ferrari, F., Mazzino, A., and Miglietta, M. M.: The role of the sea on the flash floods events over Liguria (northwestern Italy), Geophys. Res. Lett., 43, 3534–3542, https://doi.org/10.1002/2016GL068265, 2016.
Chen, C., Liaw, A., and Breiman, L.: Using Random Forest to Learn Imbalanced Data, University of California, Berkeley, 2004.
Chowdhury, M. S.: Flash flood susceptibility mapping of north-east depression of Bangladesh using different GIS based bivariate statistical models, Watershed Ecology and the Environment, 6, 26–40, https://doi.org/10.1016/j.wsee.2023.12.002, 2024.
Cignetti, M., Godone, D., and Giordan, D.: Shallow landslide susceptibility, Rupinaro catchment, Liguria (northwestern Italy), J. Maps, 15, 333–345, https://doi.org/10.1080/17445647.2019.1593252, 2019.
Claassen, J. N., Ward, P. J., Daniell, J., Koks, E. E., Tiggeloven, T., and De Ruiter, M. C.: A new method to compile global multi-hazard event sets, Sci. Rep., 13, 13808, https://doi.org/10.1038/s41598-023-40400-5, 2023.
Cortes, C. and Vapnik, V.: Support-Vector Networks, Mach. Learn., 20, 273–297, https://doi.org/10.1023/A:1022627411411, 1995.
Cox, D. R.: The Regression Analysis of Binary Sequences, J. Roy. Stat. Soc. B, 20, 215–232, https://doi.org/10.1111/j.2517-6161.1958.tb00292.x, 1958.
Elghouat, A., Algouti, A., Algouti, A., Baid, S., Ezzahzi, S., Kabili, S., and Agli, S.: Integrated approaches for flash flood susceptibility mapping: spatial modeling and comparative analysis of statistical and machine learning models. A case study of the Rheraya watershed, Morocco, J. Water Clim. Change, 15, 3624–3646, https://doi.org/10.2166/wcc.2024.726, 2024.
European Commission – DG ENTR: EU-DEM – Digital Elevation Model over Europe (1), https://ec.europa.eu/eurostat/web/gisco/geodata/digital-elevation-model/eu-dem (last access: 26 May 2026), 2012.
Faccini, F., Luino, F., Sacchini, A., Turconi, L., and De Graff, J. V.: Geohydrological hazards and urban development in the Mediterranean area: an example from Genoa (Liguria, Italy), Nat. Hazards Earth Syst. Sci., 15, 2631–2652, https://doi.org/10.5194/nhess-15-2631-2015, 2015.
Fedato, E., Fubelli, G., Kurilla, L., and Tiranti, D.: Predisposing Factors for Shallow Landslides in Alpine and Hilly/Apennines Environments: A Case Study from Piemonte, Italy, Geosciences, 13, 252, https://doi.org/10.3390/geosciences13080252, 2023.
Free, R., van den Homberg, M., Sperna Weiland, F., Teklesadik, A., Melillo, M., and Bogaard, T.: Extending a ML impact-based forecasting model for typhoons in the Philippines with a rainfall threshold for consecutive landslide events, EGU General Assembly 2022, Vienna, Austria, 23–27 May 2022, EGU22-10474, https://doi.org/10.5194/egusphere-egu22-10474, 2022.
Funk, C., Peterson, P., Landsfeld, M., Pedreros, D., Verdin, J., Shukla, S., Husak, G., Rowland, J., Harrison, L., Hoell, A., and Michaelsen, J.: The climate hazards infrared precipitation with stations – a new environmental record for monitoring extremes, Sci. Data, 2, 150066, https://doi.org/10.1038/sdata.2015.66, 2015.
Gatto, A., Clò, S., Martellozzo, F., and Segoni, S.: Tracking a Decade of Hydrogeological Emergencies in Italian Municipalities, Data, 8, 151, https://doi.org/10.3390/data8100151, 2023.
Gaume, E., Bain, V., Bernardara, P., Newinger, O., Barbuc, M., Bateman, A., Blaškovičová, L., Blöschl, G., Borga, M., Dumitrescu, A., Daliakopoulos, I., Garcia, J., Irimescu, A., Kohnova, S., Koutroulis, A., Marchi, L., Matreata, S., Medina, V., Preciso, E., Sempere-Torres, D., Stancalie, G., Szolgay, J., Tsanis, I., Velasco, D., and Viglione, A.: A compilation of data on European flash floods, J. Hydrol., 367, 70–78, https://doi.org/10.1016/j.jhydrol.2008.12.028, 2009.
Giarola, A., Schoorl, J. M., Baartman, J. E. M., Bordoni, M., Tarolli, P., Zucca, F., Heckmann, T., and Meisina, C.: Exploiting the land use to predict shallow landslide susceptibility: A probabilistic implementation of LAPSUS-LS, Catena, 246, 108437, https://doi.org/10.1016/j.catena.2024.108437, 2024.
Gill, J. C. and Malamud, B. D.: Reviewing and visualizing the interactions of natural hazards: Interactions of Natural Hazards, Rev. Geophys., 52, 680–722, https://doi.org/10.1002/2013RG000445, 2014.
Gruppo Nazionale per la Difesa dalle Catastrofi Idrogeologiche: Progetto AVI, https://avi.gndci.cnr.it/ (last access: 26 May 2026), 1994.
Han, Y. and Semnani, S. J.: Integration of Physics-Based and Data-Driven Approaches for Landslide Susceptibility Assessment, Num. Anal. Meth. Geomechanics, 49, 3060–3097, https://doi.org/10.1002/nag.4016, 2025.
He, F., Liu, S., Mo, X., and Wang, Z.: Interpretable flash flood susceptibility mapping in Yarlung Tsangpo River Basin using H2O Auto-ML, Sci. Rep., 15, 1702, https://doi.org/10.1038/s41598-024-84655-y, 2025.
Hersbach, H., Bell, B., Berrisford, P., Hirahara, S., Horányi, A., Muñoz-Sabater, J., Nicolas, J., Peubey, C., Radu, R., Schepers, D., Simmons, A., Soci, C., Abdalla, S., Abellan, X., Balsamo, G., Bechtold, P., Biavati, G., Bidlot, J., Bonavita, M., De Chiara, G., Dahlgren, P., Dee, D., Diamantakis, M., Dragani, R., Flemming, J., Forbes, R., Fuentes, M., Geer, A., Haimberger, L., Healy, S., Hogan, R. J., Hólm, E., Janisková, M., Keeley, S., Laloyaux, P., Lopez, P., Lupu, C., Radnoti, G., De Rosnay, P., Rozum, I., Vamborg, F., Villaume, S., and Thépaut, J.: The ERA5 global reanalysis, Q. J. Roy. Meteor. Soc., 146, 1999–2049, https://doi.org/10.1002/qj.3803, 2020.
Hochrainer-Stigler, S., Šakić Trogrlić, R., Reiter, K., Ward, P. J., De Ruiter, M. C., Duncan, M. J., Torresan, S., Ciurean, R., Mysiak, J., Stuparu, D., and Gottardo, S.: Toward a framework for systemic multi-hazard and multi-risk assessment and management, iScience, 26, 106736, https://doi.org/10.1016/j.isci.2023.106736, 2023.
Huffman, G. J., Bolvin, D. T., Braithwaite, D., Hsu, K.-L., Joyce, R. J., Kidd, C., Nelkin, E. J., Sorooshian, S., Stocker, E. F., Tan, J., Wolff, D. B., and Xie, P.: Integrated Multi-satellite Retrievals for the Global Precipitation Measurement (GPM) Mission (IMERG), in: Satellite Precipitation Measurement, vol. 67, edited by: Levizzani, V., Kidd, C., Kirschbaum, D. B., Kummerow, C. D., Nakamura, K., and Turk, F. J., Springer International Publishing, Cham, 343–353, https://doi.org/10.1007/978-3-030-24568-9_19, 2020.
Hurtado-Pidal, J., Acero Triana, J. S., Aguayo, M., Link, O., Valencia, B. G., Espitia-Sarmiento, E., and Conicelli, B.: Is forest location more important than forest fragmentation for flood regulation?, Ecol. Eng., 183, 106764, https://doi.org/10.1016/j.ecoleng.2022.106764, 2022.
Jenks, G. F.: The Data Model Concept in Statistical Mapping, International Yearbook of Cartography, 7, 186–190, 1967.
Johnston, E. C., Davenport, F. V., Wang, L., Caers, J. K., Muthukrishnan, S., Burke, M., and Diffenbaugh, N. S.: Quantifying the Effect of Precipitation on Landslide Hazard in Urbanized and Non-Urbanized Areas, Geophys. Res. Lett., 48, e2021GL094038, https://doi.org/10.1029/2021GL094038, 2021.
Joint Research Centre (JRC), European Commission: European Landslide Susceptibility Map (ELSUS) (2), https://doi.org/10.1080/17445647.2018.1432511, 2018.
Joseph, V. R.: Optimal ratio for data splitting, Statistical Analysis, 15, 531–538, https://doi.org/10.1002/sam.11583, 2022.
Khodaei, H., Nasiri Saleh, F., Nobakht Dalir, A., and Zarei, E.: Future flood susceptibility mapping under climate and land use change, Sci. Rep., 15, 12394, https://doi.org/10.1038/s41598-025-97008-0, 2025.
Lanza, S. G.: Flood hazard threat on cultural heritage in the town of Genoa (Italy), J. Cult. Herit., 4, 159–167, https://doi.org/10.1016/S1296-2074(03)00042-6, 2003.
Lee, J.-J., Song, M.-S., Yun, H.-S., and Yum, S.-G.: Dynamic landslide susceptibility analysis that combines rainfall period, accumulated rainfall, and geospatial information, Sci. Rep., 12, 18429, https://doi.org/10.1038/s41598-022-21795-z, 2022.
Llasat, M. C.: Floods evolution in the Mediterranean region in a context of climate and environmental change, CIG, 47, 13–32, https://doi.org/10.18172/cig.4897, 2021.
Luu, C., Ha, H., Bui, Q. D., Luong, N.-D., Khuc, D. T., Vu, H., and Nguyen, D. Q.: Flash flood and landslide susceptibility analysis for a mountainous roadway in Vietnam using spatial modeling, Quaternary Science Advances, 11, 100083, https://doi.org/10.1016/j.qsa.2023.100083, 2023.
Mancini, F., Ceppi, C., and Ritrovato, G.: GIS and statistical analysis for landslide susceptibility mapping in the Daunia area, Italy, Nat. Hazards Earth Syst. Sci., 10, 1851–1864, https://doi.org/10.5194/nhess-10-1851-2010, 2010.
Mazzoglio, P., Viglione, A., Ganora, D., and Claps, P.: Mapping the uneven temporal changes in ordinary and extraordinary rainfall extremes in Italy, Journal of Hydrology: Regional Studies, 58, 102287, https://doi.org/10.1016/j.ejrh.2025.102287, 2025.
Microsoft: GPT 4o (Large language model) [Azure OpenAI Service], https://learn.microsoft.com/azure/ai-services/openai/ (last access: 26 May 2026), 2025.
Modrick, T. M. and Georgakakos, K. P.: The character and causes of flash flood occurrence changes in mountainous small basins of Southern California under projected climatic change, Journal of Hydrology: Regional Studies, 3, 312–336, https://doi.org/10.1016/j.ejrh.2015.02.003, 2015.
Muñoz-Torrero Manchado, A., Antonio Ballesteros-Cánovas, J., Allen, S., and Stoffel, M.: Deforestation controls landslide susceptibility in Far-Western Nepal, Catena, 219, 106627, https://doi.org/10.1016/j.catena.2022.106627, 2022.
NASA LP DAAC: MOD13Q1 MODIS/Terra Vegetation Indices 16-Day L3 Global 250m SIN Grid (6), https://doi.org/10.5067/MODIS/MOD13Q1.006, 2017.
Open Street Map contributors: Open Street Map data: River, Stream, and Road Data (Liguria, Italy), https://www.openstreetmap.org/ (last access: 26 May 2026), 2025.
Orefice, S. and Innocenti, C.: Regional assessment of coastal landslide susceptibility in Liguria, Northern Italy, using MaxEnt, Nat. Hazards, 121, 2613–2639, https://doi.org/10.1007/s11069-024-06833-5, 2025.
Pedregosa, F., Varoquaux, G., Gramfort, A., Michel, V., Thirion, B., Grisel, O., Blondel, M., Prettenhofer, P., Weiss, R., Dubourg, V., Vanderplas, J., Passos, A., Cournapeau, D., Brucher, M., Perrot, M., and Duchesnay, E.: Scikit-learn: Machine Learning in Python, JMLR, 2825–2830, https://jmlr.csail.mit.edu/papers/v12/pedregosa11a.html (last access: 26 May 2026), 2011.
Peruccacci, S., Gariano, S. L., Melillo, M., Solimano, M., Guzzetti, F., and Brunetti, M. T.: The ITAlian rainfall-induced LandslIdes CAtalogue, an extensive and accurate spatio-temporal catalogue of rainfall-induced landslides in Italy, Earth Syst. Sci. Data, 15, 2863–2877, https://doi.org/10.5194/essd-15-2863-2023, 2023.
Pham, B. T., Jaafari, A., Phong, T. V., Yen, H. P. H., Tuyen, T. T., Luong, V. V., Nguyen, H. D., Le, H. V., and Foong, L. K.: Improved flood susceptibility mapping using a best first decision tree integrated with ensemble learning techniques, Geosci. Front., 12, 101105, https://doi.org/10.1016/j.gsf.2020.11.003, 2021.
Rayamajhi, D., Bhattarai, K., Giri, K., Budhathoki, M., Karn, N. K., Subedi, O., Regmi, R. K., and Dahal, V.: Assessing flood susceptibility in a Triyuga watershed, Nepal using statistical models, Sci. Rep., 15, 32056, https://doi.org/10.1038/s41598-025-10610-0, 2025.
Gwee, R., Riveros, A., Santinelli, G., and Mavritsakis, A.: AlessiaRiveros/lhat: Fork of LHAT, Zenodo [code, data set], https://doi.org/10.5281/zenodo.19726304, 2026.
Schlumberger, J., Haasnoot, M., Aerts, J., and De Ruiter, M.: Proposing DAPP-MR as a disaster risk management pathways framework for complex, dynamic multi-risk, iScience, 25, 105219, https://doi.org/10.1016/j.isci.2022.105219, 2022.
Seabold, S. and Perktold, J.: statsmodels: Econometric and statistical modeling with python, Proceedings of the 9th Python in Science Conference. 2010. And for the software, Statsmodels developers (2024) statsmodels: Statistical modelling in Python (v0.14.2), Zenodo, https://doi.org/10.5281/zenodo.10984387, 2024.
Shahabi, H., Shirzadi, A., Ronoud, S., Asadi, S., Pham, B. T., Mansouripour, F., Geertsema, M., Clague, J. J., and Bui, D. T.: Flash flood susceptibility mapping using a novel deep learning model based on deep belief network, back propagation and genetic algorithm, Geosci. Front., 12, 101100, https://doi.org/10.1016/j.gsf.2020.10.007, 2021.
Silvestro, F., Parodi, A., Campo, L., and Ferraris, L.: Analysis of the streamflow extremes and long-term water balance in the Liguria region of Italy using a cloud-permitting grid spacing reanalysis dataset, Hydrol. Earth Syst. Sci., 22, 5403–5426, https://doi.org/10.5194/hess-22-5403-2018, 2018.
Sorooshian, S., Hsu, K., Braithwaite, D., Ashouri, H., and NOAA CDR Program: NOAA Climate Data Record (CDR) of Precipitation Estimation from Remotely Sensed Information using Artificial Neural Networks (PERSIANN-CDR), Version 1 Revision 1, https://doi.org/10.7289/V51V5BWQ, 2014.
Stalhandske, Z., Steinmann, C. B., Meiler, S., Sauer, I. J., Vogt, T., Bresch, D. N., and Kropf, C. M.: Global multi-hazard risk assessment in a changing climate, Sci. Rep., 14, 5875, https://doi.org/10.1038/s41598-024-55775-2, 2024.
Steger, S., Brenning, A., Bell, R., and Glade, T.: The influence of systematically incomplete shallow landslide inventories on statistical susceptibility models and suggestions for improvements, Landslides, 14, 1767–1781, https://doi.org/10.1007/s10346-017-0820-0, 2017.
Tehrani, F. S., Santinelli, G., and Herrera Herrera, M.: Multi-Regional landslide detection using combined unsupervised and supervised machine learning, Geomatics, Natural Hazards and Risk, 12, 1015–1038, https://doi.org/10.1080/19475705.2021.1912196, 2021.
Terranova, O. G. and Gariano, S. L.: Rainstorms able to induce flash floods in a Mediterranean-climate region (Calabria, southern Italy), Nat. Hazards Earth Syst. Sci., 14, 2423–2434, https://doi.org/10.5194/nhess-14-2423-2014, 2014.
Terzi, S., Torresan, S., Schneiderbauer, S., Critto, A., Zebisch, M., and Marcomini, A.: Multi-risk assessment in mountain regions: A review of modelling approaches for climate change adaptation, J. Environ. Manage., 232, 759–771, https://doi.org/10.1016/j.jenvman.2018.11.100, 2019.
Tiggeloven, T., Ferrario, D. M., Claassen, J. N., Jäger, W. S., Shapovalova, Y., Koyama, M., De Ruiter, M. C., Daniell, J. E., Torresan, S., and Ward, P. J.: A Global Approach for Mapping Multi-Hazard Susceptibility Using Deep Learning: A Case Study in Japan, Artificial Intelligence for the Earth Systems, 4, 250039, https://doi.org/10.1175/AIES-D-25-0039.1, 2025.
UN: Secretary-General and UN, Open-ended Intergovernmental Expert Working Group on Indicators and Terminology relating to Disaster Risk Reduction: Report of the open-ended intergovernmental expert working group on indicators and terminology relating to disaster risk reduction, United Nations, New York, https://digitallibrary.un.org/record/852089?v=pdf#files (last access: 26 May 2026), 2016.
Uwihirwe, J., Riveros, A., Wanjala, H., Schellekens, J., Sperna Weiland, F., Hrachowitz, M., and Bogaard, T. A.: Potential of satellite-derived hydro-meteorological information for landslide initiation thresholds in Rwanda, Nat. Hazards Earth Syst. Sci., 22, 3641–3661, https://doi.org/10.5194/nhess-22-3641-2022, 2022.
Vennari, C., Parise, M., Santangelo, N., and Santo, A.: A database on flash flood events in Campania, southern Italy, with an evaluation of their spatial and temporal distribution, Nat. Hazards Earth Syst. Sci., 16, 2485–2500, https://doi.org/10.5194/nhess-16-2485-2016, 2016.
Viry, M., Yasirroni, M., Kim, H., and Gomes, M.: Jenkspy: Fast Fisher-Jenks breaks for Python, https://pypi.org/project/jenkspy/ (last access: 26 May 2026), 2024.
Wahba, M., Essam, R., El-Rawy, M., Al-Arifi, N., Abdalla, F., and Elsadek, W. M.: Forecasting of flash flood susceptibility mapping using random forest regression model and geographic information systems, Heliyon, 10, e33982, https://doi.org/10.1016/j.heliyon.2024.e33982, 2024.
Wang, Z., Goetz, J., and Brenning, A.: Transfer learning for landslide susceptibility modeling using domain adaptation and case-based reasoning, Geosci. Model Dev., 15, 8765–8784, https://doi.org/10.5194/gmd-15-8765-2022, 2022.
Wilde, M., Günther, A., Reichenbach, P., Malet, J.-P., and Hervás, J.: Pan-European landslide susceptibility mapping: ELSUS Version 2, J. Maps, 14, 97–104, https://doi.org/10.1080/17445647.2018.1432511, 2018.
Wood, J. L., Harrison, S., Turkington, T. A. R., and Reinhardt, L.: Landslides and synoptic weather trends in the European Alps, Clim. Change, 136, 297–308, https://doi.org/10.1007/s10584-016-1623-3, 2016.
Woodard, J. B., Mirus, B. B., Wood, N. J., Allstadt, K. E., Leshchinsky, B. A., and Crawford, M. M.: Slope Unit Maker (SUMak): an efficient and parameter-free algorithm for delineating slope units to improve landslide modeling, Nat. Hazards Earth Syst. Sci., 24, 1–12, https://doi.org/10.5194/nhess-24-1-2024, 2024.
Wu, C.-Y. and Yeh, Y.-C.: A Landslide Probability Model Based on a Long-Term Landslide Inventory and Rainfall Factors, Water, 12, 937, https://doi.org/10.3390/w12040937, 2020.
Yin, Y., Zhang, X., Guan, Z., Chen, Y., Liu, C., and Yang, T.: Flash flood susceptibility mapping based on catchments using an improved Blending machine learning approach, Hydrol. Res., 54, 557–579, https://doi.org/10.2166/nh.2023.139, 2023.
Youssef, A. M. and Pourghasemi, H. R.: Landslide susceptibility mapping using machine learning algorithms and comparison of their performance at Abha Basin, Asir Region, Saudi Arabia, Geosci. Front., 12, 639–655, https://doi.org/10.1016/j.gsf.2020.05.010, 2021.
Zander, M. J., Viguurs, P. J., Sperna Weiland, F. C., and Weerts, A. H.: Future changes in flash flood frequency and magnitude over the European Alps, Hydrol. Earth Syst. Sci. Discuss. [preprint], https://doi.org/10.5194/hess-2022-207, 2022.
Zscheischler, J., Westra, S., Van Den Hurk, B. J. J. M., Seneviratne, S. I., Ward, P. J., Pitman, A., AghaKouchak, A., Bresch, D. N., Leonard, M., Wahl, T., and Zhang, X.: Future climate risk from compound events, Nat. Clim. Change, 8, 469–477, https://doi.org/10.1038/s41558-018-0156-3, 2018.