the Creative Commons Attribution 4.0 License.
the Creative Commons Attribution 4.0 License.
 | 04 May 2026
Landfalling tropical cyclones significantly reduce Bangladesh's energy security
Kieran M. R. Hunt
Hannah C. Bloomfield
Bangladesh's rapidly expanding electricity grid is highly vulnerable to tropical cyclones, yet operational impacts remain poorly quantified. In this paper, we investigate the impact of landfalling tropical cyclones and depressions on Bangladesh's energy security by combining daily reported demand met (across 9 power-planning zones; December 2015 to May 2025) with cyclone track data and hazard proxies from reanalysis and satellite products. We use an event-centered composite approach for 14 named landfalling cyclones and 13 landfalling depressions, defining deficits in demand met as a percentage anomaly relative to a 60 d running mean. On cyclone landfall days, national demand met falls by an average of 19.8 %, with the maximum recorded national deficit (69 %) occurring during Cyclone Remal (28 May 2024). Coastal zones are disproportionately affected, with mean day 0 zone deficits of up to 38 % and some events exceeding 90 %. Depressions are associated with smaller, but still significant, deficits, averaging 8.3 %. For named cyclones, the magnitude of the national deficit is strongly correlated with the worst-affected zone deficit (r=0.80, p<0.001), indicating that national-scale shortfalls are dominated by near-collapse in at least one zone. Cross-border analysis with West Bengal shows that the largest cyclone-related deficits are often synchronised across both regions, limiting the reliability of imported electricity during major stress events. We propose potential mitigation and adaptation policies, such as targeted hardening of coastal network assets and decentralised backup supply for critical services as cyclone-related hazards continue to intensify under climate change.
- Article
(5504 KB) - Full-text XML
- BibTeX
- EndNote


Bangladesh's position at the head of the Bay of Bengal regularly exposes it to tropical cyclones and depressions. Approximately ten tropical cyclones make landfall in Bangladesh each decade (Islam and Peterson, 2009), though this is subject to substantial decadal variability. Compounding this frequent hazard, more than half of Bangladesh has an elevation below 5 m (see Fig. 1), and approximately one quarter of the population (about 40 million people) live within 500 km of the coast. Therefore, tropical cyclones and depressions, which are often associated with storm surges exceeding 5 m (Karim and Mimura, 2008; Chiu and Small, 2016), present a serious hazard to life and infrastructure in this heavily exposed region (Hossain, 2015). Although the basin-wide frequency of tropical cyclones has slightly declined in recent decades, both observation- and model-based studies point to a rise in the frequency of more intense cyclones (Sahoo and Bhaskaran, 2016; Balaji et al., 2018; Singh et al., 2019; Baburaj et al., 2020; Knutson et al., 2020; Roberts et al., 2020). This trend has been evidenced by a wealth of high-impact landfalling tropical cyclones in the last two decades, e.g., Sidr (2007), Aila (2009), Viyaru (2013), Roanu (2016), Mora (2017), Amphan (2020), Mocha (2023), and Remal (2024).
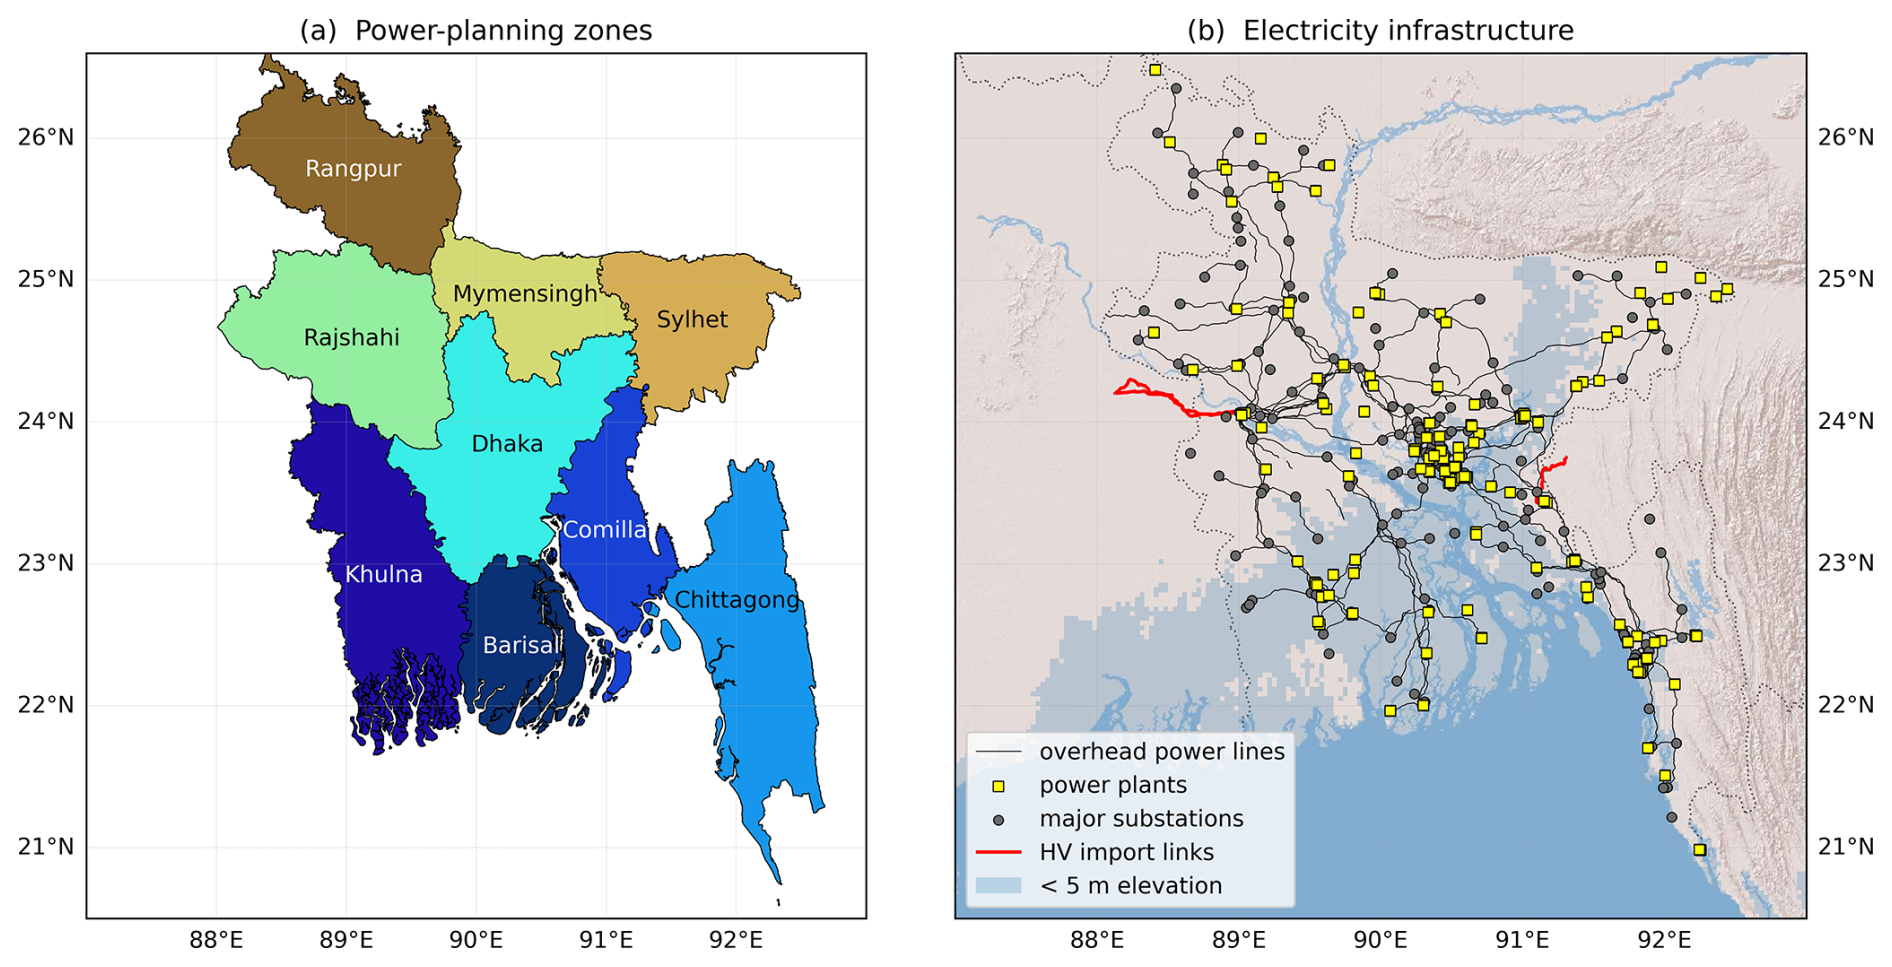
Figure 1Maps showing (a) the power-planning zones of Bangladesh and (b) the layout of its core electricity infrastructure. The zones in (a) are identical to the divisions (i.e., largest administrative unit) of Bangladesh, except that Chittagong is split into two, with the northwestern half referred to as Comilla. Infrastructure data are taken from OpenStreetMap (see Sect. 2.3). © OpenStreetMap contributors 2025. Distributed under the Open Data Commons Open Database License (ODbL) v1.0.
In Bangladesh, these storms strike an electricity grid (Fig. 1) that, while rapidly expanding, remains structurally fragile (World Bank, 2021, 2024), impacting its energy security. Here, energy security is used in the specific sense of security of electricity supply, i.e., the ability of the power system to deliver electricity to consumers when needed, including during short-lived extreme events (International Energy Agency, 2026). Total installed power capacity stands at around 27 GW as of May 2025, a fivefold increase on ten years ago (Bangladesh Power Development Board, 2025), with over half coming from depleting resources of domestic gas. Imported diesel, oil and coal fill most of the gap, leaving renewables (almost entirely biofuel) comprising about 15 % of the mix (International Energy Agency, 2025). Bangladesh now has over 14 000 km of high-voltage transmission lines (Fig. 1b), increasing at a rate of about 1000 km yr−1 (Bangladesh Power Development Board, 2023). National planning is articulated in the Integrated Energy and Power Master Plan (IEPMP; Power Division, Government of Bangladesh, 2023).
Despite this exposure, the operational resilience of Bangladesh's power grid to tropical cyclones remains under-researched. At the same time, national power-system models are becoming increasingly sophisticated, and recent increases in computing power now make hourly-resolution, multi-decadal simulations possible (Grochowicz et al., 2024). These models are increasingly able to represent not only the balance between supply and demand, but also network damage from tropical cyclones (Bennett et al., 2021) and the impacts of climate change (Wohland et al., 2025). Even so, resilience (including the amount of local damage caused by an extreme event and the time required for recovery) is best quantified using historical observations. Because metered outage and demand data are often limited, Mo et al. (2025) used satellite-based nighttime light observations across 66 countries and 396 storms, and found that the median duration of storm-related blackouts worldwide is about 4 d, with longer recovery times in less densely urbanised areas and in developing regions with weaker energy-system regulation.
Tropical cyclones impact all parts of critical energy infrastructure. For example, strong winds damage or knock down transmission and distribution network equipment (Cyclone Sidr damaged 43 000 poles and 154 towers; Bangladesh Ministry of Food and Disaster Management, 2008), and seawater inundation from storm surges shorts or otherwise damages the many coastal substations and power plants (Fig. 1b) (Shahid, 2012).
While existing literature documents cyclone mortality and economic losses, we still have limited quantitative insight into (a) the operational, regional, and demand-side impacts of tropical cyclones on Bangladesh's electricity grid; and (b) the real-world reliability and feasibility of importing electricity from India when both grids face correlated stress from large-scale wind, rain, and surge impacts.
Recent work has quantified how extreme weather can negatively affect electricity systems across tropical coastal Asia. For Southeast Asia, the International Energy Agency has stated that increasingly intense tropical cyclones, flooding and sea-level rise are growing threats to energy infrastructure and reliability, and urge the need for climate-aware planning (International Energy Agency, 2024). Prior estimates of cyclone-driven risks to power-grid assets across East and Southeast Asia average about 0.07 % of GDP across the region and are substantially higher in some countries (0.20 % in Japan; 0.17 % in Laos) (Ye et al., 2024). Night-time lights have also been used to explore disruption and recovery after hazards across South and Southeast Asian countries, although reliability is limited by noise and cloud cover (Skoufias et al., 2021).
For Bangladesh, previous studies have quantified extreme exposure to cyclonic storm surge and coastal flooding in the Ganges–Brahmaputra–Meghna delta. For example, Bernard et al. (2022) found 1-in-50 year cyclone-surge inundation heights reached ∼ 8 m above mean sea level near the Ganges–Meghna junction, with widespread exposure of coastal islands. Recent work has further shown that climate hazards threaten infrastructure service delivery in coastal Bangladesh. Using a dataset of 8.2 million households, Adshead et al. (2024) estimated that, for a baseline 1-in-50 year hazard, cyclonic winds could disrupt ∼ 94.5 % of the coastal population (across essential services on average), compared with ∼ 39.5 % for coastal flooding (including storm surge) and ∼ 22.7 % for riverine flooding, with the poorest disproportionately threatened in 69 % of coastal subdistricts.
Bangladesh's cyclone death tolls have historically arisen from storm-surge inundation and associated drowning, with the highest risks in low-lying coastal islands and polders and in places where embankments are absent or breached during cyclone landfall (Bern et al., 1993; Alam, 2023). Fatality is strongly reduced when people can access reinforced buildings or cyclone shelters in time, with post-event assessments following the 1991 cyclone highlighting higher mortality among those unable to access brick or concrete structures, alongside considerable age and gender disparities (Bern et al., 1993). Since the 1970 Bhola cyclone, Bangladesh has achieved a substantial reduction in cyclone mortality (by more than two orders of magnitude), which has been attributed to improvements in forecasting and early-warning dissemination, the Cyclone Preparedness Programme, expanded cyclone-shelter coverage, increased coastal embankments and mangrove protection, and greater public awareness (Haque et al., 2012; Paul, 2009). Nevertheless, severe cyclones still lead to mortality when warnings are not received in time or cannot be (or are not) acted upon. Barriers include long distances to shelters, poor road access in remote areas, communication failures during emergencies, and limited provision for elderly and disabled people (Kelman et al., 2018; Alam, 2023). Cyclone mortality in Bangladesh is therefore a function not only of storm intensity and coastal exposure, but also a range of socioeconomic factors (Paul, 2009; Kelman et al., 2018).
To reduce shortages, Bangladesh engages in cross-border trade with India, with capacity to import up to 1.2 GW through two high-voltage links (with more planned) – about 1.0 GW via Baharampur–Bheramara and ∼ 160–192 MW via Tripura–Comilla (an upgrade to 500 MW is underway) – both of which are shown in red in Fig. 1. Reliance on these imports, however, raises its own hazards. Firstly, West Bengal lies in the same basin as Bangladesh and tropical cyclone footprints often cover parts of both regions. Cyclone Amphan resulted in widespread damage and loss of life in both West Bengal and Bangladesh (World Meteorological Organization, 2020; India Meteorological Department, 2024; Needs Assessment Working Group (NAWG) and Humanitarian Coordination Task Team (HCTT), 2020), demonstrating that simultaneous damage on both sides of the border could rapidly erode the diversification benefit. Secondly, because cross-border exchanges are scheduled day-ahead or week-ahead and updated intraday subject to available transfer capability, Indian system operators may reduce the offered export in advance when a cyclone is forecast to affect eastern India. Realtime demand-side management also remains possible if grid security requires it (Central Electricity Regulatory Commission, 2023). Cross-border scheduling, access, and curtailment provisions are set out in India's Guidelines for Import/Export (Cross Border) of Electricity (Ministry of Power, Government of India, 2018). At the regional level, the SAARC Framework Agreement for Energy Cooperation (Electricity) provides a multilateral policy frame for voluntary cross-border electricity trade among South Asian states (South Asian Association for Regional Cooperation (SAARC), 2014).
Energy security is multi-dimensional and can be framed in terms of availability, affordability, accessibility and acceptability, or more generally as the vulnerability of energy systems to disruption. In this study, we present an initial investigation into these questions by combining nine years of daily zone-level demand data with cyclone tracks and hazard proxies. We use event-centered composites to estimate mean disruption and recovery, examine regional disparities, and assess the reliability of cross-border imports during synchronous stress events.
We focus on short-term electricity supply security during extreme events: (i) availability, quantified using observed shortfalls in daily demand met; (ii) reliability and resilience, quantified using the frequency, magnitude and recovery time of these shortfalls; and (iii) interdependence, assessed via the co-occurrence of deep dips in Bangladesh and West Bengal that sets the value of cross-border imports during cyclones. We do not attempt to quantify affordability or long-run adequacy.
Our primary methods are (i) event-based impact assessment and (ii) compositing conditional on event types. We compute demand-met anomalies relative to a centred running-mean baseline and then analyse these anomalies around independently dated landfall events (tropical cyclones and depressions) to estimate the mean/median day 0 impact and recovery trajectory.
2.1 Electricity demand data
We use daily demand met (served load), i.e. the electricity supplied by the grid to consumers. For Bangladesh this is reported as daily average load (MW); for West Bengal the source reports daily energy supplied (MU d−1), which we convert to a daily-average MW equivalent where required. Because our focus is on operational disruption during cyclones (hours to days), we emphasise the availability and reliability components of energy security and treat daily demand met and its shortfalls as a proxy for these supply-security impacts, rather than attempting to quantify affordability or long-term adequacy (consistent with The World Bank Group, 2005).
2.1.1 Bangladesh
The Bangladesh Power Development Board publish daily totals of electricity demand for each of the country's nine power zones (Fig. 1a). These are archived at URLs of the form https://misc.bpdb.gov.bd/area-wise-demand?date=DD-MM-YYYY (last access: 30 April 2026), from which they can be readily scraped. This gives us daily data, starting in December 2015 and running through to the present. Some dates are missing from the archive, and some zone entries appear as zeroes, which we treat as missing data (rather than true demand). For national totals and all subsequent composite analyses, we conservatively exclude any day where at least one of the nine zones is missing (i.e., reporting zero demand), so that the national total is always based on complete zone coverage. This leaves us with approximately 99.7 % coverage.
To identify and analyse dips in demand met, we use a centred 60 d running mean (requiring at least 30 valid days to compute the baseline). We then express anomalies as fractional deviations from this mean and define “dip days” as those where the anomaly is less than 80 % of the running mean.
We have made the scraped data available in machine-friendly format at https://doi.org/10.5281/zenodo.17175212 (Coombes et al., 2025). The code to download the data and recreate all figures and analysis in this paper is available at https://github.com/kieranmrhunt/bangladesh-renewable (last access: 30 April 2026). This is part of a wider research group initiative to make energy data open and accessible to all, e.g., for training large-sample demand models.
2.1.2 West Bengal
Daily demand met data for West Bengal are taken from the Indian dataset published by Hunt and Bloomfield (2025a). They extracted the data from daily reports issued by the Grid Controller of India (Grid-India), known before November 2022 as the Power System Operation Corporation (POSOCO). The reports are in PDF format and contain the total energy supplied by the national grid to each state on each day. The final version of the dataset covers all Indian states from 2014 to present, and is available at https://doi.org/10.5281/zenodo.14983362 (Hunt and Bloomfield, 2025b).
2.2 Weather and hazard data
2.2.1 ERA5
ERA5 is the fifth generation atmospheric reanalysis of global climate produced by the Copernicus Climate Change Service at the European Centre for Medium-Range Weather Forecasts (Hersbach et al., 2020). Data from ERA5 have global coverage at a horizontal resolution of ∼ 25 km and resolve the atmosphere on 137 levels from the ground up to ∼ 80 km in altitude. It covers from January 1940 until present at hourly frequency. We use single-level data (https://doi.org/10.24381/cds.adbb2d47, Hersbach et al., 2023) to show the near-surface instantaneous 10 m vector wind fields associated with blackout case studies, as well as “significant height of combined wind wave and swell” as a proxy for the magnitude of storm surges. There are global biases in ERA5's under-representation of the magnitude and intensity of surface wind gusts, particularly over complex terrain (Belmonte Rivas and Stoffelen, 2019), but here we use it qualitatively to contrast the relative intensities and structures of the cyclones.
2.2.2 GPM-IMERG
Global Precipitation Mission Integrated Multi-satellitE Retrievals for (GPM-IMERG) (Huffman et al., 2015) is a global satellite-based precipitation product at a half-hourly, 0.1° resolution, starting in June 2000 and continuing to the present day. Over the tropics, IMERG primarily ingests retrievals from (for 2000–2014) the now-defunct Tropical Rainfall Measuring Mission (Kummerow et al., 1998, 2000) 13.8 GHz precipitation radar and microwave imager (Kozu et al., 2001) and (for 2014 onwards) the Global Precipitation Measurement (Hou et al., 2014) Ka/Ku-band dual-frequency precipitation radar. We use IMERG precipitation data (0.1°/30 min) to quantify rainfall in our case studies because its finer resolution than ERA5 (0.25°/hourly) and demonstrated skill in reproducing the spatial and diurnal structure of precipitation over Bangladesh (Ahmed et al., 2021) make it preferable for resolving small-scale extremes; more broadly, many evaluations report IMERG outperforming reanalyses such as ERA5 in convective regimes (e.g., Xin et al., 2022).
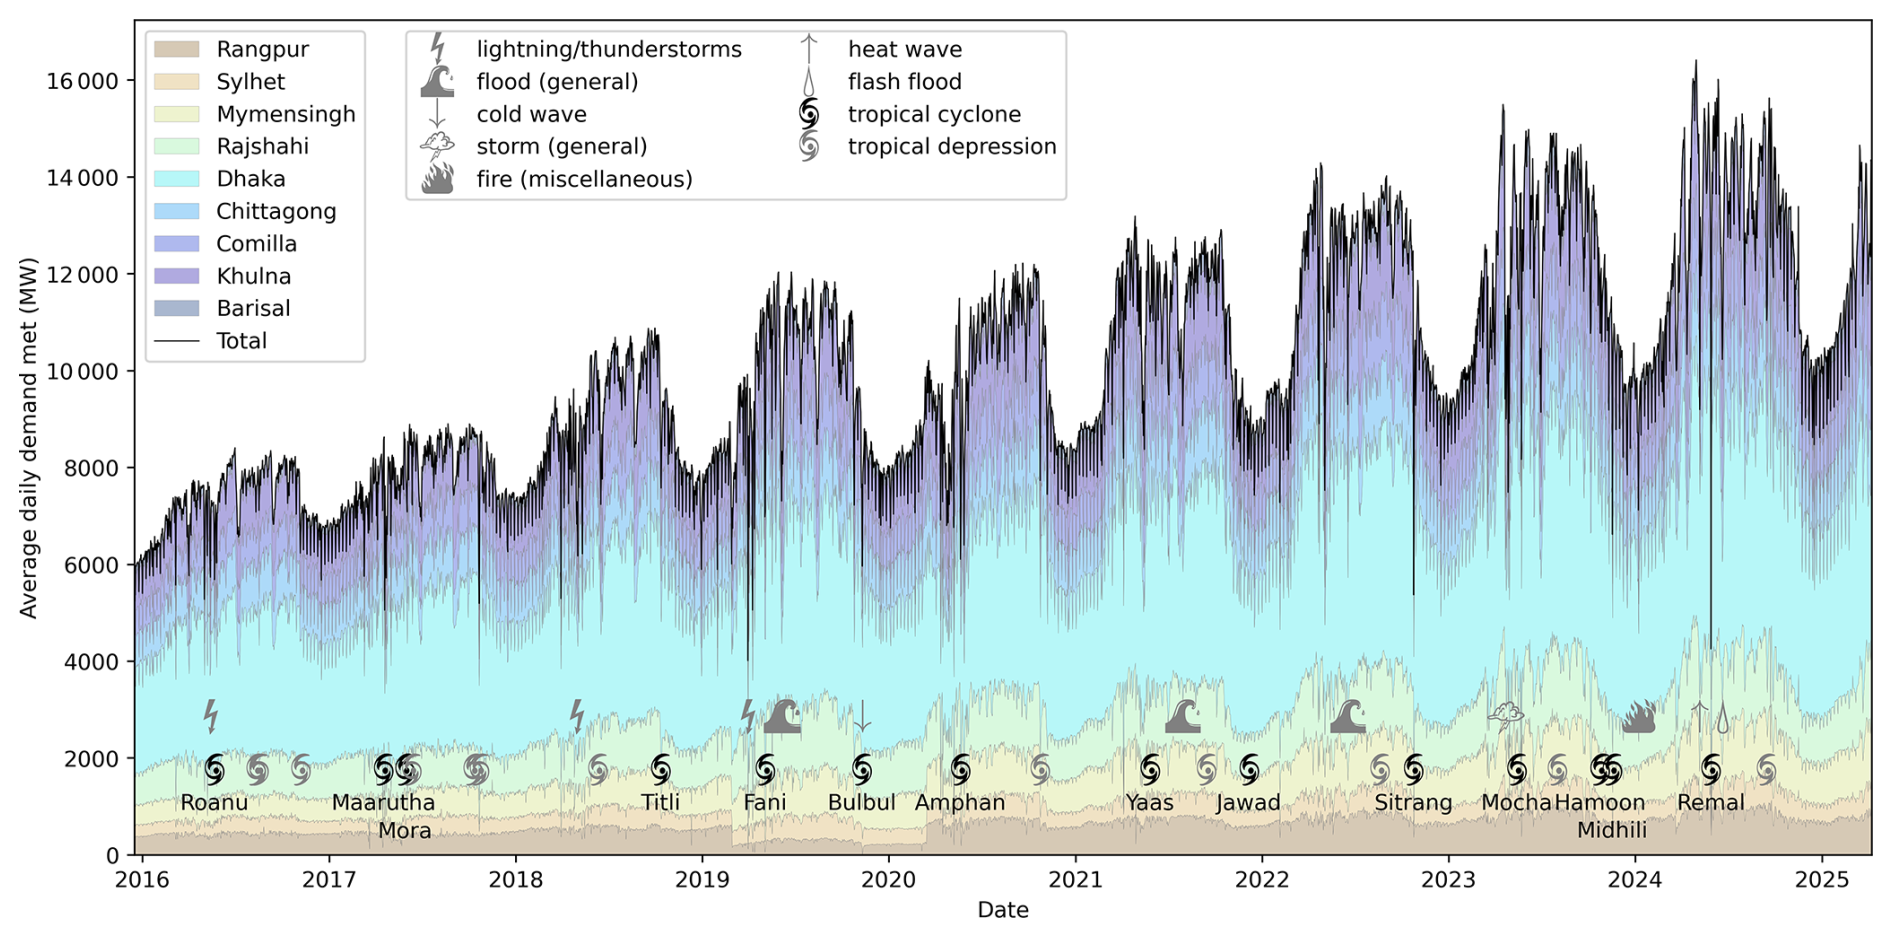
Figure 2Timeline (2016–present) of average daily demand met for Bangladesh (MW; black line) and its nine power zones (colours, see Fig. 1 for locations of each region). Along the bottom, we show all tropical cyclones (with their names; black) and depressions (grey) to have made landfall in Bangladesh in this period, whether or not they coincide with power shortages. Above this, we show all other natural hazards affecting Bangladesh during this period, so long as they co-occur with an energy dip (here defined as days where national demand met falls below 80 % of the 60 d running mean). Hazard data are taken from the EM-DAT archive (see Sect. 2.2).
2.2.3 EM-DAT
The Emergency Events Database (e.g., Delforge et al., 2025) maintained by the Centre for Research on the Epidemiology of Disasters provides a homogenised catalogue of natural hazards and their reported impacts. We queried EM-DAT for the period December 2015–May 2025 and retained all events whose affected country list contains Bangladesh. We then subset to hydrometeorological classes potentially relevant to the power system: lightning, floods, coldwaves, heatwaves, and wildfires. For tropical cyclones and depressions, we additionally verified the reported event dates against the India Meteorological Department (IMD) Regional Specialized Meteorological Centre metadata (https://rsmcnewdelhi.imd.gov.in/report.php?internal_menu=MzM=, last access: 30 April 2026) to ensure that the disturbance made landfall over, or had a clearly documented direct impact on, Bangladesh. The EM-DAT catalogue is used in two ways: (i) to tag and interpret sharp demand shortfalls that are not associated with a tropical cyclone or depression (Fig. 2); and (ii) to ensure that our composites of “other” hazards do not mix qualitatively different drivers (e.g., major river flooding versus pre-monsoon mesoscale convective systems).
2.3 OpenStreetMap
OpenStreetMap (OpenStreetMap contributors, 2017) (OSM) is a collaborative project to create a free, open, editable map of the world. It allows users to view, edit and add data, and has a large user community that contributes data on a wide range of topics, including location names, road networks and points of interest. The completeness of the data can vary because it relies on the contributions of volunteers. In this study, we use OSM data for a brief qualitative analysis of the locations of power infrastructure in Bangladesh (Fig. 1b). These were extracted using Overpass Turbo (https://overpass-turbo.eu/, last access: 30 April 2026) and extracting entities where the “power” variable is in “line”, “plant”, “substation”, or “tower”.
3.1 National-scale impacts of extreme weather
As Bangladesh's power grid has expanded rapidly, with demand rising by about 70 % since 2016 (Fig. 2), it has also become increasingly exposed to short, sharp supply disruptions. There is also a strong annual cycle, with an average amplitude of about 3300 MW, and a weekly cycle, with an average amplitude of about 580 MW.
Outside of these cycles, there are short drops in demand often lasting only a day or two, which almost invariably coincide with hazardous weather events, with tropical cyclones being the biggest contributor. Cyclone Remal caused the most extreme case in our record: on 28 May 2024, when the average demand met across all of Bangladesh was only 4253 MW, down 67 % from 12 870 MW the day before, and 71 % from 14 472 MW the day before. These appear to affect all zones, implying issues with central power distribution.
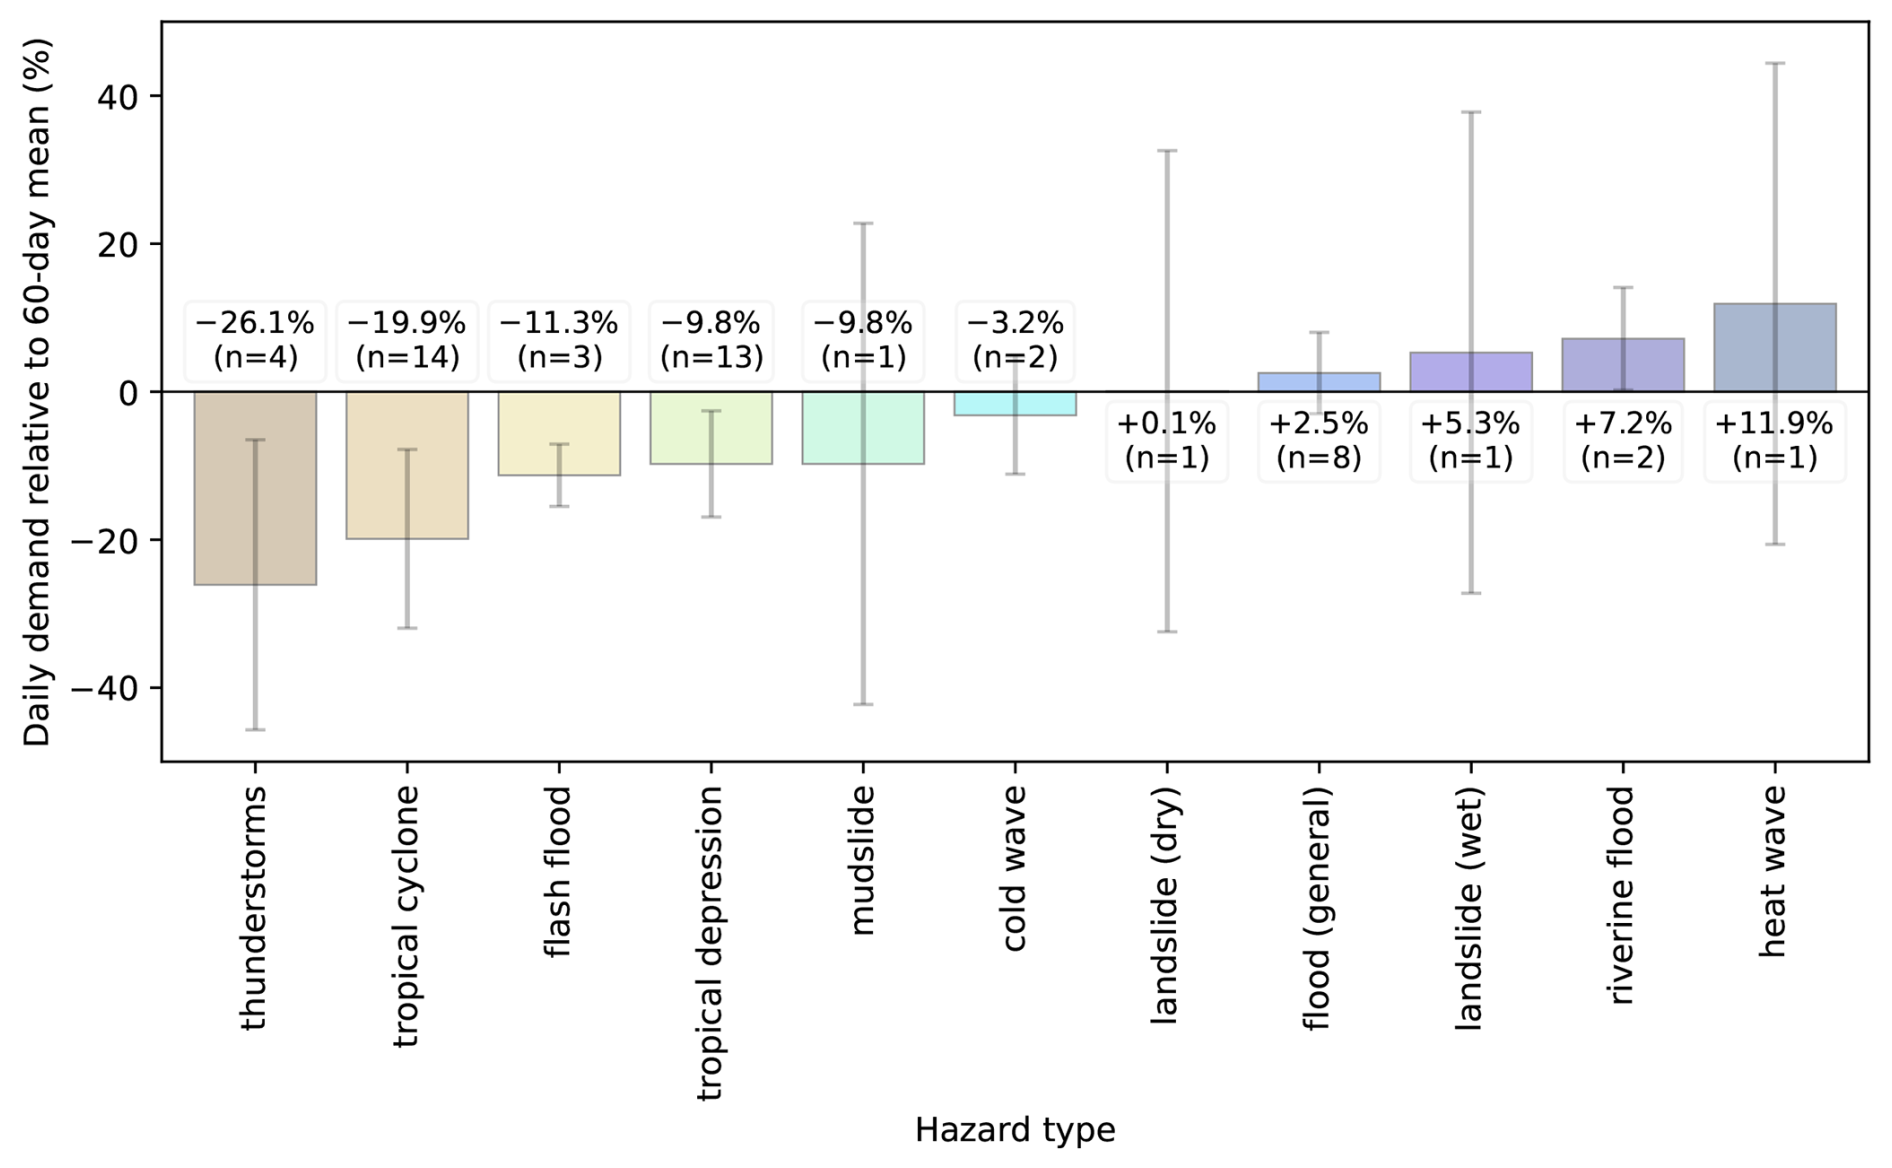
Figure 3Mean day 0 change in Bangladesh national demand met relative to a centred 60 d running mean, stratified by hazard type (December 2015–May 2025). Bars show the average percentage change on the EM-DAT start date (or the cyclone landfall date for tropical cyclones/depressions), aligned to the nearest demand day within ± 1 d. Error bars denote 95 % confidence intervals estimated using ± 1.96× standard error; for categories with n=1 the standard error uses a pooled standard deviation from categories with n≥2. Sample sizes (n) are shown alongside each bar. Only natural hazards are shown; non-natural classes in EM-DAT are excluded (e.g., disease or transport). However, all hazard logged for Bangladesh in EM-DAT in this period are included, whether or not they coincided with anomalous demand. Negative values indicate reductions in supply.
The majority of these large dip events are associated with a tropical cyclone or landfalling tropical depression (Fig. 3). Of those that remain, most are associated with some other kind of natural hazard, e.g., thunderstorms – although the link between these lesser hazards and energy shortages are sometimes coincidental, as we shall see.
We also tested whether cyclone intensity is a useful predictor of day 0 change in demand met. For each named tropical cyclone (Table 1), we used the IMD-reported storm class at landfall as a proxy for intensity and computed the total national day 0 demand-met deficit (again relative to the 60 d running mean). Over these 14 cyclones, deficits range from 0 %–69 %. There is no statistically significant relationship between cyclone class and the magnitude of the day 0 deficit (Pearson r = −0.21, p=0.48; Spearman ρ = −0.11, p=0.70), implying that intensity class alone cannot explain the event-to-event variation in demand loss. This is consistent with the expectation that outages also depend on landfall location relative to exposed coastal infrastructure, storm size, translation speed, storm surge magnitude and location, and rainfall magnitude and location.
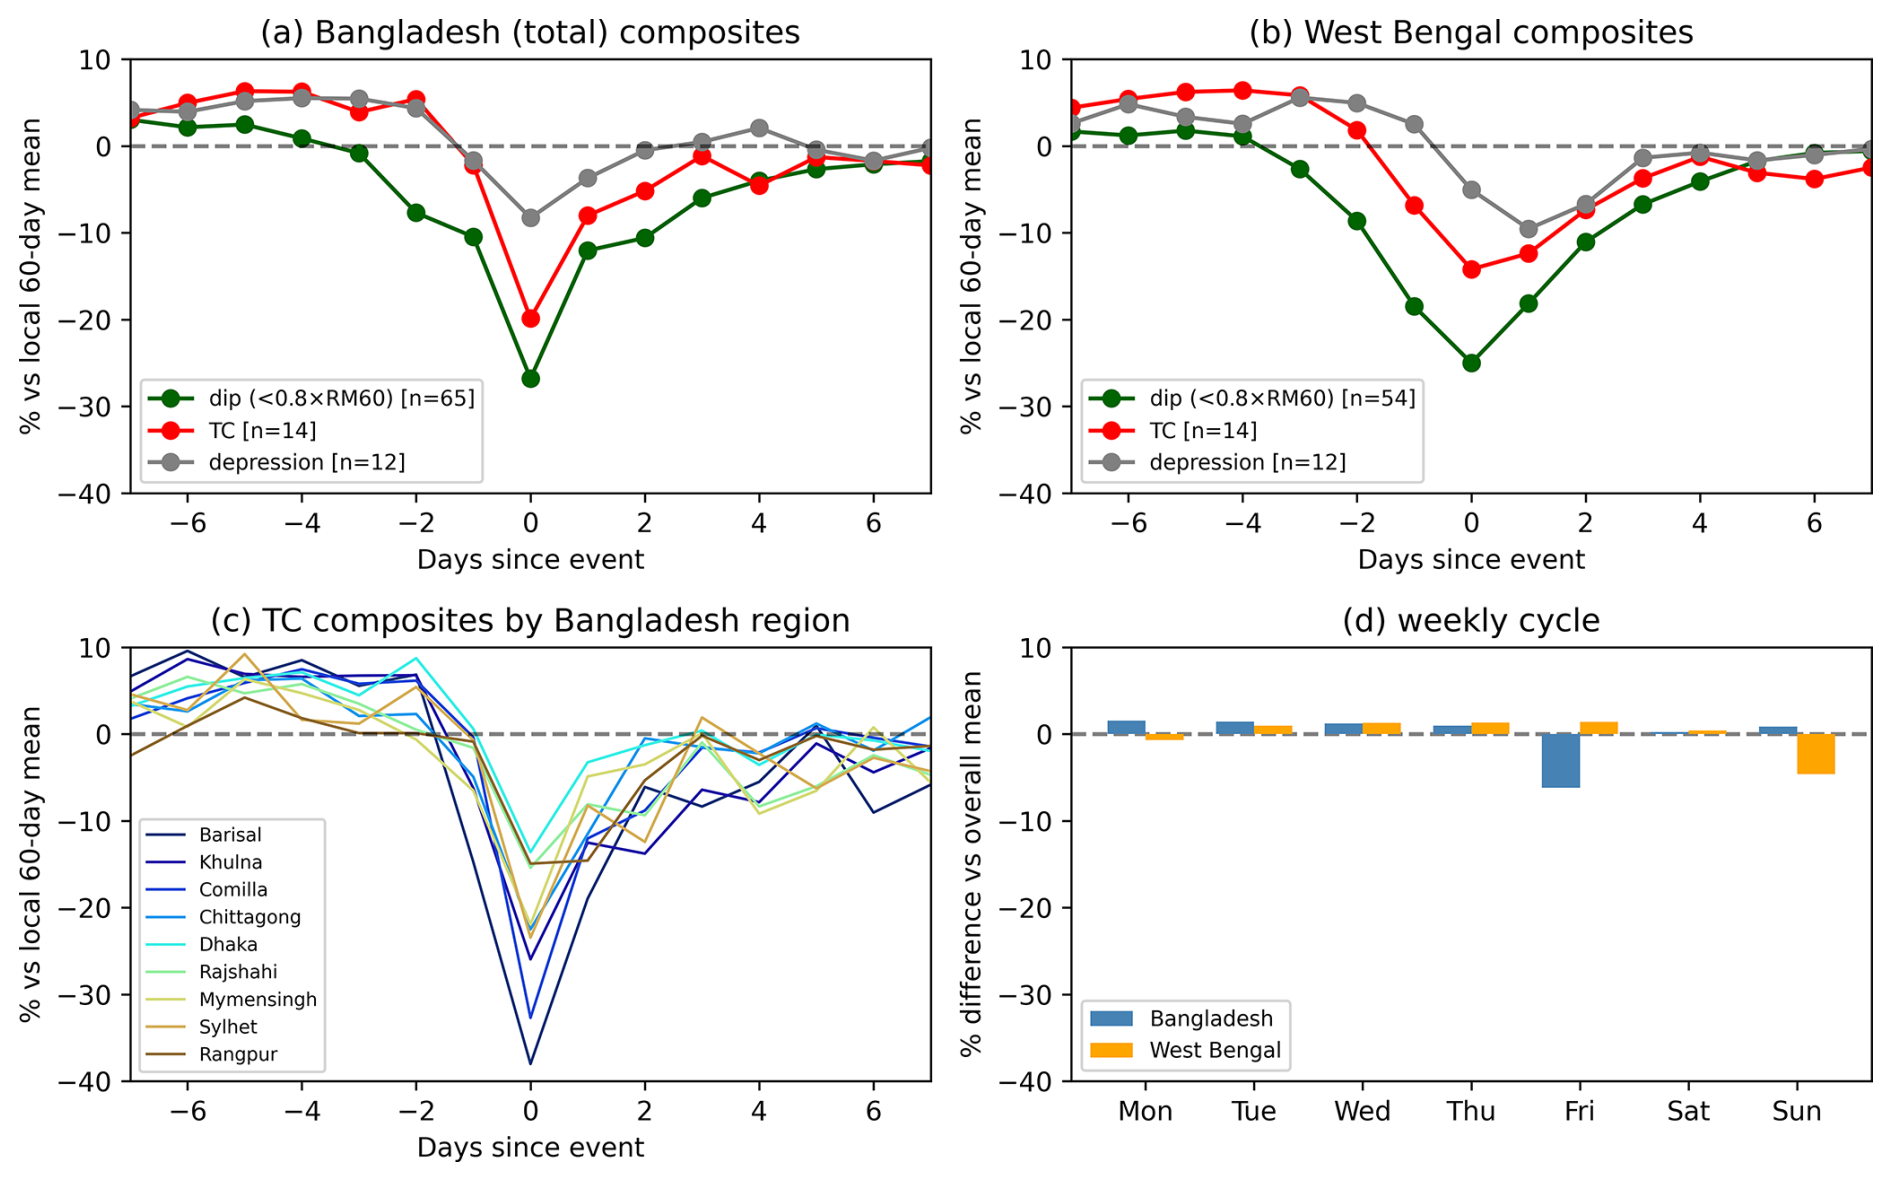
Figure 4Composite impacts of extreme weather and the weekly cycle on demand met over Bangladesh and West Bengal. Changes in demand met, relative to a 60 d running mean, are averaged for landfalling TCs (red), landfalling depressions (grey), and demand “dips” (green), and shown for (a) Bangladesh and (b) West Bengal. Dips are defined as days where demand met falls below 80 % of the 60 d running mean, excluding days that fall into the TC or depression categories above. (c) The composite profile for the same TCs, separated by grid zone. (d) Change in demand met relative to the mean, as a function of the day of week for Bangladesh (blue) and West Bengal (orange).
We now move to national-scale composite lead–lag time series of demand met, conditioned on (i) landfalling TC days, (ii) landfalling depression days, and (iii) “dip” days, defined as dates on which national demand falls below 80 % of the 2 month centered running mean (Fig. 4).
For Bangladesh (Fig. 4a), TCs reduce demand met by 19.8 % on landfall day, with a partial recovery to −8 % on day +1 and −5 % on day +2. Depressions, which are similar in number over the study period, have a weaker effect, reducing demand met by 8.3 % on day 0, 4 % on day +1, and only about 1 % by day +2. Using bootstrapping, the 95 % confidence intervals are [−32.0 %, −8.7 %] for tropical cyclones and [−15.6 %, −2.2 %] for depressions. Of particular interest are the dip days. They are more numerous (by about a factor of 2.5) than TCs and depressions combined, and they exhibit the largest composite deficit: demand met falls by an average of −28 % on day 0 and −12 % on day +1.
These large composite dips are not predominantly due to weekly cycle effects as is sometimes seen for demand reductions in developed regions (e.g. Drew et al., 2019; Fig. 4d). These are too weak, and Bangladesh's lowest demand day, Friday, which is when Bangladesh's energy demand is at a minimum, is associated with only about a 6 % reduction relative to the weekly mean. Nor can they be attributed to public holidays. Bangladesh had 66 recognised public holidays in this period, during which demand only fell by an average of 5.5 %. In fact, none of the dip days in this record coincide with national holidays in Bangladesh. Holiday composites (not shown) indicate material reductions only in the two largest urban centres: Dhaka (−11 %) and Chittagong (−8 %).
The prevalence and shape of dip-day composites are sensitive to how the background is removed. If the centred running-mean window is shortened from 60 to 10 d, the slow “spin-up” largely disappears and the number of dip events falls markedly, to 35 in Bangladesh and 19 in West Bengal. This sensitivity suggests that at least a subset of dip days reflects relatively long-lived processes that depress demand over longer (e.g., weekly) timescales, such as extended flooding, heat-driven demand suppression under widespread outages, or grid-internal constraints, rather than purely short, shock-like events.
Thus far, we have considered only demand met, ignoring load shedding. We now briefly discuss the impact of that choice. For cyclone landfall days, the average anomaly in demand met is −19.78 %. This changes only slightly, to −19.48 %, if we add reported load shedding to obtain an upper-bound estimate of total demand (served + unserved). For depressions, it worsens slightly from −8.37 % to −8.94 %. Framed slightly differently, the mean absolute dip in demand met on cyclone landfall days is about 2.22 GW; mean load shedding on the same days is 116 MW. Hereafter, all results will be reported as using demand met.
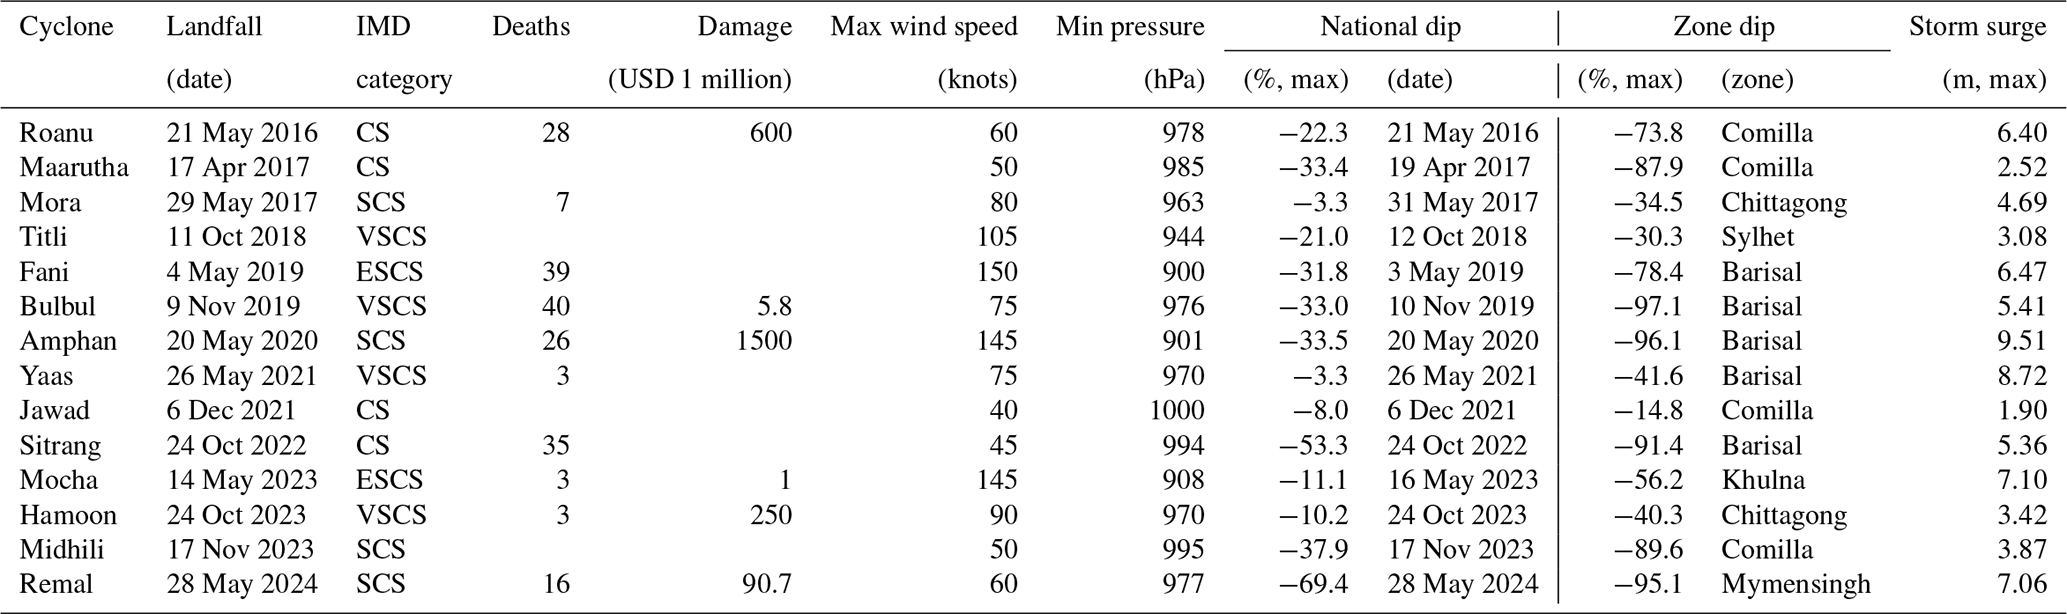
Table 1Summary of landfalling tropical cyclone impacts over Bangladesh (2016–2024). Landfall dates and IMD categories are from the IMD/RSMC catalogue. Deaths and damages (USD million) are from EM-DAT where available. Maximum wind speed and minimum central pressure are taken from IBTrACS best-track data. National and zonal electricity dips are the most negative percentage anomalies in demand met relative to a centred 60 d running-mean baseline, evaluated within ± 2 d of landfall. “Worst zone” indicates the power-planning zone with the largest dip. Storm surge is taken as the maximum ERA5 significant wave height (combined wind waves and swell) within a coastal box (20.5–23° N, 89–92° E) in a −3 to +5 d window around landfall.
3.1.1 Cyclone impacts
Building on these composite statistics, we summarise key impacts metrics and the maximum national and zonal electricity shortfalls for each landfalling tropical cyclone in Table 1.
Across the 14 landfalling cyclones in Table 1, the magnitude of the national electricity deficit (“national dip”) is strongly related to the severity of the worst-affected zone (“zone dip”). Within ± 2 d of landfall, the maximum national dip is highly correlated with the corresponding maximum zonal dip (r=0.80, p<0.001). This suggests that national-scale shortfalls are not distributed evenly, but are driven by near-total collapse in the most exposed zone, preventing load balancing.
Correlations with human impacts are weaker, as these metrics are often missing from EM-DAT (10 of 14 cyclones have reported deaths; 6 of 14 have reported damage), but available reported deaths correlate more strongly with the worst-zone deficit (r = −0.80, p=0.006, n=10) than with the national deficit (r = −0.56, p=0.09, n=10), suggesting that mortality is more closely tied to localised, extreme disruption than to the national average. This provides evidence that mortality is driven by local infrastructure collapse and inability to access services, rather than broader national energy shortages.
Our storm-surge proxy is moderately correlated with cyclone intensity, increasing for lower minimum central pressures (r = −0.55, p=0.04), but the apparent correlation between reported economic damage and surge is insignificant due to small sample size (r=0.64, p=0.17, n=6). Having established the national-scale picture, we now examine how these impacts vary regionally.
3.2 Regional vulnerability and physical drivers
Finally, we look at the composite regional effect of TCs on the different zones of Bangladesh (Fig. 4c). As we might expect from our case study analysis earlier, coastal zones are much more severely impacted by TCs than inland zones. Mean day 0 reductions reach −38 % in Barisal, −33 % in Comilla, and −26 % in Khulna, compared with −15 % in Rangpur, −15 % in Rajshahi, and −13 % in Dhaka. Dhaka is the least impacted zone in percentage terms, but it accounts for nearly 40 % of national demand, so aggregating to the national scale inevitably downplays the severity of coastal impacts. By contrast, dip days show no systematic coastal–inland contrast (not shown), although the largest single-zone effect is again in Dhaka (−29 %). There is no significant relationship between the timing of missing data and the occurrence (or lead/lag) of extreme weather.
3.2.1 Case studies
We now extract 4 cases from among these large dip events. These allow us to better examine, compare, and contrast the regional structure of their causes and impacts. These cases comprise two cyclones (Remal and Sitrang), which led to the largest relative reductions in demand met; the deep depression with the largest reduction in demand met (the landfalling deep depression of October 2017); and a major blackout in March 2019 that did not coincide with any significant synoptic-scale circulation, but is logged in EM-DAT as a day with an intense thunderstorm.
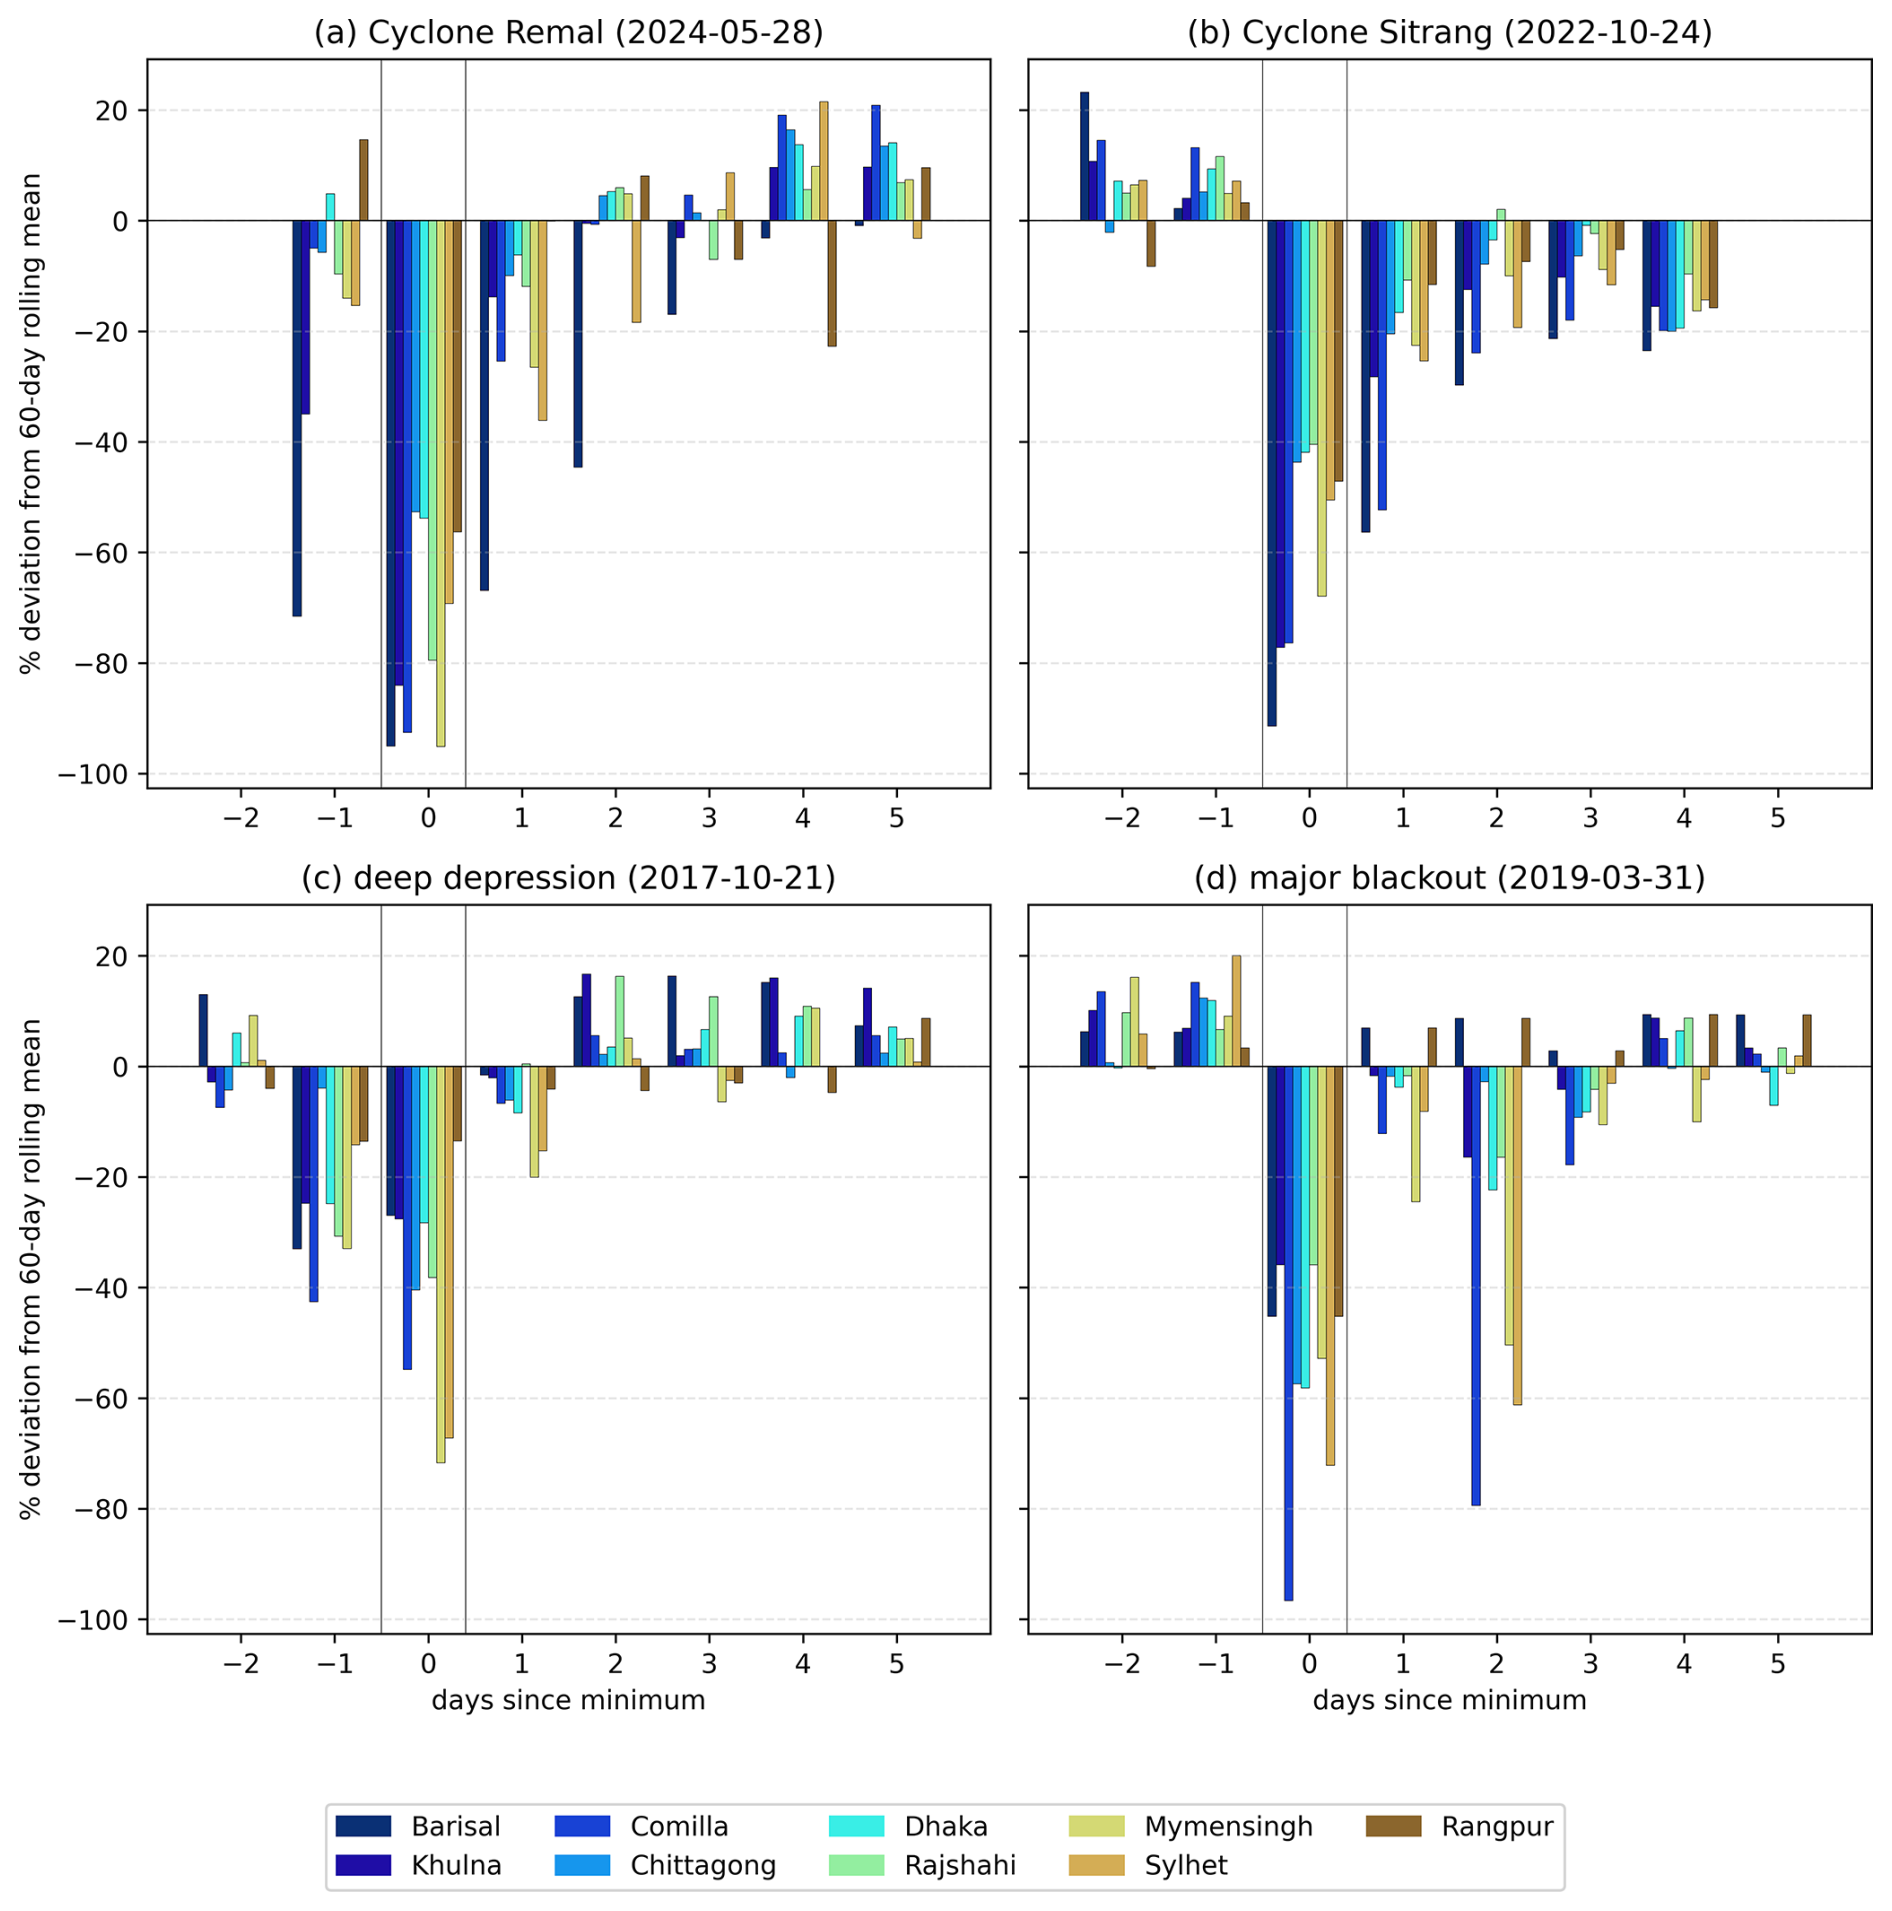
Figure 5Relative change in demand met for each of the nine grid zones in Bangladesh for 4 case studies: (a) Cyclone Remal, (b) Cyclone Sitrang, (c) a landfalling deep depression, and (d) a major blackout not related to a synoptic-scale weather pattern. In each case, the value given is the demand met in each zone relative to a 60 d running mean. Day 0 is the local minimum for national demand met (for each of the cyclone cases, this is also the landfall day), and we show the previous 2 d and the following five. Data were not available for day −2 of Cyclone Remal or day +5 of Cyclone Sitrang. Zones are ordered (blue to brown) approximately by their distance from the coastline, starting with the nearest, consistent with earlier figures.
We start by investigating the change in regional impacts on demand met across Bangladesh's nine power zones (Fig. 5). For Cyclone Remal, we are missing data from day −2. However, on day −1, we can already see a significant impact in coastal zones, with Barisal reporting a fall of 72 % in demand met and Khulna reporting a fall of 35 %. On the day of landfall itself (28 May), all zones reported a large deficit. Even the least affected zone – Chittagong – still had demand met below its rolling 60 d mean. After the dissipation of Remal, most zones recovered quickly, and within 2 d were returned to normal power. Barisal was the exception here, having been heavily damaged by Remal, even 3 d later (31 May), the demand met was still 17 % less than the rolling mean.
The profile for Sitrang is quite different. This time there is no noticeable impact on day −1. As in Remal, on the landfall day itself (24 October) all zones reported a large deficit (from 40 % in Rajshahi to 91 % in Barisal). However, the recovery was considerably slower than for Remal, such that even 4 d later (28 October), all zones reported a deficit, with all but one reporting a deficit of more than 15 %. Three of the coastal zones (Barisal, Khulna, Comilla) were disproportionately affected.
The impact of the worst deep depression (Fig. 5c; landfall on 21 October 2017) was considerably less than either of these tropical cyclones, and the recovery was thus quicker, with all zones returning to normal just 2 d after landfall. As we will see in the next section, depressions often produce heavy rain much further inland than tropical cyclones. This leads to the inland zones being more affected on day 0, and the coastal zones being more affected the day before. Despite the relatively weak synoptic signature of such depressions, they are still capable of significant disruption – Mymensingh and Sylhet reported deficits of 72 % and 67 %, respectively on the day of landfall.
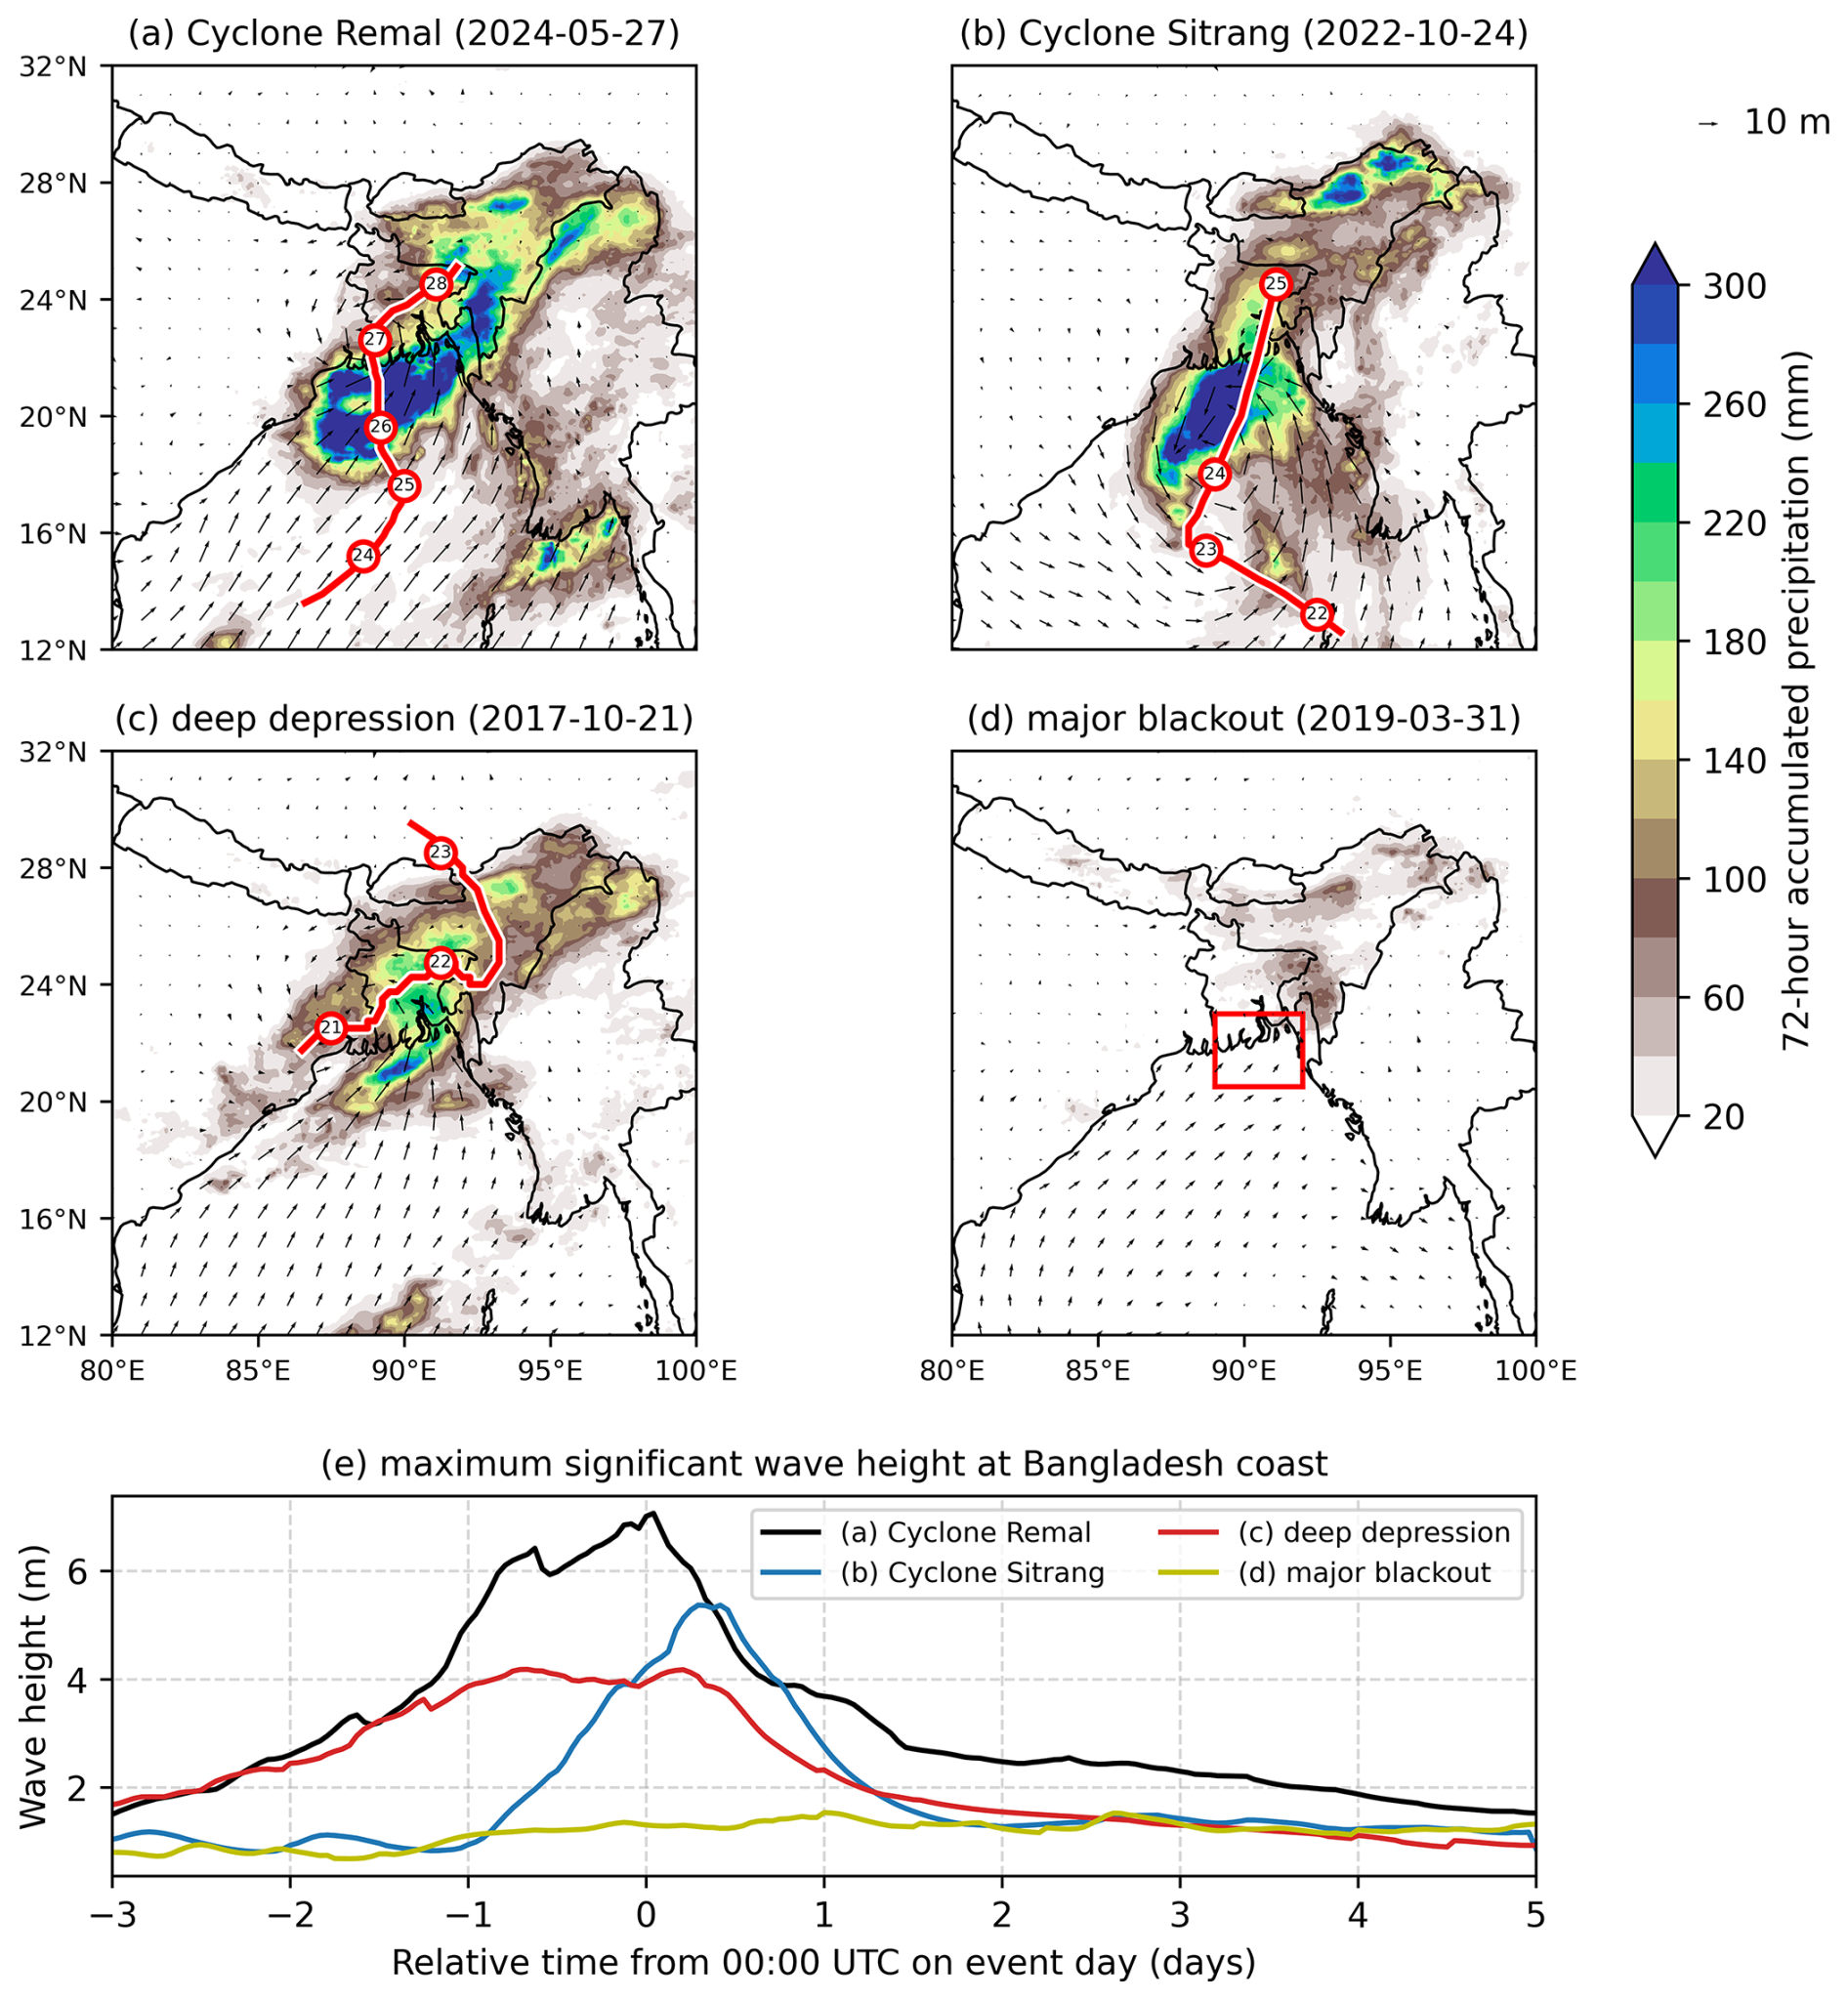
Figure 6Composite weather maps, showing instantaneous 00:00 UTC 10 m winds (vectors) and 72 h precipitation (accumulated from 00:00 UTC the day before to 00:00 UTC 2 d later; filled contours) for 4 case studies: (a) Cyclone Remal, (b) Cyclone Sitrang, (c) a landfalling deep depression, and (d) a major blackout not related to weather. Tracks for the two cyclones and deep depression are given in red, with the location at each 00 Z marked. (e) Shows the maximum hourly significant wave height in ERA5, relative to the event day, in a box surrounding the Bangladeshi coast (20.5–23.0° N, 89–92° E; marked in red in d) as a proxy for storm surge strength.
The major blackout (Fig. 5d; 31 March 2019) differs from the cyclones and depression in that on day 0, there was no significant regional pattern, with neither coastal nor inland states were more affected than the other. Recovery was almost immediate (into day +1), but then a second event hit the grid (which did not coincide with any event in the EM-DAT catalogue) on day +2, again affecting a mix of coastal and inland states. This lack of a clear regional pattern suggests a non-meteorological cause, supported by the absence of strong synoptic forcing, as we show in the next section.
We now present the same 4 cases as synoptic weather charts on the day of maximum dip (Fig. 6). Synoptic-scale storms damage electricity infrastructure through three principal hazard pathways: (i) heavy precipitation and the ensuing pluvial and fluvial flooding; (ii) storm surge and associated coastal inundation; and (iii) destructive winds. In practice these hazards co-occur, making it difficult to cleanly attribute observed power-system impacts to any single component. Bangladesh's small geographic extent relative to the typical precipitation footprint of Bay of Bengal systems further complicates attribution since most events affect the majority of the country more or less simultaneously.
Nevertheless, the 3 case studies in Fig. 6 do allow a degree of contrast. Cyclone Remal (Fig. 6a) produced comparatively modest rainfall totals over Bangladesh – the heaviest precipitation fell over north-eastern India – but generated a large storm surge, with reports of water levels exceeding three metres along parts of the coast (The Business Standard, 2024). This is consistent with ERA5 significant wave heights exceeding 6 m adjacent to Bangladesh's coastline (Fig. 6e), and with widespread, surge- and wind-driven damage to coastal substations and distribution infrastructure. Cyclone Sitrang (Fig. 6b) had weaker winds and surge, yet produced substantially greater rainfall over Bangladesh than Remal. The deep depression (Fig. 6c) was weaker still in terms of winds and surge, but produced even heavier rain totals across the country. This behaviour is characteristic of monsoon depressions over the Indian subcontinent, which often propagate far inland under favourable environmental conditions and are a dominant source of extreme precipitation for much of India (Hunt and Fletcher, 2019; Thomas et al., 2021). Finally, synoptic charts for the March 2019 blackout (Fig. 6d) confirm that this was unlikely to have been caused by weather, despite thunderstorm reports on the day.
Together, these events suggest a general pattern. As precipitation increases and wind and surge severity decreases, the aggregate impact on the power system tends to be slightly smaller (but still very large in absolute terms). All three pathways can produce substantial, system-wide losses on their own, and they frequently arrive as a compound risk. Therefore, any credible risk model for Bangladesh's national critical infrastructure must treat these hazards jointly. These regional disparities raise critical questions about Bangladesh's import strategy, which we will now discuss.
3.3 Cross-border interdependence
We see a similar pattern for West Bengal (Fig. 4b), noting that these composites are conditioned on Bangladesh landfalls. The direct TC impact on West Bengal is therefore weaker and more temporally spread out. For example, TCs reduce demand met there by only about 14 % on day 0. For depressions, the day of maximum West Bengal impact tends to be day +1 relative to Bangladesh landfall, consistent with the tendency for these systems to propagate westward, especially during the monsoon (Boos et al., 2015). West Bengal experiences a comparable number of dip days to Bangladesh, and in both regions their composite profiles are broader and build up over several days, in contrast to the sharper profile of TC- and depression-related dips.
So, although West Bengal and Bangladesh are often co-affected by the same synoptic systems, their weekly demand cycles differ (Friday versus Sunday as the principal low-demand day), so when landfall coincides with one region's weekly minimum, the joint cross-border impact can still be reduced.
3.3.1 Will the Bangladesh–West Bengal HV link help during shocks?
The new high-voltage exchange between Bangladesh (BD) and West Bengal (WB) is intended, in part, to provide resilience when production or transmission assets in Bangladesh are damaged. Therefore, we now ask: how often are Bangladesh's deepest supply shortfalls not mirrored across the border, such that imports could possibly help?
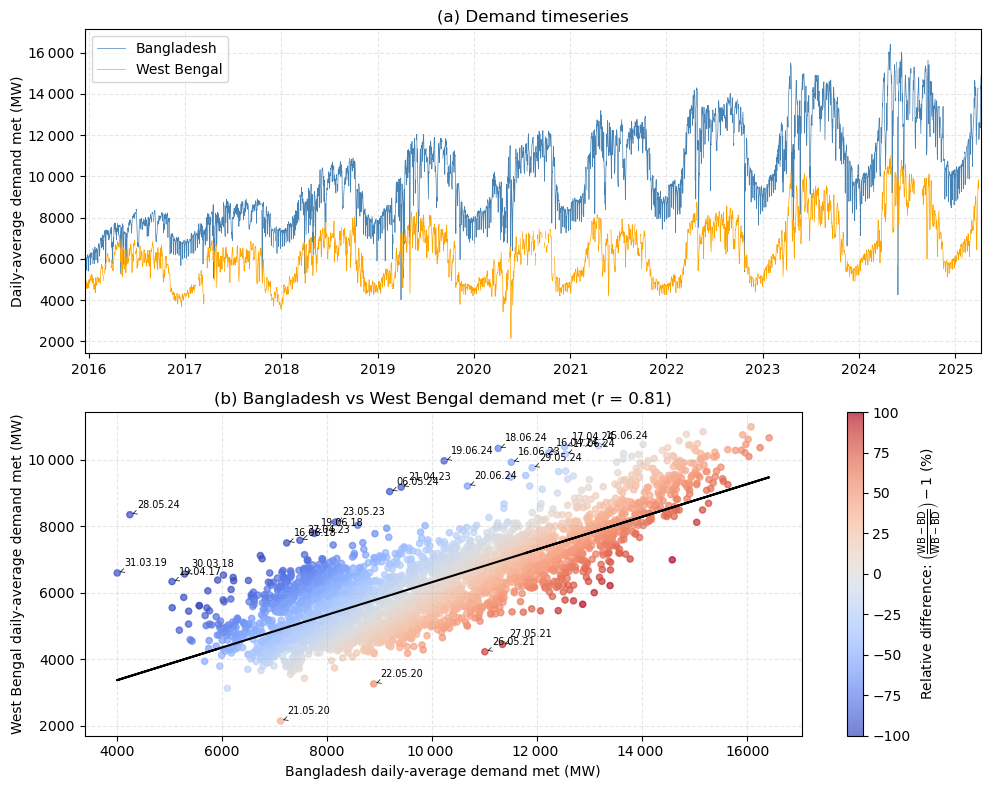
Figure 7Comparison of daily demand met (MW) in Bangladesh and West Bengal from 2016 to the present. (a) Timeseries of daily demand met. (b) A scatter plot showing West Bengal demand met against Bangladesh demand met for each day in the timeseries. Outlier days are marked, with outliers defined as days where the scatter point is at least three standard deviations away from the line of best fit, or days where the sum of both Bangladesh and West Bengal demand met is in the bottom 0.1 %.
As neighbouring regions, Bangladesh and West Bengal experience very similar weather, and consequently very similar seasonal demand profiles (Fig. 7a). This is bad for seasonal-scale complementarity: when one system's demand is high (or low), so is the other's, limiting arbitrage value. Extreme, short-lived events are more promising. A closer inspection of the joint distribution of daily demand met (Fig. 7b) shows that large single- or few-day dips in one system are often not present in the other.
3.3.2 West Bengal-only deep dips are rare and cyclone-driven.
There are really only two clear episodes with very low West Bengal demand that are not matched by similarly low Bangladesh demand. The first is Cyclone Amphan (20–22 May 2020), where landfall over West Bengal led to much larger West Bengal impacts than in Bangladesh. The second is Cyclone Yaas (26–27 May 2021), where landfall over Odisha, close to West Bengal, produced a stronger West Bengal response; the system subsequently weakened before significantly affecting Bangladesh.
3.3.3 Bangladesh-only dips are far more common.
In contrast, there are many cases where Bangladesh demand met is markedly reduced while West Bengal is comparatively unaffected. Firstly, pre-monsoon thunderstorm activity in Bangladesh (16 June 2018, 19 June 2018, 6 May 2024, 23 May 2023), with or without an accompanying synoptic low, depressed Bangladesh demand met disproportionately. Secondly, thunderstorms over Bangladesh associated with the monsoon onset (15–20 June 2024) – during which West Bengal demand remained high, consistent with pre-monsoon heat stress there. Thirdly, there are cases with no obvious synoptic-scale driver (16–17 April 2024, 21 April 2023, 27 April 2023), where Bangladesh demand stayed high in absolute terms, suggesting temperature differences or local operational issues rather than damage.
There are also more extreme Bangladesh-only cases where weather clearly dominated, namely Cyclone Maarutha (19 April 2017), Cyclone Biparjoy (16 June 2023), and Cyclone Remal (28–29 May 2024); and several that were likely not weather-related (30 March 2018 and 31 March 2019).
3.3.4 Both systems low: mostly seasonal minima, not damage.
Days on which both regions reported very low demand met occur during seasonal troughs, possibly linked to public holidays, as 25 December 2015, 1 January 2016, and 16 December 2019 all occurred during the climatologically coolest period of the year and are not associated with strong synoptic forcing. The notable weather-driven exception was on 10 November 2019 (Cyclone Bulbul), when both Bangladesh and West Bengal were simultaneously stressed.
We now quantify correlated stress across the border. As before, we define “dip” days as those when demand met falls below 80 % of a centred 60 d running mean. From 2015–2025 (a total of 3393 d), Bangladesh experienced 82 dip days and West Bengal experienced 46. Only 9 d (0.27 % of all days; 11 % of Bangladesh dips) are synchronised (occurring on the same day) and 16 out of 82 (19.5 %) Bangladesh dips coincided with a West Bengal dip within ± 1 d. During synchronised dips, the mean deficits are large in both systems (Bangladesh averaging 3.1 GW; West Bengal averaging 1.9 GW). While synchronised dips are rare (0.27 % of all days), they are strongly associated with major cyclones, with 5 out of 9 occurring within ± 1 d of a Bangladesh landfalling cyclone. In other words, synchronicity is conditionally high during exactly those events when cross-border import is most needed. Conditional on a Bangladesh deep dip occurring within ± 1 d of cyclone landfall, the probability of a same-day West Bengal deep dip rises to ∼ 45 %, compared with ∼ 6 % for Bangladesh deep dips not occurring with a day of cyclone landfall. No synchronised dips coincided with depression landfalls.
Coastal zones are most affected by cyclone-related electricity disruption. On average, the largest day 0 deficits occur in the most exposed coastal regions (particularly Barisal, Comilla, and Khulna), while inland zones are less affected. This result is consistent across both the composite analysis and the event-based case studies, and indicates that the overall national impact is strongly sensitive to the physical exposure. Although Dhaka is less affected in relative terms, its large share of national demand means that even small changes to demand met there impact the national total.
In addition, there is no single pathway for cyclone impacts. Our case studies show that large shortfalls in demand met can arise from different combinations of wind damage, storm surge, and heavy rainfall. Cyclone Remal appears to have been dominated by wind and surge impacts, whereas Cyclone Sitrang and the October 2017 deep depression were associated with broader and heavier rainfall footprints. This helps to explain why cyclone intensity alone is not a good predictor of electricity-system impact, as the severity of disruption depends not only on wind speed, but also on landfall location, storm size, translation speed, surge, rainfall, and the vulnerability and location of the affected infrastructure.
We also find that cross-border imports only provide limited support during the highest-impact events. Bangladesh-only deep dips are more common than West Bengal-only dips, implying that interconnection can help during localised or non-synchronous shocks. However, the largest cyclone-related disruptions are frequently associated with simultaneous or near-simultaneous stress in West Bengal. In other words, the value of interconnection is greatest when Bangladesh is impacted, but that value may be reduced during basin-wide extremes as both systems are exposed to the same synoptic-scale meteorological forcing.
4.1 Policy implications
A key practical question is whether Bangladesh's 2.5 GW of interconnection capacity with India, principally via West Bengal, offers reliable insurance during high-impact events. Our analysis shows that while the links can and do provide value during many non-extreme conditions, the largest TC-induced shortfalls in Bangladesh often coincide with substantial impacts in West Bengal, because both grids are exposed to the same basin-scale hazards. Bangladesh-only deep dips are far more common than West Bengal-only dips, suggesting that, in practice, the direction of needed support will more often be from India to Bangladesh. However, precisely during the tail events when that support is most valuable (e.g., Remal-like or Bulbul-like storms), correlated stress on both systems can sharply limit the availability of imports. In other words, the diversification benefit of the existing cross-border capacity is real but bounded: it improves resilience to moderate, localised, or operational shocks, but cannot be relied upon as the primary hedge against the most damaging cyclones.
Table 2Vulnerability-ranked adaptation options for Bangladesh's power system under tropical-cyclone hazards. Priority reflects the study's observed impacts (largest deficits in coastal zones; system-wide drops under compound wind–surge) and implementation feasibility.
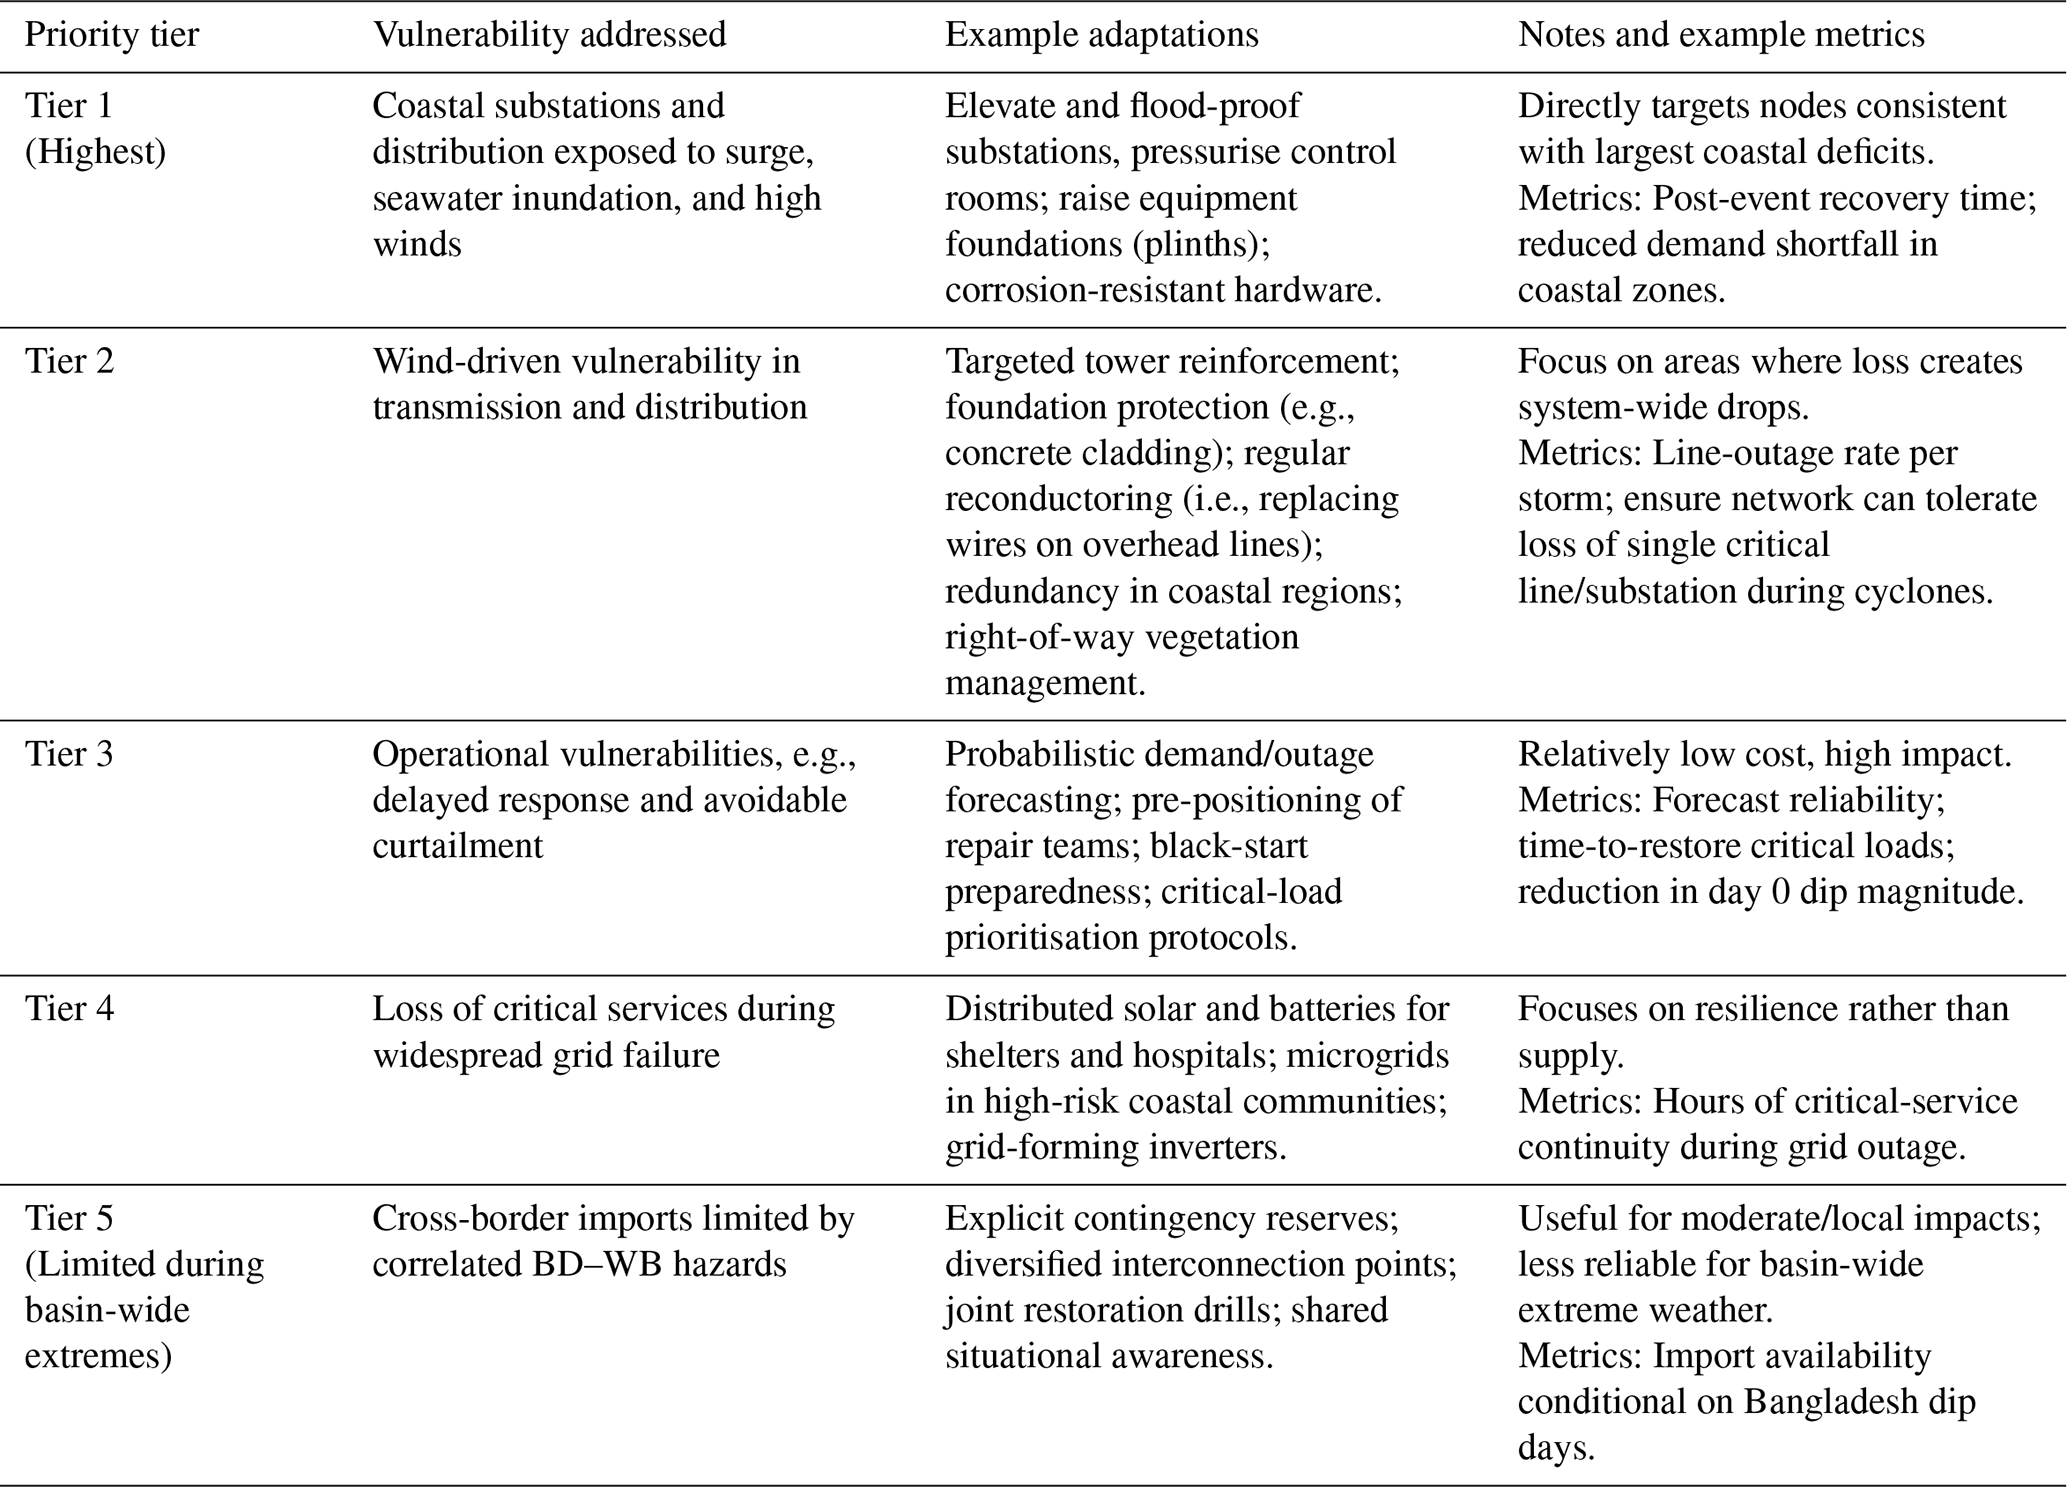
Climate change will increase the frequency and severity of the climate hazards discussed previously (Knutson et al., 2020; Emanuel, 2021) with storm-surges being exacerbated in this shallow continental shelf region by rising sea levels (Rahman et al., 2019) and an increased likelihood of compound coastal flooding (Bevacqua et al., 2020). Similarly large changes in exposure, mainly driven by increasing population combined with changes hazards will further exacerbate risk (Mitchell et al., 2022). Many infrastructure risk assessment tools are currently unable to take into account impacts of climate change as well as changes to exposure and vulnerability, and this work highlights the importance of understanding all three components within this formula for risks, as well as their associated uncertainty. Our results thus carry policy relevance, which we summarise in Table 2. For example, in Tier 4, one solution is resilience through decentralisation. A real-world example of this is Bhasan Char, a low-lying offshore island settlement in the Meghna estuary. As part of the island's development, solar power systems were planned and installed to provide 24 h electricity, alongside elevated housing and cyclone shelters (Dhaka Tribune, 2019).
4.2 Limitations and future work
The main limitation of this study is that we work with daily totals of demand met, which conflate physical damage, deliberate load shedding, and demand suppression (e.g., due to evacuation). Finer temporal resolution (e.g., hourly dispatch) or local-level outage logs would allow a cleaner attribution of mechanisms and recovery trajectories. Our hazard characterisation is approximate (e.g., surge inference from significant wave height; coarse-resolution winds), the OpenStreetMap infrastructure layers are incomplete, and the analysis period (2015–2025) is short relative to low-frequency variability, all of which introduce uncertainty. These limitations also hinder our ability to diagnose compound and temporally compounding processes with confidence.
Future work could consider (i) using higher-frequency operational data and satellite night-time lights to distinguish physical damage from curtailment or demand suppression; (ii) building multi-hazard risk models that convert meteorological fields into expected demand shortfalls; (iii) test temporal compounding by conditioning impacts on antecedent rainfall, soil moisture, or recent infrastructure faults/repairs, and by constructing storyline sequences (e.g., depressions followed by TCs, or TCs followed by heatwaves, that may result in increased air conditioning demand Feng et al., 2022); (iv) stress-test the grid with a national dispatch/network model (e.g., stochastically as in Boyle et al., 2022 or through optimisation modelling as in Bennett et al., 2021) under contrasting climate storylines and sea-level rise; and (v) disentangling the causes of non-meteorological dip days.
4.3 Wider implications
Our key result is that Bangladesh's power system is already experiencing cyclone-driven supply shocks large enough to measurably undermine short-term electricity security, and that such events disproportionately impact coastal zones while also limiting the utility of cross-border imports through correlated regional hazards. This means that continued expansion of capacity is necessary but not sufficient. Instead, ensuring that electricity is reliably delivered during extremes must be the highest priority.
This relates to both SDG 7 (Affordable and Clean Energy) and SDG 13 (Climate Action). SDG 7 is typically discussed in terms of expanding access and adequacy, but here we demonstrate the importance of the reliability of modern energy services during disasters, since large, multi-day supply shortfalls can disrupt health care, water supply, communications, education, and livelihoods even in places that nominally have grid access. SDG 13 focuses on adaptation and resilience. Cyclone-driven electricity disruptions of the magnitude we document here are clearly an immediate adaptation challenge for the energy sector. Resilience is a requirement for maintaining essential services during climate-related hazards and for preventing repeated disaster-driven setbacks.
Using almost a decade of daily, zone-resolved metered demand data, we have shown that landfalling tropical cyclones systematically and severely depress Bangladesh's demand met. On the day of landfall, national demand met falls by an average of ∼ 20 %, with coastal zones bearing the brunt (mean deficits up to 38 %). The most extreme event in our record, Cyclone Remal (28 May 2024), reduced national demand met to 4253 MW – a 67 % drop relative to the previous day and 71 % relative to 2 d prior. Landfalling depressions are less destructive in aggregate, but still material: they reduce national demand met by about 8 % on average on the day of landfall. We also identified a large class of short, sharp “dip” days unrelated to TCs or depressions that produce even larger composite deficits (28 % on day 0). These dip days are too frequent and too deep to be explained by the weekly cycle (Bangladesh's Friday minimum is only ∼ 6 % below the weekly mean) or public holidays (average ∼ 5.5 % reduction), implying a mixture of other weather hazards, prolonged flood-driven constraints, operational curtailment, and grid-internal issues.
Case studies of Remal and Sitrang demonstrate that distinct hazard pathways – wind and surge for Remal; widespread heavy rain for Sitrang and the deep depression – can each, independently, generate system-wide losses. Recovery dynamics differ between events: following Remal, most zones recovered to within 5 %–10 % of normal within 2 d, whereas after Sitrang, substantial deficits persisted 4 d later. Inland zones are consistently less affected in percentage terms, but Dhaka alone accounts for nearly 40 % of national demand; aggregating to the national scale therefore masks the disproportionate coastal burden and the operational challenge of restoring service to smaller, more exposed systems.
In summary, Bangladesh's electricity system remains highly vulnerable as tropical cyclones routinely reduce demand met by 20 %–70 %, with coastal zones suffering near-total collapse during major events. As climate change continues to intensify these storms, and as the grid continues to expand rapidly into exposed areas, the window for adaptation is narrowing. Building resilience requires targeted hardening of coastal infrastructure, decentralised backup for critical services, and explicit planning for the fact that cross-border imports cannot insure against basin-wide extremes. The choice is thus not whether to adapt the power system to cyclone risk, but how quickly and how comprehensively to do so.
The ERA5 data used in this study can be freely downloaded from https://doi.org/10.24381/cds.adbb2d47 (Hersbach et al., 2023). Similarly, the IMERG data used can be freely downloaded from https://disc.gsfc.nasa.gov/datasets/GPM_3IMERGHH_07/summary?keywords=%22IMERG%20final%22 (last access: 30 April 2026). Views of the EM-DAT database can be freely downloaded from https://public.emdat.be/ (last access: 30 April 2026). Demand data for Bangladesh at the zone level were scraped from daily data archived by the Bangladesh Power Development Board (https://misc.bpdb.gov.bd/area-wise-demand, last access: 30 April 2026). Note for reviewers: we are releasing this demand dataset as part of a larger package in the next few months.
KH conceived the study and conducted the analysis, while receiving feedback from HB. KH and HB then co-wrote the manuscript.
The contact author has declared that none of the authors has any competing interests.
Publisher's note: Copernicus Publications remains neutral with regard to jurisdictional claims made in the text, published maps, institutional affiliations, or any other geographical representation in this paper. The authors bear the ultimate responsibility for providing appropriate place names. Views expressed in the text are those of the authors and do not necessarily reflect the views of the publisher.
Kieran M. R. Hunt is supported by a NERC Independent Research Fellowship (MITRE; NE/W007924/1). Hannah C. Bloomfield is funded by a Newcastle University Academic Track Fellowship. ChatGPT was used to draft the structure of some sections.
This research has been supported by the Natural Environment Research Council (grant no. NE/W007924/1). Hannah C. Bloomfield is funded by a Newcastle University Academic Track Fellowship.
This paper was edited by Bayes Ahmed and reviewed by two anonymous referees.
Adshead, D., Paszkowski, A., Gall, S. S., Peard, A. M., Adnan, M. S. G., Verschuur, J., and Hall, J. W.: Climate threats to coastal infrastructure and sustainable development outcomes, Nat. Clim. Change, https://doi.org/10.1038/s41558-024-01950-2, 2024. a
Ahmed, T., Hong, S.-H., Jin, H.-G., Lee, J., and Baik, J.-J.: Evaluation of IMERG data in Bangladesh and surrounding regions and their application to studying diurnal variation of precipitation, Theor. Appl. Climatol., 146, 395–410, 2021. a
Alam, E.: Factors of cyclone disaster deaths in coastal Bangladesh, Heliyon, 9, e18417, https://doi.org/10.1016/j.heliyon.2023.e18417, 2023. a, b
Baburaj, P. P., Abhilash, S., Mohankumar, K., and Sahai, A. K.: On the epochal variability in the frequency of cyclones during the pre-onset and onset phases of the monsoon over the North Indian Ocean, Adv. Atmos. Sci., 37, 634–651, 2020. a
Balaji, M., Chakraborty, A., and Mandal, M.: Changes in tropical cyclone activity in north Indian Ocean during satellite era (1981–2014), Int. J. Climatol., 38, 2819–2837, 2018. a
Bangladesh Ministry of Food and Disaster Management: Cyclone Disaster Vulnerability and Response Experiences in Coastal Bangladesh, https://www.preventionweb.net/files/9470_cyclonebangladesh.pdf (last access: 16 May 2025), 2008. a
Bangladesh Power Development Board: Annual Report 2022–2023, https://bpdb.portal.gov.bd/sites/default/files/files/bpdb.portal.gov.bd/page/771c9a89_a06c_4c2f_9b8c_699d17ed769a/2024-01-03-06-02-dda85c69e3462d6de89b6486edd08779.pdf (last access: 16 May 2025), 2023. a
Bangladesh Power Development Board: Daily Generation Report – 14 May 2025, https://misc.bpdb.gov.bd/daily-generation?date=14-05-2025 (last access: 16 May 2025), 2025. a
Belmonte Rivas, M. and Stoffelen, A.: Characterizing ERA-Interim and ERA5 surface wind biases using ASCAT, Ocean Sci., 15, 831–852, https://doi.org/10.5194/os-15-831-2019, 2019. a
Bennett, J. A., Trevisan, C. N., DeCarolis, J. F., Ortiz-García, C., Pérez-Lugo, M., Etienne, B. T., and Clarens, A. F.: Extending energy system modelling to include extreme weather risks and application to hurricane events in Puerto Rico, Nature Energy, 6, 240–249, 2021. a, b
Bern, C., Sniezek, J., Mathbor, G. M., Siddiqi, M. S., Ronsmans, C., Chowdhury, A. M. R., Choudhury, A. E., Islam, K., Bennish, M., Noji, E., and Glass, R. I.: Risk factors for mortality in the Bangladesh cyclone of 1991, B. World Health Organ., 71, 73–78, 1993. a, b
Bernard, A., Long, N., Becker, M., Khan, J., and Fanchette, S.: Bangladesh's vulnerability to cyclonic coastal flooding, Nat. Hazards Earth Syst. Sci., 22, 729–751, https://doi.org/10.5194/nhess-22-729-2022, 2022. a
Bevacqua, E., Vousdoukas, M. I., Zappa, G., Hodges, K., Shepherd, T. G., Maraun, D., Mentaschi, L., and Feyen, L.: More meteorological events that drive compound coastal flooding are projected under climate change, Communications Earth & Environment, 1, 47, https://doi.org/10.1038/s43247-020-00044-z, 2020. a
Boos, W. R., Hurley, J. V., and Murthy, V. S.: Adiabatic westward drift of Indian monsoon depressions, Q. J. Roy. Meteor. Soc., 141, 1035–1048, https://doi.org/10.1002/qj.2454, 2015. a
Boyle, E., Inanlouganji, A., Carvalhaes, T., Jevtić, P., Pedrielli, G., and Reddy, T. A.: Social vulnerability and power loss mitigation: A case study of Puerto Rico, Int. J. Disast. Risk Re., 82, 103357, https://doi.org/10.1016/j.ijdrr.2022.103357, 2022. a
Central Electricity Regulatory Commission: Central Electricity Regulatory Commission (Indian Electricity Grid Code) Regulations, 2023, regulations specifying day-ahead and intraday scheduling, and TTC/ATC assessment and revision, incl. natural-disaster assessments by NLDC/RLDC/SLDC, https://cercind.gov.in/Regulations/180-Regulations.pdf (last access: 30 April 2026), 2023. a
Chiu, S. and Small, C.: Observations of cyclone-induced storm surge in coastal Bangladesh, J. Coastal Res., 32, 1149–1161, 2016. a
Coombes, O. G., Hunt, K., and Bloomfield, H.: SASEA Electricity Demand Data for 2013–2025, Zenodo [data set], https://doi.org/10.5281/zenodo.17175212, 2025. a
Delforge, D., Wathelet, V., Below, R., Sofia, C. L., Tonnelier, M., van Loenhout, J. A., and Speybroeck, N.: EM-DAT: the emergency events database, Int. J. Disast. Risk Re., 105509, https://doi.org/10.1016/j.ijdrr.2025.105509, 2025. a
Dhaka Tribune: Inside the Bhashan Char plan for Rohingyas, Dhaka Tribune (published 29 January 2019), https://www.dhakatribune.com/bangladesh/rohingya-crisis/167340/inside-the-bhashan-char-plan-for-rohingyas (last access: 20 January 2026), 2019. a
Drew, D. R., Coker, P. J., Bloomfield, H. C., Brayshaw, D. J., Barlow, J. F., and Richards, A.: Sunny windy sundays, Renewable Energy, 138, 870–875, 2019. a
Emanuel, K.: Tropical cyclone risk in Bangladesh, Mausam, 72, 27–34, 2021. a
Feng, K., Ouyang, M., and Lin, N.: Tropical cyclone-blackout-heatwave compound hazard resilience in a changing climate, Nat. Commun., 13, 4421, https://doi.org/10.1038/s41467-022-32018-4, 2022. a
Grochowicz, A., Van Greevenbroek, K., and Bloomfield, H. C.: Using power system modelling outputs to identify weather-induced extreme events in highly renewable systems, Environ. Res. Lett., 19, 054038, https://doi.org/10.1088/1748-9326/ad374a, 2024. a
Haque, U., Hashizume, M., Kolivras, K. N., Overgaard, H. J., Das, B., and Yamamoto, T.: Reduced death rates from cyclones in Bangladesh: what more needs to be done?, B. World Health Organ., 90, 150–156, https://doi.org/10.2471/BLT.11.088302, 2012. a
Hersbach, H., Bell, B., Berrisford, P., Hirahara, S., Horányi, A.,Muñoz-Sabater, J., Nicolas, J., Peubey, C., Radu, R., Schepers, D., Simmons, A., Soci, C., Abdalla, S., Abellan, X., Balsamo, G., Bechtold, P., Biavati, G., Bidlot, J., Bonavita, M., De Chiara, G., Dahlgren, P., Dee, D., Diamantakis, M., Dragani, R., Flemming, J., Forbes, R., Fuentes, M.,Geer, A., Haimberger, L., Healy, S., Hogan, R. J., Hólm, E., Janisková, M., Keeley, S., Laloyaux, P., Lopez, P., Lupu, C., Radnoti, G., de Rosnay, P., Rozum, I., Vamborg, F., Villaume, S., and Thépaut, J.-N.: The ERA5 global reanalysis, Q. J. Roy. Meteor. Soc., 146, 1999–2049, 2020. a
Hersbach, H., Bell, B., Berrisford, P., Biavati, G., Horányi, A., Muñoz Sabater, J., Nicolas, J., Peubey, C., Radu, R., Rozum, I., Schepers, D., Simmons, A., Soci, C., Dee, D., and Thépaut, J.-N.: ERA5 hourly data on single levels from 1940 to present, Copernicus Climate Change Service (C3S) Climate Data Store (CDS) [data set], https://doi.org/10.24381/cds.adbb2d47, 2023. a, b
Hossain, M. N.: Analysis of human vulnerability to cyclones and storm surges based on influencing physical and socioeconomic factors: evidences from coastal Bangladesh, Int. J. Disast. Risk Re., 13, 66–75, 2015. a
Hou, A. Y., Kakar, R. K., Neeck, S., Azarbarzin, A. A., Kummerow, C. D., Kojima, M., Oki, R., Nakamura, K., and Iguchi, T.: The global precipitation measurement mission, B. Am. Meteorol. Soc., 95, 701–722, 2014. a
Huffman, G. J., Bolvin, D. T., Joyce, R., Kelley, O. A., Nelkin, E. J., Tan, J., Watters, D. C., and West, B. J.: Integrated Multi-satellitE Retrievals for GPM (IMERG) technical documentation, NASA/GSFC Code, 612, 2019, 2015. a
Hunt, K. M. R. and Bloomfield, H. C.: Building and explaining data-driven energy demand models for Indian states, Environmental Research: Energy, 2, https://doi.org/10.1088/2753-3751/adc7bc, 2025. a
Hunt, K., and Bloomfield, H.: Daily electricity demand data for Indian states (2014–2024) (1.0), Zenodo [data set], https://doi.org/10.5281/zenodo.14983362, 2025b. a
Hunt, K. M. R. and Fletcher, J. K.: The relationship between Indian monsoon rainfall and low-pressure systems, Clim. Dynam., 53, 1–13, 2019. a
India Meteorological Department: Disastrous Weather Events 2020, Tech. rep., Climate Research & Services, India Meteorological Department, Pune, https://www.imdpune.gov.in/library/public/DWE-2020.pdf (last access: 30 April 2026), 2024. a
International Energy Agency: Glossary: Energy security, IEA website, https://www.iea.org/glossary, last access: 14 January 2026. a
International Energy Agency: Climate Resilience for Energy Security in Southeast Asia, https://www.iea.org/reports/climate-resilience-for-energy-security-in-southeast-asia/executive-summary (last access: 30 April 2026), 2024. a
International Energy Agency: Bangladesh – Energy Mix, https://www.iea.org/countries/bangladesh/energy-mix (last access: 16 May 2025), 2025. a
Islam, T. and Peterson, R. E.: Climatology of landfalling tropical cyclones in Bangladesh 1877–2003, Nat. Hazards, 48, 115–135, 2009. a
Karim, M. F. and Mimura, N.: Impacts of climate change and sea-level rise on cyclonic storm surge floods in Bangladesh, Global Environ. Chang., 18, 490–500, 2008. a
Kelman, I., Ahmed, B., Esraz-Ul-Zannat, M., Saroar, M. M., Fordham, M., and Shamsudduha, M.: Warning systems as social processes for Bangladesh cyclones, Disaster Prev. Manag., 27, 370–379, https://doi.org/10.1108/DPM-12-2017-0318, 2018. a, b
Knutson, T., Camargo, S. J., Chan, J. C. L., Emanuel, K., Ho, C.-H.,Kossin, J., Mohapatra, M., Satoh, M., Sugi, M., Walsh, K., and Wu, L.: Tropical cyclones and climate change assessment: Part II: Projected response to anthropogenic warming, B. Am. Meteorol. Soc., 101, E303–E322, 2020. a, b
Kozu, T., Kawanishi, T., Kuroiwa, H., Kojima, M., Oikawa, K., Kumagai, H., Okamoto, K., Okumura, M., Nakatsuka, H., and Nishikawa, K.: Development of precipitation radar onboard the Tropical Rainfall Measuring Mission (TRMM) satellite, IEEE T. Geosci. Remote, 39, 102–116, https://doi.org/10.1109/36.898669, 2001. a
Kummerow, C., Barnes, W., Kozu, T., Shiue, J., and Simpson, J.: The Tropical Rainfall Measuring Mission (TRMM) Sensor Package, J. Atmos. Ocean. Tech., 15, 809–817, https://doi.org/10.1175/1520-0426(1998)015<0809:TTRMMT>2.0.CO;2, 1998. a
Kummerow, C., Simpson, J., Thiele, O., Barnes, W., Chang, A. T. C., Stocker, E., Adler, R. F., Hou, A., Kakar, R., Wentz, F., Ashcroft, P., Kozu, T., Hong, Y., Okamoto, K., Iguchi, T., Kuroiwa, H., Im, E., Haddad, Z., Huffman, G., Ferrier, B., Olson, W. S., Zipser, E., Smith, E. A., Wilheit, T. T., North, G., Krishnamurti, T., and Nakamura, K.: The status of the Tropical Rainfall Measuring Mission (TRMM) after two years in orbit, J. Appl. Meteorol., 39, 1965–1982, https://doi.org/10.1175/1520-0450(2001)040<1965:TSOTTR>2.0.CO;2, 2000. a
Ministry of Power, Government of India: Guidelines for Import/Export (Cross Border) of Electricity – 2018, https://powermin.gov.in/en/content/guidelines-importexport-cross-border-electricity-2018 (last access: 14 January 2026), issued 18 December 2018, 2018. a
Mitchell, D., Hawker, L., Savage, J., Bingham, R., Lord, N. S., Uddin Khan, M. J., Bates, P., Durand, F., Hassan, A., Huq, S., Saiful Islam, A., Krien, Y., Neal, J., Sampson, C., Smith, A., and Testut, L.: Increased population exposure to Amphan-scale cyclones under future climates, Climate Resilience and Sustainability, 1, e36, https://doi.org/10.1002/cli2.36, 2022. a
Mo, Y., Thomas, F., Rui, J., and Hall, J.: Daily night-time lights reveal prolonging global electric power system recovery times following tropical cyclone damage, Environmental Research: Infrastructure and Sustainability, https://doi.org/10.1088/2634-4505/ade474, 2025. a
Needs Assessment Working Group (NAWG) and Humanitarian Coordination Task Team (HCTT): Bangladesh: Cyclone Amphan Joint Needs Assessment, https://fscluster.org/sites/default/files/documents/cyclone_amphan_joint_needs_assessment_final_draft_31_may.pdf (last access: 30 April 2026), 2020. a
OpenStreetMap contributors: Planet dump retrieved from https://planet.osm.org, https://www.openstreetmap.org (last access: 30 April 2026), 2017. a
Paul, B. K.: Why relatively fewer people died? The case of Bangladesh's Cyclone Sidr, Nat. Hazards, 50, 289–304, https://doi.org/10.1007/s11069-008-9340-5, 2009. a, b
Power Division, Government of Bangladesh: Integrated Energy and Power Master Plan (IEPMP) 2023, https://powerdivision.portal.gov.bd/sites/default/files/files/powerdivision.portal.gov.bd/npfblock/IEPMP_Report_2023.pdf (last access: 14 January 2026), 2023. a
Rahman, S., Islam, A. S., Saha, P., Tazkia, A. R., Krien, Y., Durand, F., Testut, L., Islam, G. T., and Bala, S. K.: Projected changes of inundation of cyclonic storms in the Ganges–Brahmaputra–Meghna delta of Bangladesh due to SLR by 2100, J. Earth Syst. Sci., 128, 145, https://doi.org/10.1007/s12040-019-1184-8, 2019. a
Roberts, M. J., Camp, J., Seddon, J., Vidale, P. L., Hodges, K., Vannière, B., Mecking, J., Haarsma, R., Bellucci, A., Scoccimarro, E., Caron, L.-P., Chauvin, F., Terray, L., Valcke, S., Moine, M.-P., Putrasahan, D., Roberts, C. D., Senan, R., Zarzycki, C., Ullrich, P., Yamada, Y., Mizuta, R., Kodama, C., Fu, D., Zhang, Q., Danabasoglu, G., Rosenbloom, N., Wang, H., and Wu, L.: Projected future changes in tropical cyclones using the CMIP6 HighResMIP multimodel ensemble, Geophys. Res. Lett., 47, e2020GL088662, https://doi.org/10.1029/2020GL088662, 2020. a
Sahoo, B. and Bhaskaran, P. K.: Assessment on historical cyclone tracks in the Bay of Bengal, east coast of India, Int. J. Climatol., 36, https://doi.org/10.1002/joc.4331, 2016. a
Shahid, S.: Vulnerability of the power sector of Bangladesh to climate change and extreme weather events, Reg. Environ. Change, 12, 595–606, 2012. a
Singh, K., Panda, J., Sahoo, M., and Mohapatra, M.: Variability in tropical cyclone climatology over North Indian Ocean during the period 1891 to 2015, Asia-Pac. J. Atmos. Sci., 55, 269–287, 2019. a
Skoufias, E., Strobl, E., and Tveit, T.: Can we rely on VIIRS nightlights to estimate the short-term impacts of natural hazards? Evidence from five South East Asian countries, Geomat. Nat. Haz. Risk, 12, 381–404, https://doi.org/10.1080/19475705.2021.1879943, 2021. a
South Asian Association for Regional Cooperation (SAARC): SAARC Framework Agreement for Energy Cooperation (Electricity), https://giwmscdntwo.gov.np/media/pdf_upload/04%20SAARC%20Framework%20Agreement%20for%20Energy%20Cooperation%20%28Electricity%29_euhcuu6.pdf (last access: 14 January 2026), signed 27 November 2014, 2014. a
The Business Standard: Echoes of sorrow across Sundarbans after Cyclone Remal, https://www.tbsnews.net/bangladesh/echoes-sorrow-across-sundarbans-after-cyclone-remal-862741 (last access: 24 June 2025), 2024. a
The World Bank Group: Energy Security Issues, Tech. rep., The World Bank Group, Moscow–Washington, DC, https://documents1.worldbank.org/curated/en/464811468175435408/pdf/361100ENGLISH01gy1Security01PUBLIC1.pdf (last access: 30 April 2026), 2005. a
Thomas, T. M., Bala, G., and Srinivas, V. V.: Characteristics of the monsoon low pressure systems in the Indian subcontinent and the associated extreme precipitation events, Clim. Dynam., 56, 1859–1878, 2021. a
Wohland, J., Bloin-Wibe, L., Fischer, E., Göke, L., Knutti, R., De Marco, F., Beyerle, U., and Savelsberg, J.: Climate2Energy: a framework to consistently include climate change into energy system modeling, arXiv [preprint], arXiv:2508.09531, 2025. a
World Bank: Program Appraisal Document on a Proposed IDA Scale-Up Facility Credit and Clean Technology Fund Grant to the People's Republic of Bangladesh for an Electricity Distribution Modernization Program, Project Appraisal Document PAD4596, Energy and Extractives Global Practice, South Asia Region, Project ID: P174650, World Bank, Washington, DC, https://documents1.worldbank.org/curated/en/699101641925765708/pdf/Bangladesh-Electricity-Distribution-Modernization-Program-Project.pdf (last access: 30 April 2026), 2021. a
World Bank: Bangladesh — Electricity Distribution Modernization Program: Ensuring Reliable, Affordable, and Clean Electricity Supply in Rural Areas, Fact sheet in The World Bank in Bangladesh 2024: Project Profiles, https://documents1.worldbank.org/curated/en/099511501032420315/pdf/IDU1efbbf15a11558149531ab5314697ca357770.pdf (last access: 30 April 2026), 2024. a
World Meteorological Organization: Cyclone Amphan highlights the value of multi-hazard early warnings, https://wmo.int/media/news/cyclone-amphan-highlights-value-of-multi-hazard-early-warnings (last access: 30 April 2026), news release 22 May 2020, 2020. a
Xin, Y., Yang, Y., Chen, X., Yue, X., Liu, Y., and Yin, C.: Evaluation of IMERG and ERA5 precipitation products over the Mongolian Plateau, Sci. Rep., 12, 21776, https://doi.org/10.1038/s41598-022-26047-8, 2022. a
Ye, M., Ward, P. J., Bloemendaal, N., Nirandjan, S., and Koks, E. E.: Risk of Tropical Cyclones and Floods to Power Grids in Southeast and East Asia, Int. J. Disast. Risk Sc., 15, 494–507, https://doi.org/10.1007/s13753-024-00573-7, 2024. a