the Creative Commons Attribution 4.0 License.
the Creative Commons Attribution 4.0 License.
 | 20 Apr 2026
Prototype citizen and community science app for urban heavy rainfall risk management in the Ahr Valley, Germany
Jaqueline Hoffmann
Sascha Nau
Sabrina Abler
Vincent Theis
Peter Fischer-Stabel
Julian Janßen
Andreas Abecker
The increasing frequency and intensity of extreme rainfall events present a critical global challenge for urban areas. While flood risk management has historically prioritised fluvial hazards, pluvial flooding and urban overland runoff pathways require local and global attention and scalable, community-inclusive solutions. This proof-of-concept paper presents the local-scale development and implementation of a prototype Citizen and Community Science mobile application, designed within a municipal extreme rainfall context, where both the app's testing environment and current operational scale are spatially limited to neighbourhood and city level in the Ahr valley. The prototype enables residents to document, classify, and report pluvial flood risks, while supporting community-based risk minimisation through enhanced awareness and embedded educational guidance on hazard categorisation and preventive actions. Crowdsourced observations are transferred to a Geo Data Warehouse, providing local authorities with customisable dashboards for analysis, visualisation, and decision support. Although technical constraints remain – particularly restricted offline functionality and variability in Global Navigation Satellite System accuracy – the system architecture was intentionally designed to support iterative refinement. Despite its present local application, the prototype is based on a fully open-source, modular, and scalable design, allowing international transferability and future expansion to regional, national, or global datasets and governance frameworks. This proof-of-concept thus demonstrates the global scaling potential of combining citizen-generated flood risk data with centralised geospatial infrastructure as a pathway toward more climate-resilient and participatory urban pluvial flood risk management worldwide.
- Article
(5378 KB) - Full-text XML
-
Supplement
(917 KB) - BibTeX
- EndNote


Heavy rainfall events and flood disasters have increased in frequency and intensity in recent years (Deumlich and Gericke, 2020). Because of climate change this trend will continue to intensify in the coming years and decades, causing numerous material and human losses. In Europe, extreme weather events are increasing frequently, leading to severe damage in some areas due to pressure systems such as the low-pressure system “Bernd” in July 2021. “Bernd” caused flooding that was characterised by particularly high flow velocities, rapid progression of the flood event and high water levels, especially in the Ahr Valley (Rhein and Kreibich, 2025). In 72 h, more than 150 mm of precipitation fell on already saturated soil, leading to particularly high runoff (Mohr et al., 2023). The flood led to the loss of 135 lives in the Ahr Valley (Heidbreder, 2023). Floods, such as those in the Ahr Valley, have shown that warning the population in time is a crucial factor, especially in pluvial events (Rhein and Kreibich, 2025). To mitigate this factor, continuous research is being conducted on better forecasting methods and the communication of various alert chains is being improved. An important part of risk management in flood protection is the identification and communication of flow paths in urban areas (Agonafir et al., 2023; Schmitt and Scheid, 2020).
Risk management includes a wide range of measures aimed at mitigating problematic areas within these flow paths that may pose dangers during heavy rainfall events (Schmitt and Scheid, 2020). These include, for example, clogged drains, grates, and sieves that can no longer absorb water masses during strong runoff, causing the water to flow elsewhere (Agonafir et al., 2023).
Identifying such problematic areas requires a high level of local knowledge. Many citizens are familiar with how their neighbourhood behaves during heavy rainfall events and possess detailed knowledge about runoff behaviour on their own property and in adjacent public spaces. This valuable knowledge often resides with residents who have observed and even documented their surroundings during past events. Since responsibility for public spaces lies with the respective municipalities (in Germany), establishing a communication chain between these knowledgeable locals and decision-makers is essential. This knowledge is particularly valuable for researchers and municipalities in preventing heavy rainfall events. The involvement of citizens in research projects through Citizen Science, Community Science and Citizen and Community Science has been established for several years and is increasingly being used in civil projects (Bonney, 1996; Conrad and Hilchey, 2011; Irwin, 1995). The goal is to provide local knowledge to researchers and municipalities to enable efficient and effective risk management. Communication with citizens also plays a crucial role in this process (Denda and Fujikane, 2024). Participation fosters greater tolerance and acceptance of implemented measures among those affected (Ueberham, 2016).
This participatory process shall be implemented in the form of a mobile application (app) for Android smartphones. The app should allow citizens to report problematic areas directly, including both the exact location and a description of the issue. At its current stage, the app represents a functional prototype that has been specifically developed and tested for the local extreme rainfall risk context of the Ahr Valley (Germany). Researchers or municipalities can analyse the data according to their risk management strategies and use it for implementing measures. Due to its modular open-source architecture, the prototype was intentionally designed to support future scalability and global transferability, enabling adaptation and deployment in other regions worldwide, beyond the original local use case. With this tool we aim to investigate how the citizen and community science method in heavy rainfall prevention can be technically implemented and tested as a contribution to sustainable flood management.
The paper begins with a literature review on the topics of risk management in flood scenarios, citizen and community science, and appropriate technical solutions (Sect. 2). This is followed by a description of the methods (Sect. 3) used and a detailed presentation of the results (Sect. 4). The discussion section explains the advantages of the citizen and community science method regarding the management of emergency drainage routes, as well as the challenges and limitations of the method (Sect. 5). Section 6 concludes with a summary of the work.
2.1 Flood risk management – local and global relevance of heavy rainfall and pluvial hazards
Flood events occur periodically during both winter and summer in rivers and larger water bodies within Germany's low mountain regions (Bronstert et al., 2023). These fluvial floods are well-documented hydrological phenomena to which residents are generally accustomed, enabling them to cope with moderate events with a considerable degree of confidence and resilience (Thieken et al., 2007). Floods that originate from watercourses are the result of long-term rainfall or melting snow are referred to as fluvial phenomena (Bronstert et al., 2023). To understand these processes, it is essential to distinguish clearly between fluvial and pluvial flood types and their differing hydrological characteristics. Unlike fluvial events, which are usually easier to predict, pluvial floods often occur suddenly and without sufficiently long warning periods or identifiable recurrence intervals (Schmitt and Scheid, 2020). Pluvial floods are characterised by the fact that they can occur independently of a watercourse and are usually caused by heavy rainfall in a short period of time and within a small area (Kutschker and Glade, 2016). The poor predictability and short warning times of these events make good prevention and risk management even more important (Bronstert et al., 2023). Local prevention and individual flood risk adaptation are therefore crucial for enabling households in Germany to better cope with recurrent flood events and to reduce potential damages (Dillenardt and Thieken, 2025).
One of the most important findings in risk management is that people are more likely to implement measures if they are personally (directly or indirectly) affected by an event. Affectedness is primarily shaped by the emotional responses of those concerned. The stronger the emotion the higher the likelihood of a reaction (Netzel et al., 2021). How people perceive their personal risk is also crucial. A distinction should be made between global and personal risk perception. If people perceive a global risk, such as climate change itself, this only rarely leads to preventive action (Netzel et al., 2021). However, if people are personally affected and experience the associated emotions, such as in the case of a heavy rainfall event linked to climate change, they are more likely to take precautionary measures (Netzel et al., 2021). This realisation brings risk management to a small-scale level that must take local conditions into account (Rosenzweig et al., 2018). The probability of measures being implemented is only high if people are addressed directly (Rosenzweig et al., 2018). The level of education and knowledge of the targeted people is crucial here. People with a higher level of education and a higher level of knowledge about heavy rainfall and runoff processes are more likely to implement appropriate measures (Netzel et al., 2021). Risk management therefore has both an educational task and an obligation to address people's emotions to implement the best possible precautionary measures.
Effective flood risk management thus depends not only on individual preparedness but also on close cooperation between residents and local authorities (Schmitt and Scheid, 2020). Due to limited spatial predictability and the irregular occurrence of pluvial events, permanently installed flood protection measures are only practicable to a limited extent. Widely used methods for flood protection (from fluvial floods), such as permanently installed systems for the on-demand construction of flood defence walls, are only partially applicable or not applicable at all during pluvial events (Rosenzweig et al., 2018). It is therefore crucial that more precise forecasting systems be developed and risk assessments be improved. Such improvements allow preventive measures and flood warnings to be implemented in a more targeted and effective manner (Falconer et al., 2009). In order to maximise the integration of risk management, the involvement of citizens and authorities is essential (Ueberham, 2016). Participatory approaches can promote the development of risk awareness and thus increase the population's awareness of e.g. problematic areas in urban runoff events (Rollason et al., 2018).
Personal precautions, both in the form of measures at private homes and networking with each other (e.g. by setting up warning chains), but also increasing knowledge about heavy rainfall and its dangers can make people more resilient to pluvial flood events (Gallmetzer et al., 2021). Currently there is often a gap between people recognising the risks and the implementation of measures due to a lack of communication. In order to close this gap, it is necessary to share people's findings with the responsible authorities as easily as possible in order to improve communication and data accessibility (Rosenzweig et al., 2018). Against this background, participatory approaches such as Citizen and Community Science offer valuable opportunities to integrate local knowledge systematically into environmental monitoring and flood risk management.
2.2 Public participation in environmental risk monitoring – Citizen and Community Science
Public participation has become an increasingly important component of environmental monitoring, as citizen-generated observations can significantly enhance the spatial and temporal coverage of conventional measurement networks (Cohn, 2008). In this context, a distinction is made between Citizen Science, Community Science, and their hybrid forms. Citizen Science refers to the involvement of citizens in research projects and scientific data collection (Bonney, 1996; Irwin, 1995). Citizens collect data independently, which is then analysed by researchers. In this way, large quantities of small-scale and diverse data sets can be generated (Abecker et al., 2012b, a; Bonney, 1996; Conrad and Hilchey, 2011). Citizen Science in the environmental sciences was first used in ornithological monitoring projects for which it is still very well known today (Bonney, 1996). Citizen science projects are typically characterised by being initiated predominantly by researchers (scientist-led), who also take primary responsibility for data analysis, while citizens are, in most cases, involved mainly in the collection of data (Ballard et al., 2024; Lin Hunter et al., 2023). In this way, science obtains a large amount of data that is collected by independent persons so that the bias of the scientists themselves can (potentially) be minimised. At the same time, it offers the opportunity to make science accessible and understandable for people and thus gain a greater insight into science and its topics among the population (Ballard et al., 2024). Science itself benefits from the opportunity to unlock innovation potential at both individual and societal levels (Bonn et al., 2021). In contrast, Community science refers to research approaches that are driven by local priorities and perspectives, with the initiating ideas, decision-making authority, and responsibility for the research process residing within the community itself (community-led) (Ballard et al., 2024; Cooper et al., 2021). Furthermore, there are frequent hybrid forms that incorporate characteristics of both citizen science and community science. In the context of this work, this hybrid approach is referred to as Citizen and Community Science (CCS). CCS may, for example, involve researchers providing methodological frameworks and digital tools, while local communities independently initiate data collection on issues they consider locally relevant. In such a model, scientific actors support quality assurance and analysis, whereas communities retain agency in defining priorities and applying the results within their local decision-making processes (Ballard et al., 2024).
According to surveys conducted by the German Science Barometer (Wissenschaftsbarometer), well over half of citizens are interested in science and research (Ziegler and Kremer, 2023). An interest that has increased even further in recent years, e.g. due to the coronavirus pandemic (Ziegler and Kremer, 2023). But also, movements such as “Fridays for Future” and other climate campaigns clearly show that society is increasingly interested in scientific issues and wants to be involved in them. Environmental issues are often turned into strategic decisions by the existing political and administrative structures, which often do not involve people and leave them as silent observers (Liu et al., 2014). It is precisely these silent observers who are increasingly becoming active participants in political and socially relevant decisions and could be actively involved in research through CCS. This form of participation can fulfil citizens' expectations of co-determination and at the same time give them the opportunity to better understand the limits of scientific methods (Bonn et al., 2021; Liu et al., 2014).
More broadly, CCS aligns with principles of polycentric risk governance, in which responsibility and decision-making are distributed across multiple actors rather than centralised within formal institutions. Such distributed approaches represent one possible form of polycentric governance, enhancing adaptive capacity, legitimacy and responsiveness by integrating scientific expertise, local experiential knowledge and institutional decision-making (Baldwin et al., 2024). In this way, CCS can strengthen public trust in scientific processes, deepen societal understanding of environmental risks, and foster a more positive attitude towards both scientific findings and the implementation of resulting measures (Bonn et al., 2021; Liu et al., 2014). Building on the growing relevance of participatory risk observation and the distinct but increasingly interconnected paradigms of Citizen Science, Community Science and Citizen and Community Science, digital platforms have emerged as key enablers for scalable environmental monitoring and authority-facing data analytics (Johnson et al., 2021).
2.3 Digital platforms and open-source tools for participatory flood monitoring
In modern Citizen Science, Community Science and CCS projects (in this section called participatory projects), data can, for example, be collected by participants and sent to authorities or researchers. This process can be realised using different apps. These include computer apps that are installed on the device, online apps that can be accessed via a browser or apps that can be used on mobile devices (Lemmens et al., 2021). The potential of such participatory projects has grown immensely since mobile devices have been used across the board (Paul et al., 2021). Thanks to the integrated sensors of the Global Navigation Satellite Systems (GNSS), the exact position (within the limits of the inaccuracy of the respective GNSS) can be determined in addition to the data entered manually by the participants, so that the data can be supplemented by an important geo-component. These applications are particularly valuable in the field of environmental sciences. The apps are usually installed under the two common operating systems iOS (Apple) or Android (Google) (Lemmens et al., 2021).
Mobile apps offer many functions that are particularly interesting for participatory projects (See, 2019). One method of participatory projects can be questionnaires. They can be used on a website or in a local app. Participants answer questions on one or more topics. It is possible to depict different types of questions and thus do better justice to the diverse content (e.g. multiple choice, drop-down menus or free text fields). If the location of data collection is important, questionnaires can be supplemented with this information. Since GNSS sensors are now installed in mobile devices as standard, the apps can automatically determine the position of the device and send it as additional information (Lemmens et al., 2021). In addition to GNSS sensors, mobile devices also often offer other sensors that can be used to record data. For example, image or sound recordings can be made, compass data can be read out or the brightness and ambient volume can be determined (Odenwald, 2020). External sensors can also be connected to the mobile devices or used independently of it. Their data can then also be entered via a questionnaire (Lemmens et al., 2021; Odenwald, 2020).
To increase motivation for the actual use of such apps, games are popular, especially among the younger population. Here, data are generated in a playful way that follows a competitive approach and thus encourages participants to use the app as long and intensively as possible (Lemmens et al., 2021). This approach represents a form of gamification, that is, the incorporation of game-like elements and mechanisms into non-game contexts with the aim of influencing user behaviour and enhancing motivation. Typical gamification components include goal descriptions, defined roles and rules, points, rewards, and comparative metrics, and an increasing number of digital applications – particularly mobile apps – integrate such elements to promote sustained user engagement (Lexa, 2021).
The major advantage of using mobile devices in participatory projects also brings challenges. By using mobile devices, more people can generate data more quickly and thus contribute to research. At the same time, these data must be stored and processed accordingly to be able to evaluate and analyse it later. The process therefore requires both a purpose-built app and data management software to perform analysis and visualisation.
In principle, it is possible for participatory projects to access existing platforms that already offer some functionalities and can be customised to a limited extent. Another option is to programme new software or applications, which is then generally used by a single project (Lemmens et al., 2021). An established example of a Citizen Science project in the field of hydrological observations is the CrowdWater initiative. It enables citizens to record hydrologically relevant information (such as water levels, soil moisture, or potential inundation areas) using a smartphone app (Seibert et al., 2019). Observations are generated predominantly in a qualitative manner via so-called “virtual staff gauges”, in which users estimate water levels using reference images. These data are subsequently compiled centrally in a database, validated, and made available for research purposes. CrowdWater is therefore primarily oriented towards improving hydrological models and forecasts by complementing conventional monitoring data with fine-scale, temporally detailed citizen observations (Seibert et al., 2019). However, CrowdWater does not address specific, spatially localised risk points in urban environments that may arise during pluvial flood events, such as blocked drains, constrictions in surface runoff pathways, or inadequately dimensioned structural elements. Nor is the application designed to integrate municipal actors directly into operational risk management processes or to make citizen observations immediately usable for decision support or the planning of mitigation measures. Against this background, the application developed in the present study adopts a different focus and expands the spectrum of CCS approaches by introducing a more practice-oriented and municipally actionable dimension.
The application (as a prototype) is initiated and set up by researchers, but its application and subsequent management can remain entirely within a local community, with citizens collecting data and municipalities analysing and acting upon it. Using open-source components, the prototype app is designed to be reusable for interested parties and to enable, for example, municipalities to adapt the system to their specific local contexts, thereby supporting a more sustainable and locally responsive form of heavy rainfall risk management.
The methodology describes the development of the CCS app on the technical side and addresses design and functionality. It shows the connections between the mobile application and the Geo Data Warehouse (GDW) and explains the methods for analysing data in the latter.
3.1 Development of the CCS app
The development of CCS apps is strongly influenced by the expectations of future user groups. Lemmens et al. (2021) lists some criteria specifically for Citizen Science apps, that also apply to the development of a CCS app:
-
Usability: the ease of use for the participants
-
Look and feel: the visual quality of the app
-
Performance: the speed with which an app opens and operates
-
Security: the level of technical security an encryption of sensitive data
-
Compatibility: the range of operating systems and devices supported
-
User privacy: compliance with the EU General Data Protection Regulation (GDPR)
In the following, the various aspects of the design and implementation of a CCS app, data collection and subsequent data visualisation are listed and explained.
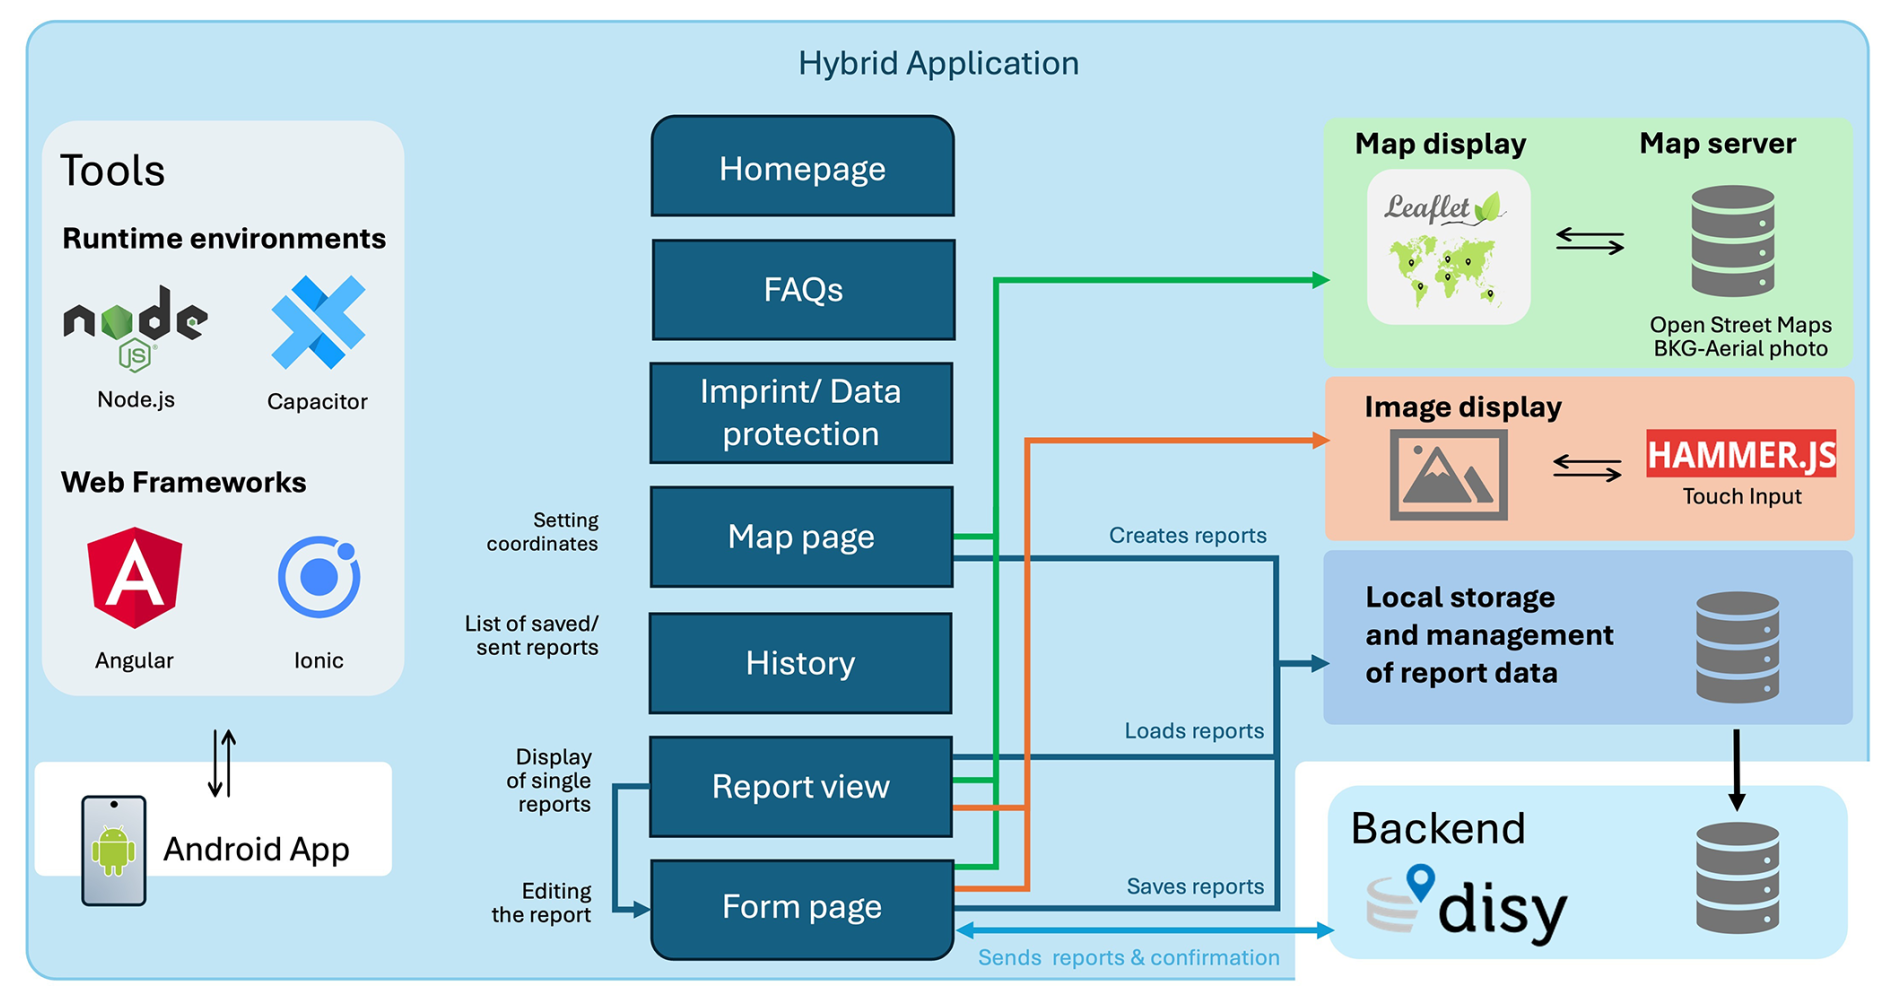
Figure 1Structure and components of the hybrid CCS app with functional relationships within the application.
3.1.1 Technical structure
When developing mobile apps, a distinction is made between web, native and hybrid apps. The CCS app was developed as a hybrid app. Hybrid apps are developed as web apps and then provided with a native framework (which is usually specific to one operating system) that allows them to be installed on different operating systems. Hybrid apps combine the strength of both web and native systems thereby supporting efficient development and broad device compatibility (Schilling, 2016). The actual CCS application is implemented in JavaScript (JS) and displayed as a web view, functioning like embedded web content within the app. Figure 1 shows that in a hybrid app, AngularJS (a single-page application framework) provides the structural basis for integrating the web content into the native environment (Weiße, 2016). The Ionic framework supports cross-platform deployment and automatically adjusts the interface to different screen sizes (Weiße, 2016). As a runtime environment, Capacitor, also enables multi-platform deployment but additionally provides access to hardware elements such as the camera or speakers. Both Capacitor and Ionic are part of the AngularJS framework, which relies on the Node.js runtime environment for development and builds. NodeJS provides the environment needed to run JavaScript outside the browser and supports development in editors such as Visual Studio Code (Weiße, 2016).
Overall, the CCS app achieves a high level of platform compatibility and ensures stable performance across a broad range of devices.
3.1.2 Design and functionality
The design and functionality of the CCS app play a central role in user-friendliness. The aim is therefore to ensure intuitive operation and, at the same time, to guarantee an appearance that is as barrier-free as possible. Intuitive navigation and operation are achieved through clear structures, easily recognisable interaction elements and a consistent design.
The system functionality was defined as part of a requirements workshop at the start of the research work and is described successively below.
A style guide defines the design and layout of the CCS app. Among other things, identical visual elements for the same function were provided in the associated layout specifications. The use of prefabricated components from the Ionic library supports a uniform look. Overall, this creates a coherent overall picture for the user, directing the focus to the essential content.
The colour scheme has been deliberately reduced to create a clear and uncluttered user interface. A broad colour palette has been avoided in favour of high contrasts, which facilitate readability and orientation and thus make the CCS app more accessible. Interactive elements, such as blue buttons, are highlighted to clearly signal their functionality.
Typography also makes a decisive contribution to user-friendliness and appearance. The use of the system's internal font, such as Roboto on Android, preserves a native look and ensures a familiar user experience. The focus here is on a low-barrier appearance by adopting the user's global settings. Different font sizes and thicknesses are used to clearly present the structure of the CCS app and promote readability.
Icons are an integral part of the design and user guidance. Common symbols that users are familiar with from other applications are used in a targeted manner. They are designed to be platform-independent to ensure a uniform appearance on different devices. Icons serve as navigation and menu elements as well as contextual support. Their intuitive recognisability ensures quick orientation and improves usability.
The combination of all these elements creates an CCS app with a simple design that emphasises functionality and barrier-free use. The evaluation of the user-friendliness of the CCS app for different target groups in the risk communication of heavy rainfall management has already been carried out on one group but still needs to be carried out for the other target groups and analysed as a whole.
3.2 Geo Data Warehouse and data analytics platform
The captured data are transmitted by the CCS app to a backend where the reports are stored and processed. This backend is designed and prototypically implemented as a part of the “FloReST water extremes data platform” (Janßen and Abecker, 2026). For data storage, a GDW (Schrauth et al., 2017) is realised. For data analysis and visualisation for specific target groups, the “disy Cadenza platform for business and location intelligence” is employed (Abecker et al., 2024). The web-based application disy Cadenza is used for data discovery and analytics of the CCS report data. disy Cadenza is in daily use in many federal and state authorities in Germany and has already proven its value to the public sector, especially when dealing with geo and environmental data. disy Cadenza allows the user to link the data with one another and it provides a user-friendly Graphical User Interface (GUI) to combine data visualisations with data-analytics capabilities to create data dashboards. A variety of possible data representations, including tables, bar charts, pie charts, maps, heat maps, etc. can be utilised for this purpose.
During the design of the system a conscious effort was made to ensure the openness of the solution created. The selected components are loosely coupled so they can be used independently of each other. To ensure interoperability, also with other possible software solutions, an Application Programming Interface (API) for communication between the CCS app and the datastore has been defined. An OpenAPI specification of the interface was created for implementation and documentation purposes (https://www.openapis.org/, last access: 21 March 2025).
Another design criterion for the selection of the individual software components was their scalability. This is important to ensure operation in larger-scale load scenarios.
The data analytics application requires an easy access to the datapoints as well as a powerful tool to fit subject-matter experts' needs. A user customisable web application as the analytics platform meets these requirements.
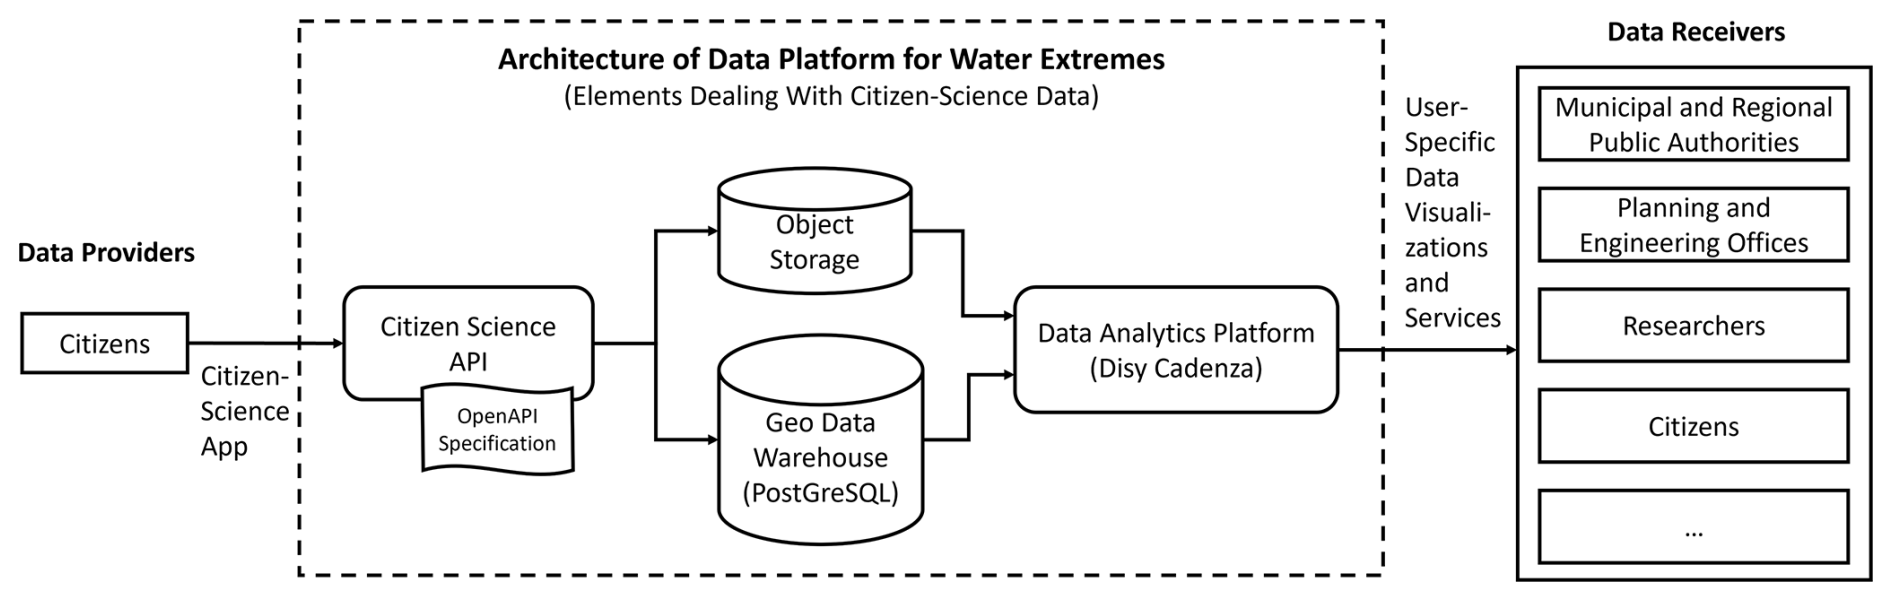
Figure 2 provides a partial overview of those actual components of the water extremes data platform which deal with the CCS reports. The API is used to transmit the data recorded by the CCS app. A python-based Extract-Transform-Load (ETL) component transforms the received data into the specific target formats. ETL processes realise the basic steps for integrating heterogeneous input data into a homogeneous data warehouse. Structured data of a report, including its metadata, is then stored in a PostgreStructuredQueryLanguage (SQL) database. PostgreSQL is the world's most successful open-source database management system – which can also be extended for efficient management of geospatial data. Transmitted photos are stored in an S3-compatible object storage. The S3 (Simple Storage Service) principle has been introduced by Amazon for a massively scalable, typically cloud-based, storage system for arbitrary data objects. Additional media files like videos or audio files could also be stored here. Finally, the data can be viewed and analysed using the disy Cadenza as the data analytics software.
To ensure data protection and secure data handling throughout the workflow, a rights-and-roles concept, encrypted data transmission, and anonymised user identifiers were implemented as part of the system architecture. These measures, together with token-based authentication and support for established identity-management protocols, form the methodological foundation for safeguarding user privacy and controlling authorised access to the analytics environment.
3.3 App-prototype test-procedure
The CCS app was tested in three distinct contexts. The first test run was conducted with internal university staff, the second took place during a municipal event on heavy rainfall and flooding in an affected area of the Ahr Valley and involved local residents, and the third was carried out with a group of students of various age groups as part of a university course. For all test settings, participants received flyers containing a QR code for downloading the app and two additional QR codes linking to the respective questionnaires. Before beginning the prototype test, participants were asked to complete an initial questionnaire that primarily assessed their prior knowledge and level of engagement with the topic. The individuals involved in this study were representatives of reference municipalities or members of the university who had provided prior consent and explicitly expressed their willingness to support the research project; given the non-sensitive nature of the data collected and the professional context of participation, formal ethical approval was not considered required. For the app test itself, participants were instructed to download and install the application independently from the app store. They were then asked to identify problem areas relevant to heavy rainfall within their surroundings and to document and submit these using the app. After completing the test, participants were invited to fill in a second questionnaire to capture any changes in the previously measured indicators. All questionnaires were completed anonymously. To allow later matching of responses from both questionnaires, participants were asked at the start of each survey to create an individual code.
The pre-test questionnaire collected demographic information, expectations regarding the app, participants' existing knowledge of heavy rainfall and flood preparedness, and their personal engagement with these topics. Following the test, participants evaluated their experience with the app, and changes in their knowledge and engagement were recorded. As the prototype was developed for use in German-speaking regions, the questionnaires were also administered in German. The original questionnaire is available as Supplement.
The CCS app for sustainable risk management in managing the impacts of heavy rainfall has a simple design. The CCS app has currently been developed in German. The start page provides a brief introduction to the topic and invites you to start an initial site survey. The main menu provides information on frequently asked questions.
4.1 Data Collection
The data are recorded by the user via a form within the CCS app. Only data that are relevant for the assessment of the problem area were selected for recording. The precise data collection process and the exact structure of the captured data are explained below.
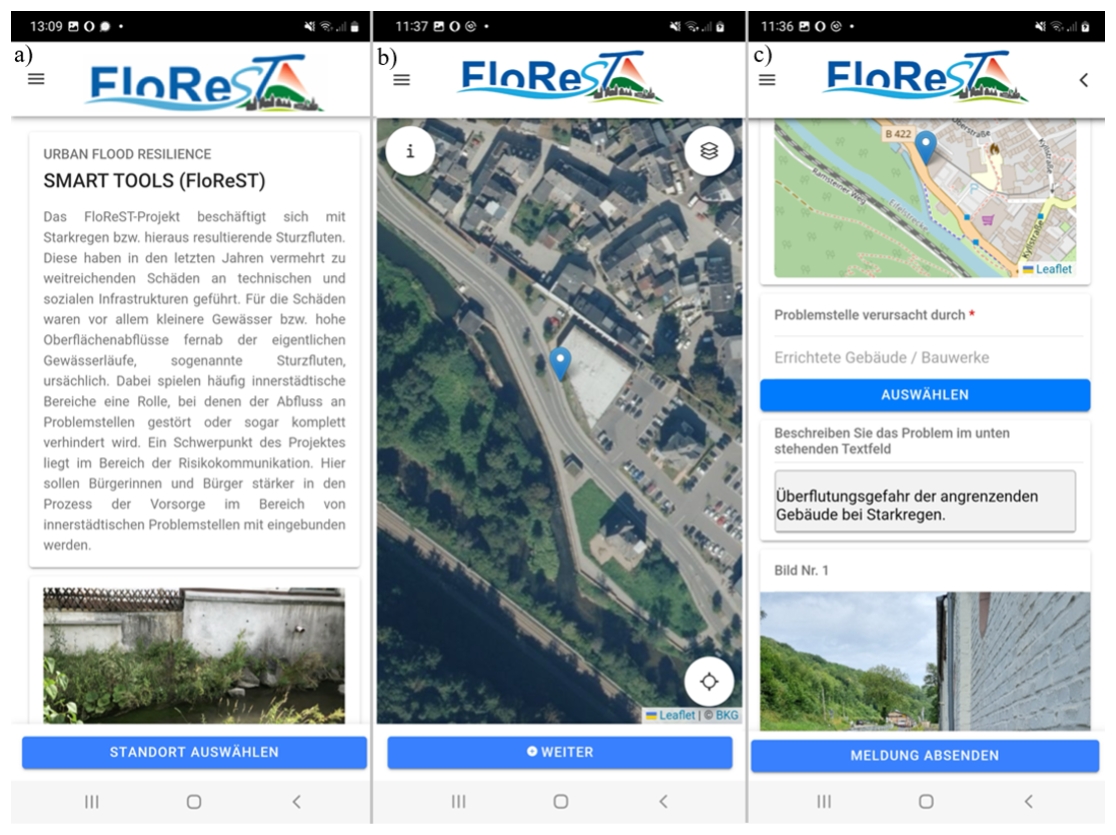
Figure 3Overview of the CCS app with start page (a), location selection (b) and survey page (c).
4.1.1 Process of data submission by citizens
Data collection should be intuitive and efficient for the user. The first step for the user is to identify a problem area in their immediate surroundings. The CCS app can then be opened, and the localisation of the problem area can be started using the map function in the CCS app. This is done either by using localisation services, so that the user's currently determined location is used as the location of the problem area, or the user can select any location on the map themselves. A topographical map and an aerial map are provided for better orientation. The user then assigns one of the four possible categories to the problem area. The following categories are available: “Accumulation of floating debris/driftwood” (Ansammlung von Treibgut/Treibholz), “Bottleneck” (Engstelle), “Deflection of water” (Ablenkung des Wassers) and “Constructed buildings/structures” (Errichtete Gebäude/Bauwerke). The categories are provided with pop-up help so that the user can view a descriptive text and sample images for each category to make the best possible assignment. The user then describes the problem area in detail and has the option of adding images to this description. These images can either be taken directly using the CCS app's camera function or added from the mobile devices' gallery. If the user can assess the responsibility of the respective location, it can be indicated whether the problem area is located on private property or on public land. Figure 3 provides an overview of the start screen (a), the location selection on an aerial map (b) and a section of the entry page (c). Once all the information has been entered, the report can be sent via the CCS app. The sending process ends with a success or error message informing the user about the status of the submission.
4.1.2 Types of data collected (e.g., location, description, photos)
The user ID (userId) is randomly generated when the CCS app is started for the first time so that messages can be clearly assigned to a user without collecting personal data. This guarantees maximum anonymity and minimises data protection risks.
The report ID (reportId) is an internal identifier (ID) that is primarily used to control the CCS app processes. This ID is also transmitted to the server, where it is supplemented by an external ID.
The recording date and time (timestamp) document the time at which the report was created (not the time of submission), derived from the system time of the end device. These data are initially stored unformatted (specification of elapsed milliseconds since 1 January 1970, 00:00, Coordinated Universal Time, UTC) and converted if necessary.
The latitude and longitude (latitude, longitude) define the location of the problem area. They are output in the World Geodetic System 1984 coordinate system (WGS 84, European Petroleum Survey Group, EPSG 4326) in decimal degrees and are therefore compatible with the map service used. The data are then projected in EPSG 3857 for visualisation.
The problem area is caused by (deficiencyType) a cause of the problem, such as accumulations of floating debris, bottlenecks or deflections of the water. This categorisation can be carried out by the user themselves and makes it easier for the authorities to assign and prioritise the problem subsequently.
The type of spatial utilisation (onPublicProperty) indicates whether the problem area is located on private or public land. This information can be legally and organisationally relevant.
Under further information (additionalInformation), users can enter specific information and notes on the problem area in a text field.
All images (Report__<No._.jpg) are used for visual documentation of the problem area. The images can be added using the camera function or from the gallery.
The collection data listed have been selected to ensure that it covers the relevant information on the problem area while complying with data protection standards. The anonymised user ID ensures that no personal data are collected. The focus is on the technical data required to precisely describe the problem areas during heavy rainfall events and derive recommendations for action. The combination of location data, categorisation, detailed description and photo documentation ensures a comprehensive representation of the problem area. At the same time, the requirement to minimise data storage is met so that recording remains quick and uncomplicated for the user. After the message has been sent, the user receives confirmation of the result of the sending process. In the current prototype of the app, users do not receive additional information when their submitted data are processed by researchers or local authorities. In future versions, however, communication back to citizens is intended. Such bidirectional communication requires a separate data protection assessment and has therefore not yet been implemented. Users currently receive direct feedback only when the respective municipality takes action based on the submitted data and resolves identified problem areas.
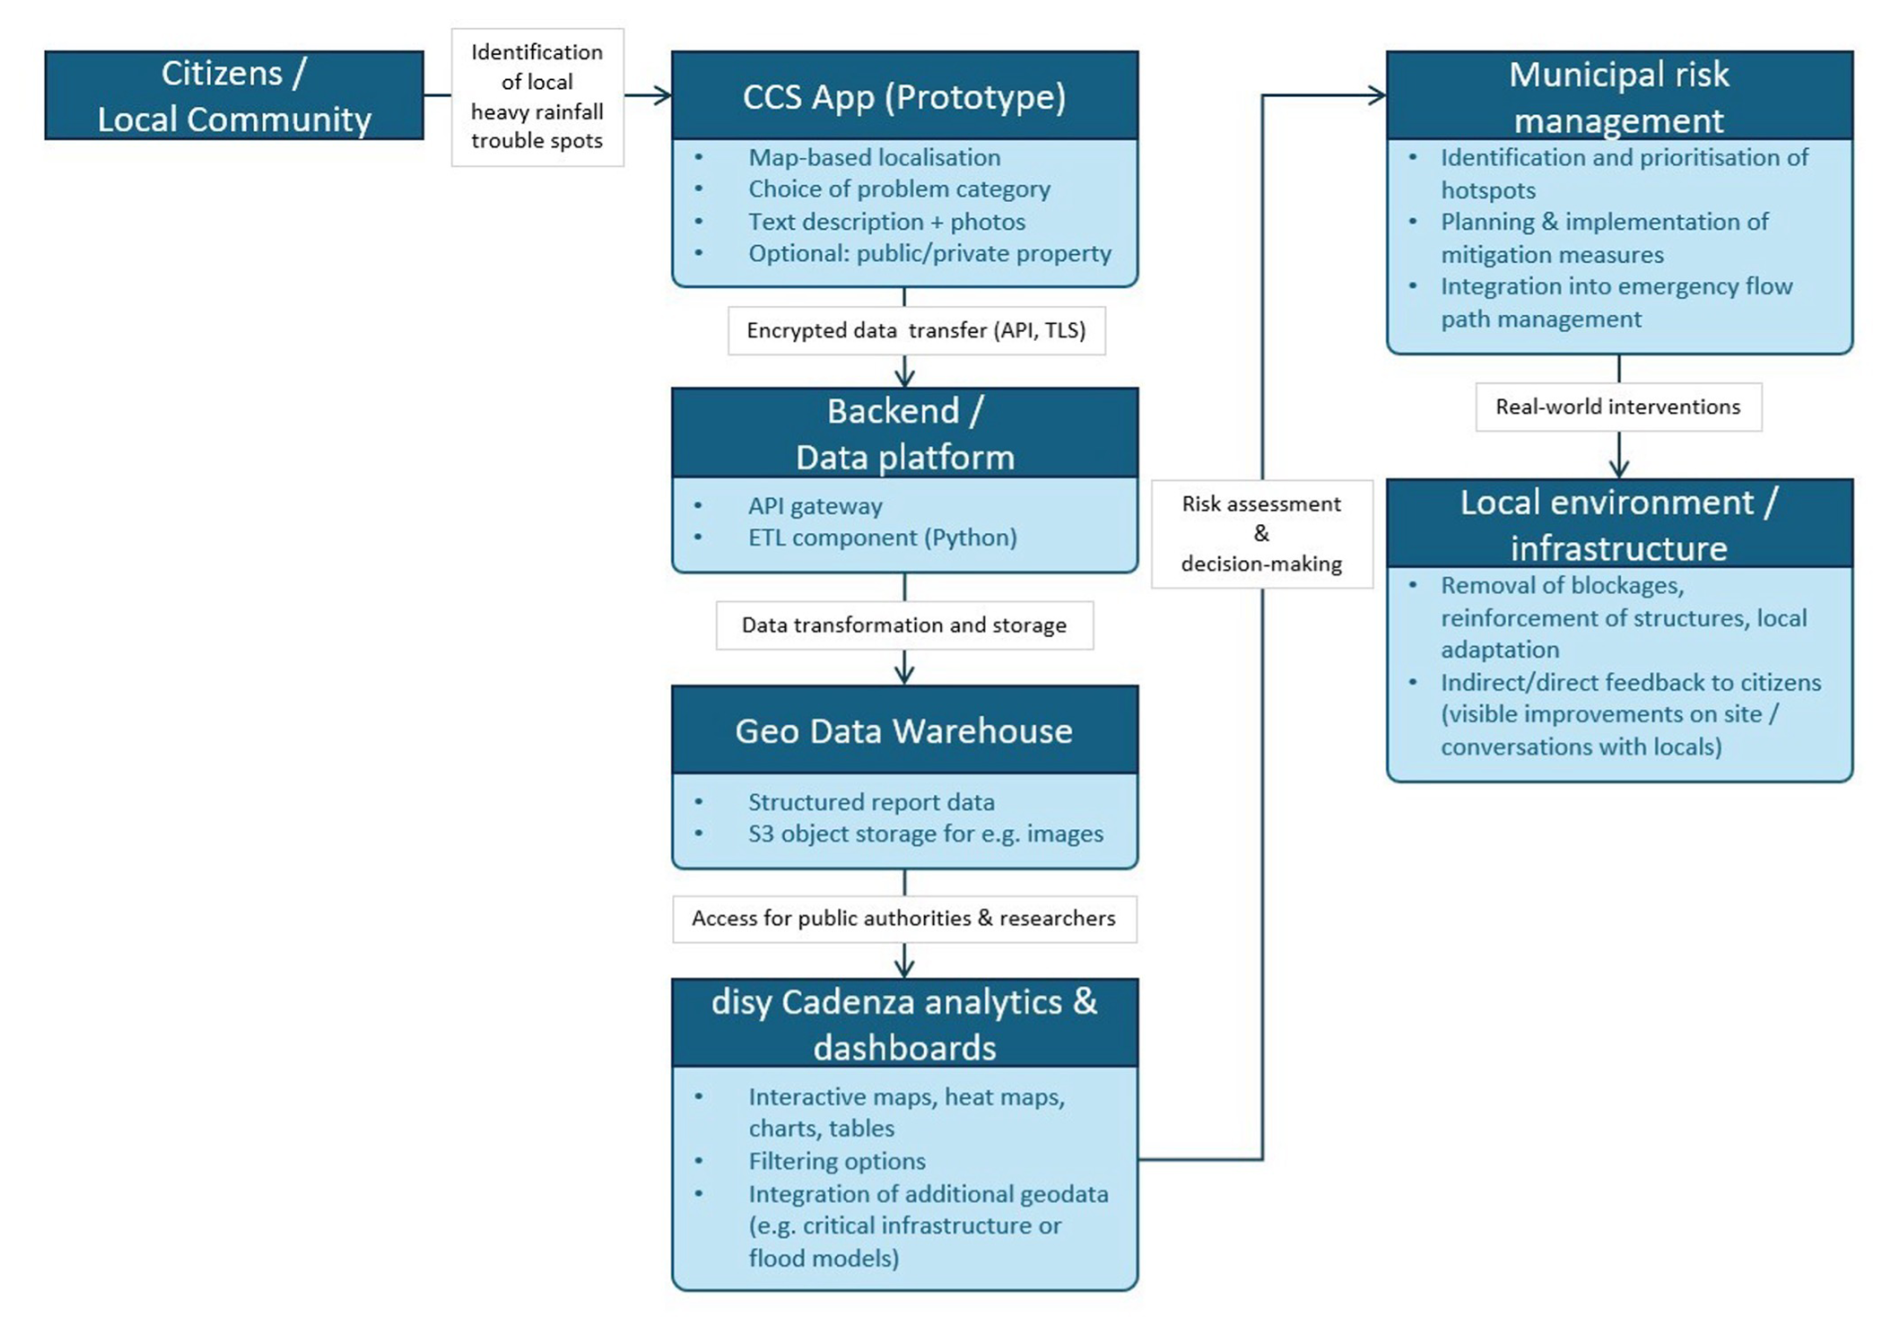
Figure 4 summarises the end-to-end workflow of the CCS app, illustrating how reported data move from the citizen-facing mobile interface through the backend infrastructure, data transformation processes, and ultimately into the analytics environment accessible to public authorities.
4.2 Data analytics and data visualization for public authorities
To support systematic analysis of the CCS report data, the web-based platform disy Cadenza offers a robust environment for data exploration, integration, and visualisation. Its user-friendly interface enables public authorities to link datasets, perform analytical operations, and create customised dashboards using diverse visualisation formats such as tables, charts, maps, and heat maps.
For recurring tasks, the user has the option to access predefined curated workbooks to fulfil the analytics requirements. A user-defined customisation of the data view allows the completion of individual inquiries. On all dashboards, the data can be restricted by filtering the considered data points geographically, temporally, or by other attributes of the data. Using these capabilities, the CCS reports can be selected by the attributes recorded with the CCS app, such as the categorisation of problem area, but also spatially, restricting the area of consideration on the map. A fully integrated Web Geographic Information System (GIS) completes the spatial analytics capabilities. This enables the user, for example, to measure distances in the map (e.g., between an observation and a watercourse) or to add geodata layers such as Points-of-Interest (where are vulnerable buildings, facilities, or infrastructures) or task-specific maps (e.g. about critical infrastructures, land survey register, other cadastre data etc.) and additional cartographic information (like aerial pictures or even flood simulations) to the result view. In addition to that, activating the Cadenza live mode will result in a periodic update of the data shown.
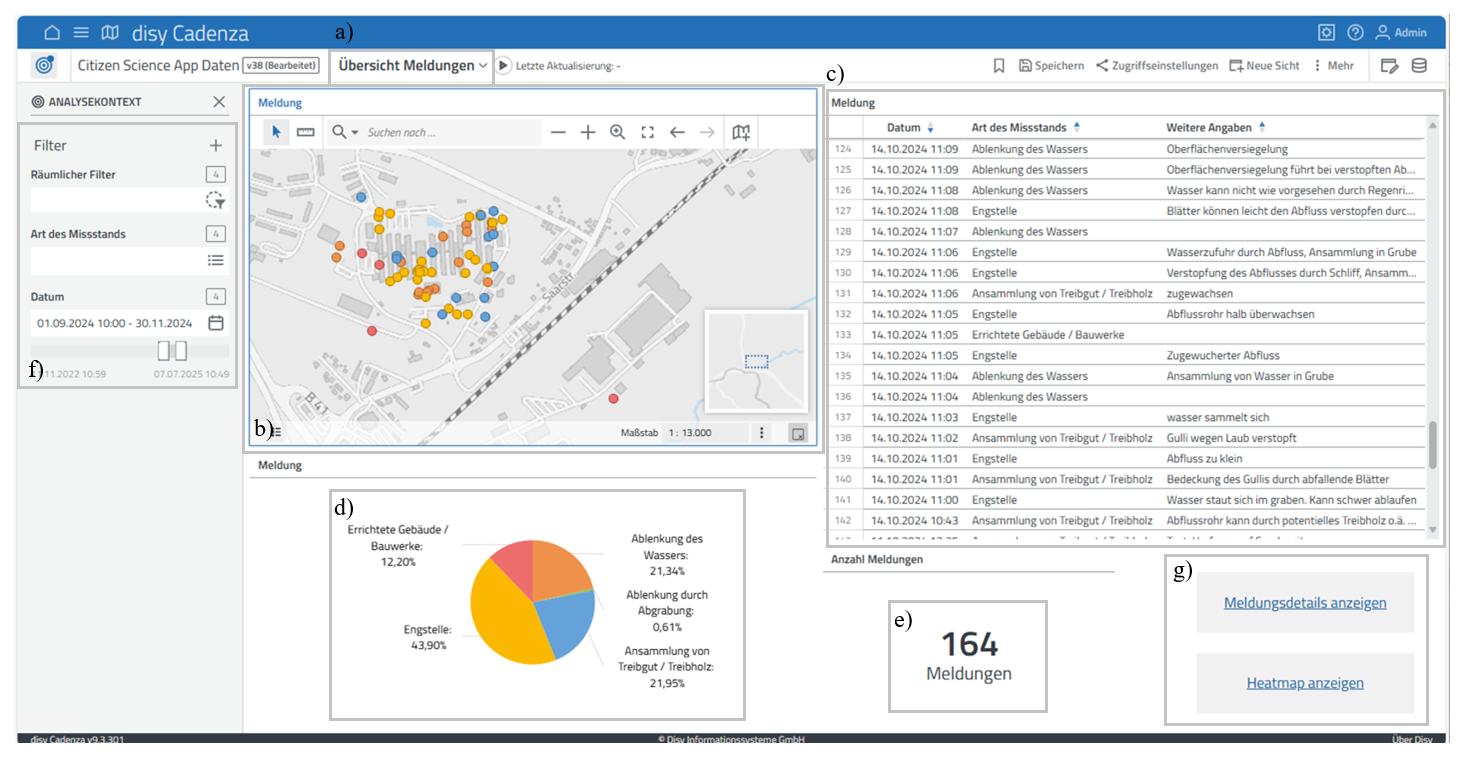
In Fig. 5 one of the predefined curated workbooks is displayed. As an entry point for the users, an overview dashboard (a) was created. It shows the CCS report data on different aggregation levels. A map shows the spatial distribution of the reports (b). The colour-coded dots each represent a single report, coloured according to the categorisation of problem area. By selecting a point, further details of the report can be observed. On the right-hand side, the report data are presented in tabular form (c), sorted by the submission date. A pie chart provides an overview of the distribution of the reported problem area types (d). The total number of reports displayed is shown by an indicator (e). By default, the submitted reports of the last three month are selected. The data can be further expanded or restricted using the filters on the left-hand side (f). The type of the problem area as well as the period in which reports were received, can be adjusted, in absolute and relative terms. Weblinks at the bottom right offer an option to jump to a detailed view of the reports or a heat-map representation of the data (g). By using these links, the state of the applied filters is transmitted to the corresponding page. The detailed report view utilised a table component to show all available details of a report. Attached images can be selected and viewed here. A spatial summarisation of the reports can be created by a heat-map representation of the data. It can be used to determine focus points of reported problem areas. By zooming in and out, the heat map is recalculated and adjusted accordingly to the zoom level.
4.3 Data protection and security
Using disy Cadenza it is possible to implement a fine-grained rights-and-roles concept. This allows to restrict the access to the data, the created dashboards and the analytics views to authorised personal only. A state-of-the-art identity provider can be used for authentication of the users. For example, the widely adopted OpenID Connect protocol is supported. Only the data related to a report is recorded. No user-related data are stored in the database. Just a randomly generated user id is attached to a report which enables a grouping of the individual messages related to a specific CCS report. It is therefore not possible to draw conclusions about a specific person. The transmission of data from the CCS app is secured by a transport encryption via Transport Layer Security (TLS, an internet communication protocol for safe data transport). Authentication of the CCS app at the API-Gateway is implemented using token authentication.
4.4 Performance analysis
The app was evaluated by conducting a performance analysis. This involved using and evaluating the application in test groups consisting of participants from different age ranges. Bugs identified during these tests were documented and resolved in several subsequent releases of the app. Remaining technical issues are described in Sect. 5.2.1. In total, 38 individuals participated in the prototype testing phase and answered the evaluation questionnaire.
A comprehensive practical evaluation of the app's impact on flood risk management requires further investigation with a broader user base. Conducting such evaluations was challenging because the topic is highly politicised. Several participation appointments were cancelled at short notice, making it impossible to carry out a large-scale survey. In addition, some local authorities expressed caution, as reports submitted through the app could highlight problem areas that might require additional action, potentially resulting in administrative or financial obligations.
However, the results of an evaluation of participants from different test groups show that people are particularly willing to engage with flood protection when they have an emotional connection to the topic and feel personally affected by it or have been affected in the past. In the evaluation, participants completed a questionnaire before and after testing the app. It is important to note that the findings presented here do not hold statistical significance due to the limited number of participants.
The responses to the questionnaires were originally provided in German and were translated into English for inclusion in this paper. Exemplary responses illustrate the range of perceptions and behavioural tendencies observed. For example, one male participant aged between 21 and 28 years, who lives in rented accommodation, has completed vocational training, and reported no previous experience with the topic, expressed the emotions “fear and concern, frustration and anger” prior to using the app. After testing the app, however, he reported feeling “relief, hope, motivation and engagement.” He assessed the risk of a drainage-related problem occurring on his property during a heavy rainfall event as 2 on a scale from 1 (very low) to 10 (very high) before using the app, and as 3 after the test. Furthermore, he indicated that participating in the app test might encourage him to implement measures for flood preparedness in the future.
Targeted risk communication always includes the perspective of the affected citizens. Therefore, a survey was conducted in five different pilot municipalities in Rhineland-Palatinate, Germany, as part of the preparatory work for this project. One of the aims of this survey was to identify target groups for certain risk communication tools based on socio-economic data. The survey revealed that accessibility through the chosen media has a significant influence on the under-35s and on the under-20s. For this reason, the CCS app was chosen as the preferred citizen and community science method. In the following the different components (sustainable risk management, heavy rainfall, citizen and community science) of the initial question are analysed and evaluated in relation to the chosen method of the CCS app.
5.1 Advantages of the Citizen and Community Science approach in emergency flood path management
Sustainable risk management requires that the affected persons can apply realistic benchmarks when differentiating between global and personal risk perception (Netzel et al., 2021). If the risk is assessed as a personal risk, the personal involvement of the affected individuals increases. This usually leads to people associating stronger emotions with the situation and consequently increases the likelihood of a reaction, in this case the implementation of protective measures (Netzel et al., 2021). By using the CCS app, the affected persons learn directly that there are potential sources of danger in their personal environment. This increases the likelihood of protective measures being implemented after using the CCS app. It is also important to consider the different scale levels for successful risk management. As heavy rainfall events are often very localised events and even small-scale changes can lead to major differences in runoff behaviour, it is particularly important to record the small-scale conditions and get as detailed information as possible (Rosenzweig et al., 2018). This is made possible by using the CCS app, as it is primarily designed for small-scale problem areas in private and public spaces.
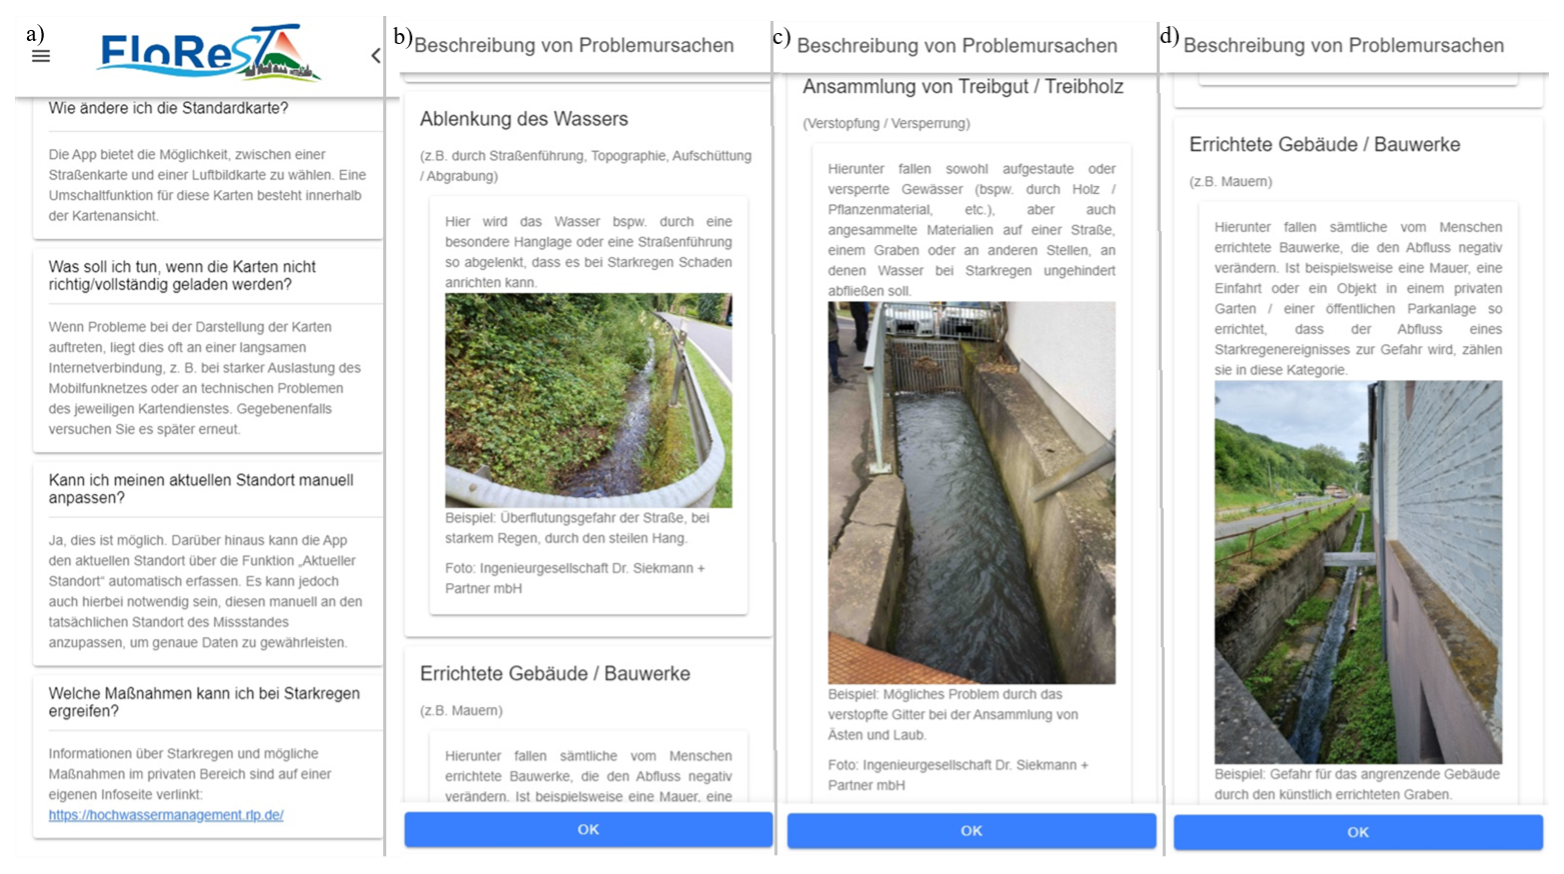
Figure 6Information on heavy rainfall (a, b, c, d) and links to information pages of the state of Rhineland-Palatinate (a, bottom) in the CCS app.
Furthermore, the individual level of knowledge and education of the people involved should be considered. These two factors are essential for the likelihood of measures being implemented. Accordingly, the CCS app should not only be intuitively designed and usable but also fulfil an educational function by providing information on the topic of heavy rainfall and flooding, as well as providing information on further education both within the CCS app and beyond. This is provided in the CCS app as info buttons (Fig. 6) and as additional links. The CCS app offers contextual information on various categories of problem areas and raises awareness of potential drainage obstructions within the local environment. It also provides direct access to the Rhineland-Palatinate flood management website, which supplies extensive guidance on flood-related issues. In this way, the app fulfils an important educational function in supporting sustainable heavy rainfall risk management.
The development of more precise forecasting methods is crucial in the prevention of heavy rainfall events. Today, these forecasting methods are often implemented using trained machine learning/deep learning models (Agonafir et al., 2023), which require a large amount of training data. The requirement for this training data is the highest possible spatial, temporal and thematic coverage. The amount of data needed for this cannot be collected by the scientists themselves, which is why models are often only reliable for certain regions with temporal and/or thematic restrictions. For improving these models, it is essential to have a more comprehensive database. The CCS app offers the opportunity to collect such data with the help of local stakeholders and then make it available to the scientific community, which shows the Citizen Science part of the project. In this way, a unique data set with high variability in the observed parameters can be created. It is also very important for citizens to be able to carry out a realistic risk assessment in the event of heavy rainfall. This is the only way they and their neighbours can react in time and protect themselves. The CCS app's participatory approach and the information it provides not only enable users to make such an estimation, but – more importantly – serve to inform and sensitise them to the topic of pluvial flood risk. This increased awareness, fostered through accessible guidance and contextual knowledge, enhances users' ability to recognise potential dangers and to react earlier and more appropriately during heavy rainfall events (Gallmetzer et al., 2021; Rollason et al., 2018).
Another gap exists between people recognising risks and the implementation of measures by the authorities. The CCS app provides the opportunity to precisely close this gap by giving people a direct link to the relevant authorities and allowing them to report their findings directly, which is one of the Community Science parts of the app. The evaluation of the data and, if necessary, the implementation of a measure is then at the decision of the public authorities, depending on their responsibilities.
Individual problem areas are usually not responsible for large amounts of damage in the case of a heavy rainfall event. It often involves several problem areas that add up to considerable damage (Wang et al., 2019). As the authorities do not have the staff to identify and record the large number of problem areas, the CCS method offers a major advantage over conventional mapping options. The CCS app can be used to record large amounts of data in equally large spatial distributions without having to increase staffing levels. Only the evaluation of the data requires the attention of the authorities.
When measures are implemented, they can achieve a higher level of acceptance than without the use of the CCS app. Due to the greater knowledge base of the affected persons and residents, they can relate to the measures and are more willing to contribute to them because their risk assessment is improved.
An CCS app offers the possibility of quick and large-scale distribution without requiring too many resources. It can collect thematic data (like a questionnaire) and at the same time offers data such as the exact location and image material, which would have meant a great deal of effort for the surveyors using the conservative method. The report can be submitted in less than two minutes and can be used by many people thanks to its high level of compatibility with all standard Android devices on the market. The CCS app is basically aimed at citizens of all ages, but also specifically addresses the younger generation, due to the more intuitive use of smartphones. The CCS app thus provides an answer to the low level of knowledge of the younger generation about heavy rain and flooding. Users do not need any prior knowledge of citizen and community science or flooding and are guided intuitively through the CCS app. The categorisations can be made as accurately as possible using example images and descriptions.
In the application test, it became clear that the topic of flooding and heavy rainfall evokes strong emotions in many of the affected people, both positive and negative. Those affected often feel anxious and worried because they feel unable to act in a flood situation. The CCS app offers the opportunity to regain the ability to act and to name and report the problems specifically for their own property or the neighbouring public space, thereby fostering a community science approach in which affected citizens actively contribute their local knowledge and observations to collective risk management and decision-making processes. This returns autonomy to users that many have lost to the water. While the accompanying emotions before using the CCS app were predominantly fear and concern, this changed to trust and security after using the CCS app. 21 % of the respondents were also motivated and felt a sense of commitment. The results of the application test indicate that the CCS app could be a suitable tool for sustainable risk management in the context of heavy rainfall.
5.2 Challenges and Limitations
When using the CCS app and the GDW, there may be challenges and restrictions during development and use. Both technical as well as thematic and data-related aspects can influence functionality, user-friendliness and data quality. The main problems are identified, and potential solutions are presented to increase the effectiveness of the application afterwards.
5.2.1 Technical challenges
Technical difficulties can occur both on the CCS app side and on the GDW side. The problems were recognised but could not be fully resolved within the scope of the project. Solution approaches are provided that could point the way for further development of the application.
The problem with many mobile applications is that they are dependent on the use of mobile data connections. In principle, messages can also be sent later with the CCS app when mobile data are available again. However, it is not possible to send a message without an active mobile data connection. In addition, the map services are not available if there is a lack of connection, which makes manual localisation on the map impossible. This is particularly problematic in rural areas. Inaccuracies can also occur if there are not enough satellites available for positioning by the mobile device used. As the number of available satellites decreases, the accuracy of the positioning also decreases and may lead to incorrect markings of the problem area. To minimise this problem as far as possible, images of the problem area can be supplied from different perspectives. This makes it possible to correct or reposition the problem area during data analysis. It is also possible that the spatial resolution of the maps provided (digital orthophoto, spatial resolution 20 cm and Open Street Map) may make it difficult for users to correctly locate the problem areas, making it harder to allocate and find them again later.
The validity of uploaded data has also not yet been checked. The date and time are automatically recorded from the mobile devices' internal data. All other data can be customised by the user and is not compared with data such as the coordinates of a captured image (should corresponding data be collected by the mobile devices). Such a comparison would further increase the accuracy of the data and could eliminate possible sources of error. However, the inaccuracies of the data automatically collected by the mobile devices must also be considered here.
The current implementation of the data processing after receiving a report via the API gateway, includes only a minimal form of data validation. On the server-side the data fields are just validated on the data type level. A domain specific plausibility check, if still possible at the backend level, has not been implemented yet. For example, a cross-check of the media metadata and the location could prevent the misuse of the CCS app backend. Thinking further, using Artificial Intelligence for the analysis of the picture content and the submitted additional textual information, could enhance the validation and therefore the data quality. For privacy protection, mechanisms to automatically review the picture content or to remove personal identification information, could be implemented as well, e.g., for removing faces of people on photos, or for removing license plates of cars.
5.2.2 Thematical and data quality limitations
Users can have a significant influence on data quality. Although appealing to emotions is important to encourage participation and the implementation of measures by those involved, this appeal can also lead to emotional behaviour that can impair data quality. For example, users may submit false reports or deliberately make false statements in the report. It is therefore particularly important that the data are subsequently evaluated by experts to generate objective drain problems from subjectively viewed problem areas.
One of the biggest problems of citizen and community science projects and the data collected is the motivation of citizens to use the CCS app. If the CCS app is not used or not used regularly and extensively, it is not possible to generate sufficient data with corresponding spatial, temporal and thematic coverage. This is where incentive systems such as gamification (for younger users) or feedback systems (for older users) can be useful. Feedback may take the form of direct messages within the CCS app indicating how submitted data are being processed, or periodic notifications informing users when measures have been implemented as a result of their reports. However, introducing a direct feedback function also creates an expectation among participants that their concerns will be addressed promptly. This expectation often conflicts with the operational reality in many municipalities, where incoming data must first be analysed, prioritised, and followed by on-site assessments before any measures can be taken. Consequently, direct user feedback mechanisms are viewed critically from a political and administrative perspective, as they may generate obligations that cannot be fulfilled within the available resources or timeframes.
Another fundamental problem is that some people do not consider it necessary to use the CCS app. Even if they are aware of the existence of the CCS app, basic knowledge about the problems of heavy rainfall is helpful to increase motivation to use it. Pluvial events often occur in areas where flooding is not typically experienced, meaning that local residents are less likely to be sensitised to the associated risks. In addition, the use of mobile devices can exclude people from participating who do not have a mobile device. This often affects elderly people, who either do not have a mobile device or are technically unable to download or use the CCS app. The user group is restricted here, which is a clear disadvantage compared to other options for data collection such as physical questionnaires.
5.3 Scalability, future development and integration potential in other regions
The CCS app was developed under open-source standards so that it can be set up and deployed in any location. The implementation guidelines are publicly available at the end of the project. This enables the CCS app to be used not only throughout Germany but also internationally. For implementation in other countries, both the language settings and the integrated map services would need to be adapted, as the current configuration only provides access to German web map services and has only German language settings. Location-specific categories used to describe problem areas can also be adjusted to reflect regional conditions. For regions without reliable mobile data coverage, relevant map sections should be integrated directly into the app (offline map function) rather than accessed via web map services. Although this increases the storage requirements on end devices, it ensures full functionality independent of mobile connectivity. A suitable geodatabase infrastructure using, for example, Geoserver is required for the storage, processing, visualisation and analysis of the collected data. Depending on local resources, this infrastructure can be hosted in-house or procured externally.
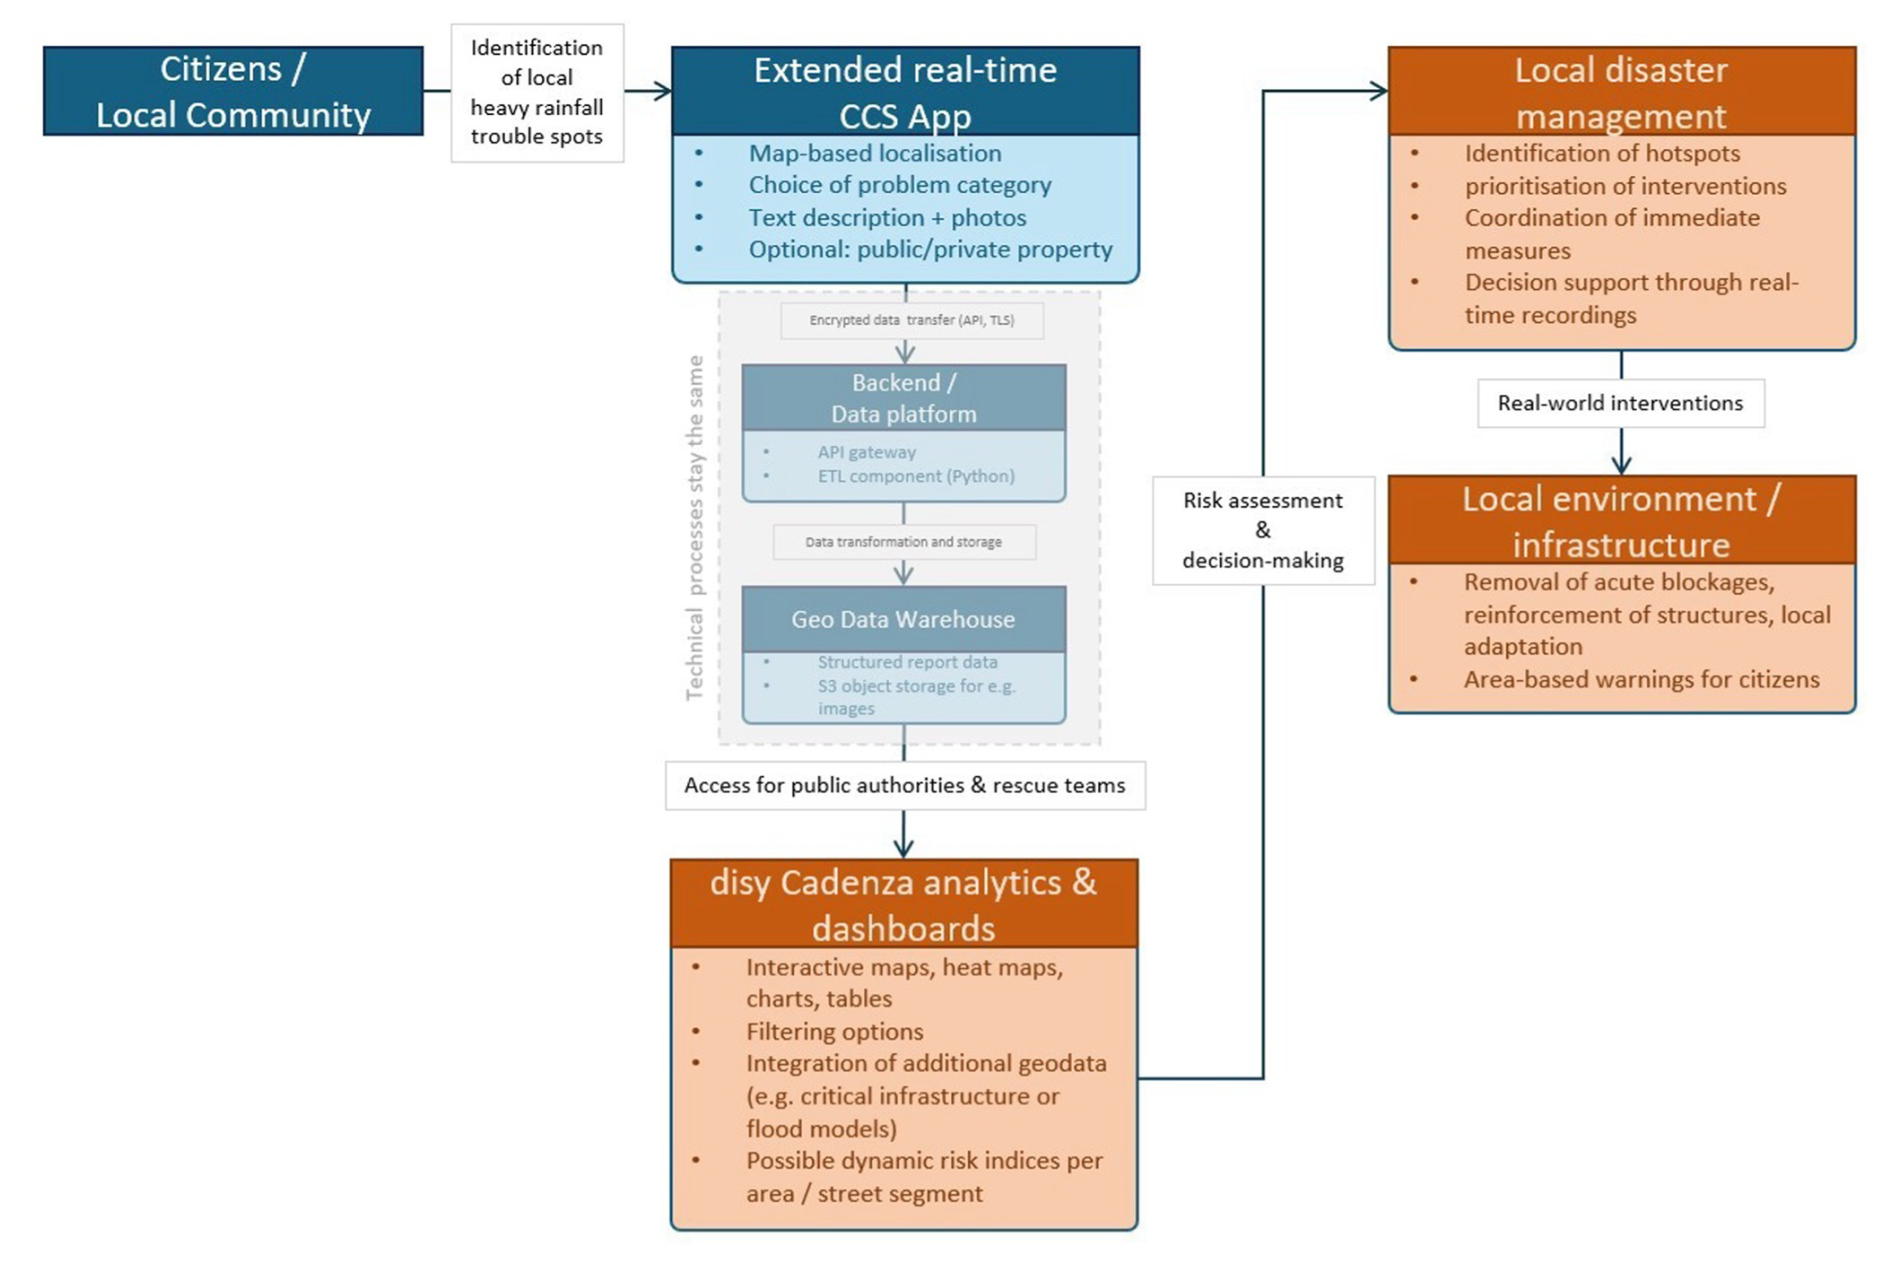
Figure 7Schematic use-case diagram of the potential extended functions as a real-time risk communication and decision support tool. The grey box shows technical processes that do not change (see Fig. 4).
At the current stage, the application is a functional prototype that has undergone technical testing but has not yet been integrated or deployed by any municipality for operational use. The open-source modular design allows municipalities worldwide to adopt, customise and deploy the system according to their specific environmental, administrative and infrastructural needs.
Future development paths include the integration of real-time support functions during active heavy rainfall events, enabling dynamic hazard communication, operational decision support and potentially automated alerting workflows. These perspectives highlight that the existing prototype represents a foundation for a wider, globally applicable system that can evolve into a comprehensive operational tool for municipal risk management.
Figure 7 illustrates how the prototype can be expanded into a real-time operational system. Building upon the app's modular and open-source architecture, the diagram outlines potential extensions for integrating real-time data sources and decision-support functionalities. These components would enable dynamic risk communication with citizens and support municipal authorities during active heavy rainfall events. The conceptual model visualises how the current local prototype can evolve into a scalable, regionally adaptable platform for operational pluvial flood risk management.
The focus of the project is on the identification and prediction of emergency flow paths caused by heavy rainfall events and the resulting risk management and communication. As climate change is expected to lead to an increase in such extreme events in the coming decades and conventional flood protection measures largely address fluvial hazards rather than pluvial ones, the aim of this work was to develop and test a citizen and community science app that can be used by the public to identify and report problem areas during heavy rainfall events. One focus was the app's contribution to sustainable risk minimisation and early warning of a heavy rainfall event in an urban context.
With its intuitive and user-friendly design, the app offers the public a low-threshold opportunity to participate in risk management processes. This is the basic requirement for effectively utilising local knowledge and recognising problem areas before they can lead to damage. The app has both a documenting and an educational function. Numerous help and information buttons are offered to provide users with further guidance on heavy rainfall the recognition of problem areas, and appropriate personal precautions. At the same time, the app serves as a tool for informing and sensitising citizens to pluvial flood risks, thereby strengthening individual and collective risk awareness. The GDW gives those responsible access to all relevant data and corresponding analytical options. Depending on the analytical needs, different dashboards can be created that summarise and present information for distinct target groups.
The test runs showed a high level of acceptance and improved self-efficacy among the test group. By using the app, the emotional stance towards the topic shifted positively from a sense of fear to one of trust. However, these findings do not have statistical significance due to the limited number of participants. This participatory approach together with the technical implementation of the CCS app, the GDW and the associated analysis and presentation tools, can nevertheless be regarded as successful. The CCS approach is particularly well suited to local and difficult-to-predict pluvial events, as the volume and level of detail of the resulting data could not realistically be gathered by public authorities alone.
In everyday use, there remain technical limitations that cannot yet be resolved. Depending on the user's mobile phone network connection, map services may not load and users may not be able to locate themselves on the map. Although reports can be saved offline and submitted once reception is restored, the maps are unfortunately not visible in offline mode. In addition, inaccuracies in GNSS positioning can lead to incorrectly placed problem areas. This is one of the reasons why the validation of submitted user data is useful. Such validation mechanisms, including automated plausibility checks or image-based content verification, have not yet been implemented and must be addressed in future development.
The potential for further development of the app and the GDW is therefore in the areas such as offline functionality and accessibility, among others. Furthermore, user frequency could be increased through possible gamification elements and feedback systems. However, direct feedback mechanisms must be designed carefully, as they risk creating expectations among users that municipalities may not be able to meet due to administrative, financial, or procedural constraints. Thanks to the open-source approach, the app also offers the possibility of scaling to other regions or countries In addition, functional extensions could be envisaged that would make the app usable for emergency services during actual heavy rainfall events, highlighting acute danger spots. Another use case would be its application by engineering companies and other experts in surveying at-risk areas.
The CCS app together with the GDW is an innovative and effective tool for urban heavy rain risk management that can be scaled to other regions and use cases. Due to the involvement of citizens, data gaps can be closed and the public can take an active role in risk management. In this way, the CCS app and the GDW contribute to a resilience-orientated, sustainable approach to climate impacts in urban areas.
The CCS app code and guidelines can be accessed via the following link: https://gitlab.rlp.net/ISS/florest/florest-smart-app (last access: 28 January 2026).
The supplement related to this article is available online at https://doi.org/10.5194/nhess-26-1795-2026-supplement.
PFS and AA planned the project; SN, SA and VT programmed the app; JJ and AA set up the Geo Data Warehouse; JH, SN and JJ analysed the data; JH and JJ wrote the draft manuscript; JH, JJ, AA and PFS reviewed and edited the manuscript.
The contact author has declared that none of the authors has any competing interests.
The authors JJ and AA are employed by the private company Disy Informationssysteme GmbH, Karlsruhe/Germany. They declare that this affiliation has not influenced the research design, data collection, data analysis or the result interpretation in the FloReST project, or the decision to publish the results in this paper. The work was conducted independently in an interdisciplinary academic consortium, following usual standards of good scientific work. The findings have been presented and discussed publicly with the independent pilot users and are reported objectively in this paper. The authors JJ and AA declare no other financial or non-financial competing commercial interests related to this work which would compromise its validity or its publishability.
Publisher's note: Copernicus Publications remains neutral with regard to jurisdictional claims made in the text, published maps, institutional affiliations, or any other geographical representation in this paper. The authors bear the ultimate responsibility for providing appropriate place names. Views expressed in the text are those of the authors and do not necessarily reflect the views of the publisher.
All work presented in this paper was carried out within the research project FloReST. The FloReST project was funded by the German Federal Ministry of Research, Technology and Space (BMFTR) under the Water Extreme Events funding initiative. The authors would like to express their gratitude for this funding. We would also like to extend our sincere thanks to the participating pilot municipalities and the project advisory board, which enabled the test applications of the developed methods and provided technical support.
This research has been supported by the Bundesministerium für Forschung, Technologie und Raumfahrt (grant no. 02WEE1634A-F).
This paper was edited by Solmaz Mohadjer and reviewed by Jonathan Paul and Christine Yiqing Liang.
Abecker, A., Kazakos, W., De Melo Borges, J., and Zacharias, V.: Beiträge zu einer Technologie für Anwendungen des Participatory Sensing, in: Angewandte Geoinformatik, Wichmann, Berlin/Offenbach, 240–249, ISBN 978-3-87907-520-1, 2012a.
Abecker, A., Braun, S., Kazakos, W., and Zacharias, V.: Participatory Sensing for Nature Conservation and Environment Protection, in: Monitoring and Mobile Applications, International Conference on Informatics for Environmental Protection, Aachen, ISBN: 978-3-8440-1248-4, 2012b.
Abecker, A., Fuchs-Kittowski, F., Janßen, J., Müller, R., Pfützner, B., and Zemann, M.: Lösungsansätze zur Entscheidungsunterstützung bei Niedrigwasser und Trockenheit, in: Umweltinformationssysteme – Digitalisierung im Zeichen des Klimawandels und der Energiewende, edited by: Fuchs-Kittowski, F., Abecker, A., Hosenfeld, F., Reineke, A., and Jolk, C., Springer Fachmedien Wiesbaden, Wiesbaden, 139–153, https://doi.org/10.1007/978-3-658-43735-0_10, 2024.
Agonafir, C., Lakhankar, T., Khanbilvardi, R., Krakauer, N., Radell, D., and Devineni, N.: A review of recent advances in urban flood research, Water Secur., 19, 100141, https://doi.org/10.1016/j.wasec.2023.100141, 2023.
Baldwin, E., Thiel, A., McGinnis, M., and Kellner, E.: Empirical research on polycentric governance: Critical gaps and a framework for studying long-term change, Policy Stud. J., 52, 319–348, https://doi.org/10.1111/psj.12518, 2024.
Ballard, H. L., Lindell, A. J., and Jadallah, C. C.: Environmental education outcomes of community and citizen science: a systematic review of empirical research, Environ. Educ. Res., 30, 1007–1040, https://doi.org/10.1080/13504622.2024.2348702, 2024.
Bonn, A., Brink, W., Hecker, S., Herrmann, T. M., Liedtke, C., Premke-Kraus, M., Voigt-Heucke, S., Von Gönner, J., Altmann, C. S., Bauhus, W., Bengtsson, L., Büermann, A., Brandt, M., Bruckermann, T., Dietrich, P., Dörler, D., Eich-Brod, R., Eichinger, M., Ferschinger, L., Freyberg, L., Grützner, A., Hammel, G., Heigl, F., Heyen, N. B., Hoelker, F., Johannsen, C., Kiefer, S., Klan, F., Kluttig, T., Kluss, T., Knapp, V., Knobloch, J., Koop, M., Lorke, J., Mortega, K., Munke, M., Pathe, C., Richter, A., Schumann, A., Soßdorf, A., Stämpfli, T., Sturm, U., Thiel, C., Tönsmann, S., Valentin, A., Van Den Bogaert, V., Wagenknecht, K., Wegener, R., and Woll, S.: Weißbuch Citizen Science Strategie 2030 für Deutschland, Helmholtz-Gemeinschaft, Leibniz-Gemeinschaft, Universitäten und außeruniversitäre Einrichtungen, Leipzig, Berlin. SoArXiv, https://doi.org/10.31235/osf.io/ew4uk, 7 August 2021.
Bonney, R.: Citizen Science: A lab tradition, Living Bird, 15, 7–15, 1996.
Bronstert, A., Apel, H., Bormann, H., Bürger, G., Haberlandt, U., Hannappel, A., Hattermann, F. F., Heistermann, M., Huang, S., Iber, C., Joneck, M., Kolokotronis, V., Kundzewicz, Z. W., Menzel, L., Meon, G., Merz, B., Meuser, A., Nied, M., Paton, E. N., Petrow, T., and Rottler, E.: Hochwasser und Sturzfluten an Flüssen in Deutschland, in: Klimawandel in Deutschland, edited by: Brasseur, G. P., Jacob, D., and Schuck-Zöller, S., Springer Berlin Heidelberg, Berlin, Heidelberg, 109–130, https://doi.org/10.1007/978-3-662-66696-8_10, 2023.
Cohn, J. P.: Citizen Science: Can Volunteers Do Real Research?, BioScience, 58, 192–197, https://doi.org/10.1641/B580303, 2008.
Conrad, C. C. and Hilchey, K. G.: A review of citizen science and community-based environmental monitoring: issues and opportunities, Environ. Monit. Assess., 176, 273–291, https://doi.org/10.1007/s10661-010-1582-5, 2011.
Cooper, C. B., Hawn, C. L., Larson, L. R., Parrish, J. K., Bowser, G., Cavalier, D., Dunn, R. R., Haklay, M. (Muki), Gupta, K. K., Jelks, N. O., Johnson, V. A., Katti, M., Leggett, Z., Wilson, O. R., and Wilson, S.: Inclusion in citizen science: The conundrum of rebranding, Science, 372, 1386–1388, https://doi.org/10.1126/science.abi6487, 2021.
Denda, M. and Fujikane, M.: Development of a virtual flood experience system and its suitability as a flood risk communication tool, Proc. IAHS, 386, 21–26, https://doi.org/10.5194/piahs-386-21-2024, 2024.
Deumlich, D. and Gericke, A.: Frequency Trend Analysis of Heavy Rainfall Days for Germany, Water, 12, 1950, https://doi.org/10.3390/w12071950, 2020.
Dillenardt, L. and Thieken, A. H.: Individual flood risk adaptation in Germany: exploring the role of different types of flooding, Nat. Hazards Earth Syst. Sci., 25, 3257–3278, https://doi.org/10.5194/nhess-25-3257-2025, 2025.
Falconer, R. H., Cobby, D., Smyth, P., Astle, G., Dent, J., and Golding, B.: Pluvial flooding: new approaches in flood warning, mapping and risk management, J. Flood Risk Manag., 2, 198–208, https://doi.org/10.1111/j.1753-318X.2009.01034.x, 2009.
Gallmetzer, W., Baumann, W., Carnelli, F., Koboltschnig, G., Krenn, P., Macconi, P., Marangoni, N., and Pedoth, L.: RIKOST Risikokommunikationsstrategien – Abschlussbericht, Internationale Forschungsgemeinschaft Interpraevent, Klagenfurt, ISBN: 978-3-901164-29-3, 2021.
Heidbreder, L.: Konsequenzen aus der Flutkatastrophe in Rheinland-Pfalz: Erfolgreichen Katastrophenschutz gewährleisten, Klimawandel ernst nehmen und Vorsorgekonzepte weiterentwickeln (“Zukunftsstrategien zur Katastrophenvorsorge”), Landtag Rheinland-Pfalz, Mainz, 2023.
Irwin, A.: Citizen science: a study of people, expertise and sustainable development, Routledge, London New York, 1 pp., https://doi.org/10.4324/9780203202395, 1995.
Janßen, J. and Abecker, A.: Eine Datenplattform zum Austausch von Starkregenvorsorgedaten, in: Umweltinformationssysteme - Digitale Innovationen für eine nachhaltige Zukunft, UIS 2026, edited by: Fuchs-Kittowski, F., Abecker, A., Hosenfeld, F., Reineke, A., and Wachsmuth, M., Springer Vieweg, Wiesbaden, https://doi.org/10.1007/978-3-658-50065-8_3, 2026.
Johnson, N., Druckenmiller, M. L., Danielsen, F., and Pulsifer, P. L.: The Use of Digital Platforms for Community-Based Monitoring, BioScience, 71, 452–466, https://doi.org/10.1093/biosci/biaa162, 2021.
Kutschker, T. and Glade, T.: Unwetter! – Starkregen als Herausforderung für den anwendungsbezogenen Bevölkerungsschutz, https://doi.org/10.13140/RG.2.1.4525.8481, 2016.
Lemmens, R., Antoniou, V., Hummer, P., and Potsiou, C.: Citizen Science in the Digital World of Apps, in: The Science of Citizen Science, edited by: Vohland, K., Land-Zandstra, A., Ceccaroni, L., Lemmens, R., Perelló, J., Ponti, M., Samson, R., and Wagenknecht, K., Springer International Publishing, Cham, 461–474, https://doi.org/10.1007/978-3-030-58278-4_23, 2021.
Lexa, C.: Gamification, in: Fit für die digitale Zukunft, Springer Fachmedien Wiesbaden, Wiesbaden, 71–73, https://doi.org/10.1007/978-3-658-33073-6_17, 2021.
Lin Hunter, D. E., Newman, G. J., and Balgopal, M. M.: What's in a name? The paradox of citizen science and community science, Front. Ecol. Environ., 21, 244–250, https://doi.org/10.1002/fee.2635, 2023.
Liu, H.-Y., Kobernus, M., Broday, D., and Bartonova, A.: A conceptual approach to a citizens' observatory – supporting community-based environmental governance, Environ. Health, 13, 107, https://doi.org/10.1186/1476-069X-13-107, 2014.
Mohr, S., Ehret, U., Kunz, M., Ludwig, P., Caldas-Alvarez, A., Daniell, J. E., Ehmele, F., Feldmann, H., Franca, M. J., Gattke, C., Hundhausen, M., Knippertz, P., Küpfer, K., Mühr, B., Pinto, J. G., Quinting, J., Schäfer, A. M., Scheibel, M., Seidel, F., and Wisotzky, C.: A multi-disciplinary analysis of the exceptional flood event of July 2021 in central Europe – Part 1: Event description and analysis, Nat. Hazards Earth Syst. Sci., 23, 525–551, https://doi.org/10.5194/nhess-23-525-2023, 2023.
Netzel, L. M., Heldt, S., Engler, S., and Denecke, M.: The importance of public risk perception for the effective management of pluvial floods in urban areas: A case study from Germany, J. Flood Risk Manag., 14, e12688, https://doi.org/10.1111/jfr3.12688, 2021.
Odenwald, S.: Smartphone Sensors for Citizen Science Applications: Light and Sound, Citiz. Sci. Theory Pract., 5, 13, https://doi.org/10.5334/cstp.254, 2020.
Paul, J. D., Bee, E., and Budimir, M.: Mobile phone technologies for disaster risk reduction, Clim. Risk Manag., 32, 100296, https://doi.org/10.1016/j.crm.2021.100296, 2021.
Rhein, B. and Kreibich, H.: Causes of the exceptionally high number of fatalities in the Ahr valley, Germany, during the 2021 flood, Nat. Hazards Earth Syst. Sci., 25, 581–589, https://doi.org/10.5194/nhess-25-581-2025, 2025.
Rollason, E., Bracken, L. J., Hardy, R. J., and Large, A. R. G.: Rethinking flood risk communication, Nat. Hazards, 92, 1665–1686, https://doi.org/10.1007/s11069-018-3273-4, 2018.
Rosenzweig, B. R., McPhillips, L., Chang, H., Cheng, C., Welty, C., Matsler, M., Iwaniec, D., and Davidson, C. I.: Pluvial flood risk and opportunities for resilience, WIREs Water, 5, e1302, https://doi.org/10.1002/wat2.1302, 2018.
Schilling, K.: Apps machen: der Kompaktkurs für Designer: von der Idee bis zum klickbaren Prototyp, 1. Aufl., Hanser, München, 1 pp., https://doi.org/10.3139/9783446446533, 2016.
Schmitt, T. G. and Scheid, C.: Evaluation and communication of pluvial flood risks in urban areas, WIREs Water, 7, e1401, https://doi.org/10.1002/wat2.1401, 2020.
Schrauth, S., Nedkov, R., Heidmann, C., Kazakos, W., and Abecker, A.: Software Support for Spatial ETL Processes, in: From Science to Society: The Bridge provided by Environmental Informatics – Adjunct Proceedings of the 31st EnviroInfo conference, ISBN: 978-3-8440-5495-8, 2017.
See, L.: A Review of Citizen Science and Crowdsourcing in Applications of Pluvial Flooding, Front. Earth Sci., 7, 44, https://doi.org/10.3389/feart.2019.00044, 2019.
Seibert, J., Strobl, B., Etter, S., Hummer, P., and Van Meerveld, H. J. (Ilja): Virtual Staff Gauges for Crowd-Based Stream Level Observations, Front. Earth Sci., 7, 70, https://doi.org/10.3389/feart.2019.00070, 2019.
Thieken, A. H., Kreibich, H., MüLLER, M., and Merz, B.: Coping with floods: preparedness, response and recovery of flood-affected residents in Germany in 2002, Hydrol. Sci. J., 52, 1016–1037, https://doi.org/10.1623/hysj.52.5.1016, 2007.
Ueberham, M.: Resilienz, Risikokommunikation und Verantwortung in der Hochwasservorsorge: zum Verhältnis zwischen öffentlichem Schutz und privater Eigenvorsorge in überschwemmungsgefährdeten Gebieten, Hydrol. Wasserbewirtsch. BfG – Jahrg. 602016, https://doi.org/10.5675/HYWA_2016,2_3, 2016.
Wang, W., Yang, S., Stanley, H. E., and Gao, J.: Local floods induce large-scale abrupt failures of road networks, Nat. Commun., 10, 2114, https://doi.org/10.1038/s41467-019-10063-w, 2019.
Weiße, B.: AngularJS & Ionic Framework: hybride App-Entwicklung mit JavaScript und HTML5, Hanser, München, 1 pp., https://doi.org/10.3139/9783446448070, 2016.
Ziegler, R. and Kremer, B.: Wissenschaftsbarometer 2022 - Repräsentative Bevölkerungsumfrage zu Wissenschaft und Forschung in Deutschland, ZA7641; Version 1.0.0, GESIS [data set], Köln, https://doi.org/10.4232/1.14077, 2023.