the Creative Commons Attribution 4.0 License.
the Creative Commons Attribution 4.0 License.
 | 16 Apr 2026
The damability function: a probabilistic approach to regional landslide dam susceptibility analysis applied to the Oregon Coast Range, USA
Alex Grant
Will Struble
Sean LaHusen
Alison Duvall
Landslides can dam rivers and require rapid response to mitigate catastrophic outburst floods. Here, we present a workflow to map landslide dam formation susceptibility at a regional scale. We define a probabilistic function that combines river valley width and landslide volume to efficiently determine the likelihood of a landslide dam or “damability”. We combine damability values with landslide susceptibility to estimate landslide dam susceptibility. The valley width measurements are automated using a new elevation threshold-based algorithm. Landslide volume is represented as a statistical distribution from mapped landslides. We validate and apply our approach to the Oregon Coast Range, USA and find that 36 % of river stretches exceed a dam potential threshold; these are in river headwaters and steeper terrain, which in this case correlate with more resistant lithologies. We also estimate volumes of the potential dammed lakes and find that most rivers with high dam susceptibility are less likely to impound large lakes because they have low drainage areas. However, widespread susceptibility, and the potential impacts from exceptionally large landslides, suggest that this hazard should be considered in the Pacific Northwest. The damability function workflow can ingest new data and be applied more broadly to assess future landslide dam hazards.
- Article
(23025 KB) - Full-text XML
-
Supplement
(1612 KB) - BibTeX
- EndNote


Landslides are a widespread and destructive hazard (Froude and Petley, 2018) with impacts that can cascade from slope failure to flooding when landslides intersect river valleys (Yanites et al., 2025). Landslides can dam the flow of water and create a lake upstream of the slide deposit which may gradually flood roads or infrastructure. However, the greater danger lies in the possibility that the lake can break through the dam in a sudden outburst, draining rapidly and possibly catastrophically (Costa and Schuster, 1988; Fan et al., 2019; Korup and Tweed, 2007). Many historic landslide dam outburst floods have led to widespread destruction and casualties (Costa and Schuster, 1991; Dai et al., 2005, 2021; Sattar and Konagai, 2012; Xu et al., 2009; Zeng et al., 2022). Landslide dams are potential hazards anywhere that steep slopes abut rivers, especially in mountainous regions prone to landsliding (Costa and Schuster, 1988, 1991; Fan et al., 2020).
After a landslide dams a river, human intervention can prevent the rising lake waters from breaching the dam in an outburst flood. The most straightforward method to prevent a large flood is the excavation of a spillway into the landslide dam (Sattar and Konagai, 2012), a technique that has been in practice for at least 500 years (Bonnard, 2011). Spillway excavation can decrease the volume of the impounded lake, and thus the potential flood volume when the dam is overtopped, and can stabilize that flow, decreasing the peak breach discharge (Yan et al., 2022). Timely coordinated landslide dam responses by government agencies have averted disaster around the world (Bonnard, 2011; Duncan et al., 1986; Fan et al., 2020; Yang et al., 2010). However, most landslide dams fail within a short time after they form, with 50 % failing within 10 d or less (Peng and Zhang, 2012; Costa and Schuster 1988; Ermini and Casagli 2003). The combination of the importance of a response, and the short window for it, necessitates pre-planning as a mitigation technique. The first steps are knowing which river stretches are susceptible to landslide dams, and where dams would be the most dangerous.
The review by Fan et al. (2020) summarizes and tests several metrics used to predict landslide dam formation. These metrics include: the “annual constriction ratio” (ACR), which concerns the ratio between landslide velocity and valley width (Swanson et al., 1986), the “Dimensionless Morpho-Invasion Index” (DMI), which is a more complex formulation of the ACR incorporating more physical parameters of the landslide like velocity, density, volume, and hydraulic level (Dal Sasso et al., 2014), the “Dimensionless Constriction Index” (DCI) that includes parameters of the landslide like geometry, velocity, and grain size, as well as the width of the valley (Ermini and Casagli, 2003), and the “Morphological Obstruction Index” (MOI), which concerns the ratio between log valley width and landslide volume (Tacconi Stefanelli et al., 2016). The ACR, DMI, and DCI require estimates of landslide velocity, which is difficult to measure for a known landslide, and even more difficult to estimate for ancient or future landslides across a landscape. The MOI (Tacconi Stefanelli et al., 2016) is the simplest and the easiest to implement at landscape scales for susceptibility analysis where the properties of a future landslide must be inferred.
Three methodologies have been used to generate landslide dam susceptibility maps and all roughly follow the format of the MOI taking into account landslide volume and valley or channel width. Tacconi Stefanelli et al. (2020) introduced a semi-automated workflow to estimate susceptibility across the Arno river basin in Italy and used landform classification to measure valley width, and a spatially variable power law fit to a large landslide inventory to estimate landslide sizes. McMeckin (2022) used a somewhat similar technique in the West Coast region of New Zealand and used relative relief as a proxy for landslide size. Wu et al. (2024) developed a globally applicable methodology using a coarse global river dataset of river widths and slope unit area as a proxy for landslide size.
Within the MOI framework (Eq. 1), dam formation or non-formation can be inferred from only two parameters: landslide volume and valley width as:
where V is landslide volume (m3), and WV is valley width (m) and MOI is treated as an index for likelihood of dam formation. Conceptually, large landslides impacting narrow valleys form landslide dams and, conversely, small landslides impacting wide valleys do not form landslide dams. A function we refer to as the damability function can estimate which landslide volume/valley width combinations are likely to result in dam formation for a specific region. This function is a modification of the formation volume and non-formation volume equations from Tacconi Stefanelli et al. (2020). Damability functions can satisfactory separate dam forming and non-forming landslides from a large historical database (Tacconi Stefanelli et al., 2015) and have been used to assess damming predisposition in Italy and Central Asia (Tacconi Stefanelli et al., 2020, 2023). However, the methods for calibrating or fitting a damability function to a new regional dataset are undefined and more widespread applicability of the damability approach remains to be demonstrated.
Here we present a simple probabilistic approach to estimating landslide dam susceptibility from mapped landslide data and digital elevation models. Mapped landslides with and without formed dams are used to quantitatively define a logistic damability function that depends on landslide volume and valley width. Landslide dam formation likelihood is then estimated for the entire study region by combining measured valley widths, empirical volume estimates, and a model of landslide susceptibility.
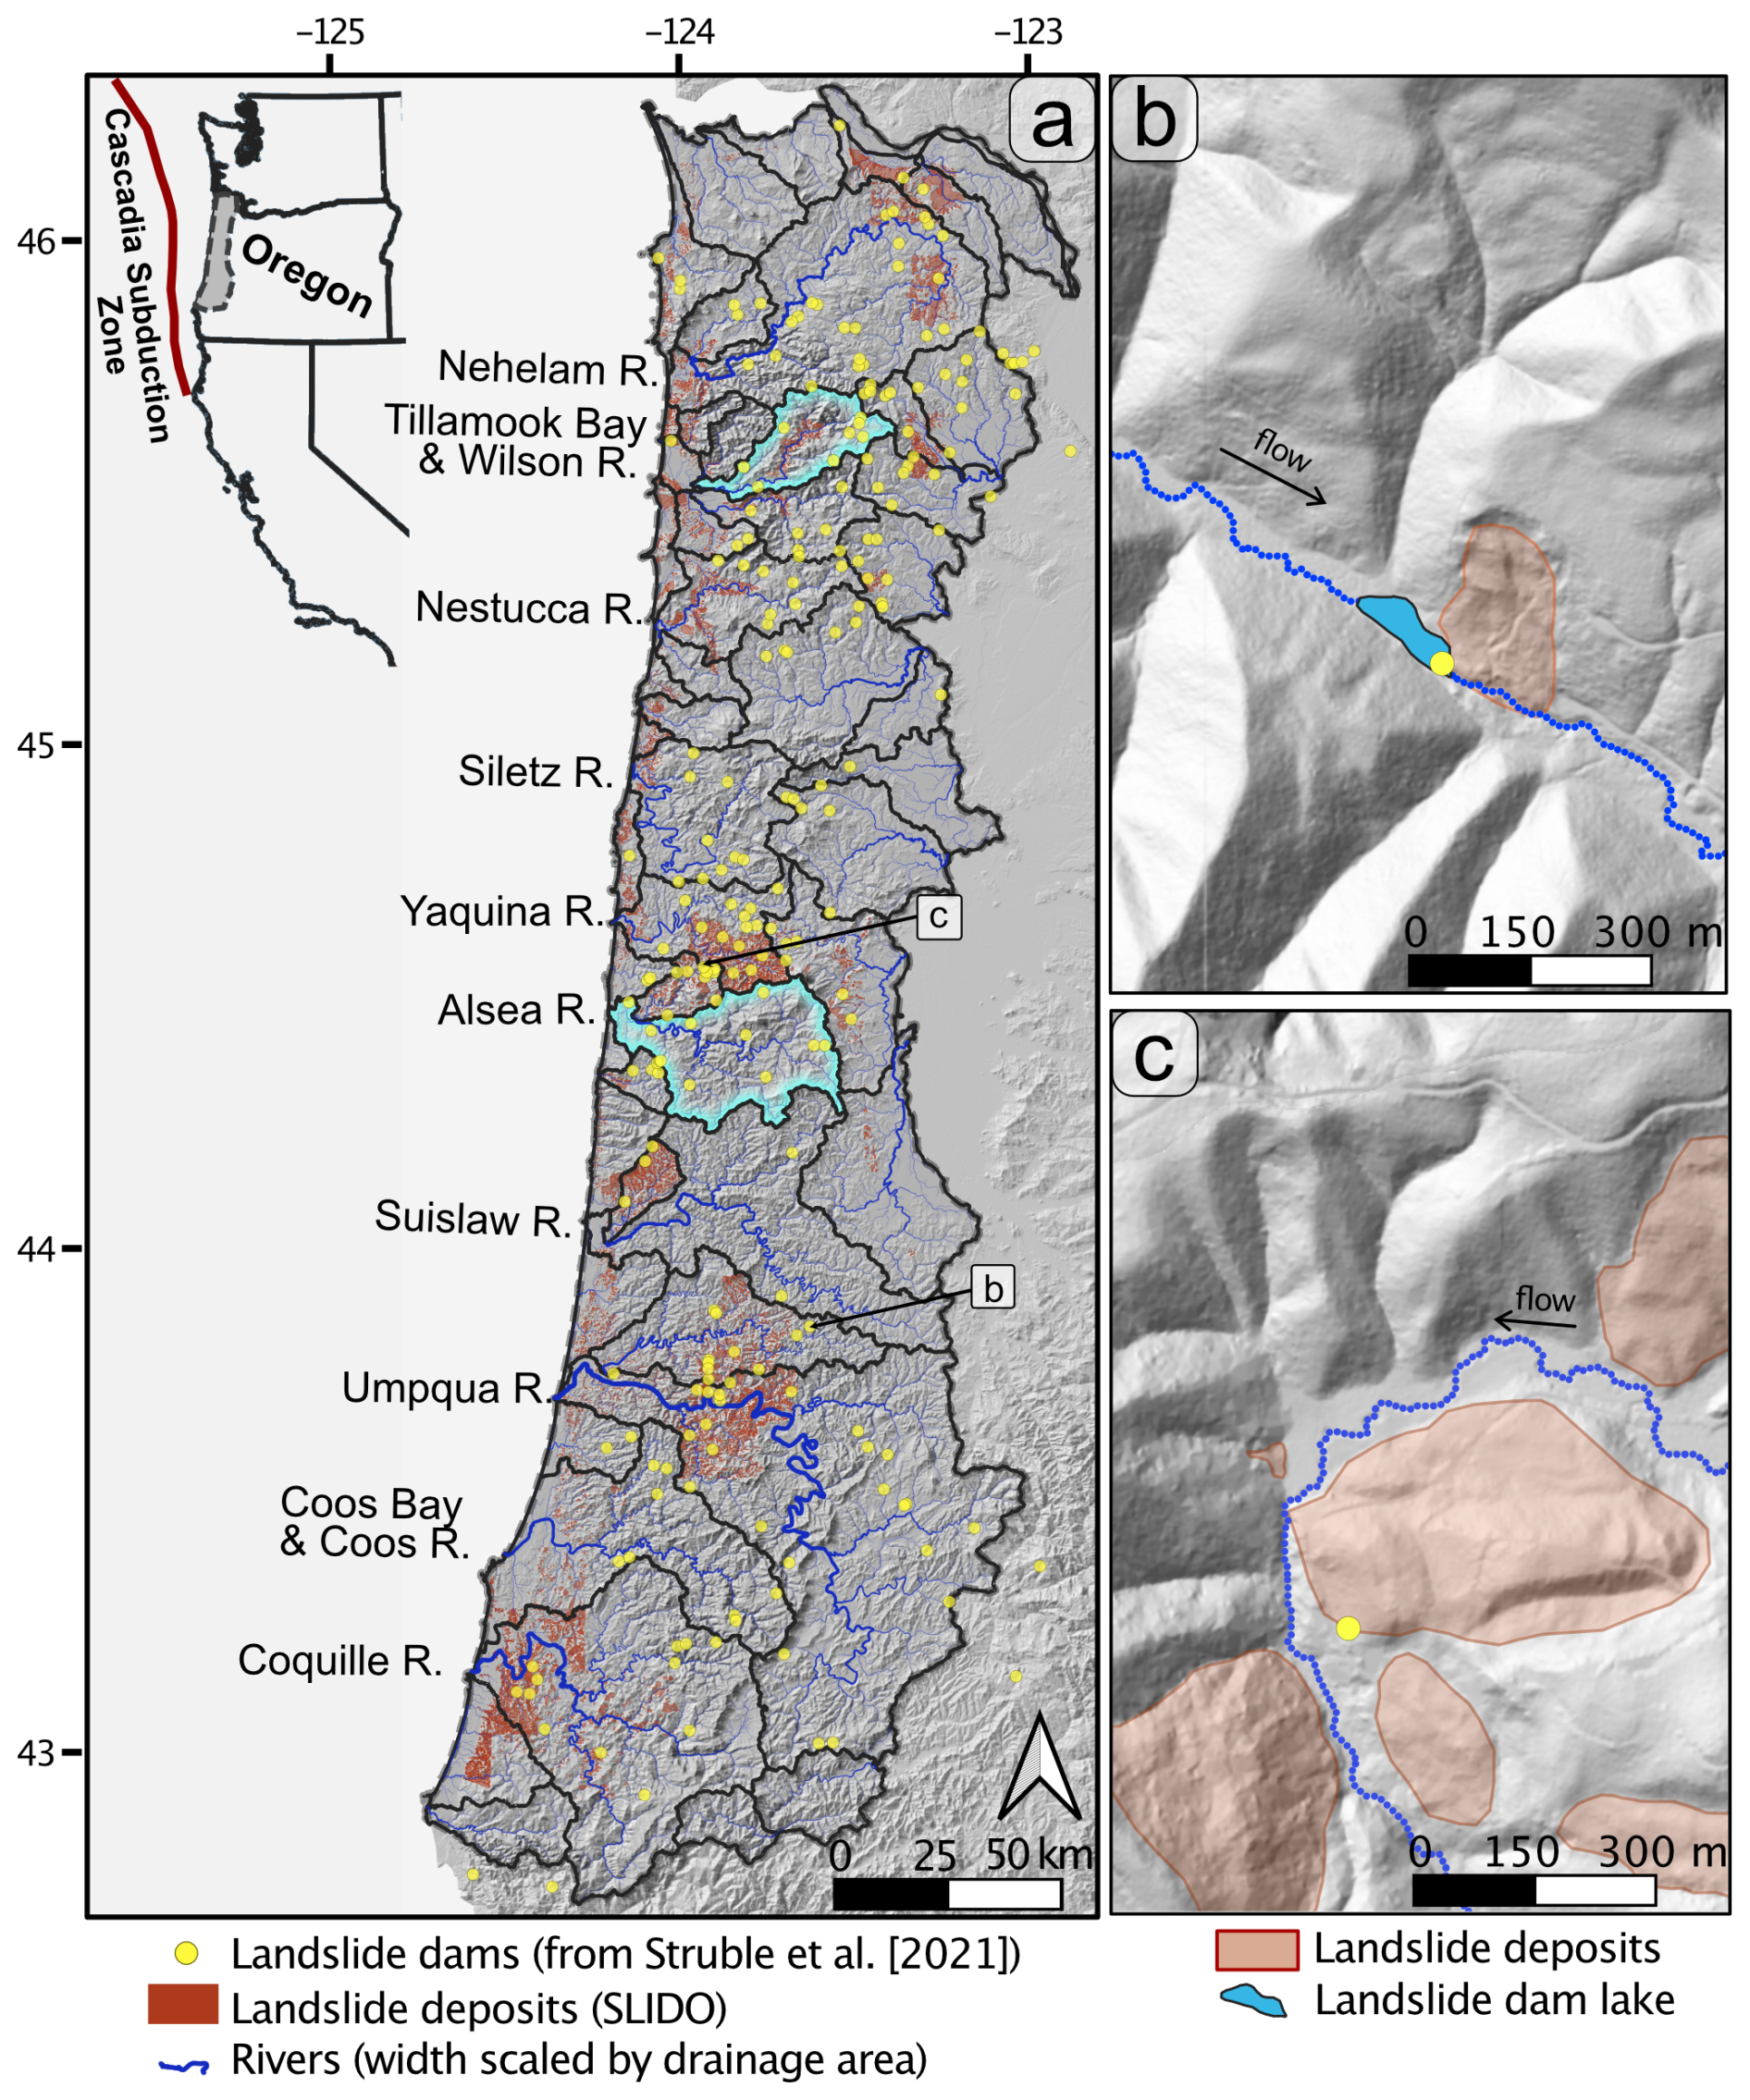
Figure 1(a) overview of the Oregon Coast Range study area as a hillshade, derived river network, and landslide inventories. Oregon state-wide landslide inventory (SLIDO, Franczyk et al. 2020) as red polygons, and Struble et al. (2021) landslide dam inventory as yellow dots. River drainage basins are delineated by black lines, with the Wilson and Alsea basins highlighted in light blue because they are discussed later (Figs. 8 and 9). (b) and (c) depict example landslides of different sizes from the SLIDO inventory, and mapped landslide dam locations from Struble et al. (2021).
We demonstrate the utility of this framework for estimating landslide dam susceptibility in the Oregon Coast Range (OCR), United States of America. Tens of thousands of landslides have been mapped in the OCR (Burns and Madin, 2009), including 238 landslide dams (Struble et al., 2020, 2021). Additionally, the OCR is subject to atmospheric rivers and intense precipitation events as well as strong shaking from Cascadia subduction zone earthquakes, all of which compound landslide and landslide dam hazards (Dettinger et al., 2018; Grant et al., 2022). We estimate landslide dam susceptibility by implementing a workflow based on a damability function, which we fit to a local landslide dam inventory. We use a new algorithm to automate valley width measurements. To estimate landslide volumes we use a large database of mapped landslide deposits within the study area to fit a single empirical log-normal distribution of landslide volumes to use across the study area. We also explore the utility of location specific landslide volume estimates using multivariate regression, however, we are unable to make satisfactorily predictions. Using the damability function, we estimate the geometric predisposition to damming, that is, the damability, of a valley. Then, we combine damability values with estimates of landslide susceptibility to find landslide dam susceptibility values. Landslide dam susceptibility maps may be useful to planners (e.g. governmental emergency managers or transportation agencies) to identify places both prone to failure and damming. Finally, we estimate possible lake volumes for all potential dams to provide planners and other end users more information about the scale of potential impacts of future landslide dams. Our results provide a map of the landslide dam formation susceptibility and severity within the OCR. We find that landslide dams are most likely to form in river headwaters, high relief terrain, and more resistant lithologies. Most river stretches with the highest potential for landslide dam formation may only impound relatively small lakes. However, the mapped widespread susceptibility and potential for the largest landslides to form large hazardous lakes that may require prompt mitigation, show that landslide dam hazards should not be overlooked across a broader region. We also discuss the damability function method, why it works, its flexibility, and its effectiveness for future evaluations globally.
The OCR is a roughly 60 km long mountain range along Oregon's Pacific coast, stretching from the mouth of the Columbia River in the north to the Klamath Ranges in the south (Fig. 1). These mountains are unglaciated and reach elevations of ∼ 1200 m. The bedrock of the range is mostly Eocene accreted volcanic terrains and marine sedimentary rocks, predominantly the siltstone and sandstone Tyee Formation in the central and southern areas (Lane, 1987; Roering et al., 2005; Wells et al., 2014). Lithologic variance has been shown to impact geomorphology, with notable units such as the Tillamook Volcanics (North-central study area, Wilson river catchment Fig. 1) exhibiting sharper hilltop curvature than neighboring sedimentary units (Struble et al., 2024). Conifer forests cover the landscape, which experiences annual rainfall of 1.6 to 5.1 m (65–200 in.), most of which during the winter and often in the form of atmospheric rivers (Taylor and Bartlett, 1993).
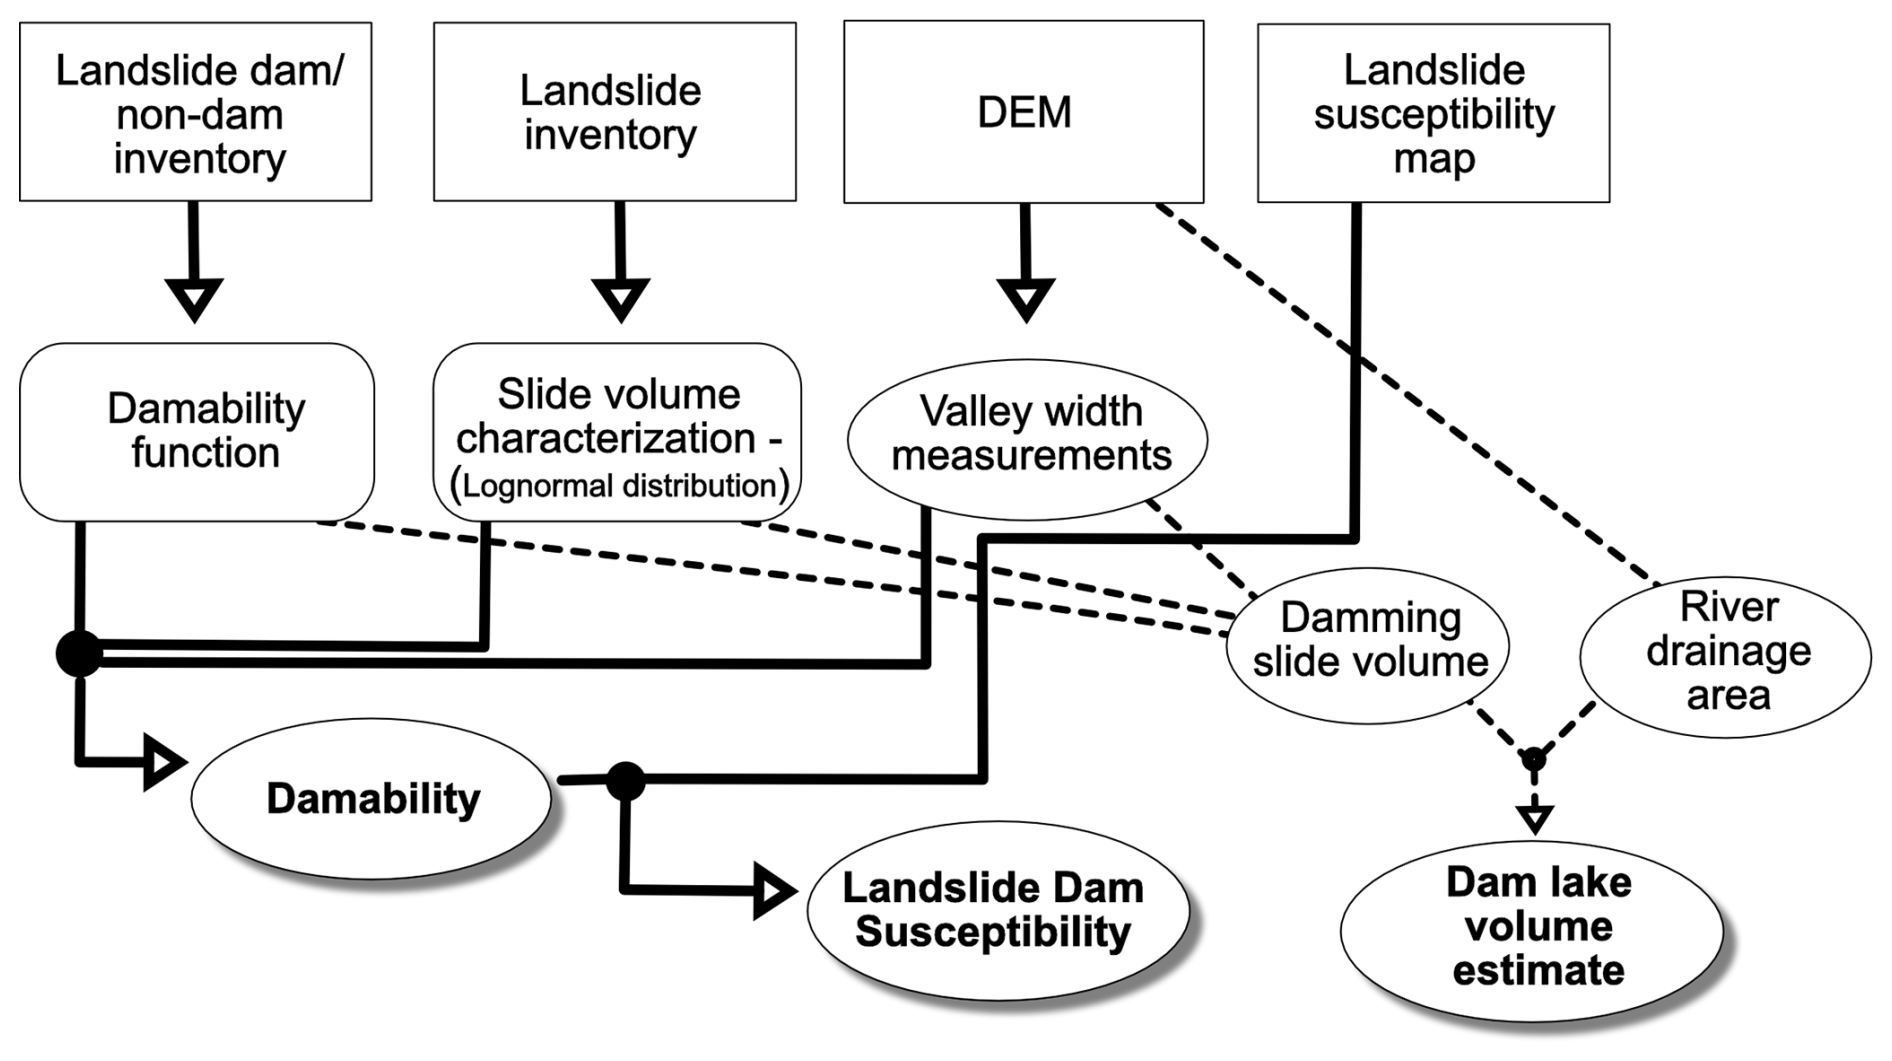
Figure 2Flow chart illustrating path from input datasets (square boxes) to interim results (rounded rectangles and ovals), to outputs (ovals with drop shadows). Rounded rectangles are values/equations that are constant across the study area, while ovals have unique values for each river point. Dashed lines represent the workflow for dam lake volume estimates, while solid lines represent the workflow towards landslide dam susceptibility.
Landslides are common in the OCR. During major winter storms, hundreds of shallow landslides, which often mobilize into debris flows, have been observed (Robinson et al., 1999). Widespread evidence of deeper-seated landslides exists across these hillslopes as well (LaHusen et al., 2020). Shallow and deep landslides have been studied and inventoried in detail, including in the Oregon statewide landslide inventory, or SLIDO (Franczyk et al., 2020, red polygons in Fig. 1). Landslide patterns within the study area are known to be controlled by sub geologic unit lithologic properties such as the dip or bedding thicknesses within the Tyee Formation (Roering et al., 2005; LaHusen and Grant, 2024).
The SLIDO database is a compilation of landslides that appear on published maps. Many of these landslides were mapped on LIDAR (light detection and ranging) generated digital elevation models follow a protocol defined by “Special Paper 42” (Burns and Madin, 2009) which require the mapper to measure, estimate, or calculate additional parameters of the landslide such as volume. We use landslides that were mapped using the Special Paper 42 protocol found in SLIDO version 4.5 directly to estimate landslide volumes in this study. Landslides within the SLIDO database range in landslide type, from shallow soil landslides to deep seated bedrock landslides, and from debris flows to earth flows to rotational and complex landslides.
Landslide dams have been documented in the area by Struble et al. (2021), who published an inventory of 238 landslide dams (yellow dots in Fig. 1). These dams were primarily caused by deep seated translational or rotational slides. They found that preserved landslide dams are overrepresented in drainage areas of ∼ 1.5 to 13 km2 and valley widths of ∼ 25–80 m. Despite the proximity of the Cascadia Subduction Zone, few dated landslide deposits or landslide dams can be correlated to earthquakes (Grant et al., 2022; Struble et al., 2021; LaHusen et al., 2020). We use this landslide dam inventory (with additions) to fit the damability function for the OCR.
Our approach to estimate landslide dam susceptibility is outlined in Fig. 2 and described in detail in the subsections below. First, we provide background on the damability function (Sect. 3.1). We measured valley widths across the study area using a new algorithm based on elevation thresholds (Sect. 3.2). We characterized the future landslide volumes using a log-normal distribution of mapped landslide volumes (Sect. 3.3.1). We also explored using multiple regression to identify a spatially variable way to predict landslide volumes, though ultimately this was not implemented (Sect. 3.3.2). We created a new dam/non-dam landslide dataset to calibrate a damability function (Sect. 3.4.1). Then we fit this data to generate the OCR specific damability function (DamabilityOCR), and integrate across the regional log-normal landslide volume distribution to get the equation for dam formation likelihood (Dam formation likelihoodOCR) used in this study (Sect. 3.4.2). Lastly, we calculated landslide dam susceptibility and quantified the magnitude of potential impacts by estimating the volume of landslide dam lakes through a proxy (Sect. 3.5).
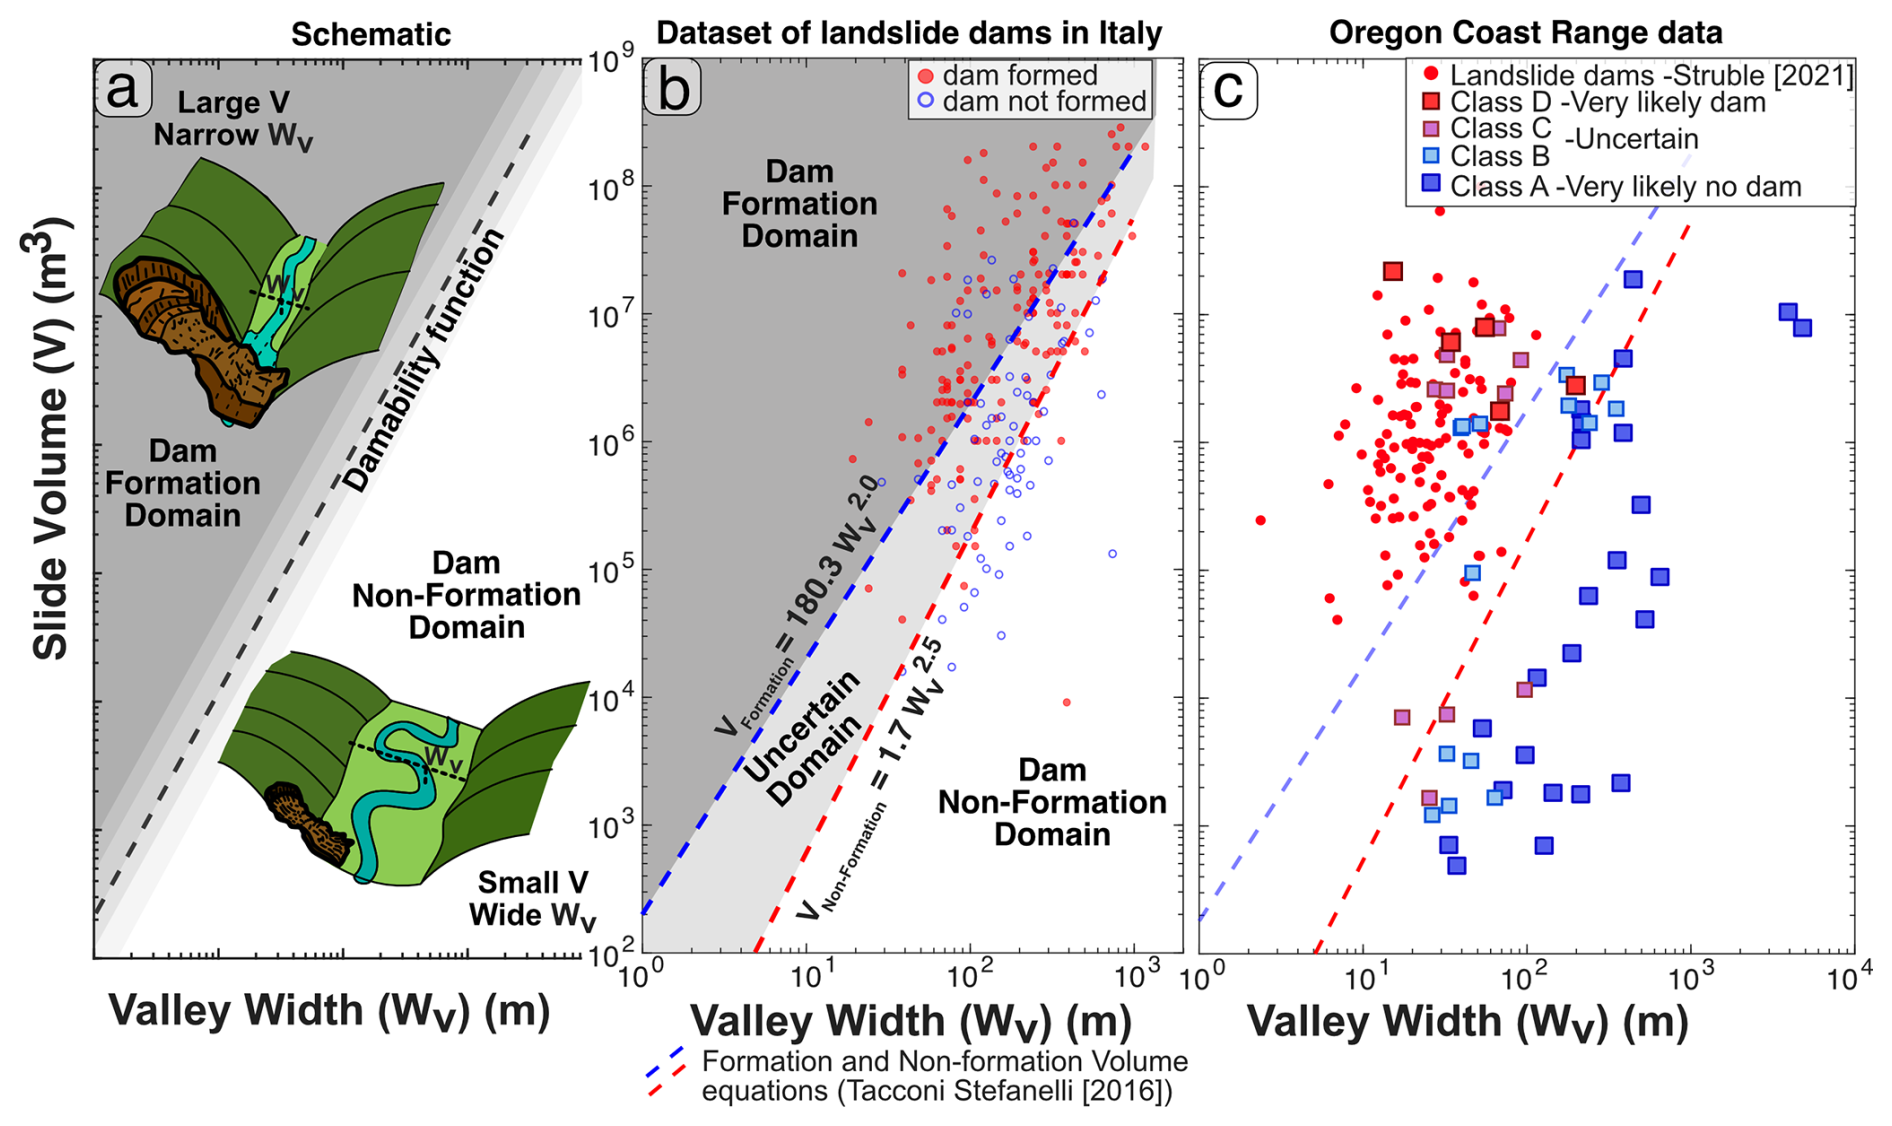
Figure 3The volume-valley width plot showing the damability functions for landslides in log-log valley width and landslide volume space. (a) Schematic diagram illustrating the form of the damability function. (b) Reproduction of the dataset and functions presented by Tacconi Stefanelli et al. (2016). The formation volume domain function, in the blue dashed line is defined by the lack of slides that didn't form dams above it. The non-formation volume domain function, in the red dashed line, is defined by lack of dam-formed slides below it. (c) The dam/non-dam inventory for the Oregon Coast Range (described in Sect. 3.4.1) , Known landslide dams from Struble et al. (2021) are plotted as small red dots, and the SLIDO (Franczyk et al., 2020) landslide subset in dark blue squares (very likely no dam), dark red squares (very likely dam) and light blue squares and light purple squares for slides with less certainty. Functions plotted in (b) are plotted again in (c).
Our methods require the input of data from a DEM, a general landslide inventory, a landslide dam/non-dam inventory (an inventory of landslides that intersect river valleys that states whether or not the landslide formed a dam), and a landslide susceptibility map (Fig. 2). We used a Lidar DEM from Oregon Department of Geology and Mineral Industries (DOGAMI) Lidar Program Data. The SLIDO landslide inventory records mapped landslide deposit polygons within select study areas throughout Oregon (Franczyk et al., 2020). We used all mapped landslides in our study area following the “Special Paper 42” (Burns and Madin, 2009) mapping protocols (n > 19 000) to estimate landslide volume. The landslide dam inventory of Struble et al. (2021) records points where landslide deposits have dammed or currently dam rivers. We generated a new landslide dam/non-dam inventory by incorporating remapped landslide deposits corresponding to the Struble et al. (2021) points and by assessing a random selection of the SLIDO landslide polygons. We then incorporated the Oregon State-wide landslide susceptibility map, which was generated primarily using the SLIDO landslide inventory, DEM data, and geologic data (Burns et al., 2016).
3.1 Damability function background
Landslide dam formation is a complex process that inherits all the geologic, and environmental uncertainties of landslide initiation and runout, as well as the discharge, erosive power, and channel size or location uncertainties of river valleys. It is difficult to know which hillslopes will fail in landslides, how large the landslides will be, and if the rivers will quickly transport the sediment or become (at least temporarily) impounded. We opt to use a MOI based damability function approach to balance simplicity, predictability, and data availability. Several other metrics require estimates of landslide velocity, which is difficult to measure for a known landslide, and even more difficult to estimate for an ancient or future landslide (Dal Sasso et al., 2014; Ermini and Casagli, 2003; Fan et al., 2020). The methodology of McMeckin (2022), uses a regional proxy for landslide size which does not hold in our study area (Sect. 4.1). The global scale landslide dam formation susceptibility evaluation of Wu et al. (2024) bypasses landslide velocity or size. However, it relies on global river datasets that do not include rivers with sufficiently small drainage areas to capture and calibrate with mapped landslide dams in the OCR.
Damability functions require only landslide volume and valley width, simplifying physically derived equations and complexity to two easily modeled terms that can be estimated and measured at landscape scales. Damability functions were introduced by Tacconi Stefanelli et al. (2016) using a large historical dataset including dam forming and dam non-forming landslides from throughout Italy (Tacconi Stefanelli et al., 2015).
They plotted their landslide dam/non-dam inventory in bi-logarithmic volume (m3) and valley width (m) space on a plot we refer to as the volume-valley width plot (Fig. 3), then manually placed two functions on the plot to separate landslides into three domains (the formation, non-formation, and uncertain domains), which they named Formation Volume and Non-Formation Volume equations (Fig. 3b). These damability functions define landslide volume (V) as a function of valley width (WV) raised to a power, expressing how large a landslide needs to be to dam a river of a given valley width (Fig. 3b and c red and blue dashed lines, respectively). This approach can make analysis of landslide dam likelihoods difficult to present in map view, requiring maps based on both the minimum volume above which a dam is possible to form and the maximum volume above which a dam is unlikely to form, and does not provide any additional uncertainty values other than a domain position. To reflect the uncertainty of landslide dam formation for all volume-valley width pairs in a landscape, we instead define a single damability function surface as a logistic function. For all combinations of volume and valley width, damability is a continuous estimate from 0–1 (grey shading in Fig. 3a) reflecting the scatter in the empirical data of a specific region. For binary classification of landslide dam formation or not, a single threshold can be adopted (e.g., a damability function at 0.5 likelihood in Fig. 3a).
3.2 Automated valley width measurement
Several algorithms have been used to calculate river valley width, including landform mapping (Tacconi Stefanelli et al., 2020), topographic position index mapping (McMeckin, 2022), curvature wavelengths (Hilley et al., 2020), and threshold slope and elevation approaches (Clubb et al., 2022). A threshold approach involving the elevation of valley walls above the river has the most physical connection to the pooling of water from river-flow impoundment. We implemented a novel threshold-elevation based approach to calculate valley width using TopoToolbox functions (Schwanghart and Scherler, 2014), which we outline in Fig. 4. The advantages of our approach when compared to other methods include: repeatability in the TopoToolbox coding infrastructure (rather than difficult to automate GIS workflows), simplicity of the geometric calculations with no required complex landform classification, and the ease of use in comparison to Python based codes available (e.g., Clubb et al., 2022).
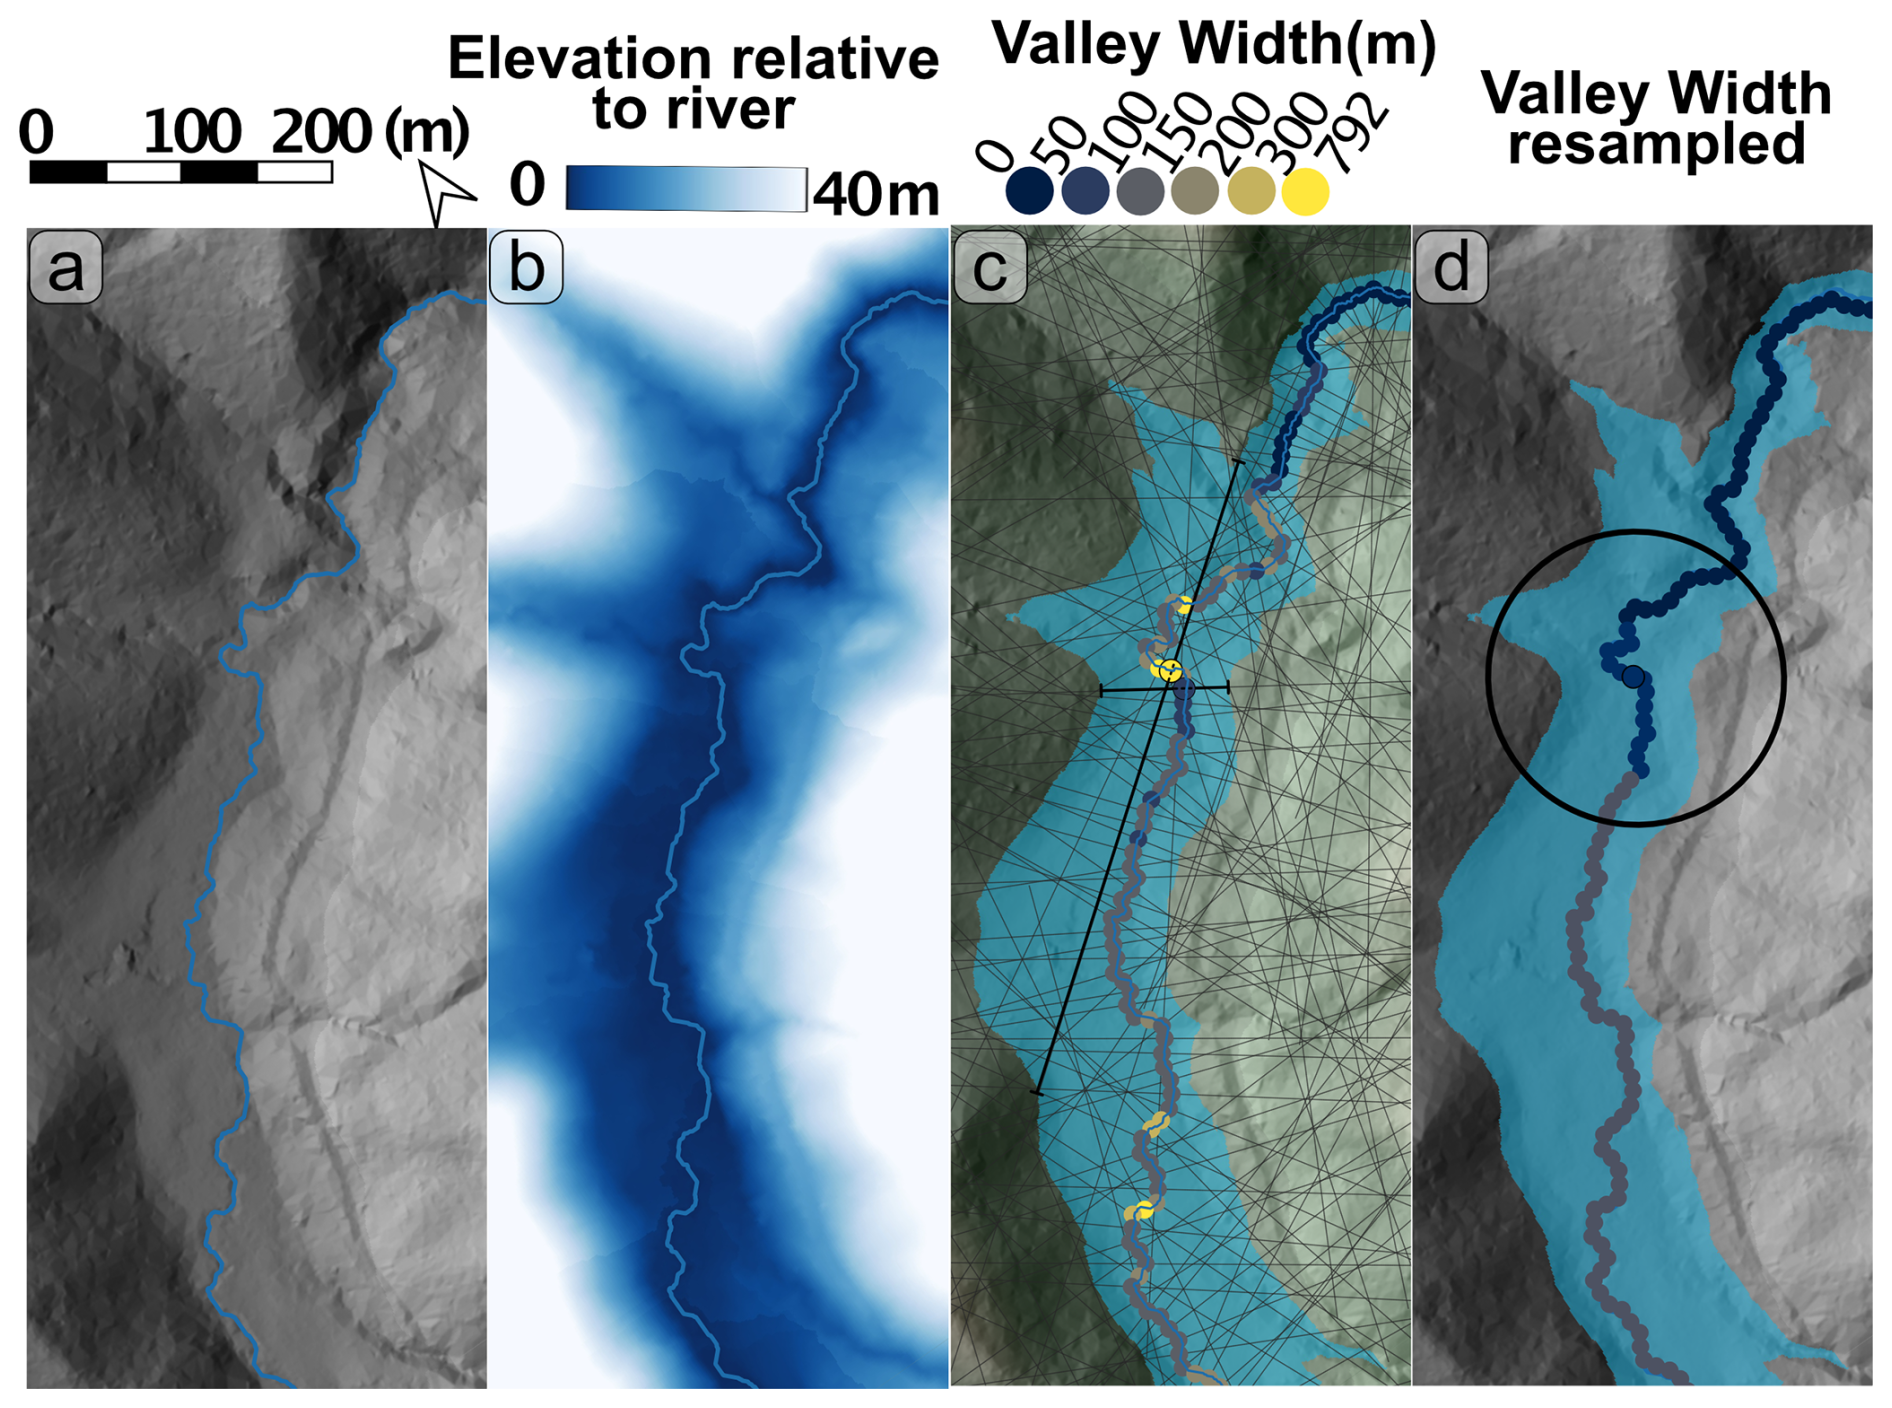
Figure 4Overview of valley width methods. (a) hillshade of a sample valley, with the extracted river plotted, (b) white to blue colour scale representing elevation above the river, along a flow path, (c) valley extraction plotted as a blue polygon, light grey lines represent profile lines perpendicular to the river path, and river points are coloured by how much of their profile line lies in the valley. Two black profile lines and outlined river points, illustrate anomalously high values where the river path is perpendicular to the valley, and accurate low values where the river is parallel to the valley. (d) final valley width result, which is the minimum value within a 100 m radius moving window, the size of which is plotted as a black circle and the same colour scale as (c).
Our workflow starts with identifying rivers using a flow routing algorithm imposed on a lidar DEM of the study area which is publicly available from the Oregon Department of Geological and Mineral Industries. We down sampled the DEM to 2 m resolution (from the original ∼ 1 m resolution) for computational feasibility in this study, however the valley width algorithm performs well on DEMs with resolutions from 1 to 10 m. We demarcated rivers based on a minimum drainage area cutoff of 2.25 km2, which balances computational feasibility while capturing the prominent drainage area positions of the mapped landslide dams in the study area (Struble et al., 2021).
Our algorithm categorizes (ElevationThresholdValleyWidth, Morgan, 2026) a pixel as part of the valley if its elevation is less than a defined threshold elevation above the nearest river pixel along a flow path. Profiles are taken perpendicular to the river (Using TopoToolbox's swath profile extraction) to measure the distance that is within the valley. When the river does not flow parallel to the valley centerline, this results in profiles that record widths that are too large, but when the river flows parallel to the valley, the recorded width will be correct and the minimum possible recorded width. Our algorithm captures the minimum value along a moving window (100 m radius in this study) that exceeds rivers meander wavelength, which is generally < 150 m. While the elevation threshold choice alters the magnitude of the valley width measurements, it does not affect the relative spatial distributions (Fig. S1 in the Supplement). A threshold elevation of 10 m was found to match valley widths previously hand measured in a catchment within the study area (May et al., 2013) (Fig. S2). Using this approach, valley width measurements were extracted from the river network every 100 m for input into the landslide dam susceptibility analysis.
3.3 Landslide Volume Modeling
3.3.1 Estimates of landslide volume
The size of future landslides can be estimated numerically based on physically derived simulations of slope failure on the terrain (Bellugi et al., 2021), or empirically by using existing volume or area distributions from landslide inventories (Lombardo et al., 2021). We developed an empirical volume distribution for mapped landslides that we then used to estimate landslide dam formation likelihood. We opted for the empirical approach because (1) it is computationally expensive to simulate a landslide on every slope in our study area and (2) an empirical approach may be more likely to account for the wide range of possible landslide sizes observed in our study area. Whereas power law scaling (Tebbens, 2020) and similar alternative functions (Stark and Hovius, 2001) have been used to characterize landslide size distributions in the past, we choose a log-normal distribution. Medwedeff et al. (2020) demonstrated that log-normal probability distributions can adequately fit landslide size inventories, and that they capture absolute characteristic landslide sizes, while power laws only capture relative frequencies. The same power law (excluding cutoff size) could be fit to a set of landslides all under 10 m3 in volume, as well as the 106 m3 landslides in our inventory as long as the relative frequencies matched up. Log-normal functions are also advantageous for working with other statistical models that might require size estimates (Bryce et al., 2022; Lombardo et al., 2021; Moreno et al., 2022).
We treated landslide volume estimation as a constant single statistical distribution across the study. We used the normal distribution of the log (base 10) of the landslide volume distribution captured from the SLIDO inventory (Fig. 5). The distribution was fit using MATLAB's normfit function and has a mean (μ) of 4.44 (∼ log(28 000 m3)) and standard deviation (σ) of 1.25. The volumes are estimated by the mapper following the “Special Paper 42” landslide mapping protocols, (96 % of inventory has volumes) where the mapper estimates or measures the slide depth and multiplies that by the slide area (Burns and Madin, 2009). A comparison of the log-normal fit and data distribution is visible in Fig. 5.
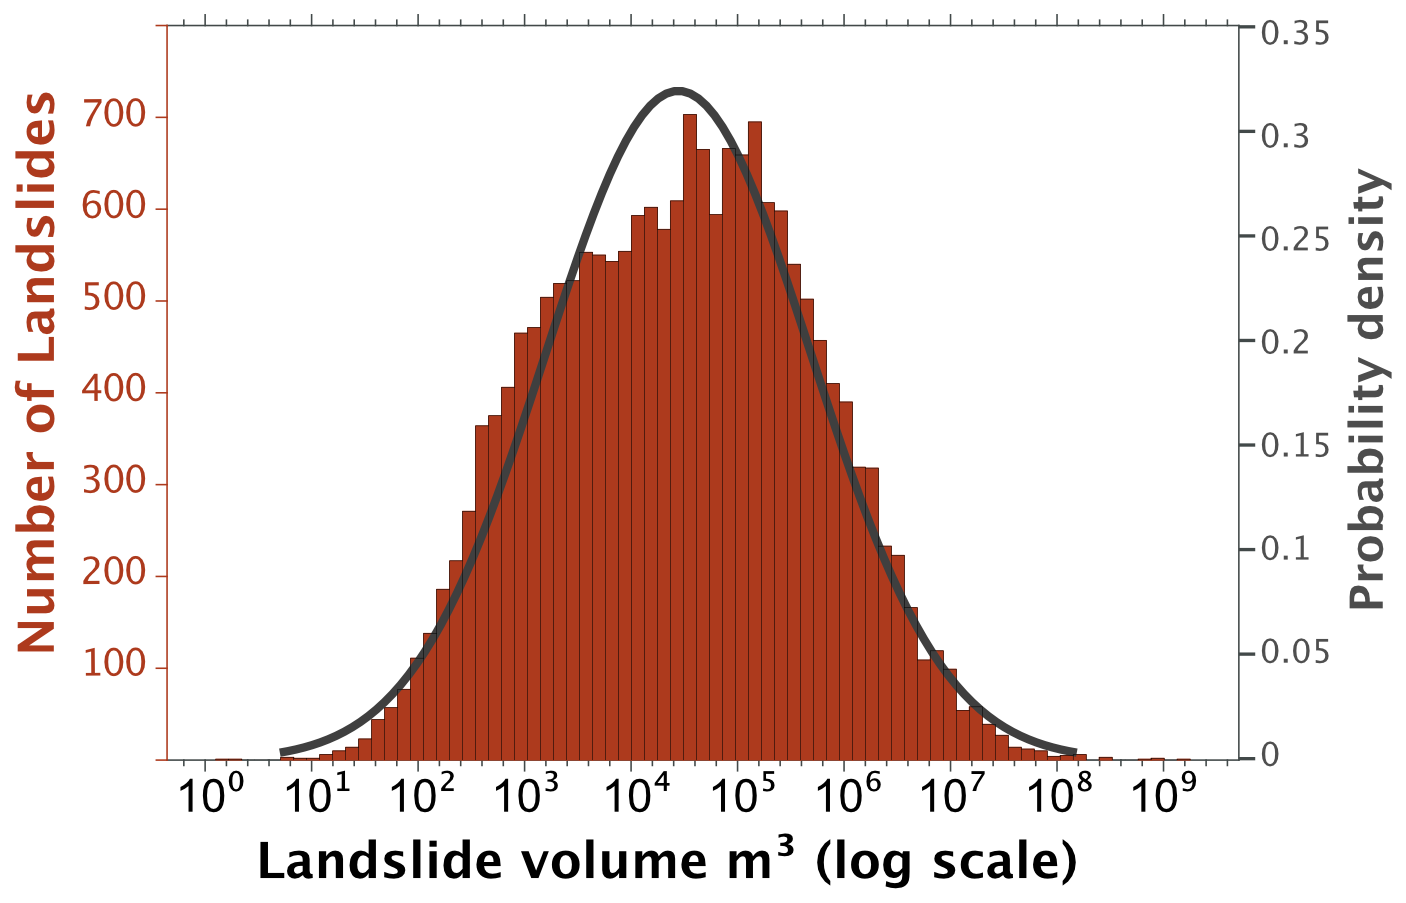
Figure 5Histogram of the base 10 logarithm of landslide volumes from the SLIDO landslide inventory (Franczyk et al., 2020). The log-normal fit probability density function is plotted in grey.
3.3.2 Spatially variable estimation of landslide volume (not implemented in final workflow)
The characteristic size of landslides may not be constant across the OCR. Variations in local lithology and structure may impact the style or size of landsliding (LaHusen and Grant, 2024). With these concerns in mind, we attempted to make location/hillslope specific landslide volume predictions using statistical regressions. A few studies have demonstrated probabilistically that landslide deposit area may depend on local topographic morphology (Lombardo et al., 2021; Moreno et al., 2022; Qiu et al., 2018). Lombardo et al. (2021) and Moreno et al. (2022) implemented versions of a generalized additive model (GAM) to predict the maximum landslide surface area within a given slope unit using a set of predictor variables including: relief, slope, roughness, and earthquake shaking. Both studies trained the models with data from earthquake triggered landslide inventories and determined that their data-driven statistical modelling approaches are moderately effective at predicting landslide volumes. To consider if such relationships hold for the OCR, we used several methods to create a statistical model using local landscape parameters to estimate local landslide volume. We chose predictors shown to work in previous studies (Lombardo et al. 2021; Moreno et al. 2022), which included: relative relief, slope (mean and range), profile curvature (mean and range), vector ruggedness measure (mean and range) (Sappington et al., 2007), terrain ruggedness index (mean and range) (Riley et al., 1999), and geologic rock type. We extracted these variables using both a 500 m radius moving window, which is large enough to span from most rivers to hilltops in the study area, and slope unit delineations following the input parameters of Moreno et al. (2022) and the algorithm of Alvioli et al. (2016). We trained statistical models with volumes recorded from an 80 % training dataset of the SLIDO inventory. The regression models include general linear models (GLM) using linear and quadratic n=4 functions for each predictor variable, to provide a simple and more complex but interpretable results and generalized additive models (GAM).
3.4 Region specific damability function fitting
3.4.1 Function calibration data development
To identify a region specific damability function that can be used within the OCR, we populated the volume-valley width plot (Fig. 3c) with local landslides that both formed and did not form landslide dams. We used an inventory of 239 landslide dams within the OCR from Struble et al. (2021) as our positive dataset of landslide dams. Identifying landslides that entered river valleys but did not form dams is less straightforward to assess without a long historical landslide dam inventory. To develop a set of null, or non-damming slides, we analyzed 100 landslides from a subset of the SLIDO inventory: 50 randomly sampled landslides and the 50 landslides with the largest surface area. None of these landslides currently dam rivers, so we assessed them for evidence of past dam formation. Signs of past dam formation include: an arcuate toe that extends well into river valley or is cut off before reaching other side of the valley, an inner gorge where the landslide intersects the river, and evidence of aggradation upstream of possible dam location (Struble et al., 2021). Assessing past landslide dam formation is subjective, thus we categorized each landslide deposit with a four part (A–D) Past Dam Formation Assessment (PDFA) class, where a PDFA-class A landslide very likely did not form a dam, a PDFA-class D landslide very likely did form a dam, and PDFA-class B and PDFA-class C represent intermediate points where the inference of past dam formation is uncertain (Fig. S3). For each landslide used in the calibration, we remapped the surface area expression of the landslide, converted the area to volume using the area-volume scaling relationship of Larsen et al. (2010) for bedrock landslides, and manually mapped the valley width downstream of the landslide.
3.4.2 Dam formation domain model fitting
We modeled the likelihood of dam formation from observed dam and non-dam forming landslides as a modified logistic function (Eq. 2) using a modified version of MOI, as the predictor variable. Equation (2) is the generalized form of the damability function. During model development, we found improved fit if we modified MOI as :
where k, X0, and a are fitted parameters related to curve steepness, the expected midpoint value, and scaling factor between valley width and volume, respectively. Predicted values of damability range from zero to one, reflecting the likelihood that a given combination of landslide volume and valley width would form a landslide dam. Log base 10 transformed values of valley width and landslide volume were used to better model landslides and landscapes over several orders of magnitude in scale with a consistent relationship. The damability function was fit using nonlinear least squares regression using the SciPy curve_fit regression tools for Python (Virtanen et al., 2020). When fitting the damability function, PDFA-class D landslides were assigned damability values of 1, class A were assigned zero, and the intermediate classes C and B were assigned 0.66 and 0.33, respectively. During model development, we considered alternative combinations of landslide volume and valley width to solve for a logistic damability function. While alternative models (e.g., linear combinations of volume and width) perform similarly to our preferred model (Eq. 2), we selected this model for both its good performance and to build on previous work where MOI has been found to be a reliable estimator of landslide dam formation.
Once the local fitting parameters in Eq. (2) are found we can use it to estimate local damability. In this study we can measure local valley widths but must use a log-normal distribution for volume. So, for each valley width we integrated all the expected damability values across the entire lognormal distribution of possible volume values. This resulted in an equation for local Damability values only as a function of valley width which we call Dam Formation Likelihood that incorporates the full form of the locally fit Damability function and the landslide volume characterization.
3.5 Dam susceptibility, and dam lake volumes
To make our estimates of damability more useful to understand local hazard and risk, we incorporated estimates of landslide susceptibility to produce estimates of landslide dam susceptibility, and we estimated potential landslide dam lake volumes for all potential dams. Landslide dam susceptibility was computed as the product of damability and a landslide susceptibility value (or LSSval) transformed from the categorical statewide map of landslide susceptibility (Burns et al., 2016).
The statewide map breaks down susceptibility into 4 categories: “low” (1), “moderate” (2), “high” (3), and “very high” (4), where the category is determined by landslide inventory analysis, geology, and slope; except for the “very high” category, which is determined by the location of mapped landslides. For our analysis we assign these qualitative classes values (LSSval) of 1 for “high” and “very high” areas, 0.5 for “moderate” areas, and 0.25 for “low” areas. This quantification was chosen conservatively to reflect that landslides still occur in the low and moderate zones. In a validation test with a historical landslide inventory (Burns et al., 2016), 65 % of landslides were in “high” areas, 16 % in “moderate” and 5 % in “low”. Landslide dam susceptibility values range from 0 to 1.
To estimate the possible lake volume arising from a future landslide dam at each river point, we used a scaling relationship developed by Argentin et al. (2021) through simulated landslides on alpine rivers. This proxy relationship calculated from only landslide volume and river drainage area was found to account for 60 % of the variation in modelled lake volumes (Eq. 7 in Argentin et al., 2021). At each river point we input the measured drainage area and a landslide volume corresponding to the minimum volume needed to likely dam a river of that width. The minimum dam forming landslide volume is calculated as the landslide volume where the damability value is 0.5 (V50 – Eq. 3). At present, we are limited to this relationship developed on Alpine rivers, though we welcome future studies extending the fit of such lake size proxy relationships across various landscape types.
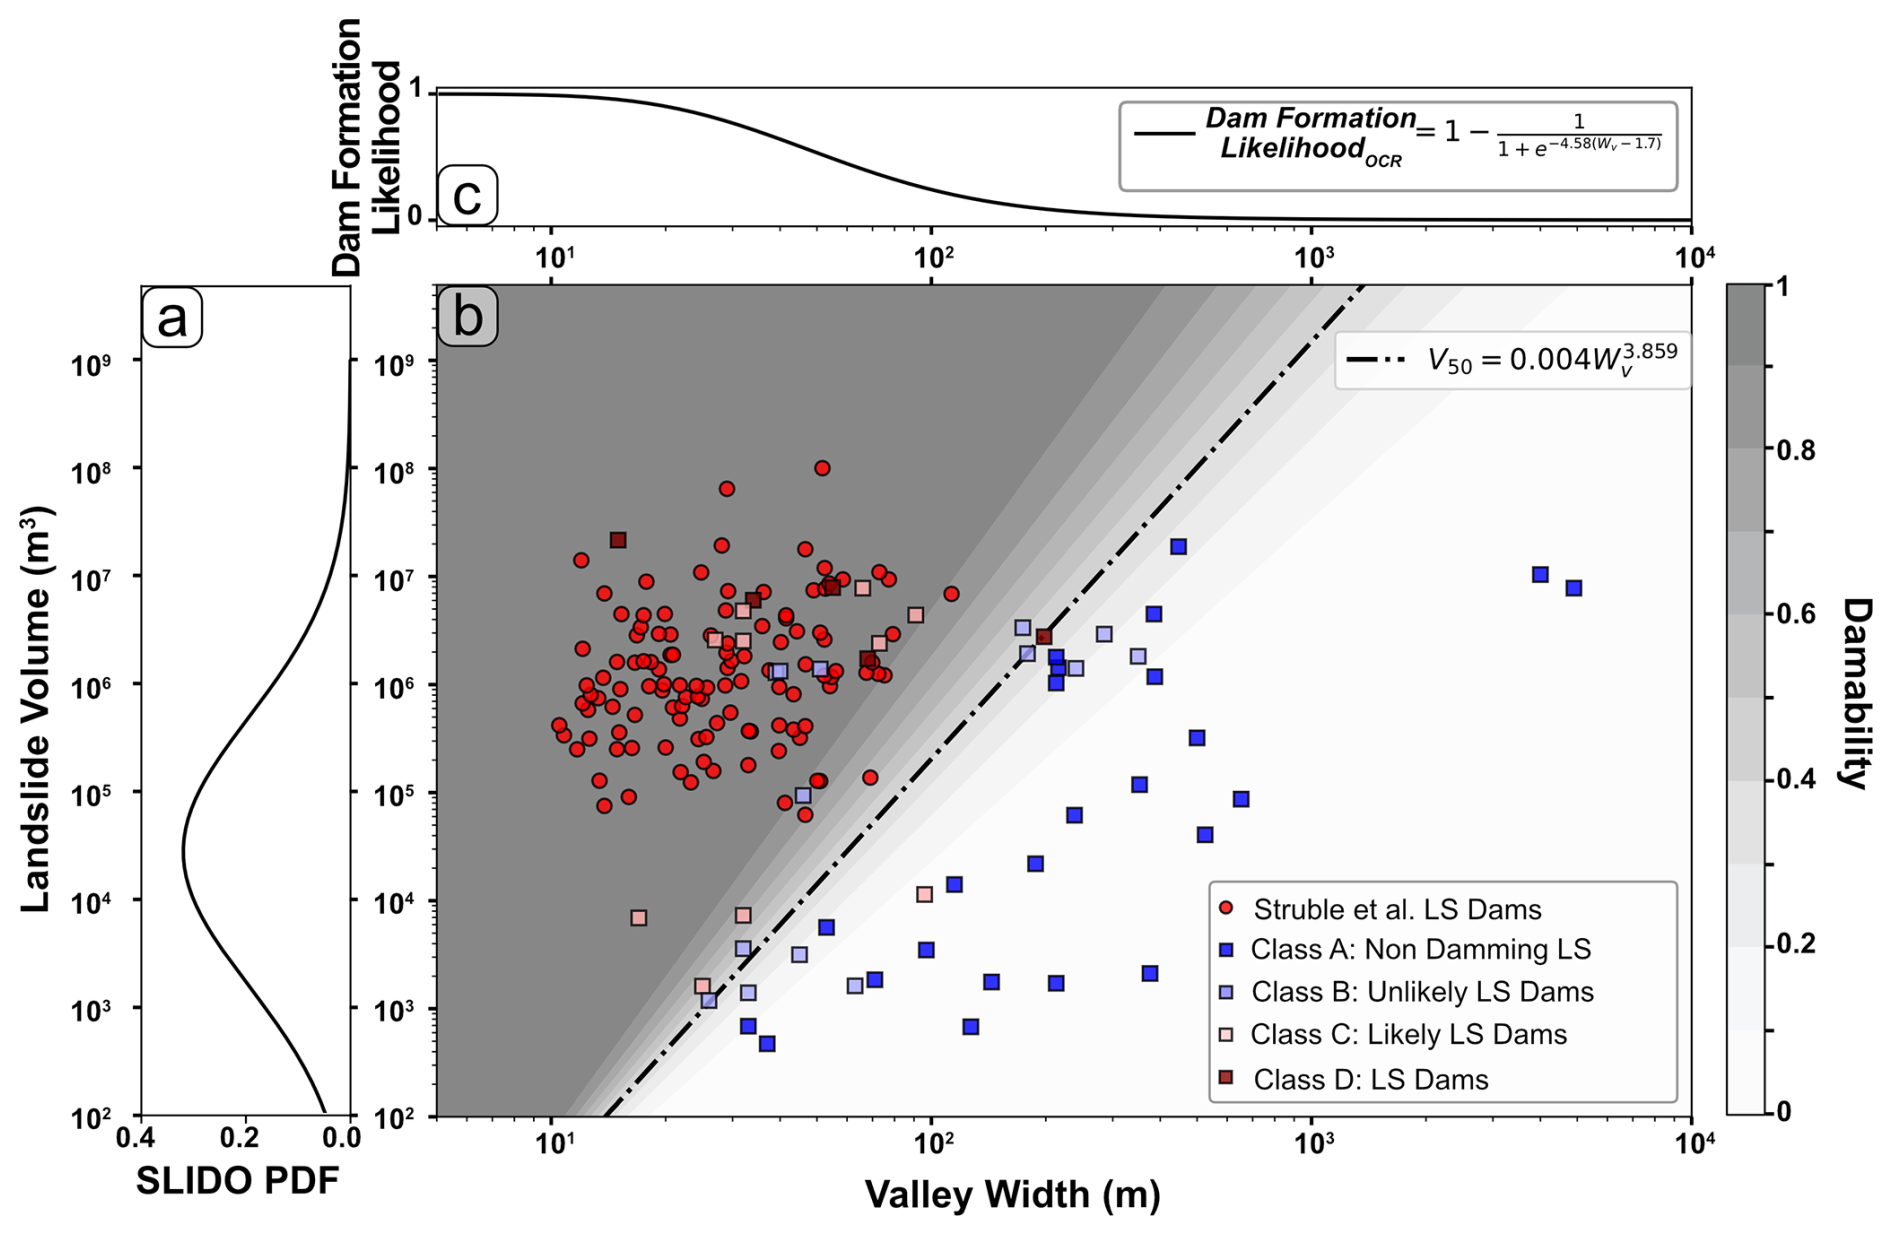
Figure 6Landslide damability functions. (a) distribution of landslide volumes in the Oregon Coast Range. (b) The same data as plotted in Fig. 3c shading from grey to white shows the likelihood of a width-volume pair being in the formation domain. (c) Integrated Dam Formation Likelihood values as a function of valley width that incorporates uncertainty in future landslide volume and the Damability function.
4.1 Landslide volume characterization
Figure 5 presents the normal fit to the log (base 10) transformed volumes from the > 19 000 landslides in the SLIDO inventory (referred to hereafter as a lognormal). The goodness of fit was evaluated using a Kolmogorov–Smirnov with a K-S statistic of 0.03 indicating a good approximation. We use this distribution as an input for landslide volume estimates across the study area where we calculate damability.
We use the same volume distribution across the study area because the location specific estimates are unsuccessful. Figures S4 and S5 show our best fitting model predictions for landslide volume based on location properties (e.g., relief, slope, roughness, and lithology) compared to measured landslide volumes. In a successful statistical prediction, we would expect the points to extend along the 1:1 line without systematic errors. Instead, we find that predicted volume values are significantly different than observed volumes (Figs. S4 and S5). Model result errors are presented in Table S1 in the Supplement. Based on these results for the SLIDO inventory, we are unable to justify using these statistical regression techniques to predict local landslide volume based on local hillslope properties in this case.
4.2 Damability function for the Oregon Coast Range
Through our logistic regression modelling, we solved for the damability function fit to the landslide dam/non-dam inventory for the Oregon Coast Range (DamabilityOCR). The function is visible as shading in Fig. 6, and in the form of Eq. (2).
where V is the landslide volume in m3, and WV is the valley width in m (all logarithms are base 10). Probabilities of dam formation given valley width and landslide volume are shown as gradational shades of grey from < 10 % to > 90 % likelihood in Fig. 6.
To solve for the minimum landslide volume needed to dam a given valley width, we use the 50 % likelihood contour of the damability function, which can be expressed as a function of valley width as:
V50 is also referred to as the minimum dam forming landslide volume because it matches the volume of slide, above which dams will most likely obstruct the valley.
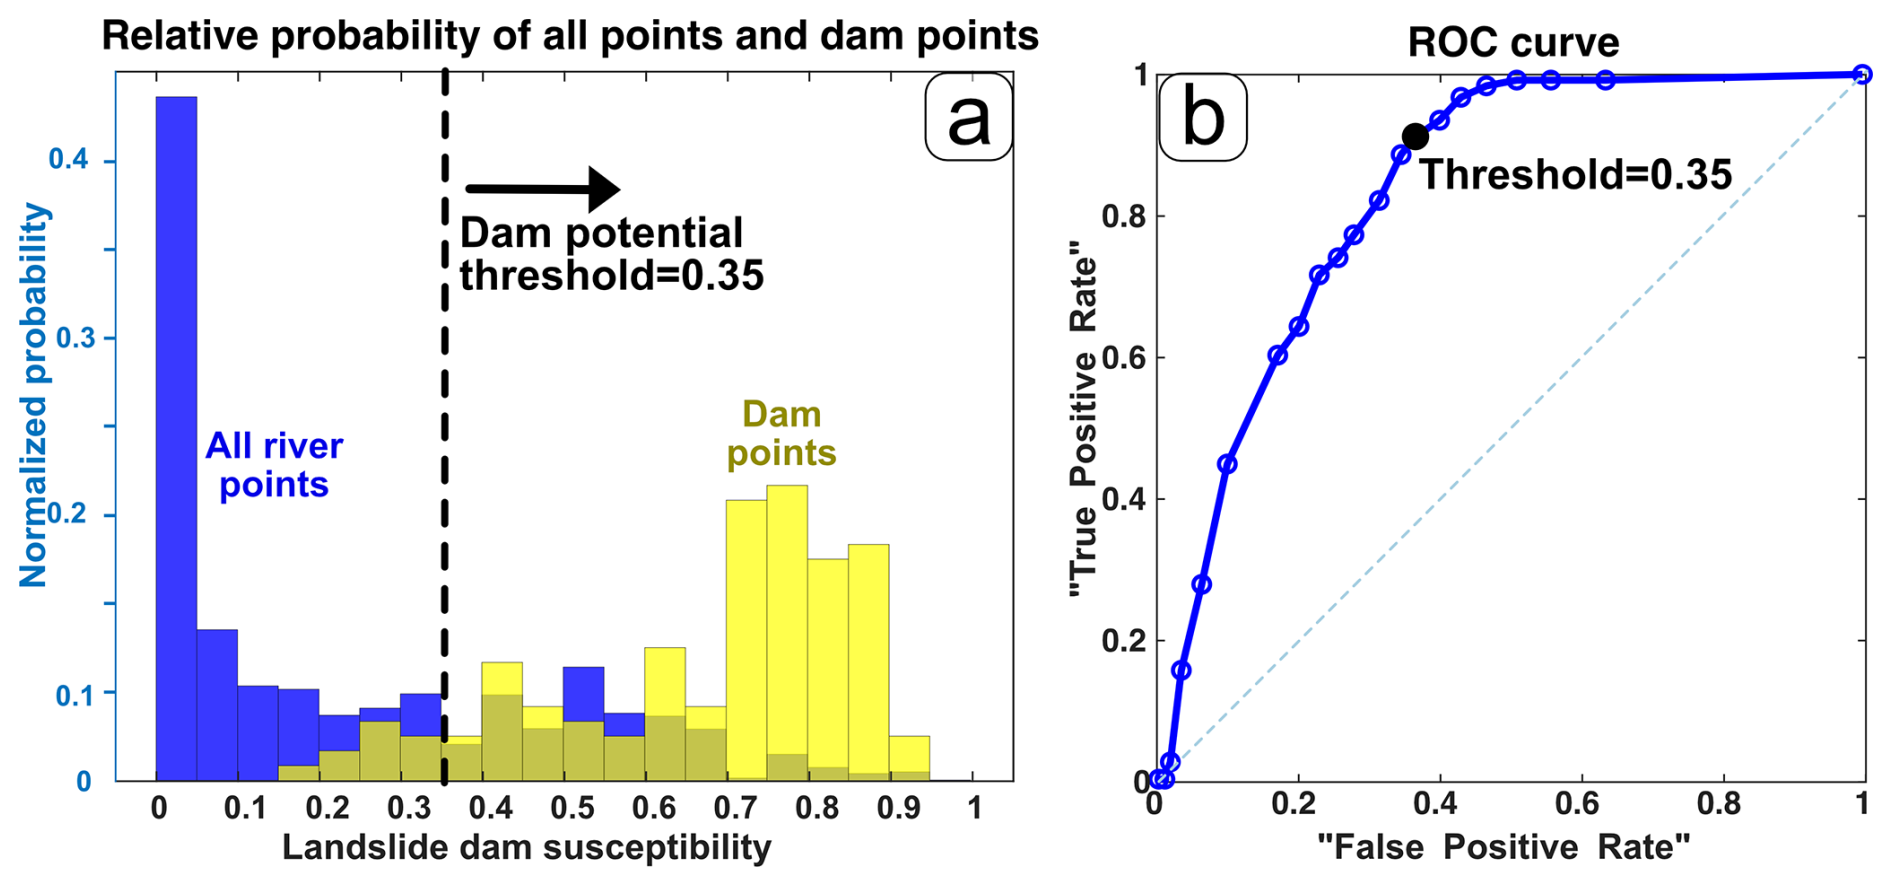
Figure 7(a) Normalized histogram of landslide dam susceptibility values for all river points (blue), and points closest to mapped dams (yellow). (b) Receiver Operating Characteristic (ROC) curve for landslide dam susceptibility values comparing river stretches with mapped landslide dams and all river stretches.
4.2.1 Landslide dam formation likelihood
To estimate the potential for future landslide dam formation given some unknown landslide volume and uncertainty in the damability function, we combine valley width measurements, the empirical distribution of landslide volumes (Sect. 4.1), and Eq. (4). For all valley widths, landslide Dam Formation Likelihood (Fig. 6c) was computed as the sum of expected damability (Fig. 6b) for the entire lognormal distribution of expected landslide volumes (Fig. 6a). For ease of use, we then fit the landslide dam formation likelihood values as a function of valley width as:
where only valley width (WV, m) is a required input.
Landslide Dam Formation Likelihood values computed using Eq. (6) range from zero to one, and reflect the likelihood a landslide forms a dam in a valley of a certain width, given the distribution of landslide volumes observed in the OCR and the uncertainty in the damability function. Dam Formation Likelihood values can be interchanged with damability values, for example in Eq. (3), and for brevity we interchange these terms when referring to our results for the OCR. For local studies where the expected distribution of landslide volumes is different, or case studies of known volumes, this integration of volume and damability could be repeated to reduce the uncertainty in predicted dam formation likelihood for known valley widths.
4.2.2 Validation
We used the dams mapped by Struble et al. (2021) (shown as yellow dots in Fig. 1) to explore the validity of this method. River stretches with mapped landslide dams have much larger damability and dam susceptibility values than the general population of all river stretches in the study area (Fig. 7a). Most of the previously mapped landslide dams lie on river stretches with dam susceptibility values greater than 0.5 (78 % of landslide dams, vs 28 % of all river points) (Fig. 7a). We acknowledge that this line of model validation is somewhat circular, as the dams were used to calibrate the damability function that sets the dam susceptibility values, and sometimes past dams can result in the narrowing of valleys where the river cuts through the dam deposit. We also randomly withheld 12.5 % of the dam forming and dam non-forming landslides, fit a new damability function, and checked the withheld points to the new function. The new function does not deviate significantly from the fit to all data points and fits all the withheld datapoints (Fig. S7). We also note that the damability values are calculated with algorithm-extracted valley width values rather than the map measured valley widths used in the calibration.
To further test the performance of the method and to identify a threshold to separate river stretches with high dam-formation potential, we used a Receiver Operating Characteristic (ROC) curve. ROC curves relate fractions of positive results (river points with a dam) and negative results (river points without a dam) to decision boundaries. However, we do not have many mapped river stretches without dams so we substituted the entire population as “negative results”, which we find reasonable considering that there are < 300 mapped dams compared to the 185 000 calculated river points. Though not ideal for area under the curve model verification (AUC = 0.834), this simplification is appropriate to find the threshold to separate river points with dams from all river points. We found this threshold to be 0.35 by maximizing the “true positive rate” minus the “false positive rate.” As a result, river stretches with landslide dam susceptibility values of 0.35 or greater are considered river stretches with dam potential.
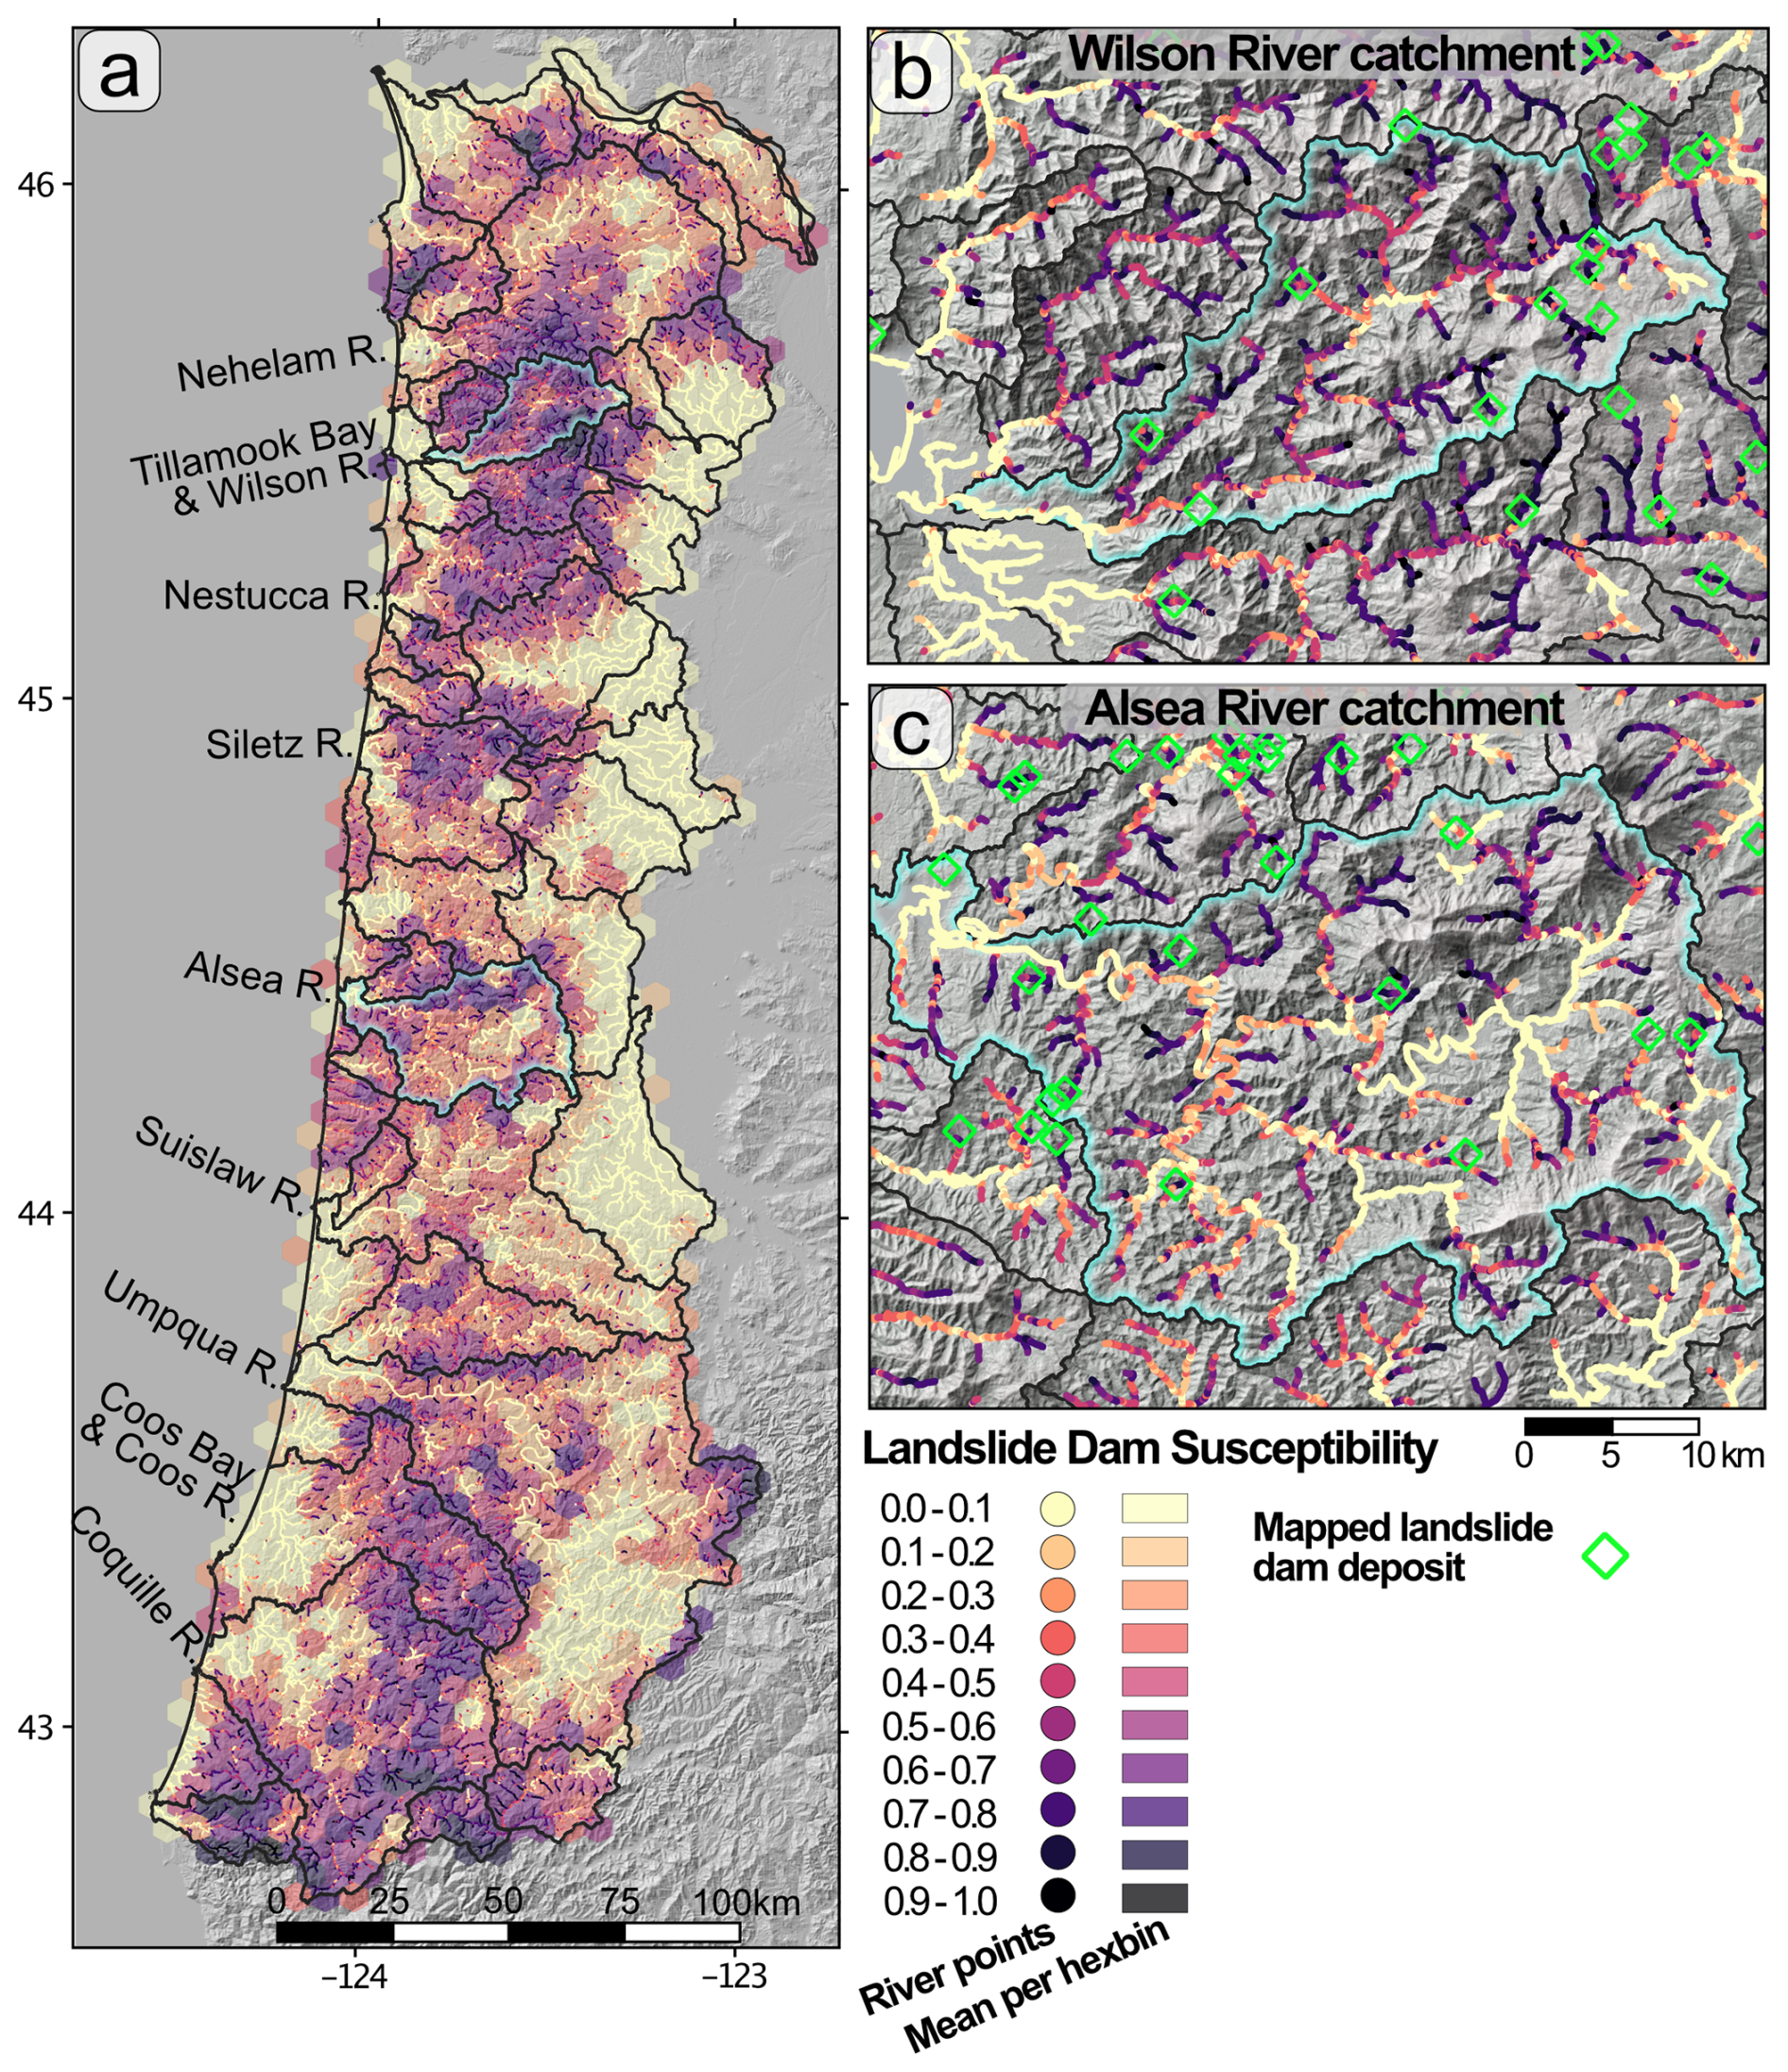
Figure 8Landslide dam susceptibility estimates for the Oregon Coast Range. (a) shown as averages over ∼ 6 km across or ∼ 30 km2 area hexagons as well as for individual 100 m long river stretches. (b) Wilson and (c) Alsea catchments. Mapped landslide dams shown as light blue diamonds.
4.3 Damability, dam susceptibility, and lake volume
Across the study area, 51 % of the calculated damability values are under 0.25, 19 % between 0.25 and 0.5, 20 % between 0.5 and 0.75 and 10 % greater than 0.75 (Fig. S6). Dam susceptibility values follow a similar distribution but are skewed lower, with 57 % less than 0.25, 15 % between 0.25 and 0.5, 18 % between 0.5 and 0.75 and 10 % greater than 0.75 (Fig. 8). 36 % of the values are greater than the 0.35 dam potential threshold identified in Sect. 4.2.2. Low values are prominent in large rivers, low elevation tributaries, and valleys draining to the east. High values are prominent in higher elevation rivers, most low drainage area tributaries, and the core of the mountainous areas (Fig. 8).
Figure 8 shows that notable large areas of higher dam potential are found in the mountains around Tillamook Bay, inland Siletz River catchment, and in the headwaters of the Coos and Coquille rivers. In general, catchments draining east have significantly lower landslide dam susceptibility values than those draining west. In addition, tributaries and more mountainous river stretches tend toward higher landslide dam susceptibility values, whereas coastal regions and the eastern edge of the study area record lower values.
To illustrate catchment scale patterns and differences in landslide dam susceptibility values across the OCR, we highlight two catchments, the Wilson and Alsea Rivers (Fig. 8b and c). These drainage basins have similar drainage areas, and both drain west, but they also represent the variation in landslide dam susceptibility values across the OCR, making them useful to compare. Within the Wilson River catchment, nearly all the tributaries contain high landslide dam susceptibility and much of the main river stems have moderate to high landslide dam susceptibility. In contrast, within the Alsea River catchment, only some of the tributaries reach high dam susceptibility, and much of the main stem has relatively low dam susceptibility.
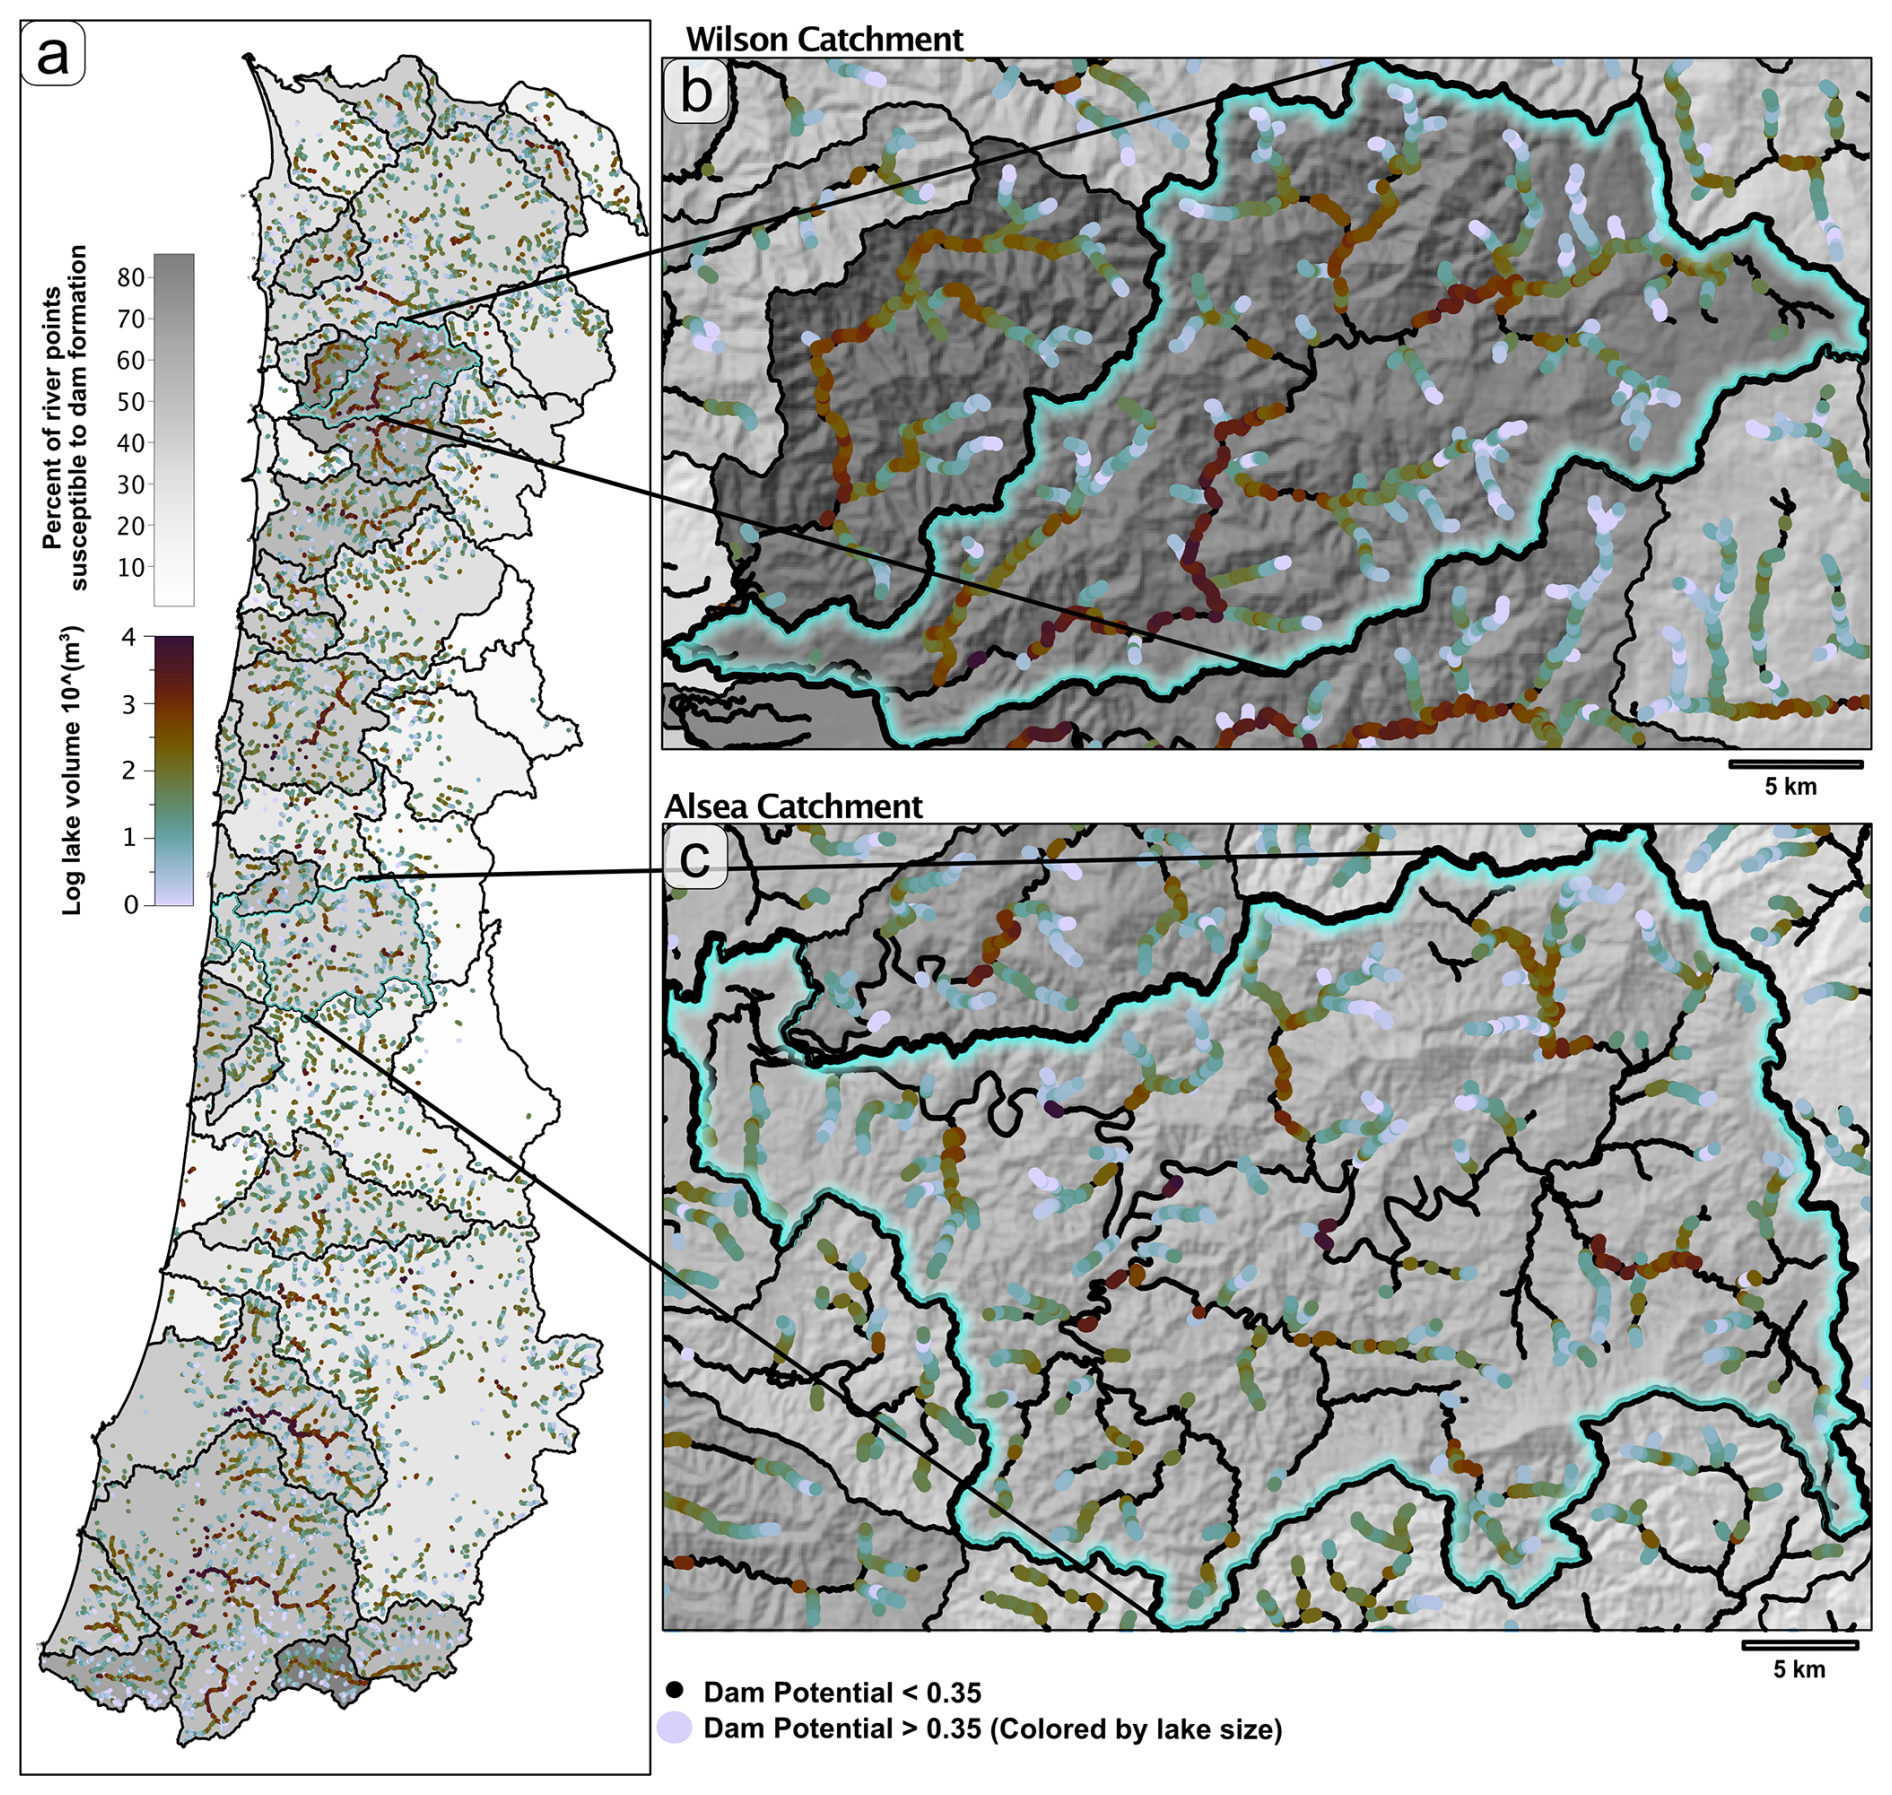
Figure 9Representation of Landslide dam potential across the study area. (a) Drainage basins are colored along a greyscale by the percent of river stretches within the basin that have dam potential values above 0.35 the dam potential threshold. Only those potential dam river points are plotted as blue scale dots where the shade of blue is represented by the estimated dam lake volume that would form at that point. (b) and (c) depict the Wilson and Alsea catchments, respectively. In insets river locations with dam potential values less than 0.3 are plotted as a black line.
Using the relationship of Argentin et al. (2021), measured drainage areas, and estimated minimum damming landslide volumes (V50) from Eq. (5), we estimated the possible impounded lake volumes at each river point. The lake volume estimates primarily correlate with river drainage area (Fig. 9). Lake volume estimates for every river point span 11 orders of magnitude, while the volume predictions at potential dam sites are significantly lower and peak at closer to 1000 m3 (Fig. 9). Within the Wilson River basin over 69 % of the river stretches are above the potential dam threshold, and much of the main stem, with higher estimated lake volumes (> 104 m3). Within the Alsea basin only 40 % of the river points are above the dam potential threshold. The Alsea River mainstem primarily does not have points above the potential dam threshold values (Fig. 9), meaning that most of the susceptible river stretches within the basin would hold relatively small lakes.
5.1 The Damability function
5.1.1 Damability function form
We present an approach to estimate landslide dam susceptibility using a logistic regression to find a probabilistic damability function. Past studies implementing damability functions, using datasets from Italy, (Tacconi Stefanelli et al., 2016), and the Cordillera Blanca in Peru (Tacconi Stefanelli et al., 2018), relied on manually placed lines separating formation, non-formation, and uncertain domains (Fig. 3b). The probabilistic approach to the damability function regression that we present here allows for a characterization of the uncertainty of dam formation. Additionally, the probabilistic approach collapses the damability result down to one dam formation likelihood value, rather than one of three domain positions, which makes adding other useful metrics (e.g,. landslide susceptibility, or estimated dam lake volume) more straightforward, and simplifies hazard visualizations.
The logistic regression methodology that defines the damability function is flexible and can be applied to any dam/non-dam landslide inventory. The damability function for the OCR used in this study is found using the new morphology-based landslide dam/non-dam inventory we generated. While we have fit the currently available inventory, new input can affect the damability function slope and uncertainty. Additional landslides, especially those corresponding to underrepresented valley widths or volumes, could alter the shape of the function (Fig. S8).
Conceptually, the form of the damability function represents how efficient a slide of a specific volume is at running out and damming a river valley. Studies have shown that, broadly, landslide runout scales as a function of landslide volume (Corominas, 1996; Pollock, 2020; Whittall et al., 2017). Pollock (2020) fit the largest dataset of landslide volumes and runout length data to find a function relating the two, which if rearranged into the form of Eq. (5) has an exponent 2.87, and coefficient of 0.0018 (dimensionless). The line representing this function in the volume-valley width plot has a slope between the Italian damability functions and the OCR damability function and is shifted towards larger lengths than both (Fig. S8). The shift towards larger lengths suggests that landslides of a given volume have a consistently larger runout length than the width of the valley that they can dam. The observation that landslide volume to runout length is broadly consistent across landscapes, suggests that new dam/non-dam landslide inventories from other regions are likely to be reasonably fit by a damability function. However, further work is needed to assess if it will be possible to move beyond the need for local calibration of regional damability functions.
In the two sites where we do have dam/non-dam inventories (Oregon and Italy) we find that distinct damability functions fit the two areas (Fig. S8). The Oregon damability function has a lower V threshold at WV=1 suggesting small slides can dam larger valley widths. However, due to the lower slope of the Italian damability function (V50 exponent is 1.67 vs 3.8 for OCR), large landslides in Italy seem to dam larger valley widths than slides with a similar volume in the OCR. We speculate that small slides in Oregon may be dominated by long runout debris flows whereas large slides are dominated by rotational failures with less of a flow style/long runout compared to large Italian slides. Alternatively, differences in damability functional forms may be related to data gaps and outliers in the calibration slides. For example, there are a couple outlying very small damming landslides in the Italian inventory (Fig. S8b) and our inventory has relatively few landslides with volumes from 105–106 m3 and valley widths from 50–120 m (Fig. 6). The width of the decision boundary (uncertain areas where damability values are between 0 and 1), may also be related to data gaps. It is narrower for low volumes and widths than larger volumes, while this is less pronounced for our fit to the Italian inventory (Fig. S8b), a similar trend exists and both inventories have few small (< 105 m3) dam forming landslides, which makes it difficult to evaluate this trend.
Local geology, geomorphology, and climate all likely indirectly control the form of the damability function. Landslide dams occur in regions with drier or wetter climates, glacial or non-glacial geomorphic histories, and minimal or extreme relief. Regional differences in damability functions should be explored through the fitting of more dam/non-dam calibration landslides.
5.1.2 Landslide volume characterization
Using a damability function for susceptibility analysis requires study-area wide measurements of valley widths and landslide volume estimates. While we did not test various methods for valley width estimation in depth (See Figs. S1 and S2), we did explore multiple methods for landslide volume estimation.
There are reasons to suspect that landslide volume is not constant across the study area. For example, some areas within the Tyee formation are dominated by small shallow landslides, are characterized by steeper more planar slopes with high drainage densities and may have narrower valley widths. Alternatively, landscapes with high densities of large deep seated landslides are characterized by scalloped hillslopes and wider (or more variable) valley widths (LaHusen and Grant, 2024). As such, the narrow valleys where damability values are high may only be exposed to small volume shallow landslides; while the wider valleys, where damability values are low, may be more likely to see large volume deep seated landslides. If so, we may be underestimating the damability for the wide valleys because they may be more likely to experience a large volume landslide than the rest of the study area.
This concern motivated our unsuccessful attempt to estimate variable characteristic landslide volumes across the landscape. We used measurable (at the regional scale) properties of the landscape to find a regression model to predict landslide volume (Figs. S4 and S5). We did not satisfactorily predict the SLIDO landslide volumes. This is in contrast to the studies of Lombardo et al. (2021) and Moreno et al. (2022), who implemented versions of a generalized additive model (GAM) to predict the maximum landslide surface areas within a given slope unit.
Methodological differences may play a role in these conflicting results (See Fig. S4), though we suspect that the input landslide inventory used as the training dataset makes the largest difference. Both Lombardo et al. (2021) and Moreno et al. (2022) used datasets from earthquake triggered landslides. Earthquake triggered landslides may have different characteristics, including failure style, than precipitation triggered landslides (Densmore and Hovius, 2000; Meunier et al., 2008). Landslides triggered by the same earthquake shaking, on the same day, have a limited spatial extent and may also exhibit similar properties on similar slope types. The SLIDO inventory includes a wide range of failure styles, includes landslides which occurred at different times by different triggers on adjacent slopes, and was mapped by several different authors.
The volume of a landslide is controlled by many factors including: the height and width of the hillslope, the area of the unstable terrain, the distribution of frictional strength parameters, the depth and shape of the failure plane, the triggering forces, and the landslide type. The complex interplay of these parameters makes estimating the volume of a possible future landslide on any given slope difficult. Slide volumes may also be controlled by hyper local properties such as the meter scale variability in cohesion or groundwater recharge (Bellugi et al., 2021; Montgomery et al., 2009). A specific hillslope in our study area could fail in a variety of ways, meaning that the landslide volume is not necessarily predictable by the variables we can measure at regional scales.
These results suggest that it is not straightforward to use hillslope properties or geometry as a proxy for landslide volume in landslide dam susceptibility analyses. McMeckin (2022) used relative relief as a proxy for landslide size and Wu et al. (2024) used delineated slope unit area as a proxy for landslide size. It is possible and intuitive that these proxies match best the largest possible landslides a hillside could produce, which may be more important than the mean landslide size for landslide dam analyses. The benefits of slide size proxies, including the potential to eliminate the need for rare, detailed landslide inventories, should motivate future research exploring controls on landslide volumes, especially in the context of landslide dam susceptibility analysis.
Instead of site-specific landslide size proxies, we are forced to use a region wide empirical approach to landslide volume estimation based on the mapped landslides within the study area. Tacconi Stefanelli et al. (2020) also used mapped landslide inventories by implementing a spatially determined power law exponent to estimate landslide volumes. However, patchy spatial coverage of the SLIDO landslide inventory, inconsistent lower volume threshold recording, and the lack of spatial coherence in landslide volumes in places where the inventory is complete make this power law-based method less applicable than the overall log-normal volume distribution. Using a single distribution works well for dam susceptibility analysis in regions where landslide inventories exist. In this study we necessarily assume that landslide volume remains unpredictable, and proceeded with susceptibility estimates controlled by valley width (Eq. 6), which we justify by the predominantly narrow valley widths at the mapped landslide dam deposits (Fig. 7a) (Struble et al., 2021).
5.1.3 Future applications
We expect that the damability function methodology – as it is currently presented – will be applicable to other regions, especially neighbouring areas of the Pacific Northwest of the US, although it will always be limited by available data sources. Valley width estimations using our algorithm are only applicable in locations with a 10 m resolution or better DEM. A detailed landslide inventory is required to characterize the landslide volume distribution. Though inventory quality and completeness vary, the use of a lognormal distribution insulates the characterization from small changes in estimated landslide volumes. A landslide dam/non-dam inventory is needed to refine the local damability function. Lastly, landslide susceptibility information is also required and often defined using a combination of landslide inventories and geomorphic measurements. These requirements show the importance of detailed landslide deposit inventory mapping and suggest that including a valley connection term and dam/non-dam value would be a helpful addition to the list of data attached to landslides in inventories. The damability approach presented here can be modified to use different methods for measuring valley width and estimating landslide volume, and it can be recalibrated with new data from other regions. Future studies may successfully employ machine learning based methodologies for any of these parts of the workflow. Large-scale regional studies will have higher uncertainty because various landscapes with different lithologies, glacial and tectonic histories, fluvial erosion patterns, and climatic controls will be included. However, more large-scale studies are necessary to quantify landslide dam hazards and can be completed using the damability function approach.
5.2 What controls regions of higher landslide dam susceptibility?
Due to the nature of our approach, relative differences of dam susceptibility values across the study area are almost entirely driven by differences in valley width. The damability function and landslide volume characterization are constant across the study area. The landslide susceptibility factors only have a small effect on spatial trends in dam susceptibility estimates, as most locations with high damability also have high landslide susceptibility.
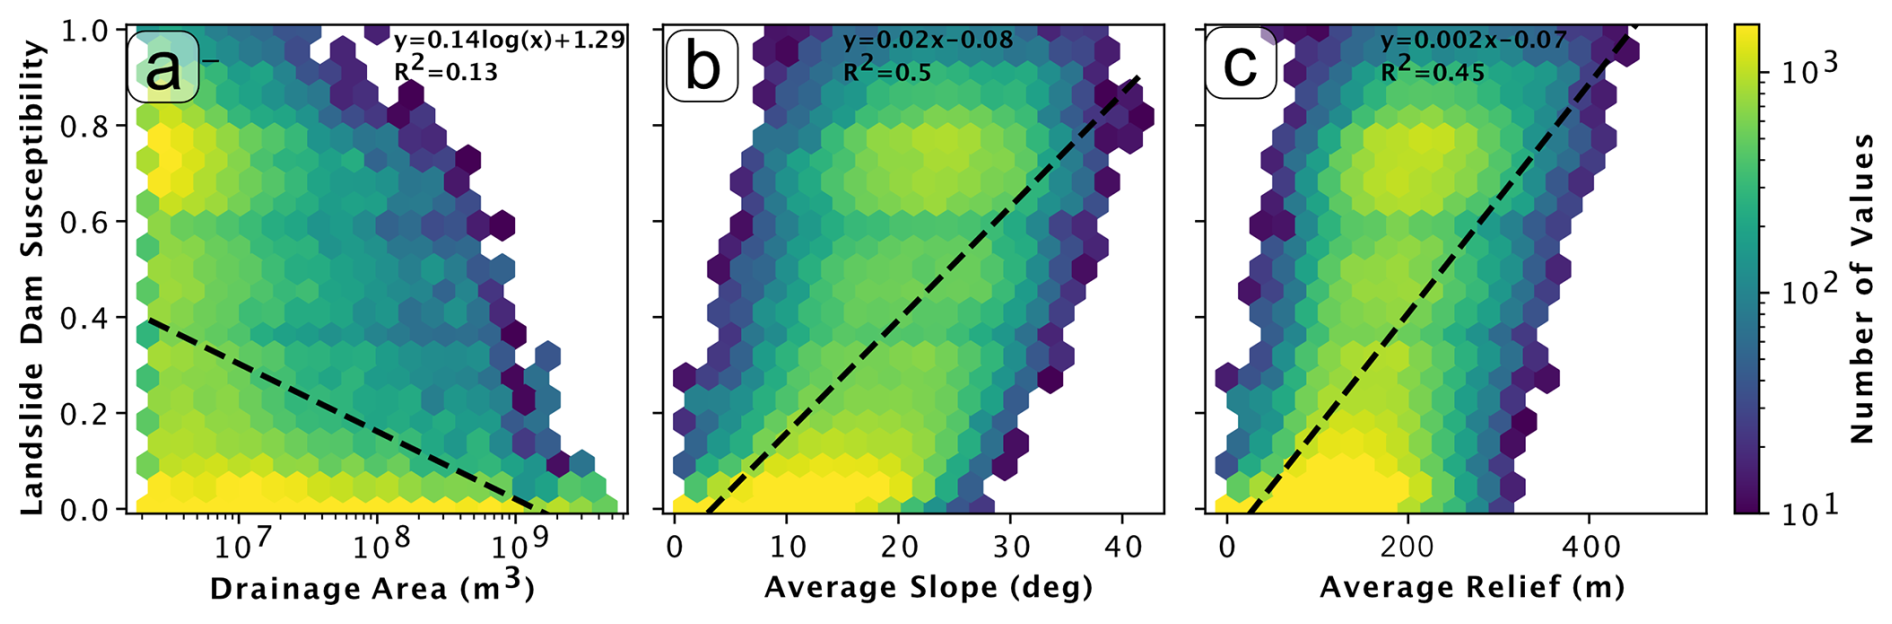
Figure 10Trends of the landslide dam susceptibility values, plotted with (a) river drainage area, (b) average slope (mean value sampled from a 500 m radius around the river point), and (c) relative relief (also mean value sampled from a 500 m radius around the river point). Colour scale for all plots represents the number of river stretches with values corresponding to the hexbin.
In general, valley width increases with increasing drainage area, which results in lower estimations of landslide dam susceptibility values at high drainage areas and at lower elevation and coastal regions (Fig. 10a). While local channel widths are modulated by contemporary fluvial properties including river slope, discharge, bank strength, and bed material (DiBiase and Whipple, 2011; Dunne and Jerolmack, 2020; Leopold and Maddock, 1953), valley widths reflect erosional and aggregational histories making them more difficult to predict (May et al., 2013). In much of the OCR, valley width is found to vary with the drainage area raised to a power (Fig. S2) (May et al., 2013). However, in drainage basins where deep seated landslide morphology is common, the valley width vs. drainage area relationship is more scattered, though the general trend persists (May et al., 2013). Across our study area, we observe that river headwaters, where drainage areas and measured valley widths are low, are more susceptible to landslide dam formation than downstream in high drainage area rivers.
Rivers that flow through more mountainous terrain have higher landslide dam susceptibility. Clear correlations are visible in the relationship between dam susceptibility values and area averaged slope and relief (Fig. 10b and c). In general, higher slope and relief correspond with river headwaters, but mainstem rivers flowing through mountains also have higher dam susceptibility values. In mountainous reaches, hillslope processes such as landsliding, valley wall armouring, and debris flow sediment input control valley width (Grant and Swanson, 1995; Shobe et al., 2021). Within the OCR, valley widths are generally depressed in basins correlated to landsliding, though it depends on the stream position relative to the landslide deposit (May et al., 2013). East of the study area, on the west side of the Oregon Cascades, mountain valley morphology was shown to be strongly controlled by bedrock exposure and hillslope and tributary processes, including landsliding (Grant and Swanson, 1995). Hillslope sediment delivery is proposed to control valley width (Tofelde et al., 2022), as found for terrace edged alluvial channels. Landsliding, bedrock exposure, and hillslope sediment supply all are expected to increase with increasing slope/relief, and possibly uplift, which may keep mountainous valleys narrower (e.g., Heimsath et al., 2012; Larsen and Montgomery, 2012; Roering et al., 1999). Indeed, the locations in the OCR where we observe the highest dam susceptibility (Fig. 8) spatially correspond with the highest uplift and erosion rates inferred from hilltop curvature (Struble et al., 2024).
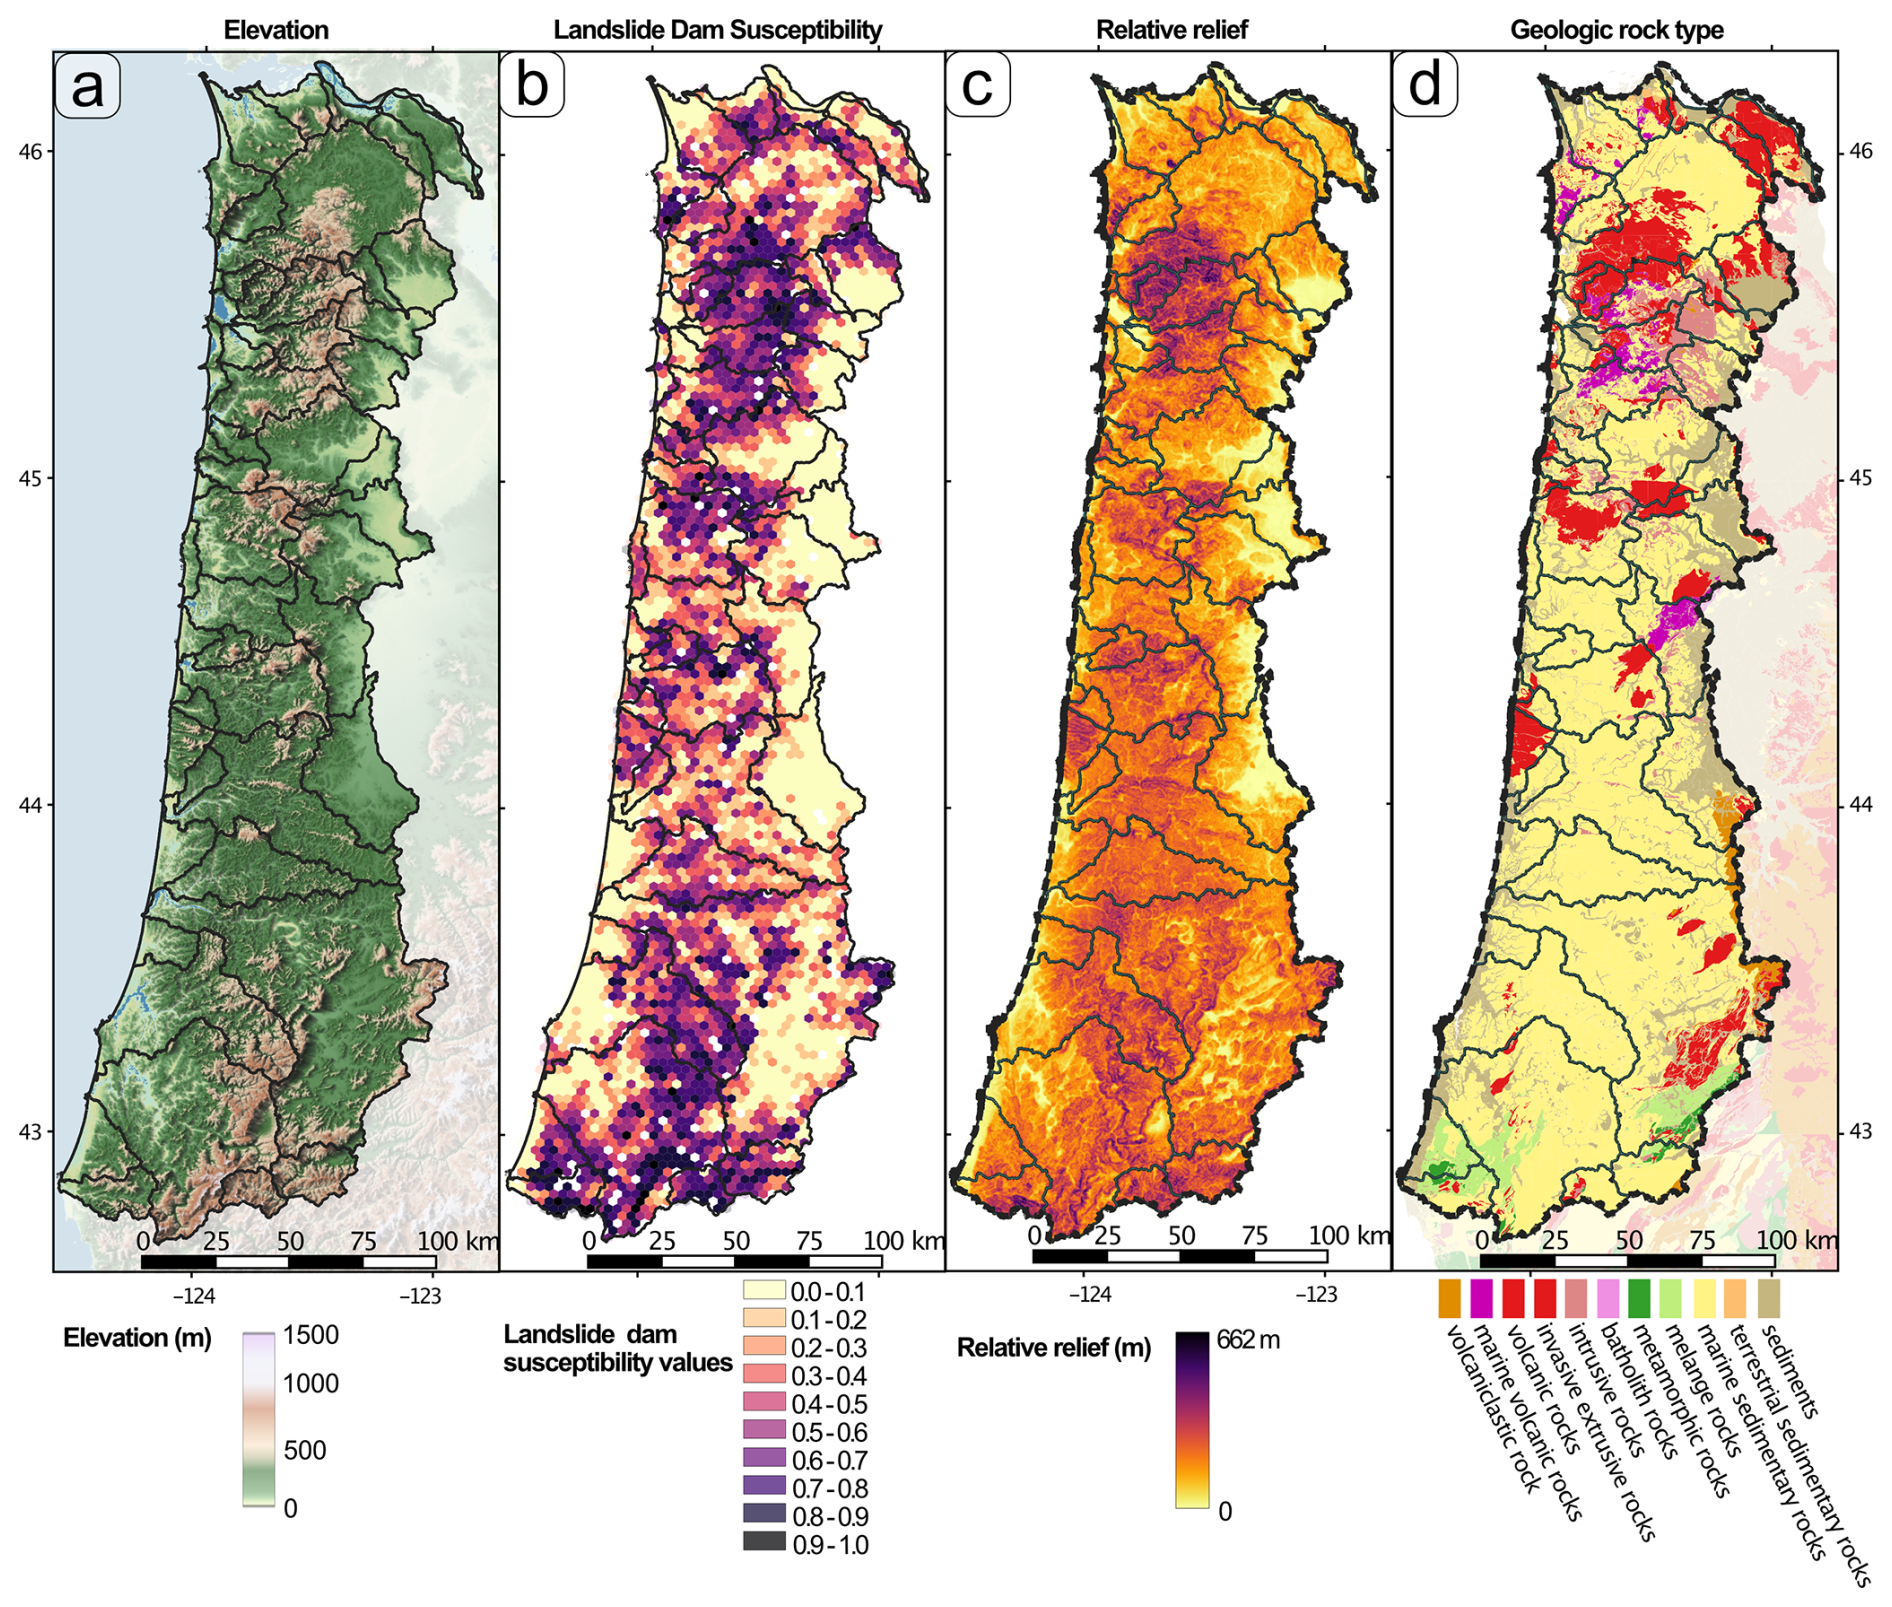
Figure 11(a) elevation, (b) dam potential, (c) relative relief, and (d) rock type for the study area presented side by side to showcase correlations. Dam potential values are averaged over each ∼ 3 km across or 7.5 km2 area diameter hex bin. Relative relief values are calculated over a 500 m moving window on the USGS arcsec (10 m) 3DEP program DEM (U.S. Geological Survey, 2023). Rock type values are from the Oregon Geologic Data Compilation (OGDC-6) by DOGAMI.
Lithology also likely plays an important role in setting landscape morphology and, consequently, dam susceptibility. Figure 11 demonstrates a correspondence between volcanic rock and higher relief (and landslide dam susceptibility) within the northern section of the study area. This is most notably exemplified by the Tillamook Volcanics around the Wilson River basin when compared to neighbouring landscapes in marine sedimentary rocks. The high relief areas in the south of the study area do not always visually correlate with a distinct rock type, since both high and low relief regions lie in marine sedimentary rocks, though inter-rock type variations in grain size and possibly erodibility may control landsliding and relief (LaHusen and Grant, 2024). This is consistent with the findings of Schanz and Montgomery (2016) who compared basins just north of the OCR dominated by igneous bedrock, with the areas of the Nehelam river (Northern OCR Fig. 8) dominated by friable sedimentary rock. They found valley widths to be 2–3 times wider in the sedimentary basins and proposed that this was due to the ease of lateral erosion in those easily weathered rock types. In other regions rock type has not been identified as a primary control on valley width, for example, in the Himalaya uplift rate was found to be the largest control on valley width (Clubb et al., 2023). Uplift rates within the OCR span only a narrow range, which may allow the variations in rock type to play a key role in setting valley width, similar to their influence on hillslope form (Struble et al., 2024). For instance, more resistant lithology may inhibit lateral erosion in channels, thus promoting narrow rivers (Li et al., 2023) and also support greater landscape relief (Neely et al., 2019).
Volcanic rocks may host narrower rivers; however, they must also host large landslides to lead to the formation of landslide dams. While it may be intuitive to expect that lithology will control landslide size and that stronger rocks may form smaller landslides, in this study we find no evidence that landslides in volcanic rocks are smaller than those in other lithologies. Lithology was included in our attempt to predict local landslide volumes with multivariate regression (Figs. S4 and S5). There are no large differences in the volume distributions of landslides based on lithology (Fig. S9). In fact, the lognormal mean volume for volcanic rocks (μ = 4.6 in log m3) is slightly higher than for the marine sedimentary rocks (μ = 4.4 in log m3) which make up most of the study area. It is possible that the landslide frequency varies across lithologies, however tackling this question is beyond the scope of this work (and capabilities of the incomplete inventories available). Our analysis indirectly accounts for relative frequency by using the state-wide landslide susceptibility map which incorporates lithology (Burns et al., 2016). This map and other susceptibility maps that incorporate lithology do not show a decrease in landslide susceptibility in regions of volcanic rocks (Burns et al., 2016; Sharifi-Mood et al., 2017). Further research could inform how geology controls possible dam forming landslides. For now, we conclude that (at a regional scale) lithology is not the primary control of landslide character but does likely act as an important control on valley widths, and consequently landslide dam susceptibility.
The distribution of landslide dam susceptibilities found in this study are generally similar to other landslide dam susceptibility studies. Studies in New Zealand's Southern Alps (McMeckin, 2022), Italy's Arno Basin (Tacconi Stefanelli et al., 2020), and Central Asia (Tacconi Stefanelli et al., 2023), generally predict a much higher percentage of river stretches with low landslide dam hazard than with intermediate or high hazard. McMeckin (2022) found roughly 28 % of the points in the catchments they studied at risk, which is comparable to the 36 % of points above dam potential of 0.35 in our study. In both the Arno Basin and Central Asia, around 30 % to 40 % of the rivers were associated with moderate, high, and very high damming susceptibility (Tacconi Stefanelli et al., 2020, 2023). All studies show a clear relationship between mountainous areas with high relief and areas with higher landslide dam susceptibility. It's unclear what the variability of results may look like if this methodology were applied to a region nearly entirely within high relief slopes such as the Himalaya. We suggest that landslide dams are more likely to occur close to river headwaters, along stretches of river that cut through higher topography, and through resistant rock types. The location of the steep terrain and narrow valleys is likely controlled by lithology in the OCR but may have other controls (such as uplift rate) globally.
5.3 Landslide dam hazards in the Oregon Coast Range
The potential for landslide dam formation is present and widespread across the OCR. Roughly one third of the river points have dam susceptibility values greater than 0.35, the threshold placed to define potential dam sites (visible points in Fig. 9). These results are consistent with the large number of landslide dam deposits (> 200) observed throughout the study area (Struble et al., 2021) and suggest that flooding associated with landslide impounded riverways is a hazard worthy of consideration in community planning.
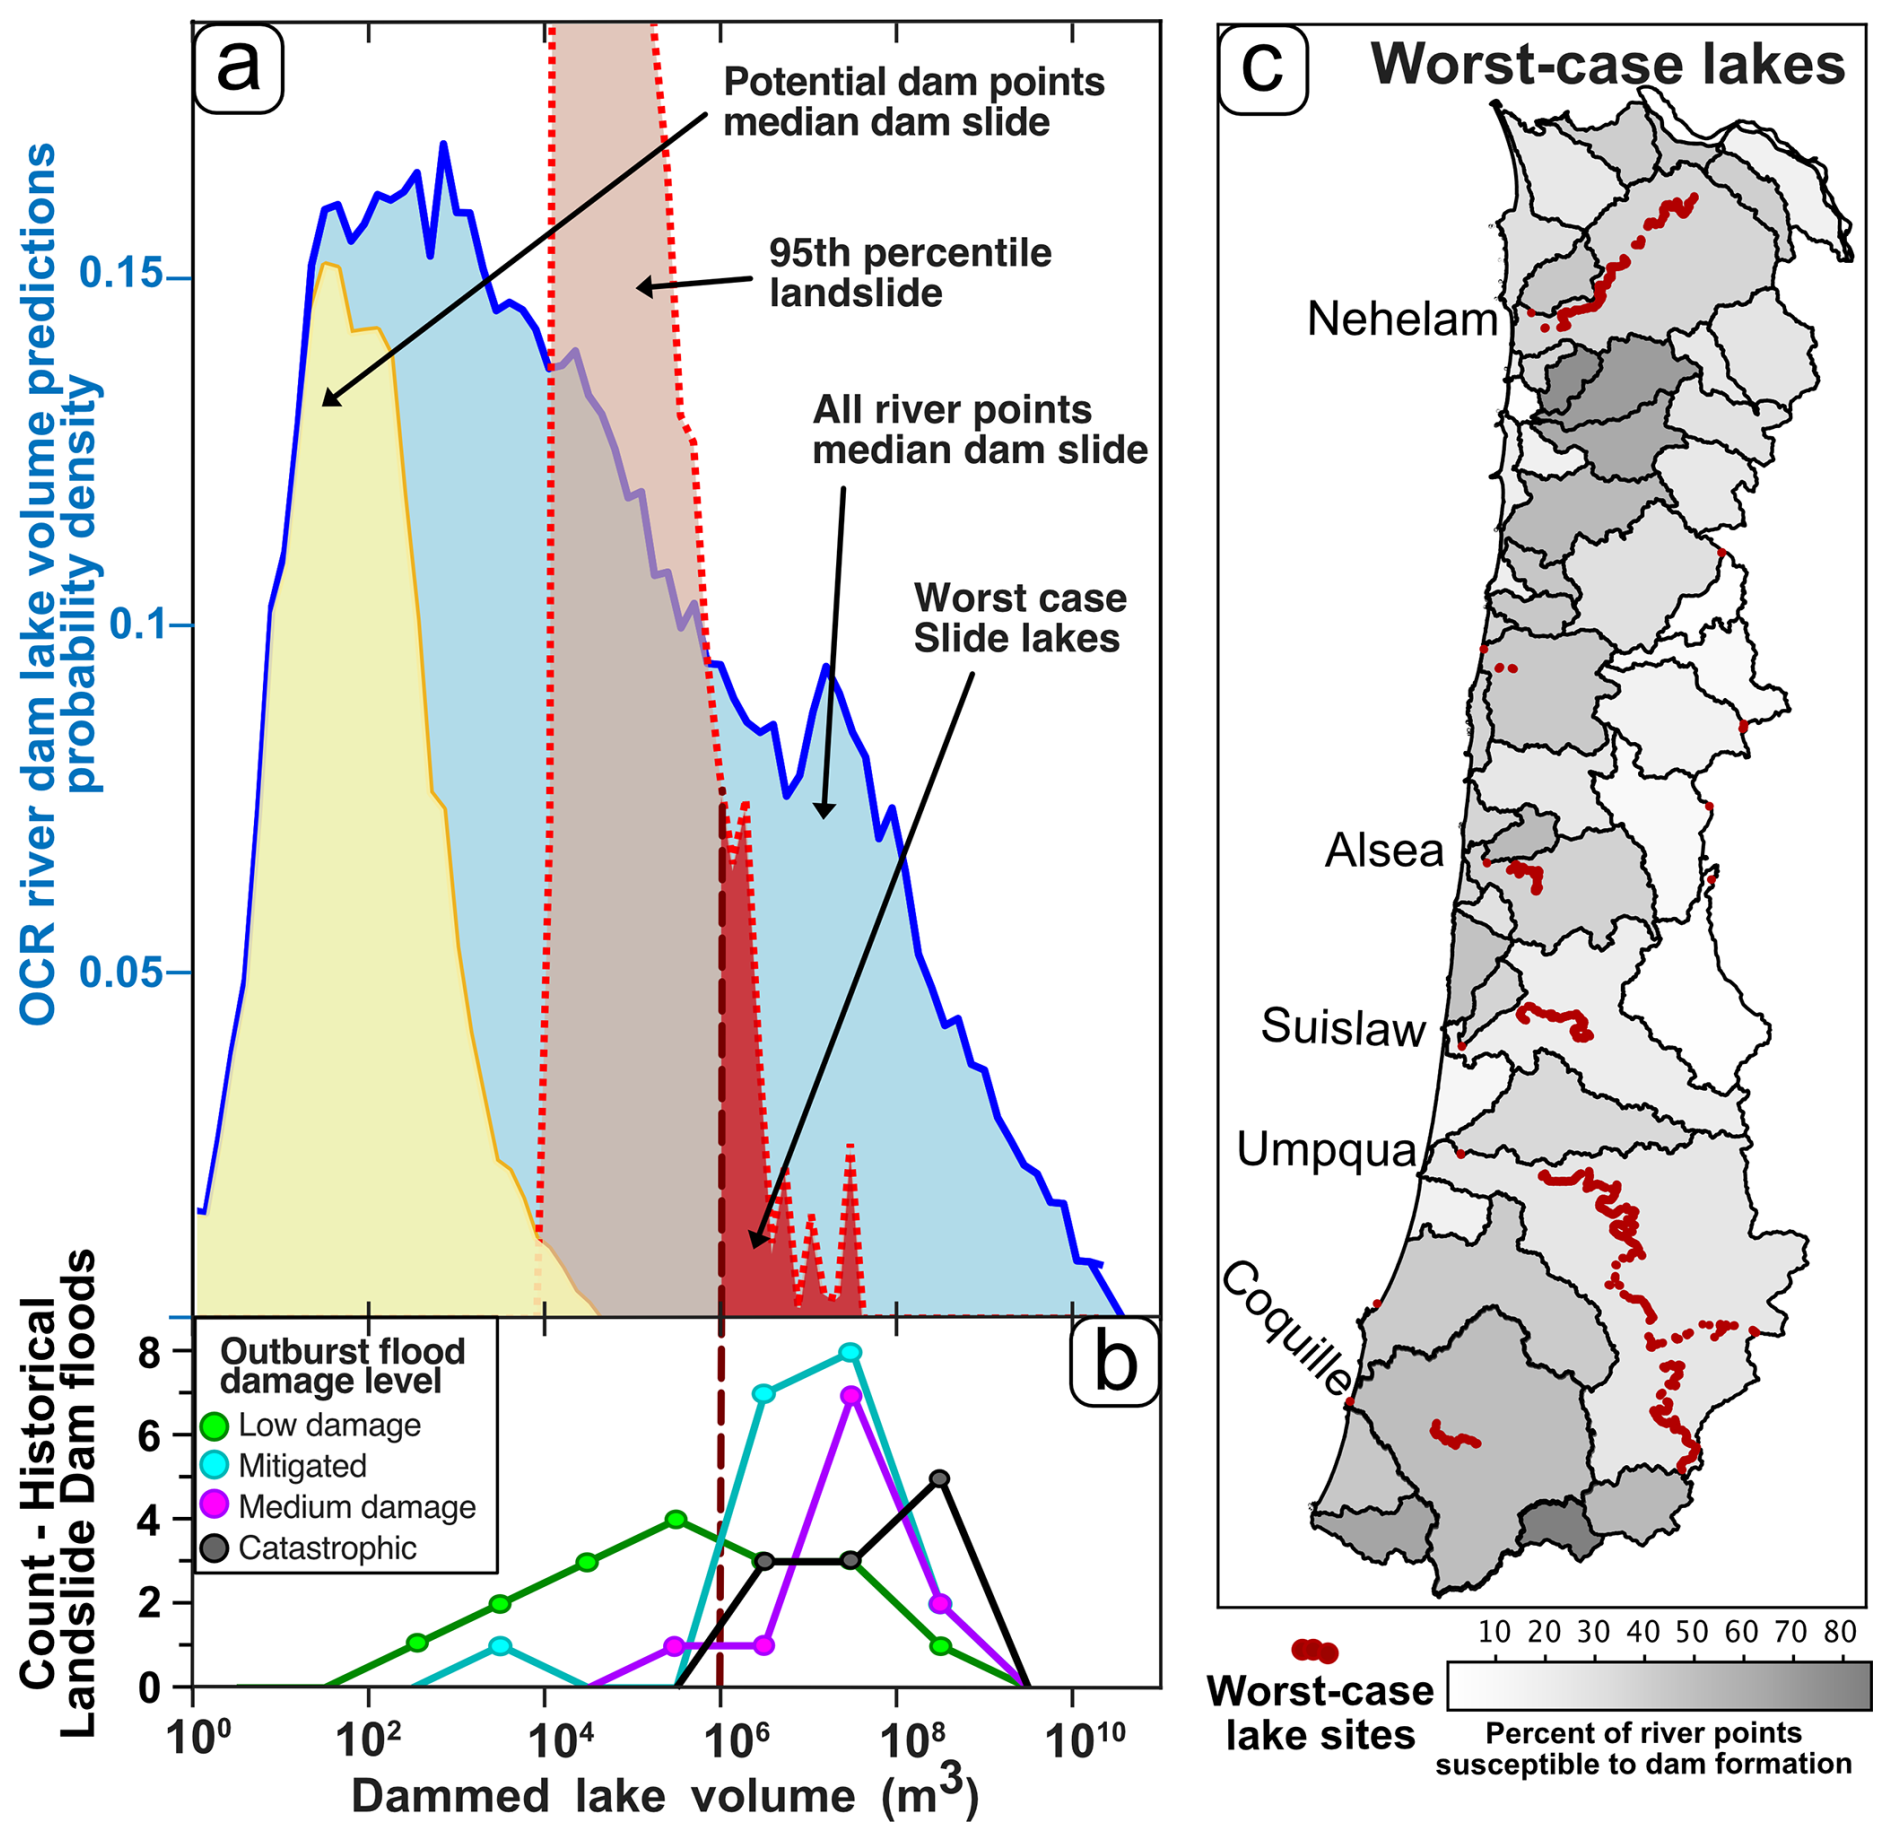
Figure 12(a) Predicted lake volumes for landslide dams at OCR river points compared with (b) the volumes of historical landslide dam lakes. (a) Blue line represents dam volumes predicted for every river point, calculated with the minimum damming landslide volume (V50, Eq. 5). The yellow line represents the same dataset as the blue line, but limited to only potential dam sites where landslide dam susceptibility is greater than 0.35 (Plotted in Fig. 7). Light red dashed line represents lake volumes estimated using the 95th percentile volume (3 × 10⁶ m3) landslide, and limited to points where that large slide leads to damability values > 0.5, and dark red shaded area represents the worst-case lakes where the 95th percentile landslide might impound a lake greater than 1 million cubic meters. (b) Lines with dots represent a subset of the data presented in Costa and Schuster (1991) where dam lake volumes are recorded and outburst flood effects are noted and are colored by impact: green = little to low damage, blue = engineering mitigation took place, pink = medium damage, and black = catastrophic damage. (c) maps the locations of the worst case lakes in (a) over the catchments shaded by percent of river points that are above the dam potential threshold, same as Fig. 9.
Fortunately, most of the river stretches with high potential for dam formation would likely hold small lakes (< 104 m3) (Fig. 12). Rivers with high landslide susceptibility values can be dammed by smaller landslides. Our lake estimate procedure adjusts the slide volume based on the minimum damming slide volume (V50) for the river stretch, therefore we predict smaller lake volumes for narrower river valleys. We consider our predicted lake volumes (yellow line in Fig. 10) low when compared to a dataset of historic landslide dam outburst floods (Costa and Schuster, 1991), where lake volumes of around 1 million m3 are the minimum recorded lake volumes for catastrophic outburst floods (black dots in Fig. 12b). Smaller landslide dam lakes are still capable of causing damage and may still require a swift mitigation response, (Costa and Schuster, 1991), however the 1 million m3 mark provides a good approximation of extreme impact potential.
Landslide dam disasters are usually triggered by exceptionally large landslides (Costa and Schuster, 1991; Fan et al., 2020). Two examples of past landslide dams which occurred in the Pacific Northwest, the Oso landslide and the Bonneville landslide dam, dammed rivers in wide valleys which would have low damability values ∼ 0.1 and ∼ 0.01, respectively (Iverson et al., 2015; Pierson et al., 2016). These were rare and large landslides, lying at the 98th percentile (Oso) and 99.9th percentile (Bonneville) of the SLIDO volume distribution. Large landslides like these are also capable of damming relatively larger rivers with lower gradients that can lead to rapid lake filling and extensive upstream impacts.
If we estimate landslide dam lake formations with a worst-case assumption of a landslide with a volume corresponding to the 95th percentile of the SLIDO inventory (3 × 10⁶ m3) the magnitude and location of dams with the greatest potential impacts shifts dramatically. This worst-case landslide would likely (damability > 0.5) dam 66 % of the river stretches, and possibly (damability > 0.1) dam 88 %. The estimated lake volumes at those likely dammed sites increase significantly as well (red dashed line Fig. 12a). In a few rivers, the 95th percentile landslide would likely dam the river and could impound a lake exceeding the 1 million m3 associated with historic catastrophic outburst floods (Fig. 12a). The corresponding worst-case lakes (Fig. 12c) are primarily in the largest rivers in the study area and are not correlated to the catchments with the highest landslide dam susceptibility values. The mismatch between the rivers where landslide dams may be the most likely to form, and those where the impacts could be the greatest, presents a mitigation planning challenge worthy of further study.
An obvious next step would be to improve on this analysis through more detailed assessments within the most hazardous catchments. This could bypass some of the simplifications made to take advantage of regional datasets. Local lake volume estimates could be improved using local topography rather than a scaling relationship not calibrated on fluvial valleys (Argentin et al., 2021; Hergarten et al., 2023). Local evaluations may also be improved by valley specific geotechnical investigations to characterize local landslide susceptibilities as well as constrain landslide volumes and possible runout distances. For example, landslide patterns within the study area are known to be controlled by sub geologic unit lithologic properties (Roering et al., 2005; LaHusen and Grant, 2024). That level of detail is beyond the scope of this regional analysis.
Ultimately the risks to populations posed by landslide dams are controlled by the location of the landslide dam formation, the size and stability of the dam, the size of the impounded lake, and the exposure of upstream and downstream people and infrastructure. The scope of this study was to identify the locations where landslide dams may be most likely to occur, and place initial estimates on the magnitude of the impacts. Our results can help mitigation planning, prioritize valleys for localized detailed analysis, and order initial inventory scouting in the case of a widespread landslide triggering event. Future work to identify community exposure, investigate the landslide dam susceptibility upstream of those communities, and simulate outburst floods within those valleys, would extend the value of landslide dam susceptibility analyses for decision makers. How landslide dam hazard analysis work is continued and presented should represent a cross section of what is scientifically possible and be informed by what products end users need (e.g., Barnhart et al., 2023).
In this study, we refined a methodology used to estimate landslide dam susceptibility at a regional scale in the Oregon Coast Range (OCR). As part of this workflow, we present a new methodology for fitting a dam/non-dam inventory to derive a probabilistic damability function, which can be used to predict landslide dam likelihood given landslide volume and valley width. We show that landslide volume is not always predictable using data driven models including local geomorphic and geologic factors. Our case study demonstrates that a log-normal distribution of landslide volumes and our valley width measurement algorithm can be successfully used to assess landslide dam susceptibility using a damability function. Our methods separate sites with known landslide dams from all river sites with an ROC area under the curve of 0.834. We also demonstrate how damability function derived damability values can be used in conjunction with landslide susceptibility or impounded lake volume estimates to better characterize and visualize landslide dam formation likelihoods and magnitudes (Figs. 8 and 9). The damability function approach is flexible to the input of new data and can be recalibrated by existing or new inventories for use in other regions globally.
When applied to the OCR, we find that dam susceptibility correlates with drainage area, mountainous terrain, and lithology. High landslide dam susceptibility is widespread across the OCR, where roughly one-third of the river stretches have landslide dam susceptibility values above the dam potential threshold value (0.35). In most of these susceptible river stretches, we estimate that landslide dams would impound relatively small lakes that are generally less dangerous. However, exceptionally large landslides could dam most of the OCR rivers and impound lakes large enough for catastrophic outburst flooding in some rivers. These results show that landslide dam hazards could be significant in the Pacific Northwest. If a large, widespread landslide triggering event, such as a subduction zone earthquake, were to occur, we expect that landslide dams may form in the OCR, and the chances of a landslide dam leading to a catastrophic outburst flood are non-negligible.
The code used to measure valley width is openly available at https://github.com/PMonroeMorgan/ElevationThresholdValleyWidth.git (last access: 16 March 2026) and https://doi.org/10.5281/zenodo.18992083 (Morgan, 2026).
We provide supplemental data files including the dam/non-dam inventory used to fit the damability function, and the analysis results at all river points here: https://doi.org/10.5066/P14SIP44 (Morgan et al., 2026).
Much of the data used in this study is publicly available and provided by the Oregon Department of Geology and Mineral Industries (DOGAMI) including: the Lidar data (https://www.oregon.gov/dogami/lidar/Pages/index.aspx, last access: March 2024), geologic map data (https://www.oregon.gov/dogami/geologicmap/Pages/index.aspx, last access: March 2024), and landslide inventories (https://www.oregon.gov/dogami/slido/Pages/data.aspx, last access: March 2024).
The supplement related to this article is available online at https://doi.org/10.5194/nhess-26-1745-2026-supplement.
AD conceptualized the research project. PM performed the investigation, developed the methodology, and wrote subsequent software. PM and ag performed the analysis. PM, ag, WS, SL, and AD contributed to interpretation of results. PM wrote the manuscript draft. ag, WS, SL, and AD reviewed and edited the manuscript.
The contact author has declared that none of the authors has any competing interests.
Publisher's note: Copernicus Publications remains neutral with regard to jurisdictional claims made in the text, published maps, institutional affiliations, or any other geographical representation in this paper. The authors bear the ultimate responsibility for providing appropriate place names. Views expressed in the text are those of the authors and do not necessarily reflect the views of the publisher.
We thank N. Calhoun and B. Burns for comments and recommendations in the early stages of this work. The manuscript was improved by comprehensive reviews by internal U.S. Geological Survey researchers A. Dunham and S. Ahrendt, and by two anonymous reviewers. Any use of trade, firm, or product names is for descriptive purposes only and does not imply endorsement by the U.S. Government.
This research has been supported by the National Science Foundation (grant no. ICER-2103713) to Duvall.
This paper was edited by Filippo Catani and reviewed by two anonymous referees.
Alvioli, M., Marchesini, I., Reichenbach, P., Rossi, M., Ardizzone, F., Fiorucci, F., and Guzzetti, F.: Automatic delineation of geomorphological slope units with r.slopeunits v1.0 and their optimization for landslide susceptibility modeling, Geosci. Model Dev., 9, 3975–3991, https://doi.org/10.5194/gmd-9-3975-2016, 2016.
Argentin, A.-L., Robl, J., Prasicek, G., Hergarten, S., Hölbling, D., Abad, L., and Dabiri, Z.: Controls on the formation and size of potential landslide dams and dammed lakes in the Austrian Alps, Nat. Hazards Earth Syst. Sci., 21, 1615–1637, https://doi.org/10.5194/nhess-21-1615-2021, 2021.
Barnhart, K. R., Romero, V. Y., and Clifford, K. R.: User needs assessment for postfire debris-flow inundation hazard products, US Geol. Surv. Open-File Rep., https://doi.org/10.3133/ofr20231025, 2023.
Bellugi, D. G., Milledge, D. G., Cuffey, K. M., Dietrich, W. E., and Larsen, L. G.: Controls on the size distributions of shallow landslides, P. Natl. Acad. Sci. USA, 118, https://doi.org/10.1073/pnas.2021855118, 2021.
Bonnard, C.: Technical and Human Aspects of Historic Rockslide – 55 Dammed Lakes and Landslide Dam Breaches, in: Natural and Artificial Rockslide Dams, edited by: Evans, S., Hermanns, R., Strom, A., and Scarascia-Mugnozza, G., Lecture Notes in Earth Sciences, 133, Springer, Berlin, Heidelberg, 1, 101–122, https://doi.org/10.1007/978-3-642-04764-0_3, 2011.
Bryce, E., Lombardo, L., van Westen, C., Tanyas, H., and Castro-Camilo, D.: Unified landslide hazard assessment using hurdle models: a case study in the Island of Dominica, Stoch. Environ. Res. Risk Assess., 36, 2071–2084, https://doi.org/10.1007/s00477-022-02239-6, 2022.
Burns, W. J. and Madin, I. P.: Protocol for Inventory MappIng of landslIde deposIts from lIght detectIon and rangIng (LIDAR) Imagery SpecIal Paper 42, Oregon Dep. Geol. Miner. Ind., 2009.
Burns, W. J., Mickelson, K. A., and Madin, I. P.: Landslide Susceptibility Overview Map of Oregon, Oregon Department of Geology and Mineral Industries Open-File Report, O-16-02, 2016.
Clubb, F. J., Weir, E. F., and Mudd, S. M.: Continuous measurements of valley floor width in mountainous landscapes, Earth Surf. Dynam., 10, 437–456, https://doi.org/10.5194/esurf-10-437-2022, 2022.
Clubb, F. J., Mudd, S. M., Schildgen, T. F., van der Beek, P. A., Devrani, R., and Sinclair, H. D.: Himalayan valley-floor widths controlled by tectonically driven exhumation, Nat. Geosci., 16, 739–746, https://doi.org/10.1038/s41561-023-01238-8, 2023.
Corominas, J.: The angle of reach as a mobility index for small and large landslides, Can. Geotech. J., 260–271, 1996.
Costa, J. E. and Schuster, R. L.: Formation and Failure of Natural Dams, Bull. Geol. Soc. Am., 100, 1054–1068, https://doi.org/10.1130/0016-7606(1988)100<054:TFAFON>2.3.CO;2, 1988.
Costa, J. E. and Schuster, R. L.: Documented historical landslide dams from around the world, Open-File Rep., 494, United States Geol. Surv., 1991.
Dai, F. C., Lee, C. F., Deng, J. H., and Tham, L. G.: The 1786 earthquake-triggered landslide dam and subsequent dam-break flood on the Dadu River, southwestern China, Geomorphology, 65, 205–221, https://doi.org/10.1016/j.geomorph.2004.08.011, 2005.
Dai, L., Fan, X., Jansen, J. D., and Xu, Q.: Landslides and fluvial response to landsliding induced by the 1933 Diexi earthquake, Minjiang River, eastern Tibetan Plateau, Landslides, 3011–3025, https://doi.org/10.1007/s10346-021-01717-2, 2021.
Dal Sasso, S. F., Sole, A., Pascale, S., Sdao, F., Bateman Pinzòn, A., and Medina, V.: Assessment methodology for the prediction of landslide dam hazard, Nat. Hazards Earth Syst. Sci., 14, 557–567, https://doi.org/10.5194/nhess-14-557-2014, 2014.
Densmore, A. L. and Hovius, N.: Topographic fingerprints of bedrock landslides, Geology, 28, 371–374, https://doi.org/10.1130/0091-7613(2000)028<371:TFOBL>2.3.CO;2, 2000.
Dettinger, M. D., Ralph, F. M., and Rutz, J. J.: Empirical return periods of the most intense vapor transports during historical atmospheric river landfalls on the U. S. West Coast, J. Hydrometeorol., 19, 1363–1377, https://doi.org/10.1175/JHM-D-17-0247.1, 2018.
DiBiase, R. A. and Whipple, K. X.: The influence of erosion thresholds and runoff variability on the relationships among topography, climate, and erosion rate, J. Geophys. Res. Earth Surf., 116, 1–17, https://doi.org/10.1029/2011JF002095, 2011.
Duncan, J. M., Fleming, R. W., Patton, F. D., and U.S. Geological Survey: Report of the Thistle Slide Committee to State of Utah, US Geol. Surv. Open-File Rep., Department of Natural Resources, Division of Water Rights, 1986.
Dunne, K. B. J. and Jerolmack, D. J.: What sets river width?, Sci. Adv., 6, 1–8, https://doi.org/10.1126/sciadv.abc1505, 2020.
Ermini, L. and Casagli, N.: Prediction of the behaviour of landslide dams using a geomorphological dimensionless index, Earth Surf. Process. Landforms, 28, 31–47, https://doi.org/10.1002/esp.424, 2003.
Fan, X., Scaringi, G., Korup, O., West, A. J., van Westen, C. J., Tanyas, H., Hovius, N., Hales, T. C., Jibson, R. W., Allstadt, K. E., Zhang, L., Evans, S. G., Xu, C., Li, G., Pei, X., Xu, Q., and Huang, R.: Earthquake-Induced Chains of Geologic Hazards: Patterns, Mechanisms, and Impacts, Rev. Geophys., 57, 421–503, https://doi.org/10.1029/2018RG000626, 2019.
Fan, X., Dufresne, A., Siva Subramanian, S., Strom, A., Hermanns, R., Tacconi Stefanelli, C., Hewitt, K., Yunus, A. P., Dunning, S., Capra, L., Geertsema, M., Miller, B., Casagli, N., Jansen, J. D., and Xu, Q.: The formation and impact of landslide dams – State of the art, Earth-Science Rev., 203, 103116, https://doi.org/10.1016/j.earscirev.2020.103116, 2020.
Franczyk, J. J., Burns, W. J., and Calhoun, N. C.: Statewide landslide information database for Oregon, release 4 (SLIDO-4.4), Oregon Department of Geology and Mineral Industries, https://www.oregon.gov/dogami/slido/pages/index.aspx (last access: 16 March 2026), 2020.
Froude, M. J. and Petley, D. N.: Global fatal landslide occurrence from 2004 to 2016, Nat. Hazards Earth Syst. Sci., 18, 2161–2181, https://doi.org/10.5194/nhess-18-2161-2018, 2018.
Grant, A. R. R., Struble, W. T., and LaHusen, S. R.: Limits to coseismic landslides triggered by Cascadia Subduction Zone earthquakes, Geomorphology, 418, 108477, https://doi.org/10.1016/j.geomorph.2022.108477, 2022.
Grant, G. E. and Swanson, F. J.: Morphology and processes of valley floors in mountain streams, Western Cascades, Oregon, Geophysical Monograph-American Geophysical Union, 83–101, https://doi.org/10.1029/GM089p0083, 1995.
Heimsath, A. M., DiBiase, R. A., and Whipple, K. X.: Soil production limits and the transition to bedrock-dominated landscapes, Nat. Geosci., 5, 210–214, https://doi.org/10.1038/ngeo1380, 2012.
Hergarten, S., Argentin, A., Prasicek, G., and Daniel, H.: The scaling of landslide-dammed lakes, Global Planet. Change, 228, https://doi.org/10.1016/j.gloplacha.2023.104190, 2023.
Hilley, G. E., Baden, C. W., Dobbs, S. C., Plante, Z., Sare, R., and Steelquist, A. T.: A Curvature-Based Method for Measuring Valley Width Applied to Glacial and Fluvial Landscapes, J. Geophys. Res. Earth Surf., 125, 1–16, https://doi.org/10.1029/2020JF005605, 2020.
Iverson, R. M., George, D. L., Allstadt, K., Reid, M. E., Collins, B. D., Vallance, J. W., Schilling, S. P., Godt, J. W., Cannon, C. M., Magirl, C. S., Baum, R. L., Coe, J. A., Schulz, W. H., and Bower, J. B.: Landslide mobility and hazards: Implications of the 2014 Oso disaster, Earth Planet. Sci. Lett., 412, 197–208, https://doi.org/10.1016/j.epsl.2014.12.020, 2015.
Korup, O. and Tweed, F.: Ice, moraine, and landslide dams in mountainous terrain, Quat. Sci. Rev., 26, 3406–3422, https://doi.org/10.1016/j.quascirev.2007.10.012, 2007.
LaHusen, S. R. and Grant, A. R. R.: Complex landslide patterns explained by local intra-unit variability of stratigraphy and structure: Case study in the Tyee Formation, Oregon, USA, Eng. Geol., 329, 107387, https://doi.org/10.1016/j.enggeo.2023.107387, 2024.
LaHusen, S. R., Duvall, A. R., Booth, A. M., Grant, A., Mishkin, B. A., Montgomery, D. R., Struble, W., Roering, J. J., and Wartman, J.: Rainfall triggers more deep-seated landslides than Cascadia earthquakes in the Oregon Coast Range, USA, Sci. Adv., 6, https://doi.org/10.1126/sciadv.aba6790, 2020.
Lane, J. W.: Relations between geology and mass movement features in a part of the East Fork Coquille River Watershed, Southern Coast Range, Oregon, MS Thesis, Oregon State University, http://hdl.handle.net/1957/18455, 1987.
Larsen, I. J. and Montgomery, D. R.: Landslide erosion coupled to tectonics and river incision, Nat. Geosci., 5, 468–473, https://doi.org/10.1038/ngeo1479, 2012.
Larsen, I. J., Montgomery, D. R., and Korup, O.: Landslide erosion controlled by hillslope material, Nat. Geosci., 3, 247–251, https://doi.org/10.1038/ngeo776, 2010.
Leopold, L. B. and Maddock, T.: The hydraulic geometry of stream channels and some physiographic implications, US Gov. Print. Off., Vol. 252, 1953.
Li, T., Venditti, J. G., and Sklar, L. S.: Steady-State Bedrock Channel Width, Geophys. Res. Lett., 50, 1–10, https://doi.org/10.1029/2023GL105344, 2023.
Lombardo, L., Tanyas, H., Huser, R., Guzzetti, F., and Castro-Camilo, D.: Landslide size matters: A new data-driven, spatial prototype, Eng. Geol., 293, https://doi.org/10.1016/j.enggeo.2021.106288, 2021.
May, C., Roering, J., Eaton, L. S., and Burnett, K. M.: Controls on valley width in mountainous landscapes: The role of landsliding and implications for salmonid habitat, Geology, 41, 503–506, https://doi.org/10.1130/G33979.1, 2013.
McMeckin, J.: Landslide Dam Hazard Modelling in the West Coast Region, New Zealand, master's thesis, University of Canterbury, https://doi.org/10.26021/14062, 2022.
Medwedeff, W. G., Clark, M. K., Zekkos, D., and West, A. J.: Characteristic landslide distributions: An investigation of landscape controls on landslide size, Earth Planet. Sci. Lett., 539, 116203, https://doi.org/10.1016/j.epsl.2020.116203, 2020.
Meunier, P., Hovius, N., and Haines, J. A.: Topographic site effects and the location of earthquake induced landslides, Earth Planet. Sci. Lett., 275, 221–232, https://doi.org/10.1016/j.epsl.2008.07.020, 2008.
Montgomery, D. R., Schmidt, K. M., Dietrich, W. E., and McKean, J.: Instrumental record of debris flow initiation during natural rainfall: Implications for modeling slope stability, J. Geophys. Res. Earth Surf., 114, 1–16, https://doi.org/10.1029/2008JF001078, 2009.
Moreno, M., Steger, S., Tanyas, H., and Lombardo, L.: Modeling the size of co-seismic landslides via data-driven models: the Kaikōura's example, Eng. Geol., 320, 107121, https://doi.org/10.1016/j.enggeo.2023.107121, 2022.
Morgan, P. M.: PMonroeMorgan/ElevationThresholdValleyWidth: ElevationThresholdValleyWidthv1.0 (v1.0), Zenodo [code], https://doi.org/10.5281/zenodo.18992083, 2026.
Morgan, P. M., Grant, A. R. R., and Duvall, A. R.: Landslide Dam Data and Susceptibility Estimates in the Oregon Coast Range, U.S. Geological Survey data release [data set], https://doi.org/10.5066/P14SIP44, 2026.
Neely, A. B., DiBiase, R. A., Corbett, L. B., Bierman, P. R., and Caffee, M. W.: Bedrock fracture density controls on hillslope erodibility in steep, rocky landscapes with patchy soil cover, southern California, USA, Earth Planet. Sci. Lett., 522, 186–197, https://doi.org/10.1016/j.epsl.2019.06.011, 2019.
Pierson, T. C., Evarts, R. C., and Bard, J. A.: Landslides in the western Columbia Gorge, Skamania County, Washington, USGS Sci. Investig. Map, 3358, 25, 2016.
Pollock, W.: A Framework for Regional Scale Quantitative Landslide Risk Analysis, Univ. Washingt Diss., http://hdl.handle.net/1773/45904, 2020.
Qiu, H., Cui, P., Regmi, A. D., Hu, S., Zhang, Y., and He, Y.: Landslide distribution and size versus relative relief (Shaanxi Province, China), Bull. Eng. Geol. Environ., 77, 1331–1342, https://doi.org/10.1007/s10064-017-1121-5, 2018.
Riley, S. J., DeGloria, S. D., and Elliot, R.: Index that quantifies topographic heterogeneity, Intermountain Journal of Sciences, 5.1-4, 23–27, 1999.
Robison, E. G., Mills, K. A., Paul, J., Dent, L., and Skaugset, A.: Oregon Department of Forestry storm impacts and landslides of 1996: Final Report, Oregon Department of Forestry, Salem, OR, 1999.
Roering, J. J., Kirchner, J. W., and Dietrich, W. E.: Evidence for nonlinear, diffusive sediment transport on hillslopes and implications for landscape morphology, Water Resour. Res., 35, 853–870, https://doi.org/10.1029/1998WR900090, 1999.
Roering, J. J., Kirchner, J. W., and Dietrich, W. E.: Characterizing structural and lithologic controls on deep-seated landsliding: Implications for topographic relief and landscape evolution in the Oregon Coast Range, USA, Bull. Geol. Soc. Am., 117, 654–668, https://doi.org/10.1130/B25567.1, 2005.
Sappington, J. M., Longshore, K. M., and Thompson, D. B.: Quantifying Landscape Ruggedness for Animal Habitat Analysis: A Case Study Using Bighorn Sheep in the Mojave Desert, J. Wildl. Manage., 71, 1419–1426, https://doi.org/10.2193/2005-723, 2007.
Sattar, A. and Konagai, K.: Recent Landslide Damming Events and Their Hazard Mitigation Strategies, Adv. Geotech. Earthq. Eng. - Soil Liq. Seism. Saf. Dams Monum., https://doi.org/10.5772/28044, 2012.
Schanz, S. A. and Montgomery, D. R.: Lithologic controls on valley width and strath terrace formation, Geomorphology, 258, 58–68, https://doi.org/10.1016/j.geomorph.2016.01.015, 2016.
Schwanghart, W. and Scherler, D.: Short Communication: TopoToolbox 2 – MATLAB-based software for topographic analysis and modeling in Earth surface sciences, Earth Surf. Dynam., 2, 1–7, https://doi.org/10.5194/esurf-2-1-2014, 2014.
Sharifi-Mood, M., Olsen, M. J., Gillins, D. T., and Mahalingam, R.: Performance-based, seismically-induced landslide hazard mapping of Western Oregon, Soil Dyn. Earthq. Eng., 103, 38–54, https://doi.org/10.1016/j.soildyn.2017.09.012, 2017.
Shobe, C. M., Turowski, J. M., Nativ, R., Glade, R. C., Bennett, G. L., and Dini, B.: The role of infrequently mobile boulders in modulating landscape evolution and geomorphic hazards, Earth-Science Rev., 220, 103717, https://doi.org/10.1016/j.earscirev.2021.103717, 2021.
Stark, C. P. and Hovius, N.: The characterization of landslide size distributions, Geophys. Res. Lett., 28, 1091–1094, https://doi.org/10.1029/2000GL008527, 2001.
Struble, W. T., Roering, J. J., Black, B. A., Burns, W. J., Calhoun, N., and Wetherell, L.: Dendrochronological dating of landslides in western Oregon: Searching for signals of the Cascadia A. D. 1700 earthquake, Bull. Geol. Soc. Am., 132, 1775–1791, https://doi.org/10.1130/B35269.1, 2020.
Struble, W. T., Roering, J. J., Burns, W. J., Calhoun, N. C., Wetherell, L. R., and Black, B. A.: The Preservation of Climate-Driven Landslide Dams in Western Oregon, J. Geophys. Res. Earth Surf., 126, 1–25, https://doi.org/10.1029/2020JF005908, 2021.
Struble, W. T., Clubb, F. J., and Roering, J. J.: Regional-scale, high-resolution measurements of hilltop curvature reveal tectonic, climatic, and lithologic controls on hillslope morphology, Earth Planet. Sci. Lett., 647, 119044, https://doi.org/10.1016/j.epsl.2024.119044, 2024.
Swanson, F. J., Oyagi, N., and Tominaga, M.: Landslide dams in Japan, in: Landslide dams: process, risk, and mitigation New York: American Society of Civil Engineers Special Publication, edited by: Schuster, R. L., 3, 273–378, ISBN 9780872625242, 1986.
Tacconi Stefanelli, C., Catani, F., and Casagli, N.: Geomorphological investigations on landslide dams, Geoenvironmental Disasters, 2, https://doi.org/10.1186/s40677-015-0030-9, 2015.
Tacconi Stefanelli, C., Segoni, S., Casagli, N., and Catani, F.: Geomorphic indexing of landslide dams evolution, Eng. Geol., 208, 1–10, https://doi.org/10.1016/j.enggeo.2016.04.024, 2016.
Tacconi Stefanelli, C., Vilímek, V., Emmer, A., and Catani, F.: Morphological analysis and features of the landslide dams in the Cordillera Blanca, Peru, Landslides, 15, 507–521, https://doi.org/10.1007/s10346-017-0888-6, 2018.
Tacconi Stefanelli, C., Casagli, N., and Catani, F.: Landslide damming hazard susceptibility maps: a new GIS-based procedure for risk management, Landslides, 17, 1635–1648, https://doi.org/10.1007/s10346-020-01395-6, 2020.
Tacconi Stefanelli, C., Frodella, W., Caleca, F., Raimbekova, Z., Umaraliev, R., and Tofani, V.: Assessing landslide damming susceptibility in Central Asia, Nat. Hazards Earth Syst. Sci., 24, 1697–1720, https://doi.org/10.5194/nhess-24-1697-2024, 2024.
Taylor, G. H. and Bartlett, A.: The climate of Oregon, Climate zone 1, Coastal area, Special Report 913, Oregon Climate Service, 1993.
Tebbens, S. F.: Landslide Scaling: A Review, Earth Sp. Sci., 7, 1–12, https://doi.org/10.1029/2019EA000662, 2020.
Tofelde, S., Bufe, A., and Turowski, J. M.: Hillslope Sediment Supply Limits Alluvial Valley Width, AGU Adv., 3, 1–20, https://doi.org/10.1029/2021AV000641, 2022.
U.S. Geological Survey: 3D Elevation Program (3DEP) 1/3 Arc-second Digital Elevation Model, https://doi.org/10.5069/G98K778D, 2023.
Virtanen, P., Gommers, R., Oliphant, T. E., Haberland, M., Reddy, T., Cournapeau, D., Burovski, E., Peterson, P., Weckesser, W., Bright, J., van der Walt, S. J., Brett, M., Wilson, J., Millman, K. J., Mayorov, N., Nelson, A. R. J., Jones, E., Kern, R., Larson, E., Carey, C. J., Polat, I., Feng, Y., Moore, E. W., VanderPlas, J., Laxalde, D., Perktold, J., Cimrman, R., Henriksen, I., Quin- tero, E. A., Harris, C. R., Archibald, A. M., Ribeiro, A. H., Pedregosa, F., van Mulbregt, P., Vijaykumar, A., Bardelli, A. Pietro, Rothberg, A., Hilboll, A., Kloeckner, A., Scopatz, A., Lee, A., Rokem, A., Woods, C. N., Fulton, C., Masson, C., Häggström, C., Fitzgerald, C., Nicholson, D. A., Hagen, D. R., Pasechnik, D. V., Olivetti, E., Martin, E., Wieser, E., Silva, F., Lenders, F., Wilhelm, F., Young, G., Price, G. A., Ingold, G. L., Allen, G. E., Lee, G. R., Audren, H., Probst, I., Dietrich, J. P., Silterra, J., Webber, J. T., Slaviˇ c, J., Nothman, J., Buchner, J., Kulick, J., Schönberger, J. L., de Miranda Cardoso, J. V., Reimer, J., Harrington, J., Rodríguez, J. L. C., Nunez-Iglesias, J., Kuczynski, J., Tritz, K., Thoma, M., Newville, M., Kümmerer, M., Bolingbroke, M., Tartre, M., Pak, M., Smith, N. J., Nowaczyk, N., Shebanov, N., Pavlyk, O., Brodtkorb, P. A., Lee, P., McGibbon, R. T., Feldbauer, R., Lewis, S., Tygier, S., Sievert, S., Vigna, S., Peterson, S., More, S., Pudlik, T., Oshima, Takuya, Pingel, T. J., Robitaille, T. P., Spura, T., Jones, T. R., Cera, T., Leslie, T., Zito, T., Krauss, T., Upadhyay, U., Halchenko, Y. O., Vázquez-Baeza, Y., and SciPy 1.0 Contributors: SciPy 1.0: fundamental algorithms for scientific computing in Python, Nat. Methods, 17, 261–272, https://doi.org/10.1038/s41592-019-0686-2, 2020.
Wells, R., Bukry, D., Friedman, R., Pyle, D., Duncan, R., Haeussler, P., and Wooden, J.: Geologic history of Siletzia, a large igneous province in the Oregon and Washington Coast Range: Correlation to the geomagnetic polarity time scale and implications for a long-lived Yellowstone hotspot, Geosphere, 10, 692–719, https://doi.org/10.1130/GES01018.1, 2014.
Whittall, J., Eberhardt, E., and McDougall, S.: Runout analysis and mobility observations for large open pit slope failures, Can. Geotech. J., 54, 373–391, https://doi.org/10.1139/cgj-2016-0255, 2017.
Wu, H., Trigg, M. A., Murphy, W., Fuentes, R., Martino, S., Esposito, C., and Marco, G.: A global - scale applicable framework of land - - slide dam formation susceptibility, Landslides, https://doi.org/10.1007/s10346-024-02306-9, 2024.
Xu, Q., Fan, X. M., Huang, R. Q., and Van Westen, C.: Landslide dams triggered by the Wenchuan Earthquake, Sichuan Province, south west China, Bull. Eng. Geol. Environ., 68, 373–386, https://doi.org/10.1007/s10064-009-0214-1, 2009.
Yan, K., Zhao, T., and Liu, Y.: Experimental Investigations on the Spillway Section Shape of the Breaching Process of Landslide Dams, Int. J. Geomech., 22, 1–7, https://doi.org/10.1061/(asce)gm.1943-5622.0002360, 2022.
Yang, X., Yang, Z., Cao, S., Gao, X., and Li, S.: Key techniques for the emergency disposal of Quake lakes, Nat. Hazards, 52, 43–56, https://doi.org/10.1007/s11069-009-9350-y, 2010.
Yanites, B. J., Clark, M. K., Roering, J. J., West, A. J., Zekkos, D., Baldwin, J. W., Cerovski-, C., Gallen, S. F., Horton, D. E., Kirby, E., Leshchinsky, B. A., Mason, H. B., Moon, S., Barnhart, K. R., Booth, A., Czuba, J. A., Mccoy, S., Mcguire, L., Pfeiffer, A., and Pierce, J.: Cascading land surface hazards as a nexus in the Earth system Cascading land surface hazards as a nexus in the Earth system, Science, 9559, https://doi.org/10.1126/science.adp9559, 2025.
Zeng, P., Wang, S., Sun, X., Fan, X., Li, T., Wang, D., Feng, B., and Zhu, X.: Probabilistic hazard assessment of landslide-induced river damming, Eng. Geol., 304, 106678, https://doi.org/10.1016/j.enggeo.2022.106678, 2022.