the Creative Commons Attribution 4.0 License.
the Creative Commons Attribution 4.0 License.
 | 19 Mar 2026
Climate and impact attribution of compound flooding induced by tropical cyclone Idai in Mozambique
Doris M. Vertegaal
Bart J. J. M. van den Hurk
Anaïs Couasnon
Natalia Aleksandrova
Tycho Bovenschen
Fernaldi Gradiyanto
Tim W. B. Leijnse
Henrique M. D. Goulart
Sanne Muis
In this study, we investigate the effect of climate change on tropical cyclone (TC) induced compound flooding and impacts for TC Idai, making landfall in Mozambique in 2019. TCs are one of the most damaging extreme events and are challenging to attribute using conventional, probabilistic methods. We develop a storyline attribution framework including a state-of-the-art modelling chain that combines hydrological, coastal, flood and impact models to simulate the changes in flooding and its impact under factual and counterfactual scenarios, with a plausible range of the climate trend removed from TC rainfall, maximum wind speed and sea level rise (SLR). For the case of TC Idai, we find that climate trends in SLR and wind-driven storm surge lead to the largest increase in flood damage of 6 %–27 %, compared to the counterfactual, while causing the smallest increase in flood volume and flood extent of 0.2 %–0.8 % and 0.1 %–0.6 %, respectively. Climate trends in rainfall lead to the largest increase in flood volume and flood extent of 5 %–19 % and 1 %–4 %, respectively, but account for the smallest increase in flood damage of 2 %–8 %. Changes in all drivers combined lead to about the same increase in flood volume and flood extent as the rain-only scenario (5 %–19 % and 1 %–5 %, respectively) but the largest increase in flood damage of 8 %–35 %. A non-linear relationship between flood hazard and flood damage results in a stronger climate footprint on TC impacts than hazards. Assessing the combination of all climate change-affected flood drivers is crucial for obtaining a comprehensive view on the effect of climate change. The attribution framework presented in this paper is applicable for TC-prone regions across the globe and can be applied in data-scarce, often highly impacted and vulnerable areas which are currently underrepresented in attribution studies.
- Article
(5299 KB) - Full-text XML
-
Supplement
(2008 KB) - BibTeX
- EndNote


Compound flooding from tropical cyclones (TCs), driven by the co-occurrence and interaction of multiple flood drivers such as fluvial, pluvial, and coastal flooding (Zscheischler et al., 2018), is one of the most damaging climate extreme events and is exacerbated by climate change (Frame et al., 2020; Smith and Katz, 2013). This raises the question to what extent climate change is already worsening the occurrence and severity of TCs. This question is being addressed by climate attribution, which is a rapidly emerging academic field, aiming to assess the contribution of climate change to extreme events (Hegerl et al., 2010; Intergovernmental Panel on Climate Change (IPCC), 2014).
There are various attribution methods; ranging from probabilistic using climate model ensembles to (semi-)conditional analogues and storylines (Faranda et al., 2022; van Garderen et al., 2021; van Oldenborgh et al., 2021; Stott et al., 2004). Most climate attribution assessments focussing on flood events use a meteorological driver as a proxy to represent the flood hazard, such as 3 d annual maximum precipitation (Davenport et al., 2021; Otto et al., 2022; Wang et al., 2023). However, flooding involves many non-linear processes that depend not only on the amount and intensity of local rainfall. The rainfall–runoff response is controlled by catchment size, antecedent conditions, land cover, elevation, and other factors (Jahanshahi and Booij, 2023; Massari et al., 2023). Without the modelling of the flood event and associated drivers, it remains uncertain what aspect of the flood event is attributable to climate change (Scussolini et al., 2024). Moreover, attribution studies that do propagate the effect of climate change to flood hazard often model a single flood driver (Mester et al., 2023; Strauss et al., 2021), ignoring the interaction of multiple flood drivers, such as pluvial, fluvial or coastal flooding, that often co-occur during TC events (Ward et al., 2018).
TCs are particularly challenging to attribute using conventional, probabilistic attribution methods (Philp et al., 2022). The reason is that probabilistic attribution relies on accurate model representation and good quality observations, which both have been shown to be challenging for TCs due to their relatively small spatial scale compared to climate model resolution, limited understanding of the underlying physics, their short observational records, and large internal variability (Camargo et al., 2023; Knutson et al., 2019; Philip et al., 2020)
Instead of attributing all causal factors simultaneously, storyline attribution examines the causality chain through conditional explanations (e.g. conditioning on atmospheric dynamics) (Shepherd, 2016; Sillmann et al., 2021). Studying the plausibility rather than probability allows for assessing contributions of separate drivers affected by climate change, which is necessary for describing complex extremes such as TCs (Lloyd and Shepherd, 2021; Perkins-Kirkpatrick et al., 2024). A storyline approach is applicable for compound flooding from TCs and has been applied for event attribution (Mester et al., 2023).
By modelling a comprehensive causality chain between hazards and impacts, storyline attribution also enables impact attribution, which builds on climate attribution. Impact attribution propagates the effect of climate change from hazard to impact and includes elements of exposure and vulnerability contributing to societal impact (IPCC, 2023a; Mengel et al., 2021; Noy et al., 2024). By integrating the role of exposure and vulnerability, impact attribution helps improving climate impact assessments (IPCC, 2023a). It can be used to inform policies and actions, and can help improve the description of the links between climate phenomena and impacts (Hope et al., 2022).
Highly vulnerable and low-income regions, such as those in East Africa, remain underrepresented in attribution studies (Callaghan et al., 2021; Coumou et al., 2024; Perkins-Kirkpatrick et al., 2024). Most TC attribution studies focus on data-rich regions, like the United States (Bourdin et al., 2025; Grimley et al., 2024; Smiley et al., 2022; Strauss et al., 2021). This attribution gap is at least partly related to the lack of observational data. However, recent advances in global flood modelling (Ward et al., 2015; Wing et al., 2024) have created new information sources, including globally applicable methods for tropical-cyclone induced flooding (Benito et al., 2025; Eilander et al., 2023a). These developments pave the way for addressing the attribution gap and building a globally applicable method for storyline attribution of TC-induced flooding.
The goal of this paper is to demonstrate a storyline attribution framework that is applicable globally, including data-scarce regions, by attributing the effect of climate change on flood hazard and impact from TC Idai. TC Idai was one of the most devastating cyclones to ever hit the southern hemisphere (Warren, 2019). On 14 March 2019, it made landfall close to Beira City in Mozambique. A seven-day accumulated rainfall of more than 600 mm, strong winds above 150 km h−1 and storm surge heights estimated at 2.5 to 4.4 m impacted Mozambique, Malawi and Zimbabwe (Probst and Annunziato, 2019; WMO, 2019). In Mozambique alone, it is estimated that Idai caused over USD 3 billion in economic costs, destroyed over 200 000 homes, and caused 600 fatalities (Nhundu et al., 2021; UN Office for the Coordination of Humanitarian Affairs (OCHA), 2019). The storm ultimately affected approximately 1.85 million people across Mozambique. Mozambique is found to be the highest impacted country by TCs in East Africa (Benito et al., 2024).
We use a storyline attribution framework with a state-of-the-art modelling chain that dynamically simulates TC flood drivers and damages in factual and counterfactual scenarios, where plausible climate change trends are removed. The differences between the factual and counterfactual scenarios for flood hazard and impact are compared to construct conditional climate and impact attribution assessments. Finally, we discuss the results and recommend further improvements for our attribution framework and directions for climate and impact attribution assessment of compound flooding from TCs.
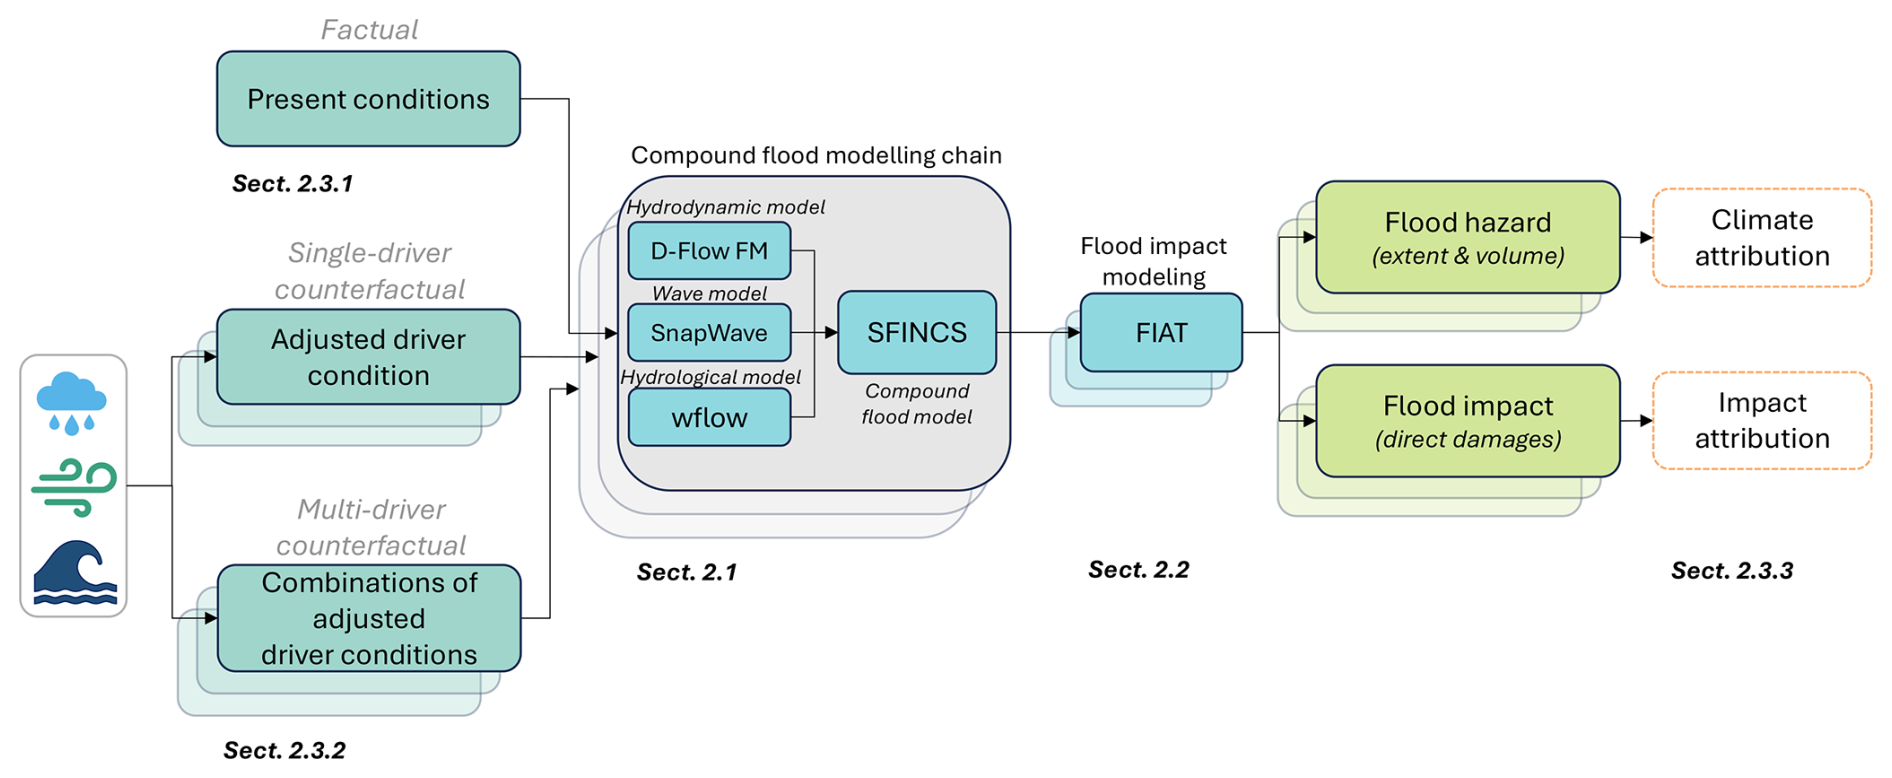
Figure 1Attribution framework consisting of steps to assess climate- and impact attribution for compound flooding from TCs. The compound flood modelling (Sect. 2.1) and flood impact modelling (Sect. 2.2) is applied to a factual (Sect. 2.3.1) and multiple counterfactual scenarios (Sect. 2.3.2), and is used to simulate flood hazard (volume and extent) and flood impact (direct damages). The input data for the different counterfactuals is based on changes in wind, rainfall and sea level rise. Stacked boxes show multiple (combined) adjusted driver conditions, model simulations or analyses. Climate attribution refers to the changes due to climate change on the hazard, whereas impact attribution propagates the effect to impact (Sect. 2.3.3).
The attribution framework (Fig. 1) for TC Idai (simulated for 9 to 25 March 2019) consists of multiple physics-based models for the different flood drivers (Sect. 2.1) and a flood impact model (Sect. 2.2). These models are used to simulate a factual scenario (Sect. 2.3.1) and multiple counterfactual scenarios with the climate change trend removed from rainfall, wind and sea level (Sect. 2.3.2). The factual and counterfactual scenarios are compared in terms of change in flood hazard (volume and extent) and flood impact (direct damage) to determine conditional climate- and impact attribution statements (Sect. 2.3.3). Our entire workflow is built on open-source models and is accessible on GitHub (Vertegaal et al., 2025).
2.1 Compound flood modelling
The modelling chain we develop for simulating the TC-induced compound flooding (fluvial, pluvial and coastal) is based on the Super-Fast INundation of CoastS v2.2.0 (SFINCS) model (van Ormondt et al., 2025a), building on the globally-applicable method presented in Eilander et al. (2023a). Discharge boundary conditions are modelled with the hydrological model wflow v0.8.1 (van Verseveld et al., 2025). Coastal water level boundary conditions are modelled with hydrodynamic model D-Flow FM v2025.01 from the Delft3D Flexible Mesh Suite (Kernkamp et al., 2011) to compute tide and storm surge. Nearshore wave setup is modelled using the coupled wave model SnapWave (Roelvink et al., 2025), that is integrated into SFINCS (Leijnse et al., 2025). The forcing for the factual and counterfactual scenarios is described in Sect. 2.3. Details on model parameters can be found in the GitHub repository (Vertegaal et al., 2025). To setup the models and process the in- and output, we make use of the python package Hydro Model Tools (HydroMT) with the model specific plugins (Deltares, 2025; Eilander et al., 2023b, 2024, 2025), except for the D-Flow FM model where we make use of dfm_tools v0.35 (Veenstra, 2025).
2.1.1 Compound flooding
Compound flooding is simulated using the SFINCS model, a reduced-complexity and computationally efficient model (Leijnse et al., 2021). SFINCS has been successfully used to simulate TC-induced flooding in various studies (Benito et al., 2024, 2025; Eilander et al., 2023a; Goulart et al., 2024; Grimley et al., 2024; Leijnse et al., 2025; Nederhoff et al., 2024). In this study, SFINCS is forced with river discharges (Sect. 2.1.2), coastal water levels (Sect. 2.1.3) and local rainfall (Sect. 2.3.1. and 2.3.2). The spatial resolution of the model is 100 m and the domain covers 8260 km2 (pink domain in Fig. 2). To reduce computational costs, we make use of the subgrid functionality that applies corrections of the flow momentum and continuity equation for bed level and friction variability within a cell and downscale the results to the higher resolution digital elevation model of 25 m (van Ormondt et al., 2025b). For topobathy, we merge the global bathymetry dataset GEBCO (GEBCO Bathymetric Compilation Group 2024, 2024) with the FABDEM digital elevation model (Hawker et al., 2022). Land Manning roughness is based on the land use data from Buchhorn et al. (2020) and Curve Number infiltration data from Jaafar and Ahmad (2019). Flooded areas are identified by removing permanent water areas, using the Global Surface Water dataset (Pekel et al., 2016). A cell is considered as flooded if the water depth exceeds 0.05 m.
2.1.2 River discharge
River discharge is simulated using the wflow model (van Verseveld et al., 2024), which is a distributed hydrological model. To account for the antecedent conditions, the wflow simulations consist of a warm-up run covering 365 d prior to the event, which provides the initial state for the event run. The wflow model has a spatial resolution of 0.0083° (∼1 km). The model domain covers around 68 000 km2, entailing the catchments of the Buzi and Pungwe rivers (blue domain in Fig. 2). MERIT Hydro is used as hydrography data (Yamazaki et al., 2019), together with river geometries from Lin et al. (2019), and lakes and reservoirs from Lehner et al. (2022) and Linke et al. (2019). We use the same land cover dataset as for the SFINCS modelling (Buchhorn et al., 2020). Hourly output is generated at the river inflow points of the SFINCS model domain (Fig. S1 in the Supplement) from which we remove the bankfull discharge (estimated as the 2-year return period; Wilkerson, 2008) to account for missing river bathymetry (Sect. S1.2 in the Supplement).
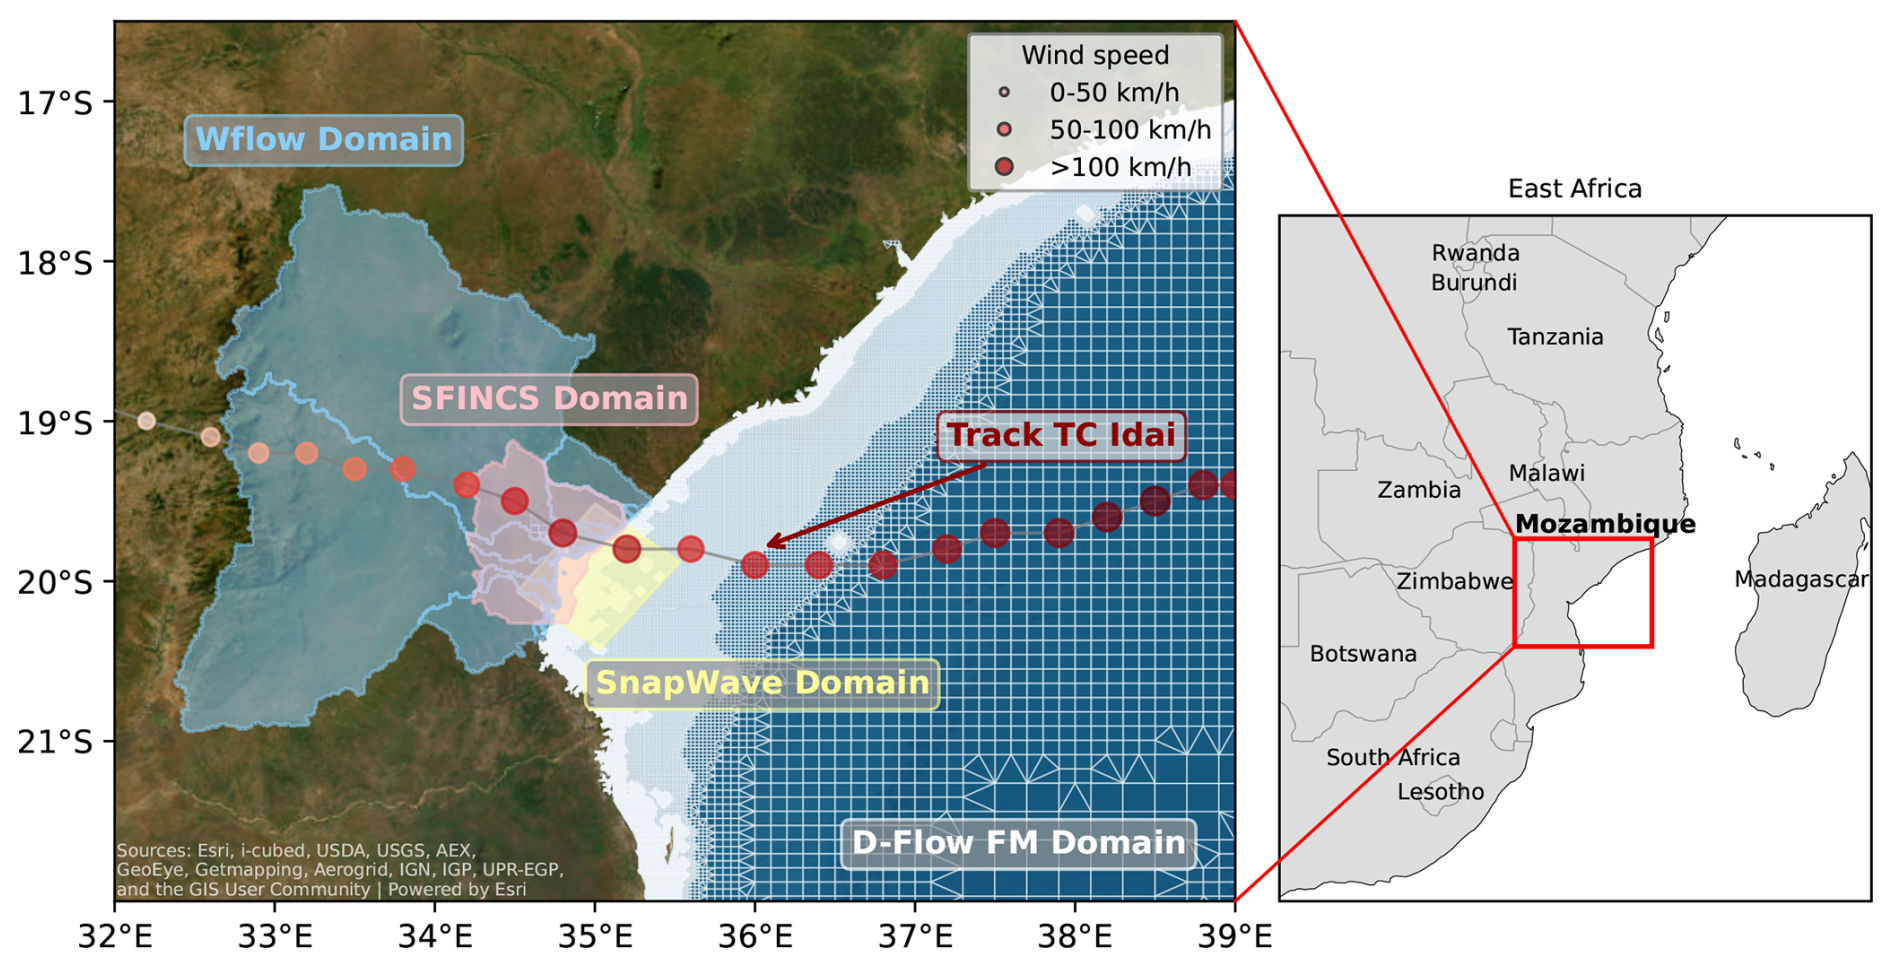
Figure 2Overview of the different model domains to simulate the compound flooding (SFINCS domain in pink), river discharge (wflow domain in blue) and coastal water levels (a part of the D-Flow FM domain in white; SnapWave domain in yellow). We also show the track of TC Idai from IBTrACS, where larger and more red coloured markers indicated higher wind speed.
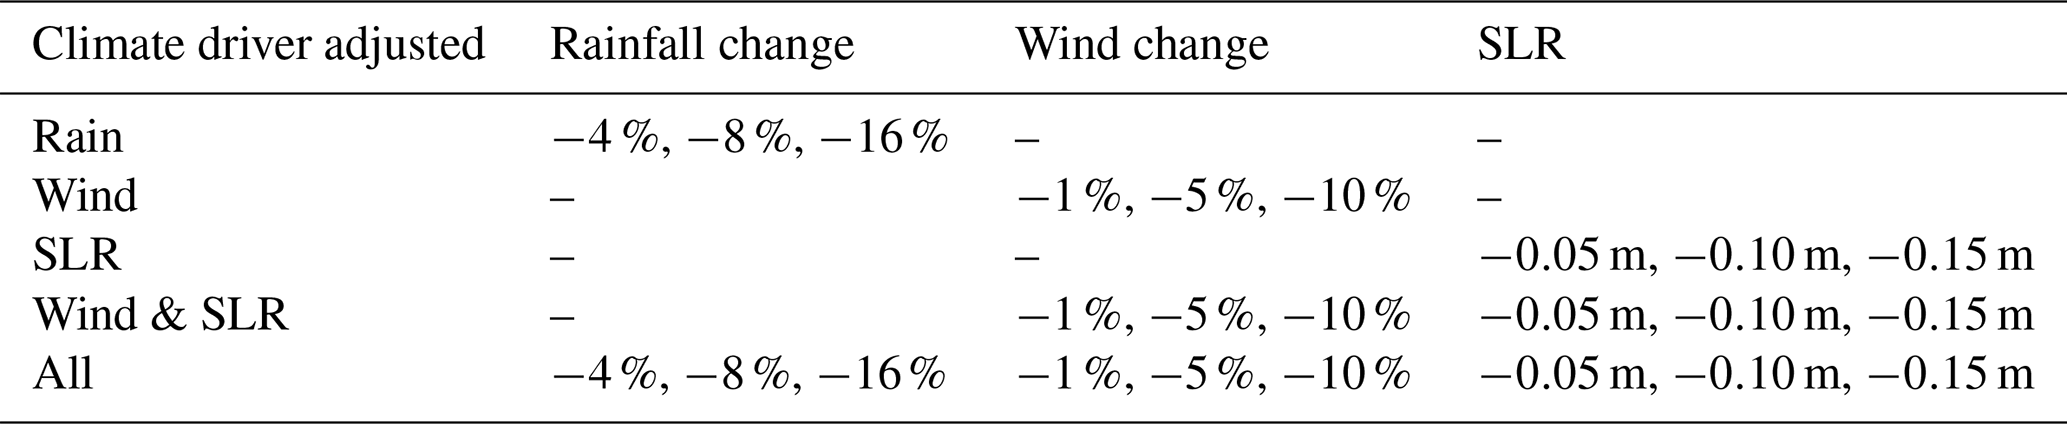
Table 1Overview of counterfactual scenarios where low, medium and high plausible climate change trends are removed for rain, wind and sea level rise individually, for the coastal flood drivers (wind and SLR) combined, and for all drivers combined.
2.1.3 Coastal water levels
Coastal water levels are composed of tides, storm surge, and wave setup (IPCC, 2023b). The tide and storm surge are simulated using a regional hydrodynamic D-Flow FM model. The spatially-varying grid has a resolution of ∼2 km in the deep ocean and 450 m at the coast. The finest resolution aligns with that of the GEBCO bathymetry dataset (GEBCO Bathymetric Compilation Group 2024, 2024). The model stretches along the whole coast of Mozambique (white domain in Fig. 2), covering 1 117 000 km2. We combine the tide and surge with dynamically modelled wave setup, calculated from a coupled SFINCS-SnapWave simulation. The 2D SFINCS-SnapWave model has a spatially-varying grid with a resolution of 400 m offshore to 50 m at the coast, covering an area of 5400 km2 (yellow domain in Fig. 2). The D-Flow FM output is generated around the 5 m depth contour within the SFINCS domain at a 10 min temporal resolution (Fig. S1). The wave setup output is also generated at a 10 min temporal resolution and saved at coastal transects. The wave setup is added to the D-Flow FM output at the same 5 m depth contour (Sect. S1.4).
2.2 Impact modelling
The fast impact assessment tool Delft-FIAT v0.3.2 (Wagenaar et al., 2017) is used to calculate direct flood damage by overlaying maximum flood depths with building footprints. The damage is calculated using the continental depth-damage curves for flooding and maximum potential damage per building type for Africa (Huizinga et al., 2017), similar to Eilander et al. (2023c) and Goulart et al. (2025). The currency of the maximum potential damage is in 2010 Euros, which is converted to 2019 US Dollars using a 2010 Euro-to-USD exchange rate of 1.327 and adjusted for inflation using a 2010-to-2019 USD rate of 1.172 (U.S. Bureau of Labor Statistics, 2025).
We use building footprints and type from OpenStreetMap (OSM; OpenStreetMap contributors, 2025) since it provides a recent and good coverage of the region, including rural areas and so-called informal settlements (Herfort et al., 2023; Wagenaar et al., 2018a; Zhou et al., 2022). The output is generated as total and relative damage (damaged fraction of the total asset value) per building, which is aggregated to cells of 0.025° and to the total compound flood domain.
2.3 Scenarios for attribution
2.3.1 Factual scenario
For the factual scenario, we make use of various datasets as meteorological and hydrodynamic forcing. The main meteorological forcing used is the ERA5 reanalysis dataset (Hersbach et al., 2020), available at hourly and daily temporal resolution and 0.25° (∼30 km) spatial resolution. ERA5 provides one of the best sources of globally complete and consistent historical climate data. The compound flood model SFINCS is forced with ERA5 hourly rainfall. The hydrological model wflow is forced with ERA5 daily (warm-up run) and hourly (event run) rainfall and temperature data. The wave model SnapWave is forced with ERA5 hourly wave conditions as the significant wave height, peak wave period and direction, at the offshore model boundary. Since ERA5 underestimates the intensity of TCs (Dullaart et al., 2020), we use best track data (IBTrACS; Gahtan et al., 2024; Knapp et al., 2010) in combination with the Holland parametric model (Holland, 2008; Holland et al., 2010) to define spatially-varying wind speed and pressure forcing fields for the D-Flow FM and SFINCS models. In addition to the meteorological forcing, the regional D-Flow FM model is forced with tidal boundary conditions derived from the Global Tides and Surge Model (GTSM) v4.1 (Wang et al., 2022).
2.3.2 Counterfactual scenarios
For the counterfactual scenario, we adjust the forcing of the factual scenario by removing plausible long-term climate trends. Climate change is affecting TCs in multiple ways, with varying levels of scientific agreement. We focus on changes in rainfall, maximum wind speed and sea level rise (SLR), since there is a clear scientific consensus about the role of climate change on these drivers (Knutson et al., 2020), to create conditional attribution statements for these robust aspects of climate change. For the counterfactual scenarios, we adjust each of these drivers by removing low, medium, and high plausible climate change trends to capture a range of uncertainty in the attribution assessment. We assess the effect of changes for the three flood drivers individually, the combined effect of the coastal flood drivers, and the effect of all drivers combined (Table 1). A complete description of the methodology that describes those changes is provided in Sect. S1.6. In line with storyline attribution, we constrain the TC track in all counterfactual scenarios, such that it is same to the one observed during the factual event (Feser and Shepherd, 2025; Mester et al., 2023; Strauss et al., 2021). We assume no change in non-flood drivers, such as exposure and vulnerability.
The plausible climate trend of TC rainfall, maximum wind speed and SLR is based on best available literature and global datasets. For the climate change effect on TC rainfall, some studies find that the trend is in line with the Clausius–Clapeyron relationship (7 %/°C of warming; Knutson et al., 2020), while other studies show trends higher than Clausius–Clapeyron (Guzman and Jiang, 2021; Liu et al., 2019a; Patricola and Wehner, 2018), referred to as super Clausius–Clapeyron (14 %/°C of warming), and lower due to enhanced cooling from slower TC translation speeds in a warmer climate (Tu et al., 2022). As Idai took place in a ∼1.1 °C warmer world, we adopt plausible reductions of rainfall of 4 %, 8 % and 16 % for low, medium and high counterfactual scenarios, respectively. For the climate change effect on TC maximum wind speeds, we use plausible reductions of 1%, 5% and 10 % for the low, medium and high counterfactual scenarios, respectively. The low and medium scenarios are based on the likely range of 1 %–5 % per °C of warming for the Southern Indian ocean from climate models (Knutson et al., 2020), and the high scenario of a 10 % wind speed reduction is based on regional trends from observed TCs (Mester et al., 2023). For the climate change effect on SLR, we use plausible reductions of 5, 10 and 15 cm for the low, medium and high counterfactual scenario, respectively. The medium scenario is based on the dataset by Treu et al. (2024), used to estimate the SLR between the time of the event and pre-industrial levels, and the low and high scenarios are based on uncertainty bounds from Strauss et al. (2021).
For all counterfactual scenarios, we assume that wave setup is the same as for the factual scenario. This simplification is made because our framework does not include a deep-water wave model, which would be required to generate a counterfactual scenario. For the case of TC Idai, we consider this a valid assumption given that waves are of limited importance for coastal flooding due to the shallow and gentle sloping coast that stimulates wave dissipation (van Dongeren et al., 2007).
2.3.3 Climate and impact attribution
The change in flood hazard and impact attributable to climate change is expressed following Eq. (1):
where A is the attributable change in %, F is the selected variable from the factual scenario and CF from the counterfactual scenario. The attributable change is conditional on the considered counterfactual flood drivers, and on the assumptions made in the model schematizations and input datasets.
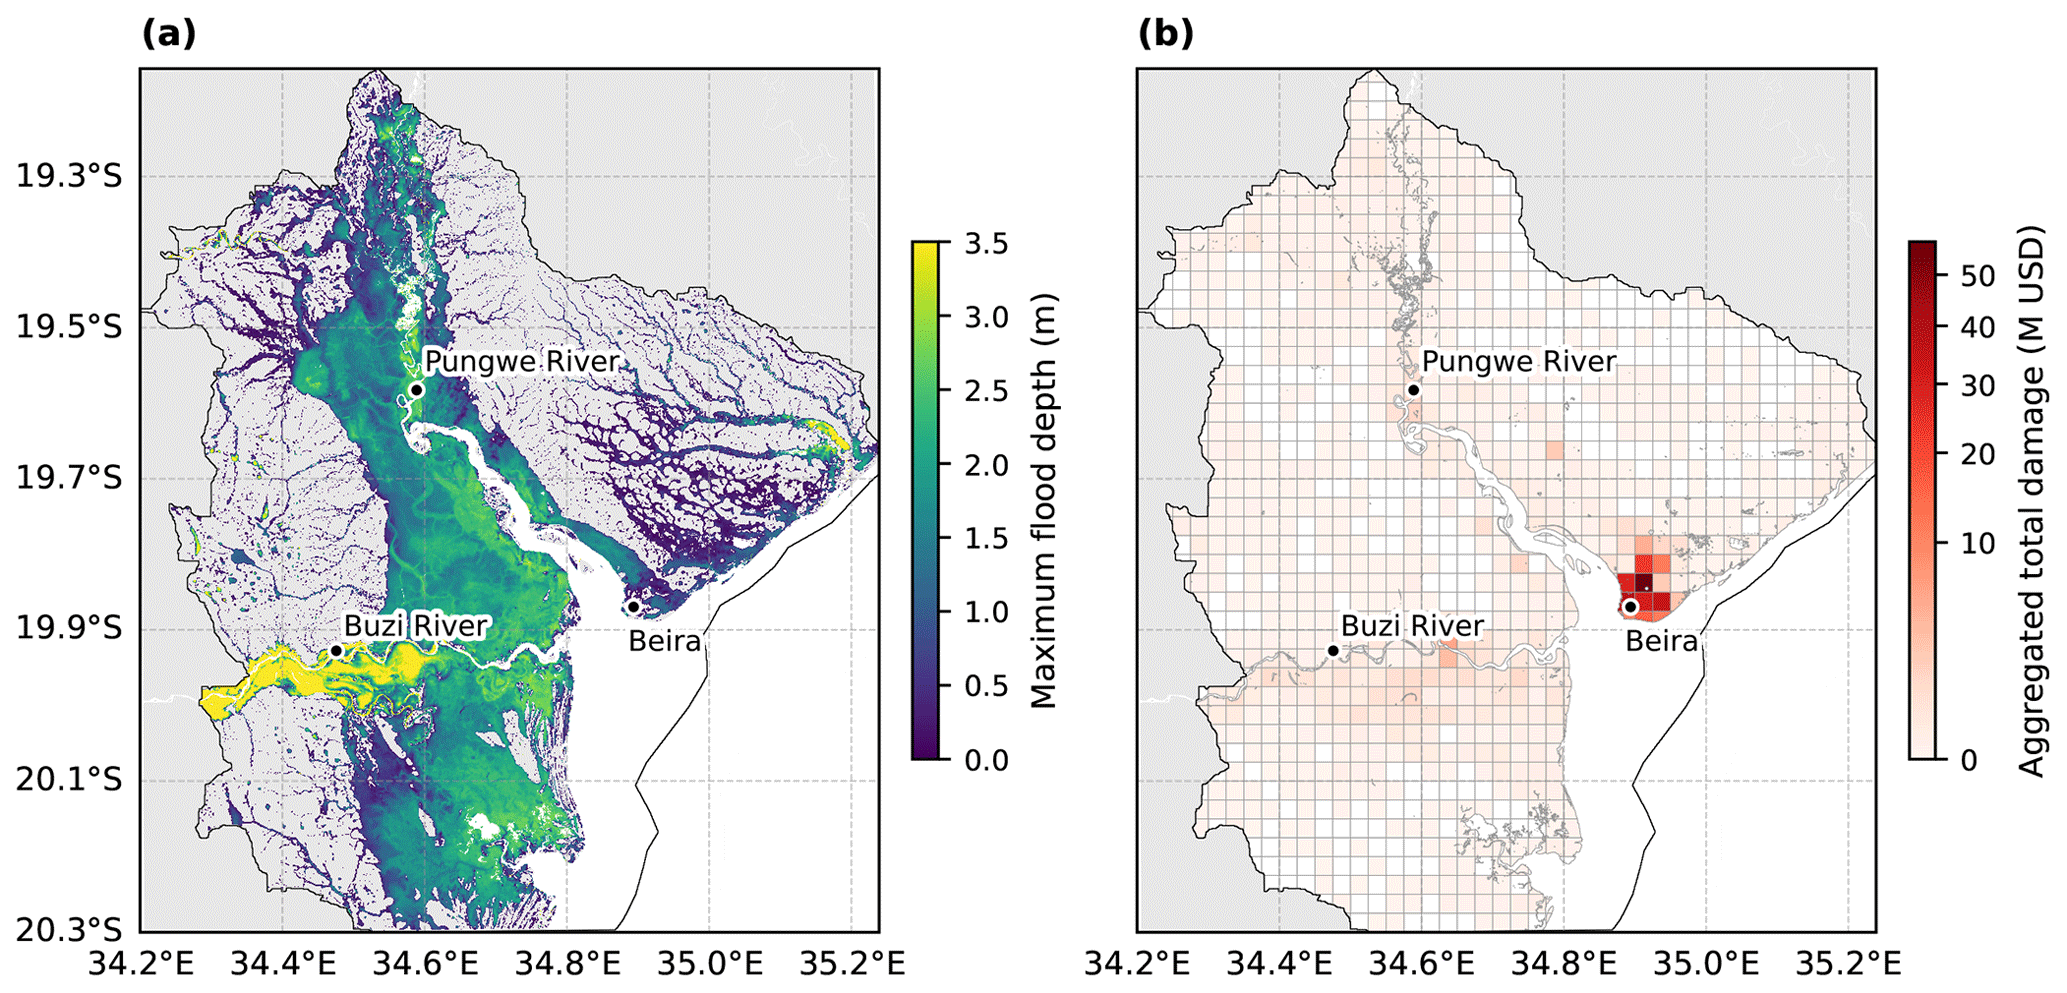
Figure 3Simulated maximum flood depths in m (a), and aggregated (0.025° grid cells) total damage in million (M) USD (b) due to flooding for the factual scenario of TC Idai. The compound flood model (SFINCS) domain is shown in black.
For the climate attribution assessment, the flood volume and flood extent of the factual and counterfactual scenarios are compared, similar to Grimley et al. (2024) and Mester et al. (2023). The flood extent is calculated by summing the cell area of all cells considered as flooded. The flood volume is calculated by multiplying the cell area of every flooded cell with its flood depth, and then summing the volume of all flooded grid cells to obtain the total flood volume. For the impact attribution assessment, the total damage from Delft-FIAT is calculated by summing the flood damage of all flooded buildings.
3.1 Description of the factual event
The compound flood modelling for the factual scenario indicates that TC Idai caused widespread flooding covering 3500 km2, affecting mostly the floodplains of the Buzi and Pungwe rivers, and the city of Beira (Fig. 3, left panel). Most of the flooding is driven by the extensive fluvial flooding from the Buzi and the Pungwe rivers, with peak discharges of 27 000 and 5000 m3 s−1, respectively, compared to 4000 and 2000 m3 s−1 under normal conditions (Table S1 in the Supplement). The extreme discharge in the Buzi river leads to flood depths of >3.5 m along the river banks. Local rainfall, which amounted to a mean of 420 mm accumulated during the time of the event over the study area, partially flooded the more elevated area northeast of Beira. The flooding in the city of Beira, however, is largely driven by coastal flooding as a result of coastal water levels up to 4.3 m m.s.l. (near Beira). Despite occurring close to neap tide, it exceeds water levels during normal high tide with about 0.6 m, and coincides with the peak rainfall (Fig. S11). The wave setup accounted for 10 % of the maximum total water level.
In total, 82 000 buildings are estimated to be flooded with damages adding up to USD 341 million. The flooding from TC Idai particularly impacts the city of Beira (Fig. 3, right panel). About 81 % of the total damage is situated in the Beira region. However, when considering relative damages (damaged fraction of the total asset value), the floodplains of the Buzi and the Pungwe rivers, and the most southern estuary, are more severely damaged (Fig. 6).
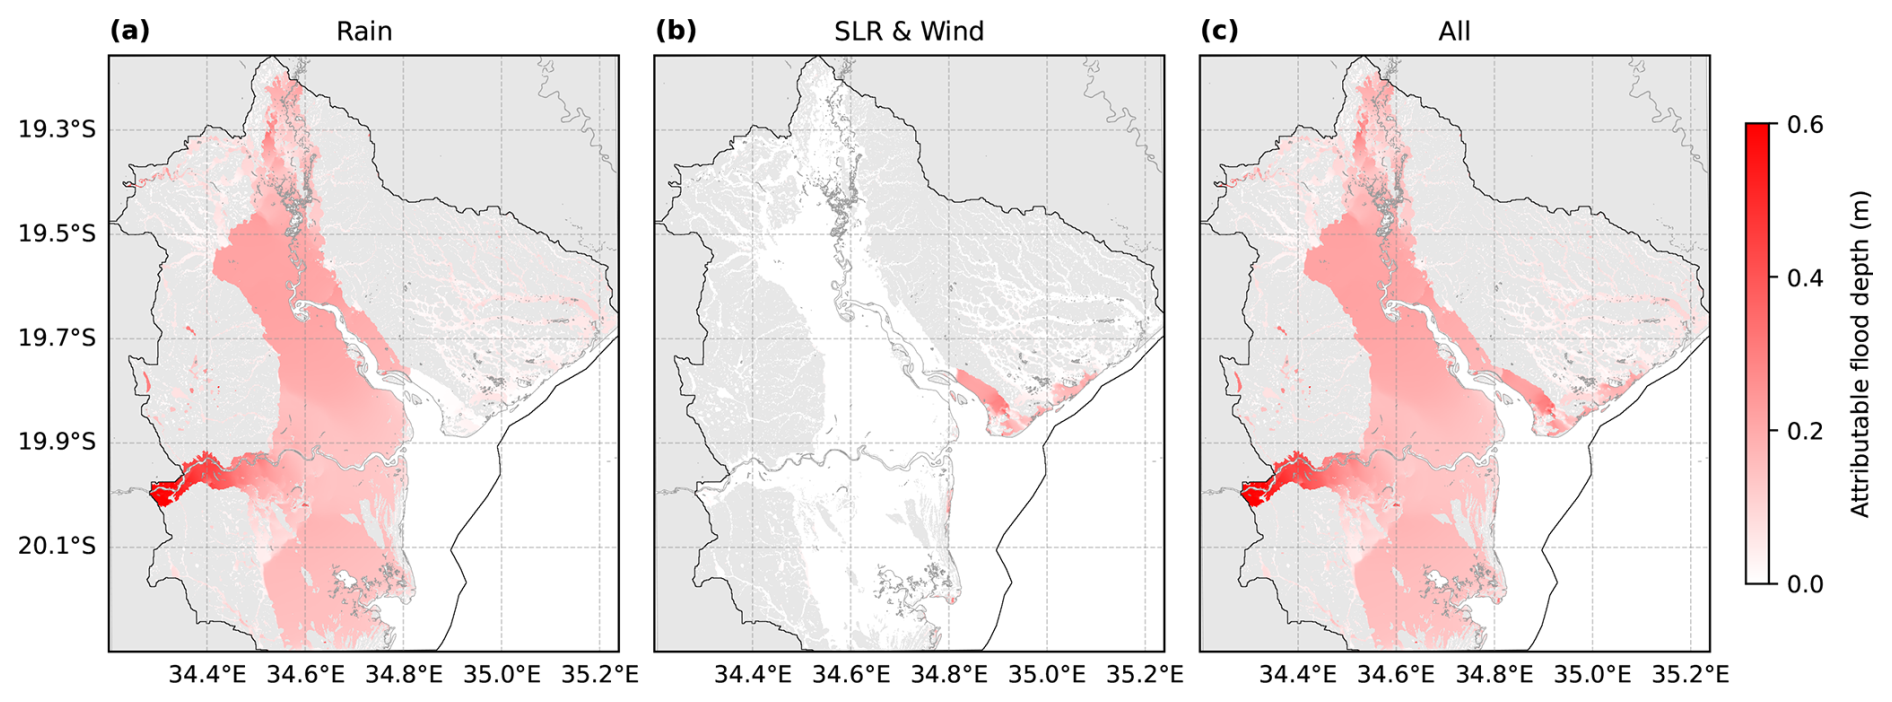
Figure 4The flood depth attributable to climate change (counterfactual medium scenario subtracted from factual scenario) for different flood drivers; rain (a), wind and SLR (b), and all drivers combined (c). The compound flood model (SFINCS) domain is shown in black and the outline of removed permanent water bodies is shown as grey lines.
3.2 Model validation
We compare the factual scenario against available observations and reported values in literature. Validating individual flood drivers is challenging due to lack of observations for rainfall and water levels during the event. For discharge, we compare against modelled Global Flood Awareness System (GloFAS) discharge data (Grimaldi et al., 2023; Joint Research Center and Copernicus Emergency Management Service, 2020; Zsoter et al., 2021), as recent observations for the region are lacking. This comparison shows that the simulated discharge for the two major rivers in the region (the Pungwe and Buzi) is uncertain and differs significantly between GloFAS data versions (v4.0 and v3.1; Figs. S5 and S6). For the period of TC Idai, the summed daily discharges simulated by GloFAS v4.0 (v3.1) differ −19 % (−10 %) and −51 % (29 %) from the summed wflow discharges resampled to a daily time step for the Buzi and the Pungwe, respectively (Table S2). The overestimated discharge could be explained by the higher spatial and temporal resolution of our wflow model compared to GloFAS data. During the flood event, the simulated discharge is in the same order of magnitude as calculated by Eilander et al. (2023a). The agreement between our results and GloFAS for the Buzi river is reasonable (KGE for comparison with GloFAS v4.0 (v3.1) is 0.42 (0.61) for the Buzi river; Fig. S6), although also here extremes are generally overestimated. For the Pungwe river, GloFAS discharge data varies significantly between versions, and this variability is also reflected in the comparison with our results (KGE for comparison with GloFAS v4.0 (v3.1) is 0.09 (0.75) for the Pungwe river; Fig. S6). Recent local observations are required to better determine the performance of the wflow model. No tide gauge stations are available but our simulated coastal water levels are consistent with Probst and Annunziato (2019) and Eilander et al. (2023a). Regarding the effect of coastal waves, Eilander et al. (2023a) estimate a wave setup of up to 24 % of the total water level, calculated using a simplified empirical approach that is known to overestimate wave setup (Leijnse et al., 2025), compared to our estimate of 10 % wave setup resulting from dynamic wave modelling.
The maximum flood extent is validated against two satellite products, which show reasonable agreement (hit rate >76 %), but also considerable uncertainty in flood detection (Sect. S1.5). Our maximum flood extent is consistent with Mester et al. (2023) and Eilander et al. (2023a), although compared to the latter our results indicate more extensive coastal flooding in the Beira region. This can be explained by the higher-resolution regional coastal models of our modelling setup, which results in higher coastal boundary conditions (Benito et al., 2025).
With regards to the flood damage, the Government of Mozambique (2019) estimated the total housing damages at USD 410 million for the Sofala, Manica, Tete and Zambezia provinces in Mozambique. Our estimated damage of USD 341 million only includes the most heavily impacted Sofala province and is thus in agreement with reported damages.
3.3 Climate and impact attribution
3.3.1 Climate attribution
The increase in flood volume that can be attributed to climate change when comparing against the medium counterfactual scenario (low–high counterfactual scenario) for all flood drivers is 10 % (5 %–19 %), corresponding to an increase of 500 M m3 (250–1000 M m3; Table 2). The increase in flood extent that can be attributed to climate change is 2 % (1 %–5 %), corresponding to an increase of 80 km2 (40–170 km2). The difference between change in flood volume and flood extent can be related to the region's topography, where higher elevated areas inhibit the extension of the flooded area. The climate change-increased rainfall leads to the largest increase in flooding (Fig. 4), with an increase of 9 % (5 %–19 %) in flood volume and 2 % (1 %–4 %) in flood extent. The climate change-increased wind speed and SLR lead to a less than 1 % increase in flood volume (0.2 %–0.8 %) and in flood extent (0.1 %–0.6 %). Still, changes in wind and SLR intensify the coastal flooding by elevating the coastal water levels, which primarily affects the Beira region, covering 230 km2 for the medium counterfactual scenario. This is in contrast to the climate change-increased rainfall, which intensifies river flooding across most of the floodplain, covering 3300 km2. The intensified river flooding affects the floodplains of the Buzi river the most, with an increase in flood depth of >0.4 m. The increase in coastal flooding results in flood depths of >0.2 m. Our results show that the counterfactual adjustment of individual flood drivers exhibits minimal compounding effects in flood volume and flood extent due to the relatively small effect of climate change-increased wind and SLR.
Table 2The absolute and relative change in flood volume, flood extent and flood damage for factual (absolute values only) and medium counterfactual scenarios (low–high counterfactual scenarios in parentheses). The relative change in flooding and impact that is attributable to climate change is calculated by applying Eq. (1). Decimals are presented for values below 1.
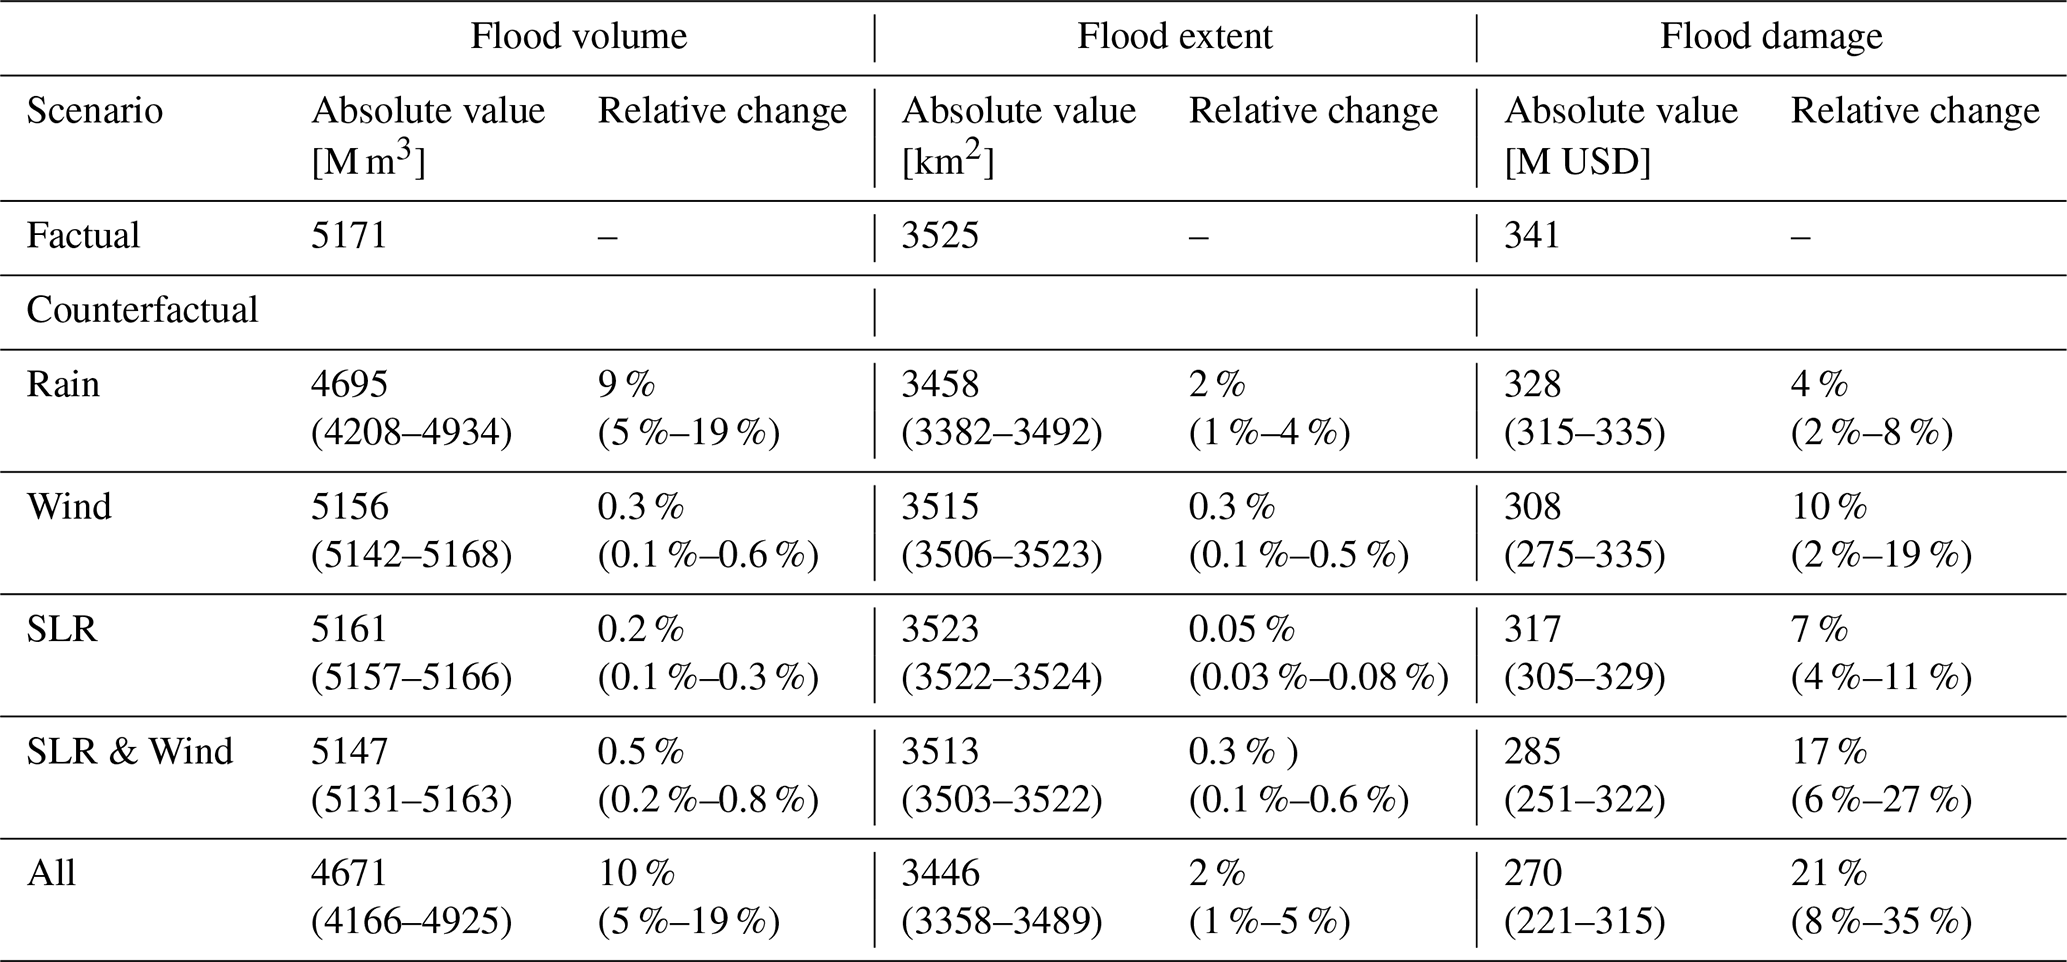
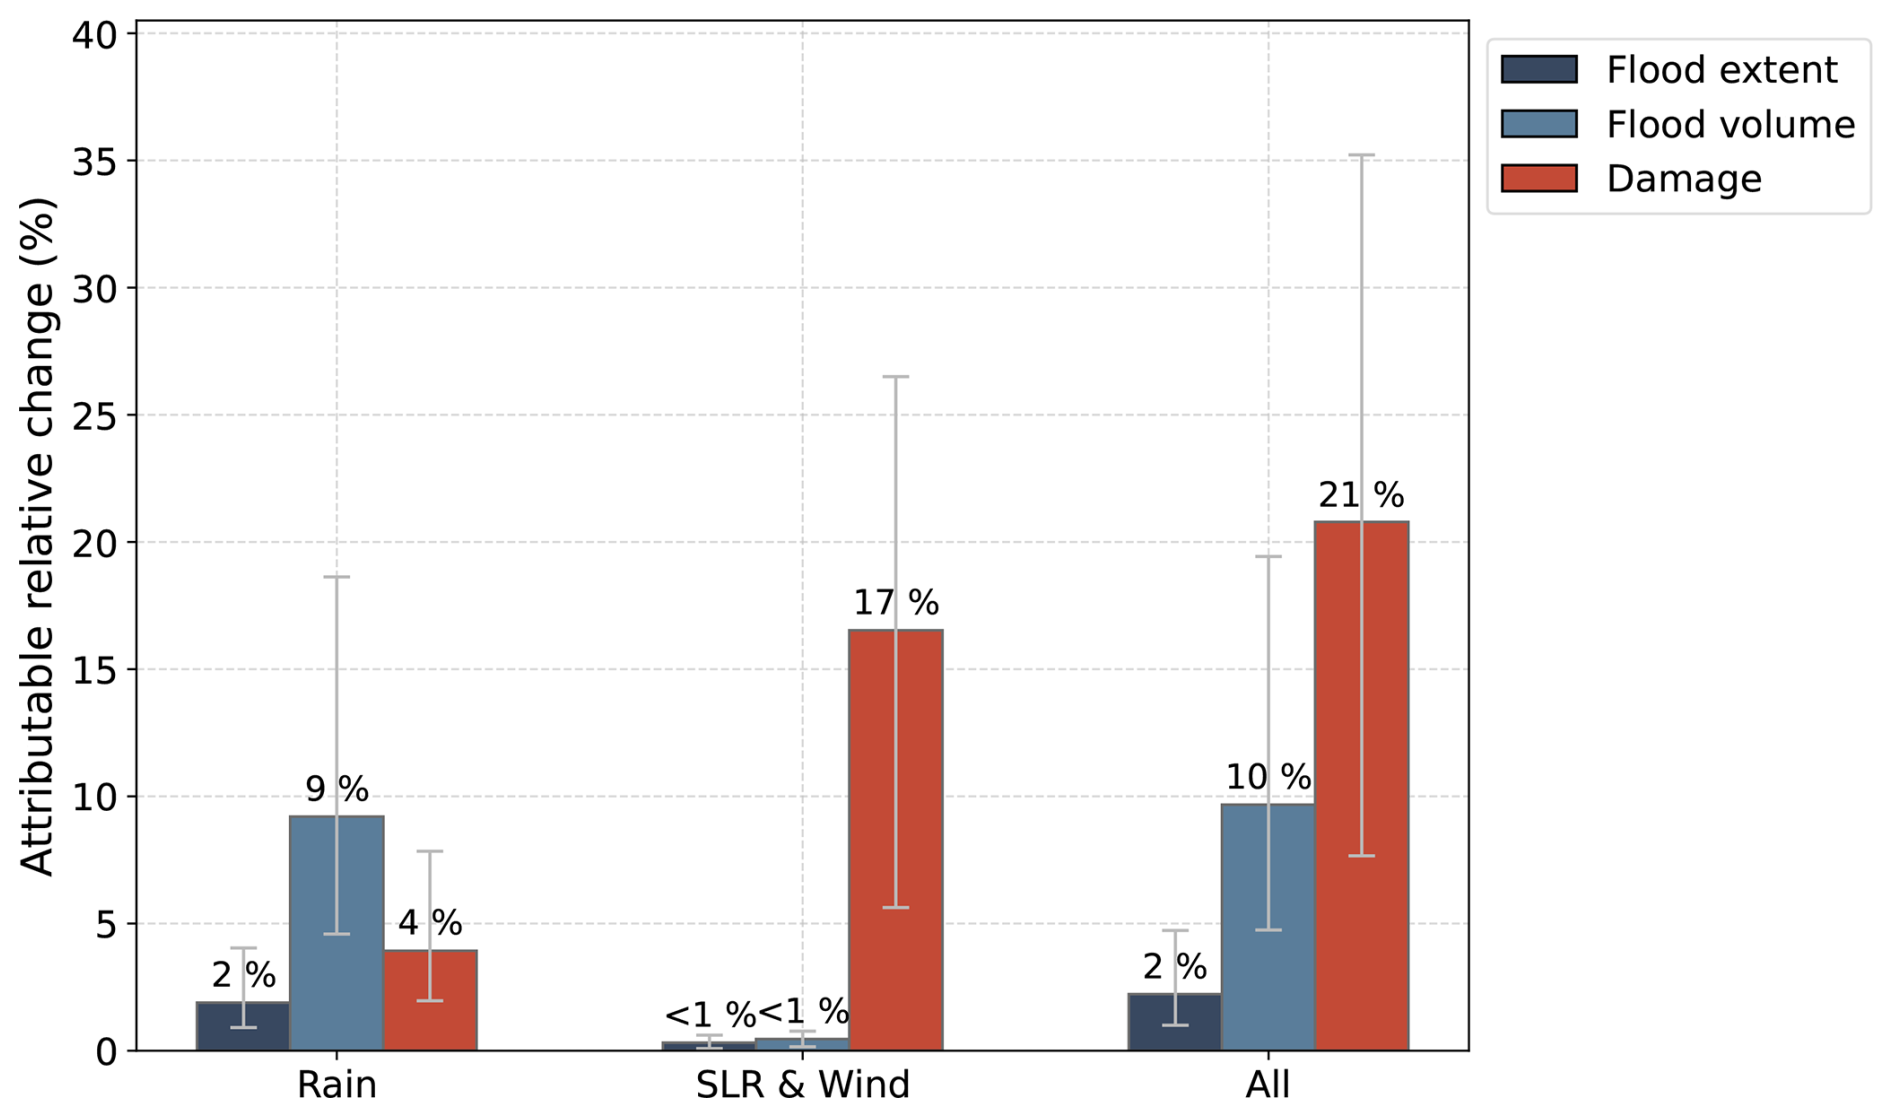
Figure 5The relative change in flood extent (dark blue), flood volume (light blue), and flood damage (red) due to climate change, driven by different flood drivers where “All” includes SLR, wind and rain. The bars present the medium counterfactual scenario, and the error bars present the low and high counterfactual scenarios. The relative change in flooding and impact is calculated by applying Eq. (1) (Sect. 2.3.3).
3.3.2 Impact attribution
Comparing the factual and medium counterfactual scenario (low–high counterfactual scenario) for all flood drivers shows that 21 % (8 %–35 %) of the flood damage, corresponding to USD 70 M (USD 30–120 M), can be attributed to climate change, resulting in 7000 (3000–13 000) more buildings damaged. Climate change-increased wind speed and SLR lead to the largest increase in damage of 17 % (6 %–27 %), whereas climate change-increased rainfall leads to an increase of 4 % (2 %–8 %; Table 2). Even though changes in SLR and wind are negligible in terms of changes in flood volume and flood extent, these drivers have a larger impact on flood damage than changes in rainfall (Fig. 5). The relative change in impact is larger than the relative change in flooding, except for the rain-only scenario. Increased wind and SLR intensify coastal flooding, which is the main driver of damage in Beira, where total damages are concentrated due to the high density of buildings (Figs. 3, S12). When adjusting wind and SLR individually, wind emerges as a more significant driver of flood damage than SLR (Table 2). Since wind and SLR both elevate coastal water levels, impacting the same coastal region, their individual impacts on damage are not additive; increases in flood depth translate non-linearly to damage due to the applied damage curves. In this case, there is a limited (<1 %) compounding effect of attributing all flood drivers combined, as the minimal interaction of the intensified flood drivers translates non-linearly to higher flood damage. Changes in all drivers combined lead to the largest increase in flood damage. Our results show that propagating the effects of climate change from hazard to impact influences the attribution assessment. The location of climate change-increased flooding is crucial in determining impacts, highlighting the role of exposure and vulnerability.
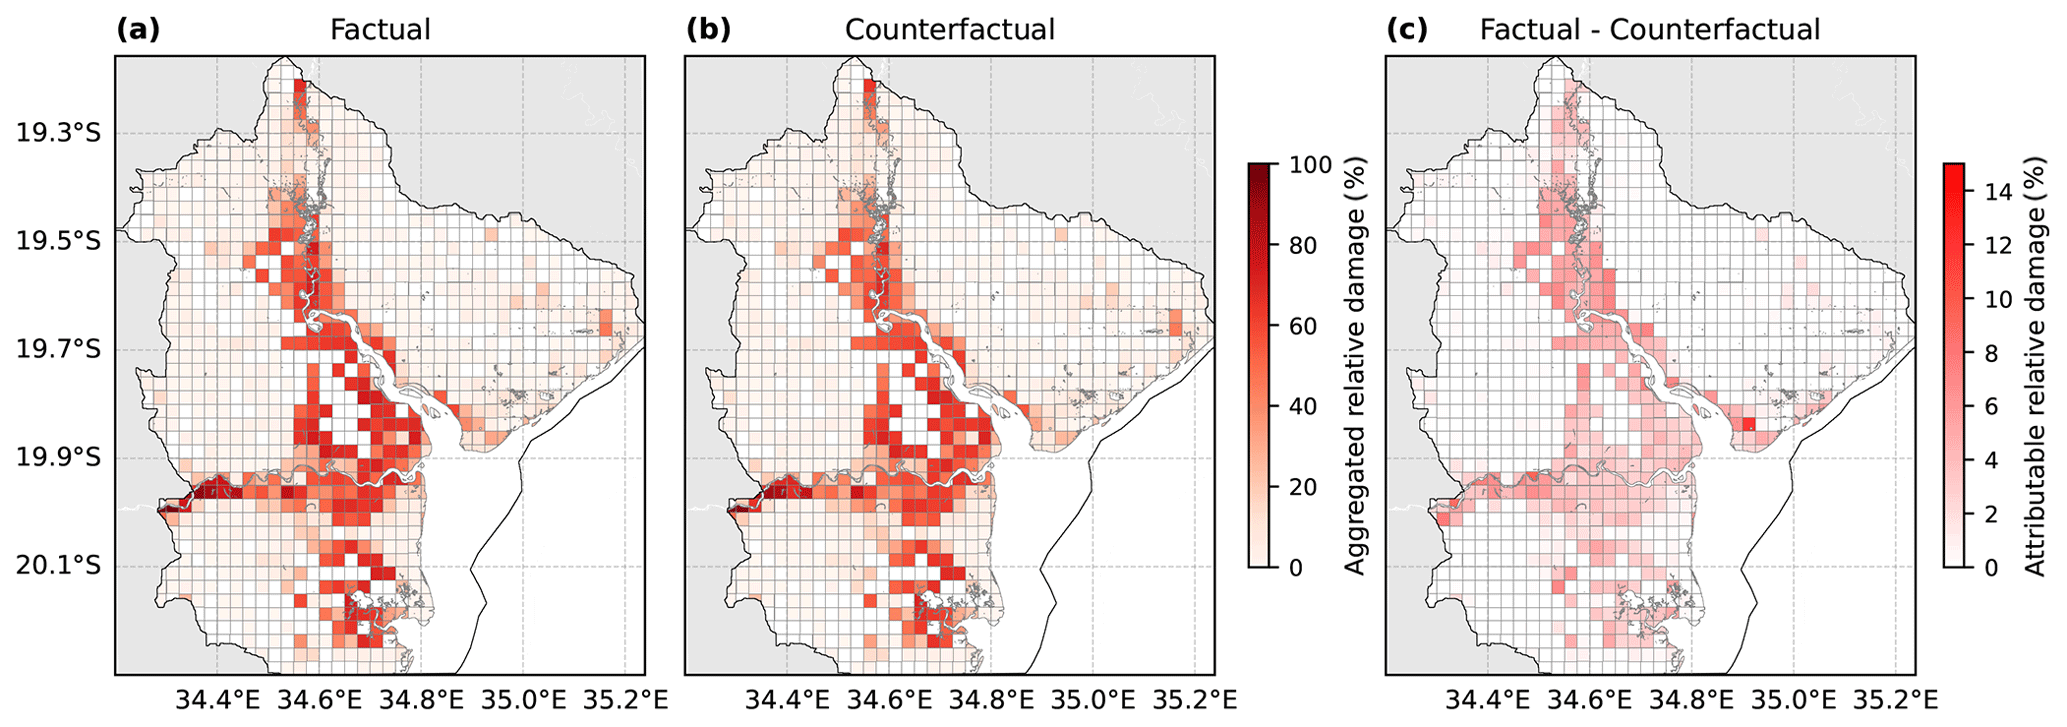
Figure 6The aggregated (0.025° grid cells) relative damage (damaged fraction of total asset value) for the factual (a) and medium counterfactual (b) scenarios with all drivers combined, and the absolute difference (factual – medium counterfactual scenario) attributable to climate change (c). The compound flood model (SFINCS) domain is shown in black.
Relative damage, i.e. damaged fraction of the total asset value, provides another perspective on the impacts of climate change. While Beira appears as a hotspot for total damage attributable to climate change (Fig. S12); when considering relative damages, areas across the floodplains become more prominent (Fig. 6). When focussing on relative damage, increased rainfall is the most important driver of additional damage compared to wind and SLR. Only looking at aggregated urban areas that are usually the hotspot of capital, and therefore more likely of total damage, provides a biased view on the impacts of climate change. Within urban areas, the compounding impacts of TC Idai have been found to increase inequality and highlight the need for local studies considering how the impact and response is distributed (Williamson et al., 2023).
In this paper, we present a storyline attribution framework with a state-of-the-art modelling chain for TC compound flooding. To our knowledge, this is the first framework resolving all TC flood drivers (local rainfall, discharge, tides, storm surge and wave setup) using physics-based models and attributing the corresponding flooding to climate change. This framework provides an estimate of compound flooding from TC Idai using global data in line with observations and reported values in literature, and is applied for both climate and impact attribution assessments. In the case of compound flooding from TC Idai, increased amounts of rainfall led to the largest increase in flood volume and flood extent, which can be explained by the flooding being largely driven by the high river discharges (Eilander et al., 2023a). On the other hand, increased coastal flooding due to intensified wind speeds and SLR resulted in the largest increase in total damage, concentrated in the coastal areas. The coastal areas are most densely inhabited, especially the coastal city of Beira, which explains the large effect of intensified wind speeds and SLR on impacts despite the relatively small increase in flood depth, emphasizing the importance of accounting for exposure and vulnerability. When reporting changes in relative damage, however, all flood drivers contribute significantly because buildings outside of Beira are also substantially damaged but have a lower total asset value.
Our results show that propagating the effects of climate change from hazard to impact influences the attribution assessment. Firstly, focussing on a single flood driver may misrepresent the total effect of climate change on the event. In addition, treating compound drivers independently may provide incomplete and incorrect attribution statements, underestimating the impact of climate change (Perkins-Kirkpatrick et al., 2024). For compound flooding, it is important to consider the dynamic interactions of the multiple flood drivers (Green et al., 2025). The relative contribution of compound processes in TC-induced flooding is found to become even more important in future climates (Grimley et al., 2024). Secondly, climate attribution results in different statements about the effect of climate change than impact attribution, which is explained by the non-linear relationship between flood hazard and damage (Huizinga et al., 2017; Pistrika et al., 2014). As a result, we highlight the importance of explicitly specifying the metrics used when making attribution statements. We also demonstrate the value of including both climate and impact attribution assessments for describing the impacts of climate change. Together, they provide comprehensive information to inform risk management and adaptation strategies (Carlson et al., 2024; Clarke et al., 2023; Coumou et al., 2024).
Our attribution framework is applicable to TC events anywhere on Earth and could easily be extended to other type of flood events. Since the framework solely requires global datasets and open-source software, it has great potential to address the attribution gap and analyse climate impact on flood events in underrepresented, data-poor, yet severely impacted and highly vulnerable regions. This study highlights once again the value and need for observations to improve and validate model results, such as in situ rain and tide gauges (Mekonnen et al., 2023). For areas without sufficient recent and local observations, providing robust attribution statements remains challenging due to limited opportunities for model validation, especially for high-impact low-likelihood events. In such contexts, storyline attribution assessments that consider plausible what-if scenarios can still provide highly informative insights (Sillmann et al., 2021). Multi-method attribution assessments could provide more confidence in the attribution assessment (Barriopedro et al., 2025; Thompson et al., 2025). Echoing e.g. Eilander et al. (2023a) and Samadi et al. (2025), establishing high-quality observations should remain a priority for more accurate assessments in data-scarce regions and for providing more localized information on climate change impacts.
Our framework is built on simplified and uniform assumptions on the effect of climate change on TC rainfall and wind speed. The counterfactual rainfall is homogenously scaled according to plausible climate trends but neglects any TC specific estimates and changes in spatio-temporal patterns (Deng et al., 2025; Kim et al., 2022; Liu et al., 2019b). The same applies to the counterfactual scenarios of maximum wind speed, where a simplified scaling of the maximum wind speed with reductions of 1 %–10 % neglects the complex dynamics of TCs (Knutson et al., 2020). The development of the counterfactual scenarios in this storyline attribution framework could be improved by further refining climate change trends in flood drivers, for example based on observed regional changes rather than global estimates. Moreover, we could evaluate the effect of climate change on additional flood drivers possibly increasing coastal flooding, such as change in TC size (Yamada et al., 2017), translation speed (Knutson et al., 2020; Seneviratne et al., 2021) and significant wave height (Thompson et al., 2021), while still conditioning on the TC track. As demonstrated by Dullaart et al. (2024) and Grimley et al. (2024), it is also possible to develop storyline approaches where the counterfactual is informed by TC statistics from pseudo global warming simulations. A promising but still developing method to construct comprehensive TC counterfactuals is the use of climate storyline simulations (Athanase et al., 2024b; Feser and Shepherd, 2025; Sánchez-Benítez et al., 2022). These simulations are nudged towards observed dynamics and can compare counterfactual realisations of near-real-time events. This method has been proven successful for mid- and high-latitude storms but is thus far limited for TCs due to the stronger role of convective processes (Athanase et al., 2024a; Goulart et al., 2024; Schubert-Frisius et al., 2017).
Our impact attribution is based on the calculation of damages to buildings using a simple but commonly used relationship between flood depth and damage, which is a major source of uncertainty. This method could be improved using multivariate depth damage curves that account for local characteristics of building types (Strauss et al., 2021) and other variables than flood depth influencing flood hazard such as duration, velocity, salinity or contamination (Adeke and Mugume, 2025; Delgado et al., 2016; Thieken et al., 2005). Impact attribution could be improved by including additional metrics of direct impacts, such as the displaced population (Mester et al., 2023); multi-hazard impacts, such as combined wind and flood damage (Wagenaar et al., 2018b); and indirect impacts, such as loss of livelihood options (Nhundu et al., 2021). Additionally, including dynamic changes in exposure and vulnerability, next to changes in the hazard, can improve our assessment of flood impact drivers. For example, the rising exposure and vulnerability in sub-Saharan Africa are found to increase damages from river flooding (Sauer et al., 2021). Such changes in exposure and vulnerability can be induced by climate change, but also by non-climatic drivers (Hope et al., 2022) such as land use change, urbanisation, or population growth (Paprotny et al., 2025; Rentschler et al., 2023; Rogers et al., 2025; Rogger et al., 2017). Lastly, total and relative damage provide different but incomplete perspectives on climate change impacts and we therefore recommend impact attribution to provide population differentiated assessments reflecting socio-spatial characteristics, such as age, gender and poverty (Puig et al., 2025). Differentiated assessments require a thorough understanding of the impacted population; studying population characteristics and their intersectionality as well as their response to different impact metrics. Such assessment can inform equitable and just adaptation measures to improve local resilience at the risks of climate change (Kind et al., 2017).
Our study advances climate and impact attribution of compound flooding from TCs by providing a framework that physically resolves multiple flood drivers (rainfall, river discharge, tide, surge and waves) using a state-of-the-art modelling chain. Our framework was applied to TC Idai, that devastated Mozambique in March 2019, and was shown to accurately reproduce compound flooding. We demonstrate that considering multiple flood drivers enables a comprehensive view on the impacts of climate change. For the case of TC Idai, we find that propagating the effects of climate change from hazard to impact affects the outcome of an attribution assessment, due to the non-linear relationship between flood hazard and damages. The conditional attribution assessment shows that 5 %–19 % of the flood volume, 1 %–5 % of the flood extent, and 8 %–35 % of the flood damages can be attributed to climate change. The amplification from change in hazard to impact can be linked to the majority of the damages occurring near the city of Beira, where coastal flooding was increased by the intensification of wind speeds and by sea level rise. Our framework is applicable for TC-prone regions across the globe, including data-scarce but highly impacted and vulnerable regions, potentially contributing to addressing the attribution gap.
Our storyline attribution framework improves the description of how plausible climate trends in TC flood drivers translate from hazard to impacts, which is relevant for anticipating further climate risks. Including the local context through the propagation to impact for specific extreme events has the potential to improve awareness by aligning closely with the lived experience of society. Our findings are sensitive to the applied impact metrics and simplified assumptions of the climate change effect on TC-induced flood drivers. Uncertainties in factual and counterfactual forcing persist in regions with a lack of long-term good quality observations, and stresses the ongoing priority for more observations and thorough uncertainty analyses. In the light of ongoing and intensifying climate change, we recommend research efforts to focus on extending climate to impact attribution for other highly impacted and vulnerable areas, and different type of compound events.
The scripts and data used to set up the experiments in this study are available from Zenodo at https://doi.org/10.5281/zenodo.17107289 (Vertegaal et al., 2025).
The supplement related to this article is available online at https://doi.org/10.5194/nhess-26-1417-2026-supplement.
DV, BvdH, AC, and SM conceived the idea for this study, jointly designed the experiments, and interpreted initial results. DV executed the experiments and set up the SFINCS, wflow and D-Flow FM models with help from NA, TB, and AC; NA helped with testing and setting up the D-Flow FM model; TB and AC helped with testing and setting up the wflow and SFINCS models; DV set up the Delft-FIAT model. FG and TL provided the necessary SnapWave simulations. DV conducted the computational processing and analysis of results with input from HMG and AC. DV wrote the manuscript with input from BvdH, AC, HMG, and SM.
The contact author has declared that none of the authors has any competing interests.
Publisher's note: Copernicus Publications remains neutral with regard to jurisdictional claims made in the text, published maps, institutional affiliations, or any other geographical representation in this paper. The authors bear the ultimate responsibility for providing appropriate place names. Views expressed in the text are those of the authors and do not necessarily reflect the views of the publisher.
We would like to thank Albrecht Weerts for support with the wflow simulations, Jelmer Veenstra for support on the counterfactual SLR integration in the D-Flow FM model, and Brendan Dalmijn and Sarah Rautenbach for support with Delft-FIAT and HydroMT-FIAT. We also thank Dirk Eilander and Nadia Bloemendaal for their input during the initial discussions of this work. We thank OpenAI's ChatGPT and GitHub Copilot for assistance with coding, and for suggestions on phrasing and text clarity during the preparation of this work.
This research has been supported by the European Commission, Horizon Europe Framework Programme (grant no. 101135481).
This paper was edited by Olga Petrucci and reviewed by three anonymous referees.
Adeke, D. P. and Mugume, S. N.: A methodology for development of flood-depth-velocity damage functions for improved estimation of pluvial flood risk in cities, J. Hydrol., 653, 132736, https://doi.org/10.1016/J.JHYDROL.2025.132736, 2025.
Athanase, M., Sánchez-Benítez, A., Monfort, E., Jung, T., and Goessling, H. F.: How climate change intensified storm Boris' extreme rainfall, revealed by near-real-time storylines, Commun. Earth Environ., 5, 676, https://doi.org/10.1038/s43247-024-01847-0, 2024a.
Athanase, M., Sánchez-Benítez, A., Goessling, H. F., Pithan, F., and Jung, T.: Projected amplification of summer marine heatwaves in a warming Northeast Pacific Ocean, Commun. Earth Environ., 5, 53, https://doi.org/10.1038/s43247-024-01212-1, 2024b.
Barriopedro, D., Jiménez-Esteve, B., Collazo, S., Garrido-Perez, J. M., Johnson, J. E., and García-Herrera, R.: A Multimethod Attribution Analysis of Spain's 2024 Extreme Precipitation Event, B. Am. Meteor. Soc., 106, E2440–E2460, https://doi.org/10.1175/BAMS-D-25-0049.1, 2025.
Benito, I., Aerts, J. C. J. H., Eilander, D., Ward, P. J., and Muis, S.: Stochastic coastal flood risk modelling for the east coast of Africa, npj Natural Hazards, 1, 10, https://doi.org/10.1038/s44304-024-00010-1, 2024.
Benito, I., Aerts, J. C. J. H., Ward, P. J., Eilander, D., and Muis, S.: A multiscale modelling framework of coastal flooding events for global to local flood hazard assessments, Nat. Hazards Earth Syst. Sci., 25, 2287–2315, https://doi.org/10.5194/nhess-25-2287-2025, 2025.
Bourdin, S., Camargo, S. J., Lee, C. Y., Lin, J., Vrac, M., Vaittinada Ayar, P., and Faranda, D.: Improving analogues-based detection & attribution approaches for hurricanes, Environ. Res. Lett., 20, 024042, https://doi.org/10.1088/1748-9326/ADAA8D, 2025.
Buchhorn, M., Smets, B., Bertels, L., De Roo, B., Lesiv, M., Tsendbazar, N. E., Linlin, L., and Tarko, A.: Copernicus Global Land Service: Land Cover 100m: Version 3 Globe 2015-2019: Product User Manual (Dataset v3.0, doc issue 3.3, Zenodo, https://doi.org/10.5281/zenodo.3938963, 2020.
Callaghan, M., Schleussner, C. F., Nath, S., Lejeune, Q., Knutson, T. R., Reichstein, M., Hansen, G., Theokritoff, E., Andrijevic, M., Brecha, R. J., Hegarty, M., Jones, C., Lee, K., Lucas, A., van Maanen, N., Menke, I., Pfleiderer, P., Yesil, B., and Minx, J. C.: Machine-learning-based evidence and attribution mapping of 100,000 climate impact studies, Nat. Clim. Change, 11, 966–972, https://doi.org/10.1038/s41558-021-01168-6, 2021.
Camargo, S. J., Murakami, H., Bloemendaal, N., Chand, S. S., Deshpande, M. S., Dominguez-Sarmiento, C., González-Alemán, J. J., Knutson, T. R., Lin, I. I., Moon, I. J., Patricola, C. M., Reed, K. A., Roberts, M. J., Scoccimarro, E., Tam, C. Y., Wallace, E. J., Wu, L., Yamada, Y., Zhang, W., and Zhao, H.: An update on the influence of natural climate variability and anthropogenic climate change on tropical cyclones, Tropical Cyclone Research and Review, 12, 216–239, https://doi.org/10.1016/J.TCRR.2023.10.001, 2023.
Carlson, C. J., Mitchell, D., Carleton, T., Chersich, M., Gibb, R., Lavelle, T., Lukas-Sithole, M., North, M., Lippi, C., New, M., Ryan, S. J., Shumba, S., and Trisos, C.: Designing and describing climate change impact attribution studies: a guide to common approaches, EarthArXiv, https://doi.org/10.31223/X5CD7M, 2024.
Clarke, B., Otto, F., and Jones, R.: When don't we need a new extreme event attribution study?, Clim. Change, 176, 60, https://doi.org/10.1007/S10584-023-03521-4, 2023.
Coumou, D., Arias, P. A., Bastos, A., Gonzales, C. K. G., Hegerl, G. C., Hope, P., Jack, C., Otto, F., Saeed, F., Serdeczny, O., Shepherd, T. G., and Vautard, R.: How can event attribution science underpin financial decisions on Loss and Damage?, PNAS Nexus, 3, 277, https://doi.org/10.1093/PNASNEXUS/PGAE277, 2024.
Davenport, F. V, Burke, M., and Diffenbaugh, N. S.: Contribution of historical precipitation change to US flood damages, P. Natl. Acad. Sci. USA, 118, e2017524118, https://doi.org/10.1073/pnas.2017524118, 2021.
Delgado, J. M. P. Q., Guimarães, A. S., De Freitas, V. P., Antepara, I., Kočí, V., and Černý, R.: Salt Damage and Rising Damp Treatment in Building Structures, Adv. Mater. Sci. Eng., 2016, 1280894, https://doi.org/10.1155/2016/1280894, 2016.
Deltares: HydroMT-FIAT: Automated and reproducible Delft-FIAT model building, https://github.com/Deltares/hydromt_fiat/releases/tag/v0.5.7 (last access: 11 September 2025), 3 September 2025.
Deng, E., Xiang, Q., Chan, J. C. L., Dong, Y., Tu, S., Chan, P. W., and Ni, Y. Q.: Increasing temporal stability of global tropical cyclone precipitation, NPJ Clim. Atmos. Sci., 8, 11, https://doi.org/10.1038/s41612-025-00896-2, 2025.
Dullaart, J. C. M., Muis, S., Bloemendaal, N., and Aerts, J. C. J. H.: Advancing global storm surge modelling using the new ERA5 climate reanalysis, Clim. Dynam., 54, 1007–1021, https://doi.org/10.1007/S00382-019-05044-0, 2020.
Dullaart, J. C. M., de Vries, H., Bloemendaal, N., Aerts, J. C. J. H., and Muis, S.: Improving our understanding of future tropical cyclone intensities in the Caribbean using a high-resolution regional climate model, Sci. Rep., 14, 6108, https://doi.org/10.1038/s41598-023-49685-y, 2024.
Eilander, D., Couasnon, A., Leijnse, T., Ikeuchi, H., Yamazaki, D., Muis, S., Dullaart, J., Haag, A., Winsemius, H. C., and Ward, P. J.: A globally applicable framework for compound flood hazard modeling, Nat. Hazards Earth Syst. Sci., 23, 823–846, https://doi.org/10.5194/nhess-23-823-2023, 2023a.
Eilander, D., Boisgontier, H., Bouaziz, L. J. e., Buitink, J., Couasnon, A., Dalmijn, B., Hegnauer, M., de Jong, T., Loos, S., Marth, I., and Verseveld, W. van: HydroMT: Automated and reproducible model building and analysis, J. Open Source Softw., 8, 4897, https://doi.org/10.21105/JOSS.04897, 2023b.
Eilander, D., Couasnon, A., Sperna Weiland, F. C., Ligtvoet, W., Bouwman, A., Winsemius, H. C., and Ward, P. J.: Modeling compound flood risk and risk reduction using a globally applicable framework: a pilot in the Sofala province of Mozambique, Nat. Hazards Earth Syst. Sci., 23, 2251–2272, https://doi.org/10.5194/nhess-23-2251-2023, 2023c.
Eilander, D., de Goede, R., Leijnse, T., van Ormondt, M., Nederhoff, K., and Winsemius, H. C.: HydroMT-SFINCS, Zenodo, https://doi.org/10.5281/zenodo.13693006, 2024.
Eilander, D., Boisgontier, H., van Verseveld, W., Bouaziz, L., Hegnauer, M., Buitink, J., and Dalmijn, B.: hydroMT-wflow, Zenodo, https://doi.org/10.5281/zenodo.15182718, 2025.
Faranda, D., Bourdin, S., Ginesta, M., Krouma, M., Noyelle, R., Pons, F., Yiou, P., and Messori, G.: A climate-change attribution retrospective of some impactful weather extremes of 2021, Weather Clim. Dynam., 3, 1311–1340, https://doi.org/10.5194/wcd-3-1311-2022, 2022.
Feser, F. and Shepherd, T. G.: The concept of spectrally nudged storylines for extreme event attribution, Commun. Earth Environ., 6, 677, https://doi.org/10.1038/s43247-025-02659-6, 2025.
Frame, D. J., Wehner, M. F., Noy, I., and Rosier, S. M.: The economic costs of Hurricane Harvey attributable to climate change, Clim. Change, 160, 271–281, https://doi.org/10.1007/S10584-020-02692-8, 2020.
Gahtan, J. , Knapp, K. R., Schreck, C. J., Diamond, H. J., Kossin, J. P., and Kruk, M. C.: International Best Track Archive for Climate Stewardship (IBTrACS) Project, Version 4r01, ALL, NOAA National Centers for Environmental Information, https://doi.org/10.25921/82ty-9e16, 2024.
GEBCO Bathymetric Compilation Group 2024: GEBCO 2024 Grid – a continuous terrain model of the global oceans and land, NERC EDS British Oceanographic Data Centre, NOC, https://doi.org/10.5285/1c44ce99-0a0d-5f4f-e063-7086abc0ea0f, 2024.
Goulart, H. M. D., Benito Lazaro, I., van Garderen, L., van der Wiel, K., Le Bars, D., Koks, E., and van den Hurk, B.: Compound flood impacts from Hurricane Sandy on New York City in climate-driven storylines, Nat. Hazards Earth Syst. Sci., 24, 29–45, https://doi.org/10.5194/nhess-24-29-2024, 2024.
Goulart, H. M. D., Athanasiou, P., van Ginkel, K., van der Wiel, K., Winter, G., Pinto, I., and van den Hurk, B.: Exploring coastal climate adaptation through storylines: Insights from cyclone Idai in Beira, Mozambique, Cell Reports Sustainability, 2, 100270, https://doi.org/10.1016/J.CRSUS.2024.100270, 2025.
Government of Mozambique: Mozambique Cyclone Idai Post Disaster Needs Assessment Conference Version, https://www.undp.org/publications/mozambique-cyclone-idai-post-disaster-needs-assessment-pdnadna (last access: 21 May 2025), 2019.
Green, J., Haigh, I. D., Quinn, N., Neal, J., Wahl, T., Wood, M., Eilander, D., de Ruiter, M., Ward, P., and Camus, P.: Review article: A comprehensive review of compound flooding literature with a focus on coastal and estuarine regions, Nat. Hazards Earth Syst. Sci., 25, 747–816, https://doi.org/10.5194/nhess-25-747-2025, 2025.
Grimaldi, S., Salamon, P., Disperati, J., Zsoter, E., Russo, C., Ramos, A., Carton De Wiart, C., Barnard, C., Hansford, E., Gomes, G., and Prudhomme, C.: River discharge and related forecasted data from the Global Flood Awareness System, European Commission, Joint Research Centre (JRC), https://doi.org/10.24381/cds.a4fdd6b9, 2023.
Grimley, L. E., Hollinger Beatty, K. E., Sebastian, A., Bunya, S., and Lackmann, G. M.: Climate change exacerbates compound flooding from recent tropical cyclones, npj Natural Hazards, 1, 45, https://doi.org/10.1038/s44304-024-00046-3, 2024.
Guzman, O. and Jiang, H.: Global increase in tropical cyclone rain rate, Nat. Commun., 12, 5344, https://doi.org/10.1038/s41467-021-25685-2, 2021.
Hawker, L., Uhe, P., Paulo, L., Sosa, J., Savage, J., Sampson, C., and Neal, J.: A 30 m global map of elevation with forests and buildings removed, Environ. Res. Lett., 17, 024016, https://doi.org/10.1088/1748-9326/AC4D4F, 2022.
Hegerl, G. C., Hoegh-Guldberg, O., Casassa, G., Hoerling, M., Kovats, S., Parmesan, C., Pierce, D., and Stott, P.: Good Practice Guidance Paper on Detection and Attribution Related to Anthropogenic Climate Change, in: Meeting Report of the Intergovernmental Panel on Climate Change Expert Meeting on Detection and Attribution of Anthropogenic Climate Change, edited by: Stocker, T., Field, C., Dahe, Q., Plattner, G.-K., Tignor, M., Midgley, P., and Ebi, K., IPCC Working Group I Technical Support Unit, University of Bern, Bern, Switzerland, https://www.wcrp-climate.org/images/summer_school/ICTP_2014/documents/IPCC_DA_GoodPracticeGuidancePaper.pdf (last access: 1 May 2024), 2010.
Herfort, B., Lautenbach, S., Porto De Albuquerque, J., Anderson, J., and Zipf, A.: A spatio-temporal analysis investigating completeness and inequalities of global urban building data in OpenStreetMap, Nat. Commun., 14, 3985, https://doi.org/10.1038/s41467-023-39698-6, 2023.
Hersbach, H., Bell, B., Berrisford, P., Hirahara, S., Horányi, A., Muñoz-Sabater, J., Nicolas, J., Peubey, C., Radu, R., Schepers, D., Simmons, A., Soci, C., Abdalla, S., Abellan, X., Balsamo, G., Bechtold, P., Biavati, G., Bidlot, J., Bonavita, M., De Chiara, G., Dahlgren, P., Dee, D., Diamantakis, M., Dragani, R., Flemming, J., Forbes, R., Fuentes, M., Geer, A., Haimberger, L., Healy, S., Hogan, R. J., Hólm, E., Janisková, M., Keeley, S., Laloyaux, P., Lopez, P., Lupu, C., Radnoti, G., de Rosnay, P., Rozum, I., Vamborg, F., Villaume, S., and Thépaut, J. N.: The ERA5 global reanalysis, Q. J. Roy. Meteor. Soc., 146, 1999–2049, https://doi.org/10.1002/QJ.3803, 2020.
Holland, G.: A Revised Hurricane Pressure–Wind Model, Mon. Weather Rev., 136, 3432–3445, https://doi.org/10.1175/2008MWR2395.1, 2008.
Holland, G. J., Belanger, J. I., and Fritz, A.: A revised model for radial profiles of hurricane winds, Mon. Weather Rev., 138, 4393–4401, https://doi.org/10.1175/2010MWR3317.1, 2010.
Hope, P., Cramer, W., van Aalst, M., Flato, G., Frieler, K., Gillett, N., Huggel, C., Minx, J., Otto, F., Parmesan, C., Rogelj, J., Rojas, M., Seneviratne, S. I., Slangen, A., Stone, D., Terray, L., Vautard, R., and Zhang, X.: Cross-Working Group Box ATTRIBUTION | Attribution in the IPCC Sixth Assessment Report, in: Climate Change 2022: Impacts, Adaptation and Vulnerability, Contribution of Working Group II to the Sixth Assessment Report of the Intergovernmental Panel on Climate Change, edited by: Pörtner, H.-O., Roberts, D. C., Tignor, M., Poloczanska, E. S., Mintenbeck, K., Alegría, A., Craig, M., Langsdorf, S., Löschke, S., Möller, V., Okem, A., and Rama, B., Cambridge University Press, Cambridge, UK and New York, NY, USA, 149–152, https://www.ipcc.ch/report/ar6/wg2/downloads/report/IPCC_AR6_WGII_CCB-CWGB_Compilation.pdf (last access: 2 June 2025), 2022.
Huizinga, J., Moel, H. D., and Szewczyk, W.: Global flood depth-damage functions: Methodology and the database with guidelines, Publications Office of the European Union, Luxembourg (Luxembourg), https://doi.org/10.2760/16510, 2017.
Intergovernmental Panel on Climate Change (IPCC): Climate Change 2014: Synthesis Report, Contribution of Working Groups I, II and III to the Fifth Assessment Report of the Intergovernmental Panel on Climate Change, edited by: Core Writing Team, Pachauri, R. K., and Meyer L. A., IPCC, Geneva, Switserland, 151, https://www.ipcc.ch/report/ar5/syr/ (last access: 29 June 2024), 2014.
Intergovernmental Panel on Climate Change (IPCC): Key Risks across Sectors and Regions, Climate Change 2022 – Impacts, Adaptation and Vulnerability, 2411–2538, https://doi.org/10.1017/9781009325844.025, 2023a.
Intergovernmental Panel on Climate Change (IPCC): Ocean, Cryosphere and Sea Level Change, in: Climate Change 2021 – The Physical Science Basis: Working Group I Contribution to the Sixth Assessment Report of the Intergovernmental Panel on Climate Change, Cambridge University Press, Cambridge, 1211–1362, https://doi.org/10.1017/9781009157896.011, 2023b.
Jaafar, H. and Ahmad, F.: GCN250, global curve number datasets for hydrologic modeling and design, figshare, https://doi.org/10.6084/m9.figshare.7756202.v1, 2019.
Jahanshahi, A. and Booij, M. J.: Exploring controls on rainfall-runoff events: spatial dynamics of event runoff coefficients in Iran, Hydrolog. Sci. J., 68, 954–966, https://doi.org/10.1080/02626667.2023.2193297, 2023.
Joint Research Center and Copernicus Emergency Management Service: River discharge and related forecasted data from the Global Flood Awareness System, Early Warning Data Store (EWDS), https://doi.org/10.24381/cds.a4fdd6b9, 2020.
Kernkamp, H. W. J., Van Dam, A., Stelling, G. S., and De Goede, E. D.: Efficient scheme for the shallow water equations on unstructured grids with application to the Continental Shelf, Ocean Dynam., 61, 1175–1188, https://doi.org/10.1007/S10236-011-0423-6, 2011.
Kim, D., Park, D. S. R., Nam, C. C., and Bell, M. M.: The parametric hurricane rainfall model with moisture and its application to climate change projections, NPJ Clim. Atmos. Sci., 5, 86, https://doi.org/10.1038/S41612-022-00308-9, 2022.
Kind, J., Wouter Botzen, W. J., and Aerts, J. C. J. H.: Accounting for risk aversion, income distribution and social welfare in cost-benefit analysis for flood risk management, Wiley Interdiscip. Rev. Clim. Change, 8, e446, https://doi.org/10.1002/WCC.446, 2017.
Knapp, K. R., Kruk, M. C., Levinson, D. H., Diamond, H. J., and Neumann, C. J.: The International Best Track Archive for Climate Stewardship (IBTrACS): Unifying Tropical Cyclone Data, B. Am. Meteor. Soc., 91, 363–376, https://doi.org/10.1175/2009BAMS2755.1, 2010.
Knutson, T., Camargo, S. J., Chan, J. C. L., Emanuel, K., Ho, C. H., Kossin, J., Mohapatra, M., Satoh, M., Sugi, M., Walsh, K., and Wu, L.: Tropical Cyclones and Climate Change Assessment: Part I: Detection and Attribution, B. Am. Meteor. Soc., 100, 1987–2007, https://doi.org/10.1175/BAMS-D-18-0189.1, 2019.
Knutson, T., Camargo, S. J., Chan, J. C. L., Emanuel, K., Ho, C. H., Kossin, J., Mohapatra, M., Satoh, M., Sugi, M., Walsh, K., and Wu, L.: Tropical Cyclones and Climate Change Assessment: Part II: Projected Response to Anthropogenic Warming, B. Am. Meteor. Soc., 101, E303–E322, https://doi.org/10.1175/BAMS-D-18-0194.1, 2020.
Lehner, B., Messager, M. L., Korver, M. C., and Linke, S.: Global hydro-environmental lake characteristics at high spatial resolution, Sci. Data, 9, 351, https://doi.org/10.1038/s41597-022-01425-z, 2022.
Leijnse, T., Van Ormondt, M., Nederhoff, K., and Van Dongeren, A.: Modeling compound flooding in coastal systems using a computationally efficient reduced-physics solver: Including fluvial, pluvial, tidal, wind-and wave-driven processes, Coast. Eng., 163, 103796, https://doi.org/10.1016/j.coastaleng.2020.103796, 2021.
Leijnse, T. W. B., van Dongeren, A., van Ormondt, M., de Goede, R., and Aerts, J. C. J. H.: The importance of waves in large-scale coastal compound flooding: A case study of Hurricane Florence (2018), Coast. Eng., 199, 104726, https://doi.org/10.1016/j.coastaleng.2025.104726, 2025.
Lin, P., Pan, M., Allen, G., Frasson, R., Zeng, Z., Yamazaki, D., and Wood, E.: Global estimates of reach-level bankfull river width leveraging big-data geospatial analysis, Zenodo, https://doi.org/10.5281/zenodo.3552776, 2019.
Linke, S., Lehner, B., Ouellet Dallaire, C., Ariwi, J., Grill, G., Anand, M., Beames, P., Burchard-Levine, V., Maxwell, S., Moidu, H., Tan, F., and Thieme, M.: Global hydro-environmental sub-basin and river reach characteristics at high spatial resolution, Sci. Data, 6, 283, https://doi.org/10.1038/s41597-019-0300-6, 2019.
Liu, M., Vecchi, G. A., Smith, J. A., and Knutson, T. R.: Causes of large projected increases in hurricane precipitation rates with global warming, npj Climate and Atmospheric Science, 2, 1–5, https://doi.org/10.1038/s41612-019-0095-3, 2019a.
Liu, M., Vecchi, G. A., Smith, J. A., and Knutson, T. R.: Causes of large projected increases in hurricane precipitation rates with global warming, NPJ Clim. Atmos. Sci., 2, 38, https://doi.org/10.1038/s41612-019-0095-3, 2019b.
Lloyd, E. A. and Shepherd, T. G.: Climate change attribution and legal contexts: evidence and the role of storylines, Clim. Change, 167, 28, https://doi.org/10.1007/S10584-021-03177-Y, 2021.
Massari, C., Pellet, V., Tramblay, Y., Crow, W. T., Gründemann, G. J., Hascoetf, T., Penna, D., Modanesi, S., and Brocca, L.: On the relation between antecedent basin conditions and runoff coefficient for European floods, J. Hydrol., 625, 130012, https://doi.org/10.1016/j.jhydrol.2023.130012, 2023.
Mekonnen, K., Velpuri, N. M., Leh, M., Akpoti, K., Owusu, A., Tinonetsana, P., Hamouda, T., Ghansah, B., Paranamana, T. P., and Munzimi, Y.: Accuracy of satellite and reanalysis rainfall estimates over Africa: A multi-scale assessment of eight products for continental applications, J. Hydrol. Reg. Stud., 49, 101514, https://doi.org/10.1016/J.EJRH.2023.101514, 2023.
Mengel, M., Treu, S., Lange, S., and Frieler, K.: ATTRICI v1.1 – counterfactual climate for impact attribution, Geosci. Model Dev., 14, 5269–5284, https://doi.org/10.5194/gmd-14-5269-2021, 2021.
Mester, B., Vogt, T., Bryant, S., Otto, C., Frieler, K., and Schewe, J.: Human displacements from Tropical Cyclone Idai attributable to climate change, Nat. Hazards Earth Syst. Sci., 23, 3467–3485, https://doi.org/10.5194/nhess-23-3467-2023, 2023.
Nederhoff, K., van Ormondt, M., Veeramony, J., van Dongeren, A., Antolínez, J. A. Á., Leijnse, T., and Roelvink, D.: Accounting for uncertainties in forecasting tropical-cyclone-induced compound flooding, Geosci. Model Dev., 17, 1789–1811, https://doi.org/10.5194/gmd-17-1789-2024, 2024.
Nhundu, K., Sibanda, M., and Chaminuka, P.: Economic Losses from Cyclones Idai and Kenneth and Floods in Southern Africa: Implications on Sustainable Development Goals, in: Cyclones in Southern Africa: Volume 3: Implications for the Sustainable Development Goals, Springer International Publishing, Cham, 289–303, https://doi.org/10.1007/978-3-030-74303-1_19, 2021.
Noy, I., Stone, D., and Uher, T.: Extreme events impact attribution: A state of the art, Cell Reports Sustainability, 1, 100101, https://doi.org/10.1016/J.CRSUS.2024.100101, 2024.
OpenStreetMap contributors: OpenStreetMap, https://www.openstreetmap.org (last access: 3 September 2025), 2025.
U.S. Bureau of Labor Statistics: Archived Consumer Price Index Supplemental Files, https://www.bls.gov/cpi/tables/supplemental-files/, last access: 27 August 2025.
van Dongeren, A., Battjes, J., Janssen, T., van Noorloos, J., Steenhauer, K., Steenbergen, G., and Reniers, A.: Shoaling and shoreline dissipation of low-frequency waves, J. Geophys. Res.-Oceans, 112, 2011, https://doi.org/10.1029/2006JC003701, 2007.
van Garderen, L., Feser, F., and Shepherd, T. G.: A methodology for attributing the role of climate change in extreme events: a global spectrally nudged storyline, Nat. Hazards Earth Syst. Sci., 21, 171–186, https://doi.org/10.5194/nhess-21-171-2021, 2021.
van Oldenborgh, G. J., van der Wiel, K., Kew, S., Philip, S., Otto, F., Vautard, R., King, A., Lott, F., Arrighi, J., Singh, R., and van Aalst, M.: Pathways and pitfalls in extreme event attribution, Clim. Change, 166, 13, https://doi.org/10.1007/s10584-021-03071-7, 2021.
van Ormondt, M., Leijnse, T., Nederhoff, K., de Goede, R., van Dongeren, A., Bovenschen, T., and van Asselt, K.: SFINCS: Super-Fast INundation of CoastS model Version 2.2.0 col d'Eze Release 2025.01, Zenodo, https://doi.org/10.5281/zenodo.13691724, 2025a.
van Ormondt, M., Leijnse, T., de Goede, R., Nederhoff, K., and van Dongeren, A.: Subgrid corrections for the linear inertial equations of a compound flood model – a case study using SFINCS 2.1.1 Dollerup release, Geosci. Model Dev., 18, 843–861, https://doi.org/10.5194/gmd-18-843-2025, 2025b.
Otto, F. E. L., Zachariah, M., Wolski, P., Pinto, I., Barimalala, R., Nhamtumbo, B., Bonnet, R., Vautard, R., Philip, S., Kew, S., Luu, L. N., Heinrich, D., Vahlberg, M., Singh, R., Arrighi, J., Thalheimer, L., Van Aalst, M., Li, S., Sun, J., Vecchi, G., and Harrington, L. J.: https://www.worldweatherattribution.org/climate-change-increased-rainfall-associated-with-tropical-cyclones-hitting-highly-vulnerable-communities-in-madagascar-mozambique-malawi/ (last access: 15 April 2025), 2022.
Paprotny, D., 't Hart, C. M. P., and Morales-Nápoles, O.: Evolution of flood protection levels and flood vulnerability in Europe since 1950 estimated with vine-copula models, Nat. Hazards, 121, 6155–6184, https://doi.org/10.1007/S11069-024-07039-5, 2025.
Patricola, C. M. and Wehner, M. F.: Anthropogenic influences on major tropical cyclone events, Nature, 563, 339–346, https://doi.org/10.1038/s41586-018-0673-2, 2018.
Pekel, J. F., Cottam, A., Gorelick, N., and Belward, A. S.: High-resolution mapping of global surface water and its long-term changes, Nature, 540, 418–422, https://doi.org/10.1038/nature20584, 2016.
Perkins-Kirkpatrick, S. E., Alexander, L. V., King, A. D., Kew, S. F., Philip, S. Y., Barnes, C., Maraun, D., Stuart-Smith, R. F., Jézéquel, A., Bevacqua, E., Burgess, S., Fischer, E., Hegerl, G. C., Kimutai, J., Koren, G., Lawal, K. A., Min, S.-K., New, M., Odoulami, R. C., Patricola, C. M., Pinto, I., Ribes, A., Shaw, T. A., Thiery, W., Trewin, B., Vautard, R., Wehner, M., and Zscheischler, J.: Frontiers in attributing climate extremes and associated impacts, Frontiers in Climate, 6, https://doi.org/10.3389/fclim.2024.1455023, 2024.
Philip, S., Kew, S., van Oldenborgh, G. J., Otto, F., Vautard, R., van der Wiel, K., King, A., Lott, F., Arrighi, J., Singh, R., and van Aalst, M.: A protocol for probabilistic extreme event attribution analyses, Adv. Stat. Climatol. Meteorol. Oceanogr., 6, 177–203, https://doi.org/10.5194/ASCMO-6-177-2020, 2020.
Philp, T. J., Champion, A. J., Hodges, K. I., Pigott, C., MacFarlane, A., Wragg, G., and Zhao, S.: Identifying Limitations when Deriving Probabilistic Views of North Atlantic Hurricane Hazard from Counterfactual Ensemble NWP Re-forecasts, in: Hurricane Risk in a Changing Climate, edited by: Collins, J. M. and Done, J. M., Springer International Publishing, Cham, 233–254, https://doi.org/10.1007/978-3-031-08568-0_10, 2022.
Pistrika, A., Tsakiris, G., and Nalbantis, I.: Flood Depth-Damage Functions for Built Environment, Environmental Processes, 1, 553–572, https://doi.org/10.1007/S40710-014-0038-2, 2014.
Probst, P. and Annunziato, A.: Tropical Cyclone Idai: analysis of the wind, rainfall and storm surge impact, European Commission – Joint Research Centre, https://reliefweb.int/report/mozambique/tropical-cyclone-idai-analysis-wind-rainfall-and-storm-surge-impact-9-april-2019 (last access: 4 June 2025), 2019.
Puig, D., Adger, N. W., Barnett, J., Vanhala, L., and Boyd, E.: Improving the effectiveness of climate change adaptation measures, Clim. Change, 178, 7, https://doi.org/10.1007/S10584-024-03838-8, 2025.
Rentschler, J., Avner, P., Marconcini, M., Su, R., Strano, E., Vousdoukas, M., and Hallegatte, S.: Global evidence of rapid urban growth in flood zones since 1985, Nature, 622, 87–92, https://doi.org/10.1038/S41586-023-06468-9, 2023.
Roelvink, D., van Ormondt, M., Reyns, J., and van der Lugt, M.: SnapWave: fast, implicit wave transformation from offshore to nearshore, Geosci. Model Dev., 18, 9469–9495, https://doi.org/10.5194/gmd-18-9469-2025, 2025.
Rogers, J. S., Maneta, M. M., Sain, S. R., Madaus, L. E., and Hacker, J. P.: The role of climate and population change in global flood exposure and vulnerability, Nat. Commun., 16, 1287, https://doi.org/10.1038/S41467-025-56654-8, 2025.
Rogger, M., Agnoletti, M., Alaoui, A., Bathurst, J. C., Bodner, G., Borga, M., Chaplot, V., Gallart, F., Glatzel, G., Hall, J., Holden, J., Holko, L., Horn, R., Kiss, A., Kohnová, S., Leitinger, G., Lennartz, B., Parajka, J., Perdigão, R., Peth, S., Plavcová, L., Quinton, J. N., Robinson, M., Salinas, J. L., Santoro, A., Szolgay, J., Tron, S., van den Akker, J. J. H., Viglione, A., and Blöschl, G.: Land use change impacts on floods at the catchment scale: Challenges and opportunities for future research, Water Resour. Res., 53, 5209–5219, https://doi.org/10.1002/2017WR020723, 2017.
Samadi, V., Fowler, H. J., Lamond, J., Wagener, T., Brunner, M., Gourley, J., Moradkhani, H., Popescu, I., Wasko, C., Wright, D., Wu, H., Zhang, K., Arias, P. A., Duan, Q., Nazemi, A., van Oevelen, P. J., Prein, A. F., Roundy, J. K., Saberian, M., and Umutoni, L.: The Needs, Challenges, and Priorities for Advancing Global Flood Research, WIREs Water, 12, e70026, https://doi.org/10.1002/wat2.70026, 2025.
Sánchez-Benítez, A., Goessling, H., Pithan, F., Semmler, T., and Jung, T.: The July 2019 European Heat Wave in a Warmer Climate: Storyline Scenarios with a Coupled Model Using Spectral Nudging, J. Climate, 35, 2373–2390, https://doi.org/10.1175/JCLI-D-21-0573.1, 2022.
Sauer, I. J., Reese, R., Otto, C., Geiger, T., Willner, S. N., Guillod, B. P., Bresch, D. N., and Frieler, K.: Climate signals in river flood damages emerge under sound regional disaggregation, Nat. Commun., 12, 2128, https://doi.org/10.1038/s41467-021-22153-9, 2021.
Schubert-Frisius, M., Feser, F., von Storch, H., and Rast, S.: Optimal Spectral Nudging for Global Dynamic Downscaling, Mon. Weather Rev., 145, 909–927, https://doi.org/10.1175/MWR-D-16-0036.1, 2017.
Scussolini, P., Luu, L. N., Philip, S., Berghuijs, W. R., Eilander, D., Aerts, J. C. J. H., Kew, S. F., van Oldenborgh, G. J., Toonen, W. H. J., Volkholz, J., and Coumou, D.: Challenges in the attribution of river flood events, WIREs Climate Change, 15, e874, https://doi.org/10.1002/WCC.874, 2024.
Seneviratne, S. I., Zhang, X., Adnan, M., Badi, W., Dereczynski, C., Di Luca, A., Ghosh, S., Iskander, I., Kossin, J., and Lewis, S.: Weather and climate extreme events in a changing climate, in: Climate Change 2021: The Physical Science Basis. Contribution of Working Group I to the Sixth Assessment Report of the Intergovernmental Panel on Climate Change, edited by: Masson-Delmotte, V., Zhai, P., Pirani, A., Connors, S. L., Péan, C., Berger, S., Caud, N., Chen, Y., Goldfarb, L., Gomis, M. I., Huang, M., Leitzell, K., Lonnoy, E., Matthews, J. B. R., Maycock, T. K., Waterfield, T., Yelekçi, O., Yu, R., and Zhou, B., Cambridge University Press, Cambridge, United Kingdom and New York, NY, USA, 1513–1766, https://doi.org/10.1017/9781009157896.013, 2021.
Shepherd, T. G.: A Common Framework for Approaches to Extreme Event Attribution, Curr. Clim. Change Rep., 2, 28–38, https://doi.org/10.1007/S40641-016-0033-Y, 2016.
Sillmann, J., Shepherd, T. G., van den Hurk, B., Hazeleger, W., Martius, O., Slingo, J., and Zscheischler, J.: Event-Based Storylines to Address Climate Risk, Earths Future, 9, e2020EF001783, https://doi.org/10.1029/2020EF001783, 2021.
Smiley, K. T., Noy, I., Wehner, M. F., Frame, D., Sampson, C. C., and Wing, O. E. J.: Social inequalities in climate change-attributed impacts of Hurricane Harvey, Nat. Commun., 13, 3418, https://doi.org/10.1038/s41467-022-31056-2, 2022.
Smith, A. B. and Katz, R. W.: US billion-dollar weather and climate disasters: Data sources, trends, accuracy and biases, Nat. Hazards, 67, 387–410, https://doi.org/10.1007/S11069-013-0566-5, 2013.
Stott, P. A., Stone, D. A., and Allen, M. R.: Human contribution to the European heatwave of 2003, Nature, 432, 610–614, https://doi.org/10.1038/NATURE03089, 2004.
Strauss, B. H., Orton, P. M., Bittermann, K., Buchanan, M. K., Gilford, D. M., Kopp, R. E., Kulp, S., Massey, C., de Moel, H., and Vinogradov, S.: Economic damages from Hurricane Sandy attributable to sea level rise caused by anthropogenic climate change, Nat. Commun., 12, 2720, https://doi.org/10.1038/s41467-021-22838-1, 2021.
Thieken, A. H., Müller, M., Kreibich, H., and Merz, B.: Flood damage and influencing factors: New insights from the August 2002 flood in Germany, Water Resour. Res., 41, W12430, https://doi.org/10.1029/2005WR004177, 2005.
Thompson, C., Barthe, C., Bielli, S., Tulet, P., and Pianezze, J.: Projected Characteristic Changes of a Typical Tropical Cyclone under Climate Change in the South West Indian Ocean, Atmosphere, 12, 232, https://doi.org/10.3390/atmos12020232, 2021.
Thompson, V., Ermis, S., and Athanase, M.: The need for multi-method extreme event attribution, Weather, https://doi.org/10.1002/wea.7779, 2025.
Treu, S., Muis, S., Dangendorf, S., Wahl, T., Oelsmann, J., Heinicke, S., Frieler, K., and Mengel, M.: Reconstruction of hourly coastal water levels and counterfactuals without sea level rise for impact attribution, Earth Syst. Sci. Data, 16, 1121–1136, https://doi.org/10.5194/essd-16-1121-2024, 2024.
Tu, S., Chan, J. C. L., Xu, J., Zhong, Q., Zhou, W., and Zhang, Y.: Increase in tropical cyclone rain rate with translation speed, Nat. Commun., 13, 7325, https://doi.org/10.1038/s41467-022-35113-8, 2022.
UN Office for the Coordination of Humanitarian Affairs (OCHA): Mozambique: Cyclone Idai & Floods Situation Report No. 2, ReliefWeb, https://reliefweb.int/report/mozambique/mozambique-cyclone-idai-floods-situation-report-no-2-3-april-2019 (last access: 4 June 2025), 2019.
Veenstra, J.: dfm_tools: A Python package for pre- and postprocessing D-FlowFM model input and output files (v0.35.0), Zenodo, https://doi.org/10.5281/zenodo.14901200, 2025.
van Verseveld, W. J., Weerts, A. H., Visser, M., Buitink, J., Imhoff, R. O., Boisgontier, H., Bouaziz, L., Eilander, D., Hegnauer, M., ten Velden, C., and Russell, B.: Wflow_sbm v0.7.3, a spatially distributed hydrological model: from global data to local applications, Geosci. Model Dev., 17, 3199–3234, https://doi.org/10.5194/gmd-17-3199-2024, 2024.
van Verseveld, W., Visser, M., Buitink, J., Bouaziz, L., Boisgontier, H., Bootsma, H., Weerts, A., Baptista, C. F., Pronk, M., Eilander, D., Hartgring, S., Dalmijn, B., Hofer, J., Hegnauer, M., and Mendoza, R.: Deltares/Wflow.jl, GitHub, https://github.com/Deltares/Wflow.jl/releases/tag/v0.8.1 (last access: 21 July 2025), 2025.
Vertegaal, D. M., Aleksandrova, N., Bovenschen, T., Couasnon, A., and Goulart, H. M. D.: Climate and impact attribution of TC Idai, Zenodo [data set], https://doi.org/10.5281/zenodo.17107289, 12 September 2025.
Wagenaar, B. H., Augusto, O., Ásbjörnsdóttir, K., Akullian, A., Manaca, N., Chale, F., Muanido, A., Covele, A., Michel, C., Gimbel, S., Radford, T., Girardot, B., and Sherr, K.: Developing a representative community health survey sampling frame using open-source remote satellite imagery in Mozambique, Int. J. Health Geogr., 17, 37, https://doi.org/10.1186/s12942-018-0158-4, 2018a.
Wagenaar, D., Slager, K., and Calero, J. S.: Delft-FIAT: An open-source flood impact analysis tool, Zenodo, https://doi.org/10.5281/zenodo.1400183, 2017.
Wagenaar, D., Lüdtke, S., Schröter, K., Bouwer, L. M., and Kreibich, H.: Regional and Temporal Transferability of Multivariable Flood Damage Models, Water Resour. Res., 54, 3688–3703, https://doi.org/10.1029/2017WR022233, 2018b.
Wang, J., Chen, Y., Tett, S. F. B., Stone, D., Nie, J., Feng, J., Yan, Z., Zhai, P., and Ge, Q.: Storyline attribution of human influence on a record-breaking spatially compounding flood-heat event, Sci. Adv., 9, eadi2714, https://doi.org/10.1126/sciadv.adi2714, 2023.
Wang, X., Verlaan, M., Veenstra, J., and Lin, H. X.: Data-assimilation-based parameter estimation of bathymetry and bottom friction coefficient to improve coastal accuracy in a global tide model, Ocean Sci., 18, 881–904, https://doi.org/10.5194/os-18-881-2022, 2022.
Ward, P. J., Jongman, B., Salamon, P., Simpson, A., Bates, P., De Groeve, T., Muis, S., De Perez, E. C., Rudari, R., Trigg, M. A., and Winsemius, H. C.: Usefulness and limitations of global flood risk models, Nat. Clim. Change, 5, 712–715, https://doi.org/10.1038/nclimate2742, 2015.
Ward, P. J., Couasnon, A., Eilander, D., Haigh, I. D., Hendry, A., Muis, S., Veldkamp, T. I. E., Winsemius, H. C., and Wahl, T.: Dependence between high sea-level and high river discharge increases flood hazard in global deltas and estuaries, Environ. Res. Lett., 13, 084012, https://doi.org/10.1088/1748-9326/AAD400, 2018.
Warren, M.: Why Cyclone Idai is one of the Southern Hemisphere's most devastating storms, Nature, https://doi.org/10.1038/D41586-019-00981-6, 2019.
Wilkerson, G. V.: Improved bankfull discharge prediction using 2-year recurrence-period discharge, J. Am. Water Resour. Assoc., 44, 243–257, https://doi.org/10.1111/J.1752-1688.2007.00151.X, 2008.
Williamson, C., McCordic, C., and Doberstein, B.: The compounding impacts of Cyclone Idai and their implications for urban inequality, Int. J. Disast. Risk Re., 86, 103526, https://doi.org/10.1016/J.IJDRR.2023.103526, 2023.
Wing, O. E. J., Bates, P. D., Quinn, N. D., Savage, J. T. S., Uhe, P. F., Cooper, A., Collings, T. P., Addor, N., Lord, N. S., Hatchard, S., Hoch, J. M., Bates, J., Probyn, I., Himsworth, S., Rodríguez González, J., Brine, M. P., Wilkinson, H., Sampson, C. C., Smith, A. M., Neal, J. C., and Haigh, I. D.: A 30 m Global Flood Inundation Model for Any Climate Scenario, Water Resour. Res., 60, e2023WR036460, https://doi.org/10.1029/2023WR036460, 2024.
World Meteorological Organisation (WMO): Tropical Cyclone Idai hits Mozambique, https://wmo.int/media/news/tropical-cyclone-idai-hits-mozambique (last access: 4 June 025), 2019.
Yamada, Y., Satoh, M., Sugi, M., Kodama, C., Noda, A. T., Nakano, M., and Nasuno, T.: Response of Tropical Cyclone Activity and Structure to Global Warming in a High-Resolution Global Nonhydrostatic Model, J. Climate, 30, 9703–9724, https://doi.org/10.1175/JCLI-D-17-0068.1, 2017.
Yamazaki, D., Ikeshima, D., Sosa, J., Bates, P. D., Allen, G. H., and Pavelsky, T. M.: MERIT Hydro: A High-Resolution Global Hydrography Map Based on Latest Topography Dataset, Water Resour. Res., 55, 5053–5073, https://doi.org/10.1029/2019WR024873, 2019.
Zhou, Q., Zhang, Y., Chang, K., and Brovelli, M. A.: Assessing OSM building completeness for almost 13,000 cities globally, Int. J. Digit. Earth, 15, 2400–2421, https://doi.org/10.1080/17538947.2022.2159550, 2022.
Zscheischler, J., Westra, S., Van Den Hurk, B. J. J. M., Seneviratne, S. I., Ward, P. J., Pitman, A., Aghakouchak, A., Bresch, D. N., Leonard, M., Wahl, T., and Zhang, X.: Future climate risk from compound events, Nat. Clim. Change, 8, 469–477, https://doi.org/10.1038/s41558-018-0156-3, 2018.
Zsoter, E., Harrigan, S., Barnard, C., Wetterhall, F., Ferrario, I., Mazzetti, C., Alfieri, L., Salamon, P., and Prudhomme, C.: River discharge and related forecasted data from the Global Flood Awareness System, European Commission, Joint Research Centre (JRC), https://doi.org/10.24381/cds.a4fdd6b9, 2021.
This study highlights the need to disentangle climate change effects on flood drivers using storyline attribution. Whether information is presented as change in one or multiple drivers, or as change in hazard or impact, determines the attribution statement. For compound flooding from tropical cyclone Idai, that hit Mozambique in 2019, we attribute 1–19 % of the flood hazard and 8–35 % of the damage to climate change. The attribution framework can be applied to other events worldwide.
This study highlights the need to disentangle climate change effects on flood drivers using...