the Creative Commons Attribution 4.0 License.
the Creative Commons Attribution 4.0 License.
 | 16 Mar 2026
Comprehensive multi-hazard risk assessment in data-scarce regions – a study focused on Burundi
Jess L. Delves
Piero Campalani
Jesica Piñon
Stefan Schneiderbauer
Mateo Moreno
Maria Belen Benito Oterino
Eduardo Perez
Massimiliano Pittore
The increased occurrence of multiple cascading and compounding hazards underlines the importance of integrated- and multi-hazard-based assessment approaches for the development of thorough strategies towards disaster resilience. To this purpose, a national-scale multi-hazard risk assessment was conducted between September 2020 and December 2021 for Burundi, focusing on the natural hazards flooding, torrential rains, landslides, earthquakes, and strong winds. This integrated multi-hazard assessment resulted in comparable nationwide provincial and commune-scale Annual Average Loss (AAL) values, further aggregated to provide a preliminary estimate of the resulting overall risk. Historical climatology (1990–2019) was computed, and a preliminary evaluation of the potential effects of climate change in the future period (2020–2049) was carried out. Data availability and reliability were challenging throughout the whole assessment and were tackled by integrating local authoritative sources with international and global resources. An up-to-date exposure model was implemented and complemented by an indicator-based socioeconomic vulnerability assessment. Furthermore, a data-driven statistical susceptibility model for shallow landslides has been derived at national scale. The consequent multi-hazard risk assessment provides an approximate picture of the expected nationwide risk distribution in economic terms. The results should support the identification of priority areas and actions for disaster risk management.
From a research perspective, the paper provides a transparent, hazard-wise framework that harmonises heterogeneous hazard, exposure and vulnerability information into comparable risk metrics in data-scarce environments. From a practice perspective, the resulting risk estimates are intended as a pragmatic baseline for multi-hazard comparison and prioritisation, supporting the identification of areas where DRR efforts and data improvements may be most impactful.
- Article
(32579 KB) - Full-text XML
-
Supplement
(909 KB) - BibTeX
- EndNote


“Understanding disaster risk” is the first of the four “priorities of action” of the Sendai Framework for Disaster Risk Reduction 2015–2030. This priority emphasises that “policies and practices for disaster risk management should be based on an understanding of disaster risk in all its dimensions of vulnerability, capacity, exposure of persons and assets, hazard characteristics and the environment” (UNISDR, 2015b). Hazard risk assessments are a crucial component leading to an understanding of disaster risk and generating knowledge required for disaster risk reduction (JRC, 2021). The increased occurrence of multiple cascading and compounding hazards underlines the importance of integrated and multi-hazard-based assessment approaches for the development of thorough strategies towards disaster resilience (Choi et al., 2021; Schneiderbauer et al., 2017; Zebisch et al., 2023).
The scientific community has increasingly invested in research to untangle the interactions and cascades between different hazards (Owolabi and Sajjad, 2023) considering their interdependencies, spatial and temporal overlaps, and compounding effects, also challenging conventional assessment approaches and demanding more sophisticated models and interdisciplinary collaboration, with notable applications (e.g., Stalhandske et al., 2024; Ward et al., 2020) also fuelled by the soaring consequences of global warming (IPCC, 2023). Despite these advances, translating this understanding into actionable, integrated risk assessments poses its own set of obstacles (Kappes et al., 2012), and multi-hazard risk analysis remains fraught with important challenges, particularly from the perspective of local and regional stakeholders (Rözer et al., 2023; Šakić Trogrlić et al., 2024). At the same time, a consistent analysis of risk arising from multiple hazards on an assumption of independence in an integrated and comparable framework is often missing, while this provides a pragmatic and useful baseline upon which to base more sophisticated approaches tackling cascade and compound effects. A major difficulty lies in the scarcity and variability of reliable data, particularly in regions where record-keeping and technological infrastructure are limited. Discrepancies between datasets from various sources, and the absence of consistent, long-term observational records, can introduce significant uncertainty into hazard assessments. Efforts to harmonise data or work with proxies only partially offset these limitations, often requiring careful methodological adaptation and transparency regarding the resulting uncertainties (Gallina et al., 2016). Moreover, institutional and resource constraints can hinder the implementation of comprehensive risk analyses and management strategies. In many settings, especially where capacity is developing, integrated assessments must be designed not only to be scientifically robust but also operationally feasible and directly relevant to policymakers (Cocuccioni et al., 2022). As such, initial assessments often serve as a baseline to be incrementally refined as better data and expertise and models become available.
Furthermore, a critical challenge in advancing Disaster Risk Management (DRM) lies in the establishment of robust, context-sensitive risk metrics that extend beyond the quantification of physical damages. Metrics based solely on recorded fatalities further underrepresent the true burden of disasters, as accurate fatality data may be scarce, inconsistently reported, or insensitive to chronic, low-impact events that cumulatively erode well-being. Moreover, the spectrum of hazards relevant to DRM manifests over contrasting temporal and spatial scales: floods and landslides for instance are significantly more frequent than earthquakes, albeit potentially less damaging. Economic losses offer an essential perspective, although they tend to omit critical dimensions such as disruption of livelihoods and long-term community resilience. Therefore, the development and adoption of comprehensive, DRM-friendly metrics – capable of reflecting not only direct but also indirect losses, and sensitive to the diverse temporal dynamics of hazards – are fundamental to effective risk prioritisation, resource allocation, and the promotion of holistic disaster resilience strategies. The 2015 Global Assessment Report on Disaster Risk Reduction (GAR, https://www.undrr.org/gar, last access: 13 February 2026), for instance, adopted an approach based on probabilistic multi-hazard risk assessment using the Average Annual Loss (AAL) metrics to provide analytical results and achieve comparability across different types of phenomena (UNISDR, 2015a). A more qualitative approach based on the use of a composite index has been followed instead to identify countries at risk from humanitarian emergencies and disasters that could overwhelm current national response capacity (European Commission, Joint Research Centre, 2017). The activities presented here were funded by the International Organization for Migration (IOM) in the context of a larger European Union development program focused on Disaster Risk Reduction (DRR), with the aim of conducting a multi-hazard assessment and risk mapping of all 18 provinces and 119 communes of Burundi, with a more refined focus on five particularly vulnerable localities in the country. The five hazards prioritized by IOM and local authorities were flooding, torrential rains, landslides, earthquakes and strong winds.
The results of the assessment were aimed at decision makers, civil protection authorities and other stakeholders at national and sub-national levels to support planning, decision-making and prioritisation of Disaster Risk Management (DRM) investments and activities. Local experts and scientists were also involved to discuss specific topics and potential contributions.
The multi-hazard risk assessment was conducted between September 2020 and December 2021. It faced multiple challenges and disruptions related to the COVID-19 pandemic, including travel restrictions and staff illness. A significant limitation was the lack of availability of observed data and the lack of reliability of some datasets (Campalani et al., 2023). Concerns regarding the reliability of datasets stemmed from discrepancies between similar datasets collected from different international sources. These data and research gaps necessitated an assessment approach based on proxies with the aim of providing an approximate nationwide disaster impact distribution, which was applied for torrential rains, strong winds and landslides. This integrated multi-hazard assessment resulted in comparable nationwide provincial and commune-scale Annual Average Loss (AAL) values for the five hazards under consideration.
Several scientific studies have studied natural hazards in Burundi (Delvaux et al., 2017; e.g., Jacobs et al., 2018; Monsieurs et al., 2019; Nsabimana et al., 2023), while seismic risk has been also assessed probabilistically within a continental scale model (Paul and Silva, 2025). Most of these contributions focus on specific combinations of hazards and regions or locations. The Global Assessment Report (GAR) in 2015 provided a multi-hazard risk assessment of Burundi within a global assessment (UNISDR, 2015a). This manuscript describes to our best knowledge the only other study to provide a specific multi-hazard risk assessment at country level for Burundi, which has implied overcoming several challenges. Furthermore, this is the first study that also assessed risk related to landslides and strong winds in monetary terms for the sake of comparability with the other hazards. To characterise the current climatology and explore the possible effects of climate change in a near future, both a historical climate (1990–2019) and climate change modelling (considering future period between 2020–2049) were completed. The latter focused on precipitation and winds and included three different climate change simulations performed at 3 km spatial resolution for Burundi considering a business-as-usual RCP8.5 (Representative Concentration Pathways) emission scenario.
This paper presents the methodologies applied in conducting a national, integrated multi-hazard risk assessment in a data scarce environment and aims at supporting Disaster Risk Management (DRM) actors (e.g. national and provincial government, IOM) in prioritising actions and funding. This implied significant assumptions and simplifications, as discussed later on, but also provided a first baseline for the local authorities to foster disaster management actions, and for the scientific community a preliminary baseline upon which to build better informed models as more technological and DRM capacity becomes available in the country and better disaster impact records are collected. The description of implemented activities and results can support scientists and practitioners in identifying efficient approaches in similarly data-scarce environments and to best meet stakeholder expectations in pragmatic operational frameworks. In the next sections a brief introduction to the case study is provided, followed by the methodological descriptions. Two subsequent sections present and discuss the most relevant results. Before summarising the conclusions and a potential outlook, an additional section describes the activities related to climate change.
This study adopts a probabilistic, hazard-wise risk assessment framework in which each hazard is analysed independently and subsequently integrated within a common, comparable risk metric. The multi-hazard risk assessment does not explicitly model cascading or compounding hazard interactions; instead, it assumes statistical independence among hazards and derives overall risk through the aggregation of hazard-specific Annual Average Loss (AAL) estimates. This approach follows a frequentist logic and is intended to provide a pragmatic and operational baseline for multi-hazard risk comparison and prioritisation, particularly suited to data-scarce environments. The assessment therefore proceeds through a sequence of single-hazard risk analyses – each combining hazard, exposure, and vulnerability components – whose results are harmonised and aggregated at the commune, provincial, and national scales.
The broader objective of this study is twofold. From a scientific perspective, it aims to develop and demonstrate a transparent and replicable multi-hazard risk assessment framework that can be applied in data-scarce contexts, combining probabilistic hazard modelling with exposure and vulnerability information within a common risk metric. From a practical perspective, the assessment is designed to support stakeholders involved in disaster risk reduction and planning by providing spatially explicit, comparable risk information across multiple hazards. The resulting outputs are intended to inform risk prioritisation, identify hotspots of concern, and support evidence-based decision-making at national and sub-national levels.
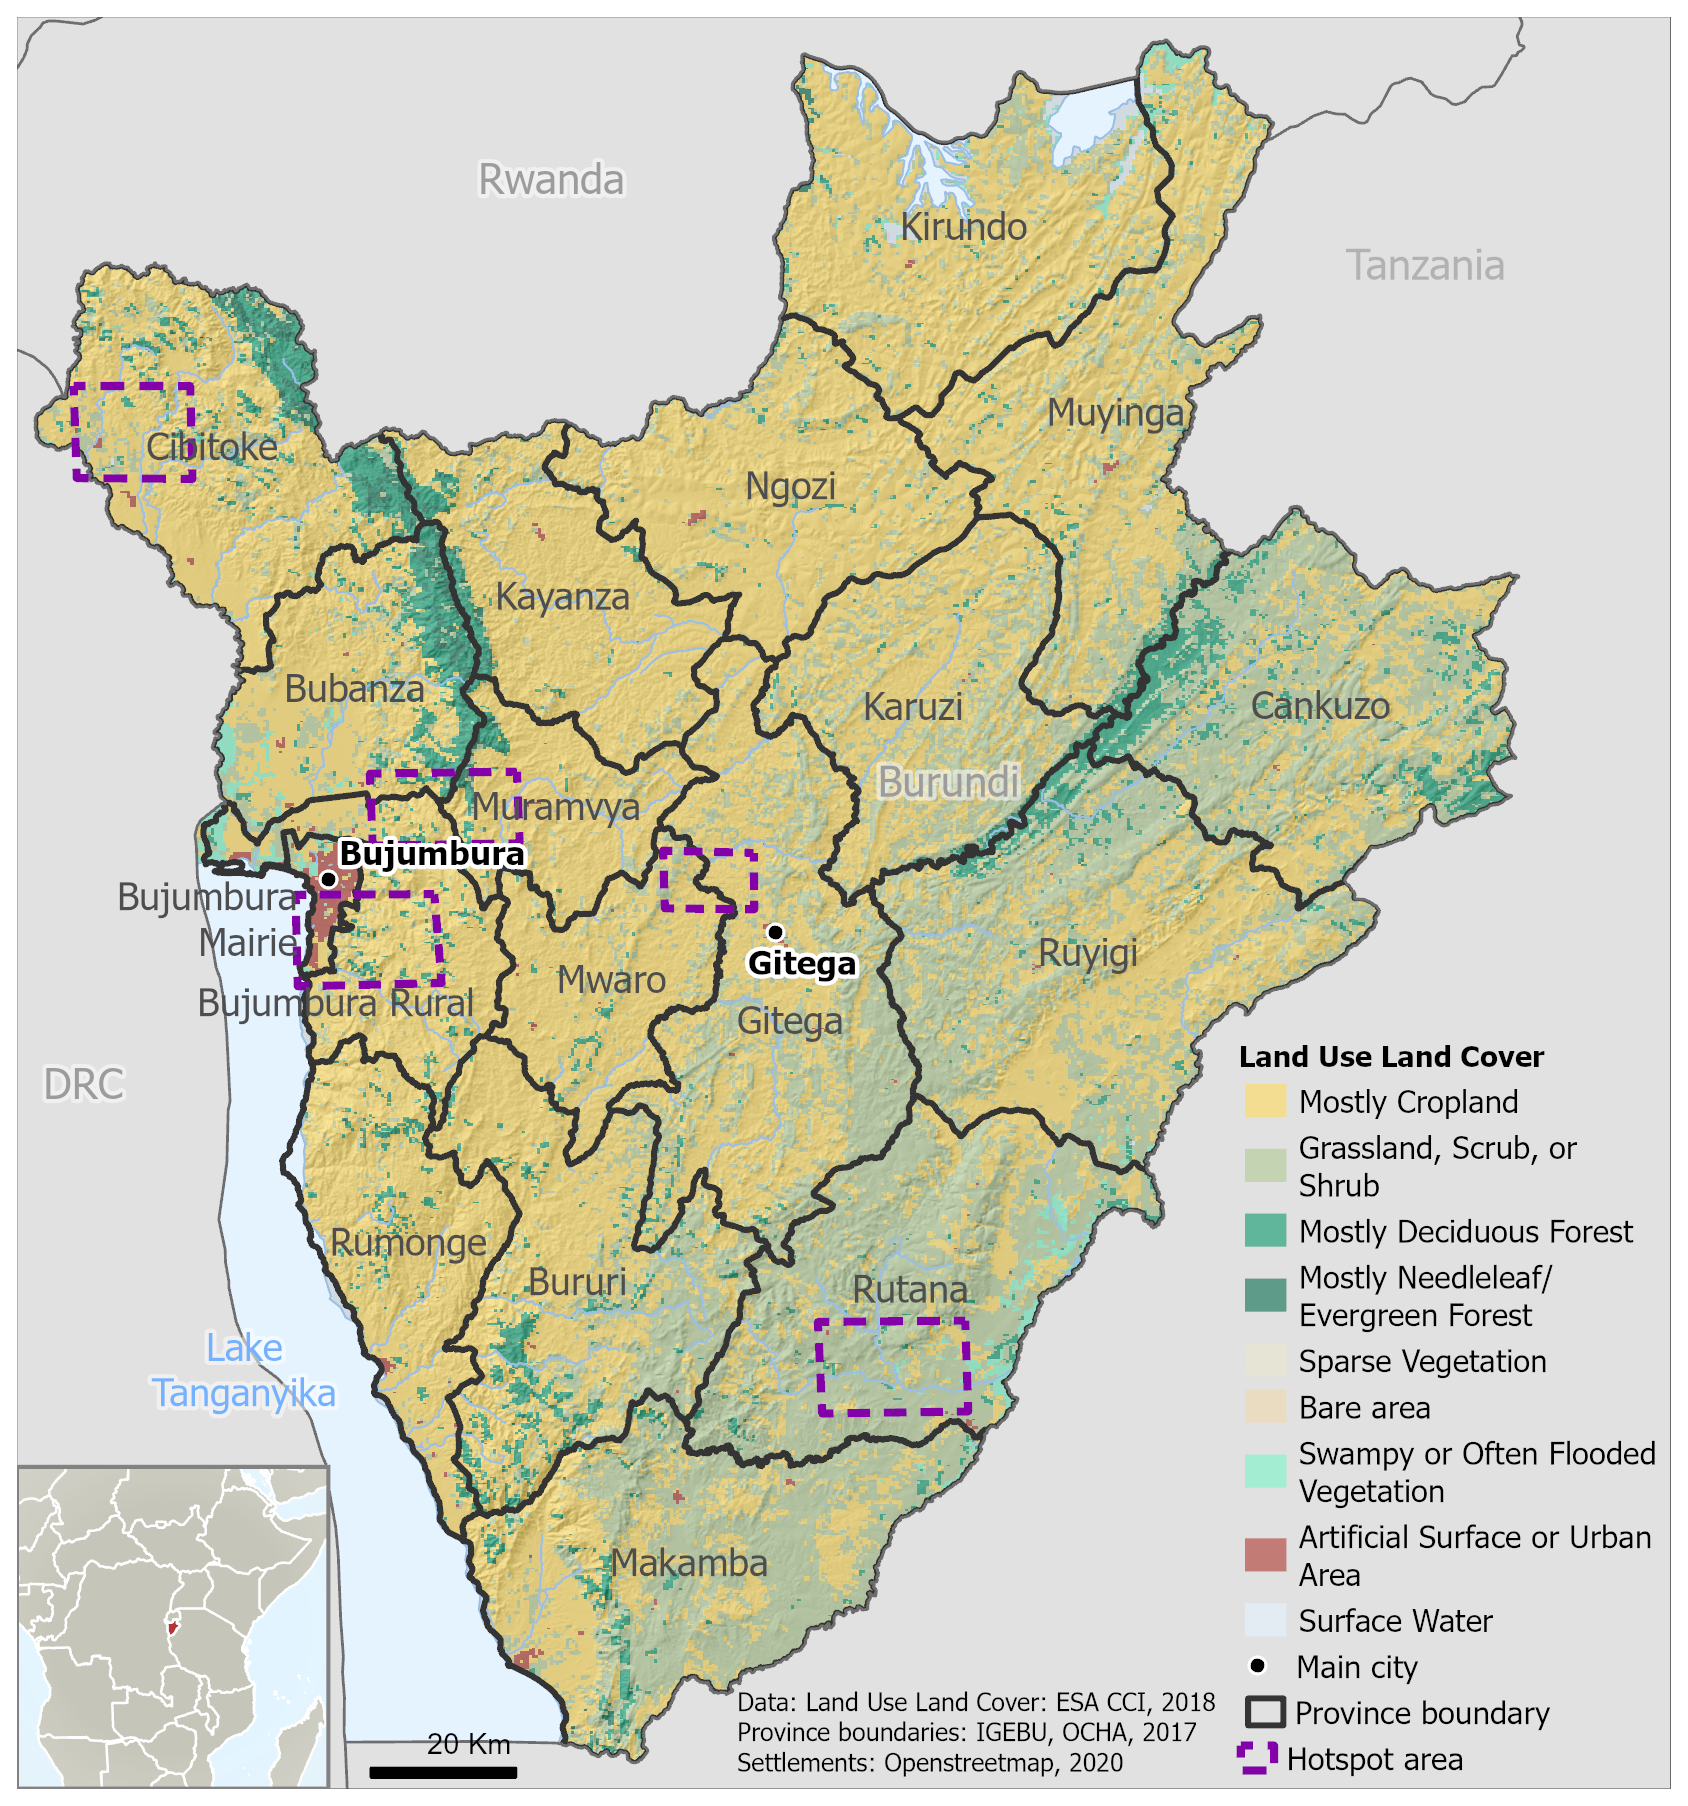
Figure 1Map showing Burundi; its topography, land cover, study areas (hotspot areas) and administrative divisions on province level.
Burundi is one of the smallest and most densely populated countries in central-eastern Africa. Of its 27 834 km2 about 2000 km2 are occupied by Lake Tanganyika, in the west of the country. It shares borders with Rwanda, Tanzania and the Democratic Republic of Congo. It is divided administratively into 18 provinces and 119 communes which are in turn divided into collines (literally, hills, in French). The economic capital is Bujumbura in the west of the country and political capital Gitega in its centre. The country shows a varied relief with altitudes that range from 774 m a.s.l. at the northern border of Lake Tanganyika to 2670 m a.s.l. of the highest peaks of the Congo-Nile Mountain chain that divides the country north-south. The country is subdivided in five eco-climatic regions (from west to east): the lowlands of the Imbo plain bordering the Tangan which corresponds to an extension basin of the western Rift Valley; the rugged region of Mumirwa; the mountainous range (Congo-Nile Mountain chain); the central plains and the Kumoso; and Bugesera lowlands (Fig. 1). Figure 1 also shows the hotspot areas for which more detailed risk assessments for some of the hazards were conducted.
The North Tanganyika-Kivu Rift region, located in the western branch of the East African Rift is characterized by active continental rifting. This rifting process has a rate of ca. 2 mm yr−1 which through the associated tectonic uplift has formed a rejuvenated landscape enclosing Lake Kivu and Lake Tanganyika. The steep terrain is associated with frequent landslides, mainly caused by rainfall linked to the tropical climate and the orography (Dewitte et al., 2021; Kubwimana et al., 2021). The landslide activity is partly controlled by uplift-driven landscape rejuvenation (Depicker et al., 2021a, b; Kubwimana et al., 2021) and affected by seismic activity. This region plays a critical role in shaping natural hazards in Burundi, as its tectonic activity and varied topography contribute to the prevalence of earthquakes, landslides, and localized flooding across the affected areas.
The economy of Burundi relies heavily on the agricultural sector, where, despite the scarcity of arable land, farming is practiced by 80 % of the population, mostly for subsistence. Burundi's farming system is characterised by small farm sizes, with average lots of 0.5 ha and a high land use intensity compared to other African countries (Dixon et al., 2019; Schneiderbauer et al., 2020). Nevertheless, agricultural productivity is low and food insecurity is high.
Amongst East African countries Burundi in 2010 had the lowest (13 %) percentage of urban population, although urbanisation is expected to increase (Dixon et al., 2019), as seen in the trend of urban sprawl in the capital Bujumbura where basic risk mitigation infrastructure such as stormwater drains are lacking (Nsabimana et al., 2023). Poverty is mainly rural and overwhelmingly affects small farmers, who lack technical skills, equipment, and financial capital. Approximately 1.7 million people needed humanitarian assistance in 2020 (OCHA, 2020). Investment in public services has not kept pace with rapid demographic growth, which is placing increasing pressure on resources and services such as healthcare and schools (ISTEEBU, 2017). Burundi in 2020 had a projected total population of around 11 million, a density of 442 inhabitants per km2 and a growth rate of 2.23 % in 2019 (ISTEEBU, 2013). Natural hazards and their impacts are the primary driver of human displacement in Burundi, with more than 80 % caused by what is described by IOM as “natural disasters” (IOM, 2020).
National DRR data context
According to the EM-DAT disaster data platform around 60 disaster events (with at least ten deaths or 100 affected people) occurred between 1997 to 2020, 38 of which corresponded to the five hazards considered in this study (flooding, torrential rains, landslides, earthquakes and violent winds). The remaining events were associated predominantly with epidemic events and droughts. The reported number of deaths was collectively around 300 with approximately 230 000 affected people. Overall, torrential rains and floods contribute most to these figures followed by strong winds. Most of the meteorologically triggered hazards occur along the western provinces of the country, those that drain towards the Tanganyika Lake from north to south, although relevant disasters have been also reported across the eastern provinces of the country. The area is also subject to landslides, usually triggered by intense precipitation, as well as earthquakes.
Table 1Comparison of disaster impact data characteristics between EM-DAT and the IOM Displacement Tracking Matrix (DTM) in Burundi.
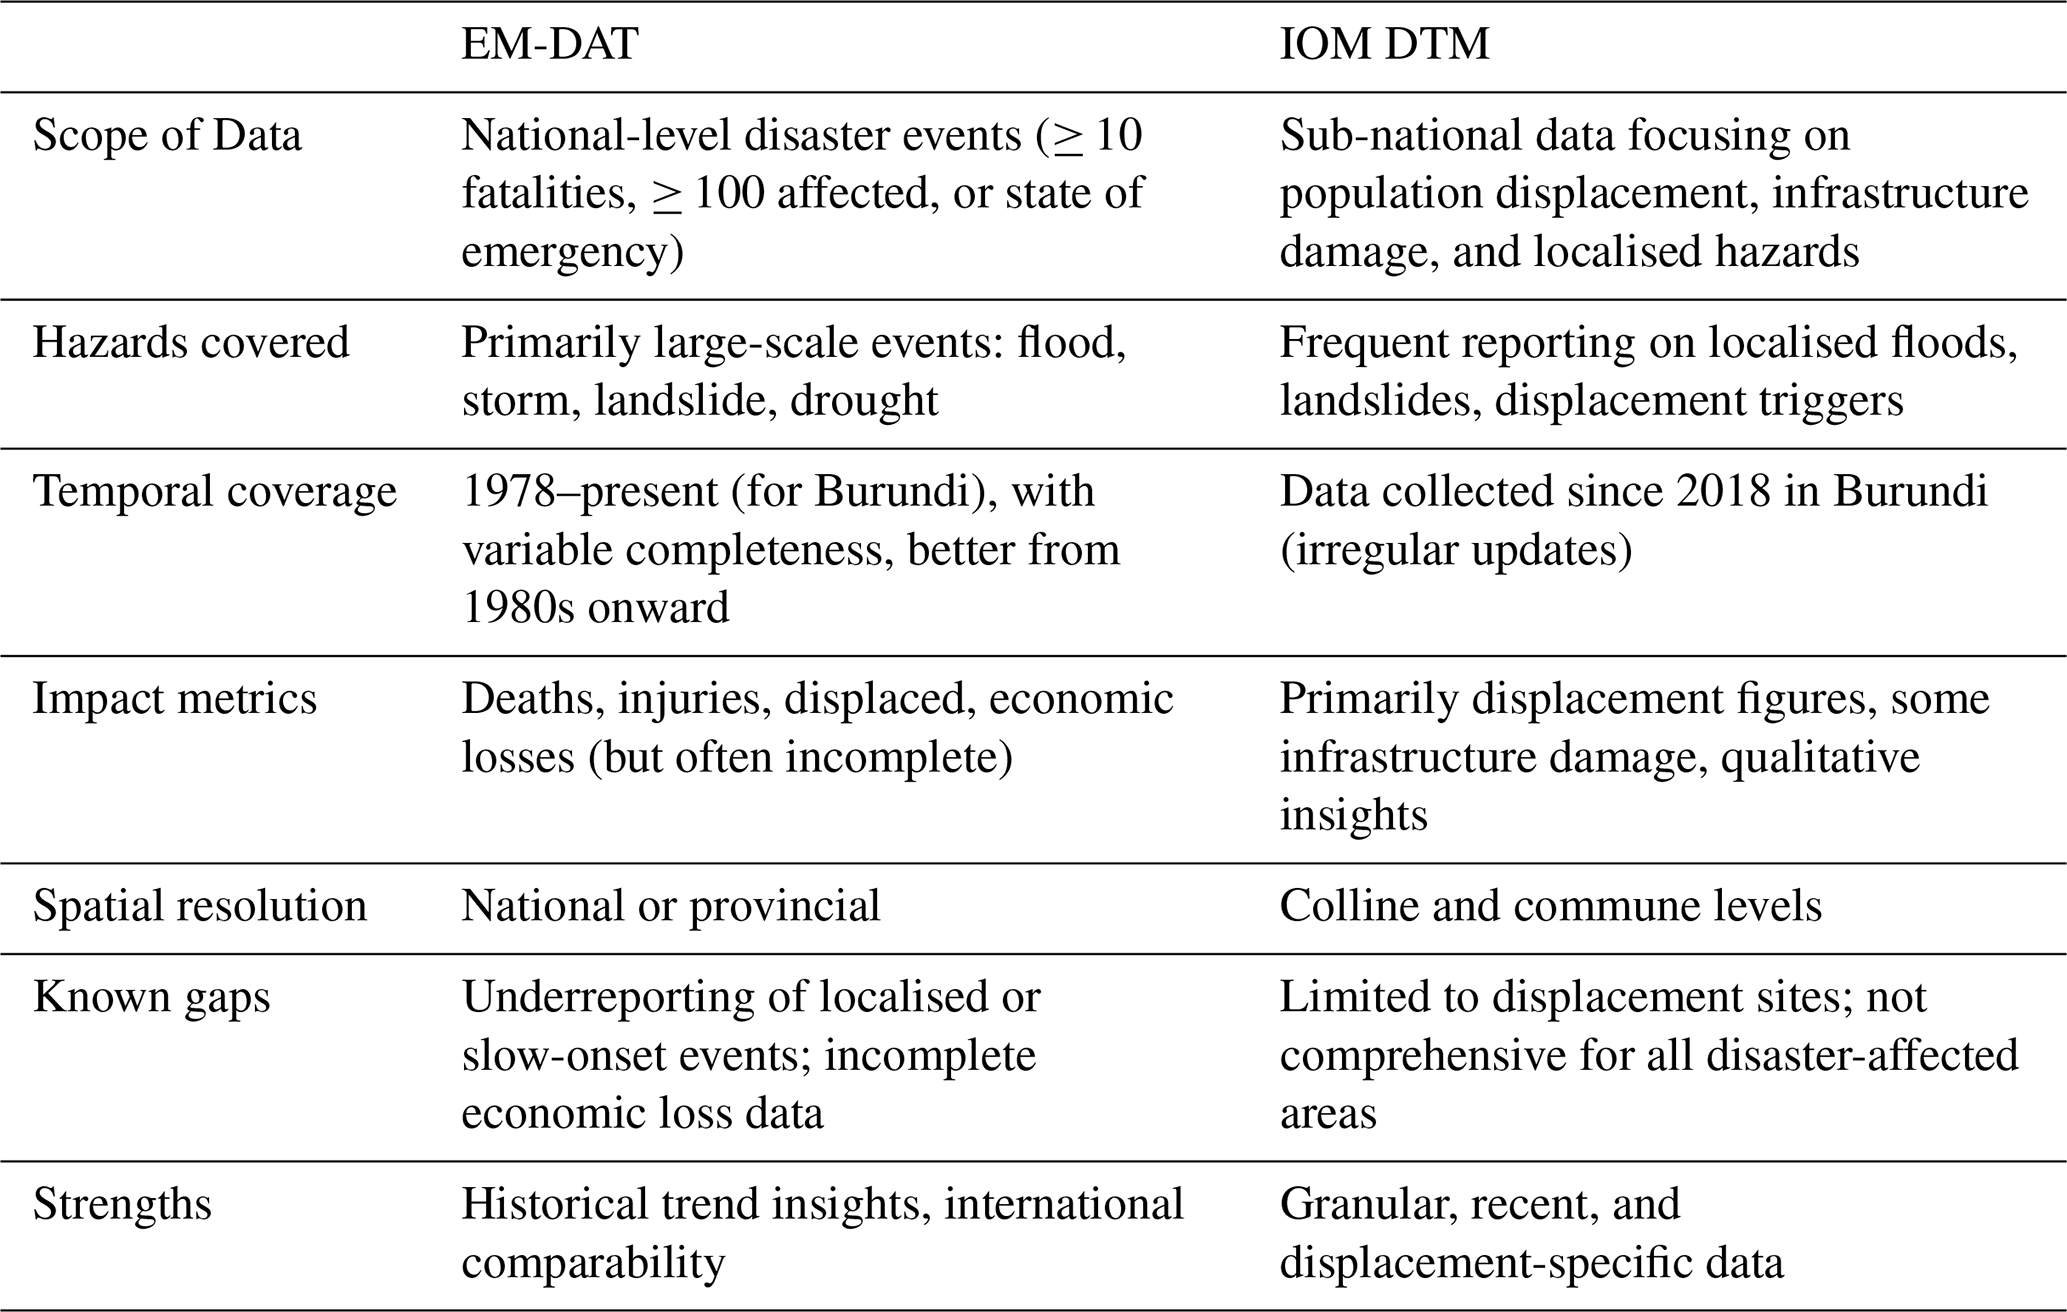
To complement these data with locally updated records, IOM's Displacement Tracking Matrix (DTM) platform began the systematic collection of disaster impact data in 2018. According to this database, during the 2018–2021 period around 9500 houses were totally or partially destroyed and more than 40 000 houses were affected by different disasters. Additionally, around 130 casualties or missing people were reported, as well as around 215 000 affected and nearly 80 000 displaced people. The discrepancies between these two datasets (EM-DAT and DTM) are illustrative of the difficulty encountered by the study team in understanding the overall historic context of natural hazards and disaster impacts in Burundi.
EM-DAT provides a broad, longer-term overview of major disasters in Burundi but lacks detail for smaller or more frequent hazards like localised floods. In contrast, the IOM DTM captures more granular, recent data on displacement caused by hazards but lacks the temporal depth and may omit non-displacement impacts (Table 1).
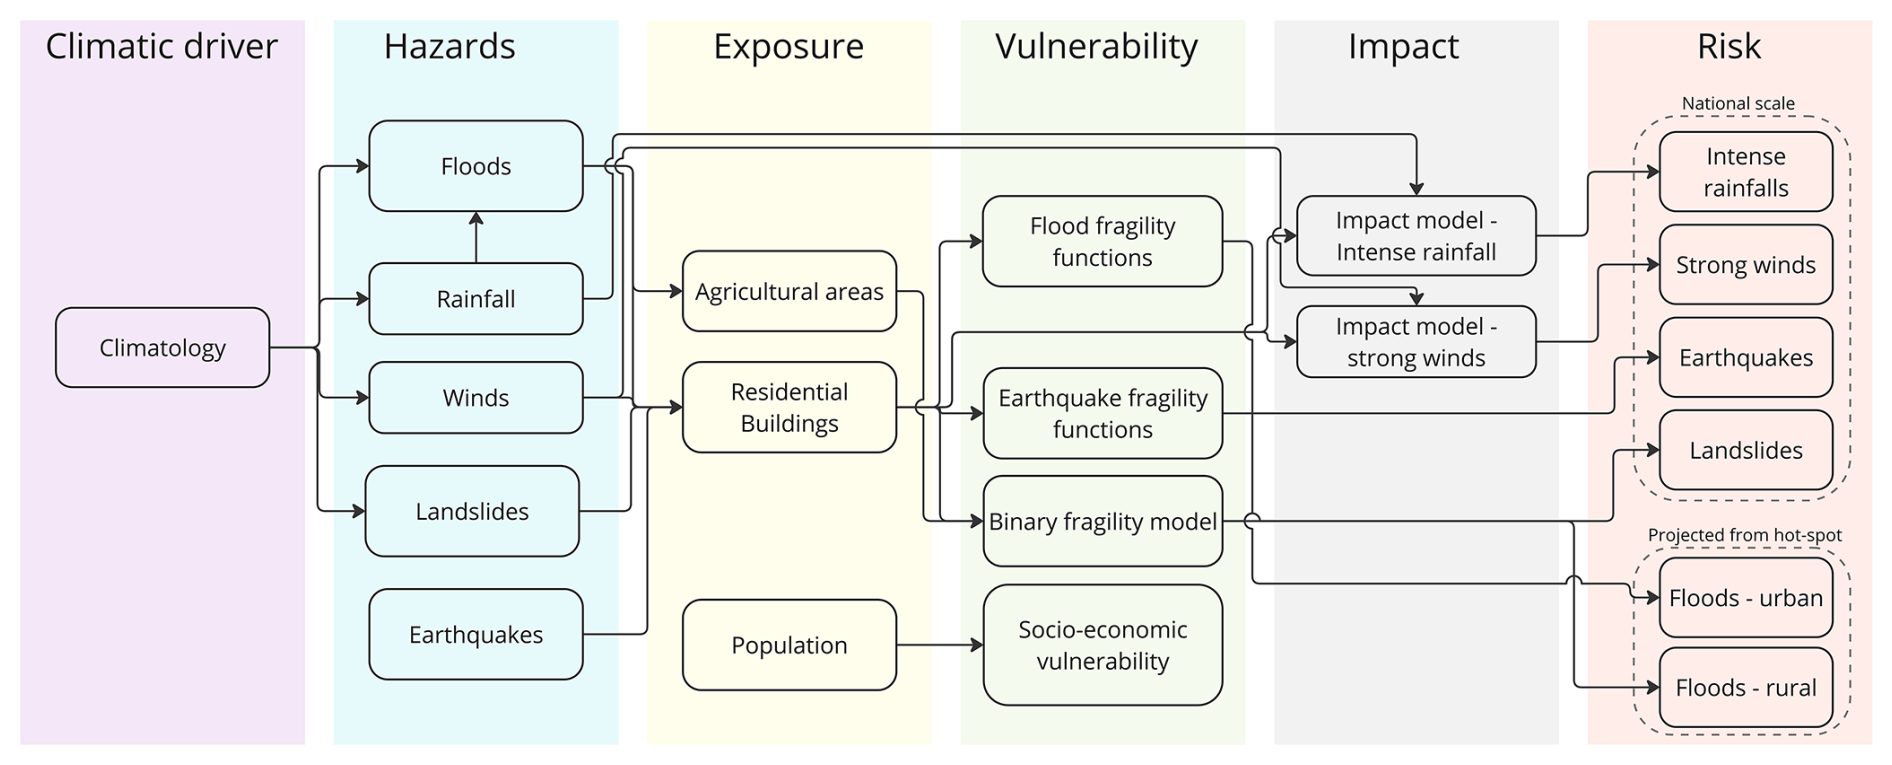
Figure 2Conceptual diagram of the methodology applied for the multi-hazard risk assessment. The graph shows the specific workflow employed for each specific combination of hazard, exposure and vulnerability in order to achieve AAL-based comparable estimates. The details of the individual steps are described in the hazard-specific sections below.
Figure 2 illustrates the internal workflow adopted for each individual hazard-risk assessment. It does not represent the full multi-hazard procedure, but rather the repeated hazard-specific process that is applied independently to each of the five hazards prior to their harmonisation and aggregation. The graph shows the specific workflow employed for each specific combination of hazard, exposure and vulnerability to achieve AAL-based comparable estimates. The overall multi-hazard workflow consists of (i) the parallel execution of these single-hazard risk assessments, (ii) the conversion of hazard-specific results into AAL-based loss metrics, and (iii) their aggregation across hazards and spatial units to derive multi-hazard risk indicators. The details of the individual steps are described in the hazard-specific sections below. Since most of the considered hazards are highly influenced by climatic conditions, an analysis and modelling of the climatic driver in the historical period 1990–2019 was undertaken. A probabilistic approach was chosen to allow for the estimation of annual average loss figures for all hazards, with different return periods (RPs) selected to better capture the expected frequency/magnitude distribution of underlying processes. Whenever possible the individual risk components, namely hazard, exposure, and vulnerability, were explicitly considered and integrated. In the case of strong winds and intense precipitation a simpler approach based on empirically derived hazard/impact relationships was employed (shown in the figure in the “impact” column). For earthquakes and fluvial flooding in urban environments physical vulnerability models (fragility curves) from literature were used, while for the impact of fluvial flooding on agricultural areas and for landslides a simpler binary fragility model was used, due to a lack of consistent alternatives. National-scale models were employed in most cases, except for fluvial flooding, which was carried out in more detail in several hot-spots and later projected to other flood-prone areas in the country.
The climate of Burundi varies in accordance with the diverse altitude across the country. It can be described as humid tropical and is characterised by the alternation of a rainy period from October to May and a dry season between June and September. Precipitation increases with altitude, with the lowest rates approximately 500 mm along the Rusizi river and Imbo plain, with the maximum rainfall being approximately 2200 mm in the highest regions. The average rainfall rate across the country is around 1270 mm. The wettest period of the year usually takes place during April, with the largest number of rainy days (between 16–26). The yearly average temperature decreases with altitude, ranging from around 15.6 °C in the high northern Kayanza province to 24.1 °C on the Imbo plain. The maximum average monthly temperatures coincide with the end of the dry season (September–October), whereas the lowest average monthly temperatures occur during the dry season (MEEATU, 2012).
The study of climate in Burundi was based on a combination of large-area climate predictions and local downscaling techniques. Global Climate Models (GCMs) in the CMIP5 (Coupled Model Intercomparison Project 5), were adjusted to obtain more specific information at Burundi national and subnational scale, climate “downscaling” was applied using a Regional Climate Model (RCM) called Weather Research and Forecasting (WRF) (Skamarock et al., 2008) in the version 3.9.1.1 (see Sect. 10 for further details and a discussion on the future climate).
Exposure is a key component of risk, which is at the same time very challenging to assess and often insufficiently considered by practitioners (Pittore et al., 2017). Key exposure information considered in this study includes population, residential buildings, and cultivated areas; additional information on infrastructure was also collected (see Campalani et al., 2023). The datasets used were either sourced from local expert sources or from trusted international projects and databases or derived through specific efforts by combining and processing existing datasets (as in the case of the population distribution and the characterisation of the residential building stock). Where more than one dataset was found, a comparative assessment was carried out and a recommended dataset was selected and shown on maps.
5.1 Population
Population in Burundi has grown from around 8 million people in 2008 (year of the last census: https://www.paris21.org/sites/default/files/BURUNDI-population-2008.PDF, last access: 13 February 2026) to around 12 million people in 2019 (projection of the National Statistics office ISTEEBU, (ISTEEBU, 2020). Thus, the population of Burundi can be considered highly dynamic. In order to provide a realistic representation of the current population distribution, a 100 m resolution building constrained gridded population modelled dataset was chosen over the much coarser population numbers available for the 119 communes. Two modelled population grids were analysed for quality against the available reference datasets. Based on the results of the accuracy assessment a calibration of the 100 m population modelled data was conducted. It is recommended to use the calibrated high resolution population grid sourced from WorldPop (https://hub.worldpop.org/geodata/summary?id=49676, last access: 13 February 2026, Stevens et al., 2015) as a representation of population exposure. The spatially explicit population model has been used to better constrain the total count and distribution of residential buildings, as detailed in the following, but could be used to also quantify the potential impacts on health and well-being.
5.2 Residential building stock
Given that no reliable nationwide building type distribution data was available from national institutions, an indirect projection approach was implemented. The process for establishing the number of buildings, their constructive taxonomies and projected distribution at commune scale was implemented based on the following three information sources: (1) IOM's Displacement Tracking Matrix (DTM) colline-scale building screening survey dataset (2020) covering 602 collines and providing approximate construction type distribution estimates and building occupation rates; (2) Global Earthquake Model (GEM) Foundation database (Silva et al., 2018) which provided a province scale validated inventory of building taxonomies (Brzev et al., 2013) and; (3) field visits, during which a general building diversity scheme was set up based on material types and assumed structure.
The data was processed as follows: first, the GEM taxonomy construction types were aggregated in accordance with the different vulnerability curves available for the different hazards focusing on a limited number of structural types. Secondly the DTM survey data were reviewed and aggregated by wall type. In total four wall type groups were defined: mud, bamboo/wood, adobe and brick/concrete. Lastly the GEM and DTM building types were merged resulting in the 10 baseline taxonomies.
The number of buildings per commune was calculated by combining the occupation rates and the total number of buildings scaled by the population distribution. For validation the results were compared with projections for 2019 of the 2008 census-based GEM data resulting in a good match. While a statistical comparison was not feasible due to data constraints, the spatial patterns and distribution proportions showed consistency with the projections and field observations, supporting the plausibility of the estimated building stock distribution. Finally, the commune-scale building type distribution data was represented in pie-distribution charts.
The main structural types of residential buildings are listed in Appendix B. The resulting national-scale exposure model is also provided as Supplement (Tables S1 and S2).
5.3 Cultivated areas
With the largest proportion of Burundian people's livelihoods depending on income from agriculture, land used for farming, i.e. cropland, is an essential asset potentially exposed to natural hazards and particularly to riverine flooding. Again, information on the distribution of agriculturally used land was not available from Burundian institutions. More than 60 % of Burundi is covered by cropland. Several land use classification products derived from very high-resolution satellites were analysed for accuracy. The mostly visual accuracy assessment found the 100 m landcover map for 2019 derived from Sentinel 2 satellite imagery best represented land cover in Burundi. In the absence of detailed ground-truth data for Burundi, we performed a visual cross-validation of these products against high-resolution imagery (e.g., Google Earth, Sentinel-2 composites). Pre-processing included the extraction of all the pixels classified as cropland and presenting this information in a cropland distribution per colline map (Fig. 3).
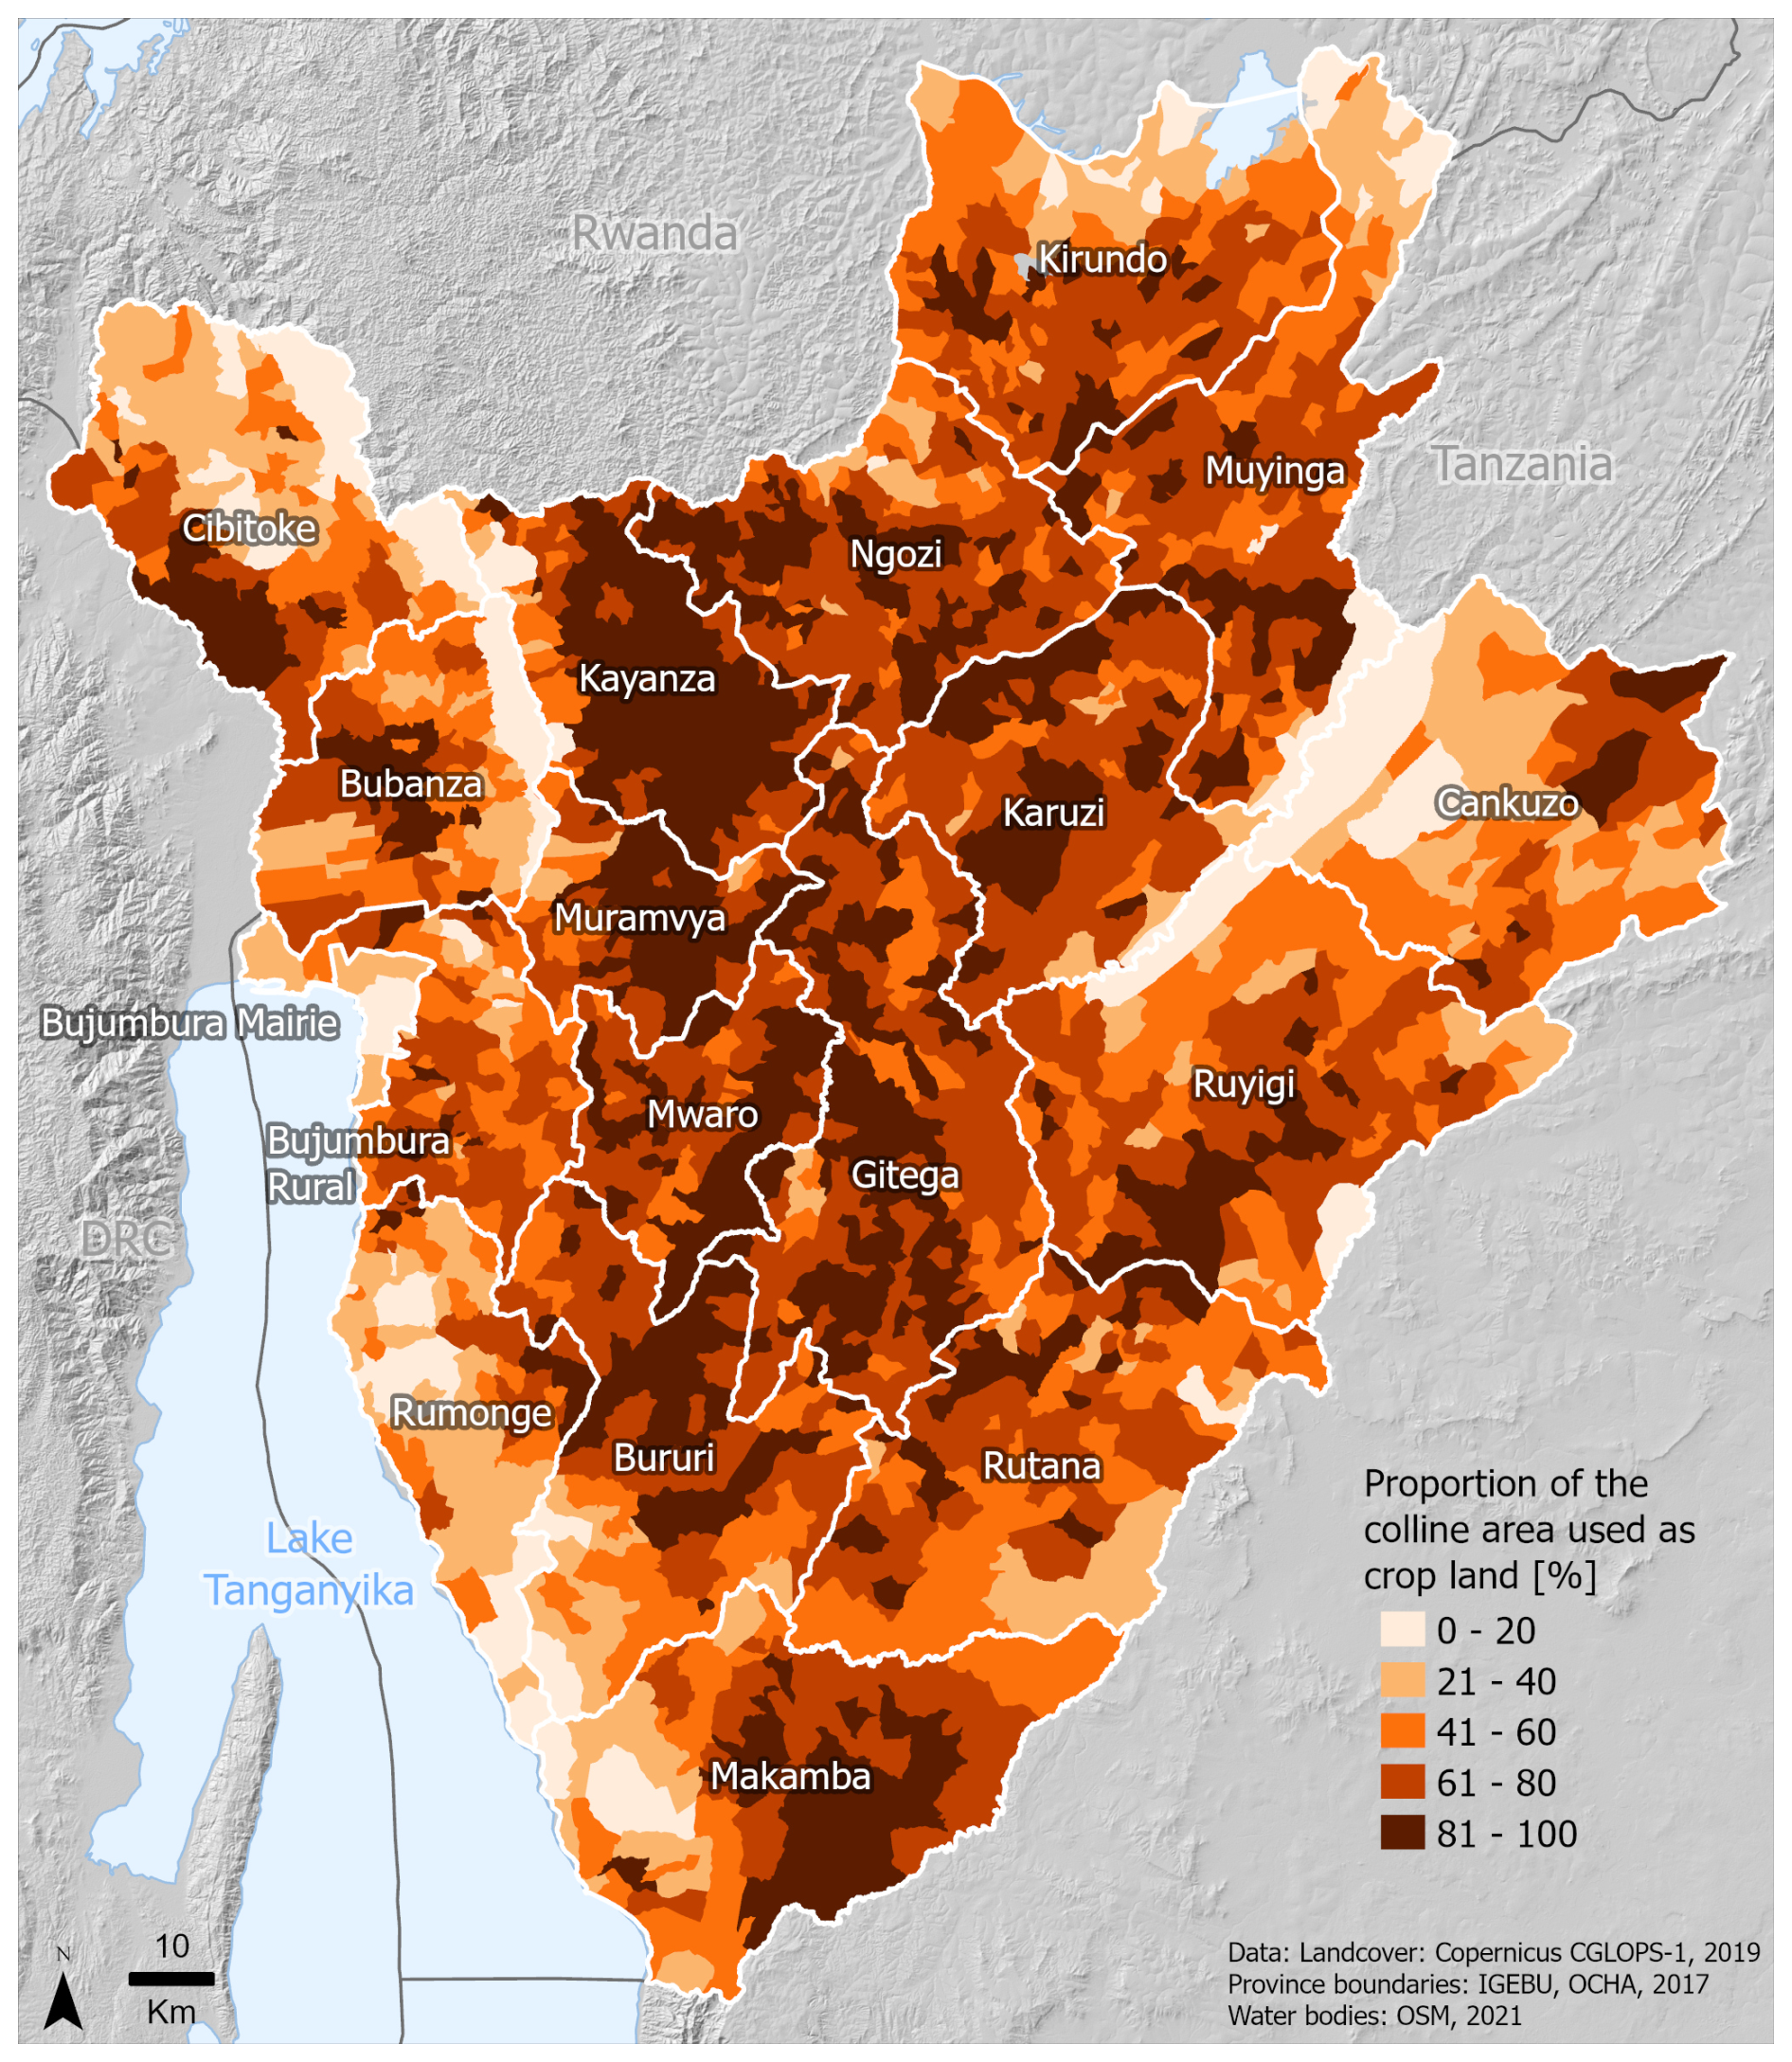
Figure 3Burundi: Map showing the density of cropland per colline.
Since specific information on how the different types of crops are spatially distributed was lacking, an average crop value of USD 1450 ha−1 was estimated considering the main crops to be found based on information from FAO and other international sources, and their relative intensity and market value, as described in the Appendix B. This modelling approach focuses on lowland regions close to the rivers, which are highly exposed to flood hazard.
6.1 Intense rainfalls and strong winds
The analysis of frequency and intensity of torrential rains and strong winds were assessed through the calculation of Intensity-Duration-Frequency (IDF) curves, which relate to the recurrency of a certain type of event (frequency), with a given intensity and duration.
The selection of extreme events intensity was implemented using the Peak-Over-Threshold (POT) method which considers all measurement above a chosen threshold. The 99th percentile of the time series was selected as threshold. The selected exceedances over the selected threshold are fit to a Generalised Pareto Distribution (GPD), which is the most appropriate distribution method for exceedances (Coles, 2001). Using POT increases the number of samples included in the analysis in comparison to other methods (such as Block Maxima) and reduces statistical uncertainties. The POT analysis provided the return levels for three return periods: 2, 10 and 50 years. It should be noted that the results show greater uncertainty the longer the return period. All the results have a spatial resolution of 3 km × 3 km according to the resolution of the models.
Torrential rains are intense precipitation events, usually from a convective nature (such as storms), that are associated with high risk of fluvial and river flooding as well as landslides. In the case of Burundi, the rainiest areas are those found at higher elevations. The fallen water flows from the mountains towards the Imbo plain. Historically, lowlands of the Imbo zone received the least rainfall per year. According to Nkunzimana et al. (2019) only 1.1 % of daily precipitation from 1960 to 2010 registered in Bujumbura airport was greater than 30 mm, while 88 % of the daily precipitation was less than 5 mm.
Strong winds are classified according to the maximum speed the wind reaches in a specific time interval. They are usually associated with storms and often compounded with strong rains and can damage buildings and infrastructure. For the analysis of strong winds, the maximum wind gust was considered. The data supplied by the modelling includes the average sustained 10 min wind speed. However, the WRF model does not directly provide information on the maximum wind gust, that is, the maximum wind speed in a time interval of 3 s for each time frequency considered. Therefore, to calculate the maximum gust for the country, it was approximated as the product of the average wind by a gust factor, kgust (Eq. 1):
where kgust has been set to 1.66 according to the recommendation of the World Meteorological Organization (WMO, see Harper et al., 2010).
6.1.1 Physical vulnerability to intense rainfalls and strong winds
In the literature there are no physical vulnerability models describing the impact of strong rains on residential buildings. Therefore, based on the available past disaster records reported by the IOM DTM, nationwide rain and wind intensity-impact relationships have been developed as proxies for vulnerability. Both relationships are assumed linear.
The rain intensity–impact relationship is expressed as:
with linear extrapolation for rain intensities exceeding 60 mm h−1.
The wind gust–impact relationship is expressed as:
with interpolation applied for wind gusts exceeding 60 km h−1.
6.1.2 Risk Analysis
The actual risk estimation process was developed following the steps described hereunder.
Recurrent, 2-10-50-100 and 500-year return period, weighted average commune-scale 3 h-accumulated rain intensities and 2-10-50 and 100-year return period, weighted average commune-scale 10 min-aggregated wind speeds were crossed with the commune estimates of adobe, wood and wattle and daub building taxonomies distributions. Each building unit is associated to a fixed value of USD 1000.
For the return periods indicated, the exposed value in each commune was aggregated to the vulnerability index, in accordance with the rain intensity ranges 10–30, 30–50, 50–70, 70–90, 90–110 and 110–130 mm/3 h for intense rainfall and 10–30, 30–50, 50–70, 70–90, 90–110 and 110–130 km h−1 for strong winds. The vulnerability index values that were applied were those associated to the mid-range values of the indicated ranges according to the estimated intensity-impact relationships.
The risk was estimated for each commune and recurrence period. Additionally, the nationwide risk was calculated by the sum of the 119 partial commune risk estimates. The comprehensive nationwide scale risk ratings for each of the five return periods is also defined as the Probable Maximum Loss (PML) for the specific return period. Based on the estimated PML data for the different return periods, the associated Loss Exceedance Curve graphs were prepared, and the Average Annual Loss (AAL) was calculated
6.2 Fluvial flooding
A national scale flood hazard map for Burundi was generated by combining historical and geomorphological approaches. The method consisted of three steps: (1) collection of historical information and data related to flood in the region; (2) preliminary analysis of flood frequency, magnitude and related impact from available information; (3) definition of possibly highly susceptible areas at national scale. Complementarily, (4) geomorphological analyses based on digital terrain models were carried out in those flood-prone areas that were insufficiently covered by the historical flood information. Based on the input provided by local experts, flood plains and other relatively flat areas along river courses were considered as flood prone areas regardless of the lack of flood records in those specific areas.
Information on 64 flood events that occurred between 2000 and 2020 was collected and analysed. Event dates, locations, and reported impacts were compiled from FloodList (https://floodlist.com/tag/burundi, last access: 13 February 2026) and EM-DAT (https://public.emdat.be/, last access: 13 February 2026). These sources provide general event metadata, but do not report rainfall totals, flood depth or inundation extent. Consequently, with this assessment, the records were used to identify approximate flood-prone areas along the watercourses mentioned in the historical accounts.
An exploratory data analysis at province level indicated that the highest number of registered flood events were concentrated in the western regions of the country, in the basins that drain to Tanganyika Lake. Almost 40 % of the flood events were recorded in the provinces Bujumbura Mairie (19 %) and Bujumbura Rural (20 %) while the provinces of Bubanza (8 %) and Cibitoke (10 %) also show a relatively high flood proneness. According to available information since the year 2000, flooding damaged around 500 000 homes, directly affected 400 000 people and displaced 600 000 people (displaced people are not included in the affected people group).
Percentile bootstrapping was applied to define high probability flooding areas associated to each flood event included in the database. A preliminary map depicting the estimated flood hazard proneness areas was then developed.
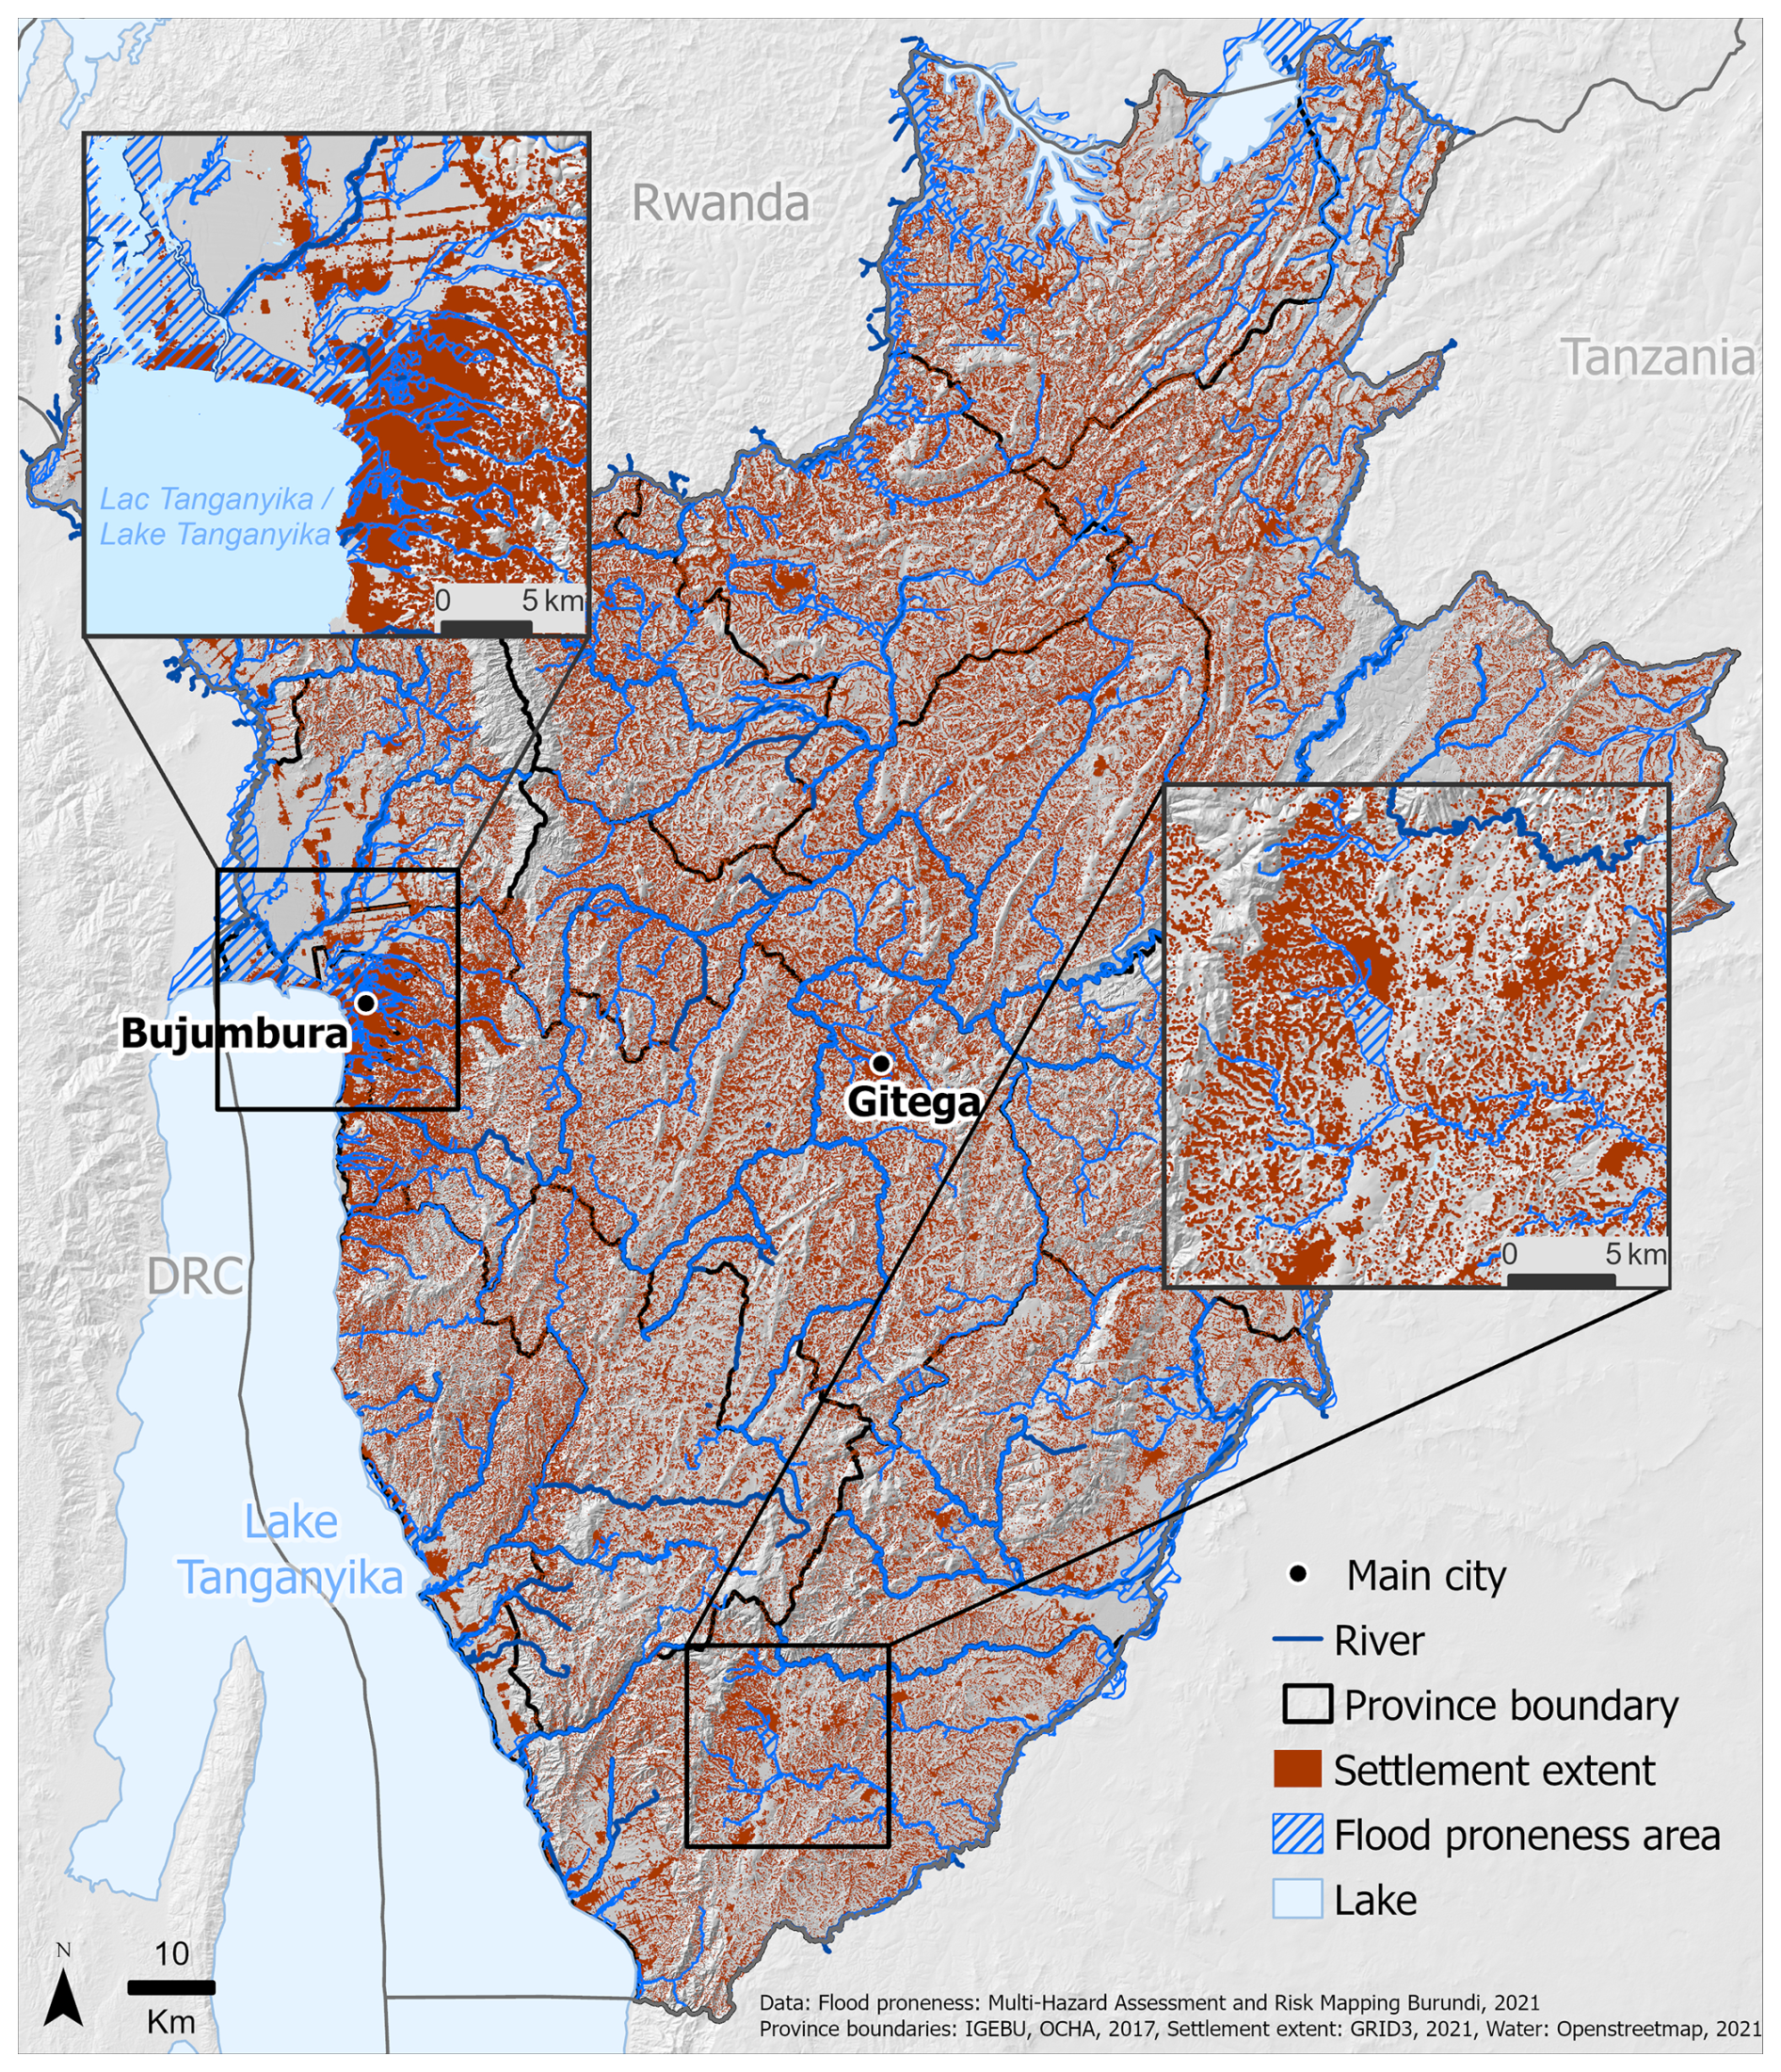
Figure 4Burundi: National Flood Proneness Map.
Historic information related to spatially explicit data on rivers classified by their importance (i.e., hierarchy) and proximity to populated areas were used to identify watercourses to be studied in further detail. Topographical stream analyses based on a 10 m digital terrain model allowed the extraction of streams with a hydraulic order higher than 3 for subsequent analyses. In addition to all 3rd order streams within Burundi, smaller streams were also included in cases where the historical data depicted a past flood event.
Finally, the flood proneness map was refined on specific locations that were not adequately covered by the historical assessment due to lack of available information. Main activities entailed updating the land classification for the GIS processing of watercourses and flood-prone areas (valleys and fluvial terraces), the geomorphological assessment of riverbanks to identify erosive forms that may be indicative of historical flood events as well as the assessment of vegetation. This latter feature is often related with historically flooded areas in combination with sedimentary areas along the riverbanks. The resulting national-scale fluvial flood proneness map is shown in Fig. 4.
The flood proneness map was used to extend the economic risk calculated for five hotspot areas to the national scale. To estimate flood risk in these hotspot areas (selected local case studies), a standard probabilistic flood-hazard assessment method was followed. This analysis comprises two processes, first a hydrologic study of the selected catchment area to estimate the recurrent (i.e. associated to the return period) water discharge rates that can be observed at a specific point along the river stream and, second, a hydraulic modelling activity to better characterise how the different recurrent discharge rates might generate flood events within the downstream river sector. The elaboration of the hydrological precipitation-runoff model was carried out using the Hec-HMS software developed at the Hydrologic Engineering Centre (HEC) of the US Army Corps of Engineers. The HEC-HMS rainfall–runoff models were implemented for five hotspot catchments rather than as a single national model. Each hotspot basin was schematised in a semi-distributed way using subbasins, reaches, junctions and an outlet, and precipitation forcing was implemented via a specified hyetograph (design storm) for each return period. In line with the data-scarce context, we used standard HEC-HMS methods: SCS Curve Number (loss), SCS Unit Hydrograph (transform), Constant baseflow and Muskingum routing. Model calibration could not be undertaken in a fully quantitative manner due to limited hydrometric observations; therefore, parameterisation and plausibility checks were supported by comparison with compiled historical flood references and expert validation in the Bujumbura hotspots for lower return periods.
6.2.1 Physical vulnerability to floods
Vulnerability of residential buildings
Englhardt et al. (2019) propose vulnerability curves adapted to the African context which were used to estimate the relative damage factor associated to the water depth during fluvial flood events across Burundi. This vulnerability model has been employed in an Ethiopian context with building types comparable with those observed in Burundi.
Vulnerability of crops
As for the impacts of fluvial flooding to agricultural plots a comparable approach was applied as the one implemented for landslide risk. Hence, 100 % crop loss was associated to a flood event impacting the area associated to crops in the 2019 high resolution landcover map. This mostly refers to areas in the flood plains that are dedicated to agriculture. The use of a simple binary function is justified, also out of precautionary considerations, by the uncertainty of exposure information (the specific crops are not mapped across the country) and by the consideration that physical vulnerability of crops to floods depends as much on the timing of the event (i.e., in relation to the phenological cycle) as on the specific crop type, as for instance discussed in Molinari et al. (2019). In the highest vulnerability conditions, most crops will be expectedly destroyed with even a moderate (e.g., larger than 0.4 m) flooding.
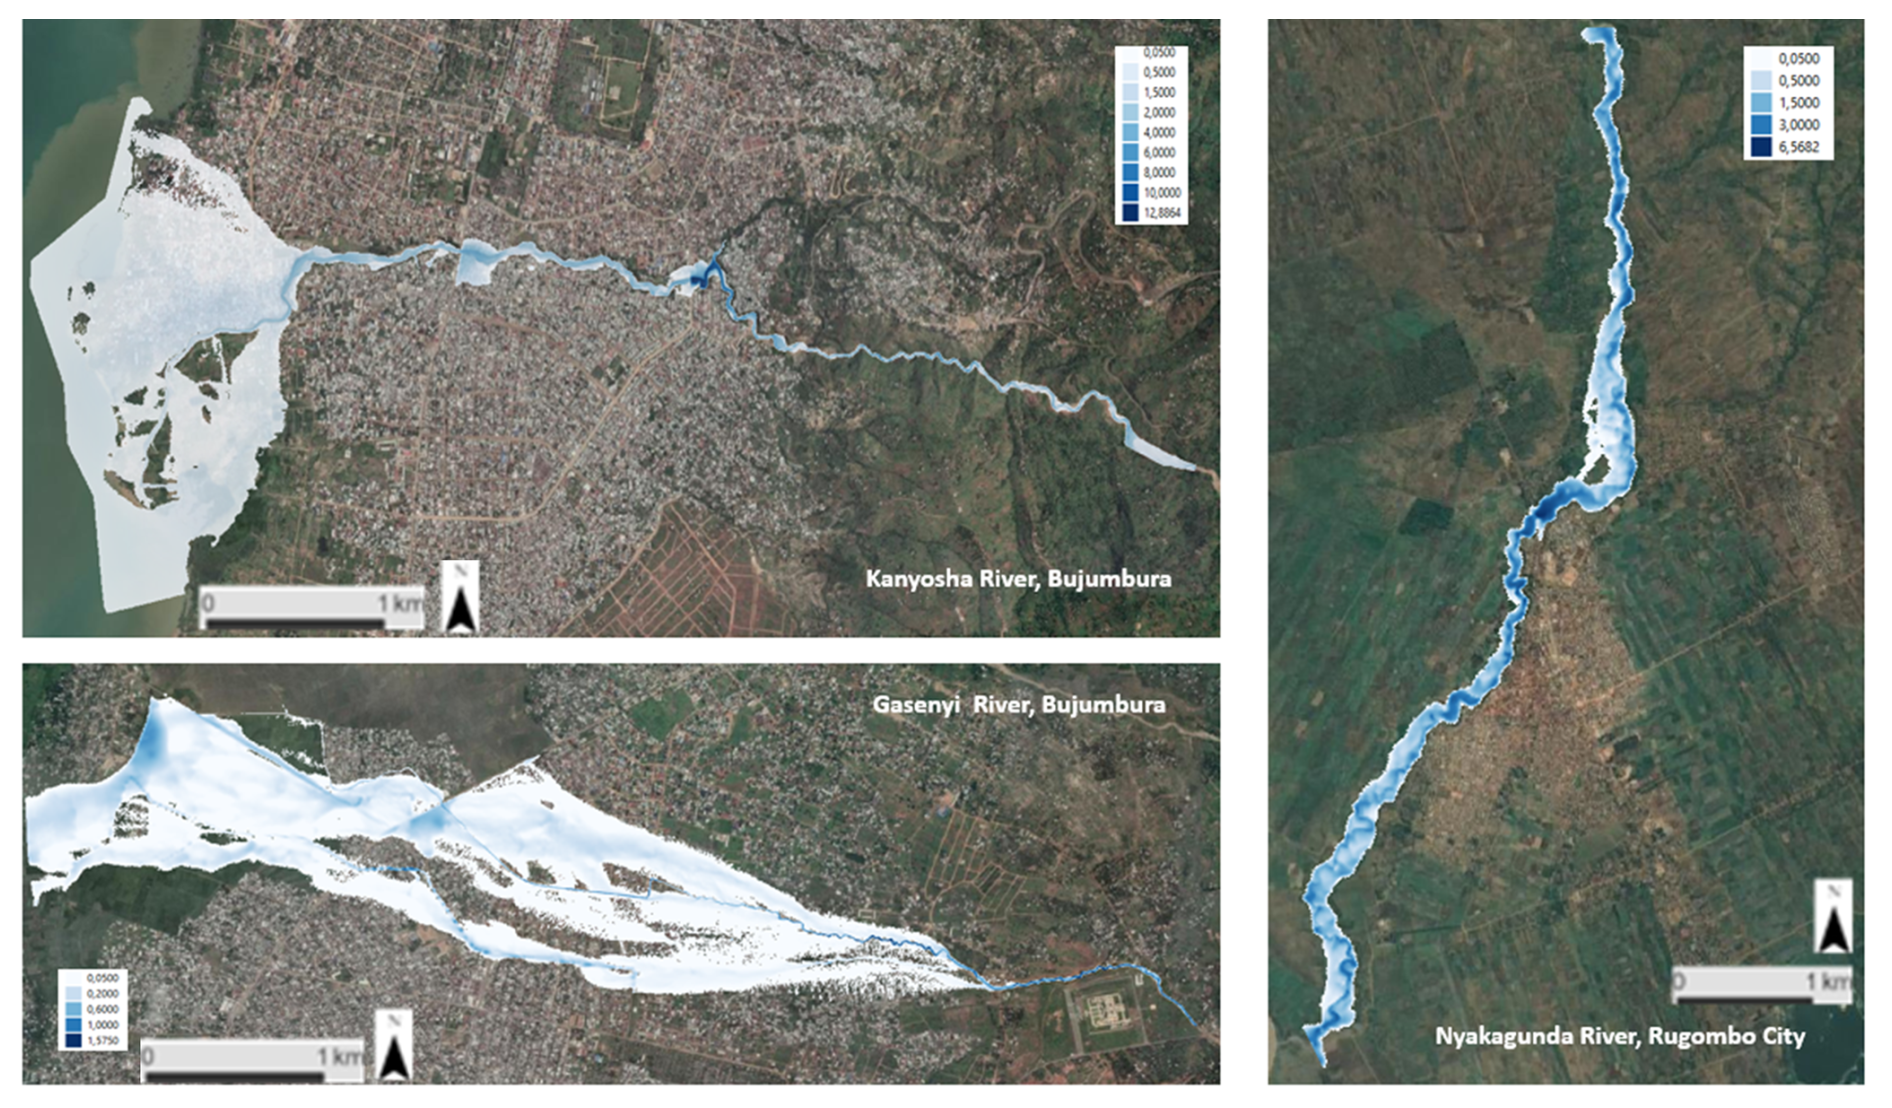
Figure 5Burundi. Bujumbura and Rugombo: Examples of results of three of the five hotspots under study for 500-year return period scenario (Map data and imagery © 2021/2022 Google, Maxar Technologies, and CNES/Airbus. All rights reserved. The imagery was accessed using the QuickMapServices plugin (NextGIS) within QGIS).
6.2.2 Risk Analysis
The risk estimation process followed these steps:
-
The hydrological model was employed to estimate the recurrent precipitation for five selected catchment basins, for which IDF curves for each considered return period were developed. The IDF curves were derived from gridded precipitation time series at 3 km ×3 km resolution produced by the project's climate downscaling (WRF v3.9.1.1). Extreme precipitation was characterised using a Peak-Over-Threshold approach (99th percentile threshold) with GPD fitting; for each hotspot catchment the precipitation series was obtained by spatially averaging grid cells within the catchment (or using the nearest cell when no grid point fell within the catchment).
-
In the subsequent hydraulic study, the water levels and flow velocities reached during each rainfall event associated with a given return period were estimated.
-
A set of inundation maps was prepared for each hotspot area both for the current climate and the selected climate change scenarios. Figure 5 shows three of these maps for the 500-year return period (without considering the potential impact of climate change).
Risk was then quantified by intersecting the return-period flood footprints with exposure layers (buildings and population) and applying the corresponding vulnerability/impact models to estimate expected damage and affected people.
6.3 Landslides
Landslides are a common process in Burundi, particularly in the area of the North Tanganyika-Kivu Rift, which is also heavily anthropized (Depicker et al., 2021a, 2024). Since a probabilistic risk-oriented landslides hazard model was not available during the project, landslides hazard at national scale was preliminarily assessed in two phases: first generating a national-scale model of landslide susceptibility and then adding a time-recurrence and an intensity-frequency model.
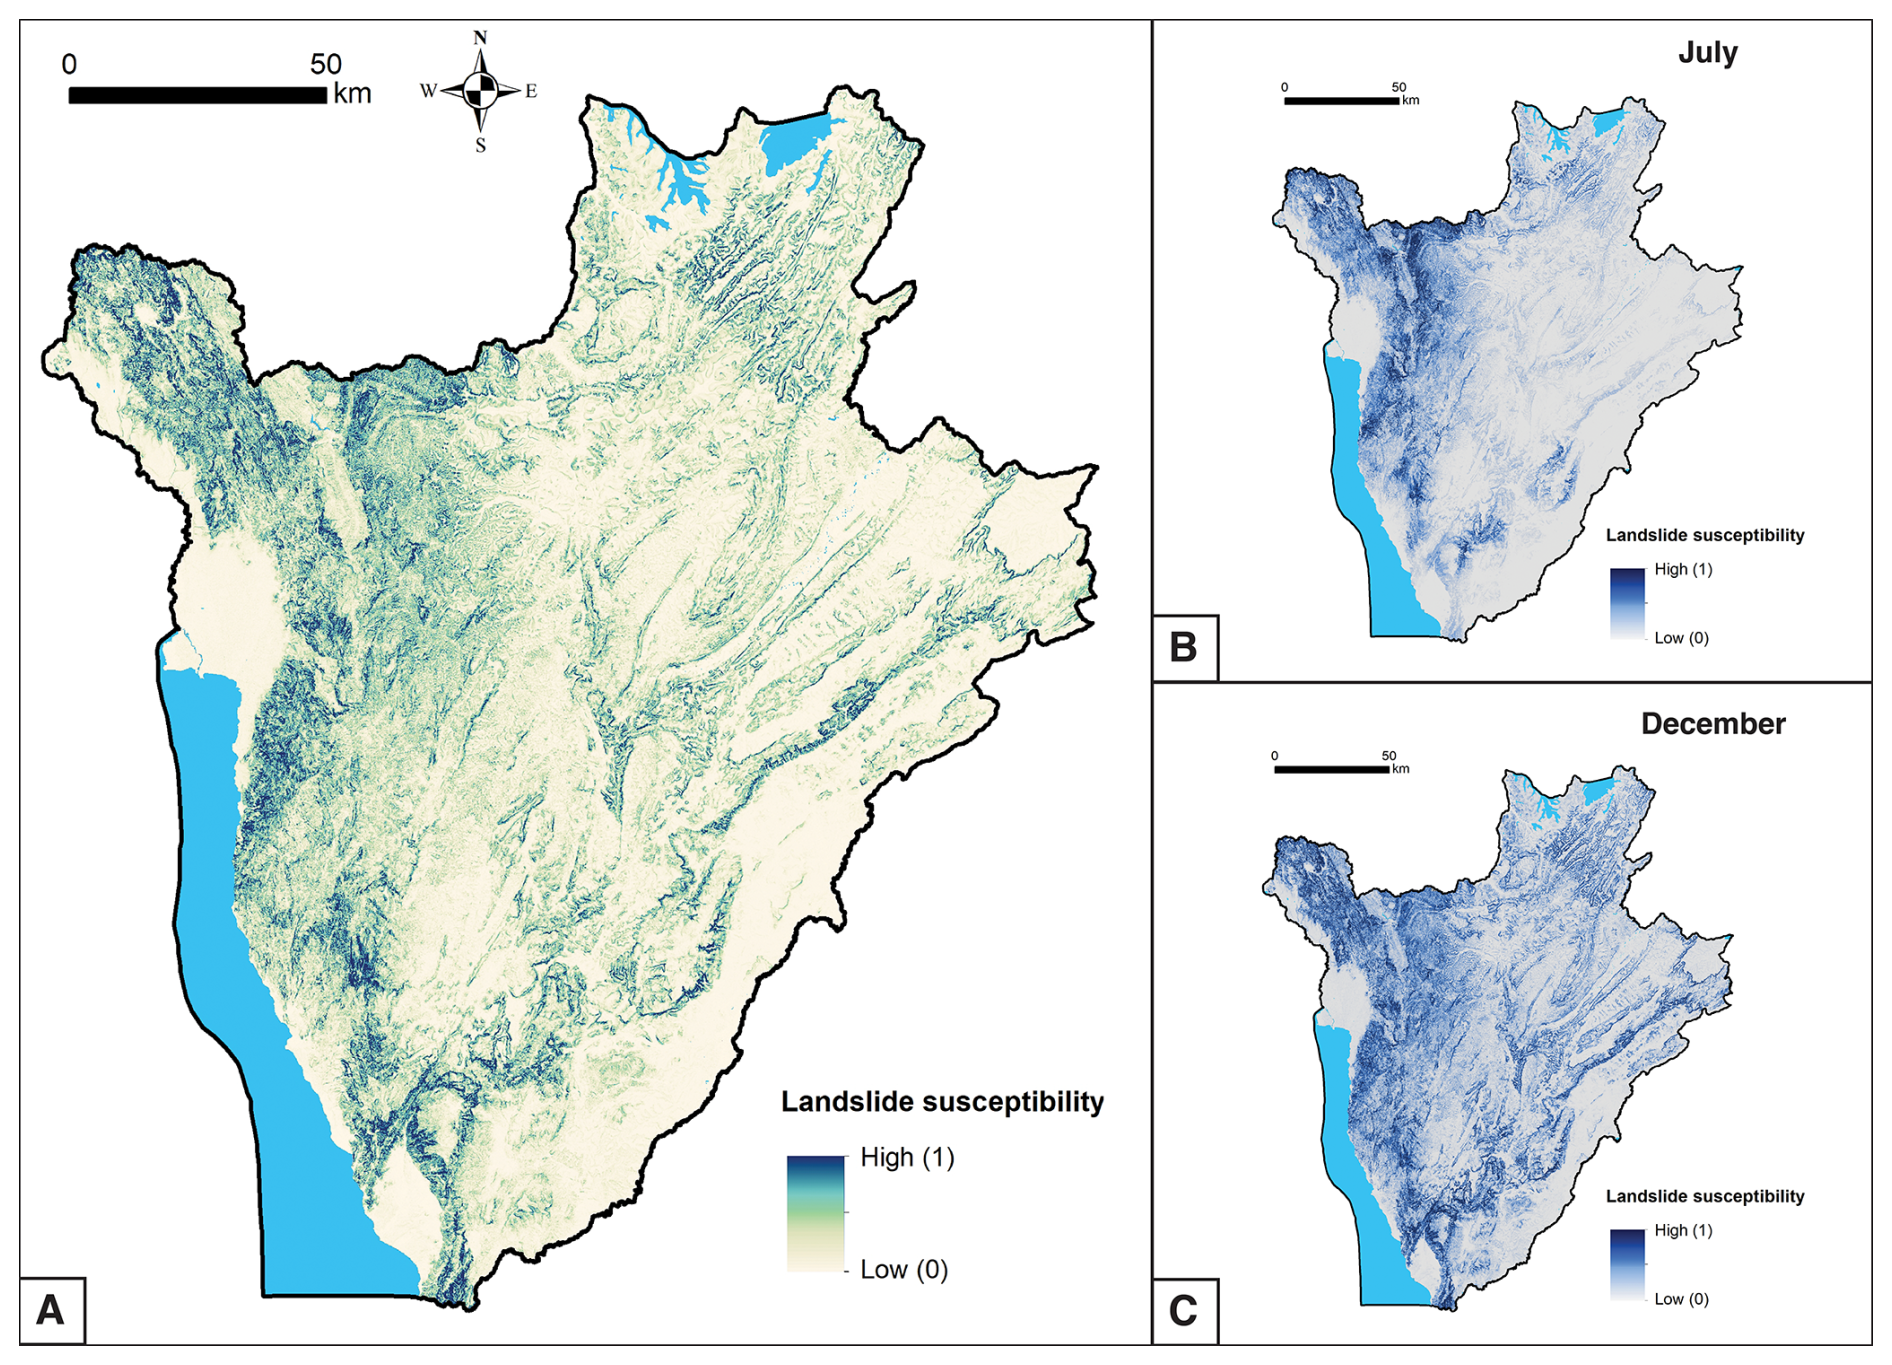
Figure 6National landslide susceptibility for Burundi (A) and landslide susceptibility for July (B) and December (C), months with respectively low and high precipitations.
Landslide susceptibility was addressed using a statistical, data-driven approach known as Generalised Additive Model (GAM). A GAM accounts for non-linear relationships between landslides and different environmental factors. The landslide inventory used for building the model consisted of landslide data partly based on studies conducted by Nibigira et al. (2013) including a subset of landslide information published by Broeckx et al. (2018) reaching a total of 770 landslides. After 2020 several other inventories have been published (e.g., Deijns, 2022; Depicker et al., 2021b), which were not available in the time frame of these activities and could be employed in future assessments. The static environmental factors comprised a set of terrain derivatives (i.e. slope angle, topographic wetness index, slope aspect, curvature, relative slope position, geomorphons and terrain ruggedness) derived from the digital terrain model SRTM V4.3 and land cover maps. The resulting model was quantitatively validated using k-fold cross-validation and showed good performance in correctly identifying areas prone to landslides (median area under the receiver operating curve of 0.89 after 100 model runs).
In order to explicitly consider the dynamic role of precipitation as relevant landslide triggers in the area, the average of the maximum 3 d precipitation for every month was computed and used along with the landslide susceptibility to produce landslide susceptibility maps as a function of the precipitation patterns throughout the year as shown in panels B and C in Fig. 6.
A recurrence model was produced to estimate the expected frequency of the landsliding processes at national scale to assess the landslide hazard. Due to the lack of multi-temporal information on landslide observations, a simplified recurrence model was developed using a heterogeneous Poisson Process model where the previously generated monthly landslide susceptibility drives the spatial occurrence of landslides. The model was calibrated by setting the average (expected) annual number of events to 1000 events (Baddeley et al., 2005; Calvo and Savi, 2009; Patanè et al., 2025).
The choice of a Poisson point process was motivated by the need for a simple and flexible approach to stochastically generate large set of events with a spatially and temporally variable rate. The heterogeneous point process allows for the integration of both the susceptibility map (which indicates propensity and is not a probability) and frequency-magnitude scaling law into a model more suitable for probabilistic landslide risk assessment, albeit very simplified. The specification of the expected annual number of landslides represented a major source of uncertainty, reflecting the limited completeness and temporal coverage of available landslide inventories at the national scale. Additional uncertainty arose from the assumption of temporal independence between events and from the use of susceptibility maps as spatial intensity proxies rather than true occurrence probabilities. These sources of uncertainty were implicitly accounted for through the stochastic nature of the heterogeneous Poisson process and the Monte Carlo simulation framework, in which multiple realisations of landslide events are generated and aggregated to derive probabilistic loss estimates.
Furthermore, it was necessary to characterise the distribution of event intensity, which in the case of shallow landslides can be approximated by their size in terms of spatial extent (Tanyaş et al., 2019). To achieve this, we used a power-law frequency-area distribution to identify the frequency of small landslide events with respect to larger ones. We modelled the landslide area AL using an empirical size–frequency relationship in which the noncumulative probability density follows a power law, , a behaviour commonly observed for medium-to-large landslides. For substantially complete inventories, this scaling is often represented with a three-parameter inverse-gamma function that captures both the power-law tail and the rollover at small sizes (Malamud et al., 2004). Due to the absence of a consistent local inventory suitable for calibration, we adopt as a pragmatic central estimate, supported by the mean exponent reported across 27 global inventories in mountainous settings (Van Den Eeckhaut et al., 2007a) and consistent with other scaling studies (Stark and Hovius, 2001). We apply a minimum event area threshold of 100 m2 to reduce the influence of the rollover region where the power-law assumption is not valid.
The parameters of this law were estimated by considering the existing inventory of past events, the most likely trigger (precipitation), the literature (Corominas and Moya, 2008) and expert judgment were deemed representative for the subsequent risk analysis. The determination of the appropriate scaling law would require a more consistent dataset. However, it was deemed that a fixed power exponent of −2.3 was a plausible estimate. This is for instance the mean value (SD: 0.56) of a set of 27 global inventories including events triggered by rainfall, snowmelt and earthquakes described by (Van Den Eeckhaut et al., 2007b) (see also Tebbens, 2020). A minimum event size of 100 m2 has been chosen to exclude small events within the roll-over of the distribution.
6.3.1 Physical vulnerability to landslides
Considering the lack of fragility models compatible with the geographical setting and the use of a stochastic approach to estimate the risk, a simplified model for physical vulnerability (fragility) was adopted in the case of landslides. Residential buildings were assigned maximum damage (hence a loss equal to 100 % of replacement cost) if their position fell within a given distance (equal to the radius of a circle whose area is proportional to the estimated landslide size) from the location assigned to a landslide event generated stochastically during the simulation, and zero damage (hence, a loss equal to 0) if outside. The vulnerability has been considered the same irrespective from the type of building structure, considering the variety of potential landslide-building interaction modes (Luo et al., 2023) and the significant uncertainty on the characteristics of the landsliding mechanisms (e.g., Hungr et al., 2014). This assumption, at least for the rural areas, is consistent with the findings of Sekajugo et al. (2024) which observed a very high rate of destroyed buildings (from 71 % to 95 %) in landslide-affected zones in Uganda.
6.3.2 Risk Analysis
The different landslide risk components (hazard, exposure, vulnerability) described in the respective sections were integrated into a Monte Carlo numerical simulation procedure framework to derive a probabilistic assessment. A set of 1000 simulation runs were generated for each month of a year. The output consisted of a set of stochastically generated events, each with a geographical coordinate representing the landslide initiation point, and an intensity described by an area measure (in m2) assigned according to the underlying frequency-magnitude model previously described. The assigned size drives also the impacting mechanism.
For each simulated event the related impact and loss is estimated according to the simplified vulnerability model described above and aggregated per year of simulation and per administrative boundary (commune and province).
The resulting data is analysed to derive, for each administrative area, a so-called loss exceeding probability (LEP) curve, which describes the probabilistic relationship between the amount of loss possibly exceeded and its probability of occurrence. The average annual loss (AAL) was obtained by numerical integration of the LEP curve.
6.4 Earthquakes
The estimation of seismic hazard followed the methodological approach known as Probabilistic Seismic Hazard Assessment (PSHA), as originally introduced by Cornell (1968) and further developed by McGuire (2004) and Kramer (1996). This widely adopted framework integrates the results of seismic source modelling, ground motion propagation, and local soil effects to assess the probability of different levels of seismic ground shaking. The expected accelerations associated with return periods of 100, 250, 475, 975 and 2,500 years (corresponding to exceedance probabilities of 40 %, 18 %, 10 %, 5 % and 2 % in 50 years, respectively) were computed considering all known seismic sources within a 300 km radius zone of influence around Burundi. Instrumental data were compiled from the National Earthquake Information Center (NEIC) of the United States Geological Survey and the Global Instrumental Earthquake Catalogue of the International Seismological Centre in collaboration with the Global Earthquake Model (ISC-GEM). The Global Centroid Moment Tensor Catalogue has also been revised, which provides data of the moment tensor solutions for events with Mw ≥5. Historical period has been covered with data from the Global Historical Earthquake (GEH) Catalogue with events of Mw ≥6 which occurred between the years 1000 to 1900.
The initial instrumental catalogue includes 1604 events occurred between 1906 and September 2020 with magnitudes (M represents different magnitude scales given by the agencies: mb, mbLg, ML, MS, Mw).
To characterize the seismic sources of this crustal regime, we selected the model of seismogenic zones defined by Delvaux et al. (2017) for the Kivu Rift region. In our study area, the model distinguished seven crustal zones, with depths less than 40 km. The probability of exceeding specific levels of ground motion – both in terms of peak ground acceleration (PGA) and spectral acceleration (SA) – due to all identified seismic sources was then estimated. A logic tree approach was employed to incorporate multiple ground motion attenuation models, enabling the quantification of both the epistemic uncertainty inherent to these models and the aleatory variability associated with different input parameters. The peak ground acceleration (PGA) and the spectral accelerations SA (T) for the previously defined return periods across Burundi were computed under both reference rock site conditions and with local site effects. These seismic hazard maps do not reflect a specific earthquake event but represent the probabilistic levels of ground shaking expected to be exceeded during an exposure period of 50 years.
Figure 7 presents the distribution of PGA, including local site effects, for the 475 year return period, which is widely used in seismic risk and design applications This return period corresponds to a 10 % probability of exceedance in 50 years and is adopted by numerous international and national seismic design codes, such as Eurocode 8 (CEN (European Committee for Standardization), 2004), the ASCE/SEI 7–22 Minimum Design Loads for Buildings and Other Structures (American Society of Civil Engineers, 2021), and the NEHRP Recommended Seismic Provisions (FEMA, 2020), as the baseline for the design of ordinary buildings under the Life Safety performance level.
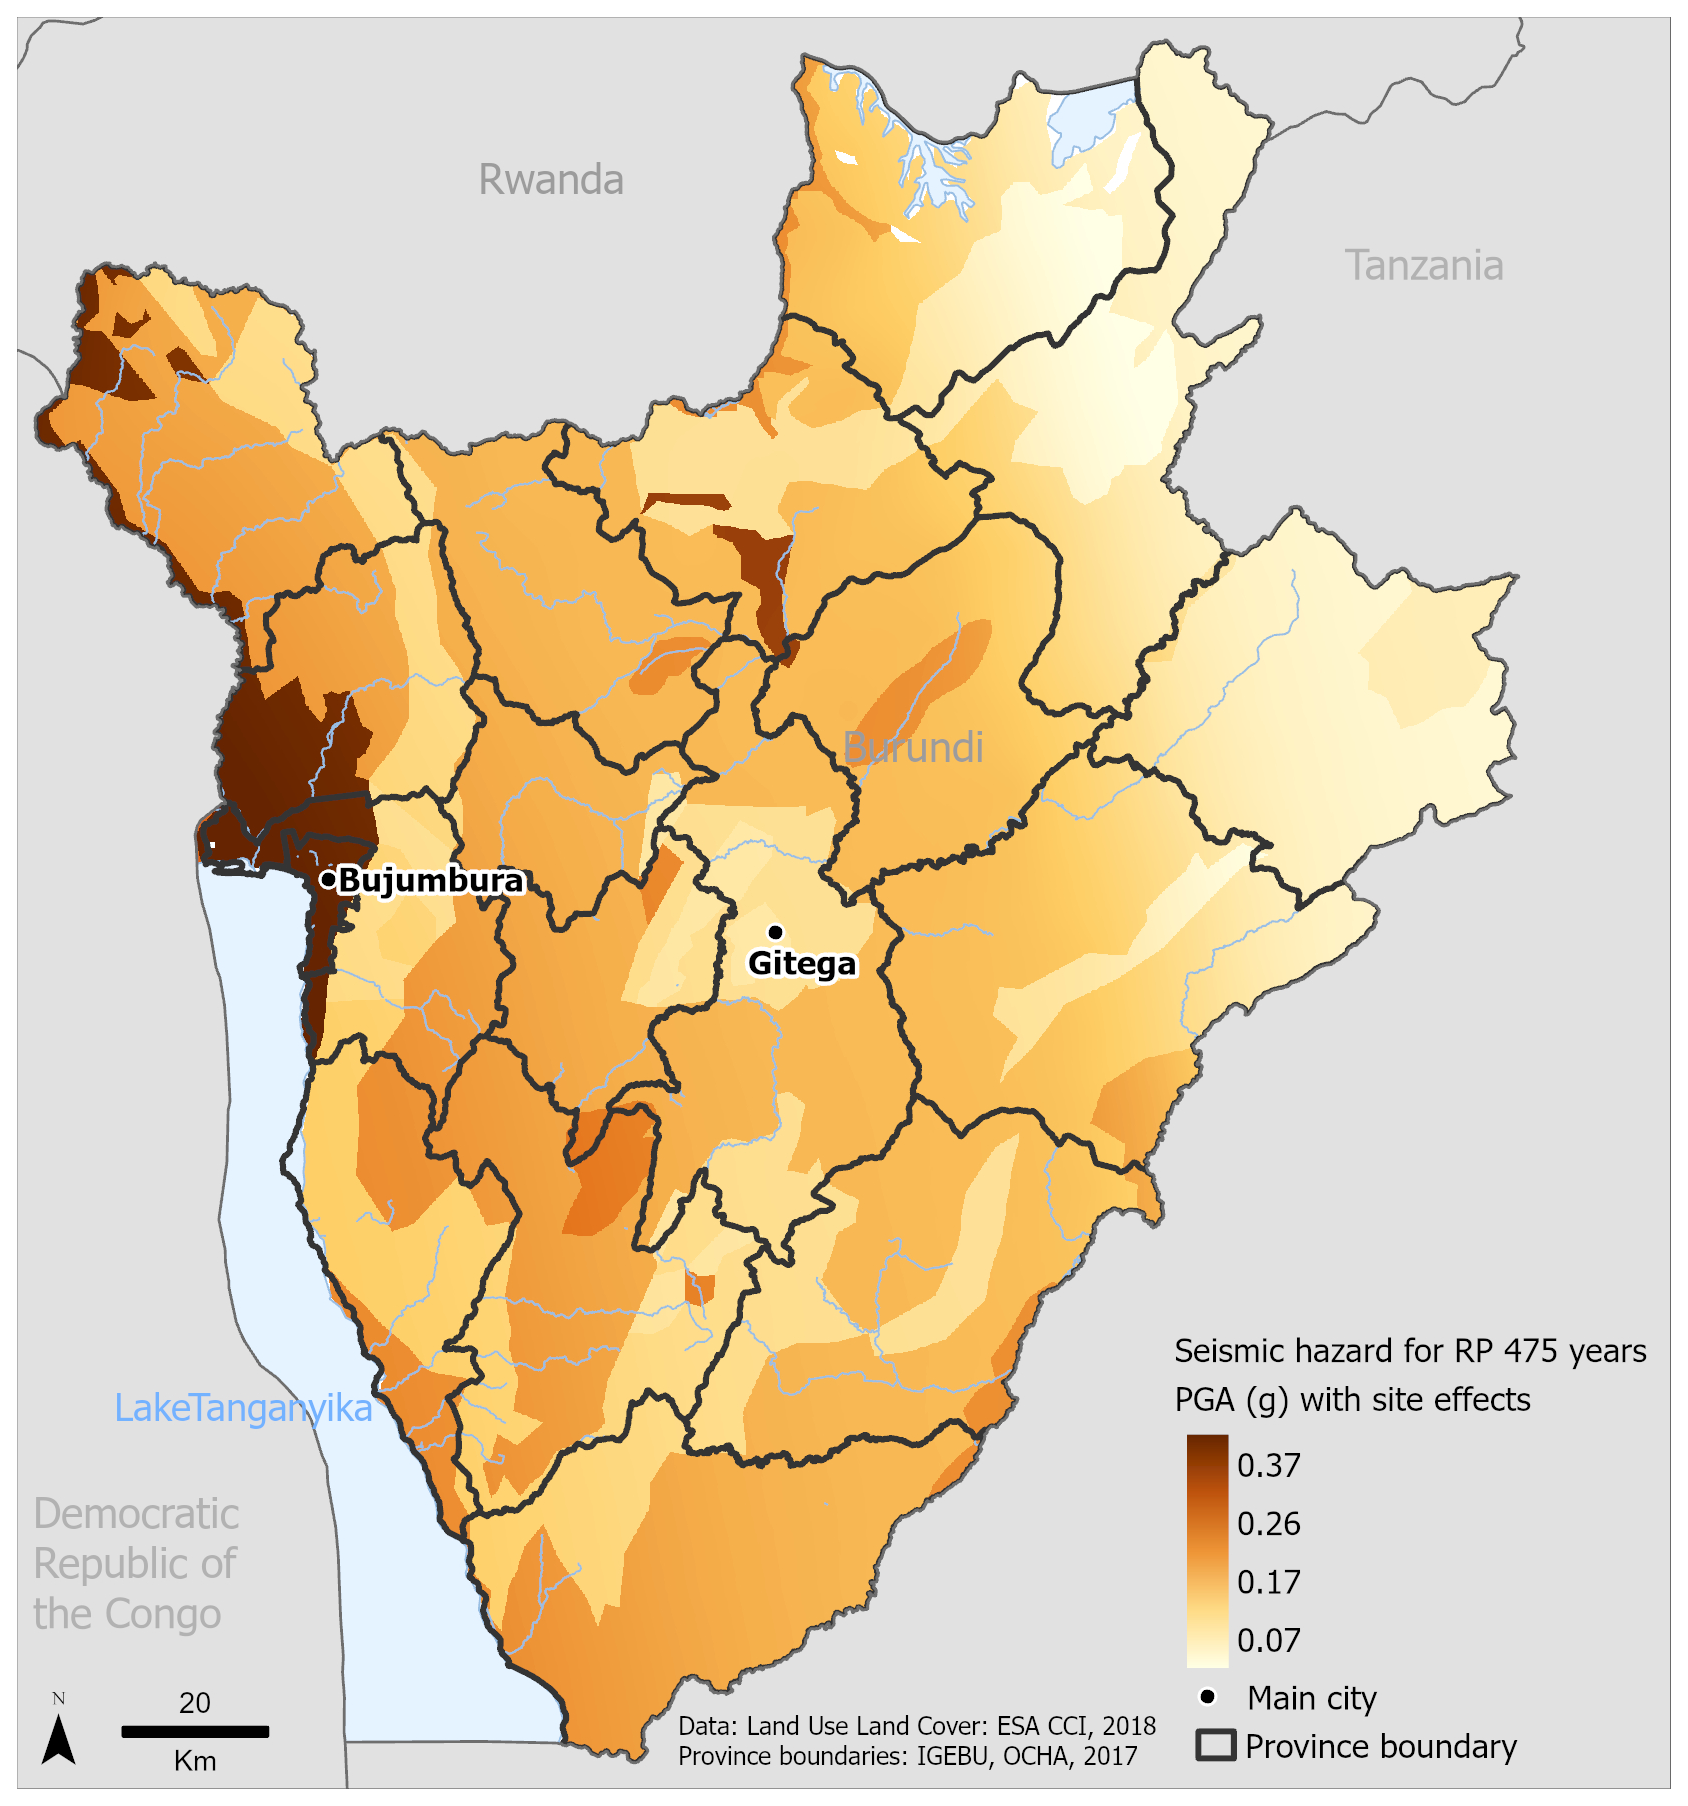
Figure 7Burundi seismic hazard maps including site effects obtained for RP 475-years.
The maximum projected PGA for the 475 years scenario is 0.37 g. The hazard maps incorporating site effects reveal significant spatial variability, which reflects the lithological complexity of Burundi. The highest seismic hazard levels are observed in the sedimentary basins and alluvial deposits of the Imbo Plain, in the western part of the country, while the eastern regions, characterized by harder soils and lower seismic activity, show the lowest expected ground motion.
6.4.1 Physical vulnerability to earthquakes
The HAZUS scheme from Kircher et al. (2006) was selected as the most appropriate framework for assigning capacity curves because it offers a comprehensive, standardized, and internationally validated set of structural fragility and capacity models. HAZUS provides detailed vulnerability parameters for a wide range of common building typologies, particularly covering low- to mid-rise masonry and reinforced concrete structures, which are the predominant forms observed in Burundi (Brzev et al., 2013). Moreover, HAZUS models have been extensively tested and applied in different seismic risk contexts worldwide, not only in the United States (FEMA, 2012) but also in several international studies addressing developing country settings (e.g., Silva et al., 2018; World Bank, 2014). Given the limited availability of detailed local structural data in Burundi, applying the well-documented HAZUS-based capacity curves constituted a technically sound and practical choice for this study.
6.4.2 Risk Analysis
For each considered return periods of 100, 250, 475, 975 and 2500 years the associated accelerations have been used to estimate the expected exceeded damage states of the exposed buildings, according to their physical vulnerability.
The distribution of expected damage states was converted to a probable maximum loss (PML) considering an average damage defined as the fraction of reconstruction cost associated to the damage states. Repair costs for extensive (ERC), moderate (MRC) and minor (LRC) damage are calculated as percentages of the reconstruction RISK-EU, W07 (Vacareanu et al, 2004).
The PML distribution has been converted into a loss-exceedance curve, whose integral describes the Annual Average Loss (AAL).
Burundi is characterised by generally high levels of vulnerability relative to other countries (INFORM, 2022) although high resolution vulnerability assessments are difficult to produce due to data and fieldwork constraints (Depicker et al., 2021a, b; Kubwimana et al., 2021). We understand vulnerability to be the degree of susceptibility of communities, systems or elements at risk and their capacity to cope under hazardous conditions (Birkmann et al., 2013). The assessment of socioeconomic vulnerability addresses many intangible factors linked to characteristics of communities, such as knowledge and social network qualities. In accordance with the INFORM framework, in this study we also assessed coping capacity, understood as the ability of people, institutions, organizations, and systems, using available skills, values, beliefs, resources, and opportunities, to address, manage, and overcome adverse conditions in the short to medium term (IPCC, 2018). The lack of ability of systems to respond adequately to shocks and to evolve in response to shocks (i.e. to be resilient) is assumed in this assessment to result in a vulnerability to all hazards. Therefore, socioeconomic vulnerability in this assessment is treated as hazard independent.
This socioeconomic vulnerability assessment (SEVA) used an indicator-based assessment framework applying existing data, supported with semi-structured interviews and focus groups with local experts (see the questions used in the semi-structured interviews in Supplement S1). The latter qualitative methods served to identify context-specific factors of vulnerability and to validate and provide feedback on our assessment framework.
The assessment framework was adapted from the vulnerability and lack of coping capacity dimensions of the INFORM Risk Index developed by the Disaster Risk Management Knowledge Centre (DRMKC) of the European Commission (European Commission, Joint Research Centre, 2017). Adaptations were made in response to data availability and the project client's (IOM) requirements. The INFORM Risk Index is a composite indicator framework in which normalised vulnerability values are aggregated at each level of a hierarchical structure (through indicators, components, categories, dimensions). We additionally included a subcomponent level between indicators and components. The INFORM framework was chosen as it provides an accessible and transparent methodology, offers adaptability to user contexts and utilises existing data. Additionally, an INFORM subnational risk assessment in Burundi was published in 2020 (EU-DRMKC, 2020), of which some data were used in the SEVA.
The SEVA was conducted at two resolutions: colline and province. The respective spatial mapping uses (1) data from a survey commissioned by IOM Burundi in September–October 2020 in 532 collines (the DTM-DRR dataset) and (2) data extracted from four national reports and from the INFORM 2020 Risk Assessment for the 18 provinces (EU-DRMKC, 2020). Proxies were used for indicators where data was not available, for example for the indicator “infant health” three variables were combined (Mortality rate of under 5-year-olds; Prevalence of malaria in infants aged 6–59 months; Percentage of infants aged 0–59 months seeking care for diarrhoea) by calculating the unweighted arithmetic mean of their assigned vulnerability classes.
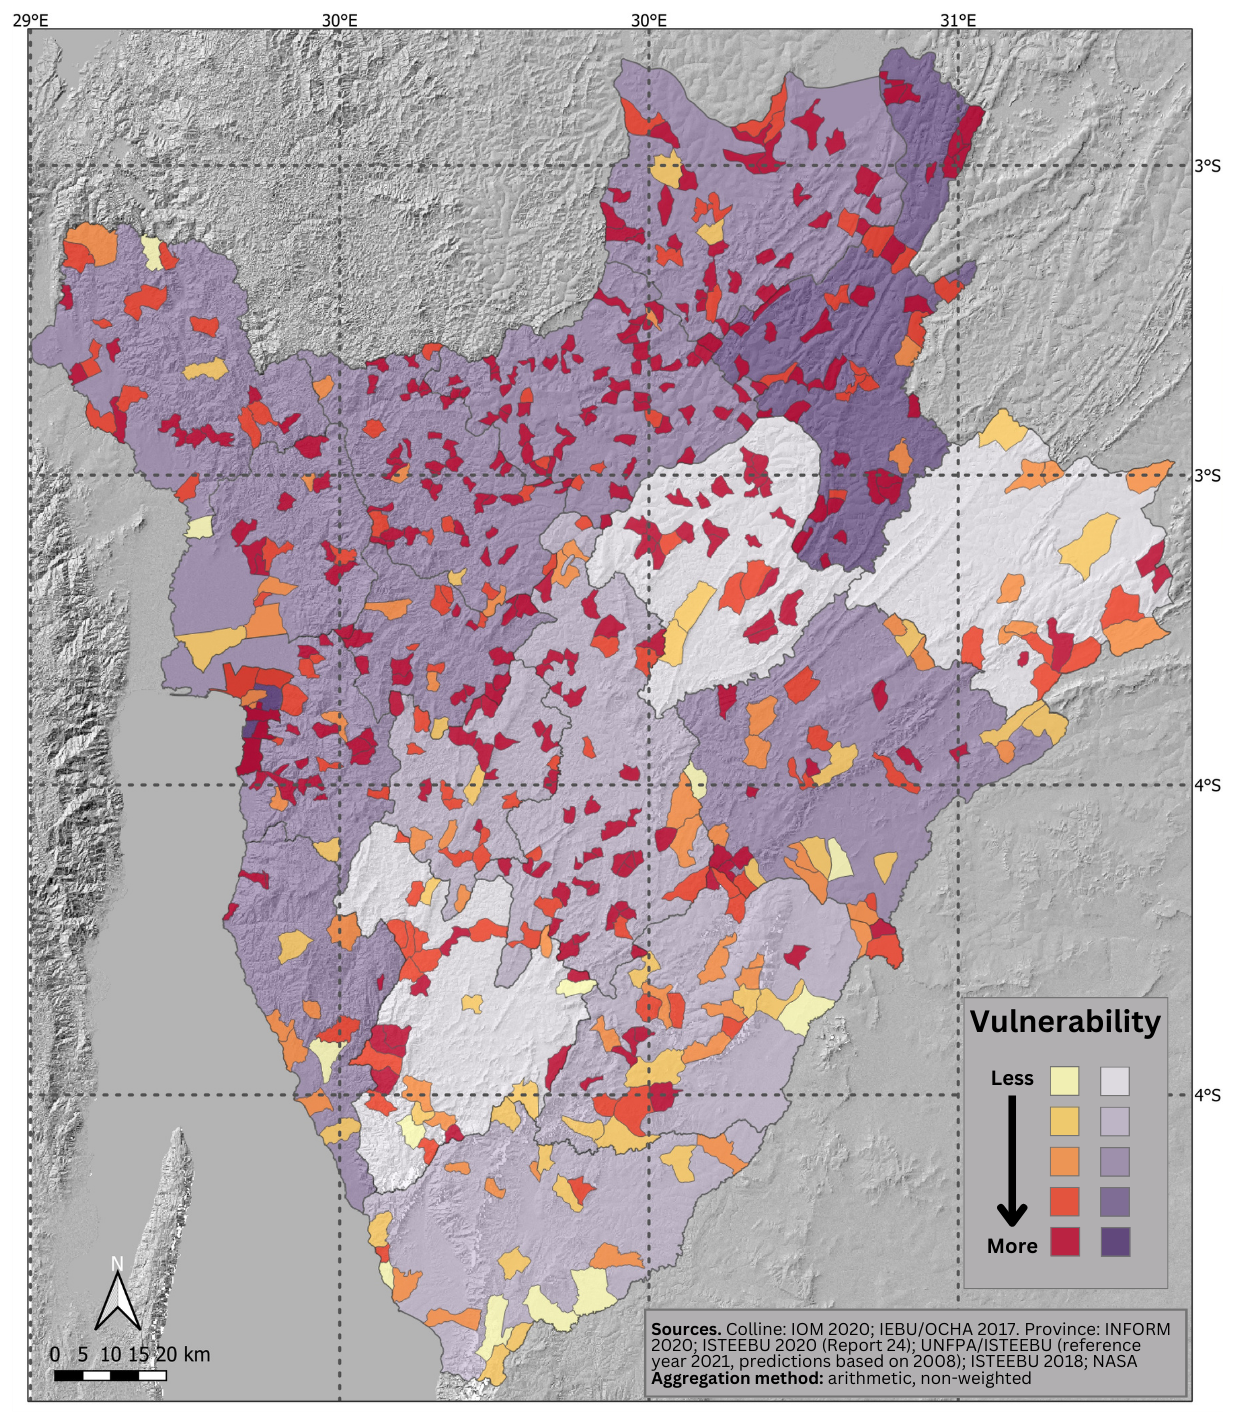
Figure 8Burundi: Map showing data aggregated under the “Population Characteristics” component of the SEVA. The underlying subcomponents are, for colline resolution population density and disadvantaged population and for provincial resolution population density.
Indicator data were normalised to a scale of 1 to 5 by assigning a vulnerability score to numbers (for metric data) and to statements/categories (for categorical data), with continuous class description from less vulnerable to more vulnerable (Fritzsche et al., 2014). To produce values for components of vulnerability, we used an unweighted arithmetic aggregation (Fritzsche et al., 2014). At each step of aggregation, Min-Max normalisation transformed all values to scores ranging from 0 to 1 (Fritzsche et al., 2014). Values were not aggregated from the component to category and dimension levels to avoid an over-simplification of results and potential misinterpretation by users. If more than 50 % of input data for the construction of an indicator, subcomponent or component were missing, this was considered insufficiently complete and therefore not aggregated to the coarser levels. The results of the SEVA are presented as 11 maps showing the 11 vulnerability components with both the colline and provincial assessment presented on each map. Every map is accompanied by a factsheet detailing the data sources, indicator calculation, and completeness of the underlying data (Supplement S2). The map in Fig. 8 shows the aggregated vulnerabilities for one component.
The results of the SEVA show a great heterogeneity in vulnerability both geographically and thematically over the two resolutions assessed, demonstrated by the frequency with which neighbouring collines show significantly different vulnerability levels across one indicator or subcomponent. This could be due to topographical and administrative boundaries which result in genuine differences in vulnerability and coping capacity between collines. The results suggest that differences in vulnerability factors are highly localised, but it must be stressed that these differences should be considered in the context of generally high and widespread vulnerability observed in Burundi which exacerbate the impacts of hazards and limit capacity to respond. We recommend that users of the SEVA results look into the underlying indicators and subcomponents when seeking to identify particular vulnerabilities or vulnerability hotspots. This is due to the loss of nuanced information caused by the aggregation of data to produce components of vulnerability and the accompanying maps. This loss of information is more apparent the more subcomponents are aggregated.
Due to its limitations (see Sect. 9), the results of the SEVA were not integrated into the monetary physical risk assessment. Consequently, the SEVA is to be considered as complementary to the overall risk assessment.
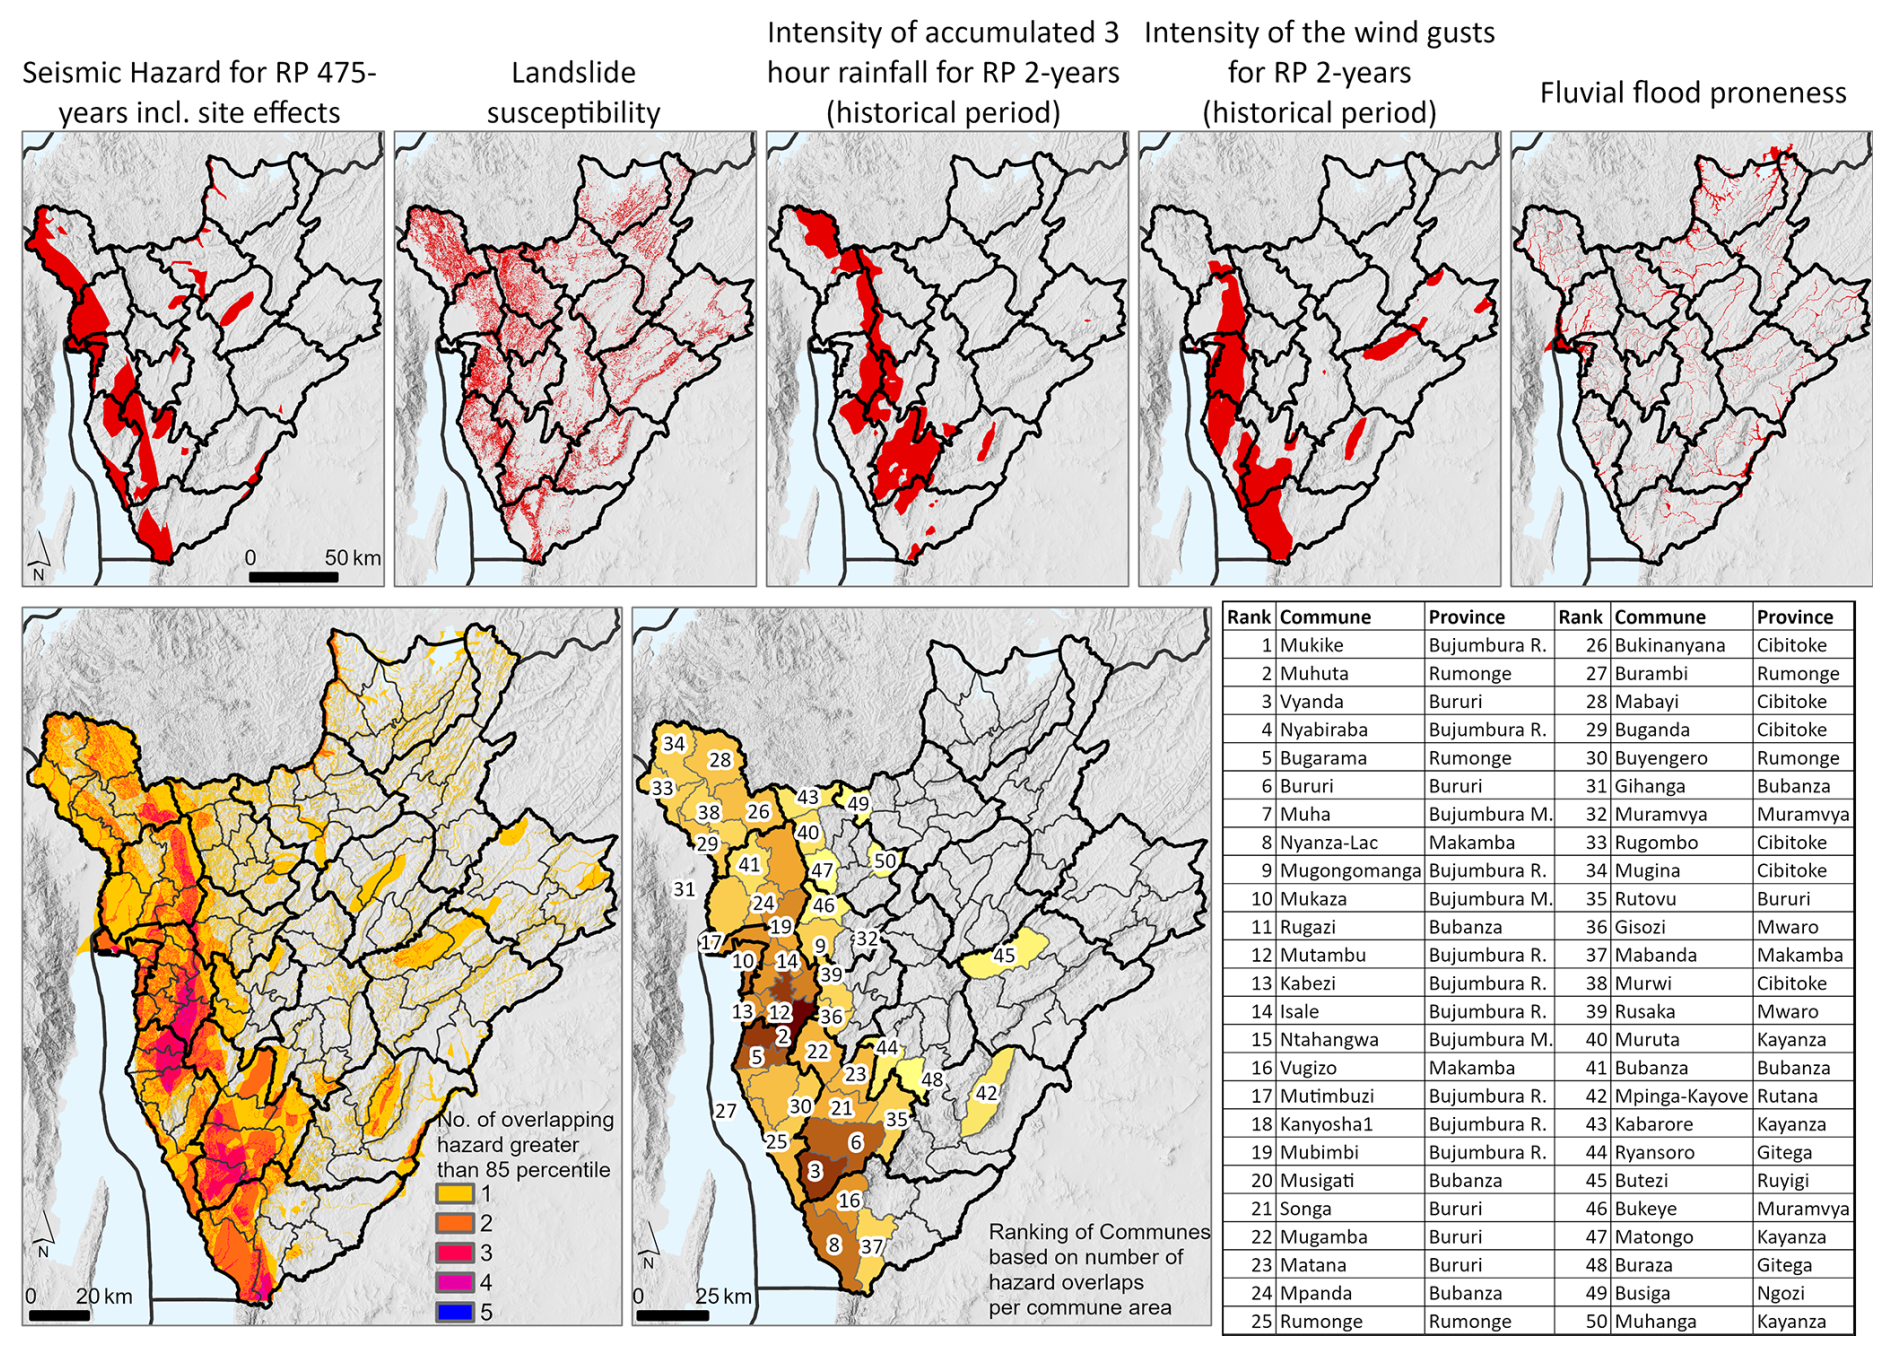
Figure 9Burundi: Illustration of national-scale multi-hazard map generation.
In this section the results of the risk analysis for the individual hazards and their composition in terms of multi-hazard risk are provided and commented.
Multi-hazard intensity overlap map
In order to provide an intuitive description of the intensity and extent of the considered natural hazards, a series of national-scale, single-hazard maps were produced, each visualising the area exceeding the 85 % percentile of the scalar intensity distribution of the specific hazards (Fig. 9) on a 30 m resolution grid. The 85 % percentile threshold has been chosen arbitrarily to capture the spatial distribution of high-intensity hazardous events without narrowing the description to extreme events. In the case of landslides, the hazard intensity is represented by the normalised susceptibility. These maps were then merged into a multi-hazard representation where each grid element is color-coded according to the number of hazards exceeding the 85 % percentile, which ranges from zero to five. The resulting map provides a hazard-overlap representation of locations where multiple hazards reach high intensity (above 85th percentile), and is used to rank the individual communes in terms of potential multi-hazard hotspots (Fig. 9). This ranking is based on hazard intensity only and does not represent risk, as it does not include exposure/vulnerability nor the frequency/magnitude relationships of the individual hazards.
The top five maps show individual hazard maps exceeding the 85th percentile of the hazard distribution. The map on the bottom left shows the number of overlapping hazards and the map on the bottom right shows those communes potentially most prone to multiple hazards. The table shows a ranking of the 50 potentially most prone communes to multiple hazards (ISTEEBU (Institut de Statistiques et d’Études Économiques du Burundi), 2017; elevation: NASA JPL/USGS, 2000).
To achieve a more quantitative comparison of the resulting risk, a probabilistic risk estimation was carried out for each of the five hazards at national scale (see Table 2 and Fig. 10).
Table 2Overall national and provincial multi-hazard annual average loss (AAL) results.
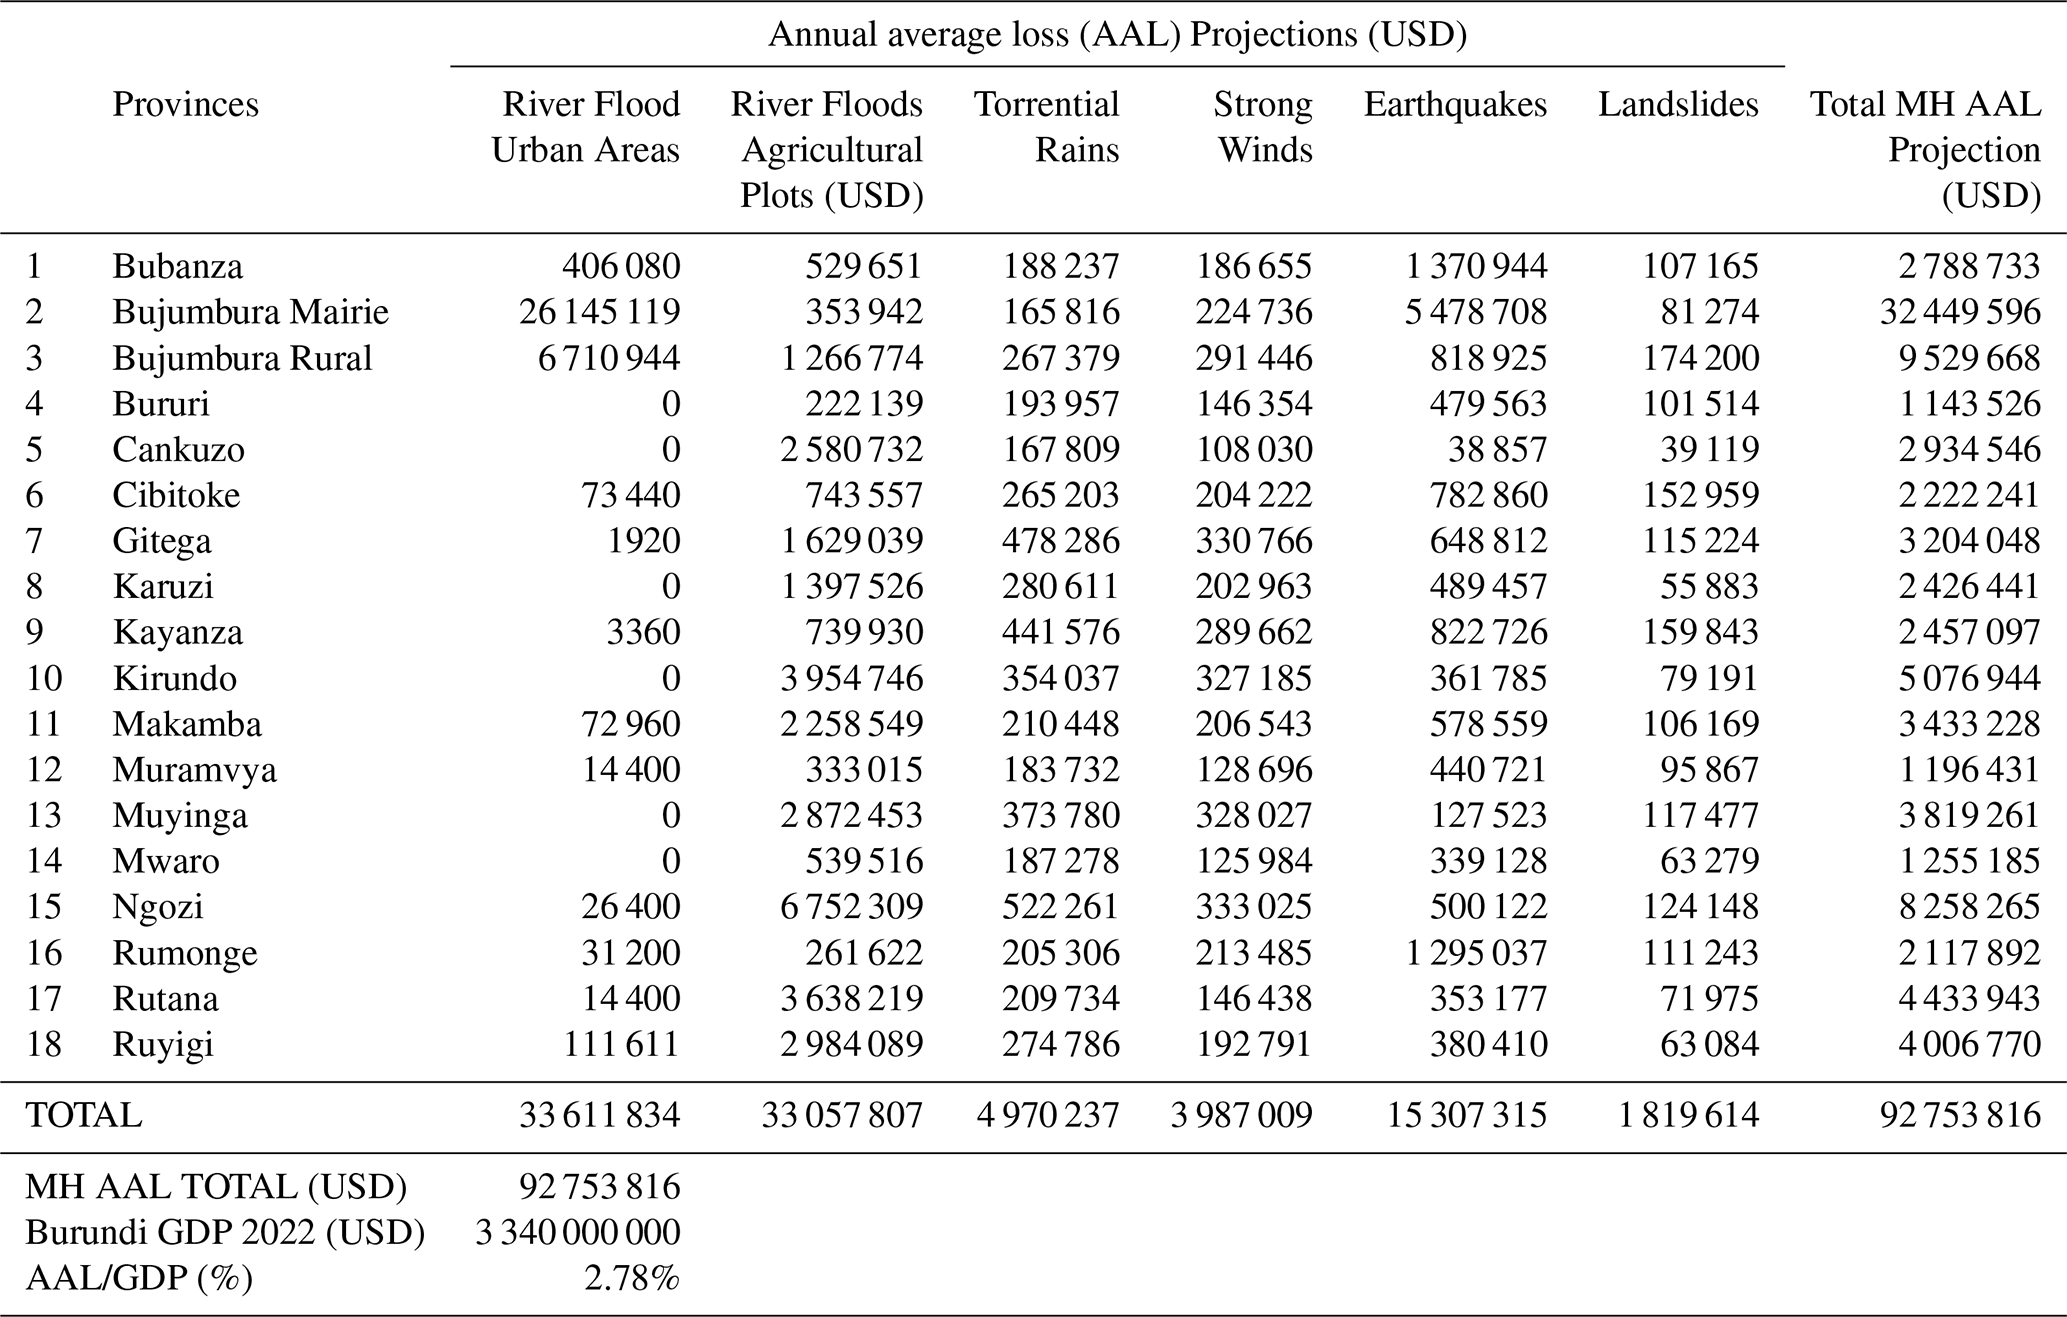
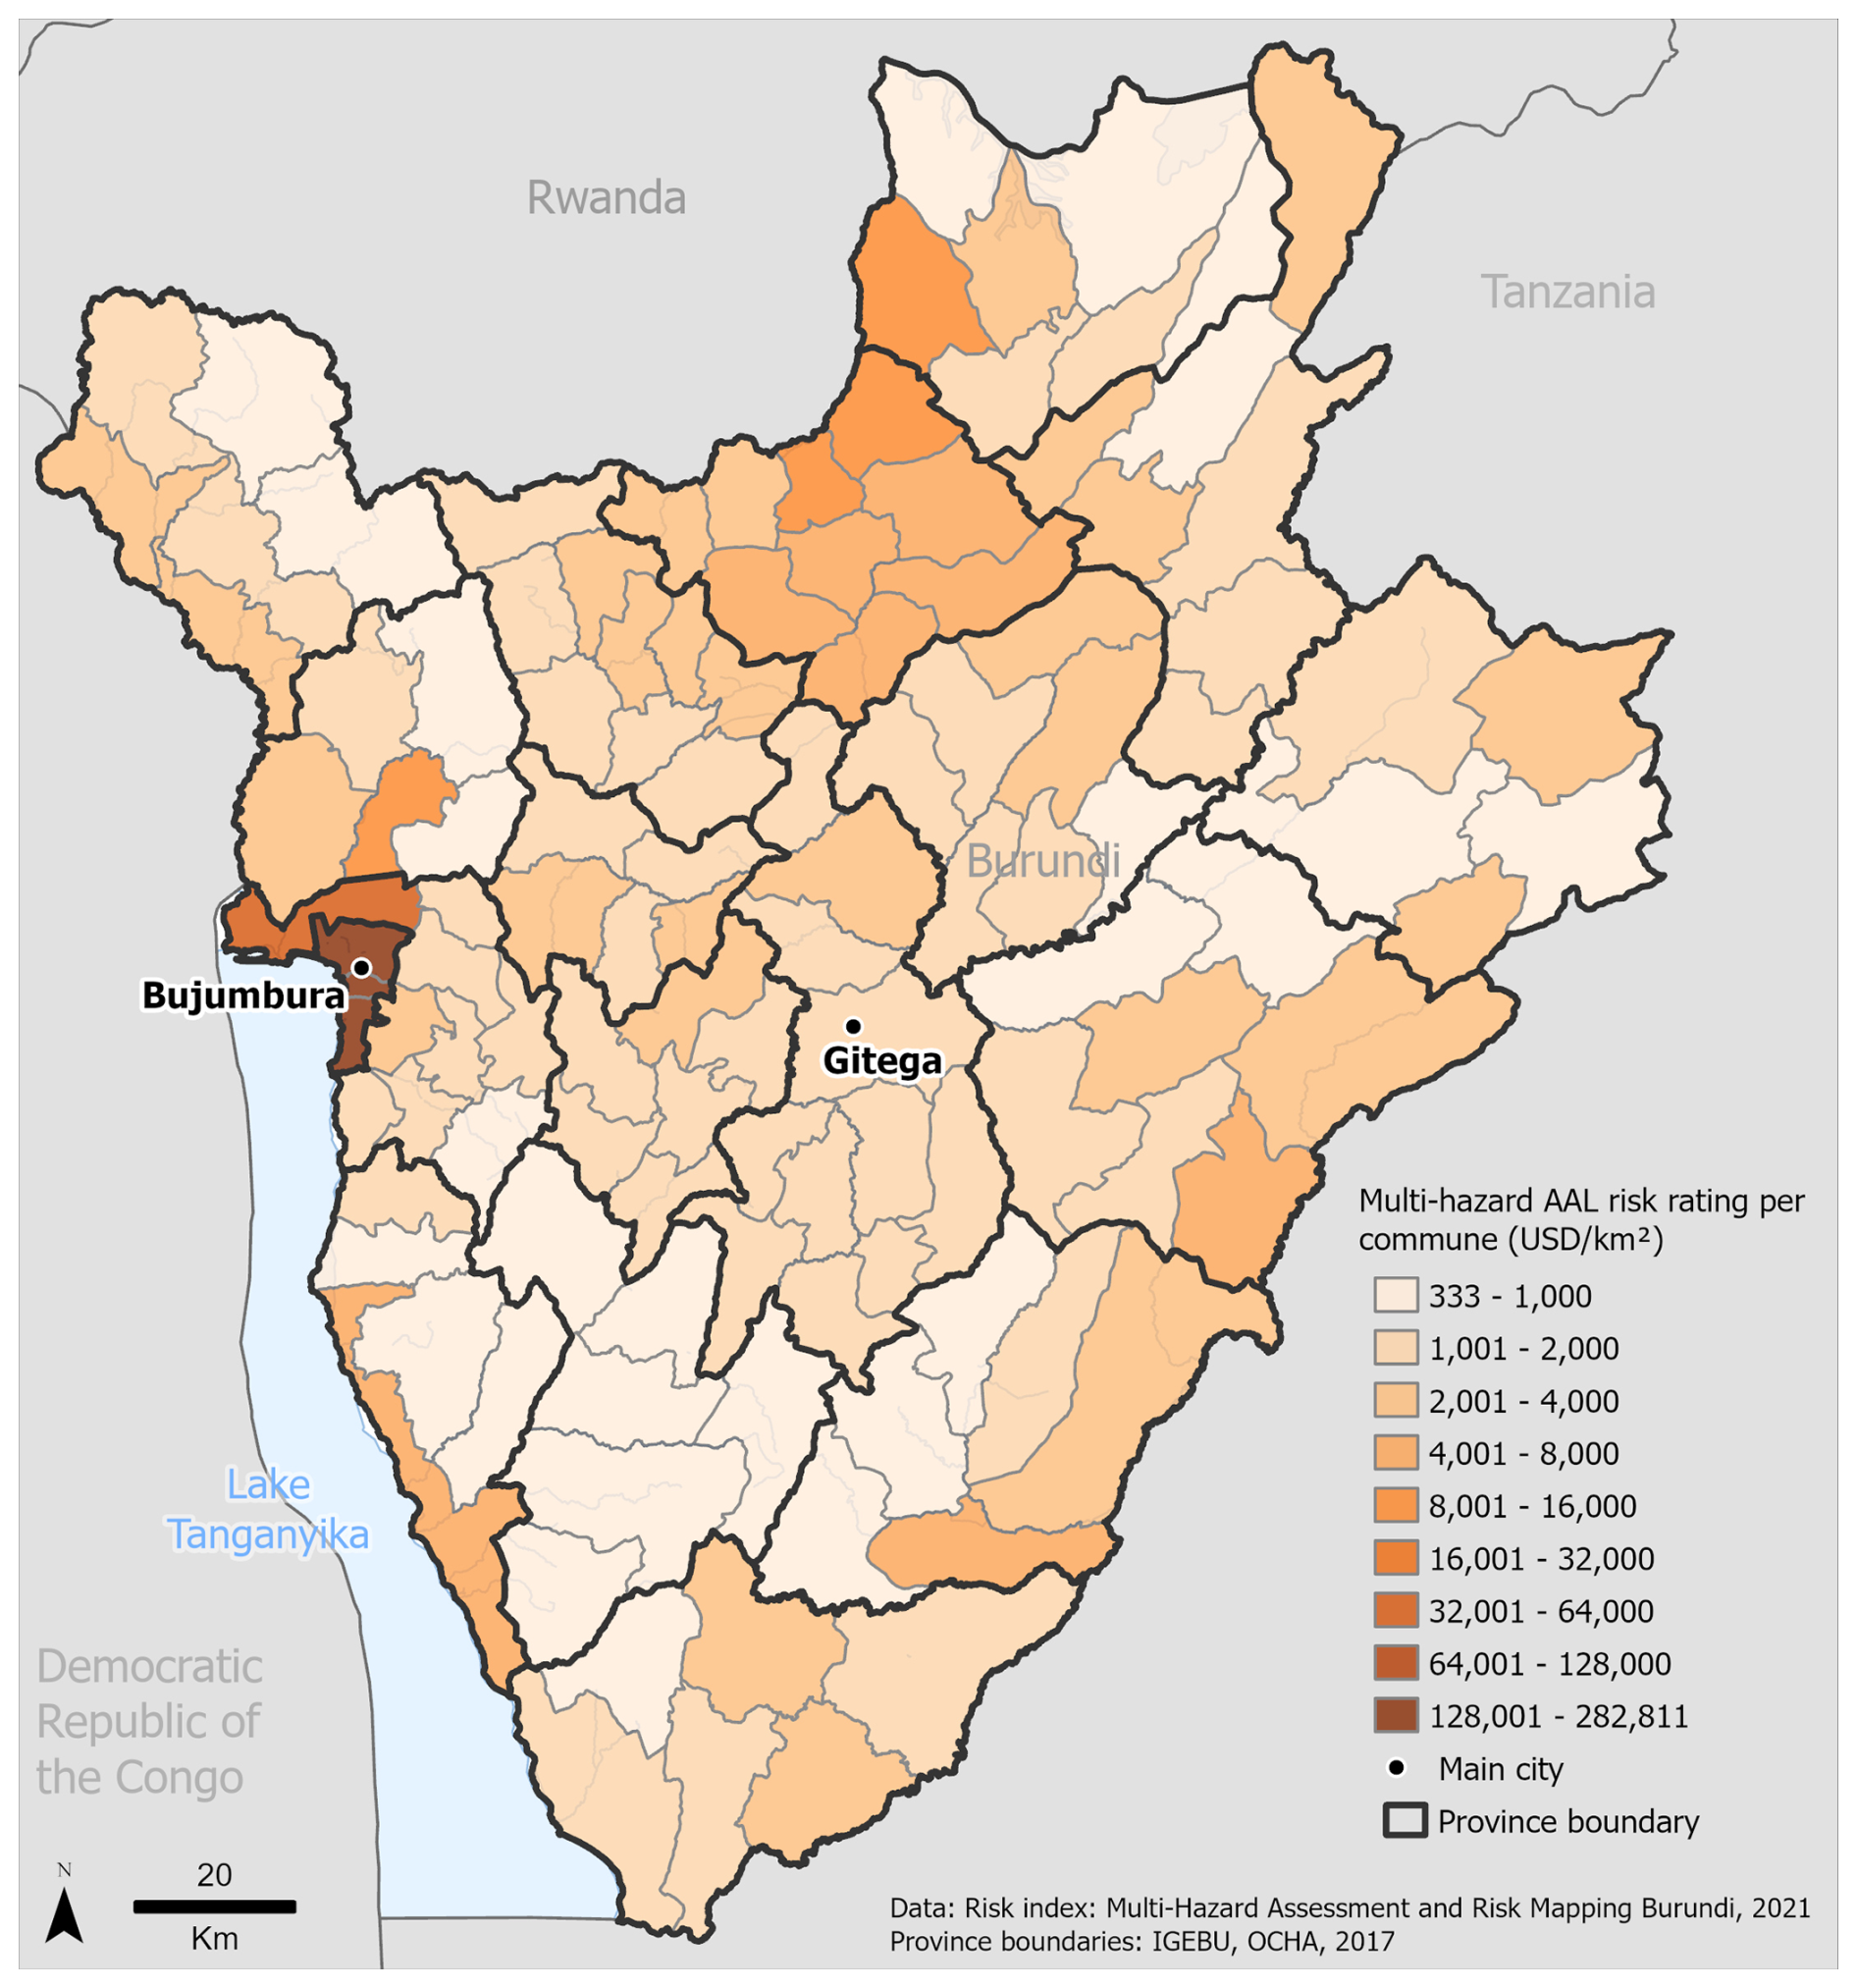
Figure 10Burundi: Nationwide commune level multi-hazard AAL risk ratings with all hazards included. The AAL is associated with loss to residential buildings except in the case of river floods where also loss of agricultural crops has been addressed.
To explicitly consider the contribution of exposure and vulnerability and obtain a consistent geographical representation of expected multi-hazard risk, an aggregated spatial risk density index (in USD km−2) was computed for each commune by dividing the aggregated AAL value by the geographic extension (km2), the results of which are shown in Fig. 10.
The multi-hazard map highlights the communes with the larger number (in terms of their uppermost percentile) of overlapping natural hazards. This representation indicates several potential multi-hazard hotspots in the western part of the country, along the Congo-Nile Mountain range, the North Tanganyika-Kivu Rift and bordering the Tanganika Lake, where where multiple hazards reach high intensity. Importantly this map represents hazard overlap (based on intensity/susceptibility exceedance) and does not represent risk, as it does not include exposure/vulnerability or hazard-magnitude relationships. When a more comprehensive multi-hazard risk assessment is carried out, in terms of economic impact and considering exposure and vulnerability, a different picture emerges. The annual average loss (AAL) is more evenly distributed across the country, with a pronounced hotspot in Bujumbura, as expected giving the concentration of assets, with other risk hotspots in the Ngozi and Kirundo provinces in the north, as well as in the eastern areas. The single-hazard AAL estimates are driven mostly by floods, impacting either urban areas or cultivated areas, and by earthquakes. Economic loss to crops has been addressed only in the case of river floods, so that risk to crops due to torrential rains, winds, landslides, or earthquakes were not assessed. This is based on the assumption that river floods affect crops disproportionally with respect to the other hazards, both because of the physical impact of water, the spatial extension of the flooded area and its duration. The expected AAL related to the impact of riverine floods in urban areas amounts to more than USD 33 million, nearly ten times bigger that the GAR15 estimate (UNDRR, 2015). The flood risk estimates have not yet been validated through comparison with other sources, but a clear confirmation of the high level of risk was provided by the recent (2024) floods. From September 2023 to April 2024, in fact, the El Niño wreaked havoc across Burundi, with floods (and landslides) affecting more than 200 000 people, forcing more than 37 400 to flee their homes and damaging 40 000 ha of agricultural fields, resulting in the loss of 10 % of 2024 crops (UNICEF, 2024). The contributions of the Bujumbura provinces can be explained due to the concentration of population and associated infrastructure in these provinces. The highest single contribution (0.78 % of GDP) is indeed associated with fluvial floods in Bujumbura Mairie. The potential high exposure of this area was clearly shown by the Copernicus rapid assessment report triggered on the eve of the April 2024 floods, where more than 130 km2 of flooded area were predicted (Copernicus, 2024) also due the continuously increasing level of the Tanganika lake (Gbetkom et al., 2024). With regards to Ngozi province, the significant AAL of USD 6.5 million is mainly due to potential losses to agricultural crops. Earthquakes, although relatively infrequent, still represent a concrete threat over longer time frames: the estimated USD 15.3 million, while much higher than the GAR15 estimate of USD 3.87 million (UNDRR, 2015) is very consistent with the recent estimate of 17 million provided by Paul and Silva (2025). In this study a preliminary probabilistic landslides risk assessment has been carried out, which is still uncommon in the context of landslides hazard and risk assessment but allows for landslide risk to be quantified and compared with other natural hazards. This probabilistic model is based on a database of landslides compiled with data available in 2020, which is expected to be affected by the spatial heterogeneity of the data and by the potential biases associated with the potential presence of deep-seated landslides and mass movements associated with large gully features and with riverbank erosion. However the statistical characterization was quite robust, which indicates a relatively high level of consistency in the underlying data. After 2020 several other landslides inventories have been published (e.g., Deijns, 2022; Depicker et al., 2021b), which could be employed to further improve the model in future assessments. Other necessary simplifications and assumptions are related to the need to extend susceptibility estimates to probabilistic hazard models. According to these preliminary estimations, landslides contribute to multi-hazard risk comparatively less than other hazards, with an estimated 0.005 % of GDP, but it is still significant and could further increase following the modification of precipitation patterns in the area due to climate change and the perduring physical and socioeconomic vulnerability conditions, particularly in the rural regions.
It should be noted that these assessments assume independence among the hazards, refer only to direct physical impacts on residential buildings and agricultural plots, and do not explicitly account for climate change. However, a preliminary evaluation of the potential impact of climate change has been carried out based on a combination of large-area climate predictions and local downscaling techniques and is provided in Appendix A. The mean daily precipitation projections show a robust increase in the mean daily precipitation, ranging from 0.2 to 3 mm, compared to the historical period (1990–2019). The highest relative changes are found in the Imbo Plane, ranging from 25 % to 40 %. This trend is projected mainly for the rainy season. The eastern part of the country where the dry eastern plateaus are located also show high relative changes in the mean daily precipitation values. Regarding the total contribution from wet, very wet, and extremely wet days to the total precipitation, for several areas, such as Bujumbura Mairie, the north of Bujumbura Rural and the south and central areas of Bubanza, as well as some areas of Kirundo and the north part of Ruyigi, the models show a positive trend in the expected changes with increases between 6 %–14 % in the percentage of precipitation accumulated during the wet and very wet days. The contribution of the extremely wet days varies from 4 % to 10 %. Results from daily wind speed during gusty days (days with wind speed values above 90th percentile) show a slightly decreasing trend, but in general, the wind speed values of the gusty days are expected to be comparable with the historical period, with moderate winds reached during the windiest days.
To support the multi-hazard risk assessment, exposure models describing the distribution of population and residential buildings have been developed. This has required extensive efforts due to the lack of coherent and up-to-date information, and the inconsistencies across official data (even on the naming and administrative boundaries) required for regional and global models to be used. The databases developed and maintained by IOM proved very useful to integrate important local information.
Since natural hazards are expected to strongly affect people and communities, a separate socio-economic vulnerability assessment (see Sect. 7) was also carried out based on the available data ranging from 2015–2020 and on consultations with local authorities and experts. Overall, it's clear that the natural hazards play a strong role in the resulting risk, but the distribution of multi-hazard AAL shows that the contribution of exposure and vulnerability are equally significant. Furthermore, there is a complex interplay between the population and its activity and the climatic drivers which is not explicitly accounted for in the models but is expected to further increase the risk. For instance, deforestation, sprawling urbanization, road construction and irrigation increase landslide mobilization rates and favour erosion mechanisms across the hilly regions and in the periphery of urban centres (Depicker et al., 2024). Diffuse socioeconomic vulnerability as well as systematic lack of resources and capacities by local civil protection and decision makers is also heavily intensifying the materialization of risks (Raju et al., 2022).
To explore the impact of natural hazards in Burundi and their distribution at different geographical scales, two approaches were followed. Following a single-hazard assessment, a multi-hazard map highlighted the communes with higher numbers (in terms of their uppermost percentile of overlapping natural hazards. This representation indicates several potential multi-hazard hotspots (hazard overlap) in the western part of the country, along the Congo-Nile Mountain range and bordering the Tanganyika Lake, where earthquakes, intense precipitations and strong wind gusts are possible. A more comprehensive multi-hazard risk assessment was carried out, in terms of economic impact and considering exposure and vulnerability, a different picture emerged. An aggregated AAL of over USD 92 million was estimated, amounting to around 2.5 % of Burundi's 2022 annual Gross Domestic Product (GDP). The single-hazard AAL estimates are driven mostly by floods, impacting either urban areas or cultivated areas, and by earthquakes. A comprehensive validation of these findings should be prioritized in future works, but preliminary comparisons with recent publications (e.g., in the case of seismic risk) have shown a good consistency, while the only other available AAL-based risk analysis for earthquakes and floods provided by GAR in 2015 (within a global assessment) exhibited a strong underestimation of average annual loss.
A separate socioeconomic vulnerability assessment was carried out based on the available data and on consultations with local authorities and experts and provides complementary information on the ways natural hazards are expected to affect exposed people and communities. The DTM-DRR survey, which provided the underlying data for the colline-resolution analysis, was conducted before the initiation of the presented study and collected data based on over 100 questions relating for the 532 randomly-selected collines. Therefore, the collines analysed in the SEVA do not align with the hotspots in this study, a reason for which the SEVA is not integrated into the overall risk analysis. Additionally, since socioeconomic vulnerability is a dynamic process that evolves over time in response to changing local conditions, the monitoring of these dynamic processes is better able to represent the true vulnerability of a community. It is therefore suggested that the SEVA be updated as new data becomes available and new indicators added.
In general, data scarcity was a significant hurdle to overcome in the multi-hazard assessment of risk; several desired datasets were not accessible, did not exist or were incomplete, and were therefore not included. Data collection and field visits were not possible due to travel restrictions related to the COVID-19 pandemic as well as COVID-19 diagnoses within the team delaying (or leading to the cancellation of) fieldwork. To mitigate this, it was attempted to validate the conceptual approach and data sources with local experts, but this was limited due to the difficulty in engaging relevant informants from abroad using mainly online meetings. The use of large-area and global datasets, most from authoritative sources, proved anyway useful to set the stage for more in-depth assessments where possible, or to achieve a baseline result otherwise. The use of AAL-oriented risk analysis implies a different and pragmatic perspective on the use of data. While AAL provides an actionable metrics which is well understood by decision makers and large-scale organizations, the monetization of risk often implies strong simplification and assumptions, which are ill-received by several scientific communities. A systematic understanding of such uncertainties is therefore crucial, while at the same time improved probabilistic approaches should be developed to tackle them efficiently. This outlines a further difficulty interacting with local experts and stakeholder, since the methodological approach required to obtain probabilistic estimates at national scale requires significant data, knowledge and information beyond the sheer consideration of hazards. The need for the analytical integration of exposure, physical and socio-economic vulnerabilities (Michellier et al., 2020) entail a significant multi-disciplinary effort which often strains local practitioners and research institutes lacking financial resources and personnel (Dike et al., 2018). Future work should include a more extended consultation process with local experts and a more in-depth consideration of the institutional and operational framework of local stakeholders is also advisable to ensure a more efficient uptake of the collected data and findings. Notwithstanding the limitations implicit in the narrower scope of the economic perspective on risk, the approach based on AAL allows for a consistent aggregation of risk arising from natural hazards with very different characteristics (e.g., intensity and frequency/magnitude distributions). This approach, being probabilistic in nature, also allows for the broad consideration of the aleatoric uncertainty underlying the considered processes, although a systematic analysis of the uncertainty was not carried out and should be addressed in future works. On the other hand, epistemic uncertainty is significant due to the limited capacity in the modelling of some of the hazards and to the lack of context-specific data. In particular the potential effects of climate on future risk conditions should be directly accounted for in the AAL estimates. Several of the models described in this manuscript had to rely on simplifications and assumptions that should be revised in the future as new data and knowledge is increasingly made available. In particular, the risk from river floods (both on residential buildings and crops) given its significance, should be further addressed by and with local experts and stakeholders. The estimation of landslide risk from probabilistic assessment was also relatively innovative and as such can be further refined and validated. More in general, the assumption of independence of hazards should be subject to further studies to better account for cascading and compounding mechanisms in the impacts, e.g. the triggering of landslides due to intense precipitation and earthquakes, and the high probability of compounding across the impacts related to hydrometeorological hazards.
Following the conclusion of the activities described in this manuscript, a public shared data repository (http://23.239.19.79/, last access: 13 February 2026) has been implemented by national and local authorities in Burundi, who engaged in extensive restructuring and update of the risk management processes. As a first result, 90 communes and 17 provinces have developed or updated contingency plans and simulation exercises have been implemented for stress-test and validation purposes (https://reliefweb.int/report/burundi/first-kind-nationwide-project-reinforces-burundis-resilience-climate-induced-disasters, last access: 13 February 2026). These findings clearly indicate that more intense and concerted efforts are needed in Burundi to develop and maintain those data, information and knowledge that are paramount for understanding, treating and monitoring the different risks increasingly threatening socio-ecological systems and communities. This also includes consistent exposure and vulnerability data, as well as a systematic collection of impacts, damage and loss. Integrated risk assessment should be understood as a continuous process, calling for substantial resources to be mobilized by local and national authorities, and for the scientific community to further engage in pragmatic joint activities with decision- and policy-makers. In this context, non-governmental organizations operating in the territory, such as IOM in the case of Burundi, can also play an important role in collecting and sharing important information and bridging gaps with local institutions.
In order to understand the potential trends of risk in the future due to the evolution of climatic drivers, a study of climate change in Burundi was carried out based on a combination of large-area climate predictions and local downscaling techniques. Global Climate Models (GCMs) in the CMIP5 (Coupled Model Intercomparison Project 5) were used to obtain information about how the climate could change at continental scale. In order to adjust such large-area climate prediction to obtain more specific information at Burundi national and subnational scale, climate “downscaling” was applied using a Regional Climate Model (RCM) called Weather Research and Forecasting (WRF), version 3.9.1.1 (Skamarock et al., 2008).
By combining the broader predictions from CMIP5 with the precise details that the WRF model's downscaling method provides, a more comprehensive picture of how climate change could impact the specific area of Burundi can be obtained. The methodology is described in Fig. A1, and assumes as baseline the historical period 1990–2019, and a short-term future period from 2020–2049.
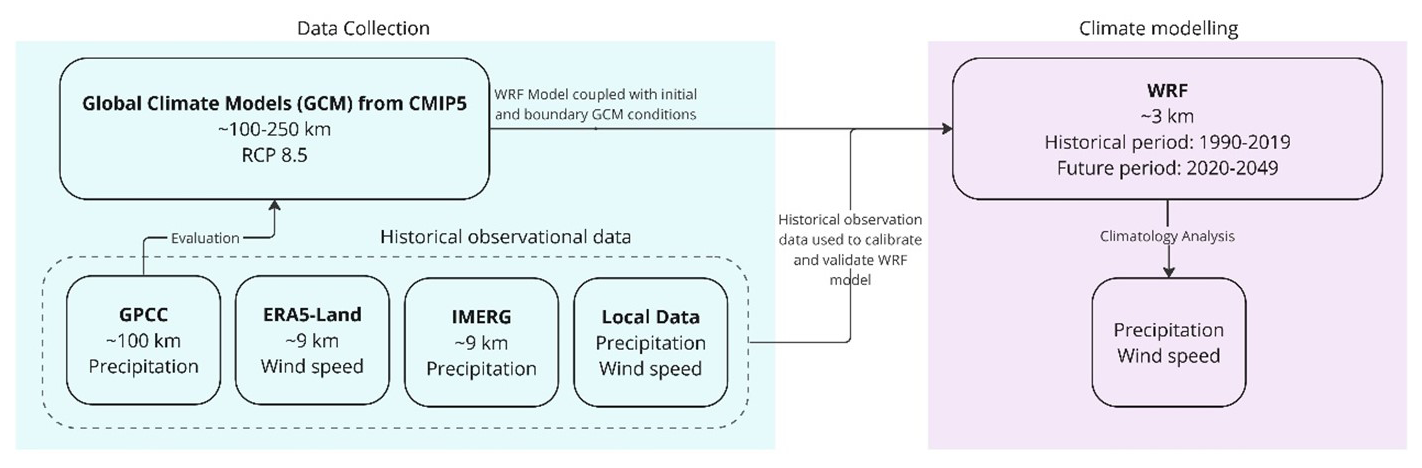
The study of climate change and therefore the future changes in extreme events cannot be deterministic, given the large existing uncertainties related to the climate system itself, the uncertain evolution of emissions, and the limited capabilities of current climate models. That is why three distinct global models were downscaled using the WRF model, namely MPI-ESM-MR, CNRM_CM5, and CanESM2. These three models were selected amongst the available global climate models to reproduce the essential characteristics of the current climatic conditions in Burundi's historical period, and to capture the range of climate change signals present in the entire ensemble of GCMs.
As for the regional WRF model for Burundi, the model displayed a strong correlation in replicating the annual precipitation cycle, albeit with a tendency to overestimate this atmospheric variable during the rainy season. Similarly, the model exhibited good correlation with monthly averages of daily precipitation and the count of rainy days per month. Concerning wind speed, the model is consistent with scientific recommendations for mean daily wind speed and the 90th percentile of mean daily wind speed.
A1 Impact of climate change on precipitation
Bujumbura Mairie is the province where the greatest increase in precipitation is expected with a projected relative increase in the 3 h precipitation of up to 58.1 % for the return period of 50 years.
This includes simulations for the historical period and projections using three global climate models, analysed across different return periods (2, 10, 50, and 100 years). In Fig. A2, left, a summary of the results by province is shown, considering the average of the three future projections and the three return periods considered (2, 10 and 50 years). Darker blue colours indicate greater relative increases in the 3 h rains expected in the future compared with the historical value. The analyses indicate (e.g. Fig. 15 right) that for the same return period and duration, torrential rains in Burundi will be more intense (or alternatively, that precipitation of a given high intensity will be more frequent). The smallest increases in the intensity are projected in the central part of the country (Kayanza, Mwaro, Muramvya, Bubanza, Gitega and Bururi).
A2 Impact of climate change on wind
Figure A3 shows a summary of the results obtained by province, considering the average of the three future projections and the three return periods considered. Red indicates the relative increases in strong winds expected in the future when compared with the historical value. Blue indicates the relative decrease in the intensity and frequency of strong winds in the future. Darker colours indicate greater decrease or increase. In the case of no conclusions, the provinces appear in white. In all the central provinces (Bururi, Cibitoke, Gitega, Karuzi, Kayaza, Makamba, Muramvya, Mwaro, Ngozi, Rutana and Ruyigi) the intensity of the wind gust is expected to increase when considering the same return period. The greatest increases in intensity are projected for Kayaza, Karuzi and Rutana provinces. For Bubanza and Bujumbura-Mairie provinces, small decreases in the strong winds are expected. There is no agreement of the models for the northeast part of the country (Cankuzo, Muyinga and Kirundo) and the west provinces of Bujumbura-Rural and Rumonge for strong winds.
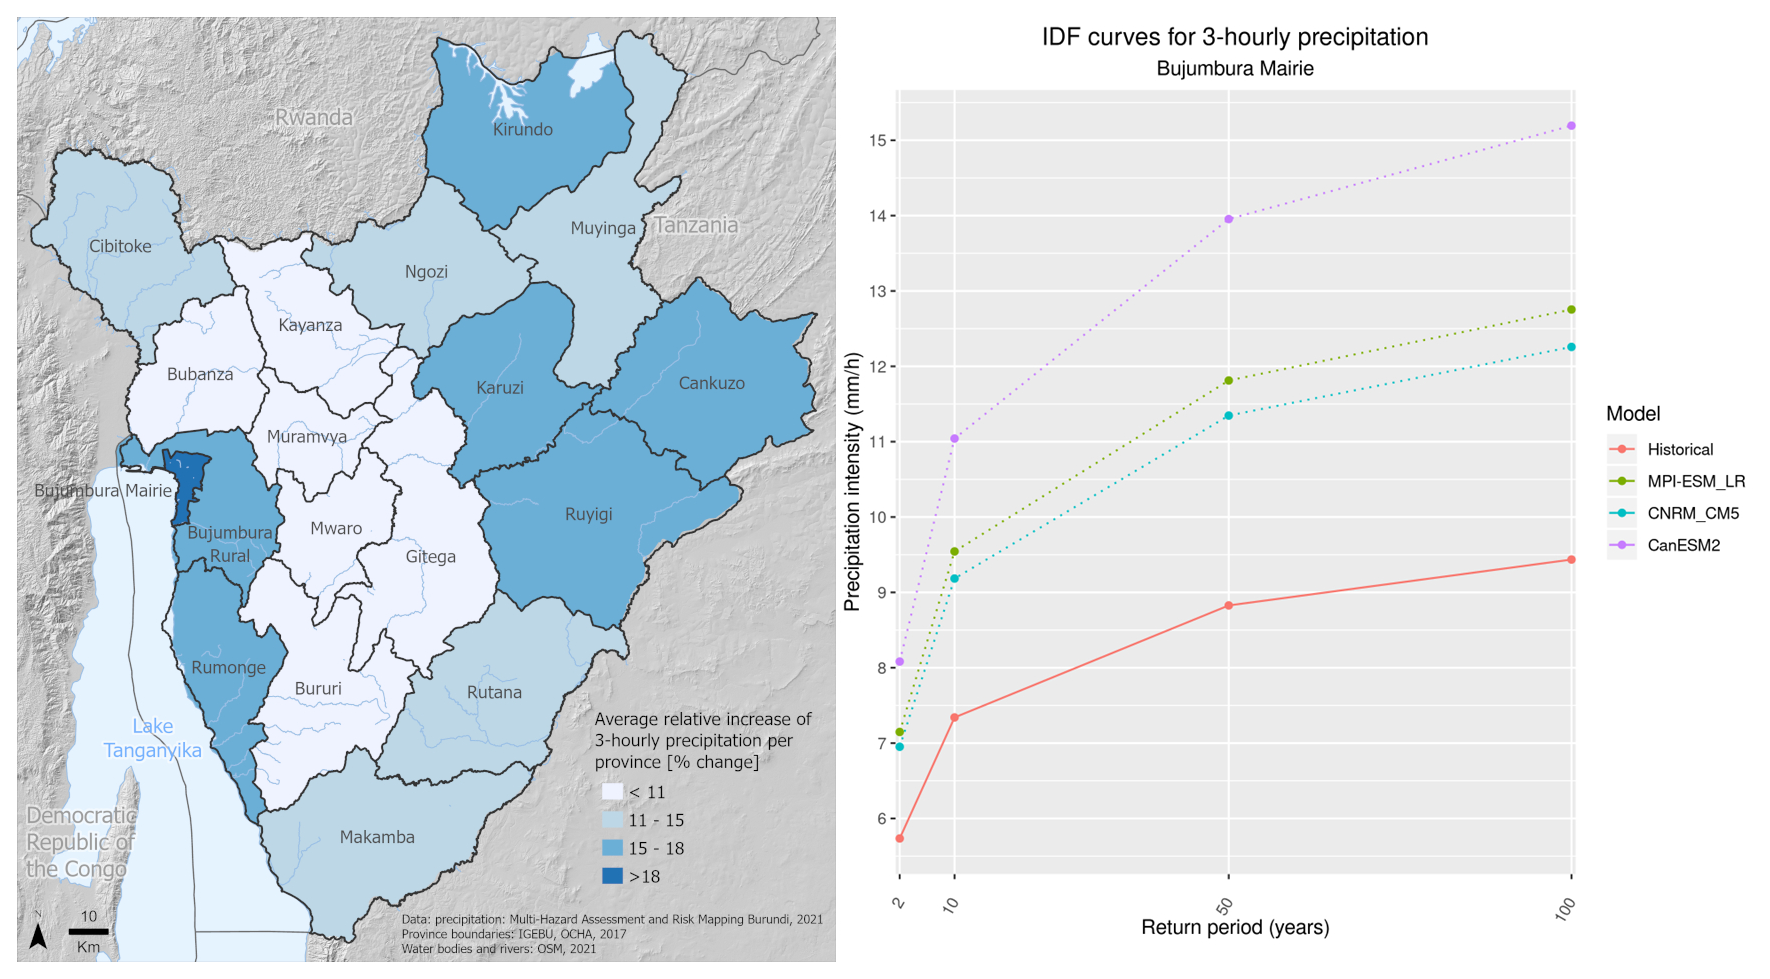
Figure A2Left: Burundi provinces according to the projected increase of intensity and frequency of the 3 h precipitation. Right: Precipitation intensity for a duration of 3 h predicted for the Bujumbura Mairie province by the forced WRF model.
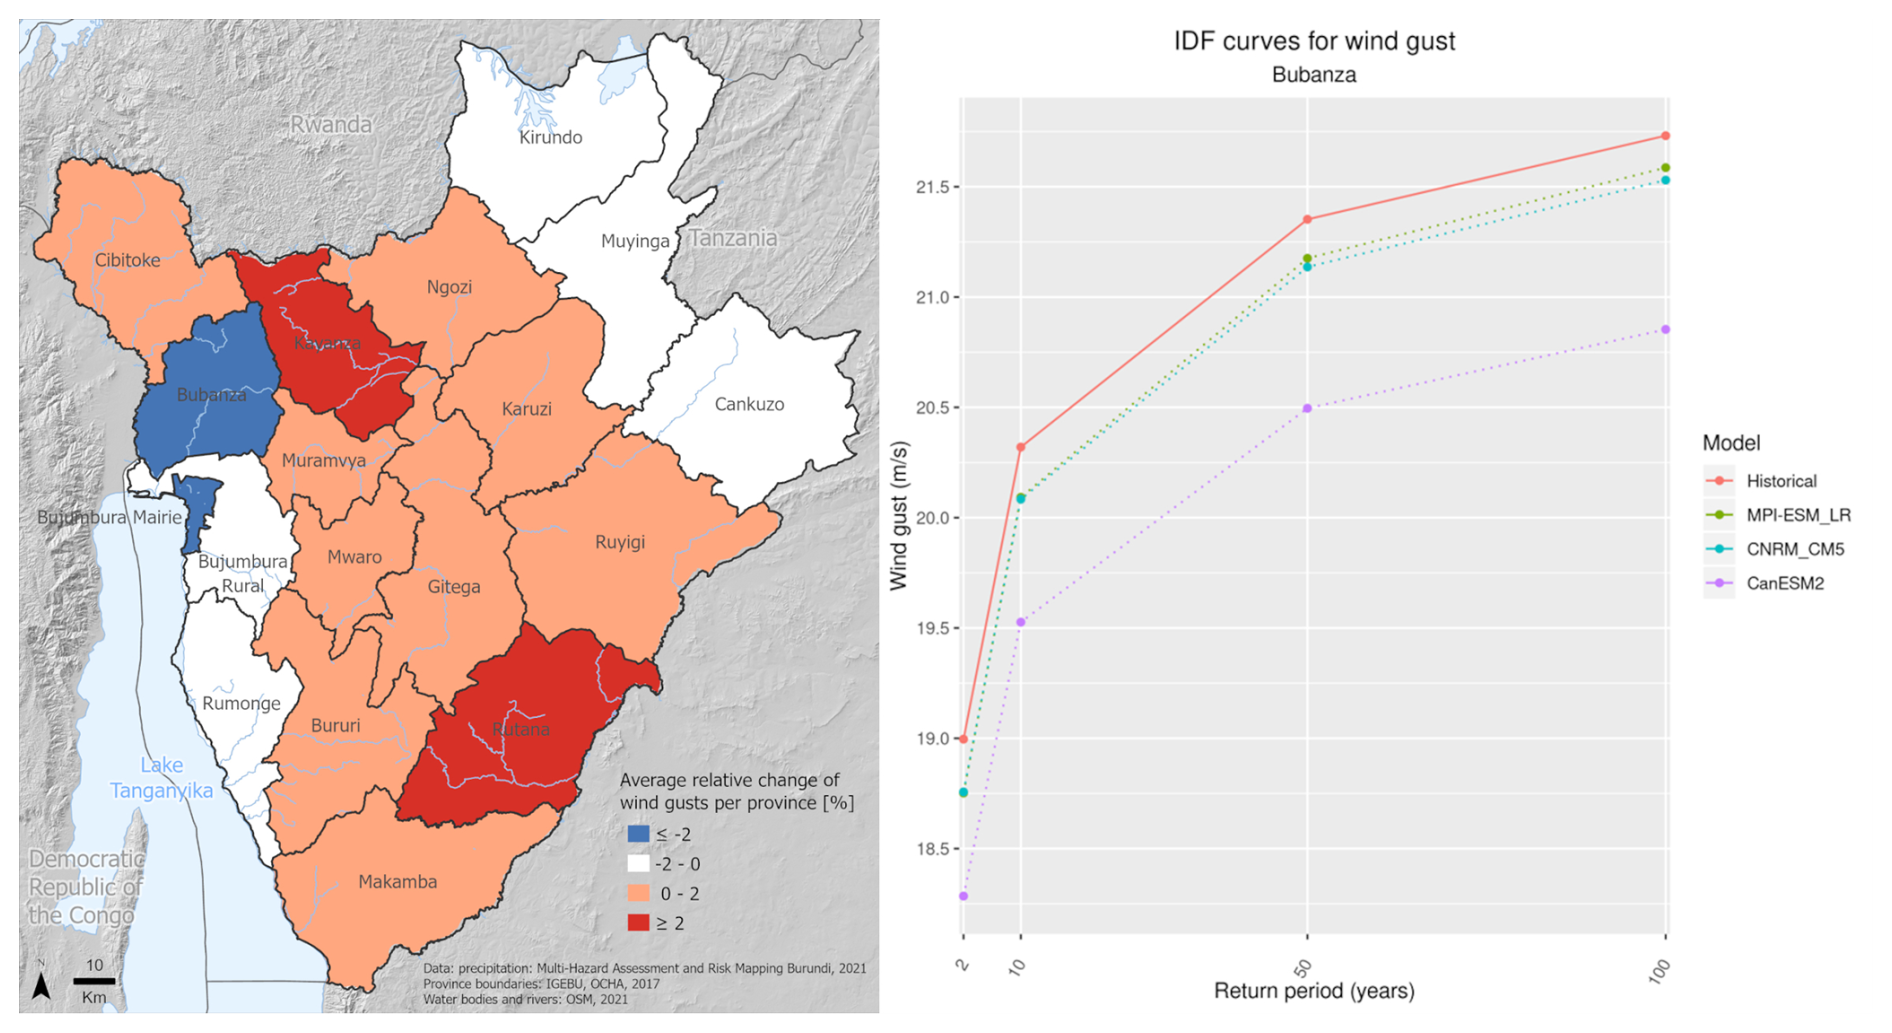
Figure A3Left: Burundi provinces according to the projected increase (red) or decrease (blue) of intensity and frequency of the wind gust. Right: Wind gust predicted by the forced WRF model with different models for the Bubanza province and return periods.
B1 Residential Buildings
The structural features and typical geometries of residential buildings commonly found in Burundi has been estimated as described in Table B1 below. Please refer to Brzev et al. (2013) for further information on the taxonomical descriptions. The estimated composition of the exposure model in terms of these typologies at colline level (referring to 2021 population and housing situation) is available as Supplement to this manuscript (Tables S1 and S2).
Table B1Structural types and geometry of residential buildings in Burundi. The description in terms of the GEM taxonomy has been included as well as the replacement value (in USD) estimated by local experts.
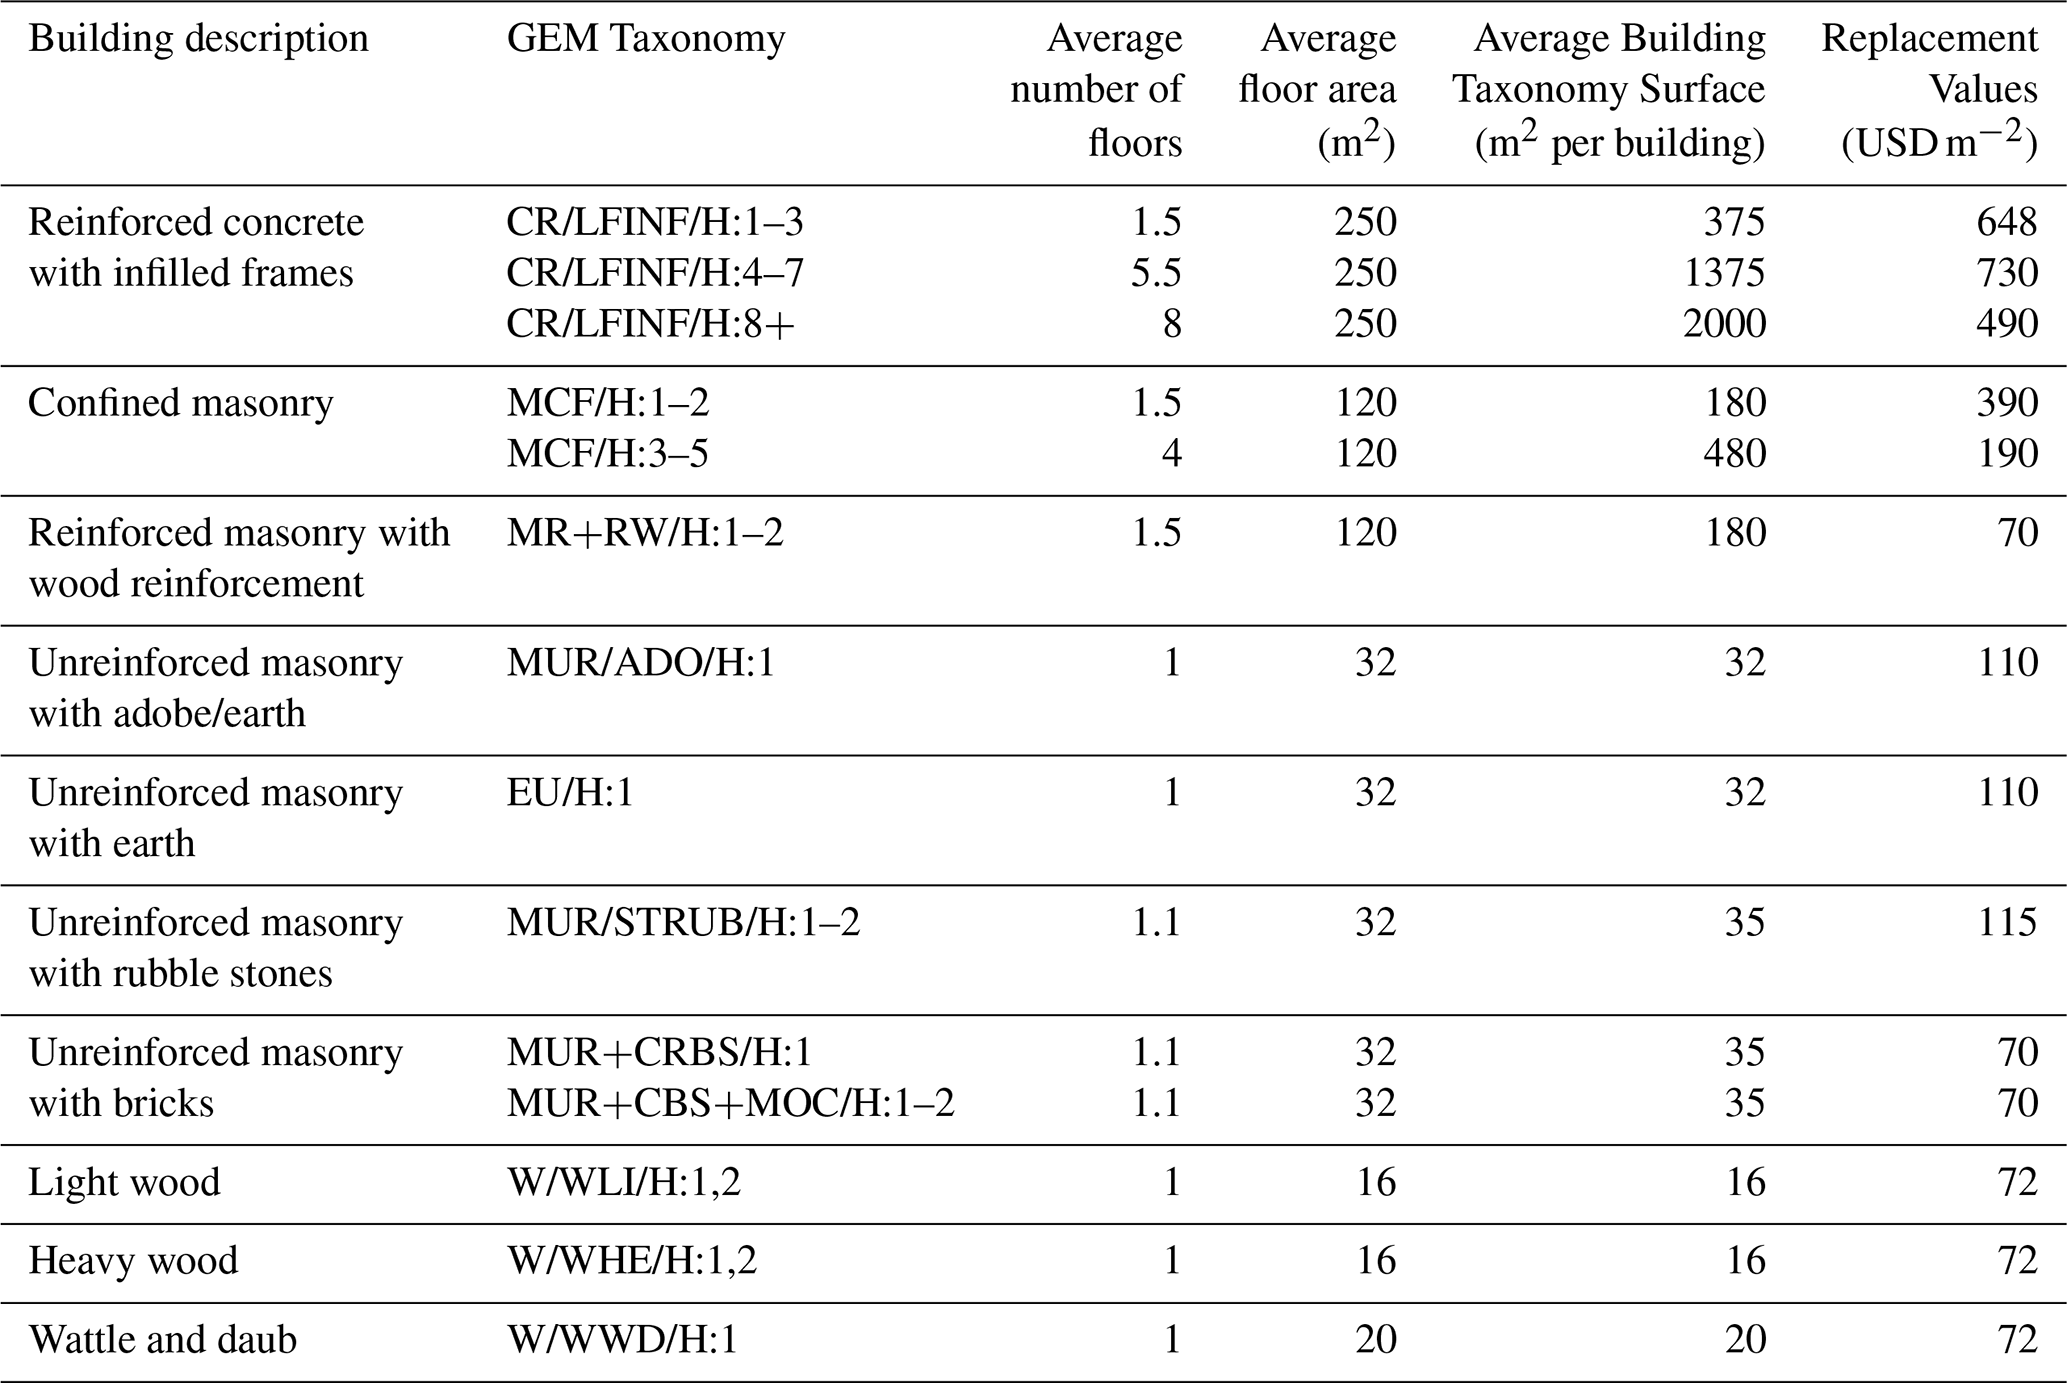
B2 Agricultural crops
The extension of the agricultural crops was derived by a land-cover map. Their replacement value was established in terms of the average value and expected productivity of the plots for the average type of crops, considering the lowland agriculture in the flood plains (based on expert judgment and local sources). In order to establish a plausible replacement value, the average productivity and monetary value of crops throughout the country was compiled from FAO (https://www.fao.org/faostat/en/#data/QI, last access: 13 February 2026) and other international sources. As is illustrated in Table B2, the weighted average value for the assumed typical river floodplain crops has been estimated as USD 1450 ha−1 (rounded) based on the production data of year 2018 (last available at the time of risk assessment).
Table B2Main expected crop types and related cultivation intensity and value. Cotton is included in the table as common crop on flood plains but was not considered for calculating the weighted average value as no national yield data for 2018 was available.
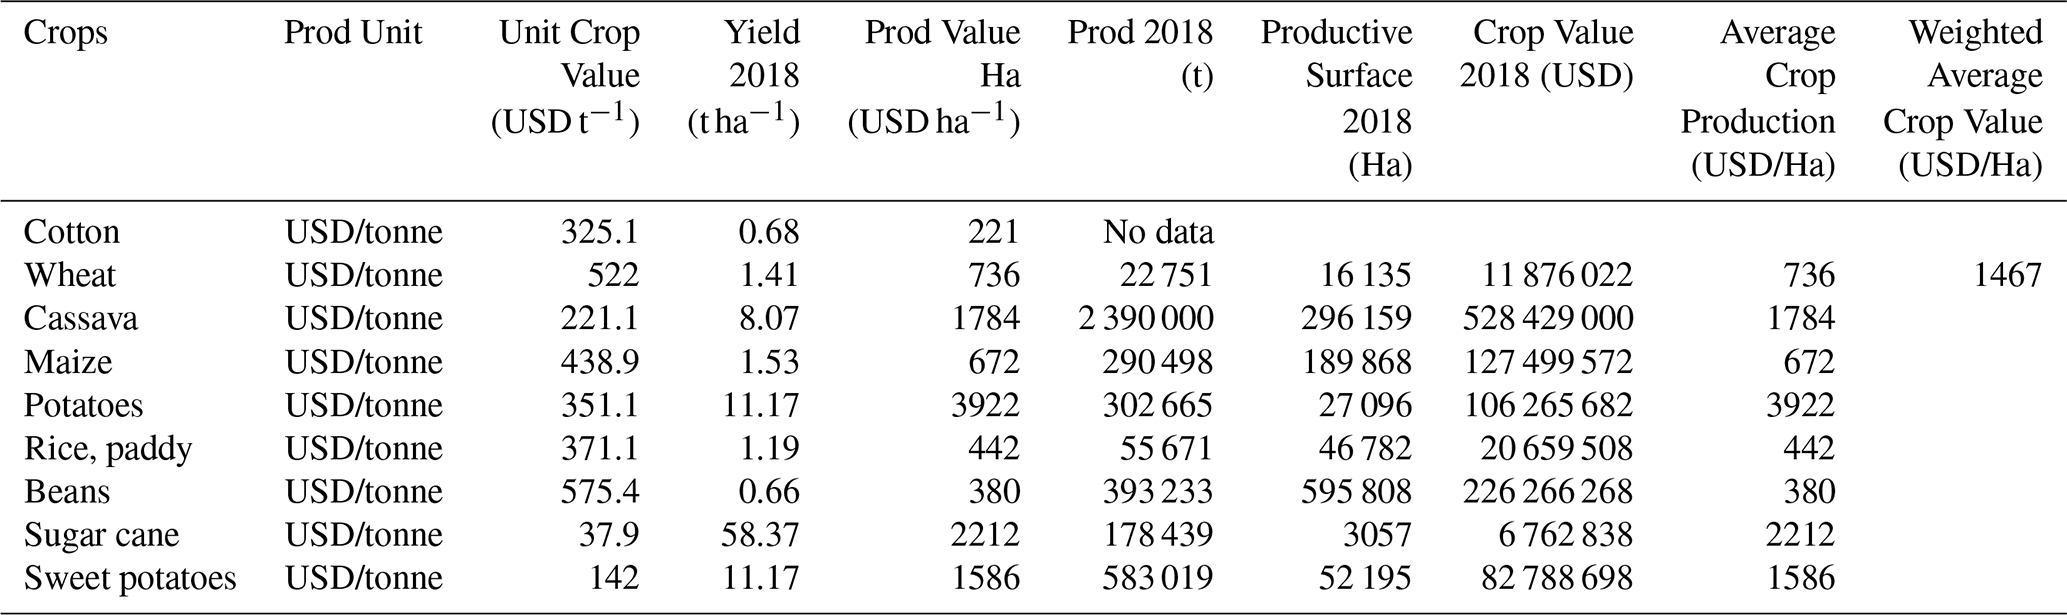
The software code used for this study is not publicly accessible because it contains internal scripts developed for the project that are not part of a public repository. Access to the code can be provided upon reasonable request to the corresponding author. No third-party code beyond standard scientific libraries (e.g., Python packages, R packages) was used.
The research data generated and analyzed in this study, including processed results and intermediate datasets, cannot be made publicly available due to agreements with data providers. Access to the underlying data can be provided upon reasonable request to the corresponding author, subject to any legal or ethical restrictions.
The supplement related to this article is available online at https://doi.org/10.5194/nhess-26-1347-2026-supplement.
M.P. and E.P. designed the study. E.P. contributed to the development of the flood hazard map and the related analyses and developed the compilation of the risk assessment estimates (AAL) for the five hazards considered, producing risk maps at municipal, provincial, and national scale. M.M. developed the landslide models and carried out the related analyses. M. B. B.O. conducted the Probabilistic Seismic Hazard Assessment. M.P., K.R., E.P. and P.C. developed the exposure models and carried out the related analyses. S.S. and J.L.D. developed and conducted the Socioeconomic Vulnerability Assessment. J.P. and M.P. conducted the climate change analysis. K.R. designed the figures with input from all other authors. J.L.D. coordinated the manuscript production. All authors proofread and commented on the manuscript.
The contact author has declared that none of the authors has any competing interests.
Publisher's note: Copernicus Publications remains neutral with regard to jurisdictional claims made in the text, published maps, institutional affiliations, or any other geographical representation in this paper. The authors bear the ultimate responsibility for providing appropriate place names. Views expressed in the text are those of the authors and do not necessarily reflect the views of the publisher.
The authors would like to warmly thank, Sandrine Dhenain, Blandine Arvis, Mathieu Vinet, Lydia Rincón de la Rosa, Fanny Overlack, Alexis Nikiza, Léonidas Nduwayo, Celeus Rwishinza, for the continuous help throughout the project. A particular acknowledgement to Carlos Villacis Villafuerte and Emmanuel Noel for the constructive support.
The activities described in this paper were funded by the International Organization of Migration (IOM), Bujumbura, Burundi. The authors thank the Department of Innovation, Research, University and Museums of the Autonomous Province of Bozen/Bolzano for covering the Open Access publication costs.
This paper was edited by Robert Sakic Trogrlic and reviewed by Olivier Dewitte and three anonymous referees.
American Society of Civil Engineers: Minimum Design Loads and Associated Criteria for Buildings and Other Structures, American Society of Civil Engineers, Reston, VA, https://doi.org/10.1061/9780784415788, 2021.
Baddeley, A., Turner, R., Møller, J., and Hazelton, M.: Residual Analysis for Spatial Point Processes (with Discussion), J. R. Stat. Soc. Ser. B Stat. Methodol., 67, 617–666, https://doi.org/10.1111/j.1467-9868.2005.00519.x, 2005.
Birkmann, J., Cardona, O. D., Carreño, M. L., Barbat, A. H., Pelling, M., Schneiderbauer, S., Kienberger, S., Keiler, M., Alexander, D., Zeil, P., and Welle, T.: Framing vulnerability, risk and societal responses: the MOVE framework, Nat. Hazards, 67, 193–211, https://doi.org/10.1007/s11069-013-0558-5, 2013.
Broeckx, J., Vanmaercke, M., Duchateau, R., and Poesen, J.: A data-based landslide susceptibility map of Africa, Earth-Sci. Rev., 185, 102–121, https://doi.org/10.1016/j.earscirev.2018.05.002, 2018.
Brzev, S., Scawthorn, C., Charleson, A. W., Allen, L., Greene, M., Jaiswal, K. S., and Silva, V.: GEM Building Taxonomy Version 2.0, GEM, https://cloud-storage.globalquakemodel.org/public/wix-new-website/pdf-collections-wix/publications/GEM Building Taxonomy Version 2.0.pdf (last access: 17 February 2026), 2013.
Calvo, B. and Savi, F.: A real-world application of Monte Carlo procedure for debris flow risk assessment, Comput. Geosci., 35, 967–977, https://doi.org/10.1016/j.cageo.2008.04.002, 2009.
Campalani, P., Pittore, M., and Renner, K.: Assessing OpenStreetMap roads fitness-for-use for disaster risk assessment in developing countries: The case of Burundi, Open Geosci., 15, 20220485, https://doi.org/10.1515/geo-2022-0485, 2023.
CEN (European Committee for Standardization): Eurocode 8: Design of structures for earthquake resistance – Part 1: General rules, seismic actions and rules for buildings (EN 1998-1:2004), Brussels: CEN, https://structuraldynamics.ulb.be/DOS/Eurocode8.pdf (last access: 17 February 2026), 2004.
Choi, E., Ha, J.-G., Hahm, D., and Kim, M. K.: A review of multihazard risk assessment: Progress, potential, and challenges in the application to nuclear power plants, Int. J. Disaster Risk Reduct., 53, 101933, https://doi.org/10.1016/j.ijdrr.2020.101933, 2021.
Cocuccioni, S., Plörer, M., and Kirchner, M.: Stakeholder Integration and Participatory Processes as Part of an Ecosystem-Based and Integrated Natural Hazard Risk Management, https://doi.org/10.5772/intechopen.99516, 2022.
Coles, S.: An Introduction to Statistical Modeling of Extreme Values, Springer London, London, https://doi.org/10.1007/978-1-4471-3675-0, 2001.
Copernicus: Flood hazard assessment in Bujumbura, Burundi, https://mapping.emergency.copernicus.eu/activations/EMSN191/#:~:text=Geodata REST API Fast Access,through JRC's ArcGIS REST services (last access: 17 February 2026), 2024.
Cornell, C. A.: Engineering seismic risk analysis, Bull. Seismol. Soc. Am., 58, 1583–1606, https://doi.org/10.1785/BSSA0580051583, 1968.
Corominas, J. and Moya, J.: A review of assessing landslide frequency for hazard zoning purposes, Eng. Geol., 102, 193–213, https://doi.org/10.1016/j.enggeo.2008.03.018, 2008.
Deijns: Deijns et al. NHESS -SAR Timing- GH Event Inventories, Zenodo, https://doi.org/10.5281/zenodo.7198321, 2022.
Delvaux, D., Mulumba, J.-L., Sebagenzi, M. N. S., Bondo, S. F., Kervyn, F., and Havenith, H.-B.: Seismic hazard assessment of the Kivu rift segment based on a new seismotectonic zonation model (western branch, East African Rift system), J. Afr. Earth Sci., 134, 831–855, https://doi.org/10.1016/j.jafrearsci.2016.10.004, 2017.
Depicker, A., Jacobs, L., Mboga, N., Smets, B., Van Rompaey, A., Lennert, M., Wolff, E., Kervyn, F., Michellier, C., Dewitte, O., and Govers, G.: Historical dynamics of landslide risk from population and forest-cover changes in the Kivu Rift, Nat. Sustain., 4, 965–974, https://doi.org/10.1038/s41893-021-00757-9, 2021a.
Depicker, A., Govers, G., Jacobs, L., Campforts, B., Uwihirwe, J., and Dewitte, O.: Interactions between deforestation, landscape rejuvenation, and shallow landslides in the North Tanganyika–Kivu rift region, Africa, Earth Surf. Dynam., 9, 445–462, https://doi.org/10.5194/esurf-9-445-2021, 2021b.
Depicker, A., Govers, G., Jacobs, L., Vanmaercke, M., Uwihirwe, J., Campforts, B., Kubwimana, D., Maki Mateso, J.-C., Mugaruka Bibentyo, T., Nahimana, L., Smets, B., and Dewitte, O.: Mobilization rates of landslides in a changing tropical environment: 60-year record over a large region of the East African Rift, Geomorphology, 454, 109156, https://doi.org/10.1016/j.geomorph.2024.109156, 2024.
Dewitte, O., Dille, A., Depicker, A., Kubwimana, D., Maki Mateso, J.-C., Mugaruka Bibentyo, T., Uwihirwe, J., and Monsieurs, E.: Constraining landslide timing in a data-scarce context: from recent to very old processes in the tropical environment of the North Tanganyika-Kivu Rift region, Landslides, 18, 161–177, https://doi.org/10.1007/s10346-020-01452-0, 2021.
Dike, V. N., Addi, M., Andang'o, H. A., Attig, B. F., Barimalala, R., Diasso, U. J., Du Plessis, M., Lamine, S., Mongwe, P. N., Zaroug, M., and Ochanda, V. K.: Obstacles facing Africa's young climate scientists, Nat. Clim. Change, 8, 447–449, https://doi.org/10.1038/s41558-018-0178-x, 2018.
Dixon, J., Garrity, D. P., Boffa, J.-M., Williams, T. O., Amede, T., Auricht, C., Lott, R., and Mburathi, G. (Eds.): Farming Systems and Food Security in Africa: Priorities for Science and Policy under Global Change, 1st ed., Routledge, New York, Routledge, https://doi.org/10.4324/9781315658841, 2019.
Englhardt, J., de Moel, H., Huyck, C. K., de Ruiter, M. C., Aerts, J. C. J. H., and Ward, P. J.: Enhancement of large-scale flood risk assessments using building-material-based vulnerability curves for an object-based approach in urban and rural areas, Nat. Hazards Earth Syst. Sci., 19, 1703–1722, https://doi.org/10.5194/nhess-19-1703-2019, 2019.
EU-DRMKC: INFORM Subnational Risk Assessment, https://drmkc.jrc.ec.europa.eu/inform-index/INFORM-Subnational-risk (last access: 17 February 2026), 2020.
European Commission, Joint Research Centre: Index for risk management – INFORM: concept and methodology, version 2017, Publications Office, LU, https://doi.org/10.2760/094023, 2017.
European Commission, Joint Research Centre: INFORM report 2023: shared evidence for managing crises and disasters, Publications Office, LU, https://doi.org/10.2760/073809, 2023.
FEMA: Hazus-MH 2.1 Earthquake Model Technical Manual, Federal Emergency Management Agency, Washington, DC, https://www.fema.gov/flood-maps/tools-resources/flood-map-products/hazus/documentation (last access: 17 February 2026), 2012.
FEMA: NEHRP Recommended Seismic Provisions for New Buildings and Other Structures (FEMA P-2082), Federal Emergency Management Agency, Washington, DC, https://www.wbdg.org/dhs/criteria/fema-p-2082-vol-1 (last access: 17 February 2026), 2020.
Fritzsche, K., Schneiderbauer, S., Bubeck, P., Kienberger, S., Buth, M., Zebisch, M., and Kahlenborn, W.: The Vulnerability Sourcebook. Concept and guidelines for standardised vulnerability assessments., Deutsche Gesellschaft für Internationale Zusammenarbeit (GIZ), https://health.bmz.de/wp-content/uploads/page/Vulnerability_Sourcebook__1_.pdf, (last access: 17 February 2026), 2014.
Gallina, V., Torresan, S., Critto, A., Sperotto, A., Glade, T., and Marcomini, A.: A review of multi-risk methodologies for natural hazards: Consequences and challenges for a climate change impact assessment, J. Environ. Manage., 168, 123–132, https://doi.org/10.1016/j.jenvman.2015.11.011, 2016.
Gbetkom, P. G., Crétaux, J.-F., Biancamaria, S., Blazquez, A., Paris, A., Tchilibou, M., Gal, L., Kitambo, B., Jucá Oliveira, R. A., and Gosset, M.: Lake Tanganyika basin water storage variations from 2003–2021 for water balance and flood monitoring, Remote Sens. Appl. Soc. Environ., 34, 101182, https://doi.org/10.1016/j.rsase.2024.101182, 2024.
Harper, B. A., Kepert, J. D., and Ginger, J. D.: Guidelines for converting between various wind averaging periods in tropical cyclone conditions, Geneva, https://library.wmo.int/idurl/4/48652 (last access: 17 February 2026), 2010.
Hungr, O., Leroueil, S., and Picarelli, L.: The Varnes classification of landslide types, an update, Landslides, 11, 167–194, https://doi.org/10.1007/s10346-013-0436-y, 2014.
Intergovernmental Panel On Climate Change (IPCC): Climate Change 2022 – Impacts, Adaptation and Vulnerability: Working Group II Contribution to the Sixth Assessment Report of the Intergovernmental Panel on Climate Change, 1st ed., Cambridge University Press, https://doi.org/10.1017/9781009325844, 2023.
IOM: Burundi Displacement Tracking Matrix (DTM) [April 2020], International Organization for Migration, 2020.
IPCC: IPCC Appendix I: Glossary, in: Global Warming of 1.5° C. An IPCC Special Report on the impacts of global warming of 1.5° C above pre-industrial levels and related global greenhouse gas emission pathways, in the context of strengthening the global response to the threat of climate change, sustainable development, and efforts to eradicate poverty, edited by: Matthews, J. B. R., Masson-Delmotte, V., Zhai, P., Pörtner, H.-O., Roberts, D., Skea, J., Shukla, P. R., Pirani, A., Moufouma-Okia, W., Péan, C., Pidcock, R., Connors, S., Matthews, J. B. R., Chen, Y., Zhou, X., Gomis, M. I., Lonnoy, E., Maycock, T., Tignor, M., and Waterfield, T., Cambridge University Press, Cambridge, UK and New York, NY, US, 541–562, https://doi.org/10.1017/9781009157940, 2018.
ISTEEBU: Rapport des projection demographiques 2008–2030, Institut de statistiques et d'études économiques du Burundi, Ministère des finances et de la planification du développement économique, Bujumbura, https://burundi.unfpa.org/sites/default/files/resource-pdf/Rapportdesprojections2008-2030.pdf (last access: 17 February 2026), 2013.
ISTEEBU: Projections démographiques 2010–2050 niveau national et provincial, Institut de statistiques et d’études économiques du Burundi, Bujumbura, 2017.
ISTEEBU: Annuaire Statistique du Burundi 2019, https://www.insbu.bi/documents/Annuaires/Annuaire-Statistique-du-Burundi_2020.pdf (last access: 17 February 2026), 2020.
Jacobs, L., Dewitte, O., Poesen, J., Sekajugo, J., Nobile, A., Rossi, M., Thiery, W., and Kervyn, M.: Field-based landslide susceptibility assessment in a data-scarce environment: the populated areas of the Rwenzori Mountains, Nat. Hazards Earth Syst. Sci., 18, 105–124, https://doi.org/10.5194/nhess-18-105-2018, 2018.
JRC: Science for disaster risk management 2020: acting today, protecting tomorrow, https://doi.org/10.2760/438998, 2021.
Kappes, M. S., Keiler, M., Von Elverfeldt, K., and Glade, T.: Challenges of analyzing multi-hazard risk: a review, Nat. Hazards, 64, 1925–1958, https://doi.org/10.1007/s11069-012-0294-2, 2012.
Kircher, C. A., Whitman, R. V., and Holmes, W. T.: HAZUS Earthquake Loss Estimation Methods, Nat. Hazards Rev., 7, 45–59, https://doi.org/10.1061/(ASCE)1527-6988(2006)7:2(45), 2006.
Kramer, S. L.: Geotechnical Earthquake Engineering, Prentice Hall, https://archive.org/details/geotechnicaleart0000kram (last access: 17 February 2026), 1996.
Kubwimana, D., Ait Brahim, L., Nkurunziza, P., Dille, A., Depicker, A., Nahimana, L., Abdelouafi, A., and Dewitte, O.: Characteristics and Distribution of Landslides in the Populated Hillslopes of Bujumbura, Burundi, Geosciences, 11, 259, https://doi.org/10.3390/geosciences11060259, 2021.
Luo, H. Y., Zhang, L. M., Zhang, L. L., He, J., and Yin, K. S.: Vulnerability of buildings to landslides: The state of the art and future needs, Earth-Sci. Rev., 238, 104329, https://doi.org/10.1016/j.earscirev.2023.104329, 2023.
Malamud, B. D., Turcotte, D. L., Guzzetti, F., and Reichenbach, P.: Landslide inventories and their statistical properties, Earth Surf. Process. Landf., 29, 687–711, https://doi.org/10.1002/esp.1064, 2004.
McGuire, R. K.: Seismic hazard and risk analysis, Earthquake Engineering Research Institute, Oakland, Calif, 221 pp., 2004.
MEEATU: Description du Burundi: Aspects Physiques, Ministère de L'Eau, de l'Environnement, de l'Amenagement du Territoire et de l'Urbanisme, 2012.
Michellier, C., Pigeon, P., Paillet, A., Trefon, T., Dewitte, O., and Kervyn, F.: The Challenging Place of Natural Hazards in Disaster Risk Reduction Conceptual Models: Insights from Central Africa and the European Alps, Int. J. Disaster Risk Sci., 11, 316–332, https://doi.org/10.1007/s13753-020-00273-y, 2020.
Molinari, D., Scorzini, A. R., Gallazzi, A., and Ballio, F.: AGRIDE-c, a conceptual model for the estimation of flood damage to crops: development and implementation, Nat. Hazards Earth Syst. Sci., 19, 2565–2582, https://doi.org/10.5194/nhess-19-2565-2019, 2019.
Monsieurs, E., Dewitte, O., and Demoulin, A.: A susceptibility-based rainfall threshold approach for landslide occurrence, Nat. Hazards Earth Syst. Sci., 19, 775–789, https://doi.org/10.5194/nhess-19-775-2019, 2019.
NASA JPL/USGS: NASA Shuttle Radar Topography Mission (SRTM) Global 1 arc second, 2000.
Nibigira, L., Draidia, S., and Havenith, H.-B.: La vallée du rift est-africain face aux risques gravitaires: cas de Bujumbura (Burundi), https://hdl.handle.net/2268/158392, 2013.
Nkunzimana, A., Bi, S., Jiang, T., Wu, W., and Abro, M. I.: Spatiotemporal variation of rainfall and occurrence of extreme events over Burundi during 1960 to 2010, Arab. J. Geosci., 12, 176, https://doi.org/10.1007/s12517-019-4335-y, 2019.
Nsabimana, J., Henry, S., Ndayisenga, A., Kubwimana, D., Dewitte, O., Kervyn, F., and Michellier, C.: Geo-Hydrological Hazard Impacts, Vulnerability and Perception in Bujumbura (Burundi): A High-Resolution Field-Based Assessment in a Sprawling City, Land, 12, 1876, https://doi.org/10.3390/land12101876, 2023.
OCHA: Aperçu des besoins humanitaires Burundi, https://www.unocha.org/publications/report/burundi/burundi-aper-u-des-besoins-humanitaires-2020-f-vrier-2020 (last access: 17 February 2026), 2020.
Owolabi, T. A. and Sajjad, M.: A global outlook on multi-hazard risk analysis: A systematic and scientometric review, Int. J. Disaster Risk Reduct., 92, 103727, https://doi.org/10.1016/j.ijdrr.2023.103727, 2023.
Patanè, G., Bortolotti, T., Yordanov, V., Biagi, L. G. A., Brovelli, M. A., Truong, X. Q., and Vantini, S.: An interpretable and transferable model for shallow landslides detachment combining spatial Poisson point processes and generalized additive models, Stoch. Environ. Res. Risk Assess., 39, 1723–1740, https://doi.org/10.1007/s00477-025-02943-z, 2025.
Paul, N. and Silva, V.: Probabilistic seismic risk assessment of Africa, Int. J. Disaster Risk Reduct., 119, 105303, https://doi.org/10.1016/j.ijdrr.2025.105303, 2025.
Pittore, M., Wieland, M., and Fleming, K.: Perspectives on global dynamic exposure modelling for geo-risk assessment, Nat. Hazards, 86, 7–30, https://doi.org/10.1007/s11069-016-2437-3, 2017.
Raju, E., Boyd, E., and Otto, F.: Stop blaming the climate for disasters, Commun. Earth Environ., 3, https://doi.org/10.1038/s43247-021-00332-2, 2022.
Rözer, V., Surminski, S., Laurien, F., McQuistan, C., and Mechler, R.: Multiple resilience dividends at the community level: A comparative study of disaster risk reduction interventions in different countries, Clim. Risk Manag., 40, 100518, https://doi.org/10.1016/j.crm.2023.100518, 2023.
Šakić Trogrlić, R., Reiter, K., Ciurean, R. L., Gottardo, S., Torresan, S., Daloz, A. S., Ma, L., Padrón Fumero, N., Tatman, S., Hochrainer-Stigler, S., De Ruiter, M. C., Schlumberger, J., Harris, R., Garcia-Gonzalez, S., García-Vaquero, M., Arévalo, T. L. F., Hernandez-Martin, R., Mendoza-Jimenez, J., Ferrario, D. M., Geurts, D., Stuparu, D., Tiggeloven, T., Duncan, M. J., and Ward, P. J.: Challenges in assessing and managing multi-hazard risks: A European stakeholders perspective, Environ. Sci. Policy, 157, 103774, https://doi.org/10.1016/j.envsci.2024.103774, 2024.
Schneiderbauer, S., Calliari, E., Eidsvig, U., and Hagenlocher, M.: The most recent view of vulnerability, in: Science for disaster risk management 2017 knowing better and losing less, edited by: Poljanšek, K., Marin-Ferrer, M., De Groeve, T., and Clark, L., Publications Office of the European Union, Luxembourg, 68–82, https://doi.org/10.2788/842809, 2017.
Schneiderbauer, S., Baunach, D., Pedoth, L., Renner, K., Fritzsche, K., Bollin, C., Pregnolato, M., Zebisch, M., Liersch, S., Rivas López, M. del R., and Ruzima, S.: Spatial-Explicit Climate Change Vulnerability Assessments Based on Impact Chains. Findings from a Case Study in Burundi, Sustainability, 12, 6354, https://doi.org/10.3390/su12166354, 2020.
Sekajugo, J., Kagoro-Rugunda, G., Mutyebere, R., Kabaseke, C., Mubiru, D., Kanyiginya, V., Vranken, L., Jacobs, L., Dewitte, O., and Kervyn, M.: Exposure and physical vulnerability to geo-hydrological hazards in rural environments: A field-based assessment in East Africa, Int. J. Disaster Risk Reduct., 102, 104282, https://doi.org/10.1016/j.ijdrr.2024.104282, 2024.
Silva, V., Amo-Oduro, D., Calderon, A., Dabbeek, J., Despotaki, V., Martins, L., Rao, A., Simionato, M., Viganò, D., Yepes, C., Acevedo, A., Horspool, N., Crowley, H., Jaiswal, K., Journeay, M., and Pittore, M.: Global Earthquake Model (GEM) Exposure Map (version 2018), Global Earthquake Model Foundation, Pavia, Italy, 2018.
Skamarock, W. C., Klemp, J. B., Dudhia, J., Gill, D. O., Barker, D. M., Duda, M. G., Huang, X.-Y., Wang, W., and Powers, J. G.: A Description of the Advanced Research WRF Version 3, NCAR Tech. Note NCARTN-475STR June 2008 Mesoscale Microscale Meteorol. Div. Natl. Cent. Atmospheric Res. Boulder, 475, 1, https://doi.org/10.5065/D68S4MVH, 2008.
Stalhandske, Z., Steinmann, C. B., Meiler, S., Sauer, I. J., Vogt, T., Bresch, D. N., and Kropf, C. M.: Global multi-hazard risk assessment in a changing climate, Sci. Rep., 14, https://doi.org/10.1038/s41598-024-55775-2, 2024.
Stark, C. P. and Hovius, N.: The characterization of landslide size distributions, Geophys. Res. Lett., 28, 1091–1094, https://doi.org/10.1029/2000GL008527, 2001.
Stevens, F. R., Gaughan, A. E., Linard, C., and Tatem, A. J.: Disaggregating Census Data for Population Mapping Using Random Forests with Remotely-Sensed and Ancillary Data, PLOS ONE, 10, e0107042, https://doi.org/10.1371/journal.pone.0107042, 2015.
Tanyaş, H., Van Westen, C. J., Allstadt, K. E., and Jibson, R. W.: Factors controlling landslide frequency–area distributions, Earth Surf. Process. Landf., 44, 900–917, https://doi.org/10.1002/esp.4543, 2019.
Tebbens, S. F.: Landslide Scaling: A Review, Earth Space Sci., 7, https://doi.org/10.1029/2019ea000662, 2020.
UNICEF: Burundi Country Office – Flash Humanitarian Situation Report No. 1 (April 2024), UNICEF, Bujumbura, Burundi, https://www.unicef.org/documents/burundi-flash-humanitarian-situation-report-no-1-30-april-2024 (last access: 4 March 2026), 2024.
UNISDR: Global Assessment Report on Disaster Risk Reduction 2015: Making Development Sustainable: The Future of Disaster Risk Management, United Nations Office for Disaster Risk Reduction (UNISDR), Geneva, Switzerland, https://doi.org/10.18356/919076d9-en, 2015a.
UNISDR: Sendai Framework for Disaster Risk Reduction 2015–2030, United Nations Office for Disaster Risk Reduction (UNISDR), Geneva, Switzerland, https://www.undrr.org/publication/sendai-framework-disaster-risk-reduction-2015-2030 (last access: 17 February 2026), 2015b.
Van Den Eeckhaut, M., Poesen, J., Govers, G., Verstraeten, G., and Demoulin, A.: Characteristics of the size distribution of recent and historical landslides in a populated hilly region, Earth Planet. Sci. Lett., 256, 588–603, https://doi.org/10.1016/j.epsl.2007.01.040, 2007a.
Van Den Eeckhaut, M., Poesen, J., Govers, G., Verstraeten, G., and Demoulin, A.: Characteristics of the size distribution of recent and historical landslides in a populated hilly region, Earth Planet. Sci. Lett., 256, 588–603, https://doi.org/10.1016/j.epsl.2007.01.040, 2007b.
Ward, P. J., Blauhut, V., Bloemendaal, N., Daniell, J. E., de Ruiter, M. C., Duncan, M. J., Emberson, R., Jenkins, S. F., Kirschbaum, D., Kunz, M., Mohr, S., Muis, S., Riddell, G. A., Schäfer, A., Stanley, T., Veldkamp, T. I. E., and Winsemius, H. C.: Review article: Natural hazard risk assessments at the global scale, Nat. Hazards Earth Syst. Sci., 20, 1069–1096, https://doi.org/10.5194/nhess-20-1069-2020, 2020.
World Bank: Understanding Risk in an Evolving World: Emerging Best Practices in Natural Disaster Risk Assessment, Global Facility for Disaster Reduction and Recovery (GFDRR), https://doi.org/10.1596/20579, 2014.
Zebisch, M., Renner, K., Pittore, M., Fritsch, U., Fruchter, S. R., Kienberger, S., Schinko, T., Sparkes, E., Hagenlocher, M., Schneiderbauer, S., and Delves, J. L.: Climate Risk Sourcebook, Deutsche Gesellschaft für Internationale Zusammenarbeit (GIZ), https://www.adaptationcommunity.net/wp-content/uploads/2023/10/giz_2023_Climate_Risk_Sourcebook.pdf (last access: 17 February 2026), 2023.
- Abstract
- Introduction
- Study area
- Methodology
- Climatic drivers
- Exposure
- Single-Hazard Risk Analysis
- Socioeconomic Vulnerability
- Results
- Discussion
- Conclusions and outlook
- Appendix A: Climate Change Analysis
- Appendix B: Exposure models
- Code availability
- Data availability
- Author contributions
- Competing interests
- Disclaimer
- Acknowledgements
- Financial support
- Review statement
- References
- Supplement