the Creative Commons Attribution 4.0 License.
the Creative Commons Attribution 4.0 License.
 | 05 Mar 2026
The EAWS matrix, a decision support tool to determine the regional avalanche danger level (Part B): operational testing and use
Karsten Müller
Christopher Marquardt
Christoph Mitterer
To support public safety and risk management in snow-covered mountains, regional avalanche forecasts must deliver reliable information on avalanche conditions, including regional danger levels representing the avalanche danger across warning regions. To promote greater transparency and consistency in avalanche danger level assessment across European avalanche warning services, a revised version of the EAWS Matrix was developed based on expert elicitation. The Matrix, a structured decision support tool that combines the Matrix input factors snowpack stability, the frequency of snowpack stability, and avalanche size, is used to determine the regional danger level. To support the development of the Matrix described in detail in the companion paper (Müller et al., 2025), we analyzed its operational use over the first three winters following implementation by 26 European avalanche warning services. Our aim was to identify inconsistencies in Matrix application and to provide empirically based guidance for further refinement. In operational use, forecasters predominantly assigned a consistent single danger level to most Matrix input factor combinations. However, two factor combinations (poor-some-size 2 and very poor-some-size3) were commonly assigned to one of two adjacent danger levels, indicating that these combinations function as transition zones between danger levels. Analyses based on finer-grained assessments of the input factors, that is, using sub-classes of the predefined coarse factor categories, revealed systematic tendencies within these classes. While application of the Matrix was relatively consistent for avalanche problems relating to dry-snow conditions, pronounced inconsistencies emerged in the classification of snowpack stability for wet-snow and gliding snow avalanche problems. These findings underscore the need for community-wide discussion and harmonization in Matrix application, particularly with respect to stability assessment practices. Assessing input factors at a finer scale shows potential for preserving important nuances in expert judgment and may enable more targeted guidance on when to assign the higher or lower of two danger levels indicated by the Matrix. However, because neither the danger level nor its input factors can be measured independently, a formal validation of Matrix logic and operational application is not possible. Despite some inconsistencies, our results suggest that European forecasters generally align with the Matrix logic, supporting its operational utility.
- Article
(3009 KB) - Full-text XML
- Companion paper
- BibTeX
- EndNote


Public avalanche forecasts play a key role in informing both authorities and recreational backcountry users about avalanche conditions at the regional scale. A primary objective of these forecasts is to communicate the severity of avalanche conditions clearly and efficiently (e.g., Engeset et al., 2018). To help users focus on the most important information first, avalanche forecasts are structured according to the concept of an information pyramid, with the most synthesized information placed at the top (EAWS, 2025d). The danger level, a single categorical value summarizing the hazard using a standardized five-level scale ranging from 1 (low) to 5 (very high) (EAWS, 2025b), sits at the top of this pyramid. It offers an immediate, easily understood signal to communicate the severity of avalanche conditions and serves as the entry point to more detailed forecast content. Recreational backcountry users often rely on this information, particularly during the planning stage, to guide their risk management strategies (e.g., Haegeli et al., 2006; Harvey et al., 2012; Schmudlach and Köhler, 2016).
Consistent and accurate assessment of danger levels, both within and across regional or national warning services, is essential to their effectiveness and is a prerequisite for providing valuable forecasts to end users (Murphy, 1993). Yet, forecasting avalanche danger at a regional scale is inherently complex. It requires synthesizing diverse data sources, including field observations and model predictions, that are often sparse, unevenly distributed in time and space, and available in both structured and unstructured formats. This process culminates in an expert judgment of the danger level, integrating both the probability of avalanche occurrence and the expected size of potential avalanches in a region. As with most expert estimation tasks, differences in danger level assessments may occur even when the same information is available during the forecast process (e.g., Lazar et al., 2016; Techel et al., 2024). To improve the consistency and transparency of danger level assessments across Europe, the European Avalanche Warning Services (EAWS) introduced decision-support tools to support the determination of regional avalanche danger levels (Bavarian matrix and EAWS-Matrix; Müller et al., 2025). Recently, this framework was revised including updated definitions, a structured operational workflow, and a new version of the EAWS-Matrix (EAWS, 2025a) (Fig. 1).
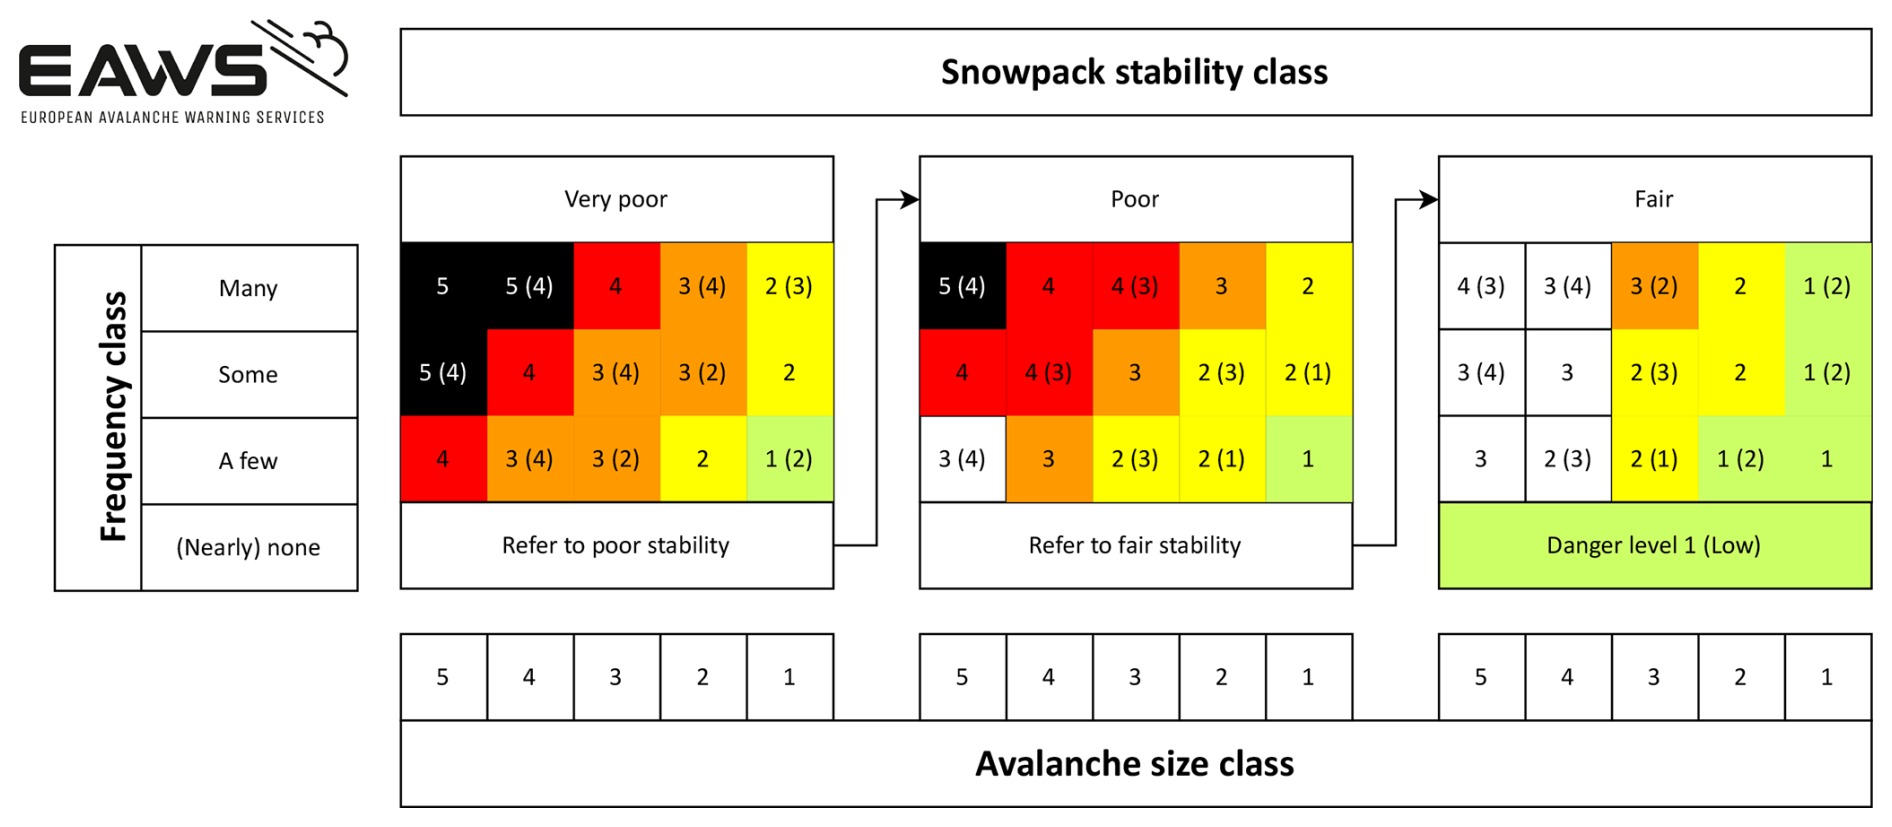
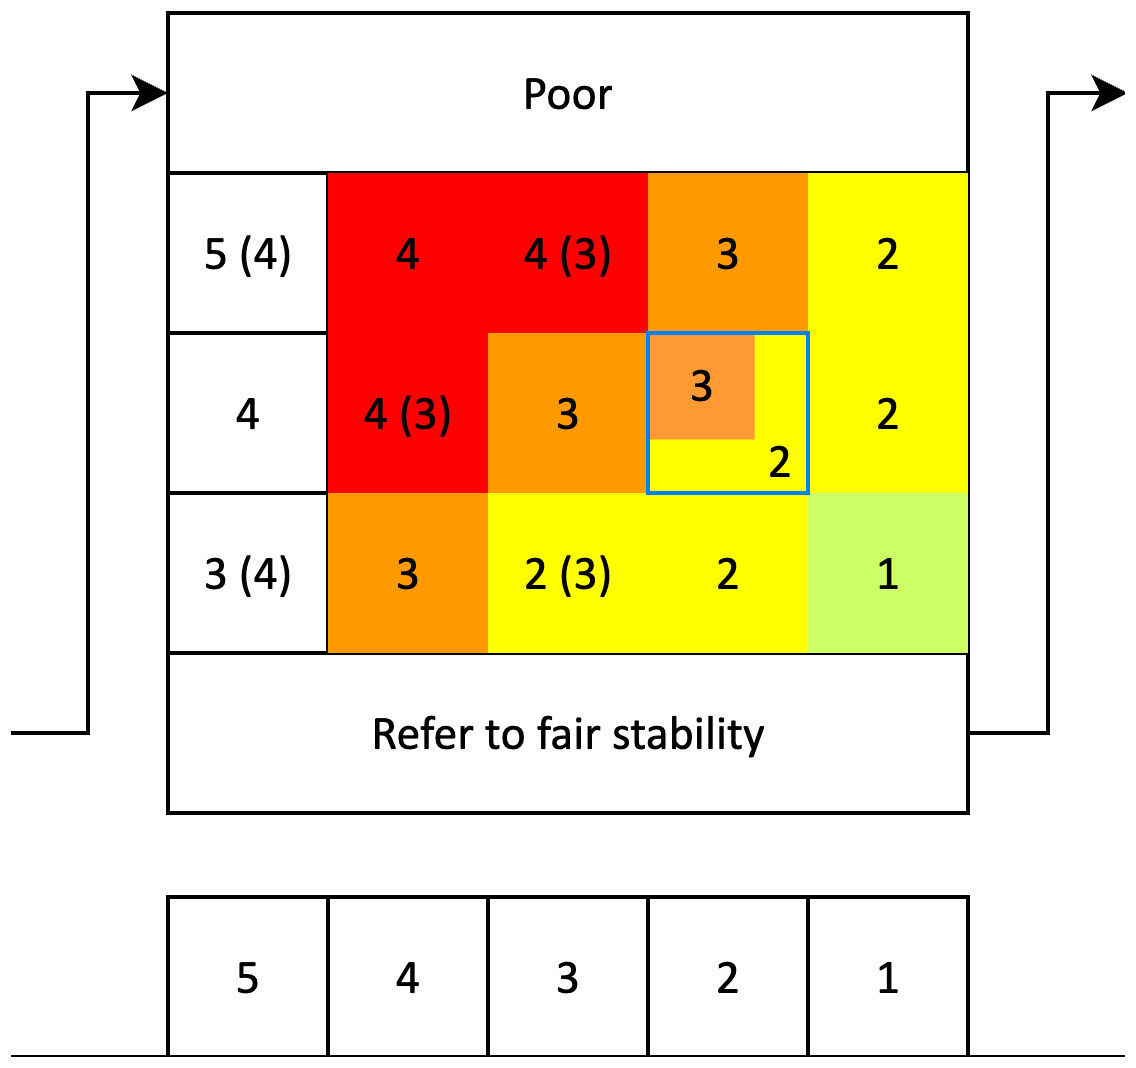
Figure 1EAWS-Matrix, as accepted by the EAWS General Assembly in 2022 (taken from Müller et al., 2025). The integer values shown in the Matrix cells refer to the danger levels. We refer to the first danger level shown in the Matrix as D1 or the Matrix-suggested danger level, and to the danger level shown in brackets as D2. For a detailed explanation refer to the text.
The revised EAWS-Matrix was developed through expert elicitation in a non-operational setting, using a survey-based approach, with the final version reached through expert consensus (Müller et al., 2025). Although a broad group of professional forecasters contributed to its development, the Matrix was not systematically evaluated under real-world operational conditions, where forecasts are issued under uncertainty and may have serious consequences if incorrect. Observing how the Matrix is used in operations can help demonstrate its value in supporting and harmonizing danger level assessments, while also revealing potential weaknesses in its structure. Ideally, such evaluation would consider both accuracy, whether the Matrix structure and input factors reflect real avalanche conditions, and consistency, in terms of how reliably it supports similar danger level assessments across services, which are key attributes of forecast goodness (Murphy, 1993). However, since both the input factors and the resulting danger level are based on expert judgment and are not directly observable or measurable, such an evaluation is inherently difficult. Moreover, analyzing Matrix use in an operational context may reflect compliance with its design rather than an independent judgment of avalanche conditions, potentially masking design flaws.
Given these limitations, we do not attempt to validate the Matrix in an absolute sense. Instead, we examine how it was used during daily operations to (i) identify differences in how avalanche danger is characterized using Matrix terminology across warning services; (ii) analyze how the Matrix was applied across the range of issued danger levels; and (iii) explore differences in situations with dry-snow conditions or when wet-snow or gliding snow avalanche problems were of concern. These analyses provide insight into the operational implementation of the Matrix and highlight potential areas for refinement.
The presented study is part of the iterative process described in the companion paper (Müller et al., 2025), which details the conceptual development of the revised Matrix and the accompanying workflow. Here, we focus on their operational implementation: how the Matrix was used in 26 warning services across multiple countries during the first three winters following its introduction, and how these real-world applications can inform ongoing improvements to the framework.
In the following, we briefly review the key principles of regional avalanche danger assessment in Europe. We refer the interested reader for details on the methodological background and conceptual derivation of the Matrix to Müller et al. (2025).
The revised conceptual framework for the determination of the danger levels introduced by EAWS includes updated definitions of the factors (snowpack stability, frequency of snowpack stability, and avalanche size) determining avalanche danger, a structured operational workflow, and the EAWS-Matrix (EAWS, 2025a). While conceptually aligned with the Conceptual Model of Avalanche Hazard (CMAH, Statham et al., 2018), the framework is tailored to the regional scale, where avalanche danger must be evaluated across entire warning regions encompassing diverse terrain types, slope aspects, and elevation bands, culminating in the determination and communication of a danger level.
The workflow begins by identifying all relevant avalanche problems (EAWS, 2025c). For each problem, forecasters assess both its presence (including affected slope aspects and elevation bands) and its contribution to the overall danger within a micro-region, the smallest spatial units used for danger level assessment. This includes estimating the probability of avalanche occurrence and avalanche size. The avalanche occurrence probability is further decomposed into two factors (EAWS, 2025a):
-
Snowpack stability describes the local propensity of the snowpack to avalanche (Reuter and Schweizer, 2018) and is categorized into four classes: very poor, poor, fair, and good (Table A1). These classes correspond to typical triggering mechanisms. For instance, avalanches releasing due to natural causes, such as loading from new snow or weakening from rain or melt water, are linked to very poor stability, while poor stability is commonly associated with human triggering.
-
Frequency of snowpack stability (classes) refers to the proportion of avalanche terrain within a region where a given stability class occurs. Frequency is categorized into four classes: many, some, a few, and none or nearly none (Table A2). The last class indicates that the stability class is either absent or so rare that it is not considered relevant for the avalanche danger level assessment.
In practice, estimating the full spatial distribution of snowpack stability across a region, where conditions vary by elevation, aspect, and slope, is not feasible (Techel et al., 2020). In fact, forecasters must synthesize limited information to estimate the prevalence of the lowest stability class(es), which forms the basis for judging the probability of avalanche occurrence. Combined with the largest avalanche size which can reasonably be expected given the conditions, categorized into five classes (Table A3), these factors inform the danger level. Thus, the three inputs (stability, frequency, and avalanche size) constitute the core of the EAWS-Matrix.
The EAWS-Matrix is a look-up table providing guidance for assigning the danger level based on these assessments (Fig. 1). It consists of three panels, one for each of the lowest relevant stability class (very poor, poor, and fair), with each showing combinations of frequency (y axis) and avalanche size (x axis). Each cell contains one or two danger levels: the primary value (D1), shown first and corresponding to the cell's color, represents the majority expert view and is referred to as the Matrix-suggested danger level. A secondary danger level (D2), shown in brackets, is included when at least 30 % of experts selected a different level (EAWS, 2025b; Müller et al., 2025).
To determine the danger level, forecasters begin with the lowest assessed stability class and evaluate whether its frequency is relevant (i.e., not none or nearly none). If not, they proceed to the next stability class, which is congruent with an increase in triggering level needed to release an avalanche, following the arrows between panels (Fig. 1), and so on. If stability is assessed as good throughout the region, the danger level is set to 1 (low) by default. Forecasters locate the Matrix cell that best represents the conditions for each avalanche problem. Avalanche size is assessed independently and reflects the largest avalanche that could reasonably be expected under the expected conditions.
The final communicated danger level for a warning region is the highest level assigned across all relevant avalanche problems. When different problems occur in a way that the combined frequency of potential triggering spots increases in the same aspects and elevations, their combined effect may result in a higher overall danger level than any single problem would suggest in isolation (Müller et al., 2025).
3.1 Data overview
In total, 26 avalanche warning services recorded their factor choices (snowpack stability, frequency of the lowest snowpack stability class, expected avalanche size) during operational forecasting, covering one or more winter seasons or extended parts thereof. Table 1 provides an overview, including the three-letter abbreviations used when referring to specific warning services.
Table 1Data overview. Warning services are ordered according to the groups they were assigned to for the analysis (see also Sect. 4.2).
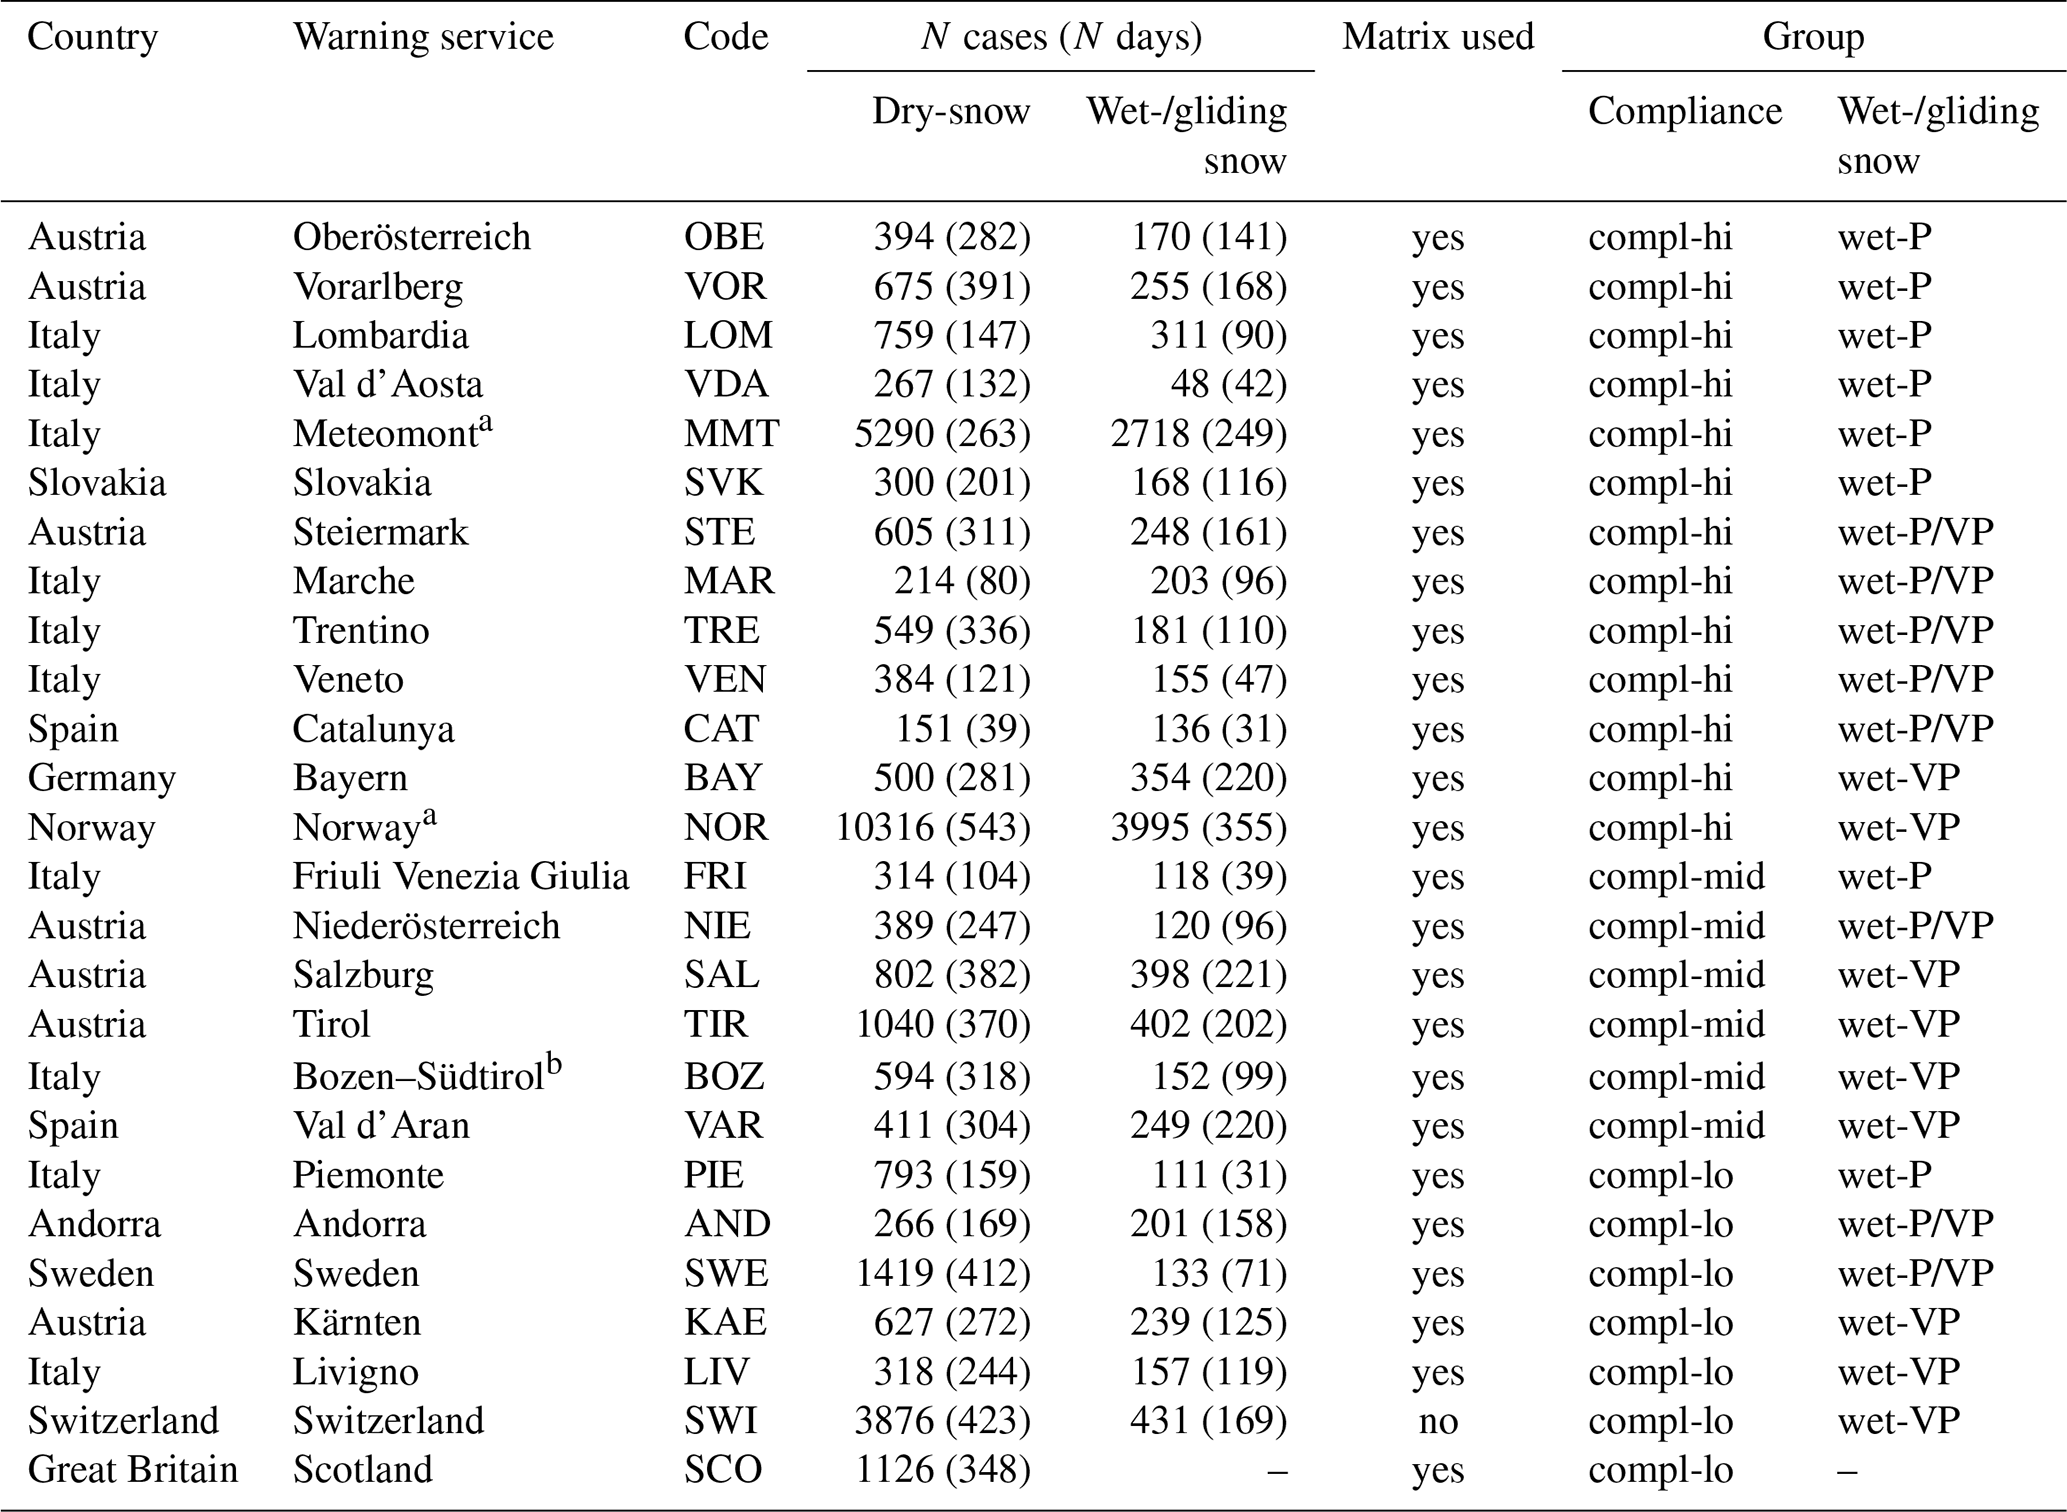
a not possible to filter unique cases as described in text. b Bozen–Südtirol/Bolzano–Alto Adige.
3.2 Varying forecasting practices and data harmonization
Forecasting practices varied both across and within services over the 3-year study period, requiring careful standardization to enable meaningful comparisons. These differences concerned not only the format of the data provided for this analysis, but also how the EAWS-Matrix and the factor assessments were applied in practice. While we do not have detailed knowledge of service-specific procedures, the following examples illustrate key variations, some of which may reflect differences in data availability for this study rather than differences in actual workflows, and how we addressed them.
3.2.1 Avalanche problem-specific assessments
Most services assessed each avalanche problem individually and assigned it a corresponding danger level. However, some issued a single overarching danger level despite assessing factors per problem (e.g., BAY in first year), grouped problems into broader categories (e.g., SWI separated dry-snow avalanche problems from wet- or gliding snow avalanche problems), or assessed the factors without assigning them to a specific problem (e.g., SCO). In certain services (e.g., SWE), no factor assessments were made when no avalanche problem was identified, a situation commonly observed for danger level 1 (low). Others documented such situations using the label no distinct avalanche problem (e.g., SVK, SWI).
3.2.2 Matrix integration in workflow
Most services had integrated the EAWS-Matrix into their operational workflows, either using it to directly link factor assessments to a suggested danger level or as a reference framework. A notable exception was Switzerland (SWI), where forecasters assessed factors and danger levels independently, with the latter determined during group discussions rather than derived from the Matrix (Winkler et al., 2024).
3.2.3 Assessment of Matrix input factors
The majority of services used the EAWS-defined ordinal classes for estimating the three Matrix input factors (EAWS, 2025a) (Table 2), though some used North American terminology (as defined in the CMAH; Statham et al., 2018) for assessing stability and frequency (e.g., SCO, SWE). These were subsequently mapped to EAWS-classes based on Müller et al. (2016). In Livigno (LIV), the Matrix was applied operationally, but the published forecasts followed North American terminology for describing the sensitivity to triggers. Additionally, some services implemented tools that allowed forecasters to express tendencies within a class. These included services using the ALBINA forecasting software platform (Mitterer et al., 2018), as used for instance in BOZ, TIR, and TRE, as well as the Swiss forecasting software (Winkler et al., 2024). In ALBINA, tendencies within classes can be expressed via sliders allowing near-continuous values between 0 and 100 for snowpack stability, frequency of the lowest snowpack stability class, and avalanche size (Fig. 2a). Class boundaries and underlying numerical values allow unambiguous conversion into the EAWS classes, for example, poor corresponds to values from 50 to 74, and very poor to values from 75 to 100. In Switzerland, forecasters make distinctions within classes using modifiers such as minus (−), neutral (=), or plus (+) (e.g., poor−, poor=, poor+), or selected intermediate labels straddling two adjacent classes (e.g., fair/poor) (Fig. 2b). In SWI, factor assessments are used for internal purposes only, in ALBINA factors are published. For the purpose of this study, modifier-based entries (e.g., poor+) were aggregated into their primary class (poor), and intermediate labels (e.g., fair/poor) were randomly assigned to either the lower (fair) or higher (poor) class.
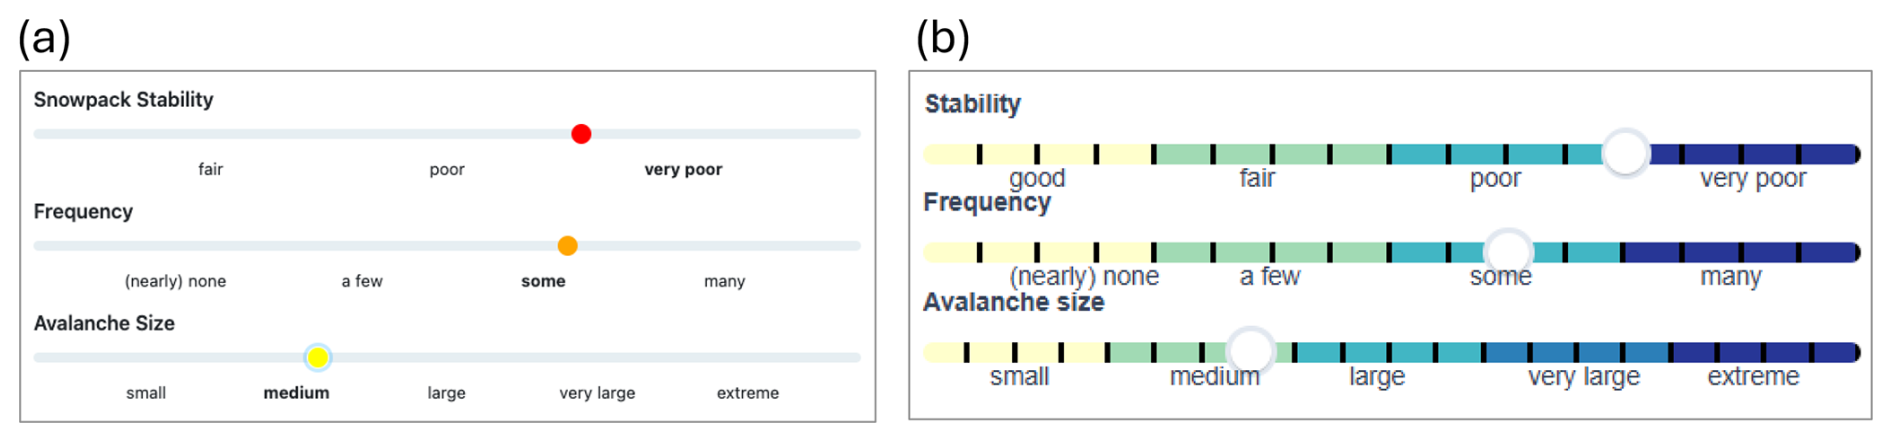
Figure 2Examples of the user interface for assessing snowpack stability, frequency of snowpack stability, and expected avalanche size in the operational forecasting software used by some European warning services. Sliders allow forecasters to indicate tendencies within each factor class. Panel (a) shows the implementation in ALBINA (e.g., BOZ, TIR, TRE) with near-continuous sliders; panel (b) shows the interface used in Switzerland (SWI) with underlying modifier-based selection.
3.2.4 Individual vs. group forecasting
In most warning services, a single forecaster was responsible for the forecast for either the entire domain or a specific part of the domain containing one or several micro-regions (e.g., in NOR or SCO), sometimes supported by a second forecaster for review (e.g. TIR). In contrast, SWI followed a fundamentally different approach: the forecasting process always involved at least two (but up to four) forecasters who independently prepared full forecast drafts for the entire forecast domain (referred to as suggestions). These suggestions were then consolidated in a group discussion prior to publication. For this study, we derived the median factor assessment from the individual suggestions and linked these to the issued danger level resulting from the group consensus.
To harmonize data across services, we applied the following procedure: for each day and micro-region, we selected the decisive avalanche problem, typically the first listed in the bulletin or the one associated with the highest danger level. If neither criterion was available, the first entry was retained. This step was performed separately for dry-snow avalanche problems and for wet-snow or gliding-snow avalanche problems. After selecting the decisive problem, we retained unique entries defined by the combination of date, issuing warning service and/or forecaster, avalanche problem, danger level, and the associated Matrix factors. If the same combination appeared in multiple micro-regions on the same day within the domain of a service, only one instance was retained. This approach was feasible for all services except NOR and MMT, where the data structure did not permit such filtering.
Table 2Forecast parameters and their possible values. For brief descriptions, see Tables A1–A3 in Appendix A, for full definitions, refer to Müller et al. (2025).
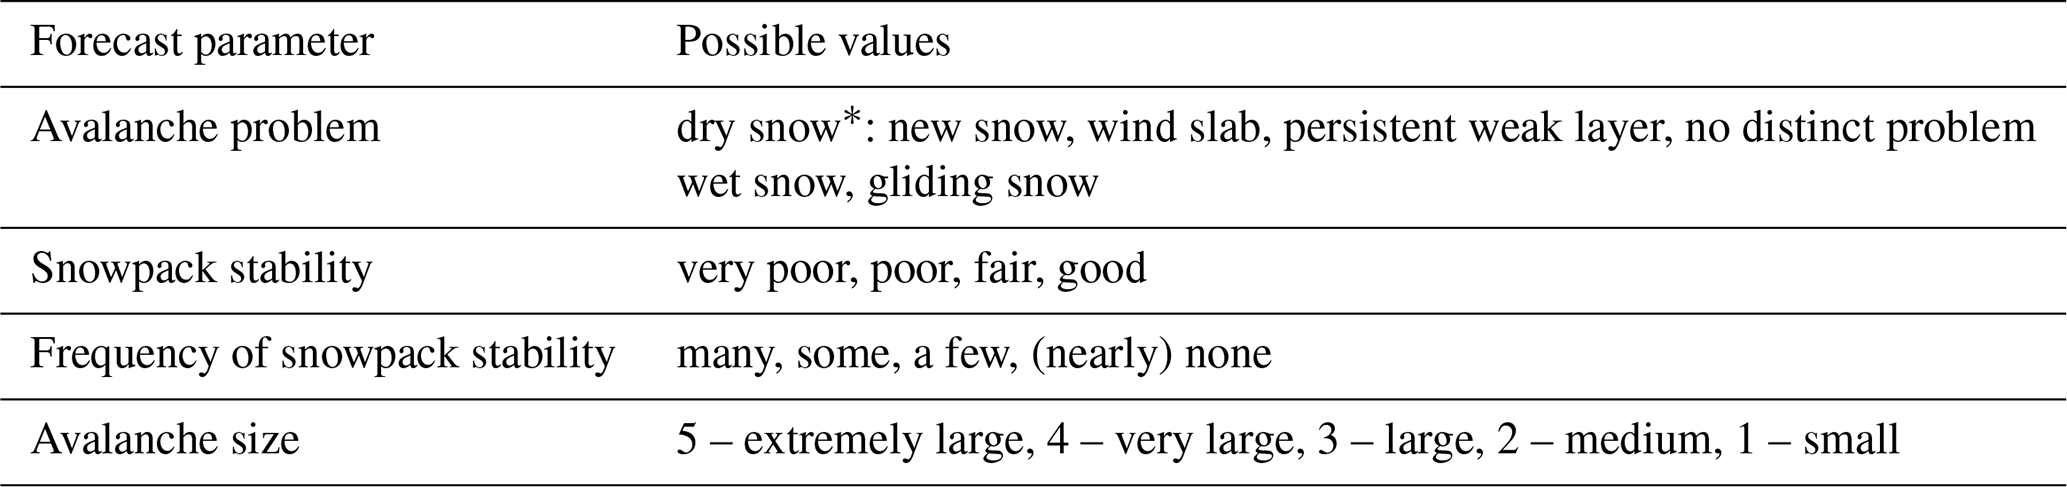
* These avalanche problems are analyzed together as problems relating to dry-snow conditions.
The analysis was conducted in three main steps. First, we examined Matrix usage in aggregate, without distinguishing between individual warning services or specific avalanche problems. This allowed us to evaluate whether forecasters assigned danger levels consistently to factor combinations and whether some combinations of factors resulted in a wider range of danger level assignments. In the second step, we grouped warning services by shared operational characteristics and analyzed differences in Matrix usage across two avalanche problem categories: (i) dry-snow avalanche problems, including new snow, wind slab, persistent weak layer, and no distinct avalanche problem; and (ii) wet-snow and gliding-snow avalanche problems (EAWS, 2025c). This stratification enabled us to investigate whether observed patterns were consistent across services and groups of avalanche problems, or whether they reflected local practices, compliance with the Matrix, or differing conceptual models. Finally, we took advantage of the finer-granularity assessments of input factors available in some warning services (BOZ, SWI, TIR, TRE) and explored whether tendencies within classes helped explain variations in danger level assignments within specific Matrix cells.
4.1 Matrix compliance
We analyzed each individual forecast to assess compliance with the Matrix, i.e., how often the issued danger level matched the Matrix-suggested level (D1). To do so, we used the indicated snowpack stability, frequency of snowpack stability, and avalanche size as inputs to the Matrix to derive the Matrix-suggested danger level (D1) resulting from a strict application of the Matrix. We then compared D1 with the danger level issued in the forecast (Dfx), calculating the proportion of disagreements (Dfx ≠ D1), Pdisagree, for each warning service and avalanche problem category (Table 2). We use Pdisagree as measure of Matrix compliance.
4.2 Grouping of warning services
Warning services were grouped to simplify analysis and presentation while retaining sufficient detail to examine key differences in how the Matrix was applied. Grouping also increased the size of the resulting data subsets relative to analyses at the level of individual services, thereby enabling more statistically robust findings. To preserve meaningful distinctions between services, we applied two grouping strategies:
First, for dry-snow avalanche problems, we grouped services based on their degree of Matrix compliance (Sect. 4.1). We defined three groups using the 50th and 75th percentiles of the disagreement rate (Pdisagree) as thresholds (see Sect. 5.2.1, see the compliance column in Table 1). For the purpose of analysis, we focused on the two groups with the highest and lowest compliance rates:
-
(compl-hi) Operational use with greater Matrix compliance (Pdisagree < 0.04), and
-
(compl-lo) Operational use with lower Matrix compliance (Pdisagree ≥ 0.07). We included SWI in this group, the only service not using the Matrix in an operational context, as Pdisagree for SWI was similar to some other services using the Matrix but with low compliance.
Second, for wet-snow and gliding-snow avalanche problems, we grouped services based on their use of the very poor stability class, which varied considerably between warning services (see Section 5.2.2). We split services using the 33rd and 67th percentiles of the proportion of very poor classifications (see the wet-snow/gliding-snow column in Table 1), and focused on the groups with the lowest and highest usage of very poor stability:
-
(wet-P) Proportion of very poor stability Pstab: very poor < 0.25, and
-
(wet-VP) Proportion of very poor stability Pstab: very poor ≥ 0.56.
Warning services representing intermediate levels of Matrix compliance (compl-mid) and intermediate use of the very poor stability class (wet-P/VP) were excluded from the main analysis to maintain focus on key contrasts. However, we present their results in the Appendix Figs. C1 and C2 for completeness.
Since the Scottish data (SCO) did not include avalanche problems linked to specific forecasts, we assumed that most cases represented dry-snow avalanche problems. This assumption is supported by information from the Scottish Avalanche Information Service indicating that dry-snow avalanche problems predominate (Mark Diggins, personal communication, 2025).1
4.3 Matrix cell usage
For each warning service and for each danger level separately, we calculated the proportion of forecast cases assigned to each Matrix cell. Danger levels that occurred in three or fewer cases during the study period were excluded from the analysis for the corresponding service. We then averaged these cell-specific proportions across all warning services and normalized the resulting distributions so that proportions summed to one.
In addition to this overall analysis, we repeated the same procedure stratified by group of avalanche problems (dry snow vs. wet and gliding snow; Table 2). For these strata, we further derived normalized mean cell-usage distributions for groups of warning services with shared characteristics in Matrix compliance for dry-snow problems and use of very poor stability for wet-snow or gliding snow problems (Sect. 4.2).
4.4 Detecting patterns within Matrix cells
To better understand how individual factor combinations relate to the issued danger levels, and whether tendencies within a factor class toward higher or lower classes correspond to more frequent use of alternative danger levels, we exploited the finer-grained assessments of the three Matrix factors available from SWI and the warning services in BOZ, TIR, TRE using the ALBINA software from the 2024–2025 forecast season. Focusing on the most frequently used factor combination poor-some-size 2 for dry-snow avalanche problems (Fig. D1), we identified combinations of sub-classes, which most often predicted one of the two danger levels as shown in the Matrix. Beside presenting the respective data, we derived decision boundaries applying Classification and Regression Trees (CART, Breiman et al., 2017), as they are well suited for detecting decision patterns in multi-factor ordinal data. A detailed description of this approach can be found in Appendix B.
5.1 Overall characterization of danger levels with the Matrix
Our analysis of the overall Matrix use without distinguishing between degrees of Matrix compliance or considering avalanche problems, shows how different combinations of stability, frequency, and avalanche size were assigned to issued danger levels (Fig. 3). Each cell represents a specific Matrix factor combination, with color intensity indicating the percentage of cases with which that combination was used for a particular danger level.
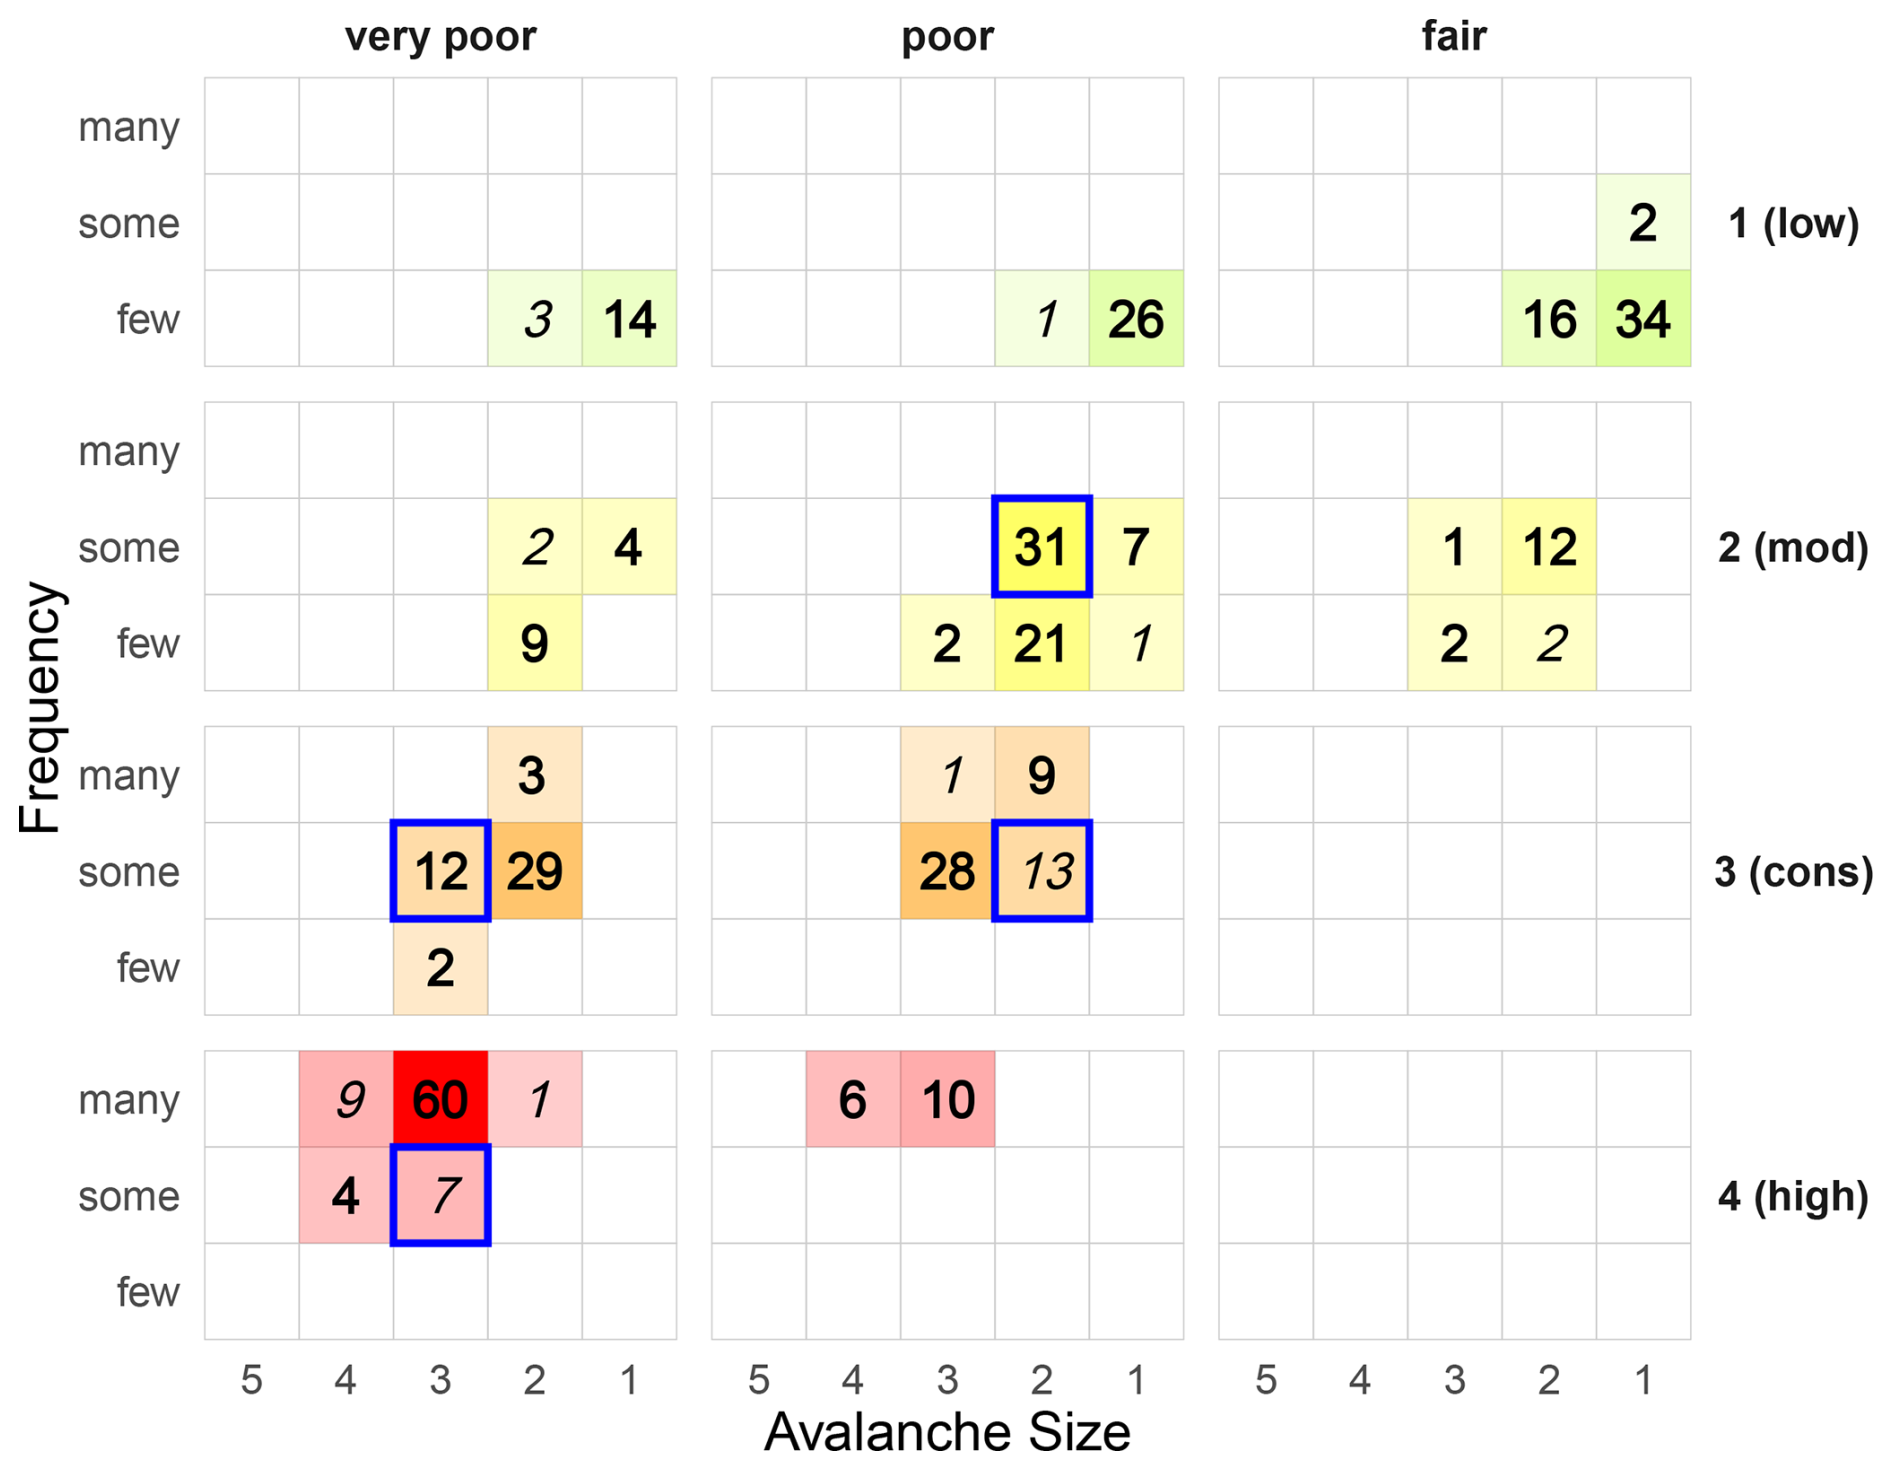
Figure 3Matrix use by danger level: percentage of cases that a specific danger level (rows from top: D = 1 (low) to D = 4 (high)) was used for a specific matrix combination. Colour intensity corresponds to the percentage. Cells with less than 1 % usage are not shown. Values highlighted bold correspond to use of Matrix-suggested danger levels (D1, see Fig. 1), values in italics represent the optional level (D2).
At danger level 1 (low), only 17 % of cases were described using very poor stability suggesting that natural avalanches or very easy triggering conditions (Table A1) were seldom considered. The combined percentages of cases classified as very poor or poor was 44 %. According to the intended logic of the Matrix, fair stability should only have been selected if both very poor and poor stability were assessed as none or nearly none in the region. Thus, the use of fair stability in more than half of the cases (56 %) implies that often neither natural avalanche activity nor human-triggered avalanches were considered as typical triggers. Frequency class few is used in 98 % of the cases, underlining that danger level 1 is associated with few triggering spots. Avalanche size was typically classified as size 1, with a smaller share (20 %) of size 2. It is important to note that not all warning services assessed Matrix factors when no avalanche problem was identified. Consequently, the percentages shown in Fig. 3 do not equally reflect all services. For instance, for SWE, 39 % of the danger level 1 forecasts lacked factor estimates.
At level 2 (moderate), usage was concentrated in the poor stability panel (62 %), which is typically associated with human-triggered avalanches (Table A1). In 16 % of forecasts, stability was described as very poor, most often in connection with avalanche size 2. The frequency of locations with very poor or poor stability was most commonly assessed as a few or some, never many. 17 % of cases would have been classified as none or nearly none for these two stability classes, corresponding to situations where stability was assessed as fair. Avalanche size was predominantly size 2, accounting for 87 % of cases.
At level 3 (considerable), stability was equally often described as very poor and poor, with frequency most commonly assessed as some (82 %). Avalanche size was typically size 2 or size 3. Notably, size 3 was more frequently associated with poor stability, while size 2 was used more often in combination with very poor stability.
At level 4 (high), there was a strong concentration in the cell very poor-many-size 3, which was used in 60 % of cases. Nonetheless, in 16 % of the cases, forecasters chose poor stability in combination with many locations and avalanche size 3 or 4. These situations are often referred to as “skier-level 4”, situations where human triggering is the dominant triggering mechanism with few or no natural avalanches expected to occur (e.g., SLF, 2024).
Danger level 5 (very high) was issued only once during the study period and is therefore not shown in Fig. 3; in this case, it was described as very poor-many-size 4.
Across all danger levels, most Matrix cells were predominantly used for a single danger level, with two important exceptions highlighted in Fig. 3. The cell poor-some-size 2 was the most frequently used combination for level 2 (moderate) (31 %), but also accounted for 13 % of level 3 (considerable) assessments. Similarly, the cell very poor-some-size 3 was used in 12 % of level 3 cases and 7 % of level 4 cases.
5.2 Avalanche-problem specific characterization of danger levels with the Matrix
We analyzed Matrix usage separately for dry-snow and for wet- or gliding snow avalanche problems. The corresponding data contributions from each warning service are summarized in Table 1.
5.2.1 Avalanche problems relating to dry-snow conditions
Comparing the issued danger level with the Matrix-suggested danger level showed that nearly all warning services occasionally deviated from the Matrix (median Pdisagree = 4 %; Fig. 4a). The highest disagreement rates were observed in Andorra (AND), Scotland (SCO), and Switzerland (SWI), where deviations occurred in 36 %–39 % of cases. Piemonte (PIE), Livigno (LIV), and Sweden (SWE) also showed comparably frequent deviations (10 %–21 %), while in half of the warning services, deviations were relatively rare (Pdisagree < 4 %).
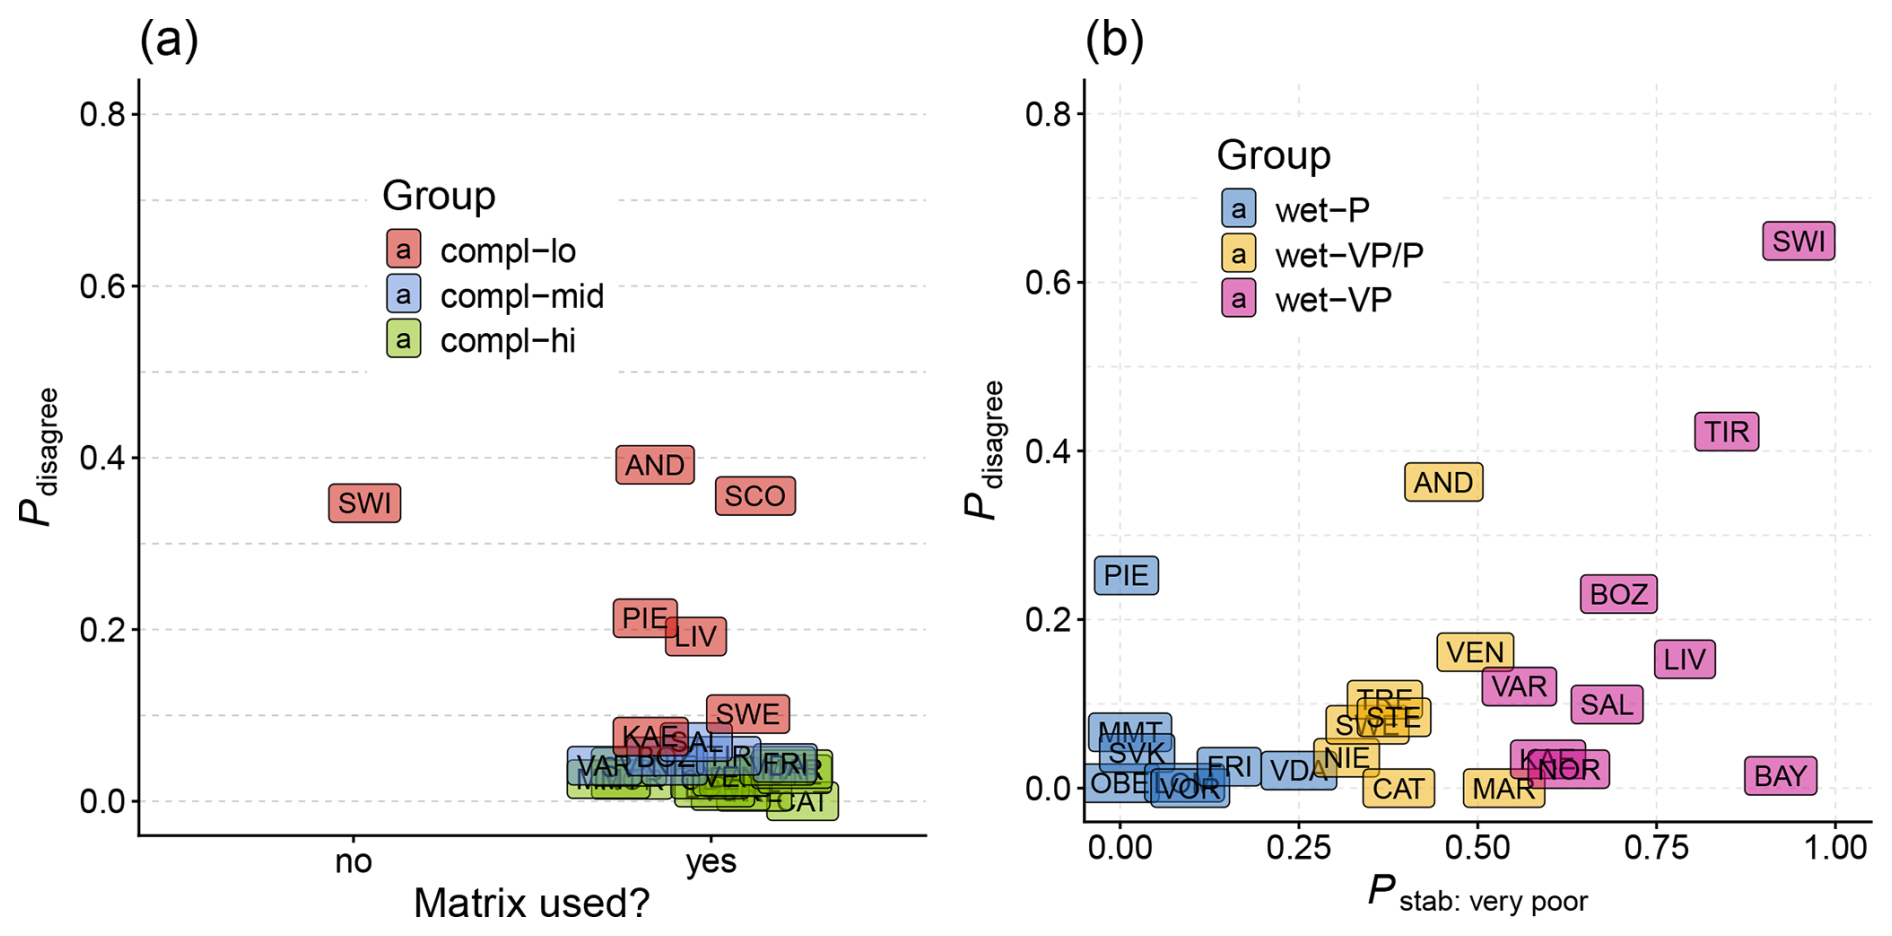
Figure 4Proportion of disagreement between Matrix-suggested and issued danger level (Pdisagree) for (a) dry-snow avalanche problems and (b) for wet- and gliding snow avalanche problems. In panel (a), use of the Matrix is shown on the x axis, in panel (b) the proportion of very poor stability assessments (Pstab: very poor) is shown. Each point represents one warning service, colored by group as defined in Sect. 4.2.
Figure 5 illustrates how the issued danger levels for dry-snow avalanche problems were assigned to combinations of stability, frequency, and avalanche size. Results are shown for the groups introduced in Fig. 4a and Sect. 4.2. As expected, warning services with high compliance with the Matrix (group compl-hi) generally assigned the Matrix-suggested danger level. In these services, alternations between the two danger levels shown in the Matrix were rare: the secondary danger level was only used in three factor combinations (fair-a few-size 1, poor-some-size 2, and very poor-some-size 3) in more than 1 % of cases. In contrast, forecasters in services with low Matrix compliance (group compl-lo, Pdisagree ≥ 7 %) and presumably greater heterogeneity in how the Matrix is integrated into the forecasting process, showed a much broader distribution of danger levels across Matrix cells and, consequently, greater overlap in the use of the same factor combinations for different danger levels.
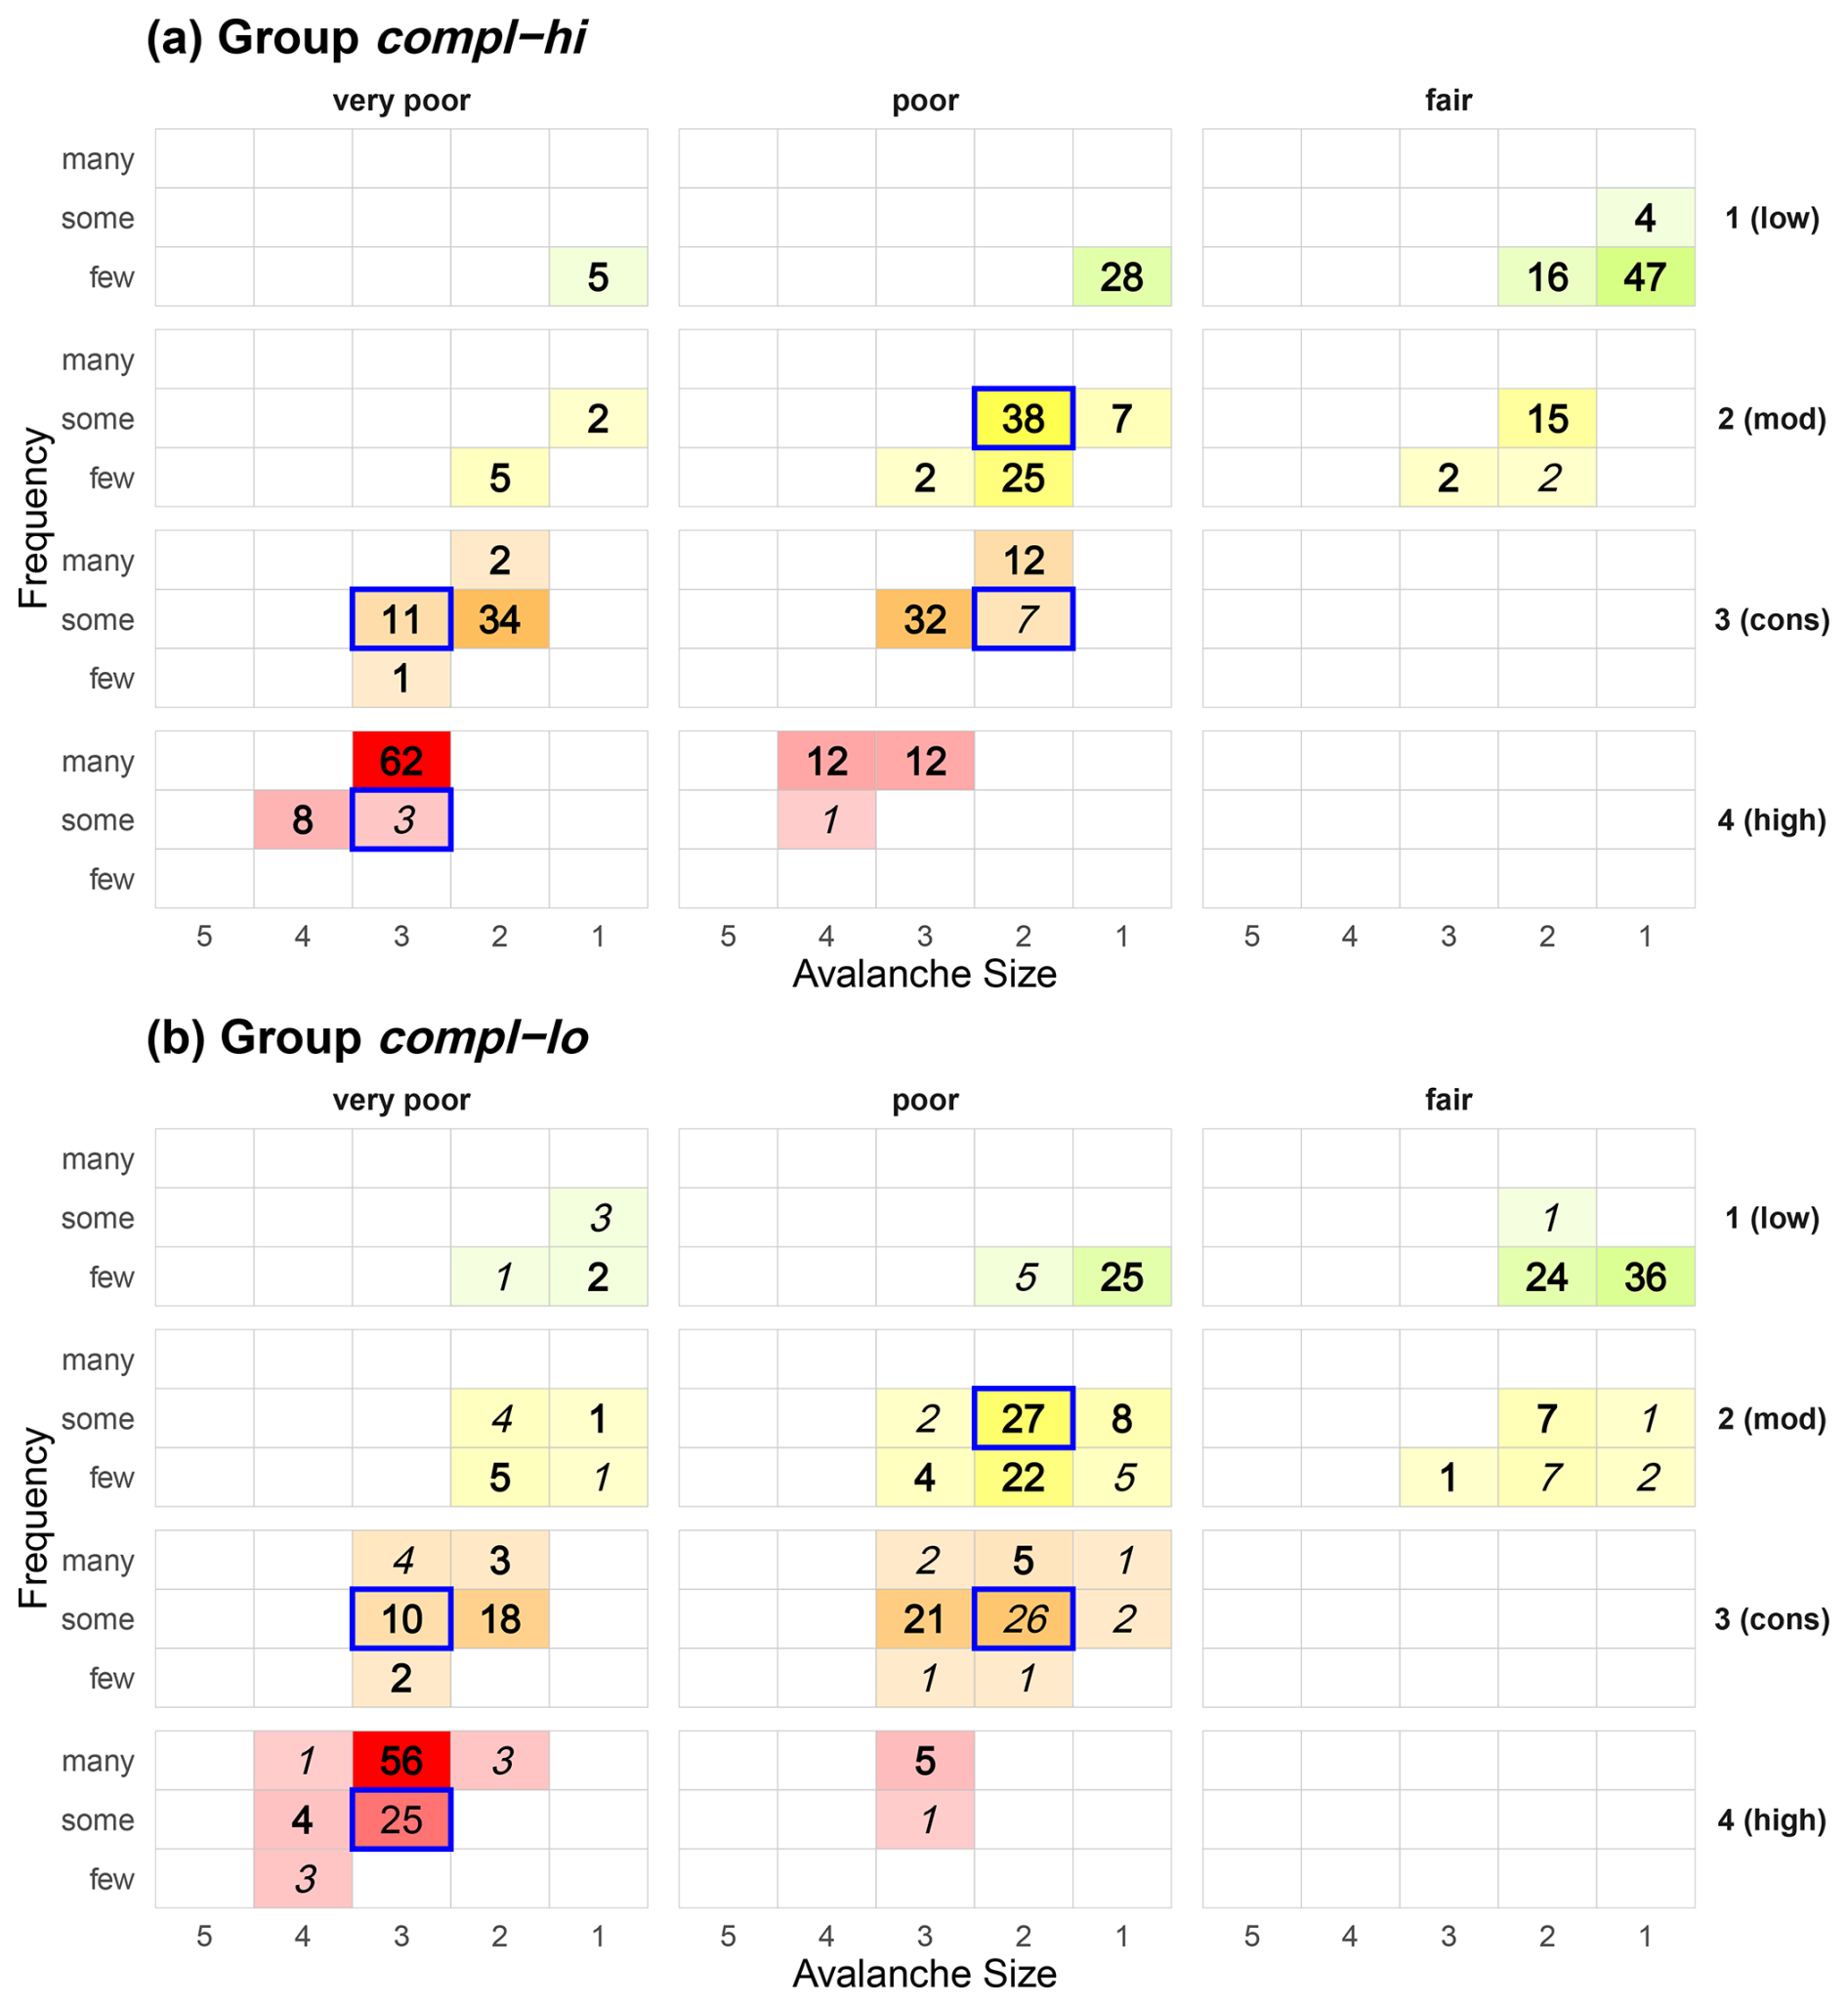
Figure 5Matrix use for avalanche problems relating to dry-snow conditions: proportion of cases that a specific danger level (rows from top: D = 1 (low) to D = 4 (high)) was used for a specific matrix combination. Colour intensity corresponds to the proportion of cases. Cells with less than 1 % usage are not shown. Values highlighted bold correspond to use of Matrix-suggested danger levels, values in italics represent the second level. Group compl-hi forecasters rarely deviated from the Matrix-suggested danger level (high compliance), group compl-lo forecasters deviated ≥ 7 % of the time. The respective figure for warning services lying in between is shown in Fig. C1 in Appendix C. Absolute use of Matrix cells, regardless of danger level, is shown in Fig. D1 in Appendix D.
Two factor combinations, highlighted in Figure 5, stood out for both groups: poor-some-size 2 and very poor-some-size 3. These combinations were among those where deviations from the Matrix-suggested danger level were more frequent, even among forecasters with high Matrix compliance. According to the Matrix (Fig. 1), the suggested danger level for poor-some-size 2 is 2 (moderate), with 3 (considerable) as the second option. Warning services with low Matrix compliance used this factor combination equally often to describe danger levels 3 (considerable) (26 % of level 3 cases) as 2 (moderate) (27 %) (Fig. 5b). In contrast, warning services with high Matrix compliance rarely used the poor-some-size 2 cell when choosing 3 (considerable). Instead, they typically selected neighbouring Matrix cells that differed in one factor, either very poor stability rather than poor, many rather than some, or size 3 rather than size 2, when choosing 3 (considerable). Nonetheless, even in this high compliance group, 7 % of all 3 (considerable) assessments fell into the poor-some-size 2 combination. A second notable difference involved the factor combination very poor-some-size 3, where the Matrix suggests 3 (considerable) and 4 (high) as the secondary level. Services with low Matrix compliance used this combination for 4 (high) in 25 % of cases, while it was less frequently used for 3 (considerable) (10 %). In contrast, warning services with high Matrix compliance used this combination in 11 % of cases for 3 (considerable), and only 3 % of cases for 4 (high). These two factor combinations appear to represent key transition zones between these danger levels, where danger level assignment differs depending on the degree of Matrix compliance.
Despite these differences, both groups shared several patterns. For 1 (low), the most frequently used combinations were fair-a few-size 1 or poor-a few-size 1, for 2 (moderate), the typical combinations were poor-some-size 2 and poor-a few-size 2. And when issuing 4 (high), both groups predominantly used the factor combination very poor-many-size 3.
Although the Matrix required forecasters to classify conditions into a small number of discrete categories, the underlying processes are inherently continuous. In BOZ, TIR, and TRE (using the ALBINA software), as well as in SWI, forecasters were able to assess the Matrix factors with finer granularity (Fig. 2). This allowed a closer examination of how subtle differences in factor assessments translated into differences in the issued danger level. We focused on the combination poor-some-size 2, the most frequently used Matrix cell (Fig. D1), which also showed considerable variation in the issued danger level (Fig. 5), either 2 (moderate), as suggested by the Matrix, or 3 (considerable).
For the three warning services BOZ, TIR, TRE (using ALBINA) and for SWI separately, Fig. 6 shows how the issued danger levels varied within this cell. Panels (a) and (b) display the distribution of danger levels as a function of snowpack stability and frequency, while avalanche size was fixed to size 2. Panels (c) and (d) focus on cases where stability was classified as poor, showing how danger levels varied as a function of frequency and size, corresponding directly to the Matrix cell shown in Fig. 1.
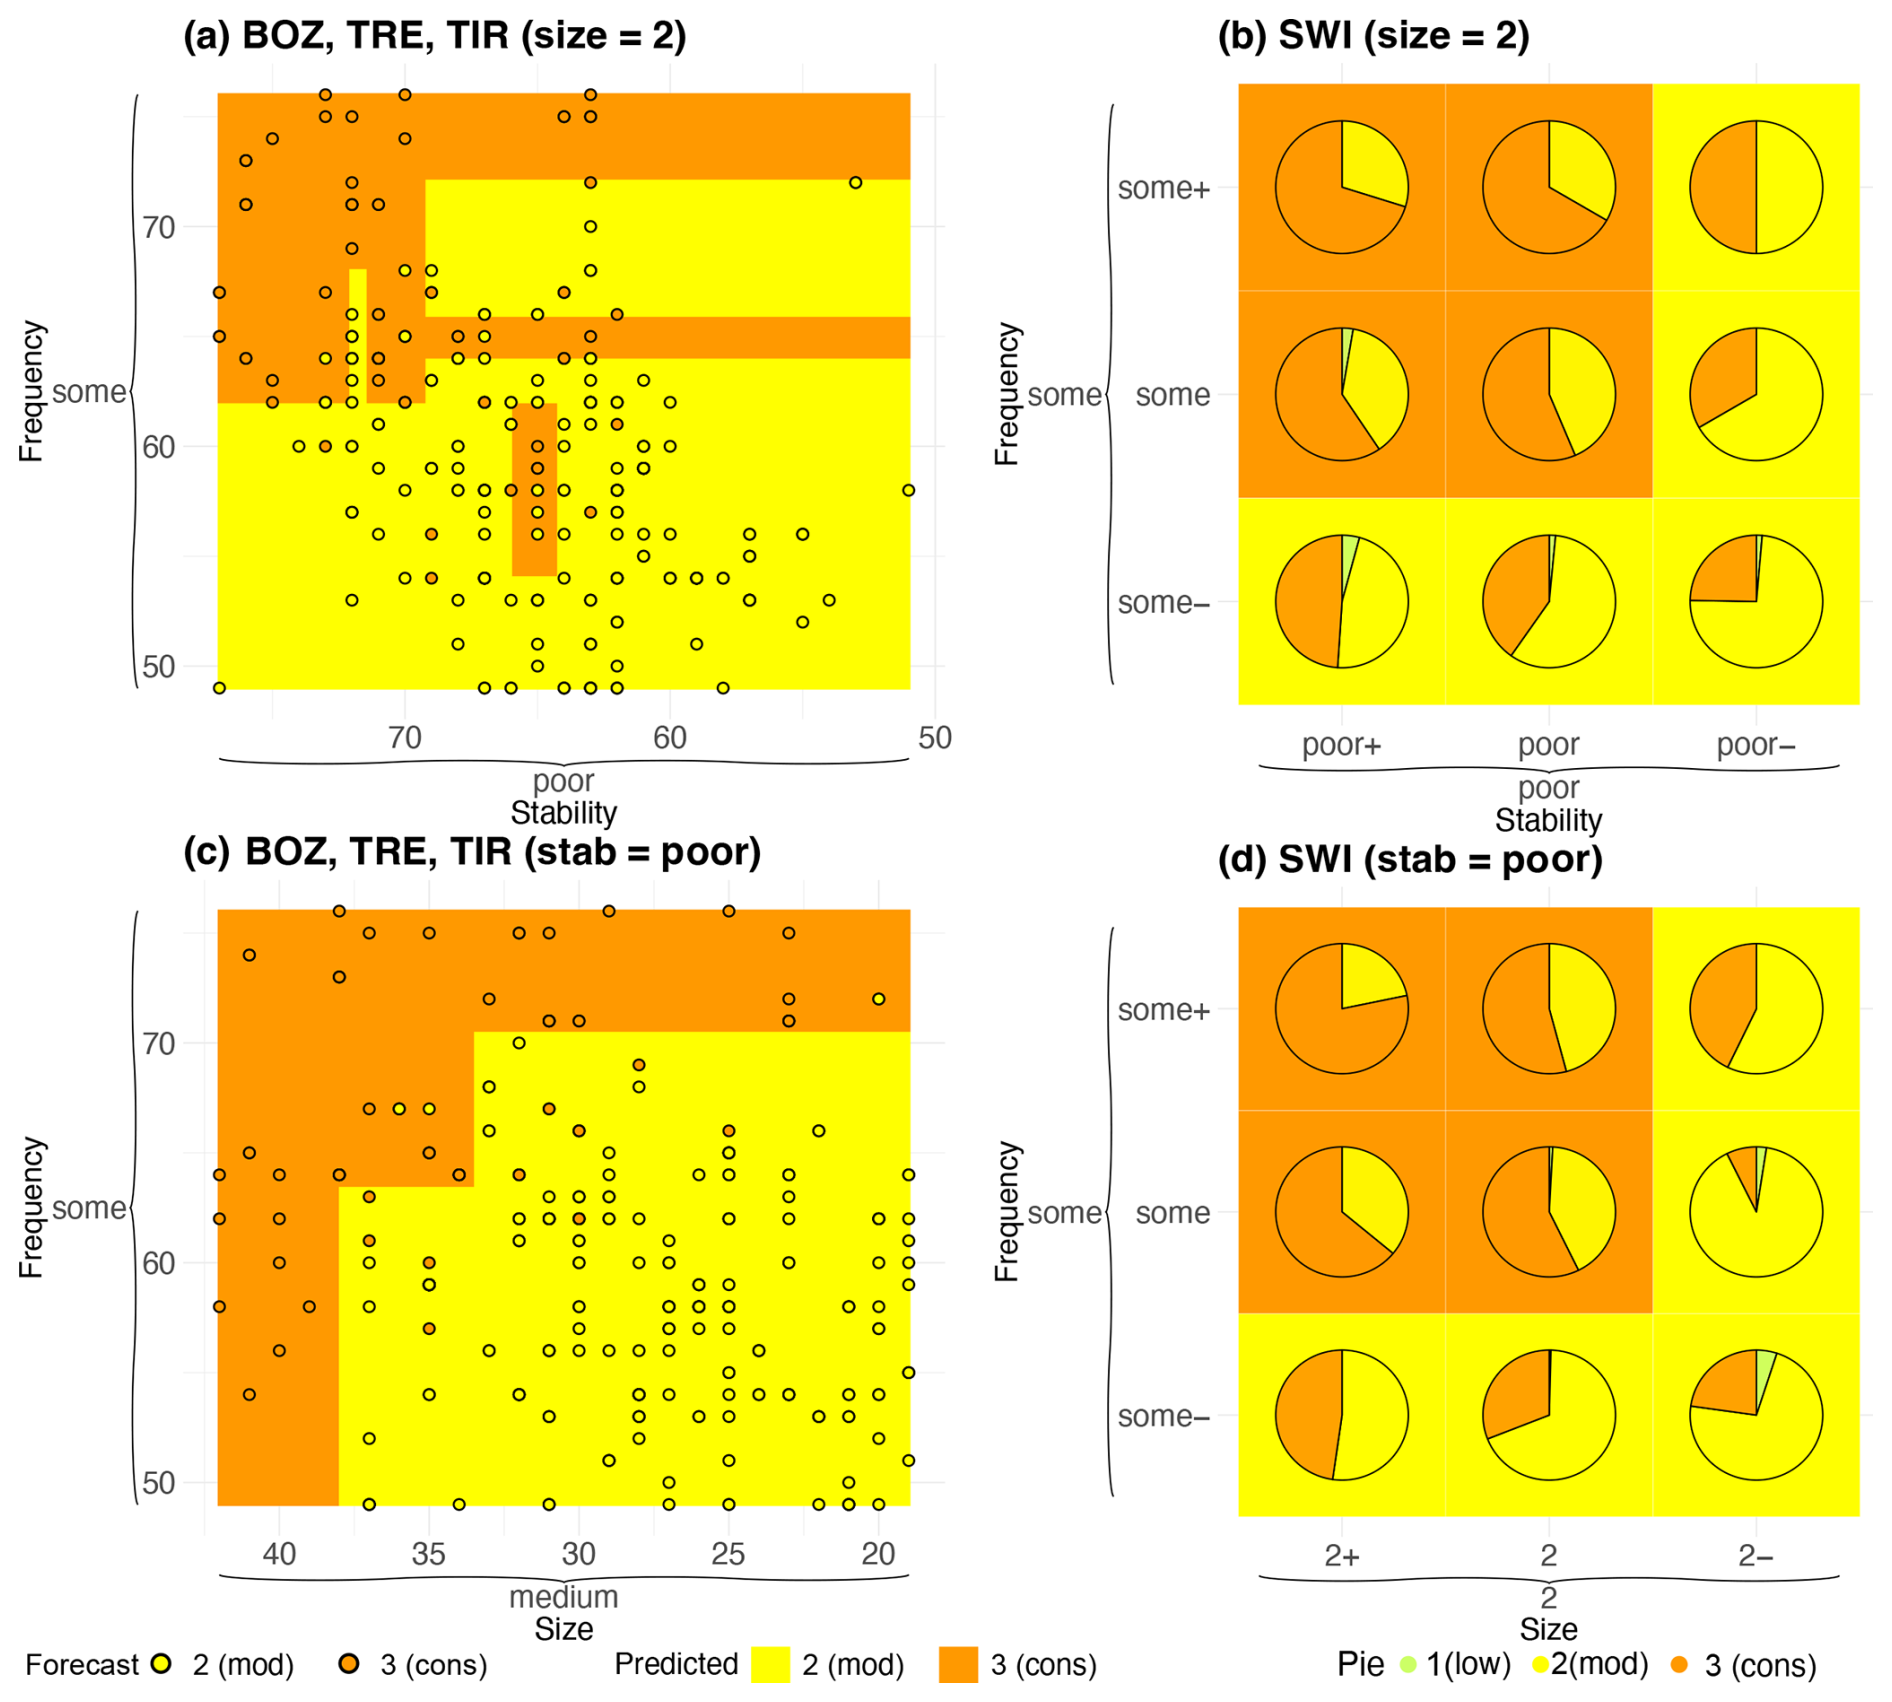
Figure 6Distribution of issued danger levels as a function of factor combinations for different warning services, illustrating tendencies within coarse Matrix categories for the Matrix cell poor-some-size 2. Panels (a) and (b) show stability and frequency (with avalanche size fixed to 2), while panels (c) and (d) show frequency and size (with stability fixed to poor). The left column (a, c) presents data from BOZ, TIR, and TRE, which use the ALBINA forecasting software (see also Fig. 2); the right column (b, d) shows data from SWI. Issued danger levels are indicated by circles (a, c) or pie segments (b, d). Background colors reflect the predicted danger level based on the CART model.
In SWI, the issued danger levels were either 2 (moderate) (42 %) or 3 (considerable) (57 %); 1 % (12) of the 964 cases were assigned to level 1 (low). In contrast, the ALBINA services issued level 2 in 75 % and level 3 in 25 % of 282 cases. Despite this difference in the relative preference for level 2 versus level 3, similar tendencies emerged across groups. Slider positions leaning toward very poor stability and many locations were more often associated with level 3 (considerable) (Fig. 6a, b), whereas shifts toward fair stability and a few locations tended to result in level 2 (moderate). The services BOZ, TIR, TRE showed a pronounced diagonal pattern in slider use, highlighting the interplay between stability and frequency (Fig. 6a). In SWI, the proportion of level 2 (moderate) assignments decreased systematically with decreasing stability and increasing frequency (Fig. 6b). A similar trend was observed for the combination of frequency and size (Fig. 6c, d): danger level 3 (considerable) was more often given when both factors tended towards higher categories. The CART predictions shown in the figure backgrounds closely mirrored these tendencies. While the prediction surfaces were generally well defined, some scatter was present (notably in Fig. 6a).
5.2.2 Wet-snow and gliding snow avalanche problems
Figure 4b illustrates the use of very poor stability to describe wet-snow or gliding snow avalanche problems and the proportion of disagreements between the issued danger level and the Matrix-suggested danger level. While forecasters in several services (notably SWI, TIR, and BAY) predominantly assessed wet-snow and gliding snow avalanche problems using very poor stability, a few services never used this stability class. This was striking, given that wet-snow and gliding snow avalanches are typically associated with natural avalanche release (Schweizer et al., 2020), and are thus conceptually linked to very poor stability (Table A1, see also Tables A2 and A3 in Müller et al., 2025). This divergence in the use of the stability classes was also reflected in the degree of disagreement with the Matrix-suggested danger level. Services that used very poor stability more frequently also tended to show greater disagreement, and vice versa (Spearman ρ = 0.38, p < 0.1). Notable exceptions included BAY, where stability was described as very poor in most situations (92 %) while high agreement with the Matrix was maintained (99 %), and Piemonte (PIE), where Pdisagree was high (25 %) even though stability was essentially never assessed as very poor (1 %). In the case of BAY, forecasters typically assigned smaller avalanche sizes to the same danger levels compared to, for instance, SWI and TIR, who showed much lower agreement with the Matrix-suggested danger levels. For example, at 1 (low), 93 % of BAY cases were size 1, compared to 37 % in SWI and 13 % in TIR. Overall, for wet-snow and gliding snow problems, the median disagreement rate Pdisagree was 7 %, slightly higher than the 4 % observed for dry-snow avalanche problems.
These differences in stability assessments and levels of compliance with the Matrix-suggested danger level carried over into the final danger level assignments, leading to a broad range of factor combinations and considerable variation in how the same danger level was described. Splitting the warning services into three groups (Sect. 4.2, Fig. 4b) based on their use of very poor stability, and focusing on the two groups that either used this class infrequently (group wet-P, Pstab: very poor < 0.25) or often (group wet-VP, Pstab: very poor ≥ 0.56), revealed substantial differences in Matrix cell usage (Fig. 7). Group wet-P forecasters most often used poor and fair stability across danger levels 1 (low) to 3 (considerable). Even for 3 (considerable), 62 % of cases involved poor stability. In contrast, group wet-VP forecasters predominantly used the very poor stability panel, even when describing 1 (low) (66 % of cases). Furthermore, group wet-P forecasters did not use danger level 4 (high) at all when assessing wet- or gliding snow problems. As a result, similarities between these groups related primarily to avalanche size, which increased with rising danger level in both groups, from size 1 at 1 (low), to size 2 at 2 (moderate), and size 3 at 3 (considerable) in group wet-P and size 2 to size 3 in group wet-VP.
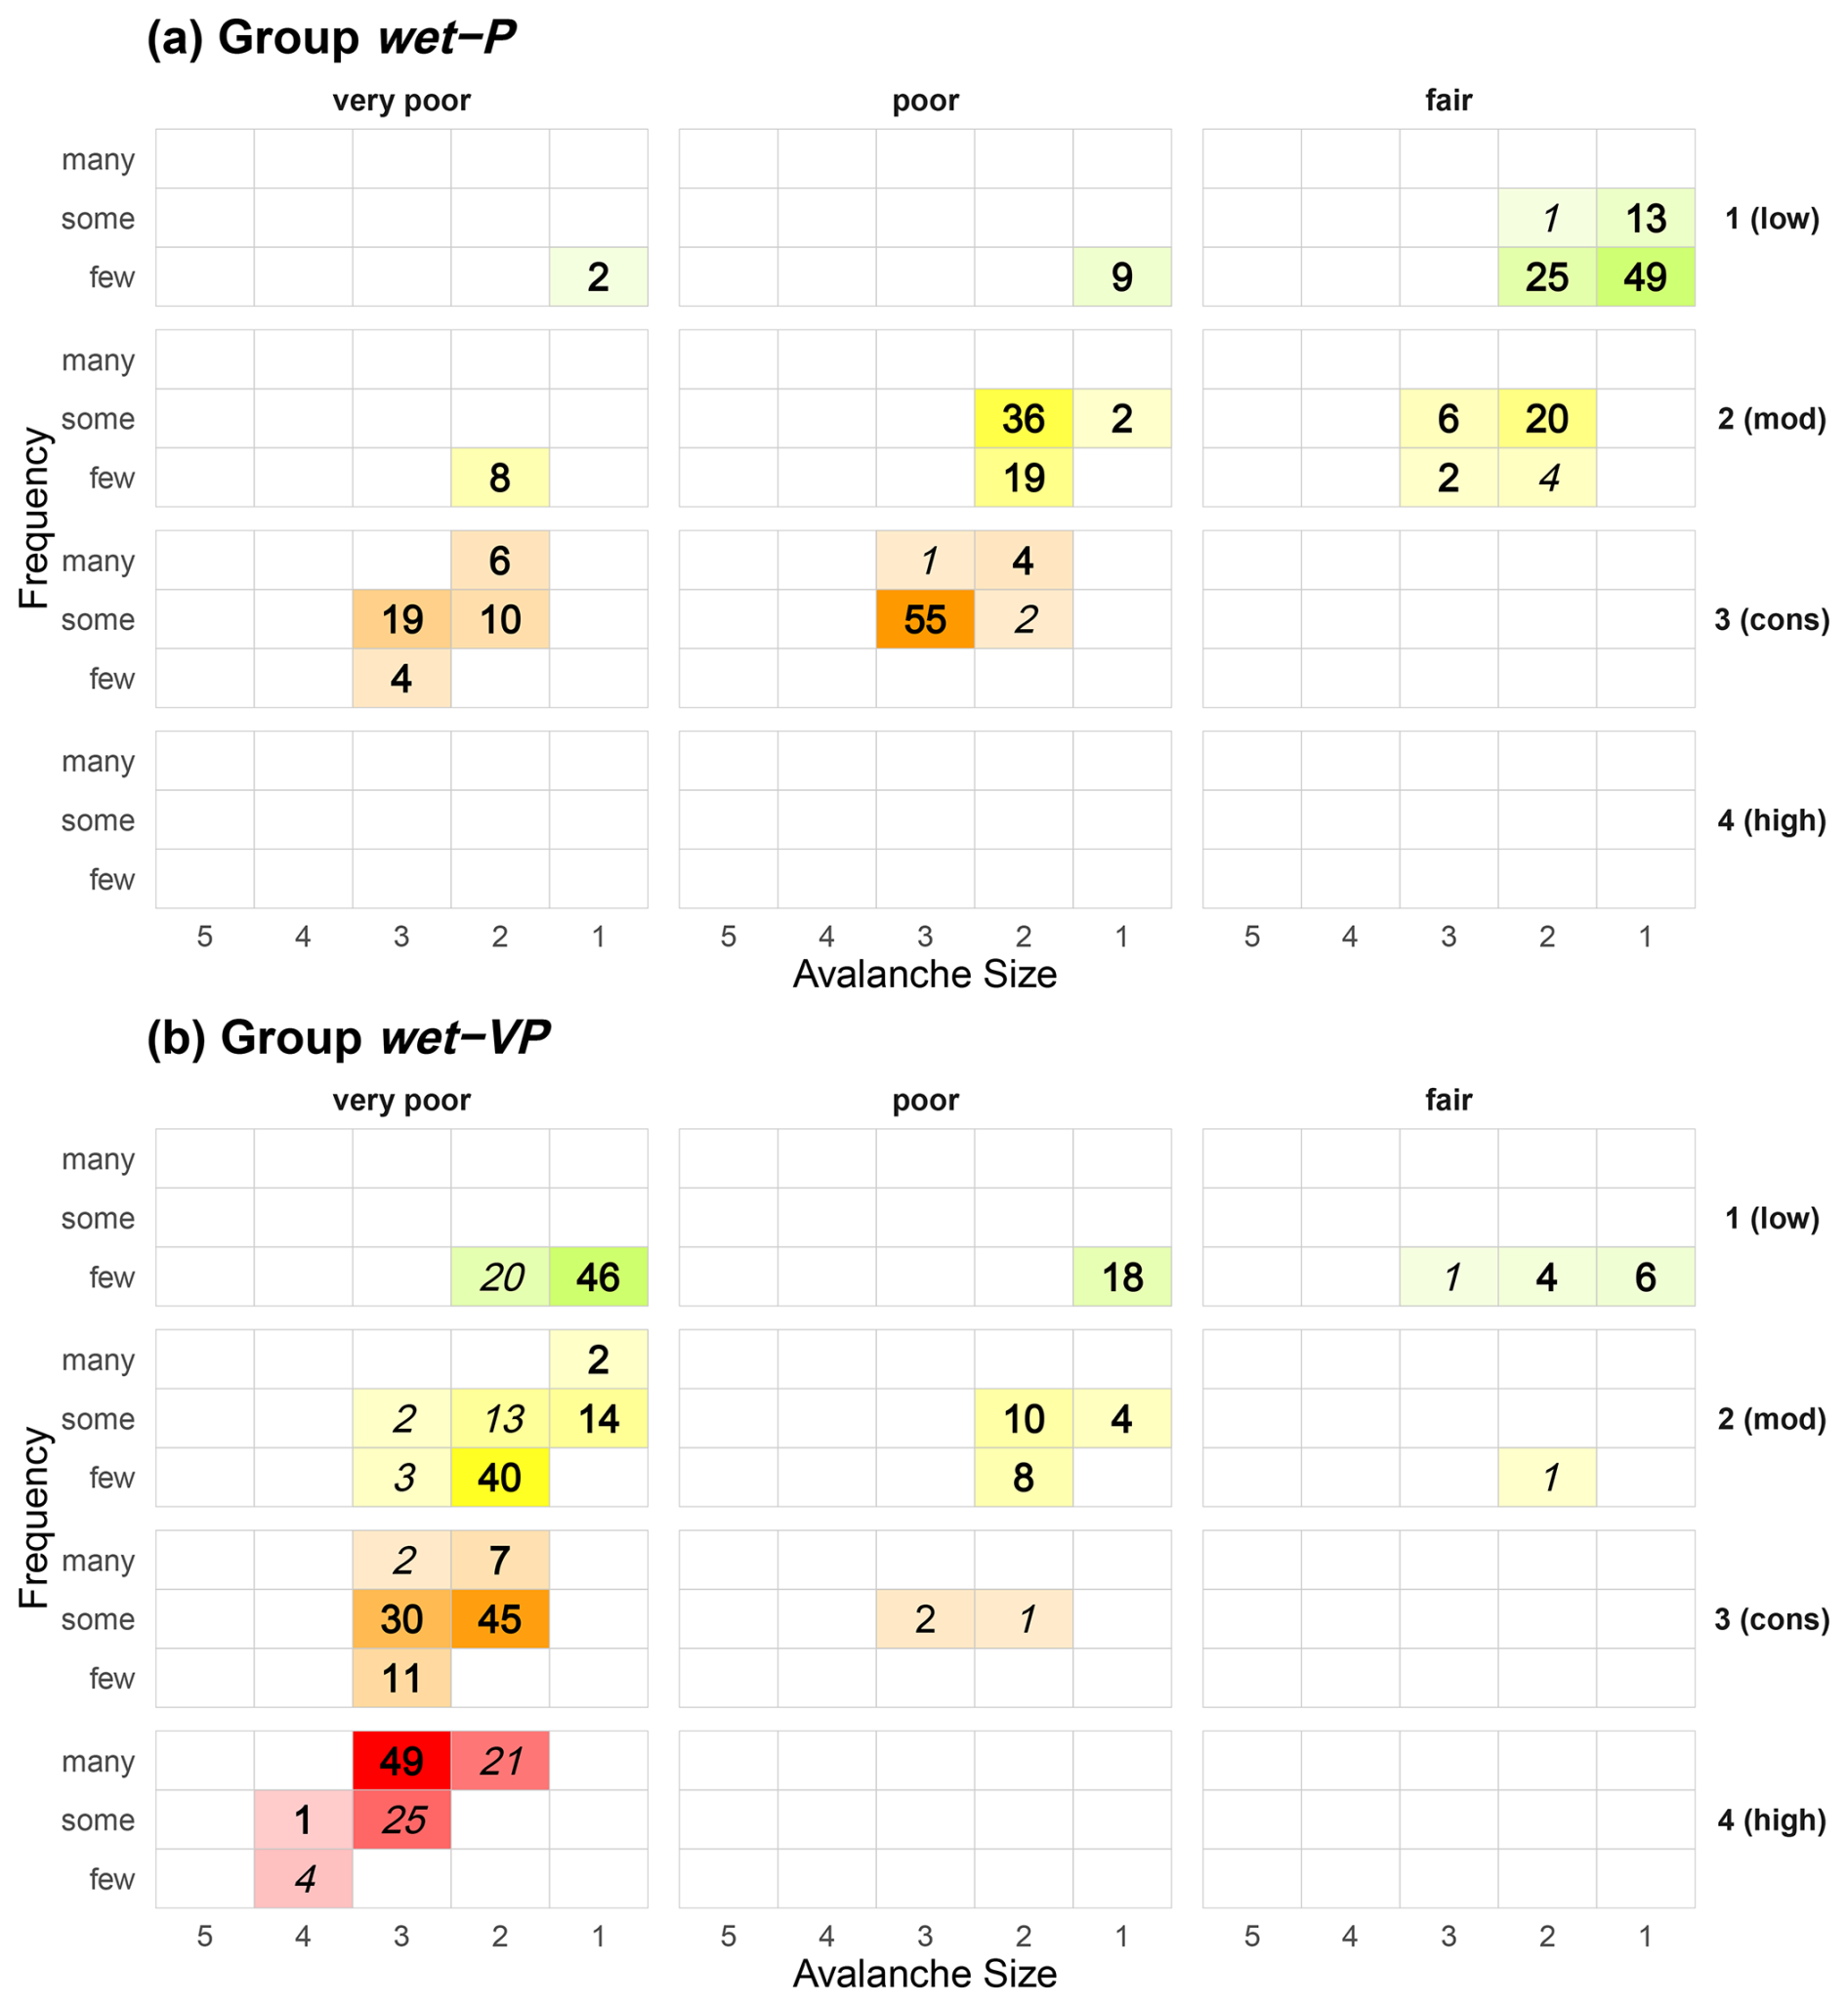
Figure 7Wet-snow and gliding snow avalanche problems: percentage of cases that a specific danger level (rows: D = 1 (low) to D = 4 (high)) was used for a specific matrix combination. Colour intensity corresponds to the percentage of cases. Cells with less than 1 % usage are not shown. Values highlighted bold correspond to use of Matrix-suggested danger levels, values in italics represent the second level. Group wet-P forecasters used very poor stability < 25 % of the time, group wet-VP forecasters ≥ 56 % of the time (see Fig. 4b). The respective figure for warning services lying in between these two is shown in Fig. C2 in Appendix C. Absolute use of Matrix cells, regardless of danger level, is shown in Fig. D1 in Appendix D.
6.1 Interpretation of findings
We examined how the Matrix was used in daily operations with the goal of (i) identifying differences in how avalanche danger is characterized using Matrix terminology across warning services; (ii) analyzing how the Matrix was applied across the range of issued danger levels; and (iii) exploring differences in Matrix use between dry-snow and wet- or gliding-snow avalanche problems. Our findings show that Matrix usage was broadly consistent with its design, while several observed patterns and variations provide empirical insights into both the Matrix's strengths and limitations and offer guidance for refinement and further harmonization.
Importantly, these findings must be interpreted in light of a fundamental limitation: the EAWS Matrix ultimately rests on expert judgment, both in its original development (Müller et al., 2025) and in its operational application. Since avalanche danger and its defining factors cannot be measured independently, there is no external reference against which Matrix-based danger level assignments can be formally validated. This introduces an inherent circularity into the evaluation, as forecasters assess factors and danger levels through the same conceptual framework that underlies the Matrix itself. As a result, deviations from the Matrix may reflect inconsistent application, justified adaptations to specific avalanche conditions, or differences in interpretation that cannot be disentangled without additional contextual information. In this sense, our analysis describes how the Matrix is applied in practice, rather than evaluating the correctness of issued danger levels.
6.1.1 Dominant Matrix cells and transition zones
Our analyses showed that most combinations of snowpack stability, frequency, and avalanche size were consistently linked to a single danger level. This was particularly pronounced for danger levels 1 (low), 2 (moderate), and 4 (high), indicating that the Matrix provides a robust and interpretable structure for operational use. Notably, even though about half the Matrix cells show a secondary danger level (D2, see Fig. 1), most factor combinations were almost always used for a single consistent danger level in practice, even by services with comparatively low Matrix compliance. This suggests a broad consensus on the danger level for these factor combinations and indicates that such cells could potentially be simplified.
In contrast, a small number of cells, most notably poor-some-size 2 and very poor-some-size 3, functioned as transition zones between adjacent danger levels. These cells showed frequent overlap in danger level assignment and played different roles across forecaster groups. For danger levels 3 (considerable) and 4 (high), respectively, they were among the most frequently used cells by services with low Matrix compliance (Fig. 5b), even though the Matrix indicates these danger levels only as second options. The reasons for this discrepancy remain speculative. This may be due to differences in how factor classes are interpreted, particularly the frequency categories (Techel et al., 2024). Alternatively, it may reflect a tendency among more Matrix-compliant services to avoid cells that do not yield the desired Matrix-suggested danger level. Notably, even services with high Matrix-compliance occasionally selected these cells issuing the second danger level suggested in the Matrix, underscoring their role as boundary regions between adjacent danger levels.
Beyond the dominant and transitional cells, some Matrix cells remained rarely used across all services (Figs. D1 and D2). This lack of empirical support reduces confidence in the danger levels suggested for these cells and highlights that these assignments still rely solely on expert elicitation during Matrix development (Müller et al., 2025).
6.1.2 Granularity, relative assessments, and convergent validity
Several warning services applied a finer-granularity when assessing the Matrix input factors, reflecting a fundamental tension between simplicity – few, well-defined classes – and nuance – expressed through finer-grained, ordinal rankings within otherwise discrete classes. On the one hand, the Matrix relies on a limited number of discrete classes, a design choice that aligns with evidence that humans can reliably assess only a small number of categories (e.g., Miller, 1956; Kahneman et al., 2021). On the other hand, requiring forecasters to commit early to a single class is analogous to rounding intermediate results, which can discard relevant information and introduce discontinuities in subsequent decision steps. Such rounding effects are particularly relevant when assessments lie near the boundary between two neighbouring classes; expressing these tendencies through sub-classes would preserve this information for the final danger level decision.
At the same time, humans are comparatively good at making relative judgments, such as ranking conditions within an absolute class (e.g., Kahneman et al., 2021). Combining absolute classifications with relative assessments by first selecting a discrete class and then indicating tendencies within that class therefore represents a promising way to preserve nuance while remaining within the overall structure of the Matrix. This is illustrated by the analysis of finer-granularity factor assessments for the frequently used factor combination poor-some-size 2 (Sect. 5.2.1). While this cell was predominantly associated with danger level 3 (considerable) in SWI and with level 2 (moderate) in BOZ, TIR, and TRE (Fig. 6), tendencies within the cell toward either danger level were broadly comparable across services. This convergence occurred despite differences in how relative positioning within the cell was implemented (Fig. 2) and regardless of whether the Matrix was used for danger level determination.
Despite these procedural differences, the observed agreement provides evidence of convergent validity (Campbell and Fiske, 1959): independent approaches aimed at assessing the same underlying concept yielded broadly similar outcomes. Even in the absence of external reference data, this supports the feasibility of a harmonized interpretation across warning services. While finer granularity helps preserve variation within coarse classes, the appropriate level of resolution remains a subject for discussion. Evidence from parallel forecasting in SWI indicates that reasonably reliable estimates are achievable even with higher-resolved absolute–relative scales (Techel et al., 2024). Together, this suggests that combining absolute and relative assessments can capture meaningful tendencies while remaining cognitively manageable and compatible with the Matrix framework.
6.1.3 Disentangling Matrix compliance, consistency, and accuracy
We distinguish between Matrix compliance (agreement with the danger level suggested by the Matrix), consistency (the degree to which the same factor combination leads to the same danger level), and accuracy, the latter of which cannot be evaluated in the absence of external reference data. When viewed through the lens of Matrix compliance, differences in how warning services applied the Matrix provide insight into both the consistency of danger level assignment and its potential limitations.
The stratified analyses (Sect. 5.2.1) confirmed that Matrix compliance influenced Matrix usage. Services, which disagreed more frequently with the Matrix-suggested danger level (D1), exhibited broader distributions and more frequent use of alternative danger levels (D2) than services with more standardized use. Notably, however, even the services generally in strong alignment with the Matrix for dry-snow avalanche problems, showed comparably large deviations when assessing wet- and gliding-snow avalanche problems.
A primary objective of integrating the Matrix into the forecasting process is to improve consistency. Our findings indicate that services with high Matrix compliance indeed used a narrower set of Matrix cells for each danger level, suggesting greater consistency in how factor combinations were linked to danger levels. However, consistency in output does not necessarily imply consistency in the assessment of the input factors. It is possible though speculative that forecasters occasionally adjusted input factor estimates to achieve a desired Matrix outcome rather than allowing factor assessments alone to determine the danger level.
While differences in danger levels assigned to factor input combinations clearly highlight inconsistency, they do not necessarily imply that one outcome is “wrong”. Rather, they may reflect shifts in how specific danger levels are interpreted relative to earlier practice of assessing the input factors, whether intentionally or not. Prior to the introduction of the revised Matrix in 2022, warning services did not explicitly assess the Matrix input factors or combine them systematically to derive danger levels. Since then, many services have learned to apply factor classifications within the Matrix framework, potentially anchoring factor assessments to a desired danger level. Possibly, services with low Matrix compliance applied a more independent approach when estimating factor classes and relating them to danger levels. From an operational perspective, however, a broad overlap of factor combinations across multiple danger levels, as observed for these services, remains problematic because it reduces consistency in communication and makes it more difficult for users to associate a given danger level with a set of avalanche conditions.
In addition, each factor estimate carries uncertainty, depending on data availability and the forecasters' ability to retrieve and correctly interpret information (Stewart and Lusk, 1994). Even small inconsistencies in factor assessment can propagate through the Matrix and lead to different danger levels. For example, if two forecasters assessing identical conditions differ by only one neighbouring class for a single factor in half of all cases, while fully agreeing otherwise, the danger level suggested in the Matrix would differ in approximately 21 % of cases on average (Techel et al., 2024). Without access to external validation data or forecaster rationale, it remains impossible to determine whether the Matrix promotes genuinely consistent interpretation or merely uniform outputs.
Even though the assessment of the input factors is subject to considerable uncertainty and subjectivity, and thus to variation in outcome, it is important to recognize that danger levels are increasingly defined by the Matrix logic and by the frequency with which the Matrix-suggested danger level is selected for specific factor combinations. Consequently, consistency in input factor estimation, within and across warning services, becomes even more important. Achieving this may require clearer factor definitions (e.g., for frequency categories) as well as improved availability of relevant data, such as snow-cover simulations, to support robust and harmonized factor assessment.
6.1.4 Avalanche problem dependence and implications for harmonization
Inconsistencies became particularly evident when considering different avalanche problems. While Matrix use was relatively consistent for dry-snow avalanche problems, forecasts for wet-snow and gliding snow problems showed considerably more variation between services. Similar discrepancies have been documented in Canada (Clark and Haegeli, 2018; Clark, 2019), where identical combinations of likelihood of avalanches (the North American counterpart to stability and frequency in the Matrix) and avalanche size resulted in different danger levels depending on avalanche problem type and, at times, the forecasting agency. In our analysis, the most notable differences related to the classification of snowpack stability for wet-snow and gliding snow avalanche problems. Although wet-snow and gliding snow avalanches are generally associated with natural avalanche occurrence (Schweizer et al., 2020; Hutter et al., 2021), and thus conceptually with very poor stability (Table A1), services showed considerable divergence in their stability ratings (Figs. 4b, 7). Again, we can only speculate whether this reflects different conceptual models or deliberate adjustments of factor inputs to achieve expected Matrix outcomes. To promote harmonized application of the Matrix, a clearer, shared framework for assessing stability in wet- and gliding snow contexts appears necessary.
6.2 Recommendations for improving the Matrix and workflow
Based on the findings outlined above, we propose the following recommendations:
-
Simplify cell content. Forecasters used several Matrix cells predominantly for a single danger level (Fig. 3). These include the factor combinations very poor-a few-size 3 and very poor-some-size 2, which forecasters assigned strongly with danger level 3 (considerable), as well as poor-a few-size 2 and poor-some-size 1, which were used mostly for danger level 2 (moderate). These cells could therefore be simplified to emphasize a single danger level without a substantial loss of information.
-
Use white shading for under-supported cells. Beyond the cells already marked white in the Matrix (Fig. 1), several additional cells were rarely used in operational practice and could also be shaded white to indicate increased uncertainty. For these cells, danger level assignments currently rely exclusively on the expert elicitation underlying the Matrix. Specifically, this applies to combinations involving fair stability with either avalanche size 4 or 5, or frequency many, as well as poor stability in combination with avalanche size 5.
-
Investigate transition zones and promote transparency in ambiguous cases. The cells poor-some-size 2 and very poor-some-size 3 were frequently assigned to two different danger levels, highlighting persistent ambiguity in these transition zones. These areas warrant further investigation to better understand the sources of variation and to refine the corresponding guidance. While the Matrix should be applied in line with agreed standards, these cells remain open to interpretation. Because objective validation is not feasible, we recommend that deviations from the primary danger level (D1) be documented transparently. Such documentation helps distinguish well-founded expert judgment from inconsistent application and facilitates learning across warning services. This transparency may include practices already in use, such as indicating tendencies within factor classes, as applied and analysed for four warning services (Figs. 2 and 6). In addition, this information could be used to further refine the Matrix itself; for example, cells such as poor-some-size 2 could be subdivided to provide more detailed guidance to forecasters (Fig. 8).
-
Clarify assessment procedures for wet-snow and gliding snow avalanche problems. A harmonized conceptual framework is needed to guide the assessment of wet-snow and gliding snow avalanche problems. This may require revised definitions, targeted forecaster training, and/or updated guidance within the forecasting workflow.
6.3 Limitations
A key limitation is that we lack precise information about how the Matrix was implemented operationally within each warning service. While some services likely provided formal internal guidance, for instance by implementing the Matrix directly in the forecasting software, or training, others allowed for greater forecaster discretion in referring to the Matrix or did not use the Matrix, but rather reached a final decision following group discussion (SWI). We also do not know the rationale behind individual forecaster decisions or the situational context in which factor assessments were made. These missing layers of information limit our ability to distinguish between genuine differences in interpretation and procedural differences across services and would be valuable for understanding when and why forecasters adhered to or deviated from the Matrix, particularly in ambiguous or transitional cells. Moreover, variations in Matrix use and data collection procedures described in Sect. 3.2 required harmonizing the data across services, which may have introduced an unknown degree of information loss, including potentially relevant detail. Finally, while grouping warning services facilitated data analysis and presentation, some groups, such as the group of warning services with low Matrix compliance, were likely heterogeneous with respect to the underlying reasons for deviating from the Matrix.
This study provides the first comprehensive assessment of how the revised EAWS-Matrix has been used operationally across European avalanche warning services. The findings confirm that the Matrix structure is broadly effective, with most cells supporting consistent danger level assignment – even among services with a tendency to diverge from the Matrix-suggested danger level. However, two factor combinations (poor-some-size 2 and very poor-some-size 3) emerged as areas of ambiguity that warrant closer examination. Integrating finer-granularity factor assessments can reveal tendencies within Matrix fields and may offer a path toward more specific guidance in cells that currently contain two danger levels. Rarely used cells remain a source of uncertainty and should be visually marked. These findings were integrated into the final revisions of the Matrix (Müller et al., 2025).
While Matrix use was relatively consistent for dry-snow avalanche problems, substantial inconsistencies were observed for wet-snow and gliding-snow avalanche problems, especially in the classification of snowpack stability. This highlights a need for broader harmonization of factor assessment and Matrix application practices across services, to support more reliable and consistent avalanche danger level forecasts. Overall, the results provide guidance for refining the Matrix and underscore the importance of transparent documentation and shared interpretation frameworks in domains where expert judgment plays a central role.
Ultimately, the assessment of avalanche danger levels should be guided as directly and transparently as possible by available data and not by individual forecasting styles, conceptual preferences, or service-specific traditions. Forecasts should reflect a shared understanding of avalanche danger and its determining factors, rather than the personality or institutional context of the forecaster. While some degree of expert interpretation is unavoidable, danger level assignment should result from a forward-looking evaluation of the evidence, not reverse reasoning from a desired outcome. Given the inherent uncertainty and subjectivity of the data, providing objective and targeted recommendations for improving the Matrix and its use is undoubtedly challenging but remains essential for producing credible and consistent public avalanche forecasts across Europe. Given these limitations, our conclusions and recommendations should not be interpreted as validation of the Matrix or its outputs, but as operational insights to support its ongoing development.
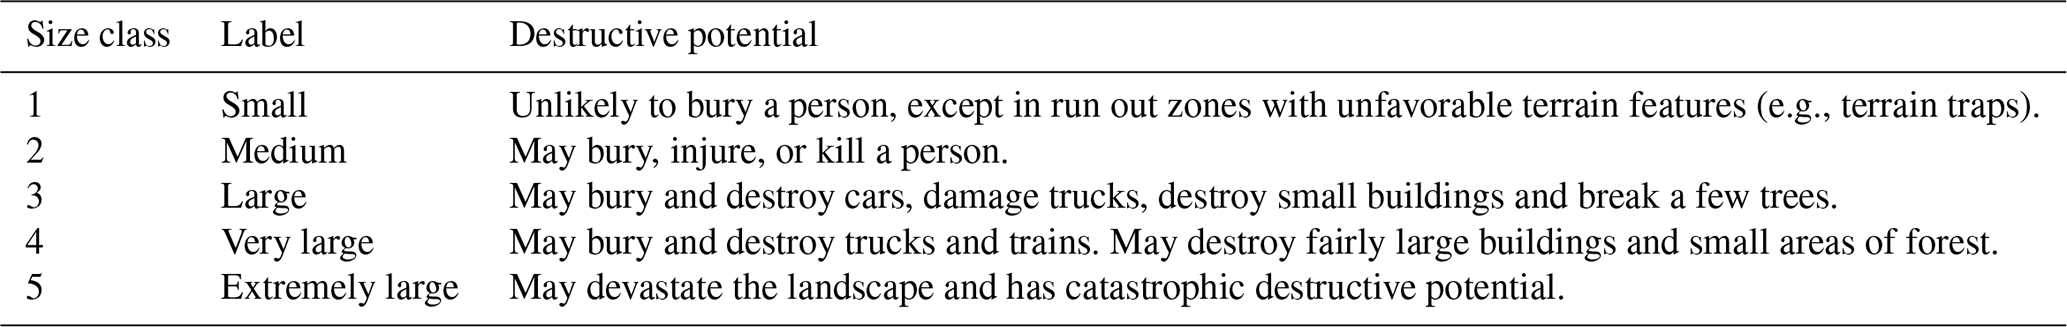
Table A1Snowpack stability classes and the type of triggering typically associated with these classes according to Müller et al. (2025, Table 2). Stability refers to the point scale. Values in parentheses indicate that the trigger or evidence is not typical but may occur.
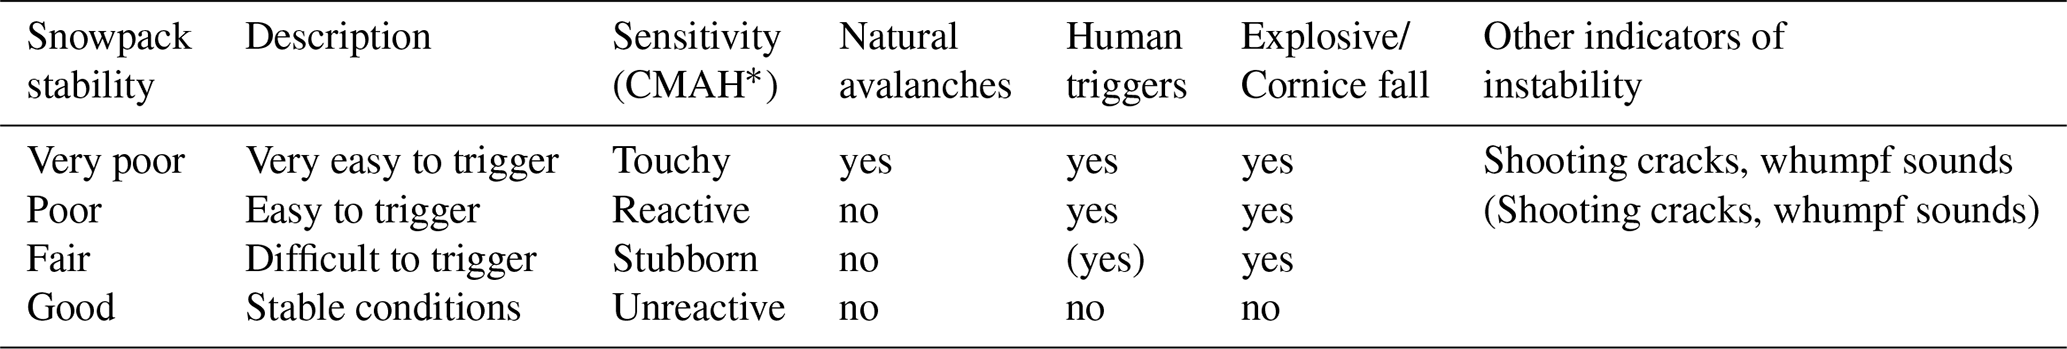
* Terminology according to Conceptual Model of Avalanche Hazard (Statham et al., 2018).
Table A2Frequency classes of snowpack stability, taken from Müller et al. (2025, Table 3).
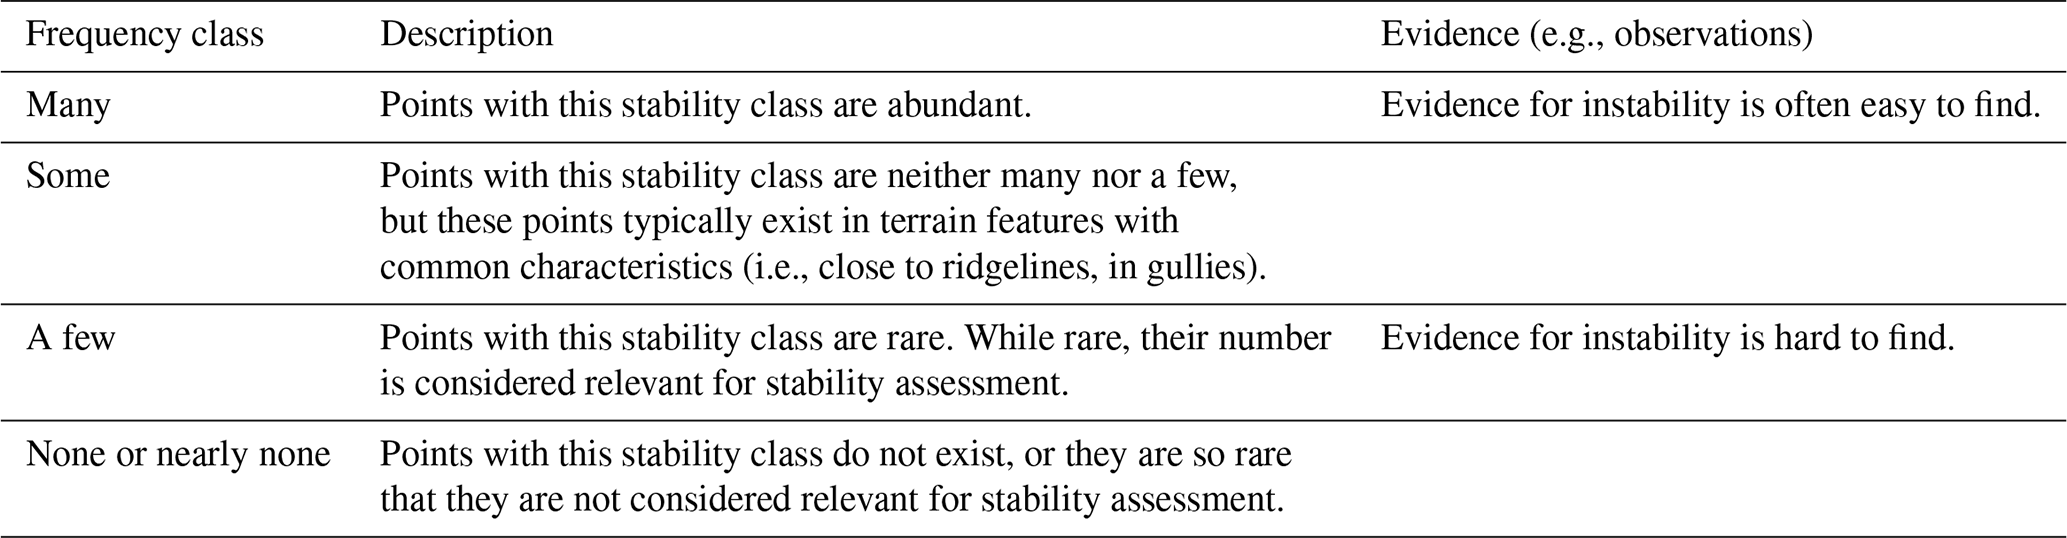
Table A3Avalanche size classes, taken from Müller et al. (2025, Table 4).
Classification and Regression Trees (CART, Breiman et al., 2017) are non-parametric models that recursively partition the predictor space to construct interpretable decision trees for classification or regression. CART models are highly interpretable, as each split corresponds to a simple decision rule. The resulting tree structure provides clear insight into the relationships between predictors and the response. CART is robust to outliers, can handle both numerical and categorical predictors, and does not require assumptions about the distribution of the data. For this study, we applied the rpartScore package (Galimberti et al., 2012), which extends CART to ordinal outcomes by incorporating misclassification costs that reflect the ordered structure of the response variable. Unlike standard CART procedures that treat all misclassifications equally, this approach recognizes that errors between adjacent ordinal categories are less severe than errors between distant categories. The methodology assumes that numerical scores are assigned to the ordered categories of the response variable, reflecting the inherent ordinal structure of the data.
The dataset consists of p predictors X = (here: stability, frequency, size) and an ordinal target variable Y (here: D). For each observation i = , there is a data pair (yi,xi), where yi is the target variable and xi = represents the predictor values.
Trees were grown using the Generalized Gini impurity function, which incorporates misclassification costs calculated based on the ordinal distances between categories. The splitting criterion selects the predictor variable and split point that maximizes the reduction in the Generalized Gini impurity at each node. For a given node m representing region Rm with Nm observations, the proportion of class k is
where I(⋅) is the indicator function. The Generalized Gini impurity for node m is then defined as
where K is the number of categories, and ckl is the misclassification cost between categories k and l, typically set as the absolute or squared difference between their scores (e.g., ckl = or ckl = (k−l)2). This impurity measure accounts for both the frequency of misclassifications and their severity based on the ordinal distance between categories, ensuring that splits are chosen to minimize not only the number but also the seriousness of classification errors in the context of ordinal data.
To avoid overfitting, cost-complexity pruning was applied. Two pruning criteria were evaluated:
-
Total misclassification rate (
prune = "mr"): minimizes the proportion of misclassified observations. -
Total misclassification cost (
prune = "mc"): minimizes the cumulative cost of misclassifications, weighted by ordinal distance.
The complexity parameter (cp) is a central hyperparameter in the rpartScore framework that controls the trade-off between tree complexity and model fit (Breiman et al., 2017; Galimberti et al., 2012). At each split, cp specifies the minimum reduction in the overall cost-complexity measure required for a split to be retained in the tree. As cp increases, the algorithm produces smaller, simpler trees by pruning branches that do not sufficiently decrease the impurity, thereby reducing the risk of overfitting. Conversely, a lower cp allows for more complex trees, which may capture more structure but risk overfitting the training data.
The analysis employed a comprehensive hyperparameter tuning approach using repeated cross-validation. A 10-fold cross-validation with 3 repetitions was implemented to ensure robust model evaluation. The hyperparameter grid included:
-
Complexity parameter: values ranging from 0.01 to 0.3 in increments of 0.05
-
Split functions: both absolute (
"abs") and squared ("quad") difference approaches -
Pruning measures: both misclassification rate (
"mr") and misclassification cost ("mc") criteria
To address potential class imbalance in the ordinal response variable, the Synthetic Minority Oversampling Technique (SMOTE) was applied during the cross-validation process. This technique generates synthetic examples of minority classes to balance the training data while preserving the ordinal structure of the response variable. However, SMOTE was only used in cases where the predictors were continuous. In the case of SWI, where the predictors were categorical, no SMOTE was applied.
Model performance was assessed using Matthews Correlation Coefficient (MCC) as the primary evaluation metric (Matthews, 1975). MCC is well-suited for imbalanced class distributions, as it considers all elements of the confusion matrix and avoids the pitfalls of standard accuracy metrics when one class dominates. In this analysis, MCC is especially appropriate for SWI, where predictors were categorical and SMOTE was not used. Without SMOTE, traditional metrics could overestimate performance, but MCC ensures a fair and robust evaluation even with class imbalance.
where TP, TN, FP, and FN represent true positives, true negatives, false positives, and false negatives, respectively. While the formula above shows the binary case, for multiclass classification the MCC is computed using a generalized confusion matrix formula that accounts for all classes simultaneously. This ensures the reported MCC remains a balanced and robust measure of model performance, even when more than two classes are involved (Gorodkin, 2004; Chicco and Jurman, 2020). Additionally, balanced accuracy was computed as a secondary metric:
The optimal model configuration was selected based on the highest cross-validated MCC score, ensuring that the final model provides the best balance between predictive accuracy and model complexity while appropriately accounting for the ordinal nature of the response variable.
The analysis was conducted in R (R Core Team, 2024) using the caret package framework (Kuhn, 2008).
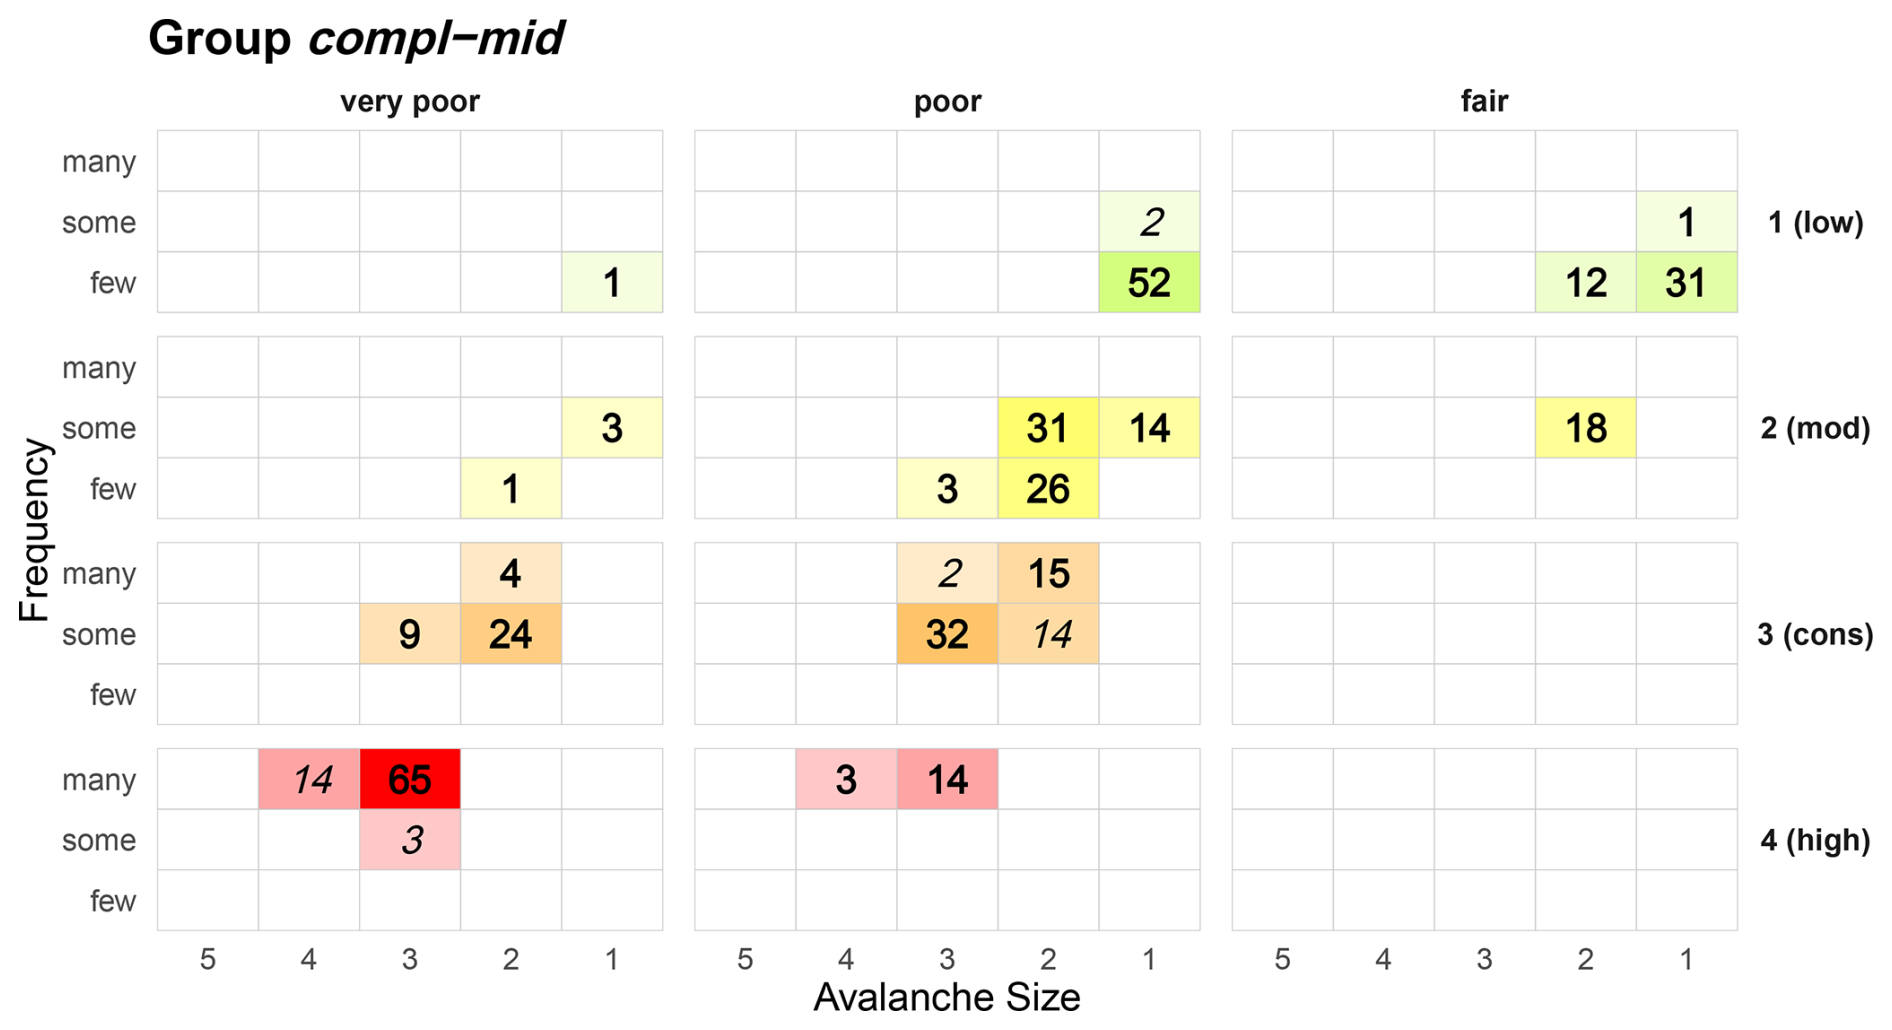
Figure C1Dry-snow avalanche problems – warning service group compl-mid with intermediate values for compliance (Table 1): proportion of cases that a specific danger level (rows: D = 1 (low) to D = 4 (high)) was used for a specific matrix combination. Colour shading corresponds to the proportion of cases. Cells with < 1 % usage are not shown.
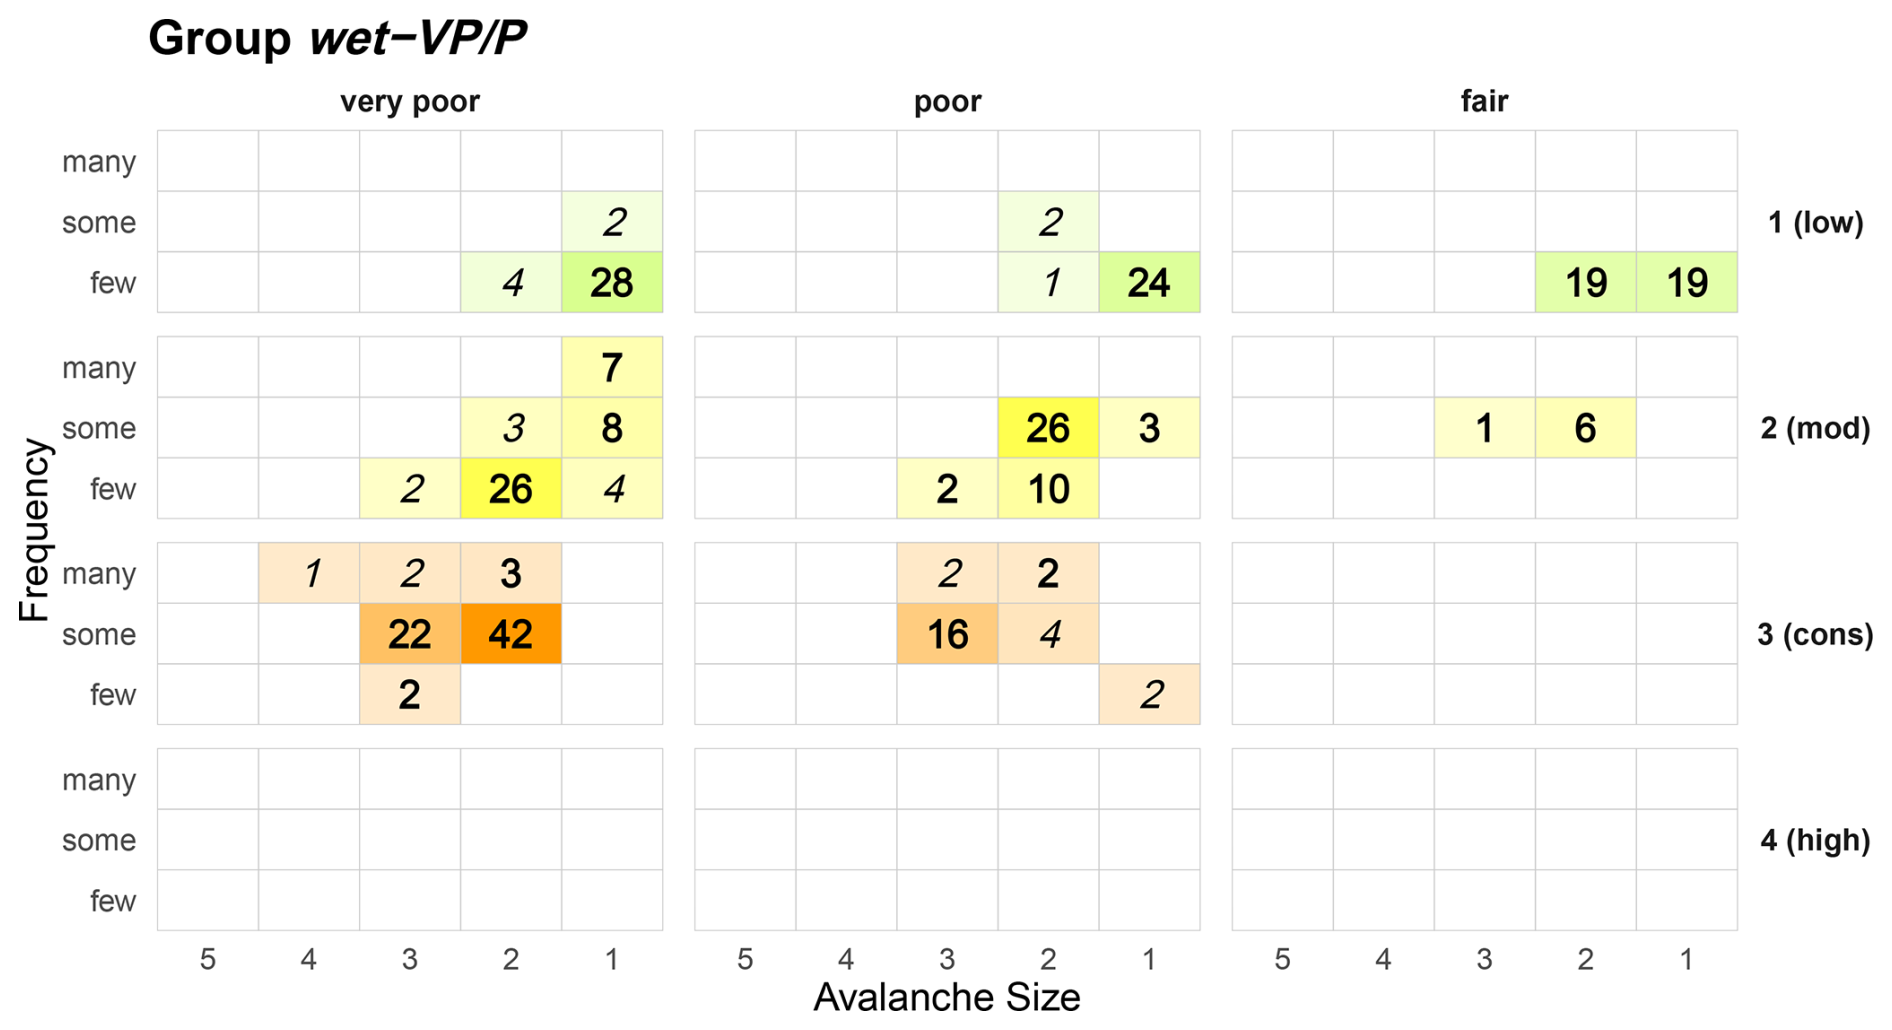
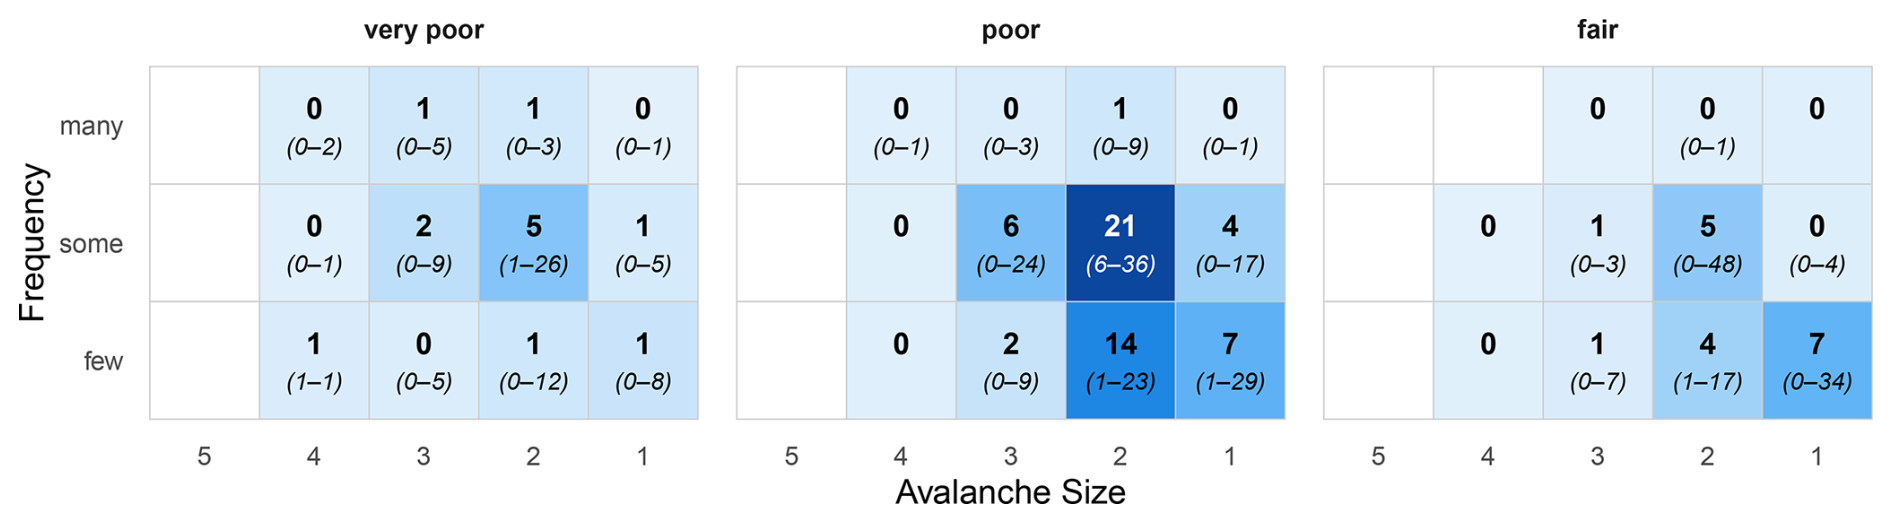
Figure D1Dry-snow avalanche problems. Shown are the median percentages of cell usage of the 26 warning services. The values in brackets represent the min-max range.
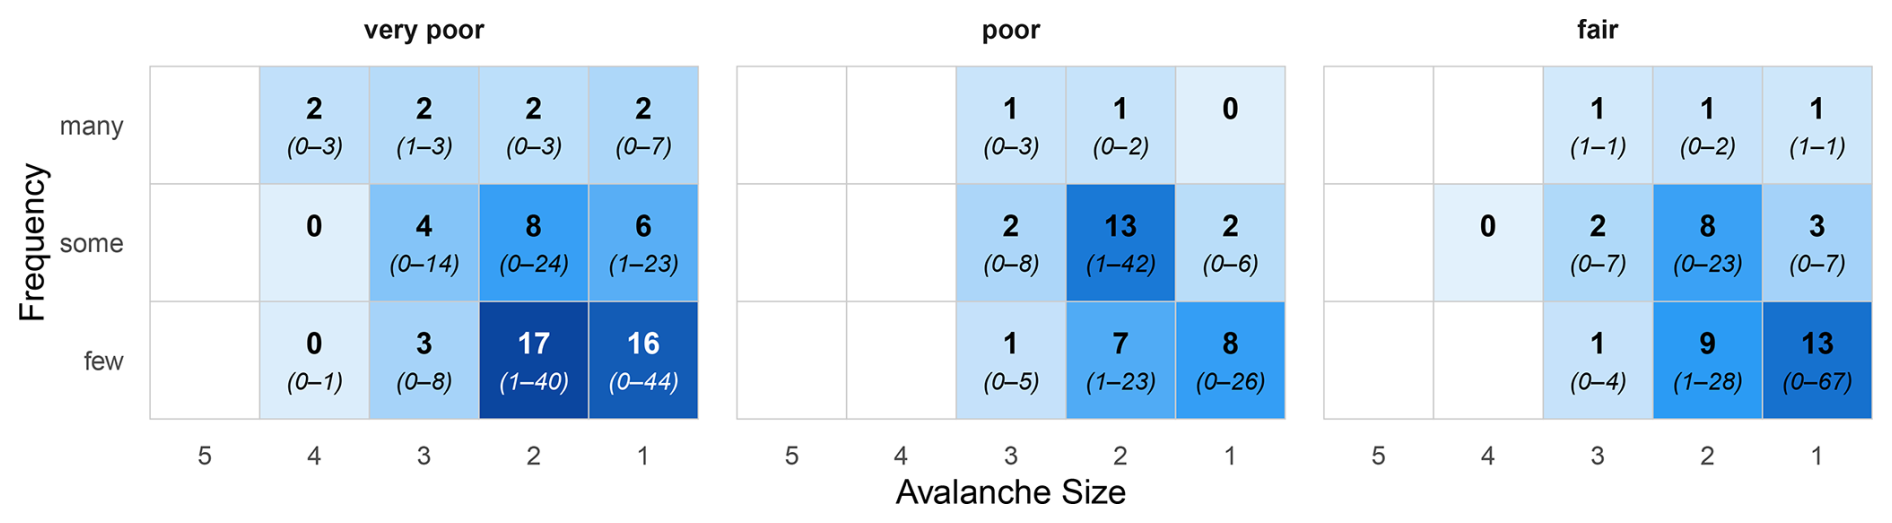
Figure D2Wet-snow and gliding snow avalanche problems. Shown are the median percentages of cell usage of the 25 warning services (no data for SCO). The values in brackets represent the min-max range.
Data and code are accessible at https://doi.org/10.5281/zenodo.18030373 (Techel et al., 2025).
FT (study design, data curation, formal analysis, writing, reviewing), KM (project lead, reviewing), CMa (study design, formal analysis, writing, reviewing), CMi (study design, writing, reviewing).
The contact author has declared that none of the authors has any competing interests.
Publisher's note: Copernicus Publications remains neutral with regard to jurisdictional claims made in the text, published maps, institutional affiliations, or any other geographical representation in this paper. The authors bear the ultimate responsibility for providing appropriate place names. Views expressed in the text are those of the authors and do not necessarily reflect the views of the publisher.
We thank Stefano Sofia, Petter Palmgren, Nicolas Roux, Giacomo Villa, Guillém Martin Bellido, and Lorenzo Bertranda for invaluable discussions within the EAWS working group Matrix & Scale. Filip Kyzek, Mark Diggins, Igor Chiambretti, Giacomo Villa, Guillém Martin Bellido, and Lorenzo Bertranda provided data. We thank the reviewers Erich Peitzsch and Benjamin Reuter for their valuable feedback, and we thank the editor Pascal Haegeli for his feedback on the initial manuscript, which ultimately led to the decision to separate the conceptual development (Müller et al., 2025) and the operational analysis (this study) into two publications. The analysis was conducted using the programming languages R (R Core Team, 2024). We acknowledge the use of ChatGPT-5.2 (OpenAI) to support language editing of this manuscript and to assist with debugging of code.
This paper was edited by Pascal Haegeli and reviewed by Erich Peitzsch and Benjamin Reuter.
Breiman, L., Friedman, J. H., Olshen, R. A., and Stone, C. J.: Classification and Regression Trees, Chapman and Hall/CRC, New York, https://doi.org/10.1201/9781315139470, ISBN 9781315139470, 2017. a, b, c
Campbell, D. T. and Fiske, D. W.: Convergent and discriminant validation by the multitrait-multimethod matrix, Psychol. Bull., 56, 81–105, https://doi.org/10.1037/h0046016, 1959. a
Chicco, D. and Jurman, G.: The advantages of the Matthews correlation coefficient (MCC) over F1 score and accuracy in binary classification evaluation, BMC Genomics, 21, 6, https://doi.org/10.1186/s12864-019-6413-7, 2020. a
Clark, T.: Exploring the Link between the Conceptual Model of Avalanche Hazard and the North American Public Avalanche Danger Scale, Master's thesis, Simon Fraser University, https://summit.sfu.ca/_flysystem/fedora/sfu_migrate/18786/etd20073.pdf (last access: 23 December 2025), 2019. a
Clark, T. and Haegeli, P.: Establishing the link between the Conceptual Model of Avalanche Hazard and the North American Public Avalanche Danger Scale: initial explorations from Canada, in: Proceedings ISSW 2018. International Snow Science Workshop, Innsbruck, Austria, 7–12 October 2018, 1116–1120, https://arc.lib.montana.edu/snow-science/objects/ISSW2018_O12.4.pdf (last access: 3 March 2026), 2018. a
EAWS: Determination of the avalanche danger level in regional avalanche forecasting, https://www.avalanches.org/wp-content/uploads/2025/08/EAWS_matrix_definitions_EN.pdf (last access: 23 December 2025), 2025a. a, b, c, d
EAWS: European Avalanche Danger Scale, https://www.avalanches.org/wp-content/uploads/2022/09/European_Avalanche_Danger_Scale-EAWS.pdf (last access: 10 July 2025), 2025b. a, b
EAWS: Typical avalanche problems, https://www.avalanches.org/wp-content/uploads/2022/09/EN_EAWS_avalanche_problems.pdf (last access, 10 July 2025), 2025c. a, b
EAWS: Information pyramid, https://www.avalanches.org/wp-content/uploads/2022/09/Content_and_Structure_Avalanche_Bulletin-EAWS.pdf (last access: 10 July 2025), 2025d. a
Engeset, R. V., Pfuhl, G., Landrø, M., Mannberg, A., and Hetland, A.: Communicating public avalanche warnings – what works?, Nat. Hazards Earth Syst. Sci., 18, 2537–2559, https://doi.org/10.5194/nhess-18-2537-2018, 2018. a
Galimberti, G., Soffritti, G., and Di Maso, M.: Classification trees for ordinal responses in R: the rpartScore package, J. Stat. Softw., 47, 1–25, 2012. a, b
Gorodkin, J.: Comparing two K-category assignments by a K-category correlation coefficient, Comput. Biol. Chem., 28, 367–374, https://doi.org/10.1016/j.compbiolchem.2004.09.006, 2004. a
Haegeli, P., McCammon, I., Jamieson, B., Israelson, C., and Statham, G.: The Avaluator – A Canadian rule-based avalanche decision support tool for amateur recreationists, in: Proceedings International Snow Science Workshop, Telluride, Colorado, USA, 254–263 pp., https://arc.lib.montana.edu/snow-science/objects/issw-2006-254-263.pdf (last access: 3 March 2026), 2006. a
Harvey, S., Rhyner, H., and Schweizer, J.: Lawinenkunde, Bruckmann Verlag GmbH, München, ISBN 978-3-7654-5779-1, 2012. a
Hutter, V., Techel, F., and Purves, R. S.: How is avalanche danger described in textual descriptions in avalanche forecasts in Switzerland? Consistency between forecasters and avalanche danger, Nat. Hazards Earth Syst. Sci., 21, 3879–3897, https://doi.org/10.5194/nhess-21-3879-2021, 2021. a
Kahneman, D., Sibony, O., and Sunstein, C.: Noise: A flaw in human judgment, William Collins, London, U.K., ISBN 978-0-00-830899-5, 2021. a, b
Kuhn, M.: Building Predictive Models in R Using the caret Package, J. Stat. Softw., 28, 1–26, https://doi.org/10.18637/jss.v028.i05, 2008. a
Lazar, B., Trautmann, S., Cooperstein, M., Greene, E., and Birkeland, K.: North American avalanche danger scale: Do backcountry forecasters apply it consistently?, in: Proceedings ISSW 2016. International Snow Science Workshop, Breckenridge, 2–7 October 2016, CO, 457–465, https://arc.lib.montana.edu/snow-science/objects/ISSW16_O20.01.pdf (last access: 3 March 2026), 2016. a
Matthews, B. W.: Comparison of the predicted and observed secondary structure of T4 phage lysozyme, Biochimica et Biophysica Acta (BBA)-Protein Structure, 405, 442–451, 1975. a
Miller, G.: The magical number seven, plus or minus two: Some limits on our capacity for processing information, Psychol. Rev., 63, 81–97, https://doi.org/10.1037/h0043158, 1956. a
Mitterer, C., Lanzanasto, N., Nairz, P., Boninsegna, A., Munari, M., Geier, G., Rastner, L., Gheser, F., Trenti, A., Begnini, S., Tognoni, G., Pucher, A., Nell, D., Kriz, K., and Mair, R.: Project ALBINA: A conceptual framework for a consistent, cross-border and multilingual regional avalanche forecasting system, in: Proceedings ISSW 2018. International Snow Science Workshop Innsbruck, Austria, 7–12 October 2018, 1523–1530, https://arc.lib.montana.edu/snow-science/objects/ISSW2018_O17.8.pdf (last access: 3 March 2026), 2018. a
Müller, K., Mitterer, C., Engeset, R., Ekker, R., and Kosberg, S.: Combining the conceptual model of avalanche hazard with the Bavarian matrix, in: Proceedings ISSW 2016. International Snow Science Workshop, CO, USA, 2–7 October 2016, Breckenridge, 472–479, https://arc.lib.montana.edu/snow-science/objects/ISSW16_O20.03.pdf (last access: 3 March 2026), 2016. a
Müller, K., Techel, F., and Mitterer, C.: The EAWS matrix, a decision support tool to determine the regional avalanche danger level (Part A): conceptual development, Nat. Hazards Earth Syst. Sci., 25, 4503–4525, https://doi.org/10.5194/nhess-25-4503-2025, 2025. a, b, c, d, e, f, g, h, i, j, k, l, m, n, o, p, q
Murphy, A. H.: What is a good forecast? An essay on the nature of goodness in weather forecasting, Weather Forecasting, 8, 281–293, https://doi.org/10.1175/1520-0434(1993)008<0281:WIAGFA>2.0.CO;2, 1993. a, b
R Core Team: R: A Language and Environment for Statistical Computing, R Foundation for Statistical Computing, Vienna, Austria, https://www.R-project.org/ (last access: 3 March 2026), 2024. a, b
Reuter, B. and Schweizer, J.: Describing snow instability by failure initiation, crack propagation, and slab tensile support, Geophys. Res. Lett., 45, 7019–7029, https://doi.org/10.1029/2018GL078069, 2018. a
Schmudlach, G. and Köhler, J.: Automated avalanche risk rating of backcountry ski routes, in: Proceedings ISSW 2016. International Snow Science Workshop, 2–7 October 2016, Breckenridge, CO, 450–456, https://arc.lib.montana.edu/snow-science/objects/ISSW16_O19.04.pdf (last access: 3 March 2026), 2016. a
Schweizer, J., Mitterer, C., Techel, F., Stoffel, A., and Reuter, B.: On the relation between avalanche occurrence and avalanche danger level, The Cryosphere, 14, 737–750, https://doi.org/10.5194/tc-14-737-2020, 2020. a, b
SLF: Avalanche bulletin interpretation guide, WSL Institute for Snow and Avalanche Research SLF, November 2024th edn., https://www.slf.ch/fileadmin/user_upload/SLF/Lawinenbulletin_Schneesituation/Wissen_zum_Lawinenbulletin/Interpretationshilfe/Interpretationshilfe_EN.pdf (last access: 10 July 2025), 2024. a
Statham, G., Haegeli, P., Greene, E., Birkeland, K., Israelson, C., Tremper, B., Stethem, C., McMahon, B., White, B., and Kelly, J.: A conceptual model of avalanche hazard, Nat. Hazards, 90, 663–691, https://doi.org/10.1007/s11069-017-3070-5, 2018. a, b, c
Stewart, T. and Lusk, C.: Seven components of judgmental forecasting skill: implications for research and the improvement of forecasts, J. Forecasting, 13, 579–599, https://doi.org/10.1002/for.3980130703, 1994. a
Techel, F., Müller, K., and Schweizer, J.: On the importance of snowpack stability, the frequency distribution of snowpack stability, and avalanche size in assessing the avalanche danger level, The Cryosphere, 14, 3503–3521, https://doi.org/10.5194/tc-14-3503-2020, 2020. a
Techel, F., Lucas, C., Pielmeier, C., Müller, K., and Morreau, M.: Unreliability in expert estimates of factors determining avalanche danger and impact on danger level estimation with the Matrix, in: Proceedings International Snow Science Workshop, Tromsø, Norway, 23–29 September 2024, 264–271, https://arc.lib.montana.edu/snow-science/item.php?id=3144 (last access: 3 March 2026), 2024. a, b, c, d
Techel, F., Müller, K., Mitterer, C., and Marquardt, C.: Data for publication: The EAWS Matrix, a decision support tool to determine the regional avalanche danger level (Part B): Operational testing and use, Zenodo [data set and code], https://doi.org/10.5281/zenodo.18030373, 2025. a
Winkler, K., Trachsel, J., Knerr, J., Niederer, U., Weiss, G., Ruesch, M., and Techel, F.: SAFE – a layer-based avalanche forecast editor for better integration of model predictions, in: Proceedings International Snow Science Workshop, Tromsø, Norway, 23–29 September 2024, 124–131, https://arc.lib.montana.edu/snow-science/item.php?id=3123 (last access: 3 March 2026), 2024. a, b
Across the six forecast regions covered by the Scottish Avalanche Information Service, and excluding the cornice problem, dry-snow problems accounted for 67 %–90 % of all assigned avalanche problems during the 2024/2025 season (unpublished data provided by Mark Diggins, Scottish Avalanche Information Service, 2025).
- Abstract
- Introduction
- Determining the regional avalanche danger level – approach in Europe
- Data
- Methods
- Results
- Discussion
- Conclusions
- Appendix A: Definition of factors
- Appendix B: Details on the CART model for sub-class analysis
- Appendix C: Matrix usage – warning service groups compl-mid and wet-VP/P
- Appendix D: Matrix usage regardless of danger level
- Code and data availability
- Author contributions
- Competing interests
- Disclaimer
- Acknowledgements
- Review statement
- References