the Creative Commons Attribution 4.0 License.
the Creative Commons Attribution 4.0 License.
 | 05 Mar 2026
The 15 September 2022 floods in northern Marche (Central Italy): disaster analysis, case studies and mitigation strategies for hydro-geomorphological hazard
Fabrizio Bendia
Piero Farabollini
Marco Materazzi
Margherita Bufalini
On 15 and 16 September 2022, a large area of the Marche region in central Italy experienced an exceptionally heavy rainfall event, with nearly 420 mm of rain falling in just six hours. The intense rains, in addition to causing 13 fatalities, triggered a large number of landslides in the mountain areas and flood events, mainly concentrated along the valleys of the hydrographic basins of the Metauro, Cesano, Misa, and Esino Rivers. The physiographic setting of the territory and the poor maintenance of both the main and secondary hydrographic network, often insufficient or entirely absent, exacerbated an already exceptional event. Although extraordinary, the natural event occurred in an area already affected by intense meteoric events in the past, the most recent of which had taken place just eight years earlier, in 2014.
This study presents the results of the systematic and detailed surveys conducted in several sites affected by the storm, also providing detailed case studies. These surveys highlighted the critical issues detected during the disaster and identified appropriate intervention measures for reducing hydraulic risk in the Region. Many of these measures are innovative and will serve as guidelines for future land-use planning and for improving public education and awareness in flood-prone areas.
- Article
(27795 KB) - Full-text XML
- BibTeX
- EndNote


Floods represent one of the most destructive natural phenomena in Europe, with estimates indicating that approximately 500 000 people are affected by flood events annually (European Environment Agency [EEA], 2020). In recent decades, floods have been responsible for over 60 % of the damage caused by natural events, with associated economic costs increasing significantly from around EUR 5 billion per year in the early 2000s to approximately EUR 12 billion from 2010 onwards (EEA, 2020). Among the most devastating events are the 2002 floods in Germany and the Czech Republic, the 2010 floods in Bulgaria and Romania, as well as the tragic 2021 floods in Belgium and Germany, which resulted in over 200 fatalities and billions of euros in damages (Jongman et al., 2014; EEA, 2021).
In response to the growing frequency of these events and their devastating impacts, the European Union adopted the Flood Directive 2007/60/EC, aimed at reducing flood risks. This directive requires Member States to identify vulnerable areas, develop flood risk maps, and establish flood risk management plans (European Parliament and Council, 2007). The Directive represented a key step towards proactive flood risk management, encouraging policies for prevention and adaptation to climate change, emphasising protecting people, the environment, and infrastructure (Barredo, 2009).
However, despite legislative and policy efforts, floods continue to cause significant damage. The recurrent flood events that affected the Italian territory in recent decades, highlights the need to further strengthen flood risk management by improving monitoring, forecasting, and intervention strategies at local and regional levels, in line with the objectives of Directive 2007/60/EC.
Analysing the conformation of the Italian territory from a physiographic point of view, it is not difficult to understand why this Country registers a large number of landslides and flooding events during intense storms each year. This is mainly because the Italian peninsula is elongated from North to South, it is northward bounded by the Alps and longitudinally crossed by the Apennines. This mountain ridge can easily reach 3000 m above sea level and the Alps, in some cases, can abundantly exceed even 4000 m. The configuration of the hydrographic network, together with the presence of obstacles along the rivers (hydraulic crossings such as undersized bridges, lifelines, footbridges, or piers and other obstacles in the riverbed) are some of the main elements that can predispose sudden meteorological events. During an intense storm, in fact, the fluvial stream eradicates tree trunks, branches, bushes, sediment and other material from the riverbed, accumulating it in the first “bottleneck” encountered along the way (often represented by undersized bridges). The anthropogenic crossings resist until critical pressures are exceeded, causing the failure of the barrier of material that served as a dam or, even, the collapse of the structure itself. This triggers the “dam break” effect, which causes all the water collected upstream of the obstruction to go downstream, giving rise to a “wall of water” (it is often described in this way by witnesses) as high as many meters pouring abruptly downstream, so much so that they are called “flash floods”.
The definition “hydro-geomoprhological hazard” used in the title refers to the interaction between geomorphological processes (such as landslides, erosion, and soil instability) and hydrologic-hydraulic dynamics (such as runoff and flooding).
The hydro-geomoprhological hazard increases if we consider that most of the anthropogenic settlements have developed right along the river floodplains, increasing the “exposure factor” to the point of potentially involving 6.8 million inhabitants living in flooding areas, more or less 11 % of the entire population (Trigila et al., 2021). This is mainly because, during the time, the river was deprived of its flood plain, which was firstly used for agricultural purposes and, in recent decades, for urban purposes (infrastructures, industrial areas, new urbanisation, shopping malls, etc.). Therefore, during a flood, rivers are not free to meander, dissipating their energy in an open land, but they employ their erosive potential, causing destruction along the entire watercourse. And this implies the need and the duty to manage the hydro-geomoprhological hazard.
The hydraulic hazard increases exponentially if we consider that anthropized (impervious) surfaces have increased from 2.7 % in the 1950s to 7.11 % in 2020 and, at the same time, the progressive abandonment of rural mountainous and hilly areas resulted in a neglect of the territory, increasingly deprived of its garrisons. Current climate change is also leading to an increase in the frequency of intense rainfall events and, consequently, an increase in the frequency of surface landslides, debris flows and flash floods (Trigila et al., 2021).
It starts from here, the need for a proper maintenance of waterways intervening, where it is impossible to delocalize, through cleaning riverbanks of vegetation and surface water regulation works. In the last decades, most of these actions were neglected or unacted, due to the gradual abandonment of cultivation and mountain areas (farmers used to be very good maintainers of the land), together with a widespread lack of attention by the deputed Administrations.
During the 15 September 2022 events, most of the rain fell in the mountainous interior territory of the region (mainly in Pesaro Urbino and Ancona provinces) and, in a few tens of minutes, it was channelled through the hydrographic network to the main watercourses, swelling hydrometric levels and causing scattered flooding along the entire river valleys. Unfortunately, in addition to bringing about two billion euros in damage to the anthropic heritage, this event also recorded the loss of thirteen human lives, fifty injuries and severe damage to cultural heritage (De Lucia et al., 2024). This exceptionally intense storm struck the Marche Region, with nearly 420 mm in ∼6 h in the most affected area, causing widespread landslides in mountain districts (Fig. 1), and valley-floor floods along the Metauro, Cesano, Misa and Esino River basins. The event's impacts were magnified by physiography and insufficient maintenance of both main and secondary channels and occurred in a region already hit by severe events.
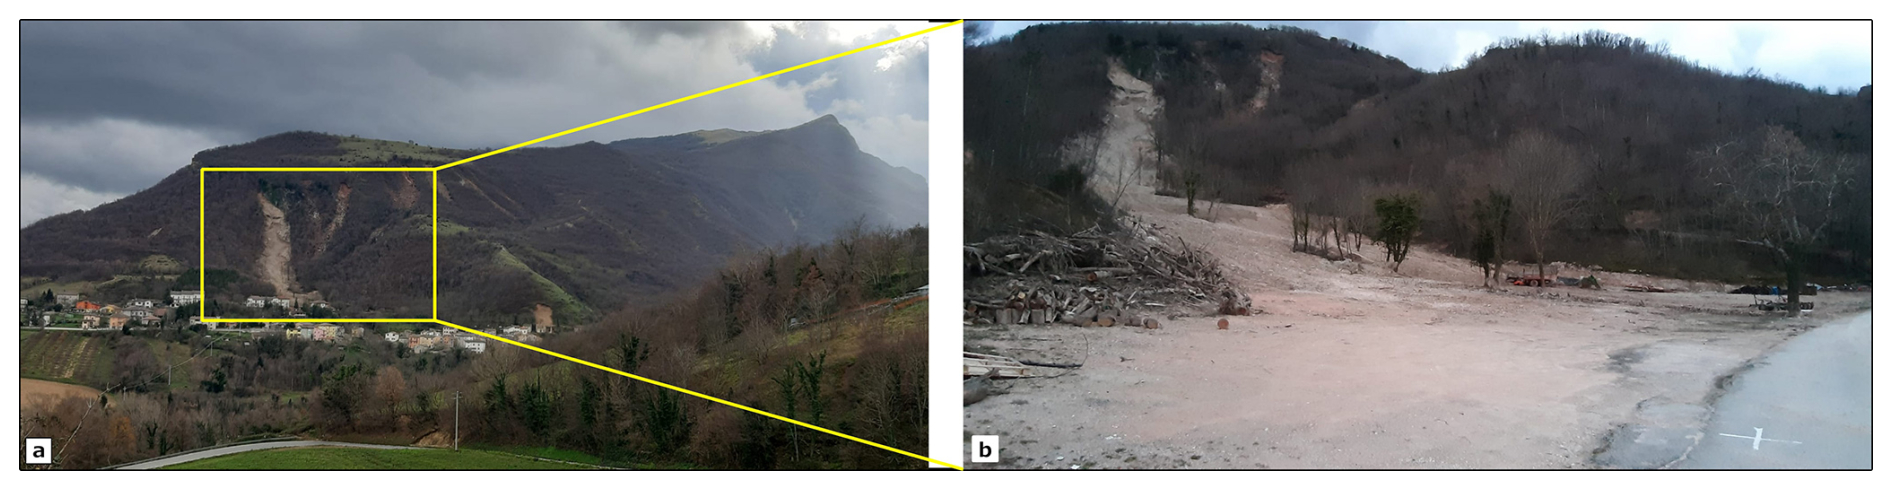
Figure 1(a) the scars of landslide events along the northern slopes of Mt. Calvello, activated during the rainfall event in question and involving the hamlet of Leccia, municipality of Serra Sant'Abbondio; (b) detail of the frame in picture (a).
The present study, in addition to providing a complete examination of the event, is based on geomorphological field surveys aimed at disaster analysis, by investigating the critical issues found along the main damaged watercourses and localities, differentiating between mountain and foothill environments. It is considered to have a great impact at the social level because it has been functional for mapping all the critical issues detected and for the subsequent proposals of intervention aimed at risk mitigation. It is furthermore an extraordinary example of synergy between institutions where the academic knowledge of geologists and engineers, enhanced by modern and innovative technologies, is made available for the territory and the society.
In particular, after this natural disaster, the geomorphology research group of the Geology Division of the University of Camerino conducted field surveys in many of the worst-hit sites to identify the main critical issues and suggest the most appropriate remedial interventions. The situations of hazard have been detected both in mountain and valley environments also using LiDAR images from UAV surveys and hydrologic-hydraulic numerical modelling for the prediction of the maximum flood discharge (and relative water depths) for different return periods. The magnitude of the event (intensity of precipitation, water discharge, debris and solid transport) and the subsequent impacts (more severe and extended than previous events in the same area), call for a radical change in current flood risk management practices (Dottori et al., 2024).
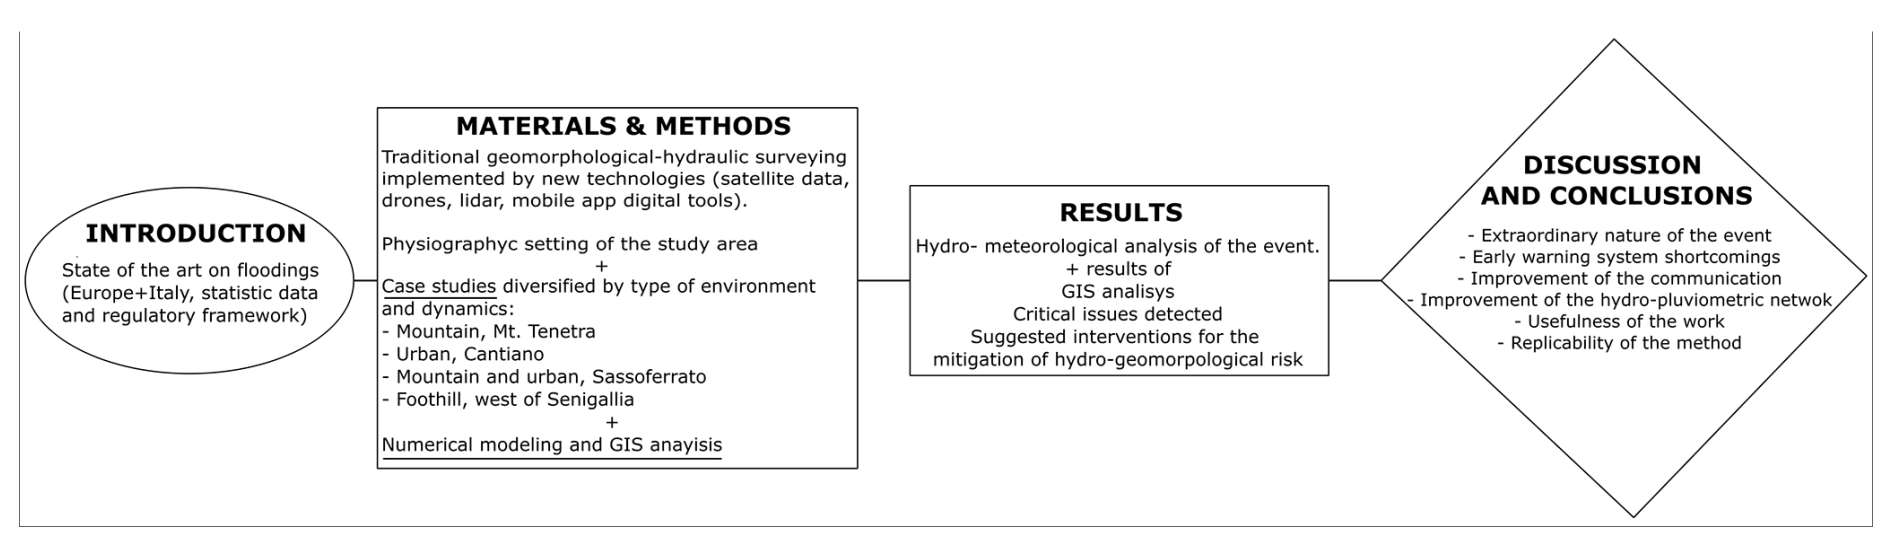
From the very moment this article was conceived, the intention was to address it extensively, presenting numerous case studies and offering a comprehensive overview of the event under consideration from multiple perspectives. Consequently, dealing with such a broad subject has not been an easy task. To guide the reader in understanding the structure of the article, Fig. 2 is provided.
The present work follows an agreement where the Marche Region Administration, through the Commissioner delegated by the National Government for the management of the Marche 2022 flood, conferred to the geology division of the University of Camerino and the civil engineering division of Marche Polytechnic University of Ancona studies to identify priority interventions to mitigate risk in flood-affected areas.
2.1 The flood event of 15 and 16 September 2022 in the Marche region of Italy
On 15 and 16 September 2022, after a long drought period, the Marche region was affected by a very intense self-healing thunderstorm, which mainly involved the provinces of Pesaro Urbino, Ancona and, on the following day and even if in a minor part, Macerata (CIMA, 2022). The extreme meteorological event of September 2022 in the Marche region has been extensively analyzed from a meteorological point of view (Civil Protection of the Marche region, 2022; Gentilucci et al., 2023; Torcasio et al., 2023), also considering the important contribution coming from the use of satellite data (Pulvirenti et al., 2023).
From a meteorological point of view, a convective system generated by low pressure over the Atlantic and high pressure over northern Africa resulted in the formation of a stationary, self-healing thunderstorm, as it transited from West to East over the north of the Tyrrhenian Sea (Gennari et al., 2023; Gentilucci et al., 2023). This typology of the storm is called “V-shaped” because of its geometry, well recognizable in plain view (Fig. 3). In general, V-shaped thunderstorms are not uncommon over Italy, especially in the summer (Torcasio et al., 2023) and not all V-shaped thunderstorms result in floods or flash floods, as their duration is short. However, when V-shaped thunderstorms are stationary for several hours over a specific area, they very often result in floods or flash floods (Federico et al., 2019). The vertex of the V-shaped (sting) is the point where the fresh new storm cells are continually regenerating, and it is there that the phenomena can take on an extraordinary character in terms of rainfall and lightning. Geographically, during the event, this position was the inner territory of the Marche region, between Pesaro Urbino and Ancona provinces. Comparing Figs. 3 and 9, in fact, it appears clear the superimposition between the location of the sting and the areas with the highest recorded rainfall.
The extreme meteorological event of September 2022 in the Marche region has been extensively analyzed from a meteorological point of view (Civil Protection of the Marche region, 2022; Gentilucci et al., 2023; Torcasio et al., 2023), also considering the important contribution coming from the use of satellite data (Pulvirenti et al., 2023).
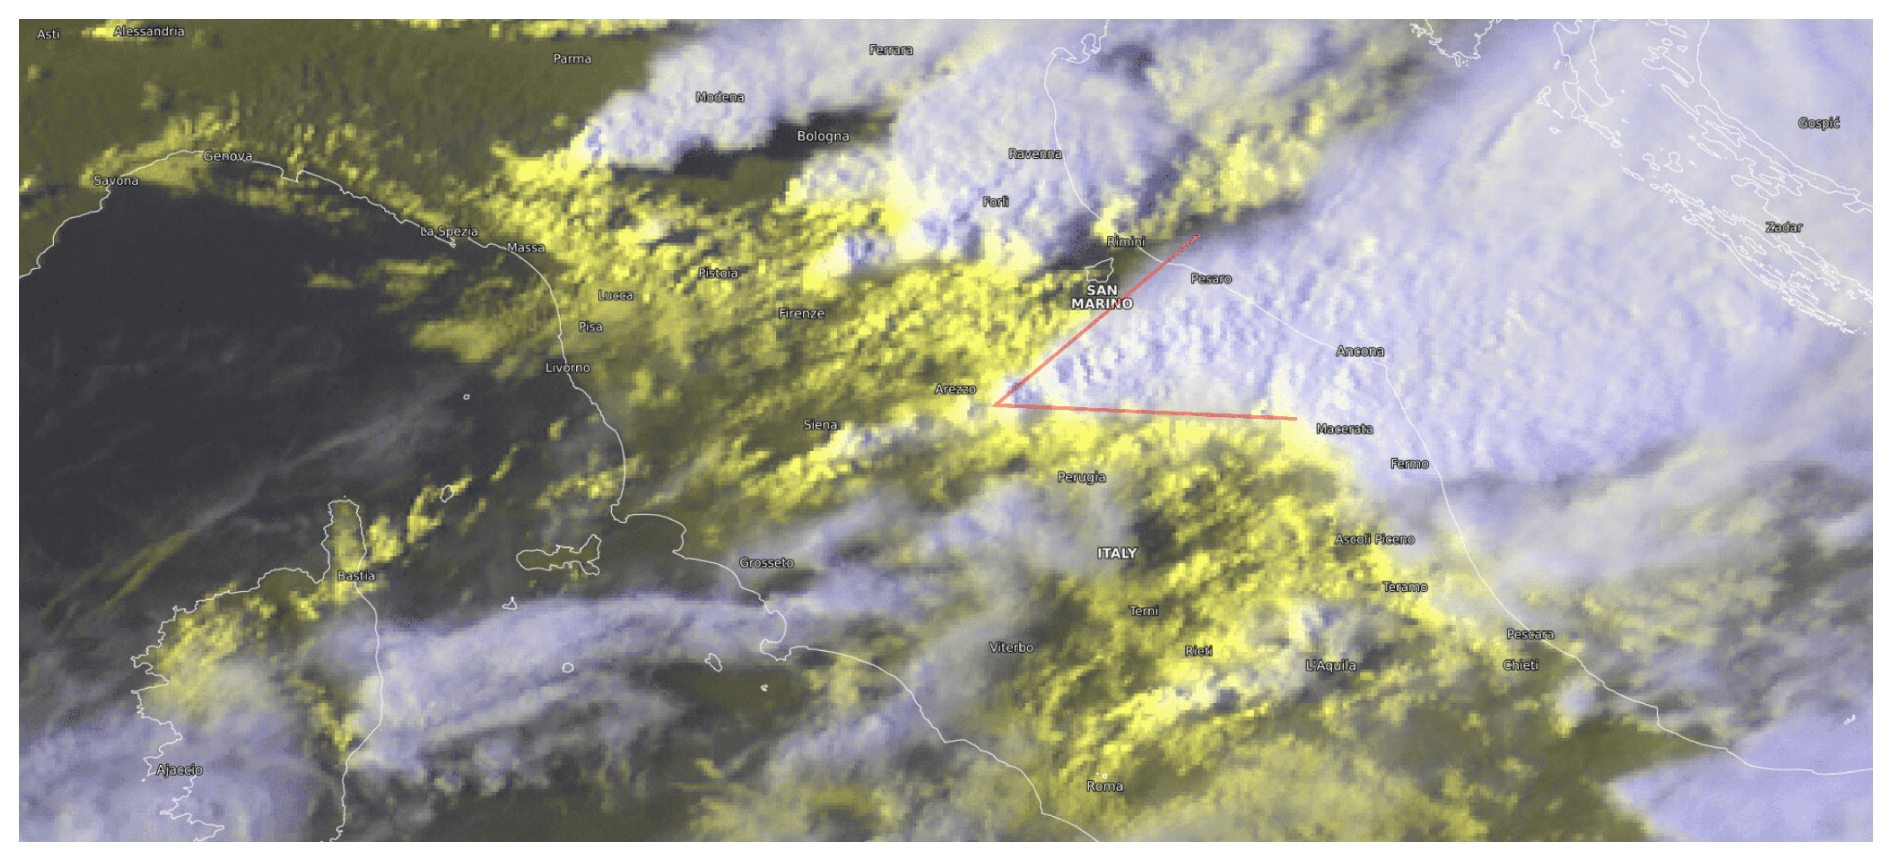
Figure 3The Central Italy satellite view of the thunderstorm at 03:00 pm UTC on 15 September 2022. MSG-SEVIRI HRV cloud composite with the characteristic and well-recognisable V-shape (drawn in red). Copyright Eumetsat. Image from https://view.eumetsat.int/productviewer?v=61314 (last access: 18 October 2024).
The magnitude of the event was so extraordinary that, on 16 September 2022, through two resolutions, the Council of Ministers of the Italian Republic declared a “state of emergency”, a legal status that can be enacted by the national Government after the occurrence or in the imminence of exceptional events, such as floods.
2.2 Geomorphological setting
The Marche region exhibits a distinctive physiographic setting (Fig. 4), following an Apenninic N/NW–S/SE trend, because it reflects the main tectonic lineaments that acted in the landscape. The territory is characterised by an internal, western portion constituted mainly by calcareous and marly rocks and a higher elevation, the Apennine ridge. Moving away from the mountainous sector, elevations progressively decrease eastward, reaching the terrigenous peri-Adriatic area, which is characterised by predominantly hilly landforms and mostly low-lying coastlines. The dominant direction of the watercourses is from west to east, up to the Adriatic Sea, with a comb-like arrangement orthogonal to the structure.
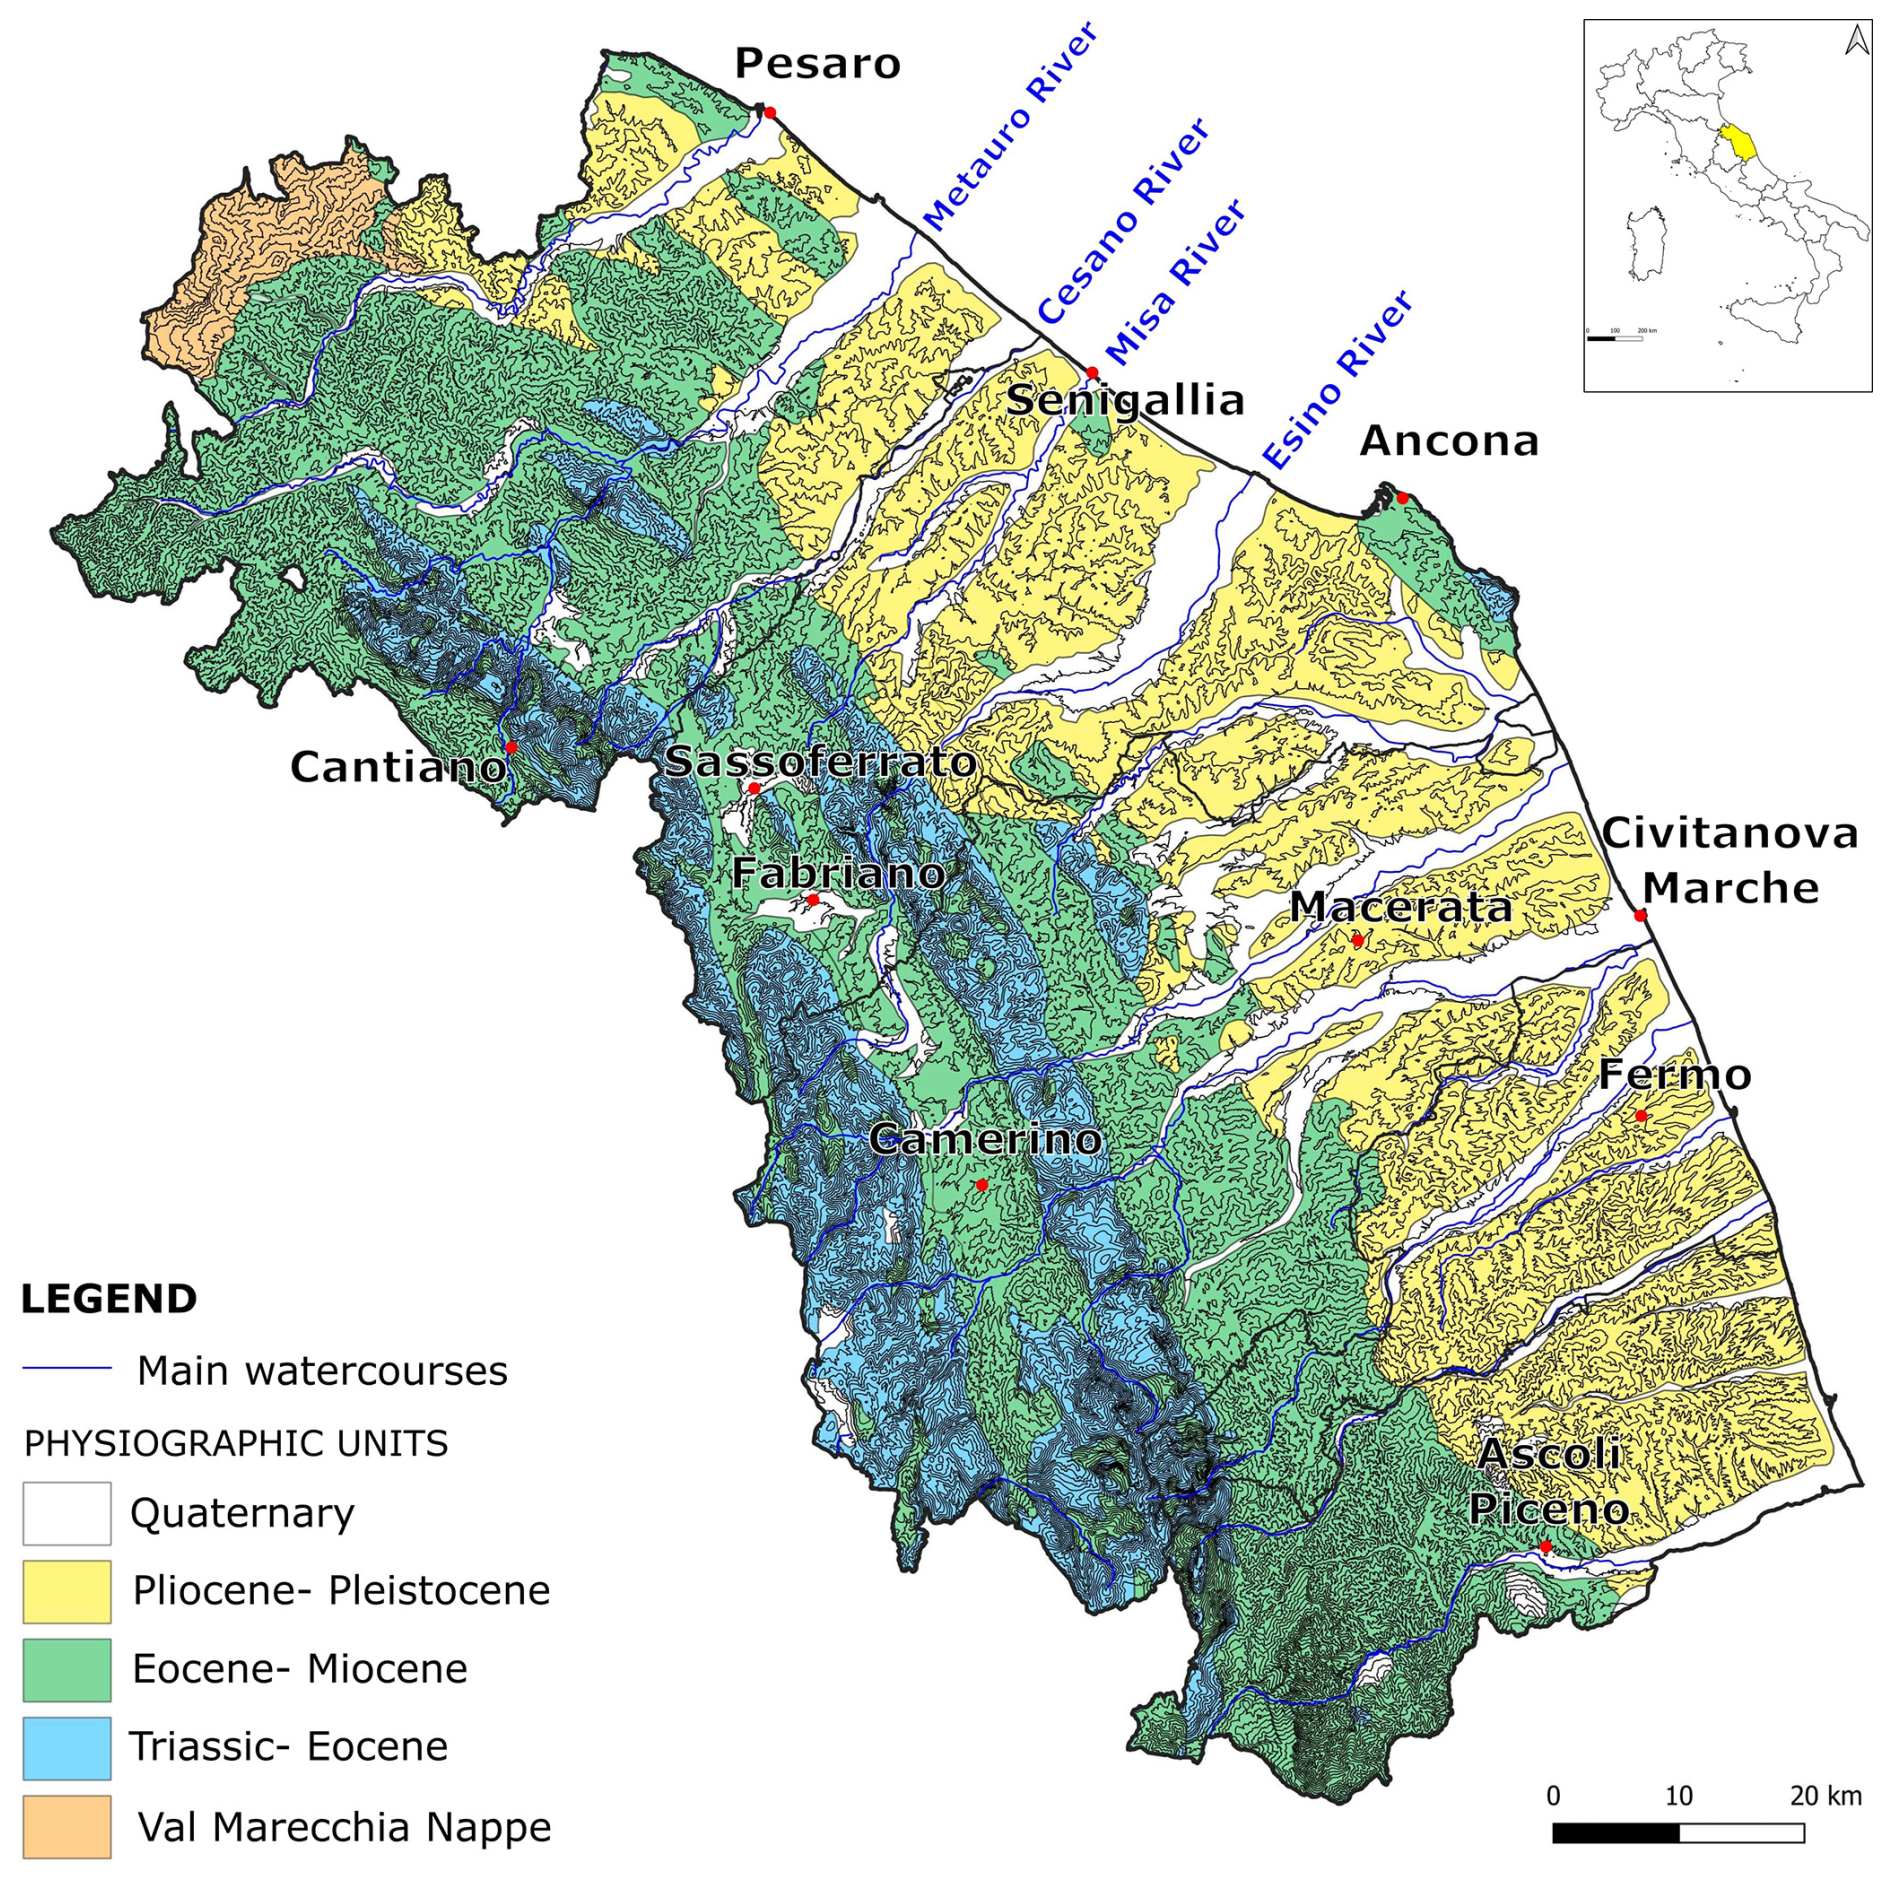
Figure 4Physiographic setting of the Marche region (Farabollini and Bendia, 2022, modified) with elevation contour lines, main watercourses, and provincial boundaries. Cartographic layers from Regione Marche, 2024.
As mentioned before, the study was conducted in some test areas, which include some of the inhabited centres most severely affected by the flood event: Cantiano, Cagli, Serra Sant'Abbondio, Pergola, Sassoferrato, Serra de' Conti, Ostra and Senigallia. The hydrographic basins involved were those of Metauro, Cesano, Misa, Esino and Potenza Rivers, although the last (southern) one was affected to a lesser extent (Fig. 5).
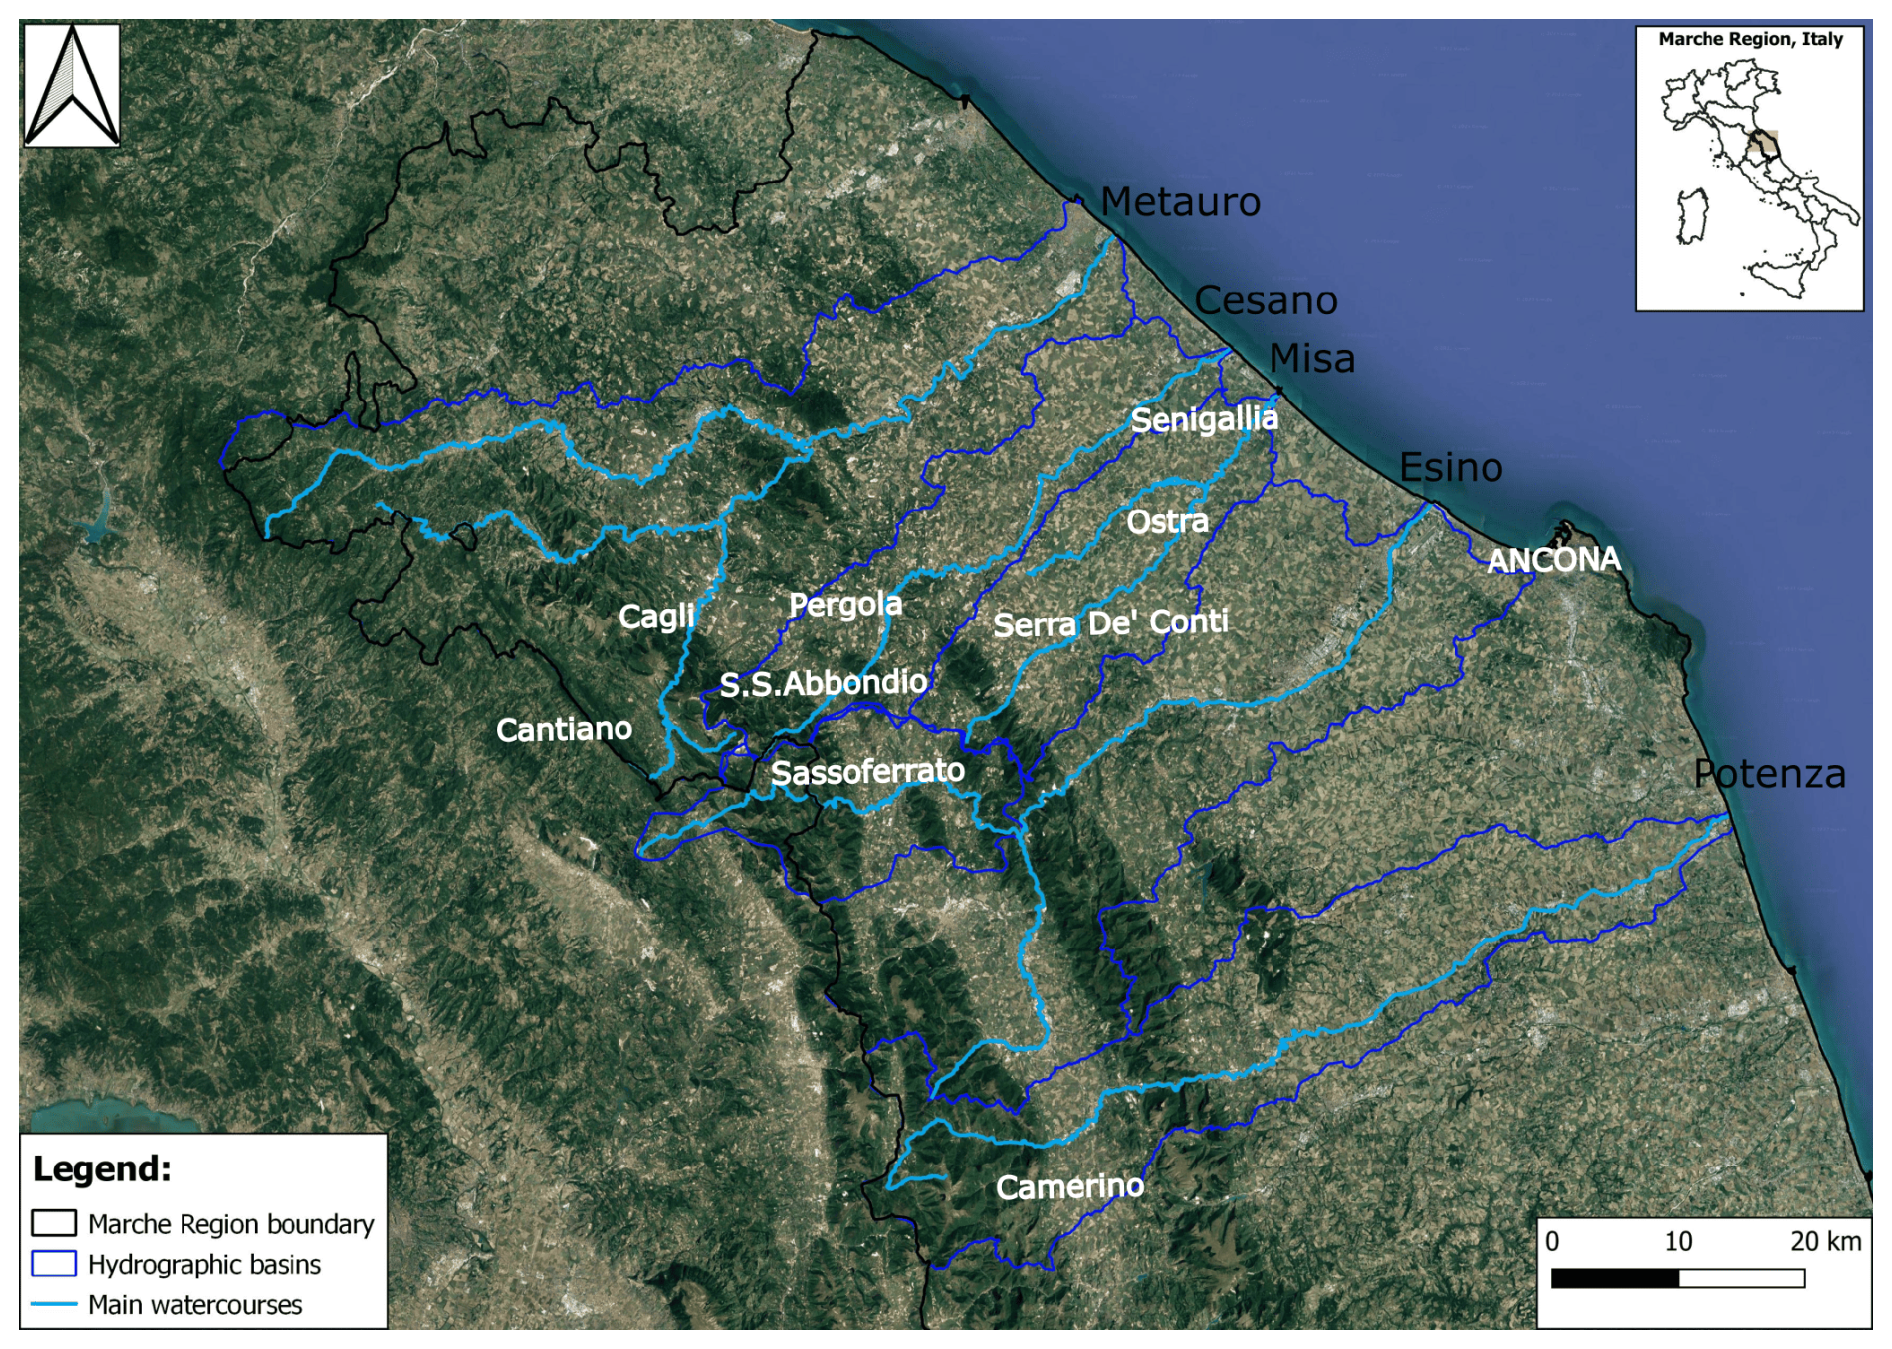
Figure 5The northern portion of the Marche Region with the hydrographic basins involved by the flood and the names of the main localities named in the article. Cartographic layers from Regione Marche, 2024.
Below, the main geomorphological characteristics of the four case studies analysed are summarised. A large number of areas were investigated. To illustrate the most representative issues, the selected case studies were chosen based on the morphological characteristics of the environments involved, the urban context, and the hydraulic response of the territories.
Case study 1 (mountain context): the Mt. Tenetra River valley (Cantiano)
Tenetra River valley (Fig. 6) is about 1500 m long and is represented by a narrow valley located around an altitude of 430 m a.s.l. elongated in a N/NE-S/SW direction and bordered to the northeast by the morphological amphitheatre of Mount Tenetra (1242 m above sea level) with a still debated morphogenesis. It is not excluded that the area was influenced in the past by glacial processes, as mentioned in the bibliography (Savelli et al., 1995; Valentini et al., 2023), which were later intensified and amplified by karstification and other erosional phenomena, resulting in the suggestive landscape forms visible today. The southwestern foothill of the hydrographic basin ends, valley-side, with two distinctive morphological structures called flatirons of Pontedazzo and Mt. Alto. The steep slopes of these elements, inherited from the interaction between the stratigraphic-structural setting and the erosive processes that acted above it, end up imposing rocky buttresses on either side of the ditch, which therefore sees its section drastically reduced near the hamlet of Tenetra. At the historic centre of Cantiano, the water lineament converges to the Bevano Creek and then both flow into the Burano River. The extent of the Tenetra valley is variable, with a width of around 20–30 m in the upstream section and up to 140 m in the intermediate section, which has large and cultivated areas.
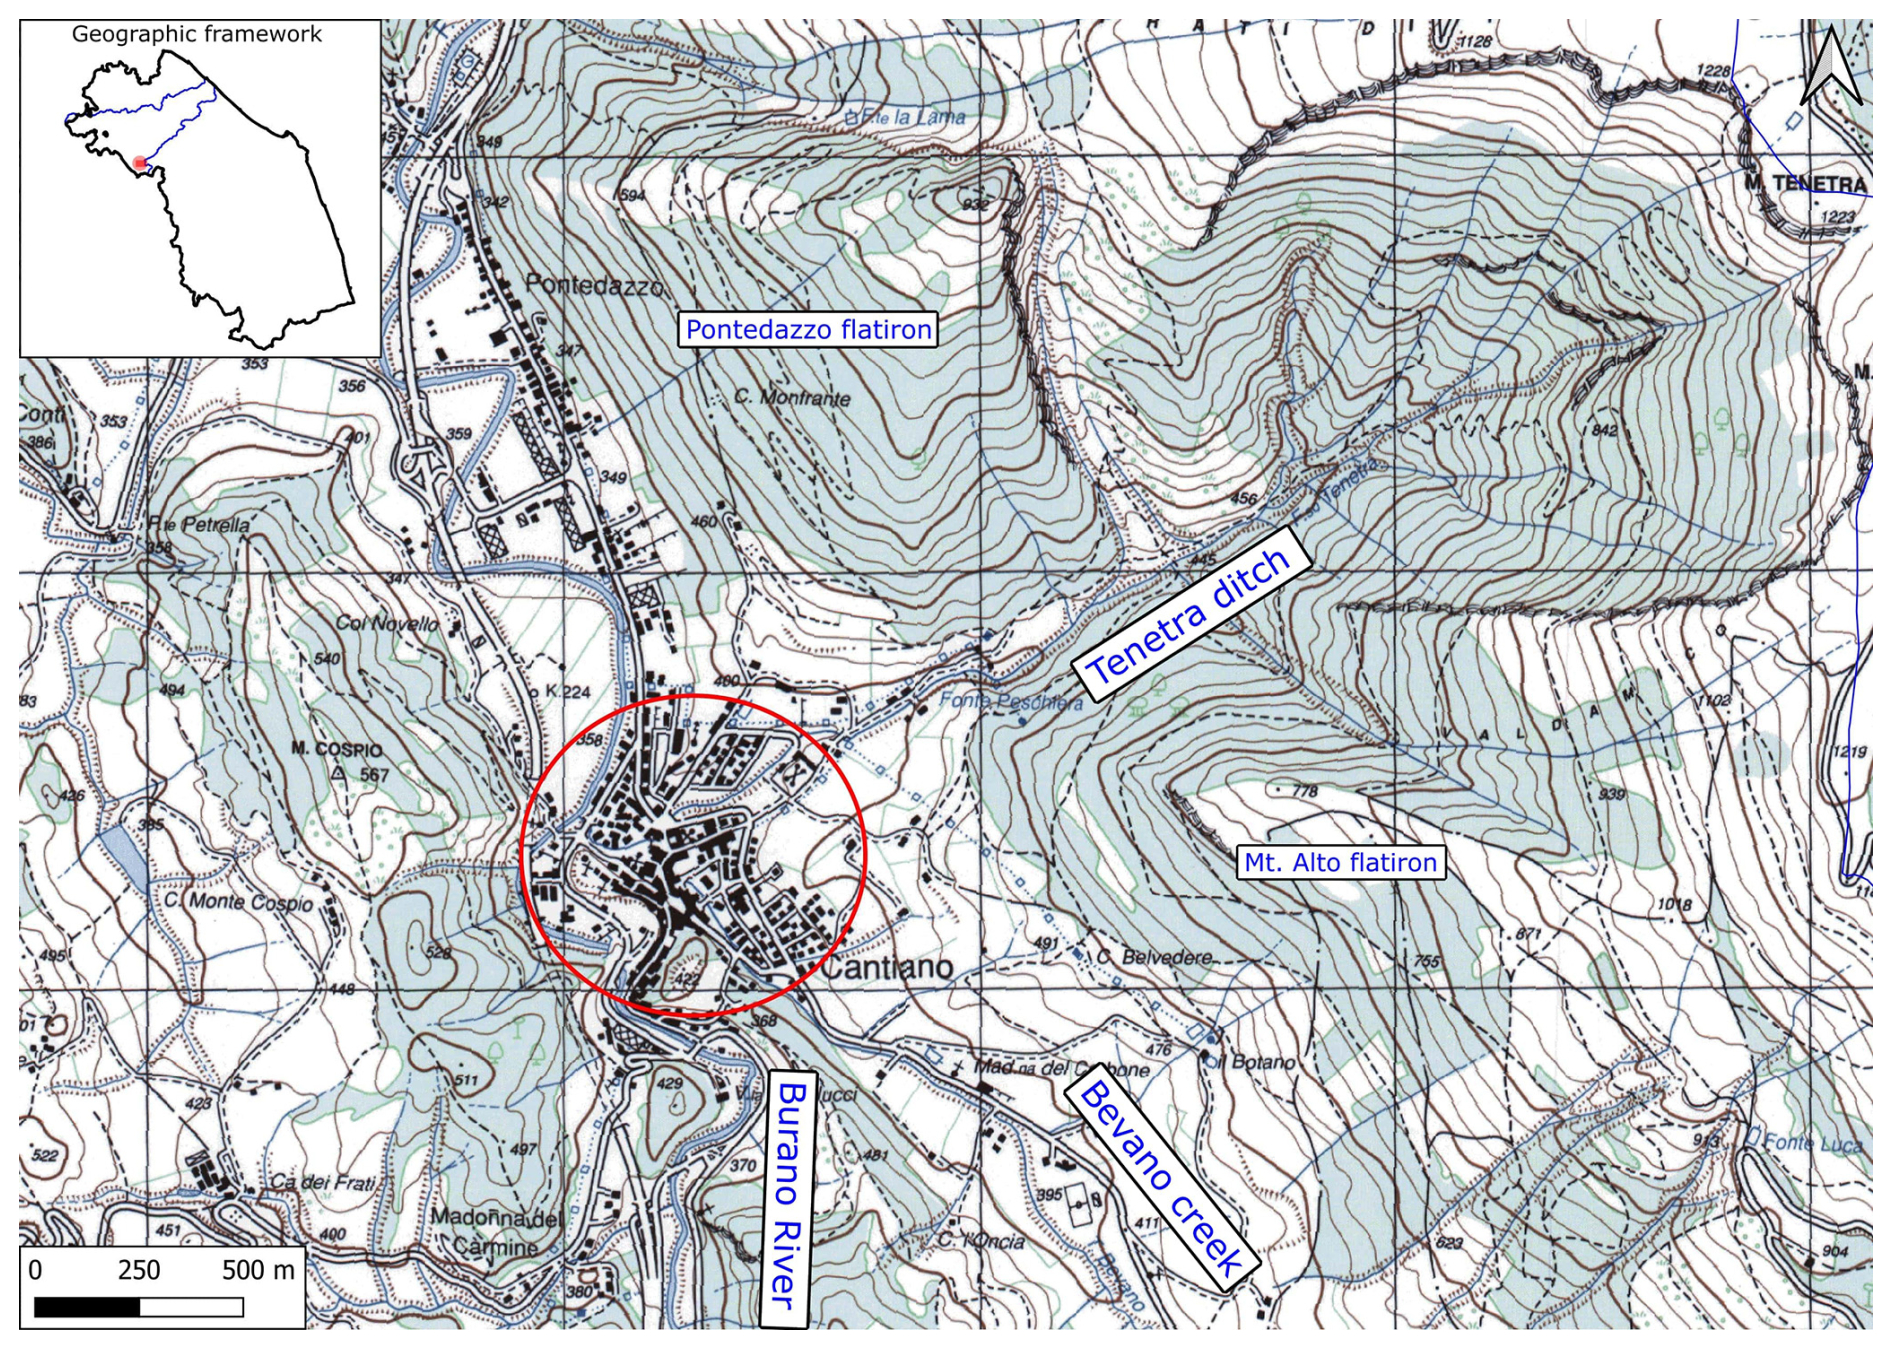
Figure 6Topographic map of the town of Cantiano (IGM 1:25 000) with the well-recognisable form of Mt. Tenetra amphitheatre and the three main watercourses. In the extent rectangle, the Marche region, the hydrographic basin of the Metauro River in blue and the town of Cantiano in red. Cartographic layers from Regione Marche, 2024.
Case study 2 (urban context): the historical centre of Cantiano
The town of Cantiano is in the north-western portion of the Marche region, along an alluvial plain situated at an altitude of around 360 m pennine watercourse with a predominantly torrential behaviour. From a hydrographic point of view, the town of Cantiano falls along a narrow alluvial valley interposed in the Miocene Umbria-Marche ridge of the northern Apennines and the town precisely falls at the confluence of three watercourses: Burano River comes from the South and in the historic city centre, it receives important water inputs from Bevano and Tenetra streams, respectively coming from SE and E (Fig. 6). Among the three watercourses, the Tenetra stream was the only one that did not overflow during the flood event analyzed in this study. Bevano and Tenetra watercourses show a mostly straight direction, with confluences of tributaries often orthogonal to them. These characters indicate a strong control by the litho-structural setting over the hydrographic network, able to condition its flow. The geomorphological setting conditioned the main drainage axis.
Case study 3 (mountain and urban context): Sassoferrato
Another explanatory example relating to the urban fabric response during flood events is represented by the situation of Sassoferrato, located in the inner portion of the Marche region along an intra-Apennine valley, bounded by reliefs with elevations reaching more than 1300 m. The study area is contained within the catchment area of the Sanguerone Stream, and it can be distinguished into two different portions: a hilly-mountainous and an urban one. The first critical situation encountered, starting from the mountainside, is represented by Monterosso Stazione, a hamlet of Sassoferrato, where the Sanguerone Stream flows at around 380 m altitude. The stream in this mountainous section presents a rather regular direction, partly because it flows embedded within the geological Formations it crosses.
The valley is quite wide for a mountain environment, with an amplitude of even hundreds of meters, mainly thanks to its sharing with other streams, factors that undoubtedly acted to concentrate runoff in this area. About seven kilometres downstream of Monterosso Stazione, the Sanguerone Stream reaches the town of Sassoferrato, where it flows between 280 and 290 m above sea level with an approximately N-S direction. Upstream of the confluence with the Sentino Creek, the Sanguerone Valley presents a rather curvilinear course, with a variable width of about 30–50 linear meters. This amplitude is drastically reduced when the watercourse meets the Garibaldi Street Bridge, which therefore acts as a bottleneck.
Case study 4 (foothill context): the western suburbs of Senigallia
The area is close to the Adriatic coastline and, from a topographic point of view, is almost exclusively flat, as it is the floodable area of the Nevola and Misa Rivers. Its catchment area covers a surface of 384 km2, ranging from a minimum height close to sea level to a maximum height of 750 m a.s.l. in the Apennine zone (Corti et al., 2024). The floodplain is consistently and abundantly more than one kilometre wide in the downstream portion, near the abovementioned confluence. The territory is extensively urbanised, with large portions of the hamlets of Pianello and Casine (municipality of Ostra), Brugnetto (Trecastelli and Senigallia) and Bettolelle (Senigallia) falling within the flood plain (Fig. 22) and that was, therefore, completely inundated. In the past, floods came very frequently in Senigallia. For this reason, over the years, the farmers built artificial embankments along the Misa River to protect field crops and livestock. At the same time, the municipal administrations built the so-called “cavo Penna”, an artificial channel which flowed below the actual IV November Street and reached the sea, where today there is the famous roundabout. The Penna channel was a sort of drainage ditch designed to protect the town from floodings. Around 1920, after completing all the earthen embankments in the countryside and building the masonry embankments in the city, they decided to bar and fill the channel and urbanise the area above it abundantly (Fig. 7).
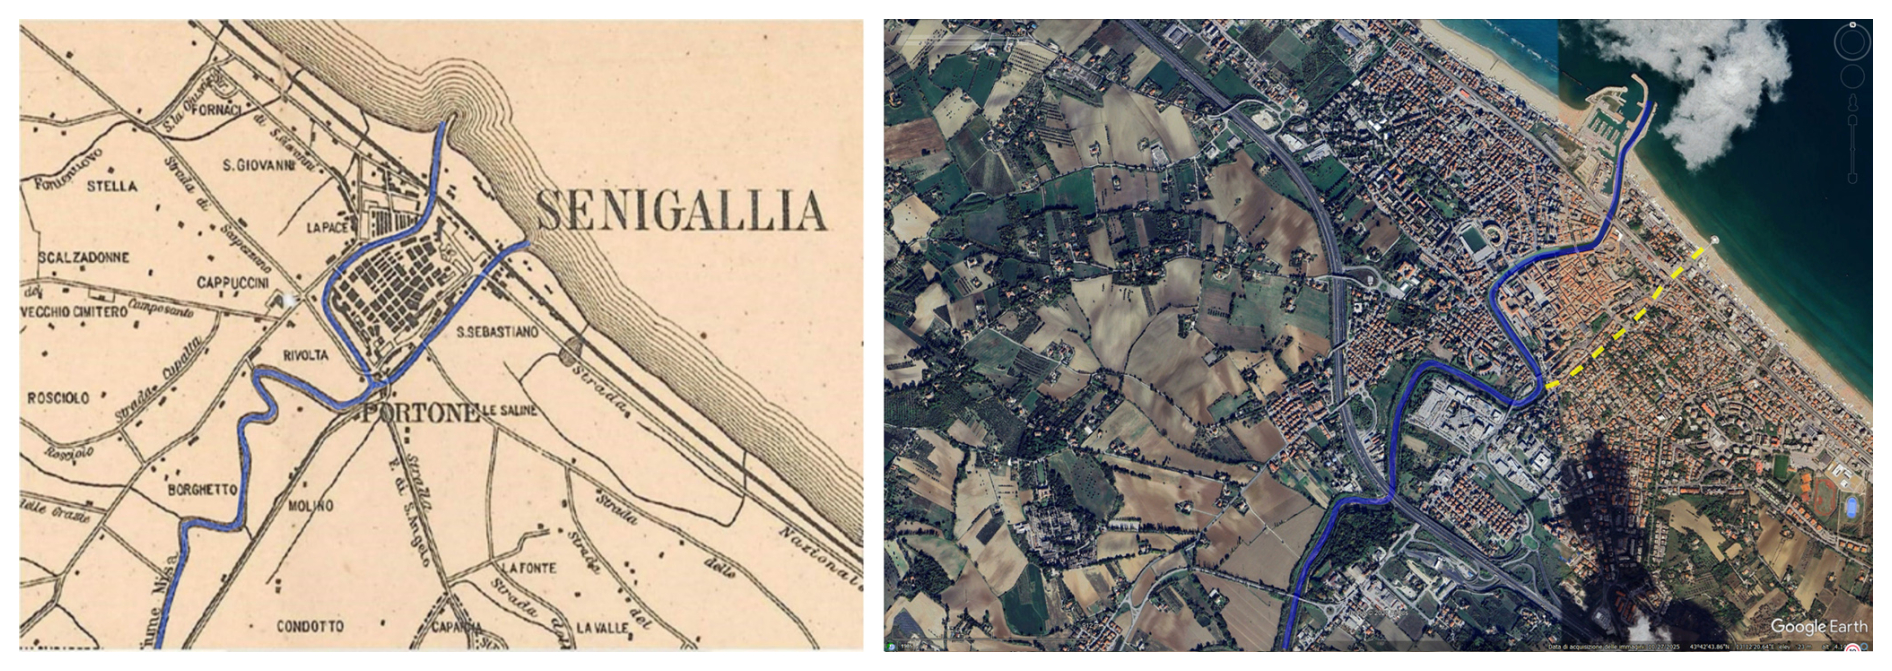
Figure 7The comparison between the Misa River, highlighted in blue near Senigallia in an ancient map of 1889 (Santoni and Morici, 2021) on the left and in a image of 2025 on the right (Map data © 2025 Google maps), with the preexisting “Penna channel” dashed in yellow, subsequently occluded about a century ago.
2.3 GIS analysis and flood impact along the main river valley
One of the first parts of this work consisted of a bibliographic and cartographic recognition, the latter conducted through the predisposition of a Geographic Information System (GIS) database, where all the cartographic elements considered useful were collected such as: the topographic map of Istituto Geografico Militare “IGM” (scale 1:25 000), the Regional Technical Map (C.T.R.) of the Marche Region (scale 1:10 000), a detailed municipal topographic map (scale 1:2000), geological and geomorphological cartographies (CARG project, scale 1:10 000), maps of hydrogeological and hydraulic hazard and risk (“Piano di Assetto Idrogeologico”, P.A.I.), cartographies of geomorphological hazard “Italian Landslide Inventory (IFFI)”, the Archive of Italian Vulnerated Areas (A.V.I.), historical images retrieved from archives online, the Gregorian historical cadastre (year 1835) to understand the hydrographic network modification interventions conducted in the past, Satellite data of post-event (Copernicus Emergency Management Service, n.a.), LIDaR Digital Elevation Models acquired through drone surveys and post-event cartographies drawn up by the technical offices of the interested municipalities and Civil Protection.
All this information was catalogued in a GIS database, useful in supporting the indispensable on-field geomorphological surveys. All the findings were subsequently implemented using the technical innovations provided by new instruments and software, such as drones, lidar, QGIS software, the QField mobile app, and numerical models for hydrologic and hydraulic predictions, including HEC-HMS and HEC-RAS.
The availability of satellite data from the Copernicus European project was acquired during and in the immediate aftermath of the event (Fig. 8). This project produced for each locality a map capable of investigating and defining the extent of the phenomenon. These remote sensing techniques, in addition to being useful to geologists in defining the flooded area immediately, can be considered essential in real time to provide Civil Protection with an idea of the extent of the event and to direct relief efforts to the most damaged areas, taking into account the expected level of damage and people involved.
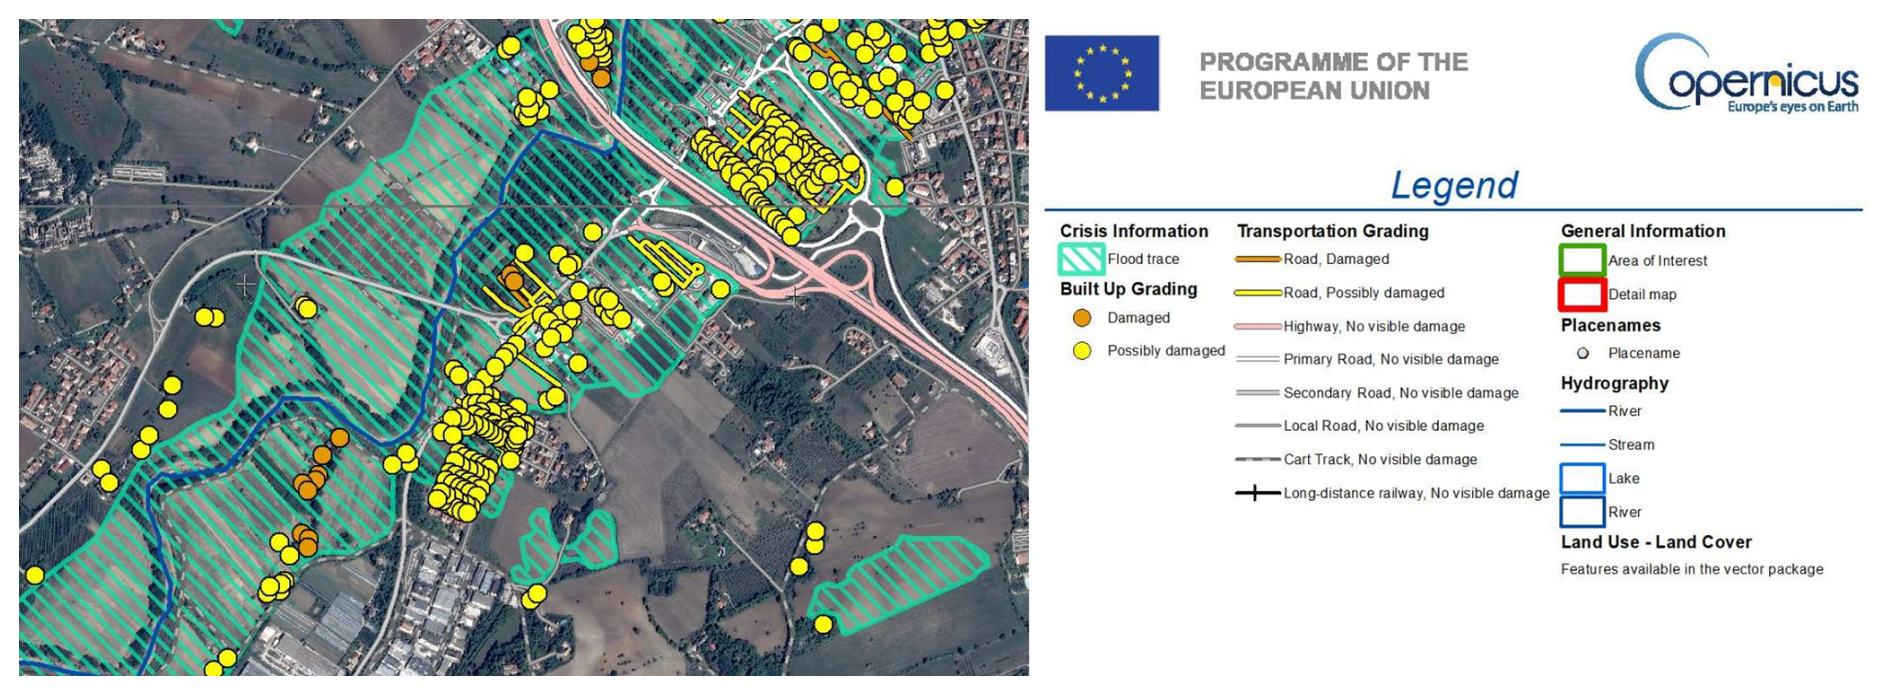
Figure 8An excerpt, modified, of Copernicus satellite mapping in the immediate aftermath of the Marche floods, with the well-recognisable flood trace and the damaged and possibly damaged buildings. South-West of Senigallia. Original image from https://mapping.emergency.copernicus.eu/activations/EMSR634/ (last access: 16 December 2024).
2.4 Hydrologic-hydraulic modelling with HEC-HMS and HEC RAS
The precipitation data collected relating to the actual event and those derived from the analysis of historical rainfall series were initially used, as mentioned, within the HEC-HMS software to define the maximum flood discharge for different hazard scenarios. More specifically, the data were used to attempt to reproduce the 2022 event (calibrated where possible with hydrometric data collected at the Bettolelle and Ponte Garibaldi stations along the final stretch of the Misa River) and to evaluate the maximum flood discharge for 100- and 200-year return periods. These scenarios are used by the Civil Protection Agency of the Marche Region to define the boundaries of areas at high hydraulic hazard.
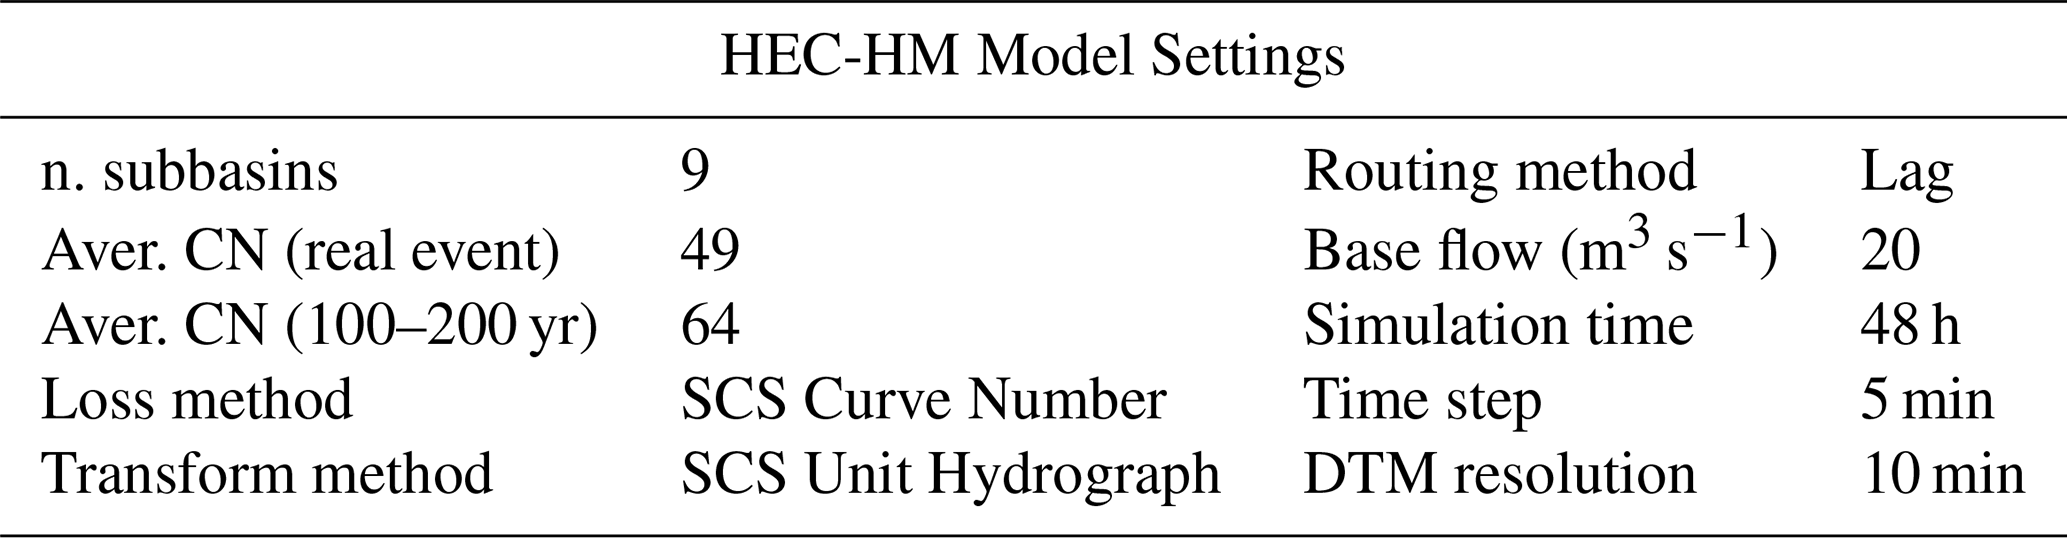
The watershed and stream network schematization in HEC-HMS was developed using a 10 m resolution DTM, freely downloadable from the link https://doi.org/10.13127/tinitaly/1.1 (Tarquini et al., 2023). This DTM was used to calculate basin slope, drainage area, watershed delineation, and all other geometric parameters required by the software. The basin model estimated excess rainfall using the SCS Curve Number (CN) method, which relates cumulative precipitation, land cover/land use, hydrologic soil group, and antecedent moisture conditions (AMCs). The required inputs are CN and the percentage of impervious area, and the software updates infiltration at each time step to compute incremental effective rainfall during the storm. Land-use information was obtained from the Corine Land Cover 2018 database (level 3), while soil groups were derived from the Pedological Provinces Map of the Marche region (1:250 000) and previous flood-risk studies by the authors (Aringoli et al., 2013; Farabollini and Materazzi, 2014; Bufalini et al., 2019). The CN value was calculated from USDA tables while runoff in each subbasin was transformed into discharge using the SCS Unit Hydrograph method, maintaining the default 37.5 % pre-peak runoff fraction. A constant baseflow of 20 m3 s−1 was set based on the reference gauging station. Flood-wave propagation along river reaches was then modelled with Lag routing, which represents translation only (no attenuation), suitable for short reaches with relatively stable travel times; the lag parameter was estimated from the concentration time calculated with the Kirpich formula (Kirpich, 1940).
For the hydraulic model using HEC-RAS, a high-resolution Digital Surface Model (DSM) with a 0.05 m ground sample distance (GSD) was produced as an initial step from the Lidar survey. A 0.3 m Digital Terrain Model (DTM) was then obtained by applying GIS-based filtering procedures. The terrain description was further refined by incorporating land-use information from the Corine Land Cover (CLC) 2018 dataset (level 3) for both the river corridor (channel and banks) and the adjacent floodplain. These land-use classes were used to map the spatial variability of surface roughness (Manning's coefficient), assign imperviousness percentages in HEC-RAS, and derive infiltration parameters using the SCS Curve Number approach. After defining the terrain inputs, the computational grid was set up. HEC-RAS 2D uses a finite-volume solver that can operate with either structured or unstructured meshes. A 2D flow-area polygon was first delineated to establish the limits of the simulation domain. This domain covers approximately 26.1 km2 and includes a broad section of the alluvial plain on both sides of the river over roughly 4.2 km of the Misa River. The mesh was generated using 10 m cells across the entire area, with local refinement to 2 m cells along the main channel and at tributary junctions, resulting in a total of 179 853 computational cells.
A summary of the parameters and procedures used to create both the hydrologic and hydraulic models can be found in Table 1.
Table 1Summary table with all the parameters and settings used in the hydrologic simulation.
3.1 Hydrologic analysis of the event
From the regional rainfall map (Fig. 9), it is possible to recognize the areas most affected by rain during the meteorological event, such as the western Apennines area of the province of Pesaro Urbino and a large portion of Ancona province.
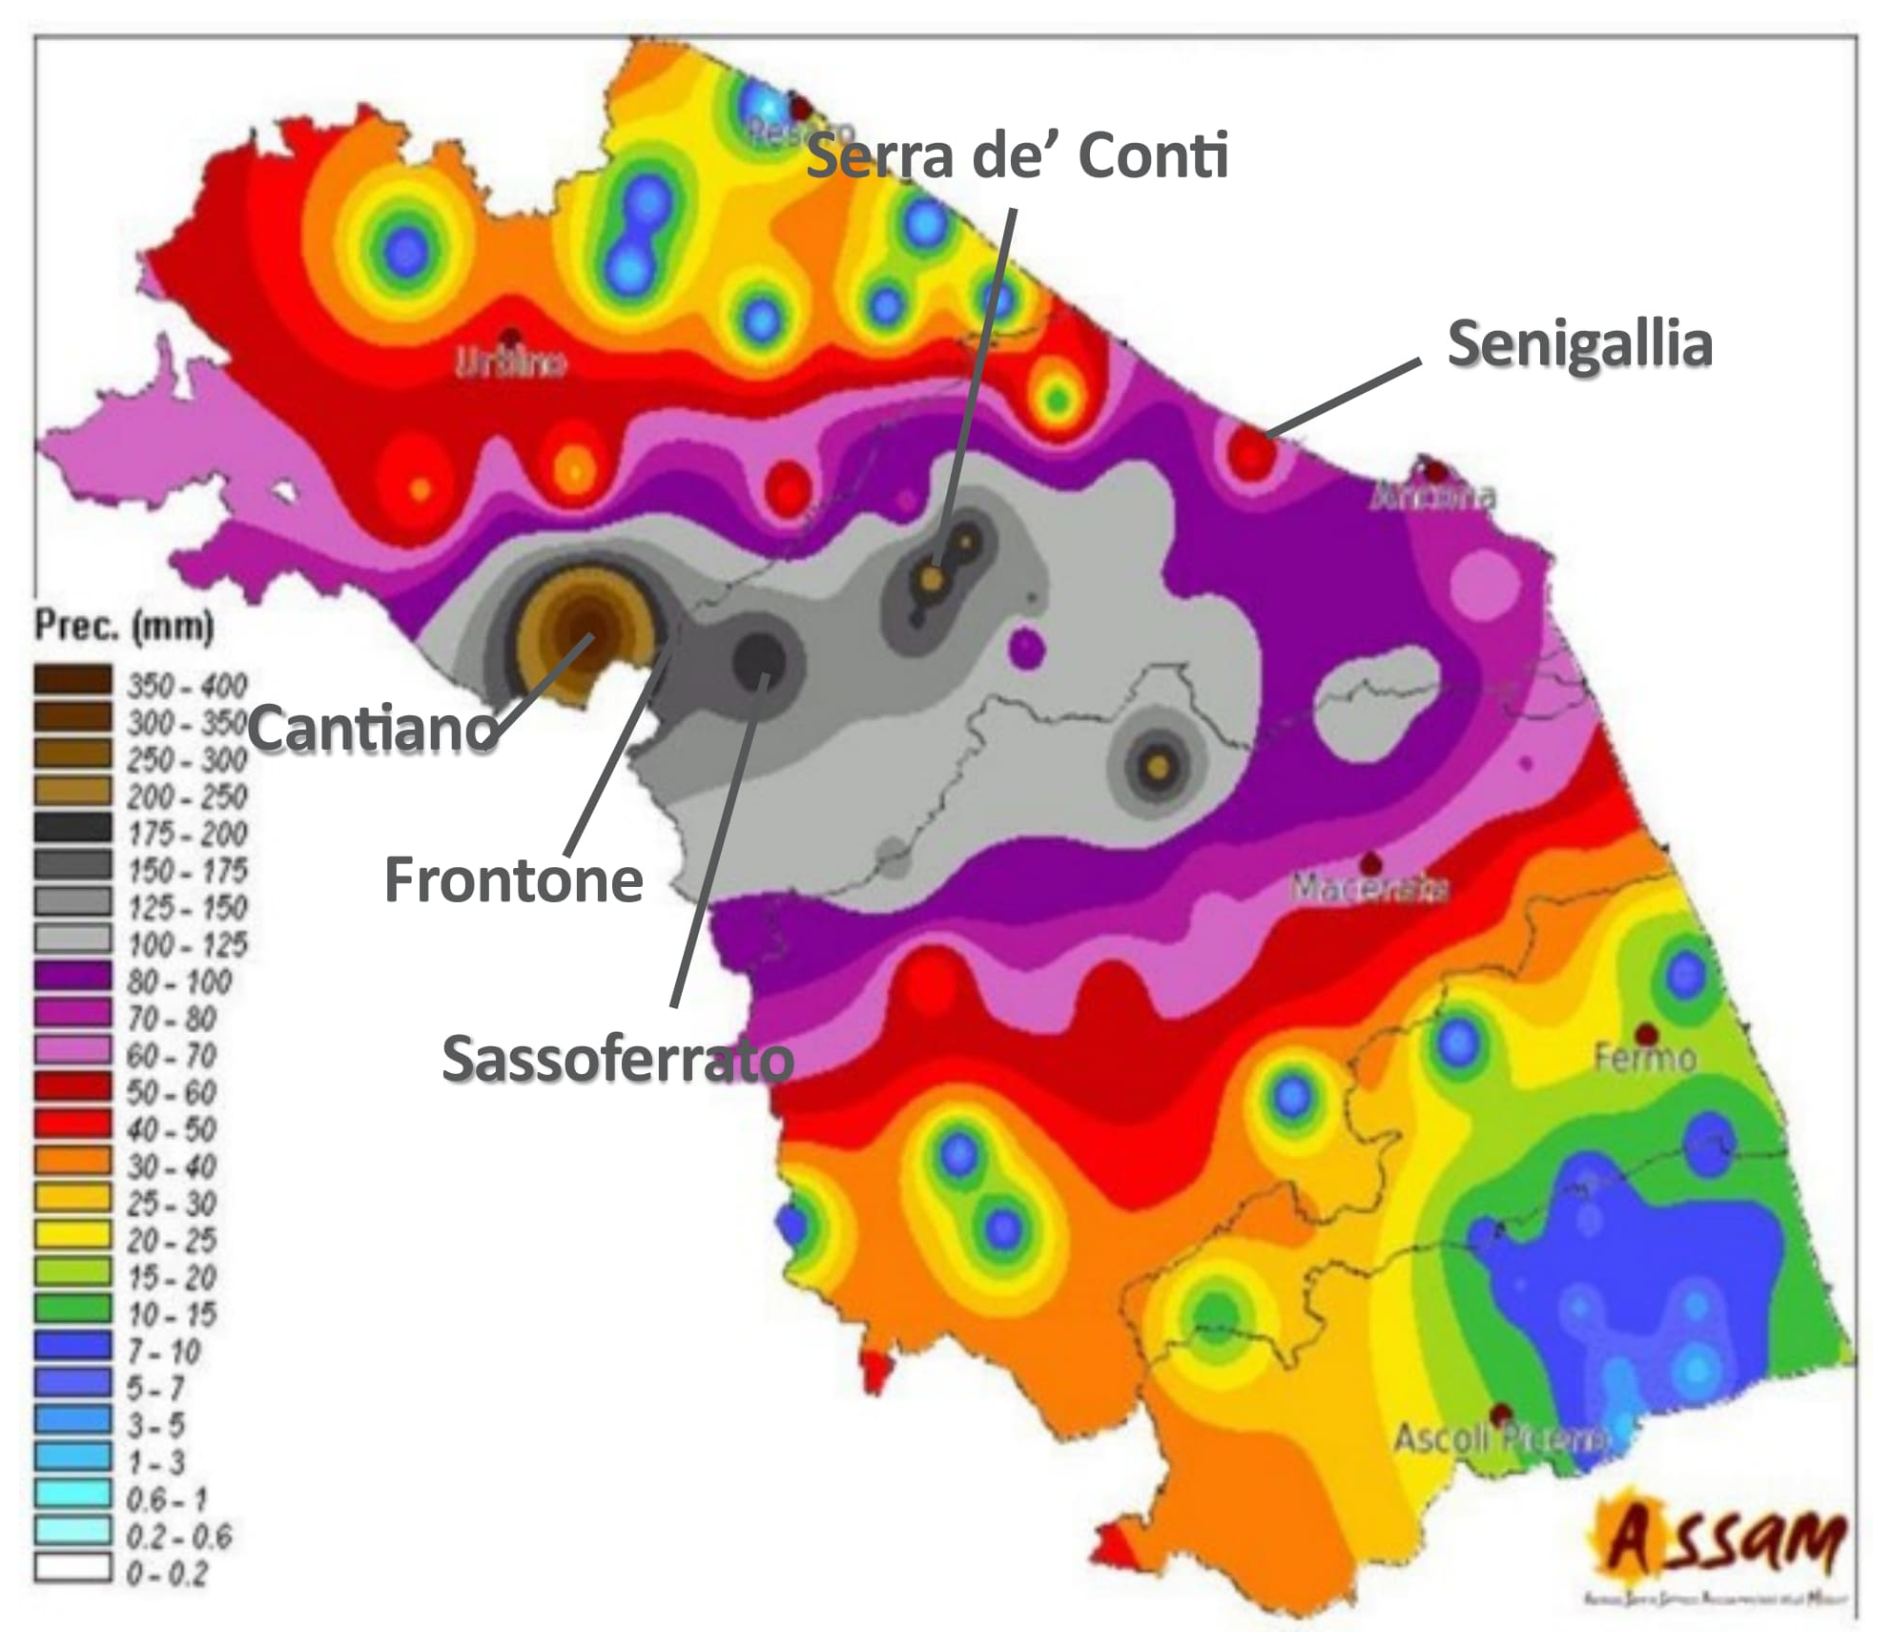
Figure 9Cumulative rainfall distribution during the entire day of 15 September 2022 in the Marche region, modified, indicating the most represented localities treated in this work (Regional Agro- meteorological Service of AMAP Regione Marche, 2022; modified).
It should be noted that this work is based on cumulative rainfall data acquired through different regional agencies responsible for data acquisition, named SIRMIP, 2022 and the Regional Agro- meteorological Service of AMAP Regione Marche, 2022. SIRMIP is the acronym of “Sistema Informativo Regionale Meteo- Idro- Pluviometrico”, it means the regional meteorological- hydro- pluviometric information system. Important pluviometric differences were noted in the towns of Sassoferrato and Arcevia. The most representative stations for this analysis were considered and collected (Table 2) for the sake of the record.
Table 2Comparison of cumulative rainfall between different regional agencies responsible for data acquisition.
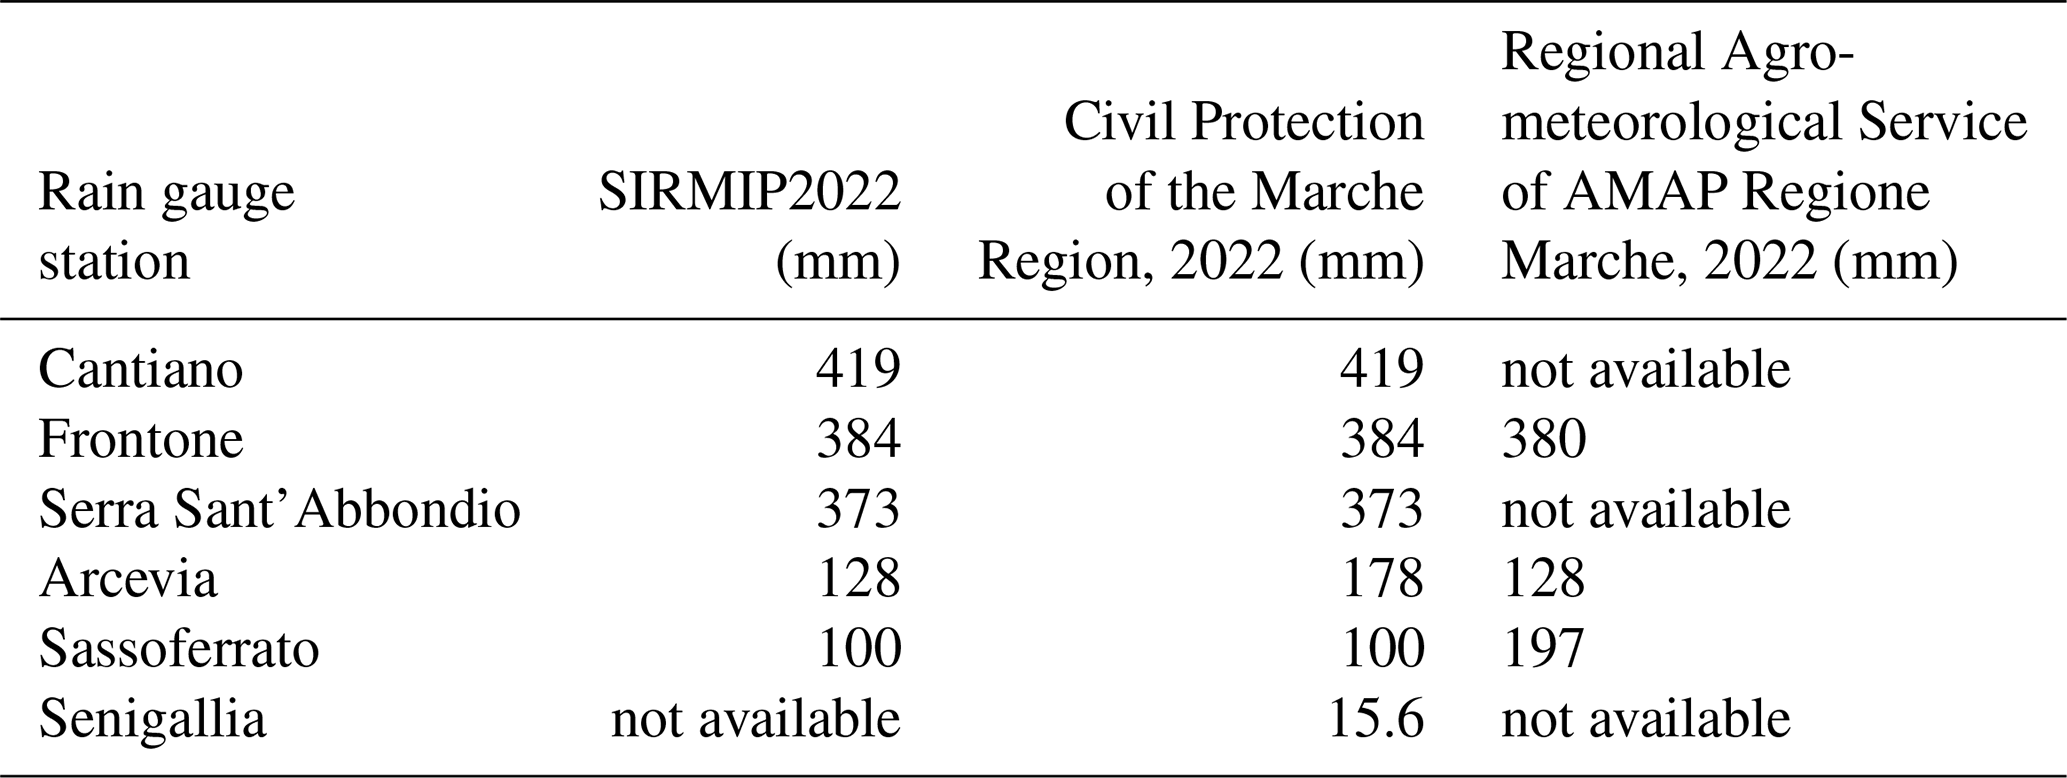
According to our analysis, the discrepancies between the two sets of data may be due to the presence of two different rainfall station networks with different coordinates and elevations and, sometimes, with two different rain gauge installation methodologies. For example, the town of Sassoferrato has three rainfall sensors, two of the SIRMIP pluviometric network (sensors no. 2073 and no. 2992) and one of AMAP (sensor ST59). Rainfall sensor no. 2073 did not work during the event. Rain gauge sensor no. 2992 recorded a cumulative rainfall of 100.4 mm and AMAP recorded a cumulative rainfall of 197 mm from 03:00 to 11:00 pm. This is probably because, in some cases, the modalities of installation of rain gauges may differ between the two monitoring networks (rainfall sensors set up near watercourses with trees that, growing in height with time, could shelter the rain and could affect, even considerably, the final result).
From a hydrological point of view, the largest amount of the rain fell in the area around Mount Catria (1702 m a.s.l.), thus first involving the surrounding villages of Cantiano (Metauro River basin), Frontone (Cesano River basin) and then spilling down into the valleys of Sassoferrato (Esino River basin), Pergola (Cesano River basin), to finally arrive in the towns of Ostra and Senigallia (Misa River basin), close to the Adriatic coast. Just to have an idea of the magnitude of the event, from 02:30 to 09:45 pm on 15 September 2022, the sensor no. 2972 of the rain gauge of the town of Cantiano recorded the highest rainfall during this extreme event, with a cumulative of 419 mm and almost all of this rain fell in the first 6 h (Fig. 10 and Table 3). During the same time, the sensor 3294 of Mt. Acuto (Frontone) registered 380.08 mm (SIRMIP, 2022). The largest part of the rainfall was mainly concentrated between 03:00 and 07:00 pm time window and it decreased going from the mountains to the sea; therefore, almost no rain fell in Senigallia (15.6 mm). The rainfall data for each considered time interval acquired from rain gauges in the most representative localities of the meteorological event were collected and summarised in Table 3.
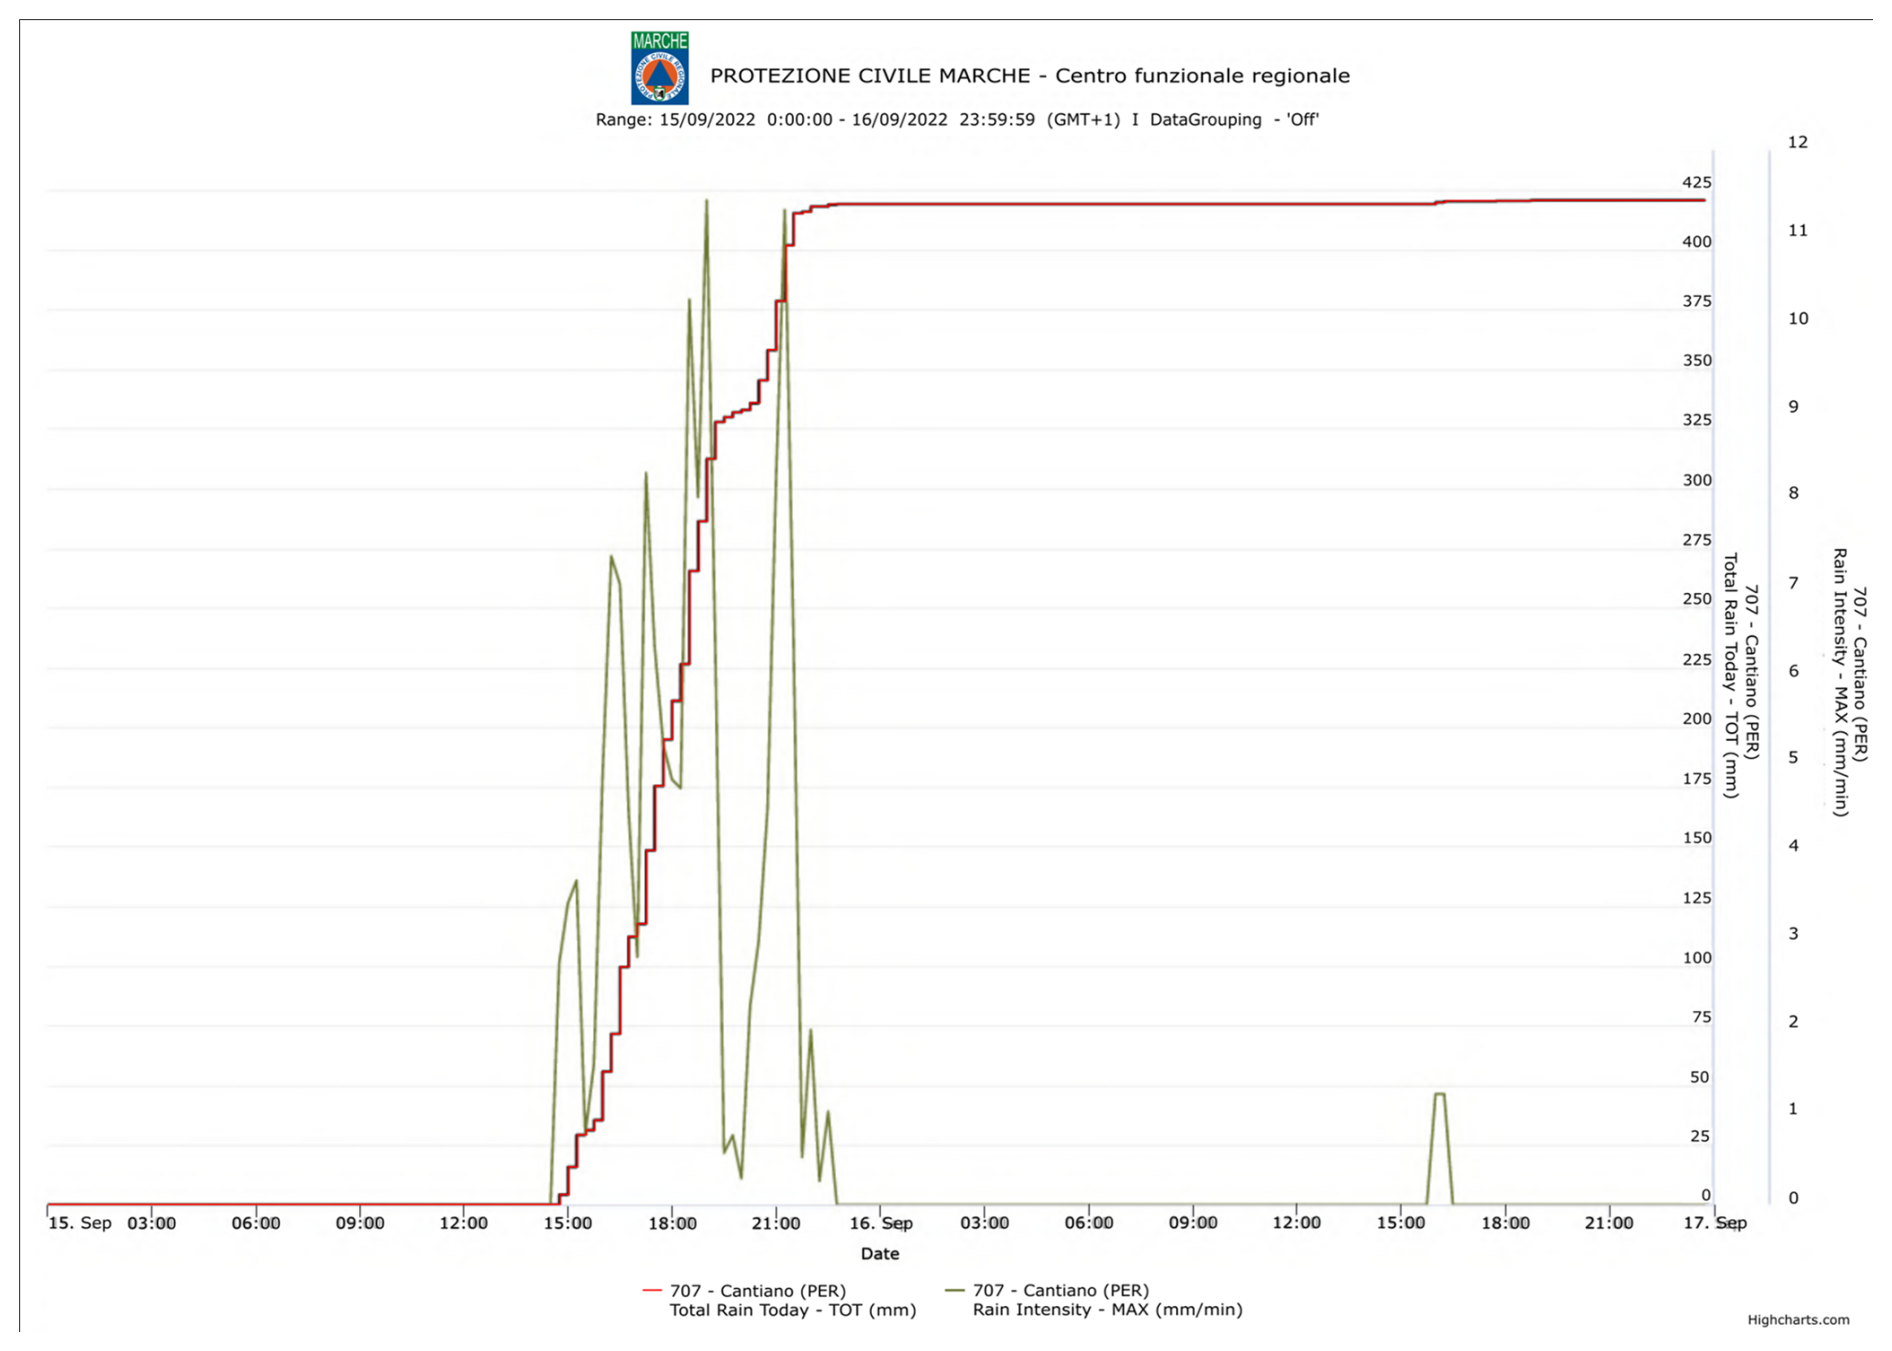
Figure 10Cumulative and intensity of precipitation recorded by the rain gauge of Cantiano (redraw from Civil Protection of the Marche region, 2022). Times in the graph refer to standard time.
Table 3Estimation of the return periods of rainfall recorded by some significant rain gauges for the event (Civil Protection of the Marche region, 2022).
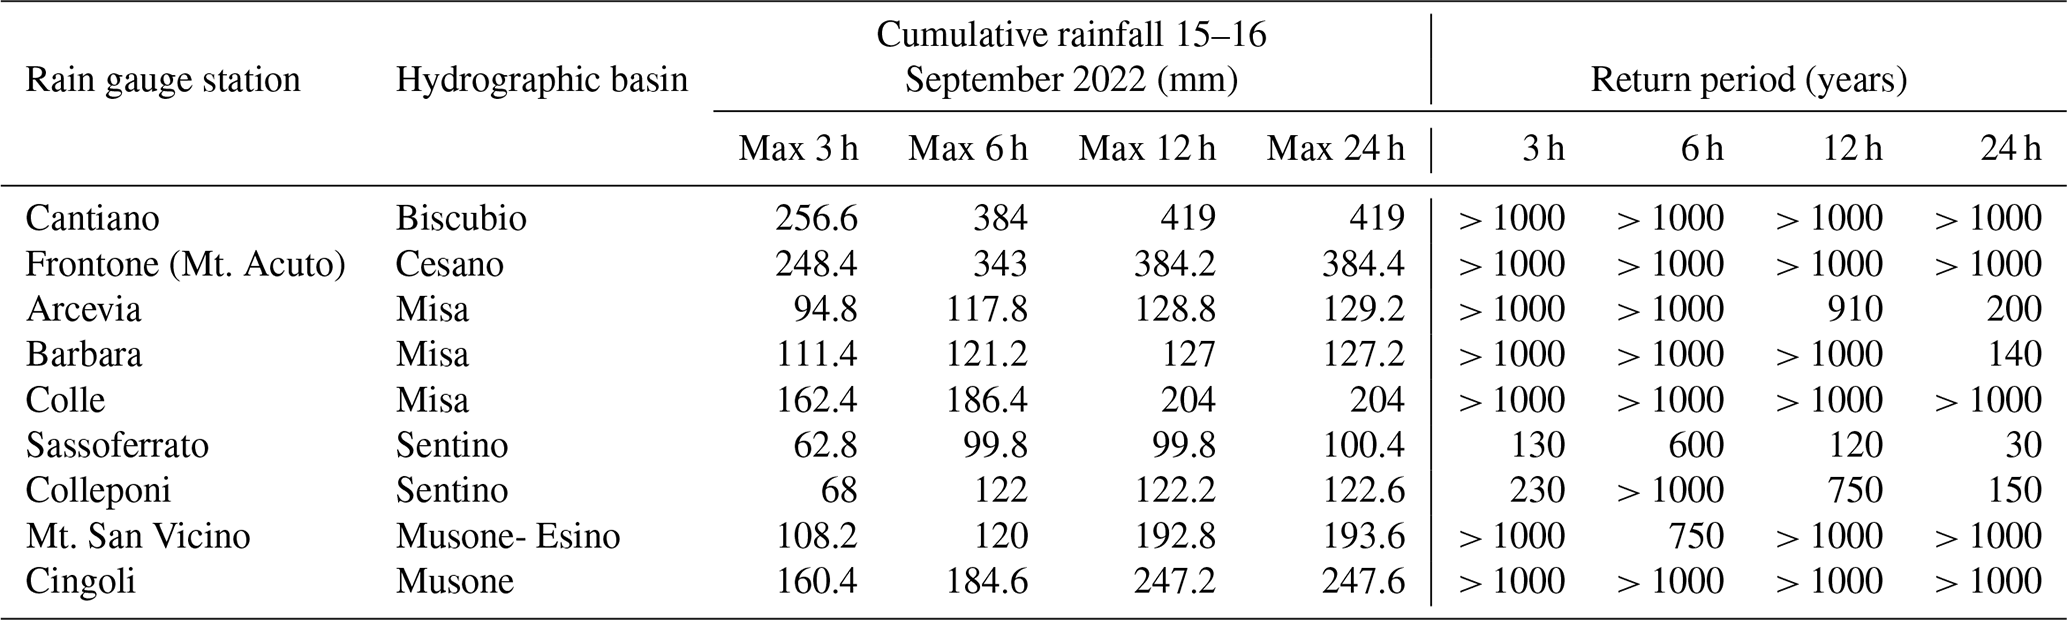
The magnitude of this event significantly surpassed the literature Intensity-Duration-Frequency curves, categorizing it as an “outlier event,” likely triggered by the ongoing climate change across the Mediterranean climate “hot spot” (Mattavelli, 2022; Corti et al., 2024).
The hydrometric analysis for the municipality of Cantiano (Fig. 11) confirms the testimonies collected from residents who narrated about two flood waves that affected Luceoli Square: the first, smaller, inundated the square with about 50 cm of water and the second, more extensive, reached a height of 2.35 m. This is well recognizable in the two peaks corresponding to the two flood waves that reached Luceoli Square at 07:30 and 09:30 pm.
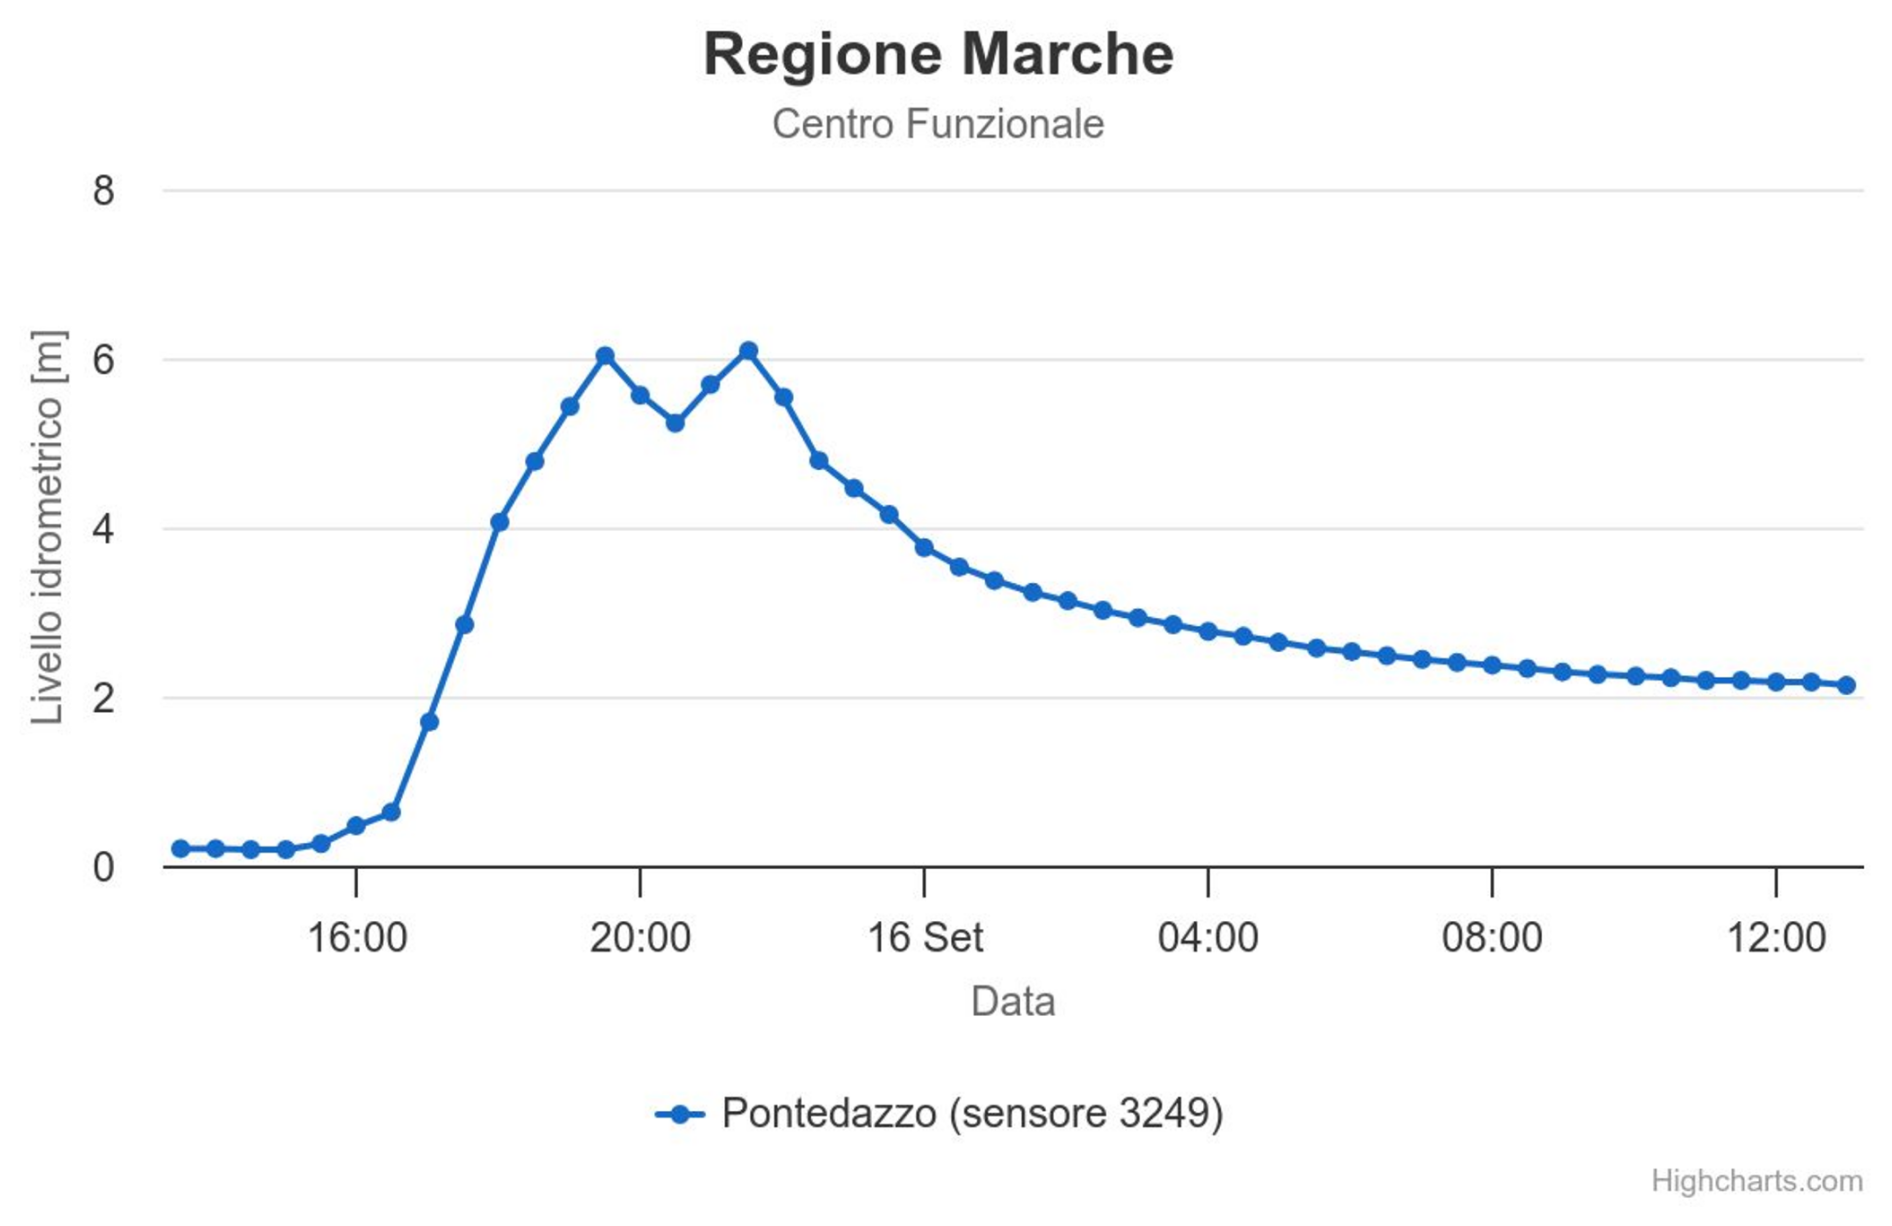
Figure 11The hydrometric graph of sensor 3249 Pontedazzo about one km downstream of Cantiano from 01:00 pm of 15 September 2022, to 01:00 pm of 16 September 2022, Italian time (SIRMIP 2022).
The results of the hydrological modelling (settings and parameters are shown in Table 1) are presented in Fig. 12.
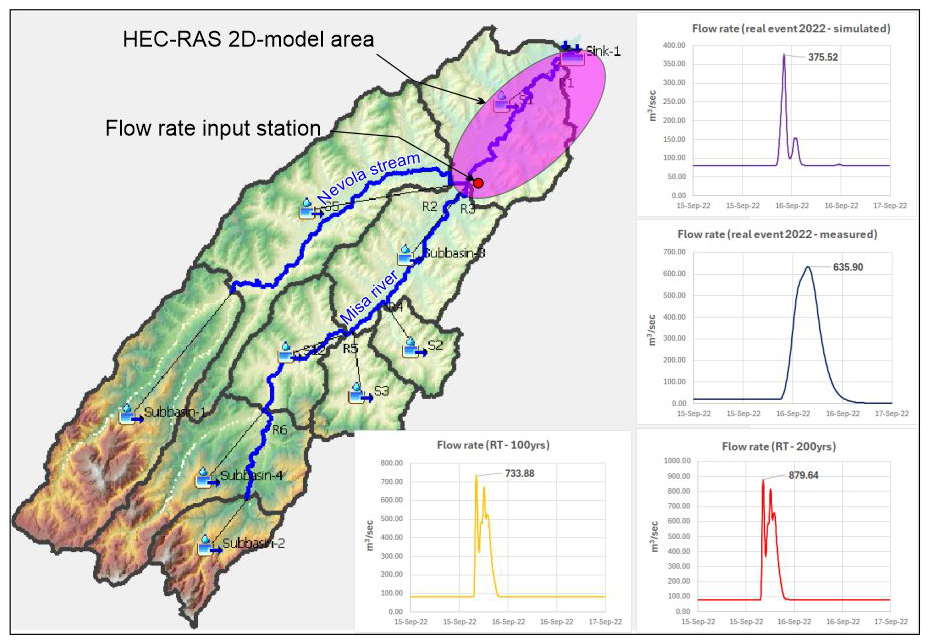
Figure 12HEC-HMS model results.
3.2 Hydrologic-hydraulic modelling results
For the actual 2022 event, precipitation data were entered into the model with a relatively low average Curve Number (CN = 49), typical of dry conditions; the rainfall event had, in fact, been preceded by weeks of virtually no precipitation. Flow rate calculation gives a value of approximately 375 m3 s−1, a value significantly lower than that recorded at the Bettolelle hydrometer (around 640 m3 s−1). In the simulations estimating maximum flood discharges for 100- and 200-year return periods, on the other hand, an average Curve Number of 64 was used; this value is typical of “saturated” conditions, as required by legislation, which mandates consideration of the most unfavorable event scenario. Flow rates calculated for both scenarios give values of respectively 733 and 879 m3 s−1.
The discharge data obtained from the HEC-HMS model were entered into the HEC-RAS software to assess the extent of potentially floodable areas under different scenarios. Figure 13 presents a comparison of the various results: (i) Fig. 13a shows the extent of the floodable area obtained by inputting the discharge value measured during the 2022 event into the model; (ii) Fig. 13b displays an aerial photograph taken the day after the event, showing the flooded terminal stretch of the Misa River floodplain; (iii) Fig. 13c illustrates the floodable area for a return period of 100 years, as defined by the Marche Region Civil Protection Agency.
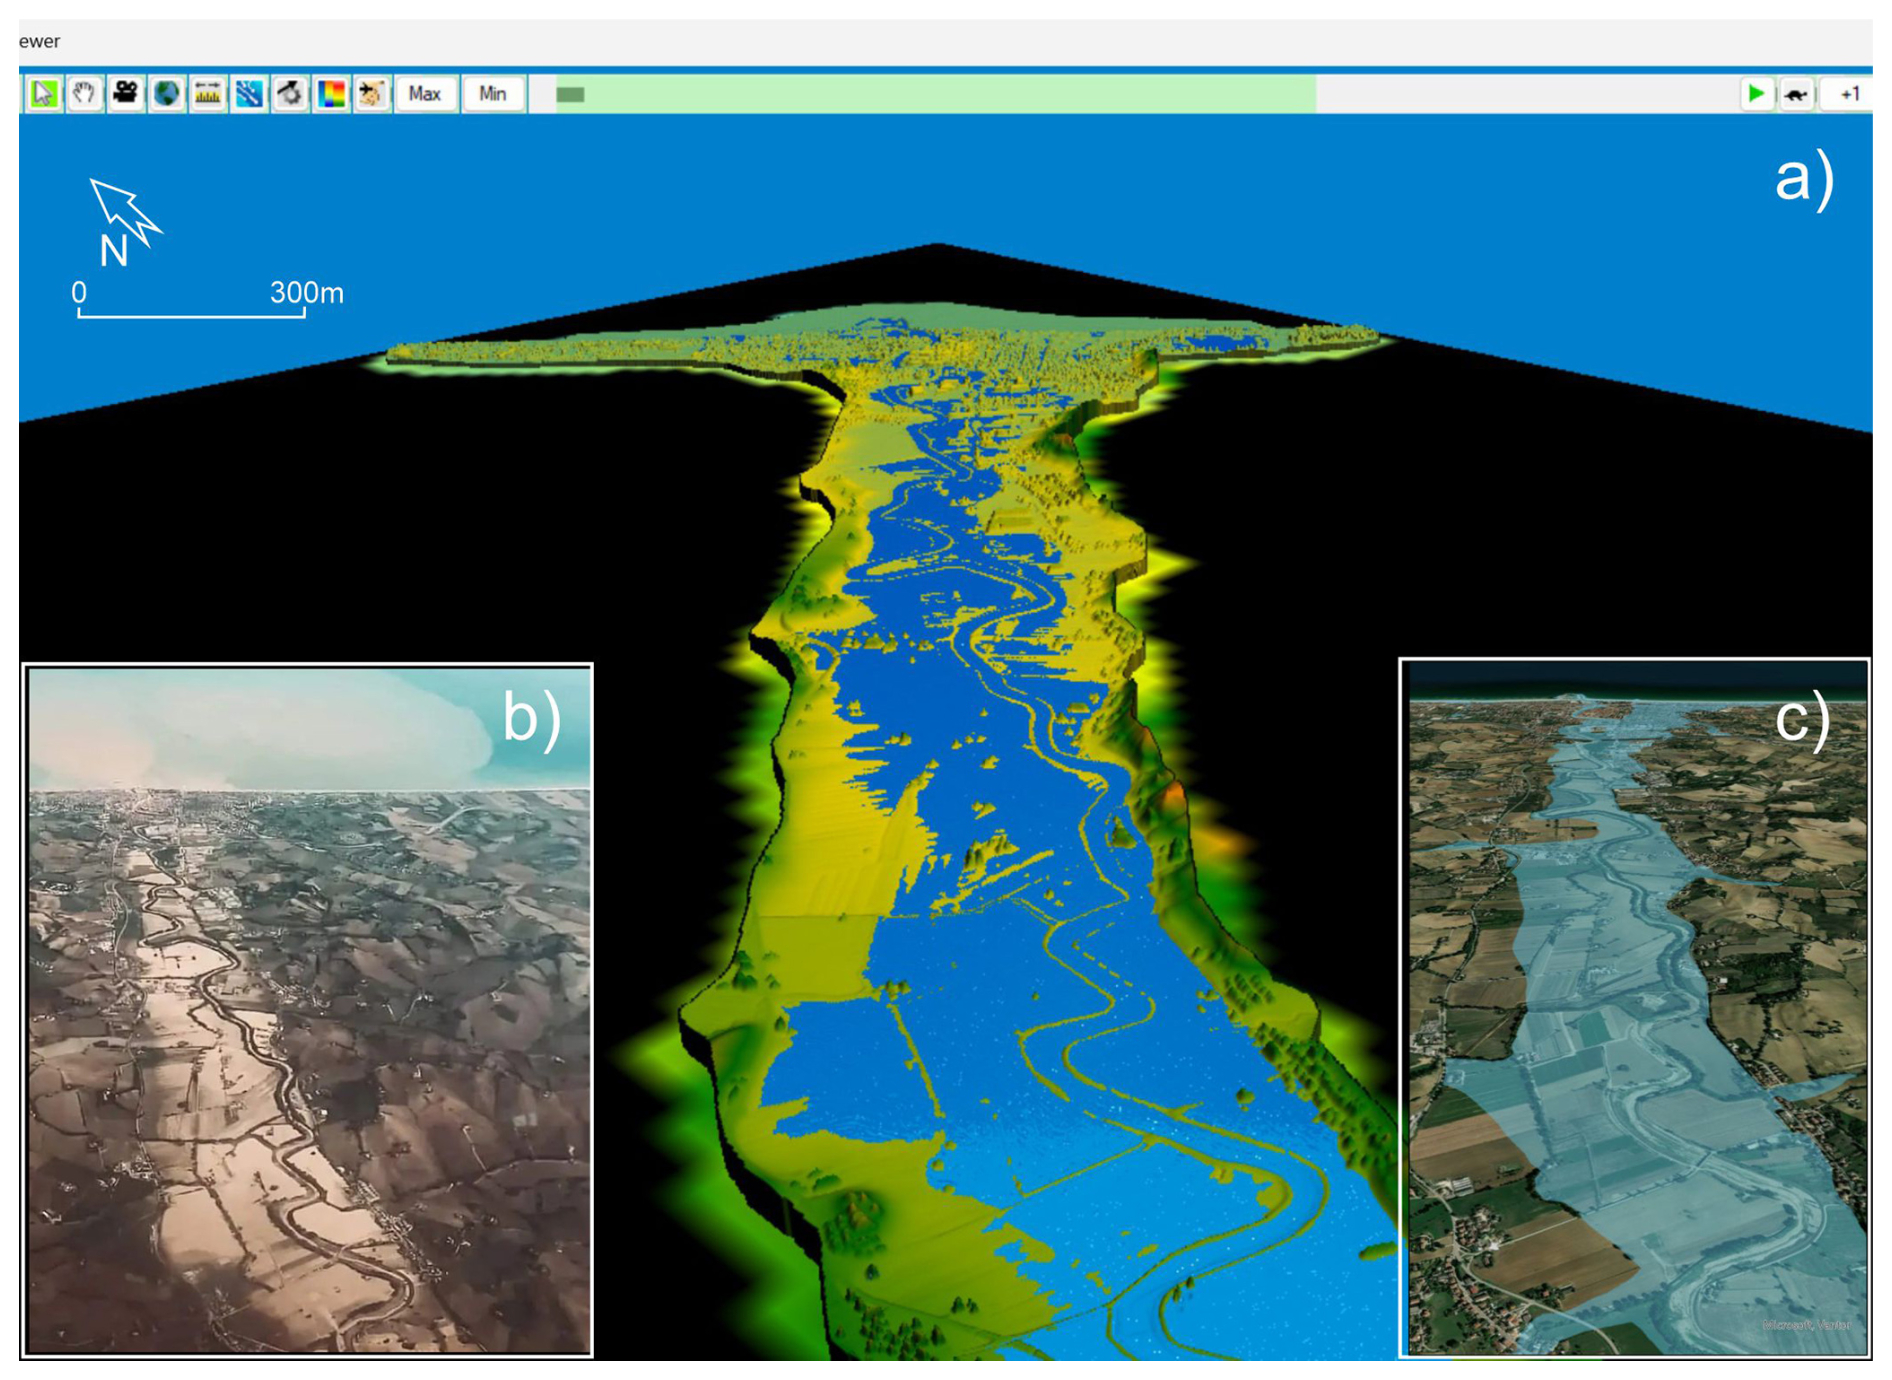
Figure 13Comparison between potentially floodable areas in relation to different event scenarios and the areas actually flooded during the September 2022 event in correspondence of the final stretch of the Misa River valley. (a) Flooded area using a flow rate of 640 m3 s−1; (b) the flooded plain of the Misa River seen from an aircraft flying from Ancona to the United Kingdom on 16 September 2022 at 11:08 am. Italian time, with the well-recognisable flooded area, the main localities in yellow and the plume of sediments seaward. Image from https://www.senigallianotizie.it/1327562338/dalla-foto-ad-alta-definizione-si-individuano-punti-di-fuoriuscita (last access: 11 December 2024); (c) flooded area for a return time of 100 years.
3.3 GIS analysis
GIS software proved extremely valuable for topographic and cartographic analyses. The spatio-temporal and multiscale analyses carried out through the examination of historical imagery made it possible to assess the evolution of the urban system, the channel migrations, and, more generally, the long-term development of the hydrographic network.
For the western suburbs of the town of Senigallia, GIS software was employed to manage lidar imagery and to process the topographic profiles of the river cross-sections. In particular, using the drone-acquired DTM, it was possible to extract a transverse topographic profile of the river (Profile tool) and to assess the geometric differences between the levees across the various sections in terms of height, crest width, toe width, and slope inclination. These observations proved highly valuable for identifying critical issues, defining the necessary interventions, and supporting the considerations developed in the subsequent Case Study 4.
3.4 Critical issues detected in the test areas, restoration works and mitigation of hydro-geomorphological hazard
The on-field surveys detected all the critical issues encountered along the watercourses, according to the datasheets provided by the “Consorzio di Bonifica delle Marche”, the public agency that manages the hydrographic basins of the region. This paper aims to illustrate some case studies depicting the most representative situations encountered, both in mountain and valley floor environments. In each one of them, meteorological processes resulted in substantial differences in hydro-geomorphological dynamics and processes and in the hydraulic response of the watercourses.
Based on the differences in different environments, it is possible to subdivide the most representative situations encountered, which are described in detail in the following lines.
Case study 1 (mountain context): the Mt. Tenetra River valley (Cantiano)
As widely mentioned, on 15 September 2022, the rainfall sensor “2972 Cantiano” recorded a cumulative rainfall of 419 mm, almost all of it concentrated in just over six hours (Figs. 10, 11; and Tables 2, 3). The amphitheatre-type shape of the western flank of Mt. Tenetra, together with its high relief energy (Figs. 6, 14a), channelled all the surface runoff towards the homonymous ditch. From a geomorphological-hydraulic point of view, this resulted in different landslides recorded along the flanks of the relief with the consequent removal, transportation and deposition of a huge quantity of coarse-grained material along the waterway itself, with rock blocks as also of a couple of meters. In many cases, the watercourse has cut so deeply into the riverbed as to expose the underlying local calcareous bedrock, which in the past was covered during time by alluvial and colluvial sediments. In many observations, along the slopes, the same channels have been filled with this coarse-grained sediment and subsequently incised during the tail of the event, remaining debris flow deposits in the form of embankments lateral attributable to a lateral overflow of the flow front (Johnson and Rodine, 1984). After the extreme event many deposits at the foot of the slopes (Fig. 14a, b) and throughout the valley were recorded. The shape of the valley, in fact, resulted in steep slopes and a flat bottom filled with sediments, spreading as flat blankets on alluvial fans (Aulitzky, 1980), indicating the overflooding condition of the same.
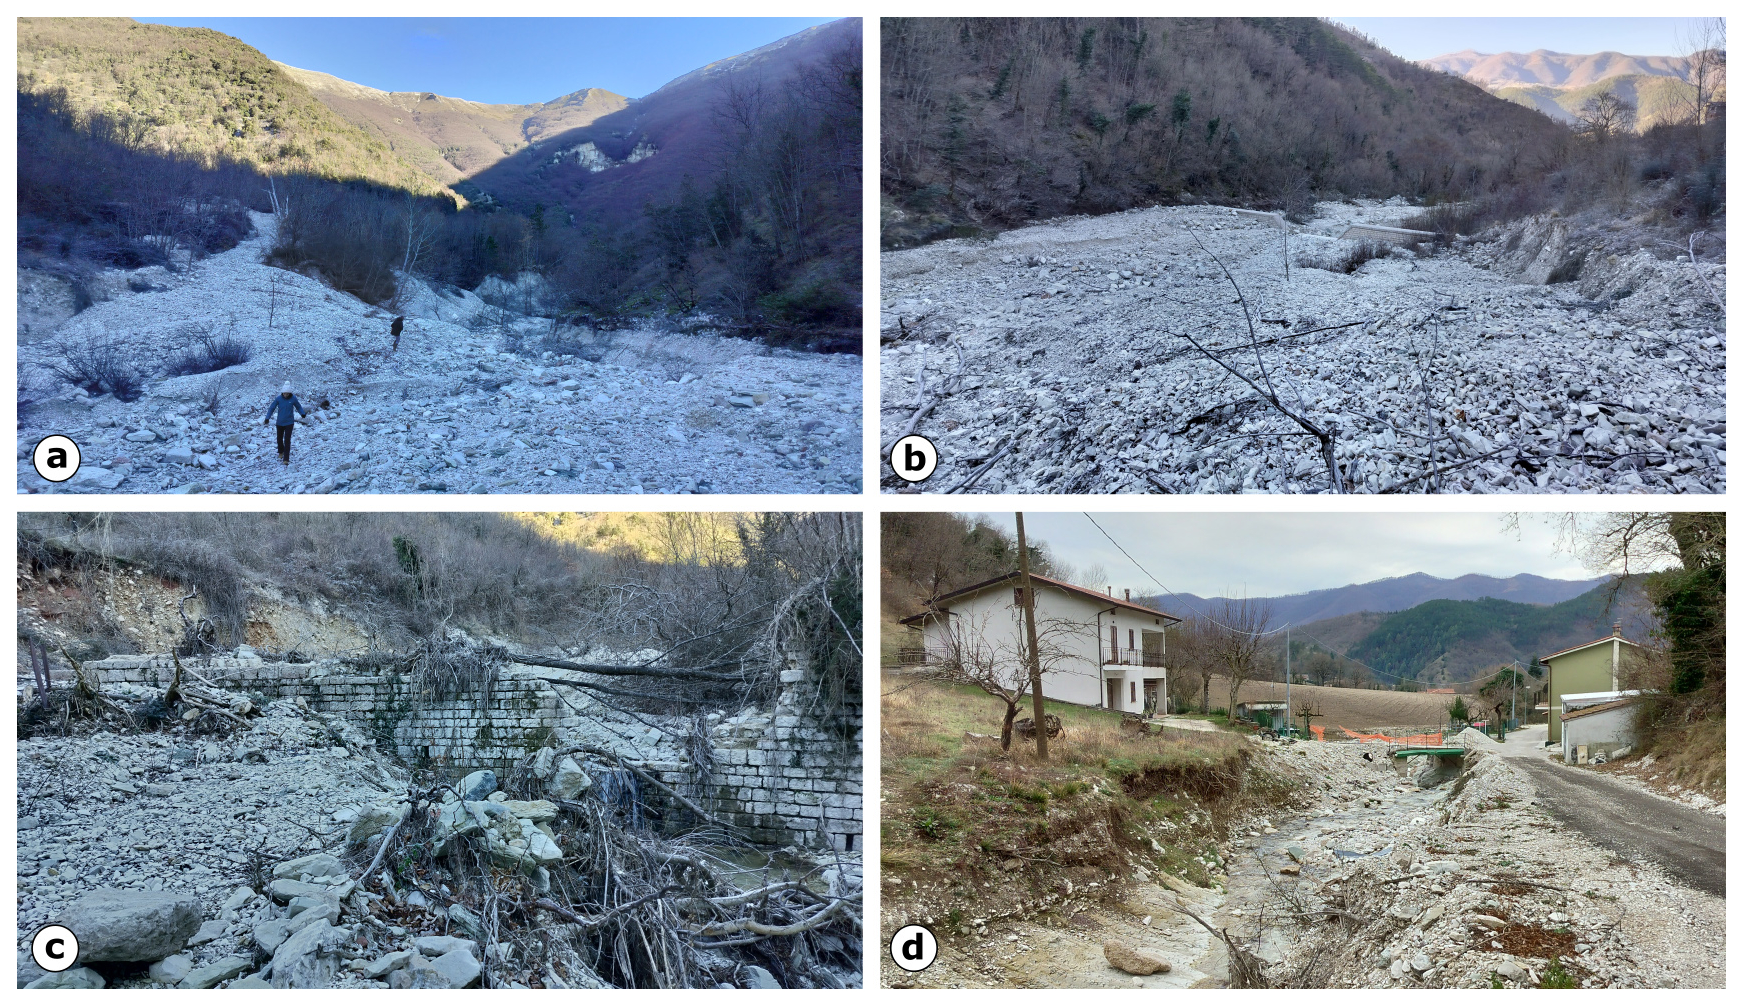
Figure 14Geomorphological criticalities detected along the Tenetra valley in the municipality of Cantiano: (a) panoramic view of the valley seen from downstream; (b) debris flow channel in the hydrographic right portion of Tenetra ditch; (c) debris flow deposits of the channel in picture b) in the valley bottom side; (d) the flat bottom of Tenetra Stream valley seen from upstream filled with debris flows sediments.
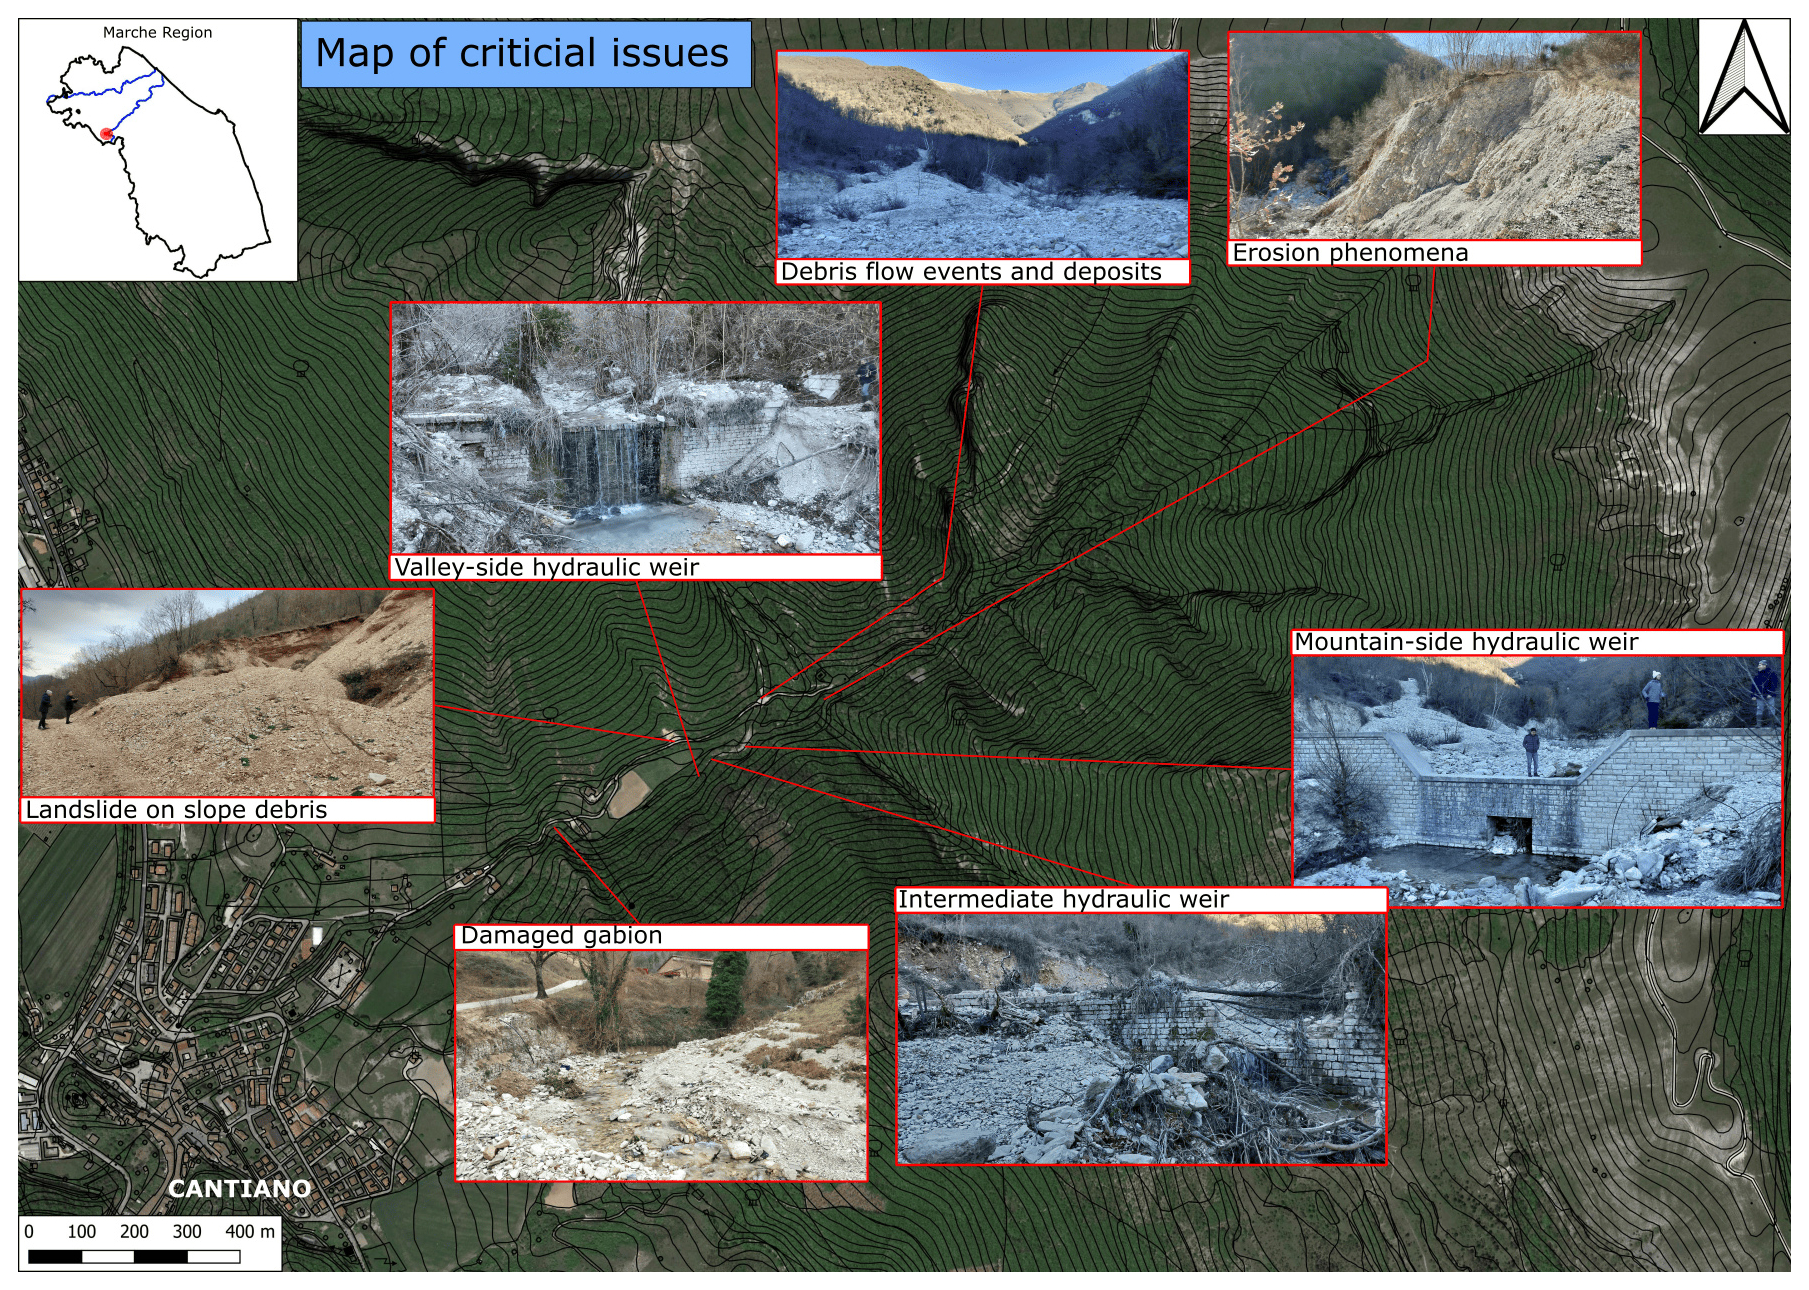
Figure 15Map of critical issues in the Tenetra valley. The extent rectangle shows in black the boundaries of the Marche Region with Cantiano (in red) and the catchment area of the Metauro River (in blue). Cartographic layers from Regione Marche, 2024 (Bendia et al., 2025).
The on-field survey mapped different criticalities, also from the anthropic point of view. Along the watercourse, three hydraulic weirs were present, and they were entirely filled (Fig. 14b) and damaged (Fig. 14c) by the event, compromising their functionality. Some riverbank protection works were also damaged, such as the gabion wall protecting the municipal road. Another criticality was represented by the undersized bridge in the hamlet of Tenetra (Fig. 14d), which was obstructed and overtopped during the flood so much that it separated the two dwellings on either side of it.
The main goal of our research group was to identify critical issues along the hydrographic basin useful to suggest remediation interventions for the reduction of hydraulic risk. This led to the production of two different cartographies: a map of critical issues detected during the on-field survey (Fig. 15) and a map of the suggested interventions (Fig. 16).
The western area of Mt. Tenetra is not too much anthropized, but the Tenetra stream represents a very important watercourse because a few hundred meters downstream it reaches the historic centre of Cantiano, adding its waters to those of the Bevano Creek, which, still in the historic centre, converges into the Burano River. This double confluence of three watercourses within the built-up area caused the sum and concentration of surface runoff, resulting in a sudden water level rise. The implementation of interventions along the Tenetra sub-basin is considered strategically important for managing water flow volumes and solid transport within Cantiano.
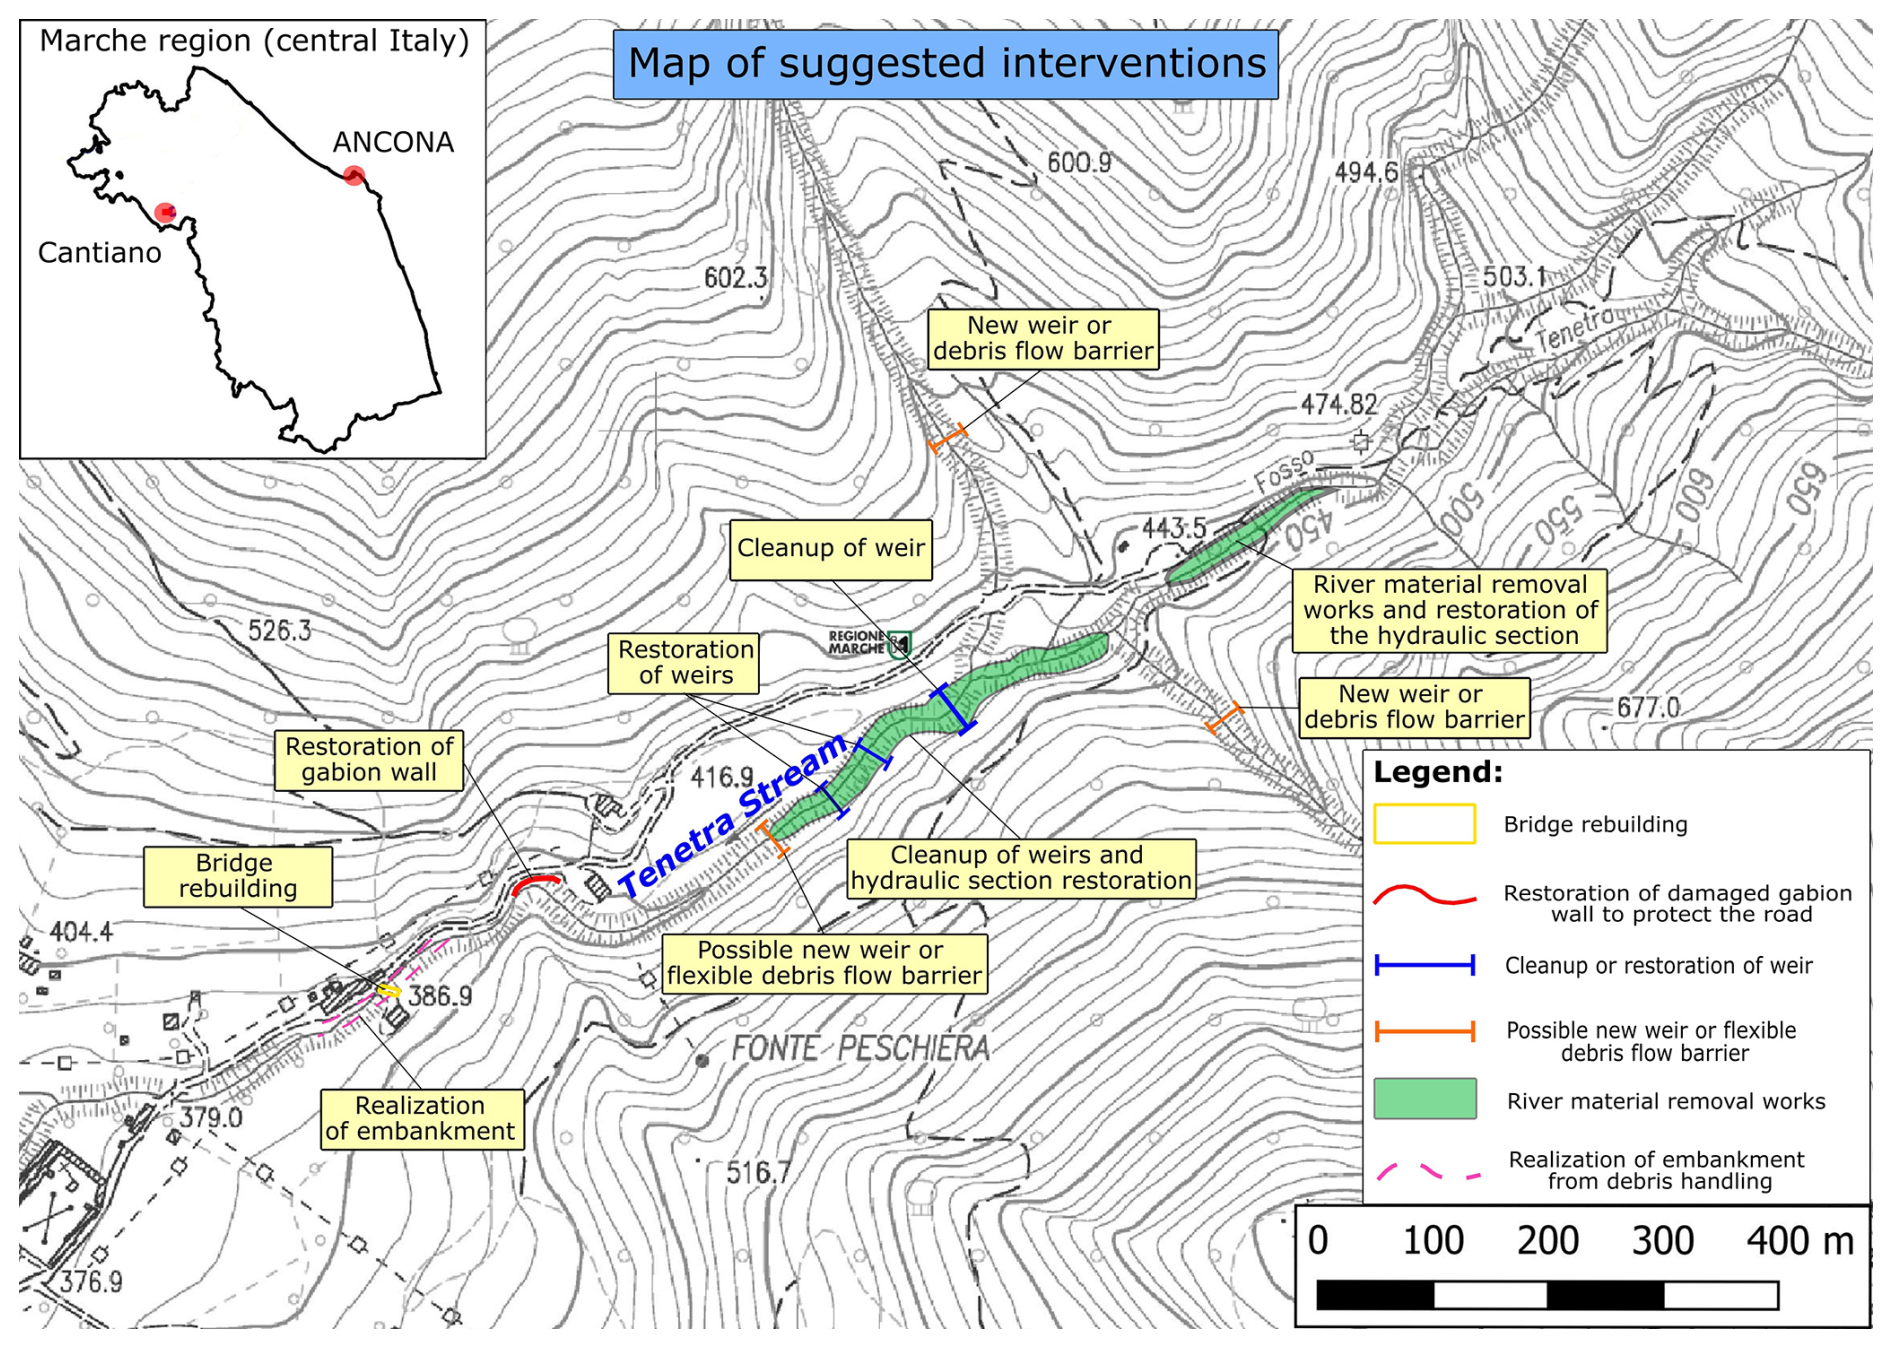
Figure 16Map of the suggested intervention in the Tenetra Valley. The extent rectangle shows in black the boundaries of the Marche Region with Cantiano (in red) and the catchment area of the Metauro River (in blue). Cartographic layers from Regione Marche, 2024 (Bendia et al., 2025).
Case study 2 (urban context): the historical centre of Cantiano
With a cumulative rainfall of 419 mm in just over six hours (Tables 2, 3) and a maximum cumulated rainfall in 1 h (Emax1h/mm) of 101.4 mm (Donnini et al., 2023), Cantiano is the location which recorded the most abundant rainfall during the extreme weather event of 15 September 2022. With 48 landslides on a territory of 84 km2, 22 compromised artisanal activities (some with zero production capacity), 28 businesses destroyed by the flood (bars, restaurants, shops, offices, etc.), six locations of recreational/cultural associations destroyed, the town of Cantiano paid one of the highest prices of all the affected communities.
Cantiano and its surroundings registered many landslides during the considered event, because of the condition of lithotypes (very fractured, due to the tectonic evolution and to intense weathering at these altitudes) and because of the geomorphological-structural setting, with high reliefs alternating with valleys. On the 15 September 2022, the South-Western slope of Mt. Tenetra released different debris flows (Figs. 6, 14a, b) along the pre-existing channels, in some cases stopped along the slope, in other cases able to reach the Tenetra mainstream at the bottom of the valley. Very likely, the presence of three hydraulic weirs (resulting damaged and filled) placed upstream with respect to the town counteracted the erosive potential of the stream, preventing major damage to downstream structures.
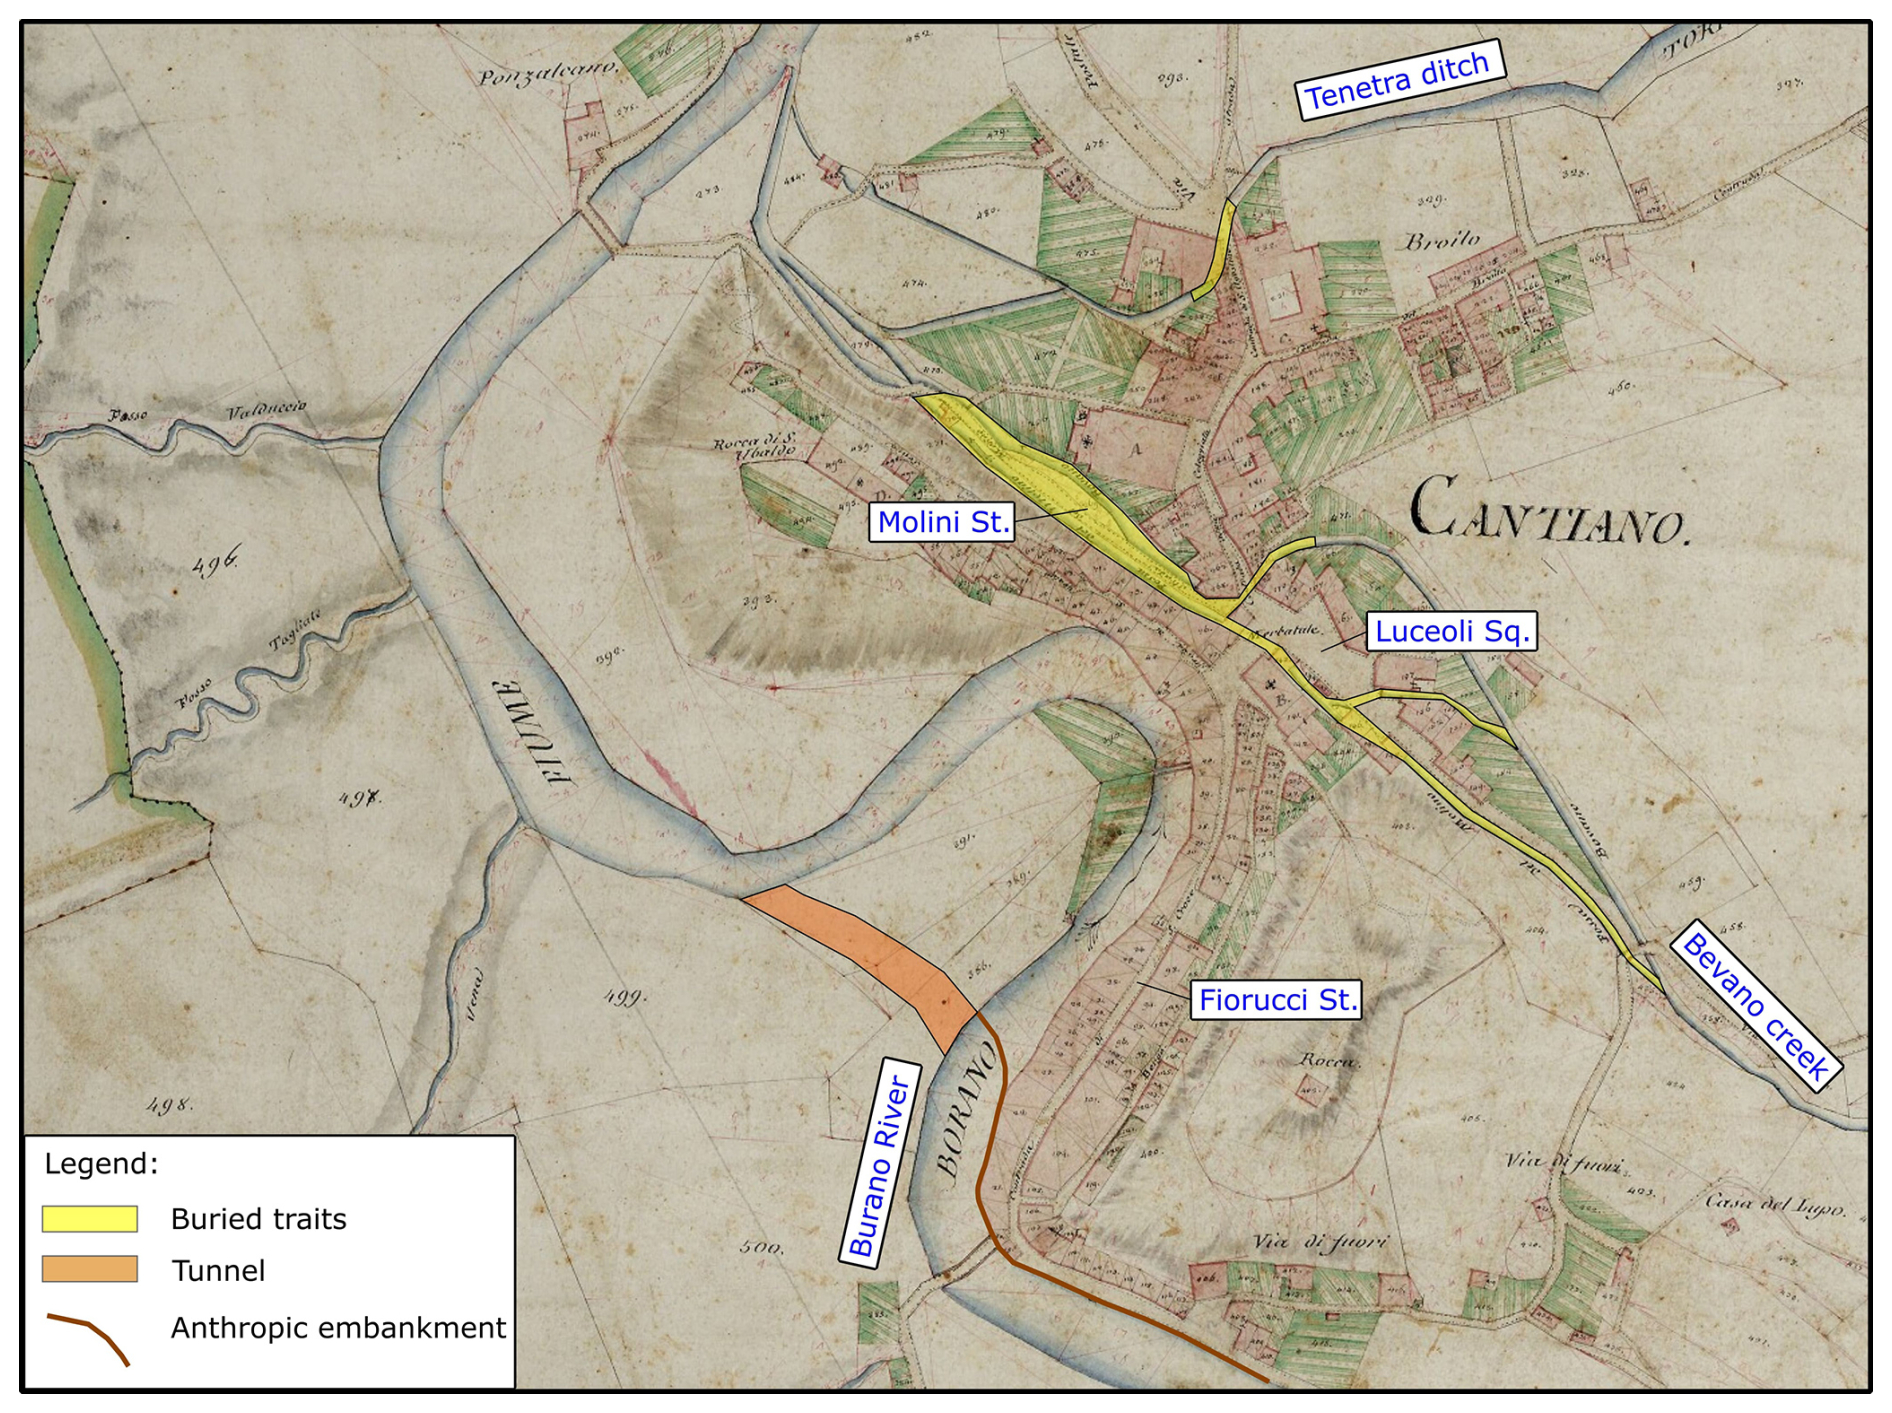
Figure 17Schematic map of the main anthropogenic surface water regulation interventions superimposed on the Gregorian cadastre (Archivio di Stato di Roma, 2026). It is easily recognisable that the abandoned meander is destined for human use.
During the time, anthropogenic efforts were applied to manage the watercourses in this territory. In Cantiano, in fact, rivers were channelled, diverted, or even buried under reinforced concrete structures, mostly in the city centre (Fig. 17). But, surely, the most sensational practice was conducted in 1928 (Morelli et al., 2023) to force the Burano River to jump a meander, anticipating its curvature and diverting it below a rocky ridge with a tunnel of about 65 meters (Figs. 17, 18a). In this way, the river was supposed to abandon its floodplain, allowing humans to cultivate it and, in recent decades, create a parking space above it. This practice certainly proved to be a gamble because, during the flood of 15 September 2022, Burano River in the proximity of Fiorucci Street was able to overflow above the artificial embankments built for its channelization (Fig. 18a), flooding the entire floodplain, the parking, Fiorucci street and to arrive at the historic city centre inundating all Luceoli square with two main events, at 07:00 pm with a water level of 0.5 m and at 10:00 pm raising 2.35 m. (hydrometric levels recorded in front of the town hall). Effectively, the Bevano Creek originally flowed through Luceoli Square, as evidenced by the Gregorian cadastre cartography of 1835 consulted as an indispensable tool supporting the present work (Fig. 17), where a map was produced showing the anthropogenic interventions that have forced the watercourses over time, greatly affecting the surface hydrological regime. Even the most significant contribution was provided by the Burano River, the main responsible for the flood, as well as for its higher flood discharge. The swollen watercourses merely occupied and reclaimed their original spaces.
The culverts were undersized, both in size and construction details, because the covers did not withstand the hydraulic pressures set below them and they literally collapsed (Fig. 18b and c). Moreover, during the on-field surveys, other critical issues were detected: undersized bridges with a limited height between intrados and riverbed (Fig. 18d), partially occluded arches of the bridges and absent river maintenance with the presence of vegetation and sediment that can reduce the hydraulic section during flood events.
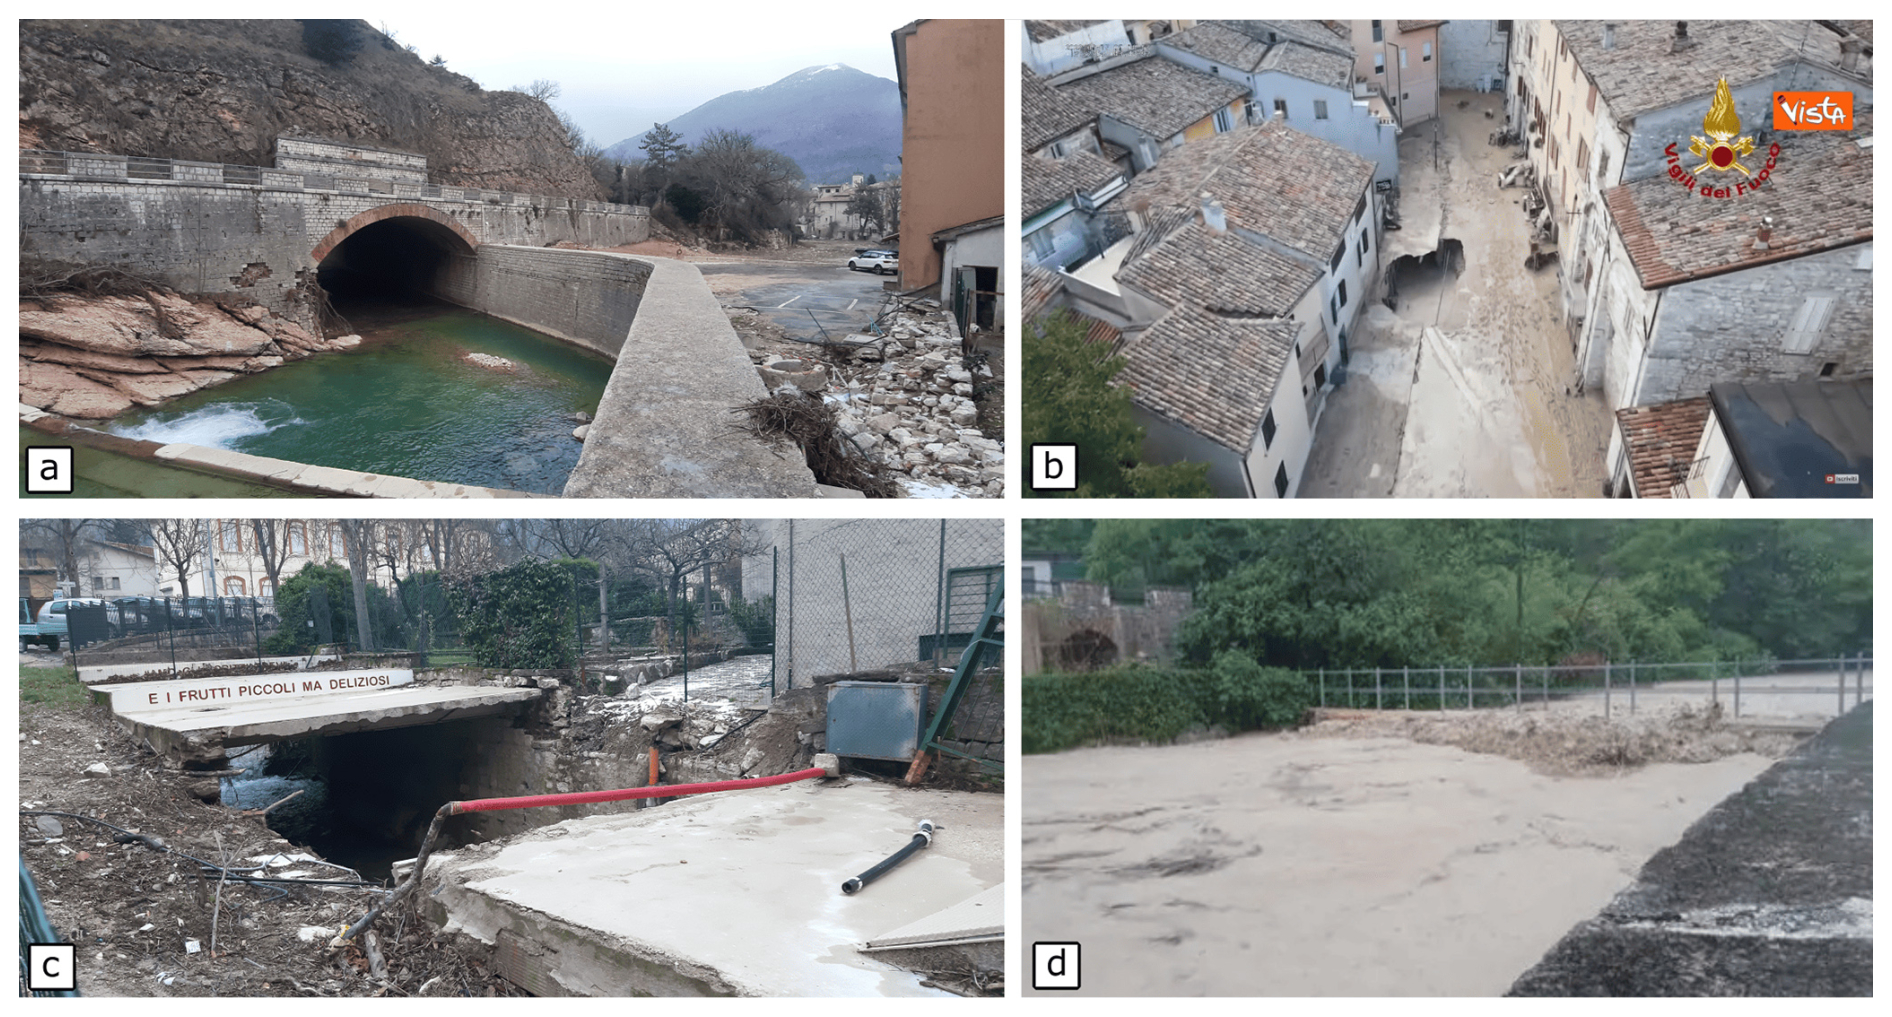
Figure 18(a) The 65-meter tunnel of the Burano River below the calcareous mountain ridge, with the anthropogenic embankment behind which the alluvial plain, the parking and the historical centre are recognizable; (b) collapse of the tombed sections in Tumiati Street, Bevano Creek; (c) explosion of the buried sections in Fiorucci Street, Bevano Creek (courtesy of National Fire Department); (d) undersized footbridge reached by the water level, subsequently washed away, Burano River.
The surveys focused on producing a map for each locality that indicated the critical issues and the suggested interventions for reducing hydraulic risk.
Analysing the hydrometric graphs (Figs. 11 and 25a) along the catchment area of Metauro River from Cantiano (hamlet of Pontedazzo) to Fossombrone (PU), it is possible to recognize the two main peaks inherited from the Cantiano floods also reflected in the downstream municipality of Cagli (PU), which is another locality studied for this work. After the rain gauge in Cagli (Cavour Bridge of Flaminia Street), the Burano River reaches the water contributions of Bosso River, further on, those of Candigliano River and, further on, in proximity of Fossombrone, those of Metauro River. It is precisely for these contributions that, from the town of Cagli on, we do not find the double peak in the flow. The downward trend in hydrometric levels is because the Metauro River has a SW-NE direction, while the storm has moved to the south-east.
To get an idea of the uniqueness of the event, an online blog of hydrogeology (Idrologia Polito, 2022) provided an interesting historical series of annual precipitation maxima for 5 different durations (1, 3, 6, 12 and 24 h) of the Cantiano rain gauge.
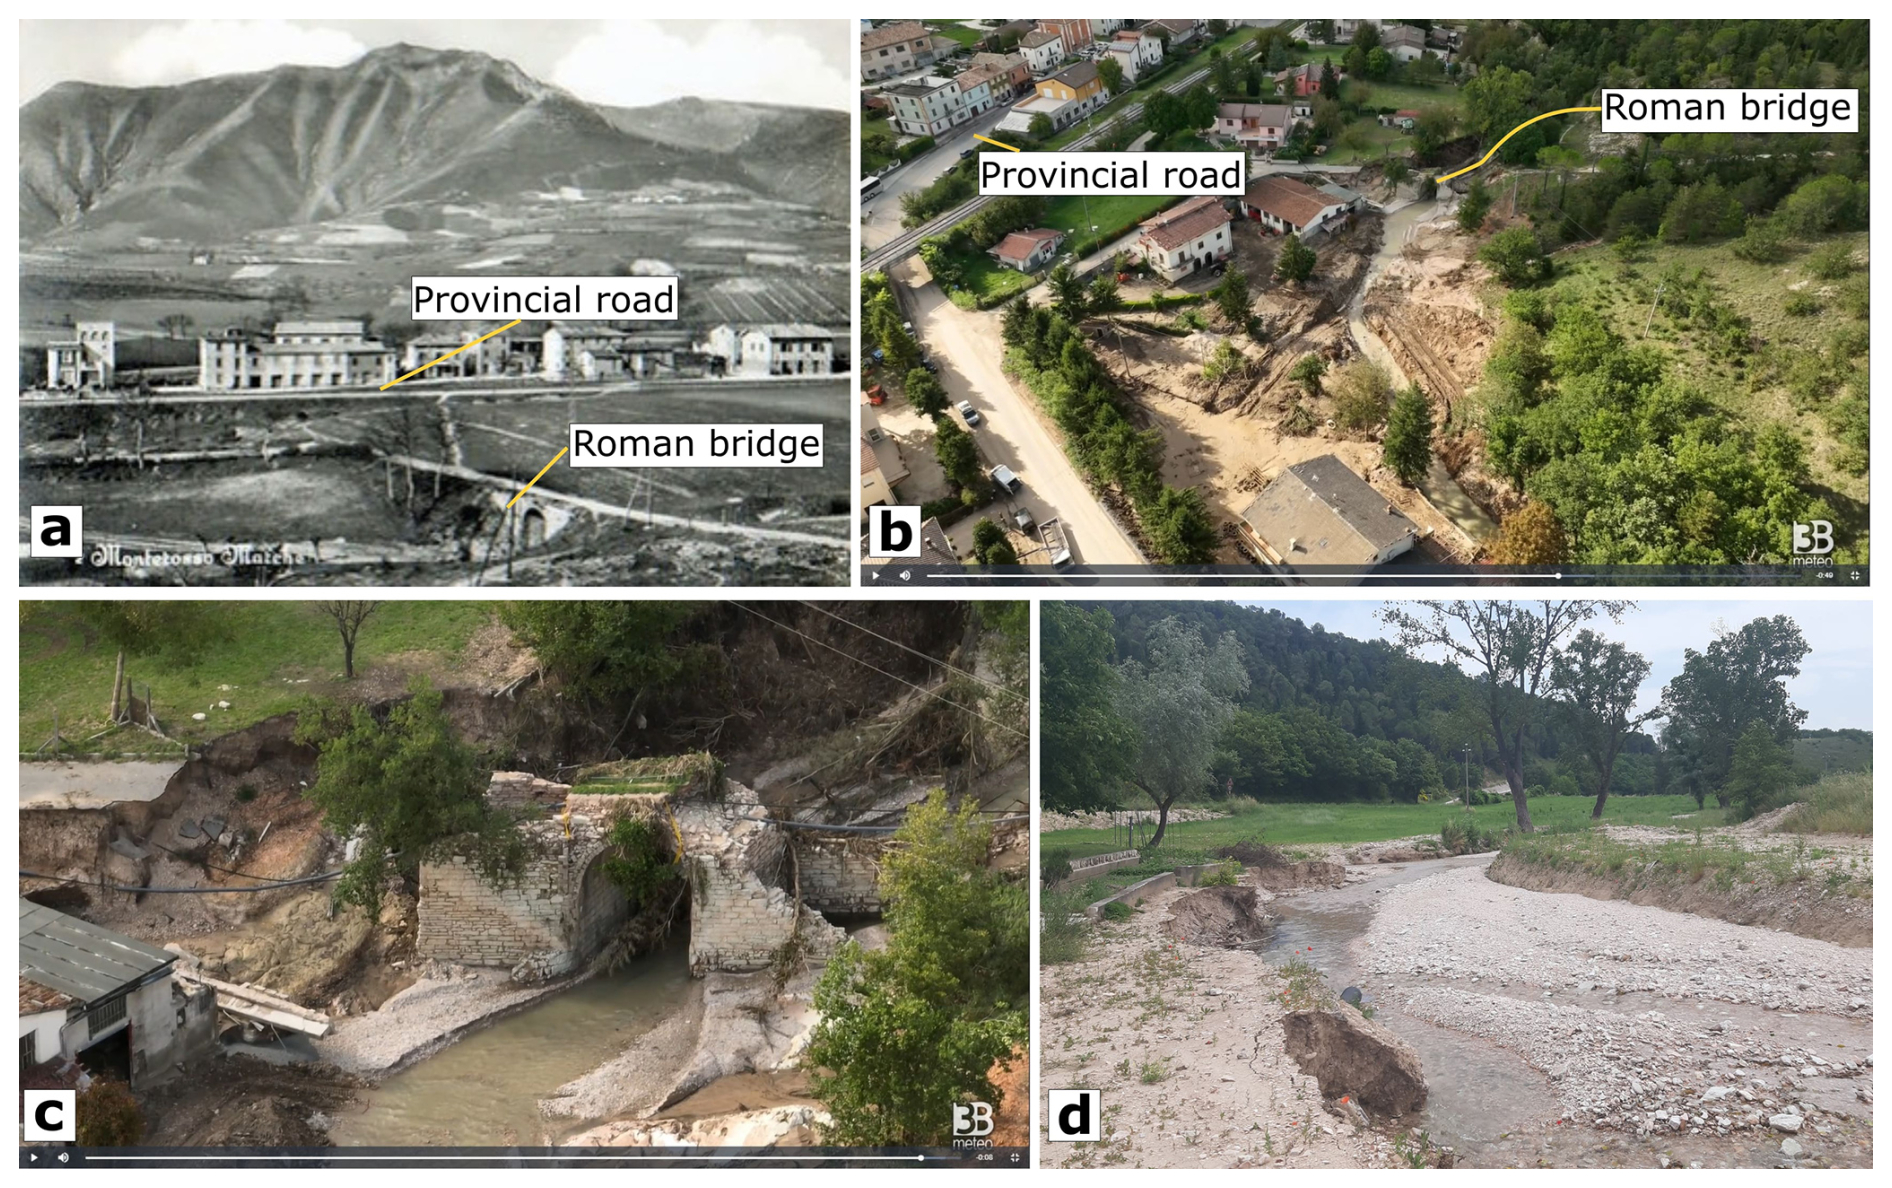
Figure 19(a) the Roman bridge at Monterosso Stazione above the Sanguerone Creek in a historical photo, with the eastern foothills of Mt. Strega in the background (scanning from a postcard, then modified); (b) the post-event situation for comparisons with image a (also related to urbanisation). Note that in the past, the alluvial valley was not urbanised; (c) the Roman bridge after the event viewed from downstream, with the collapsed abutments; (d) the unnamed ditch in Sassoferrato Stazione after the flood, with the waterbed filled with gravel and raised about two meters compared to the pre-event situation. Images (b) and (c) come from https://www.3bmeteo.com/giornale-meteo/cronaca-meteo-alluvione-marche—monterosso-stazione (last access: 1 December 2026).
Case study 3 (mountain and urban context): Sassoferrato
The examples of Monterosso Stazione and Sassoferrato represent a key point to observe and understand the hydraulic behaviour and the influence of some structures during a flood. With a cumulative rainfall of about 197 mm that fell in just over 6 h (Regional Agro- meteorological Service of AMAP Regione Marche, 2022), Sassoferrato represents one of the locations which recorded the highest rainfall during the extreme weather event on 15 September 2022, and its territory was widely damaged.
The mountain stretch of Sanguerone Stream is characterised by a progressively urbanised floodplain over time, with the presence of structures and infrastructure close to the riverbed. In many cases, the watercourse was so obliterated by vegetation and sediment that a round-arched Roman bridge was no longer visible, often unknown to the most recent generations (Fig. 19a). During the flood, the Roman bridge located upstream of the town (Fig. 19b) was filled with tree trunks, branches, bushes and other material until its obstruction. It acted as a dam, limiting almost to the point of inhibiting the outflow of the watercourse and thus allowing the setting of a lake upstream of the barrage. As hydraulic pressure increased, the abutments of the Roman bridge (never maintained or restored over time) did not hold the hydrodynamic forces and collapsed (Fig. 19c), causing the “dam break effect” and triggering the downstream release of the entire volume of stored water: a flash flood event that saw a wall of water invade the hamlet.
After the flooding, the watercourses released their solid transport in the portions where hydraulic affinity allowed this. The riverbed of the unnamed ditch coming from the south behind the automobile repairs workshop was filled with gravel and raised about two meters (testimony from residents) compared to the pre-event situation (Fig. 19d). This resulted in repeated new flooding of the forecourt of the building at each new rainfall event. This represented an important critical issue which required the emergency restoration of the original section of the watercourse.
The watercourse flows through the lithostratigraphic transition between the eastern more calcareous and marly-calcareous lithotypes on which the historic centre of Sassoferrato was built, and the western hemipelagites with a more marly and marly-clay content. These sediments, characterized by a greater aptitude for degradation by erosion, border the slope on the hydrographic right of the Sanguerone, which is therefore distinguished by gentler morphologies and less steep slopes.
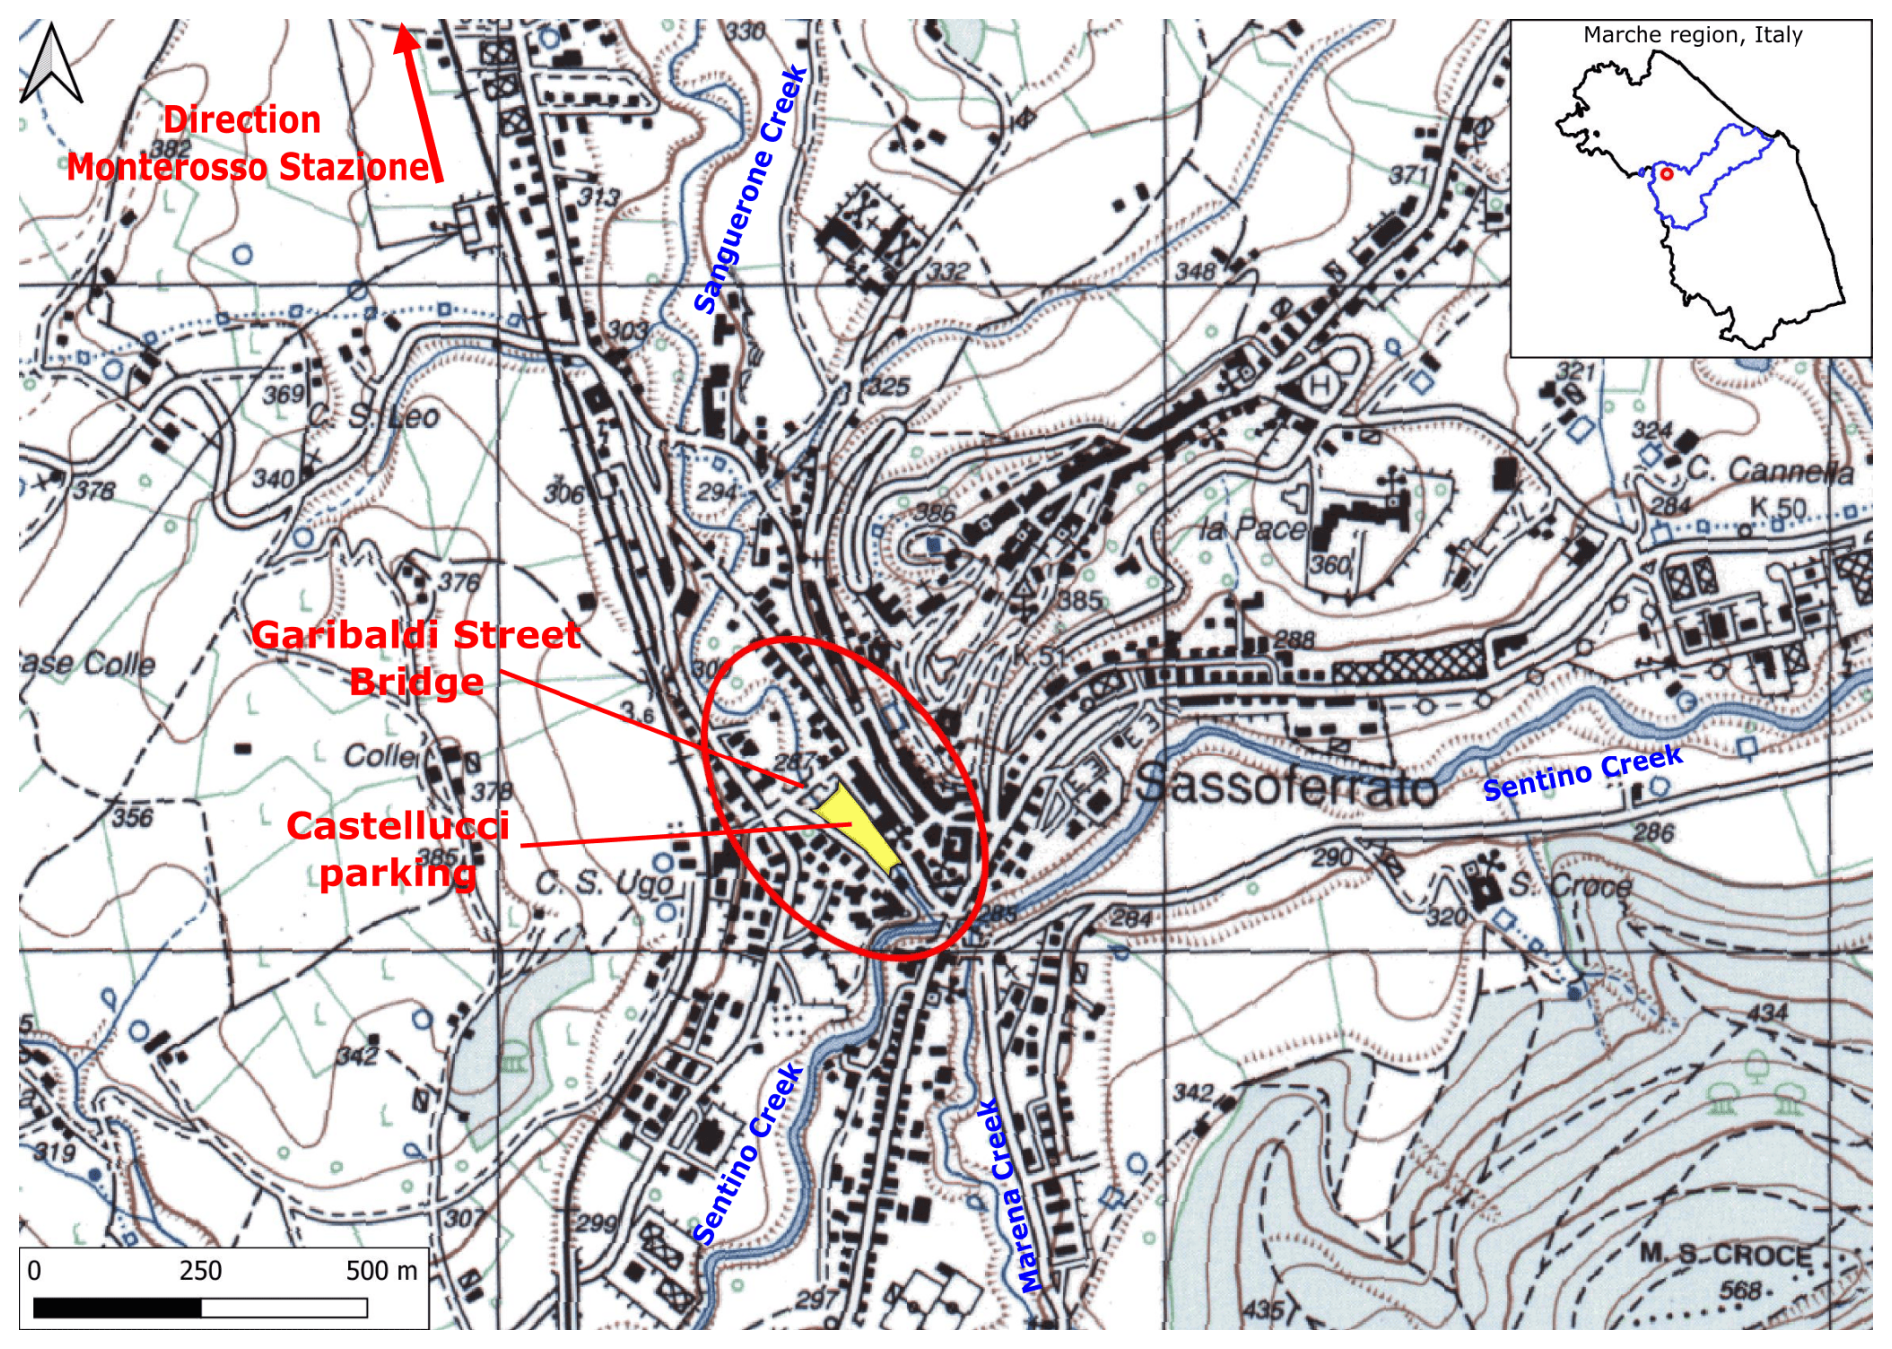
Figure 20Topographic map of the Military Geographical Institute – IGM of Sassoferrato with the buried stretch of Sanguerone Creek below the Castellucci parking highlighted in yellow. In the extent rectangle, the Marche region (black border), the hydrographic basin of the Esino River in blue and the town of Sassoferrato in red. Cartographic layers from Regione Marche, 2024.
Starting from the bridge on Garibaldi Street, the entire riverbed of Sanguerone Stream was tunnelled with a three-segmented concrete box structure of about 200 m in length, which reduces the original section of the ancient bridge built by the Italian Military Engineering Corps (Fig. 21). The watercourse returns to the open space only one hundred meters before its confluence into the Sentino Creek. The buried section was then upward covered with backfill material, above which the Castellucci parking was realised. The channelisation intervention, observed from upstream, shows how the original wide arches of Garibaldi Street Bridge were reduced to a box-like structure that greatly reduced the hydraulic section, making it undoubtedly undersized for the flow rates recorded during the 15 September 2022, hydraulic event (Fig. 21).
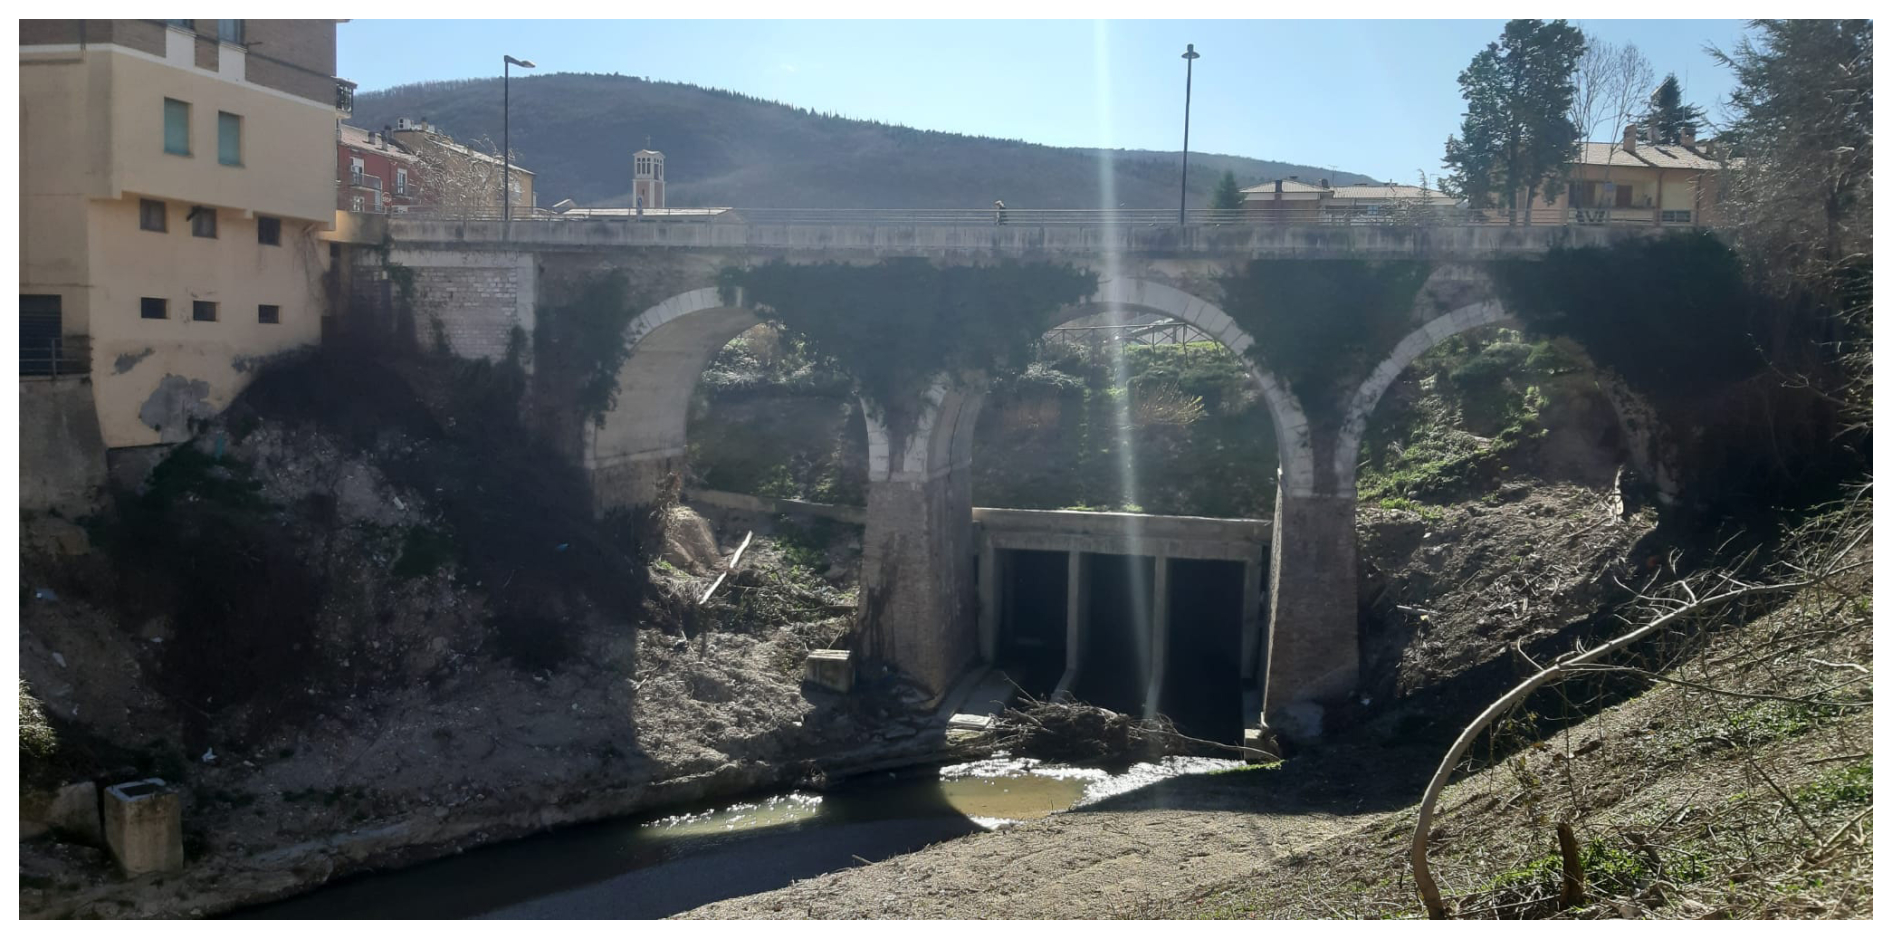
Figure 21The Garibaldi Street Bridge saw from upstream with the evident, extreme reduction of the original flow section with a box-like structure (the markers on the wall on the left mark the hydrometric levels reached).
The flood eradicated and dragged bushes, branches, trees and sediment along its course, which, once they met the narrowing imposed by the channelisation, obstructed the section, creating a lake in its upstream portion (markers on the wall on the left mark the hydrometric levels reached). Overpressures developed inside the buried section, the roof of which fortunately held up without being damaged. These overpressures, however, were released as they exited the channelized section, creating extensive erosions to structures located adjacent to it.
In Monterosso Stazione and Sassoferrato, it is evident how inadequate man-made structures, together with neglect of maintenance along the river network, contributed to amplifying the destructive effects of the flood.
The surveys focused on producing a map for each locality with indicated the encountered critical issues and the suggested interventions for the reduction of hydraulic risk.
Case study 4 (foothill context): the western suburbs of Senigallia
The storm discharged most of the rain in the Apennine portion of the Marche region. Rainfall levels decrease from west to east, from upstream to downstream. The towns of Ostra and Senigallia, although they represent some of the most damaged locations, recorded a negligible rainfall of about 15–20 mm for the 15 September 2022 (Tables 2 and 3). This, undoubtedly, contributed not to alarming the citizens too much. In many cases, unfortunately, they were caught off guard by the flood wave as they were moving their cars out of their underground garages after they had heard on the news and social media about the flooding in the upstream areas.
The case study of Senigallia represents a very didactic example of studying anthropogenic modifications of the territory. Looking at the comparison between the ancient cartography of the Geographical Institute “De Agostini Novara” of 1889 and the aerial image of 2023 (Fig. 7), it is evident how the Misa River, at that time, had two channels, both flowing into the Adriatic Sea. Within them, the ancient castle of the town was built, defended with imposing walls to protect against sieges and floods. During the time many anthropic modifications to the hydrographic network have been made to manage the watercourse and allocate as much land as possible for agricultural, industrial, or urban development purposes. The spatiotemporal analysis conducted through the comparison of historical cartographies highlighted a widespread discrepancy between actual and ancient maps (Fig. 22). The Gregorian cadastre of 1835 shows the area at the confluence between the Nevola and Misa rivers, coming from the West and South, and shows significant modifications made to the hydrographic network during that time.
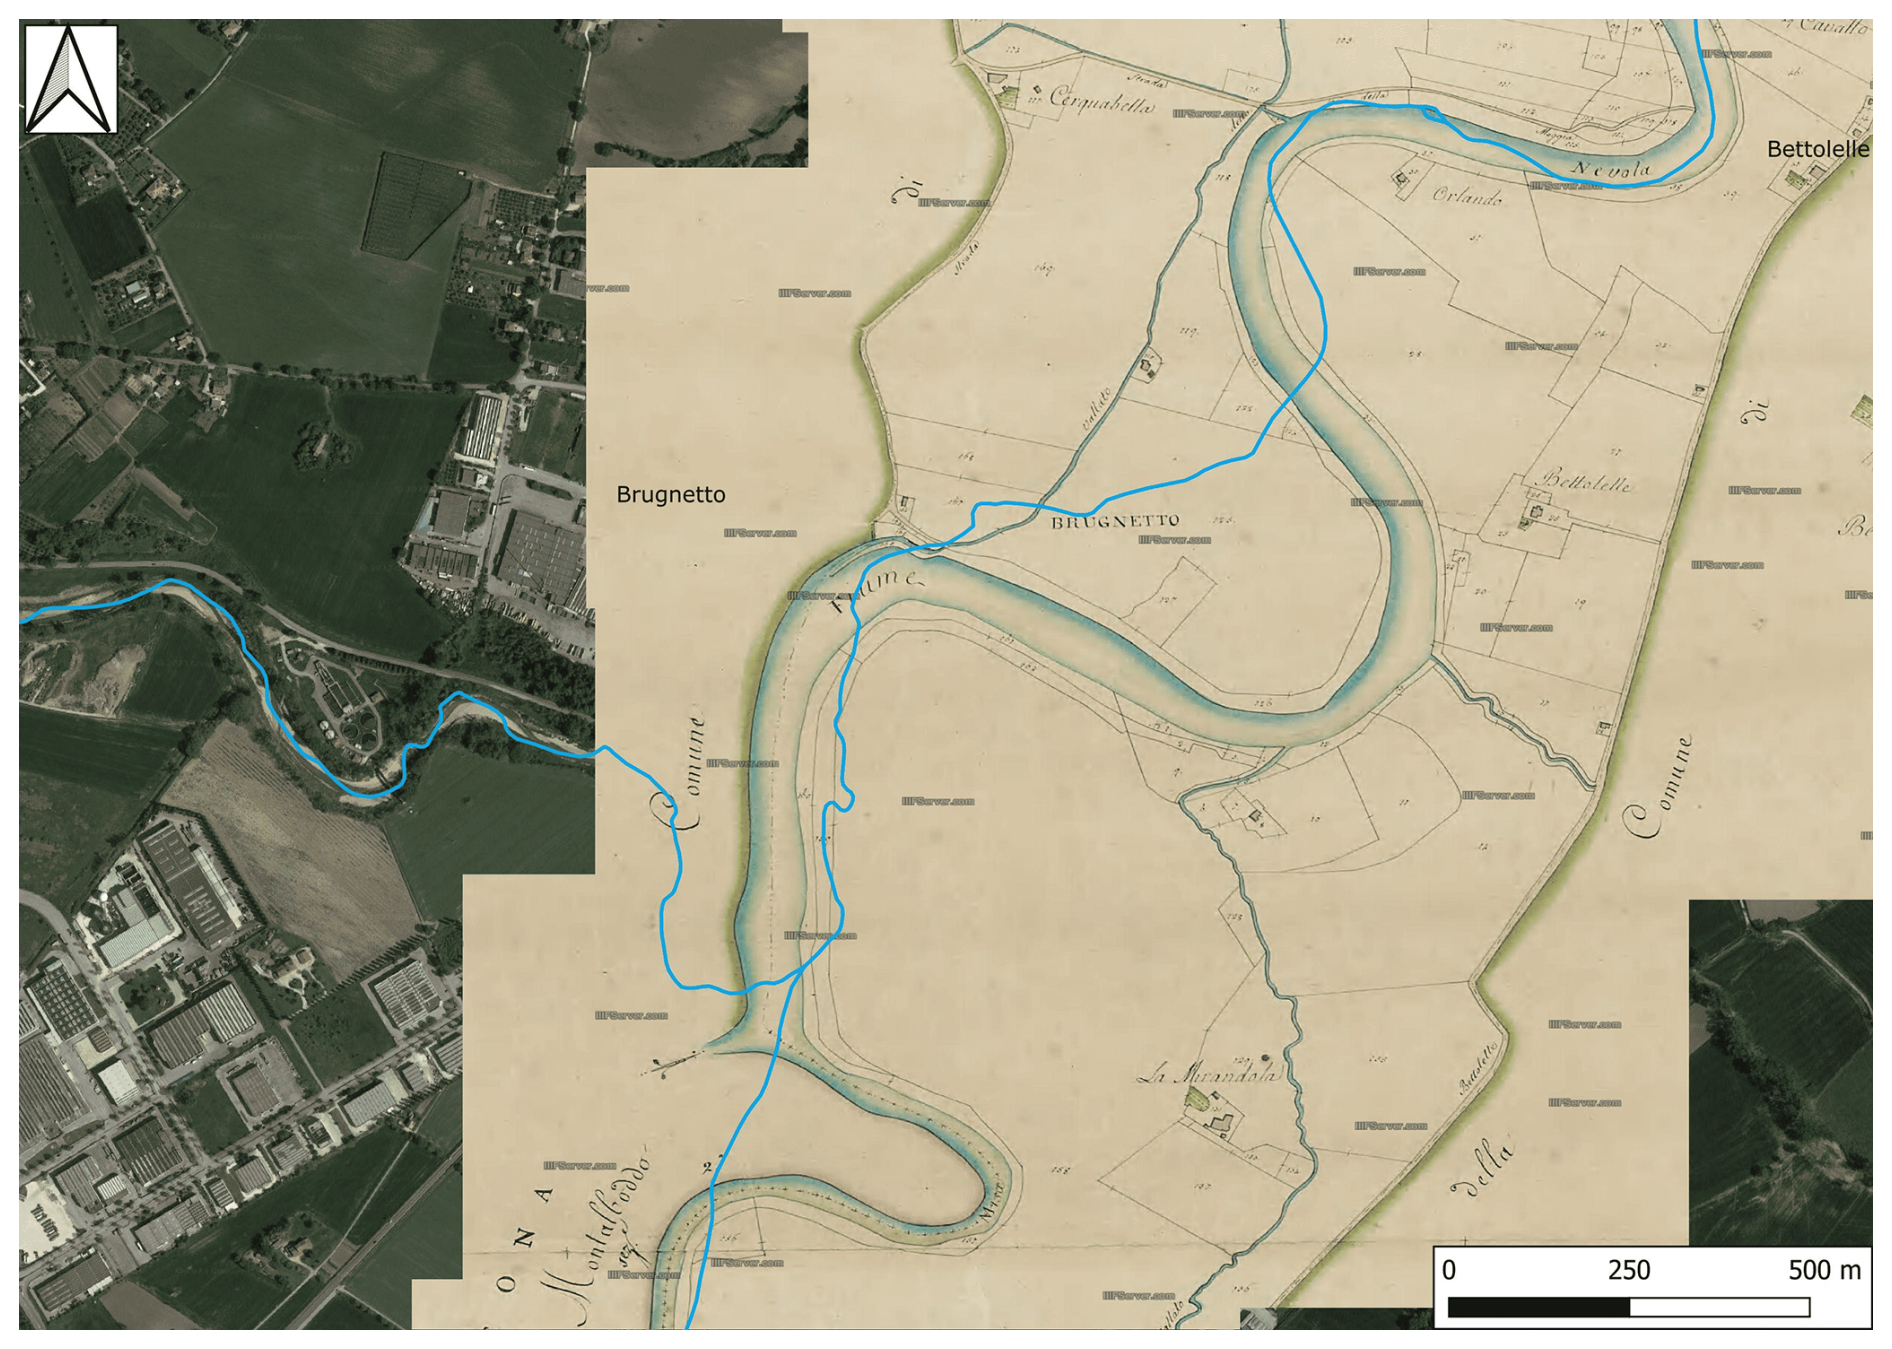
Figure 22The ancient map of the Gregorian cadastre (Archivio di Stato di Roma, 2026) with the superimposed actual watercourses of the Nevola and Misa rivers (light blue lines), with the modifications of the hydrographic network well recognisable (Bendia et al., 2025, modif.).
Nowadays, this final portion of the Misa River appears completely channelled between artificial earthen embankments. On-field surveys and mapping also regarded these structures and identified their main criticalities.
Furthermore, lidar images acquired through drone and on-field surveys highlighted the presence of large amounts of sediment (river point bars composed of cross-bedded sands) distributed and deposited along the riverbed, especially in the inner portions of the river bends (Fig. 23). The hydro-geomorphological on-field survey also detected a widespread presence of trees buried by overbank sedimentation. River point bars develop where stream flow is locally reduced because of friction and reduced water depth. During a flood, this material may represent an obstacle to the runoff by reducing the hydraulic section or partially obstructing bridge arches.
The presence of artificial levees prevents normal fluvial dynamics; consequently, during floods, the river cannot spread into the meander zones to attenuate peak discharge and reduce its erosive potential, except in cases of catastrophic breaches or overtopping of the levee crest. Sediment-rich areas along the river course represent an obstacle to the regular flood flow. By knowing their planimetric and cross-sectional dimensions, also obtained from the LiDAR-derived topographic profile (Fig. 23), it was possible to calculate the volume of removable material to widen the section. Upstream of the town of Senigallia, field surveys and LiDAR mapping of the over-sedimentation areas made it possible to identify a total of 42 individual in-channel zones, located against the outer bends of the river with respect to its flow direction, for a total removable material volume of approximately 252 000 m3. These calculations were useful to quantify the removable material from the riverbed according to profiles and cross-sections corresponding to the low-flow channel of that time, to enlarge the current flood discharge sections to the maximum extent available between the incised banks.
These lidar images were also very useful for the identification of areas where the construction of flood attenuation basins could be recommended.
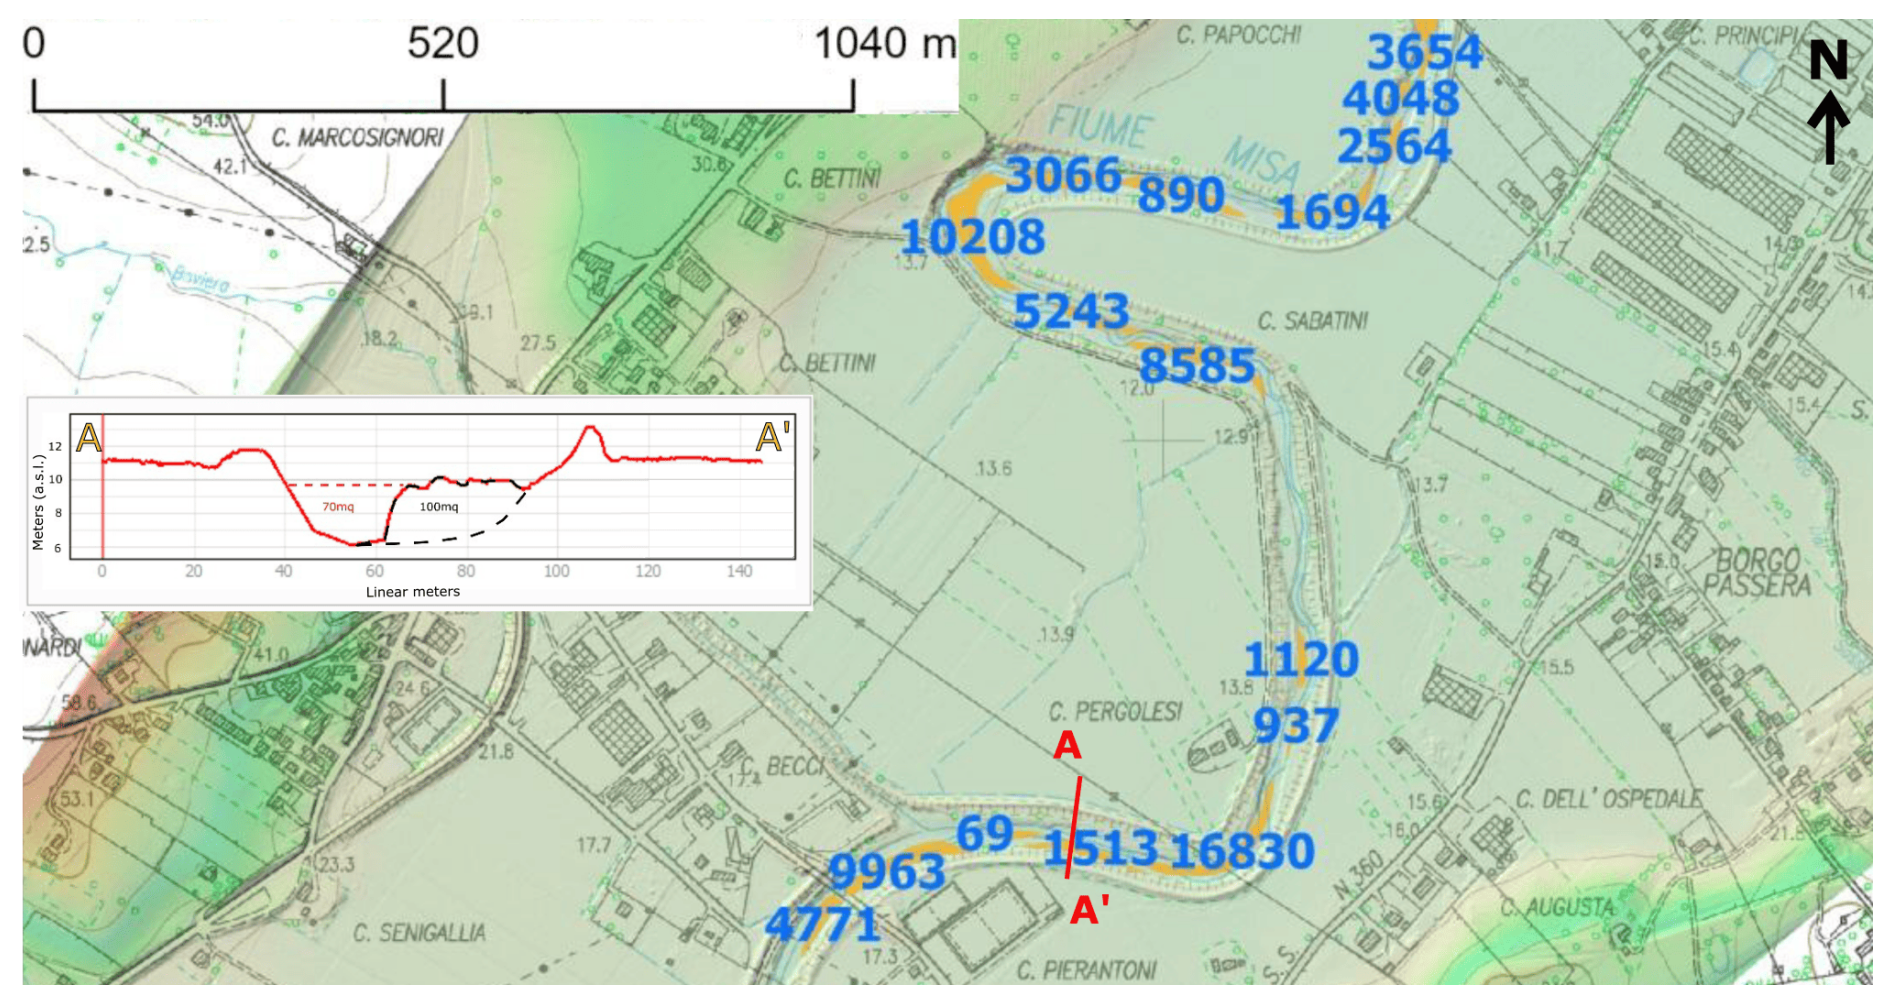
Figure 23A stretch of the lidar image of the Misa River around Molino Marazzana (Senigallia). The blue numbers refer to the single volume of each river point bar (in orange) to be dredged to widen the river section. The red line indicates the section trace from which the river cross-sectional topographic profile (shown in the inset) was obtained through LiDAR data from the drone survey performed. The colour shades refer to the elevations. The smaller inset shows the topographic profile (red line) of a representative stretch of the Misa River near Molino Marazzana (Senigallia) acquired through lidar survey after the flood event (river sediments dashed in black).
The embankments of the Misa River were built with sand, silt and clay derived from the river itself. Before the September 2022 flood event, the area was grassed and wooded, with a widespread presence of trees in the riverbed.
The main criticalities of the hydraulic section of the valley portion of the Misa River can be detected by observing the lidar acquisition. The topographic profile resulting from lidar acquisition conducted by our research group (Fig. 23) highlighted the asymmetry of the two embankments, with differences in height and thickness. In addition to this, the hydraulic section appears partially occluded from the river point bar on the hydraulic right. From the examination of the typical cross-section derived from the LiDAR survey, it is evident that (as shown in the example of Fig. 23) the removal of the overbank sediment allows the recovery of an additional 100 m2 of flood section, resulting in a total cross-sectional area more than twice the current one (70 m2).
Furthermore, the on-field geomorphological-hydraulic survey identified the presence of widespread burrows of fossorial animals (Fig. 24), sometimes passing from one side to the other. During a flood, this can represent a serious situation of weakness of the embankment and can therefore cause its erosion, piping and collapse. In addition to the embankment overflowing, this was one of the causes of the flooding of the Senigallia and Ostra area.
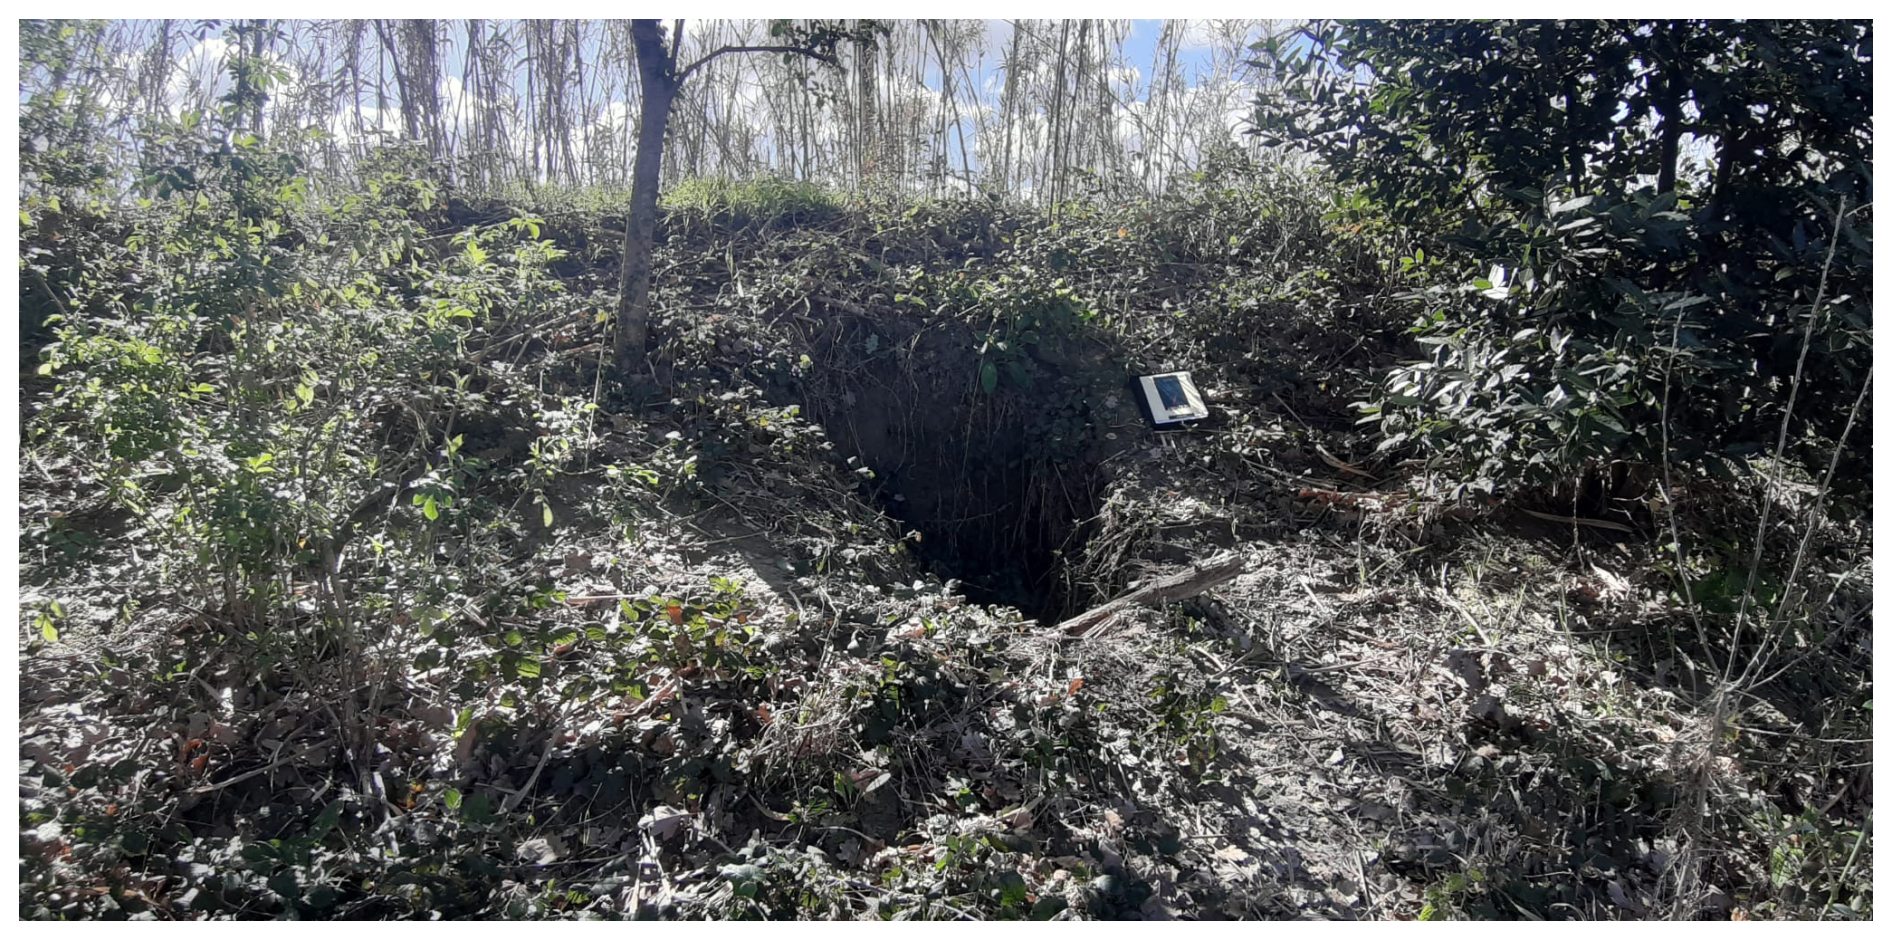
Figure 24The burrow of fossorial animals along the right embankment of Misa River in the hamlet of Borgo Catena (Senigallia), with A4 block notes for scale.
Within the historic centre of Senigallia, the Misa River is channelled through masonry embankments. The greatest criticalities are due to the large urbanization of this area, the ancient Penna channel that was eliminated and the presence of three bridges (Portone Bridge, Garibaldi Bridge and 2 June Bridge) that resulted undersized during the flood of 15 September 2022. Therefore, they were obstructed by vegetation, causing the Misa River to overflow from its banks. The Garibaldi Bridge was damaged, it has been demolished and it will be rebuilt with a wider height.
The foothill environment showed a fluvial setting and dynamics that were totally different from the mountain ones. Watercourses present a lower slope and a wider riverbed (although today it is bordered by man-made embankments).
In the impossibility of giving the river all its space back to allow its dynamics, our research group suggested to the Marche regional administrators a series of interventions, variously distributed throughout the watercourse. Given the critical issues listed above, as also specified in Article 6, paragraph 1, letter (b) of the Italian normative “Norme Tecniche di Attuazione del Piano di stralcio di bacino per l'assetto idrogeologico”, it is necessary, especially in correspondence of meanders, to implement a management strategy aimed at safeguarding the natural hydraulic dynamics, with particular reference to flooding and morphological evolution of the riverbeds and to encourage the maintenance or restoration of the natural features of the hydrographic network.
To avoid the accumulation of vegetation eradicated from the riverbed in the narrowings, it was proposed to act along the hydrographic network by removing dead vegetation present along the river that could create a potential obstacle to runoff. Action was also taken by removing the material deposited in the river bars to widen the hydraulic section.
Another of the most important actions is the embankment restoration and reinforcement. The burrows of fossorial fauna must be filled in, the embankments consolidated and reinforced, and the height of the hydrographic left and right embankments levelled.
The event produced widespread geomorphological changes, including landslides, channel erosion, pointbars migration, valley infilling, and extensive flood deposits. These impacts highlight how the hydraulic response of the catchments was strongly conditioned by both natural factors and intense anthropization of the alluvial plain. The presence of structures and infrastructures within floodprone areas significantly amplified the damage.
Marked spatial differences emerged across the landscape. In the mountainous sector, steep gradients and narrow channels favoured erosive dynamics and slope failures. In the foothill and lowland areas, overtopping or breaching of earthen embankments enabled rapid inundation of wide floodplains, particularly downstream of the Nevola–Misa confluence.
Rainfall analyses confirmed the exceptional nature of the event, with return periods locally exceeding 1000 years (Table 3). Most precipitation fell in the inland mountainous area, whereas the foothills and coastal zone received negligible rainfall. This spatial gradient critically influenced risk perception: in coastal areas, where most fatalities occurred, the absence of intense rainfall led residents to underestimate the hazard and remain in exposed locations. The lack of an effective earlywarning system further contributed to the rapid increase in risk.
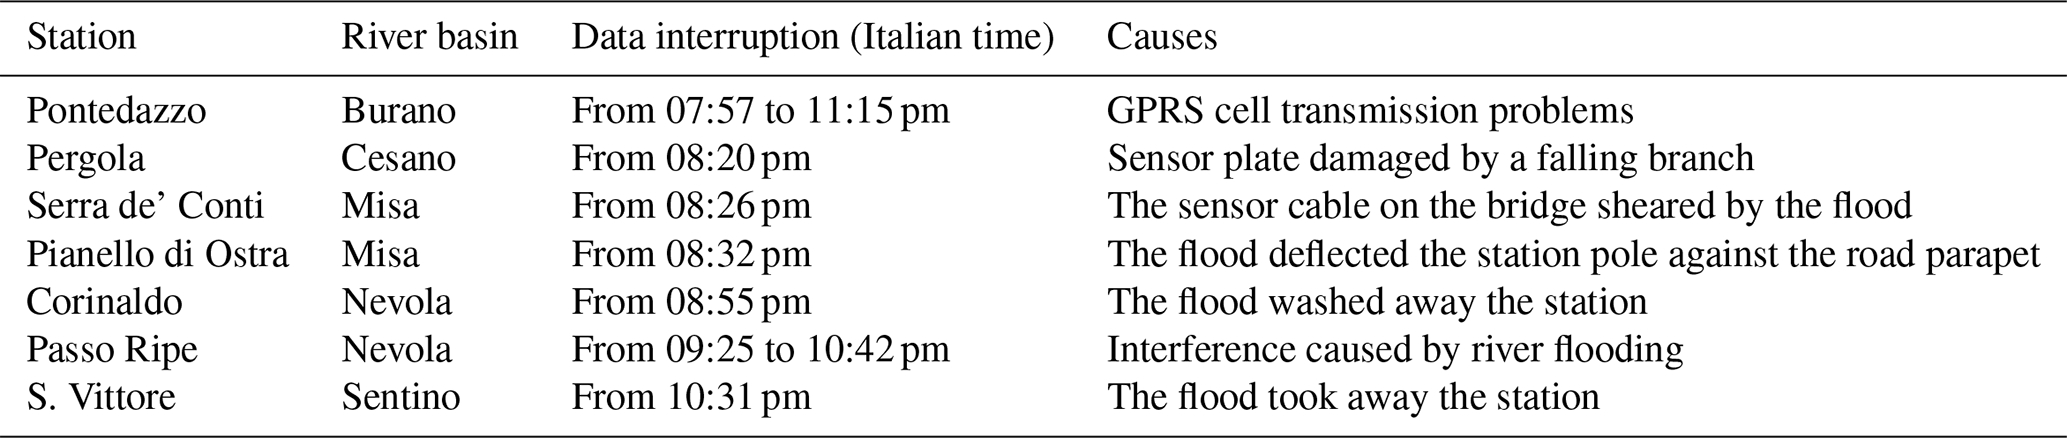
Several hydrometers were damaged or washed away during the flood (Fig. 25b; Table 4), preventing realtime monitoring at crucial moments. This operational fragility underscores the need to redesign and strengthen the regional hydrometeorological network, particularly in catchments repeatedly affected by extreme events.
Looking at the comparison between the hydrometers along the catchment area of the Misa River (Fig. 25b), it is immediately apparent how the hydrometers of Serra de' Conti, Corinaldo, Passo Ripe and Pianello di Ostra stopped because they were broken, temporarily disabled, or washed away as the flood arrived. The difference between Bettolelle (municipality of Ostra) sensor 1112 and, downstream, Ponte Garibaldi sensor 3147 (Senigallia city centre). From Serra de' Conti in the mountain area to Garibaldi Bridge in Senigallia, the peak of the flood wave took presumably about three and a half hours.
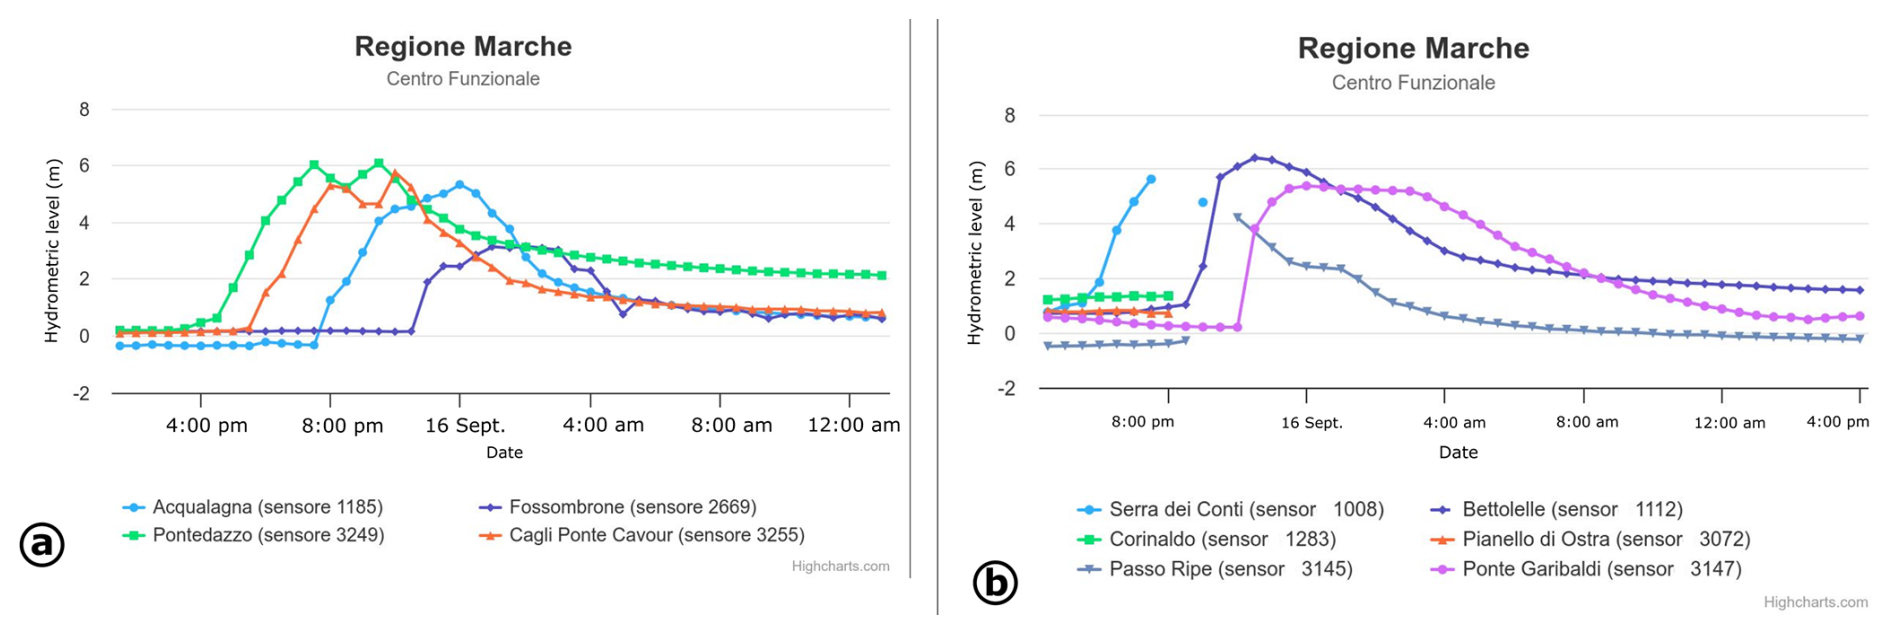
Figure 25(a) the hydrometric levels of the mountain portion of the Metauro River basin from Pontedazzo (Cantiano) to Fossombrone, from 01:00 pm of 15 September 2022, to 01:00 pm of 16 September 2022. Italian time (SIRMIP 2022); (b) the hydrometric levels of the Misa River basin between Serra de Conti and Senigallia (Garibaldi Bridge), from 04:00 pm of 15 September 2022, to 04:00 pm of 16 September 2022. Italian time (SIRMIP 2022).
The statistical analysis of the extreme and rare event object of the present paper reports very significant return levels (Gentilucci et al., 2023) and return periods in terms of rainfall. Some authors suggest that, for the Frontone weather station, a quarter of the average annual rainfall fell in only nine hours (Regional Agro- meteorological Service of AMAP Regione Marche, 2022). Civil Protection of the Marche region, 2022, reports return periods of more than a thousand years for some (Cantiano, Frontone) of the most affected localities (Table 3). Other authors (Guglielmo and Verdicchio, 2022) calculated return periods for 24 h included between 2000 and 3000 years and greater than 3000 years for durations up to 12 h (Table 3). The hydrologic analysis highlighted the extraordinariness of the event. The analysis of the rainfall distribution shows that most of the rain fell in the inland mountainous area and almost nothing in the foothills of the Apennines and the coast (a cumulative rainfall of 15.6 mm, recorded in Senigallia, is equivalent to saying that it rained almost nothing). Therefore, in the latter areas, as there has been no heavy rainfall, people have underestimated the event and continued stationing near waterways or occupying ground floors or underground rooms. These unfortunate circumstances, together with a not-yet-present early warning system to signal the sudden migration of the flood from upstream to downstream, can be identified among the major responsible of the increase in risk. For this reason, it is at least necessary to undertake initiatives to communicate to citizens (public engagement) how hydraulic risk is managed and what correct behaviour they must adopt during an emergency.
Table 4Hydrometers washed away by the flood (Civil Protection of the Marche region, 2022).
The results obtained from hydrological-hydraulic modelling allow some interesting observations about the event and the use of numerical models. Firstly, the flow rates measured at the Bettolelle hydrometer during the actual event are slightly lower (about 100 m3 s−1) than those calculated through modelling for a return period of 100 years, and slightly lower than 200 m3 s−1 for a return period of 200 years (Fig. 12). This is also confirmed by comparing the areas flooded following the event (Fig. 13b), those simulated by inputting the flow rate measured at the hydrometer (Fig. 13a), and those defined (simulated) for a return period of 100 years (Fig. 13c); indeed, the extent of the respective areas, in addition to being comparable, reflects the values obtained. This fact also confirms the validity of the numerical model created.
However, the flow rates obtained through modelling (using rainfall data recorded by rain gauges in the area) differ significantly from those measured by the hydrometer. The simulated flow rate of approximately 375 m3 s−1 is almost half the observed rate (635 m3 s−1). This is particularly surprising when compared to previous results, especially considering that even when soil saturation conditions were incorporated into the basin model (which is unlikely, given the extremely arid conditions in the weeks preceding the event), the aforementioned values were not reached.
The explanation may lie in the poor condition of the main riverbeds, and particularly the minor drainage network, which at the time of the event exhibited extremely limited functionality due to the presence of vegetation (including dead vegetation) and debris within the channels. Under these circumstances, during the event, which was nevertheless unusually intense, so-called “dam break” phenomena occurred within the canals themselves, producing anomalous flood waves with very pronounced flood peaks. Another interesting aspect is the marked discrepancy between the estimated return period for the rainfall event (close to, or in some cases exceeding, 1000 years) and that of the discharge (as mentioned, approximately 100 years). This anomaly could be explained by the fact that V-shaped thunderstorms produce highly localized precipitation cores; if such a core occurs at the rain gauge station, the associated return period will tend to be overestimated, while the cumulative rainfall over the area, by contrast, could be only moderately high.
Recent modelling work on leaky wooden dams highlights that effective flood mitigation cannot rely solely on attenuating peak flows. Wolstenholme et al. (2025), demonstrate that “natural expansion” areas (zones where water can safely spill, slow, and spread) are equally critical for regulating sediment fluxes and supporting geomorphic adjustments at the reach and catchment scale. These areas act as buffers that dissipate energy, promote temporary sediment storage, and reduce downstream sediment pulses that may otherwise amplify flood impacts. Incorporating space for lateral channel mobility and overbank inundation, therefore, enhances both hydraulic performance and long-term geomorphic resilience. The study underscores that natural flood management measures must be embedded within a broader landscape strategy that accommodates water, sediment, and morphological evolution together.
The structural fixes proposed can be considered a traditional approach to handling flood risk (which, for instance, includes bridge enlargement, gabions, reinforcement of levees, etc.). These short-term solutions are no longer sufficient to handle the increasing rainfall, sea-level rise, and continued development in floodplains that are making flooding worse. Furthermore, this strategy may perpetuate social inequities, leaving those who are the most vulnerable at greatest risk. The Flood Adaptation Hierarchy “FAH” (Peck et al., 2022) proposed a list of solutions examining decades of research and practice from around the United States and developing a way to make decisions about flood risk solutions.
Protecting and restoring natural floodplains means not building on them, removing human alterations and restoring water flows (tier 1 of FAH). It is obvious that, to do this, in many cases it will be necessary to intervene through expropriations, which may sometimes include the loss of crops or the inability to use the real estate above the affected land parcels. Tier 2 of FAH identifies as positive and encourages the adoption of such practices.
The other structural solutions proposed (e.g., bridge widening, gabions) are classified as low-priority adaptation/defence measures (FAH levels 3–6) that allow time to be gained, rather than as long-term solutions (Peck et al., 2022).
The research object of this work certainly highlighted the exceptional nature of the event in terms of intensity and, therefore, the need to consider climate change and integrate it into hydraulic studies and flood risk management maps. These studies may be considered very useful at the basin scale and PAI maps of flood areas could be updated, both derived from direct post-event observation and numerical modelling.
The estimated return periods following particularly significant rainfall events must take into account the changing climatic conditions in which these events occur; an assessment based solely on instrumental data could lead to conclusions that are far from reality.
Future research may focus on extending this type of multidisciplinary approach to other catchment areas (not considered in this paper) with similar settings and characteristics under the geological, geomorphological, hydraulic, hydrologic and urbanistic points of view, by extending it not only to affected watercourses but also looking to reduce the risk in watercourses in which the same criticalities are found.
Analysing the areas affected by the recent (September 2024) flooding events in Tuscany and Emilia-Romagna Regions in Italy, we noticed that some of the river basins affected are the same ones that were affected last September (i.e. Lamone, Reno, etc.). A similar situation was observed in Senigallia (AN) during the surveys carried out for this study. After the September 2022 floods in the Marche region, there were several instances of hydrometric thresholds being exceeded in the following months. At least one instance in December 2022 and one in May 2023 are remembered.
This was immediately linked to a statement made in March 2023 by farmers in Mulino Marazzana (Senigallia) during the on-field surveys. Several months after the main event, residents reported a groundwater level of 1.5 m below ground level, compared to the usual constant level of 4.5 m recorded in “peacetime”. Our consideration may seem obvious, but the fact that the piezometric level of the sub-riverbed aquifer has risen may promote new flooding (the capacity to store excess water underground would be greatly inhibited by the availability of space in the unsaturated zone). Although we are aware that, during storms, most of the water runs off the surface (runoff) without penetrating too deeply, we believe it is appropriate to mention this consideration.
This study documents the exceptional geomorphological and hydrological impacts of the September 2022 flood and provides an integrated analysis of processes, impacts, and implications for risk mitigation. The results underscore the need for a paradigm shift in floodrisk management, moving beyond traditional structural measures toward strategies that restore natural processes and enhance catchmentscale resilience.
Below, we provide a bulletpoint list of the key takehome messages emerging from this study.
-
Extreme rainfall was concentrated in the mountainous area, while the coast received almost no precipitation, an asymmetry that critically influenced risk perception and contributed to fatalities.
-
Geomorphological impacts were widespread and severe, reflecting both natural controls and decades of anthropization of floodplains.
-
Monitoring networks proved inadequate, with several hydrometers failing during the event, compromising realtime assessment and warning capability.
-
Hydrological–hydraulic modelling confirmed the severity of the event but revealed discrepancies between simulated and observed peak flows, likely linked to channel obstruction and local “dambreak” dynamics.
-
Traditional structural measures alone cannot mitigate future floods; restoring natural floodplains is considered essential for longterm resilience.
-
Climate change must be explicitly incorporated into hazard assessments and floodrisk mapping.
-
The multidisciplinary approach adopted here can be applied to other catchments with similar geomorphological and hydraulic characteristics.
-
Effective hydraulicrisk management requires an integrated approach combining geomorphological field surveys, spatiotemporal analyses, satellite data, and numerical modelling, supported by coordinated action between technical experts and policy makers to ensure that scientific evidence is translated into effective communication, planning and mitigation strategies.
The authors specify that all data were taken from public domains. For those interested in obtaining the extensive dataset collected during the field survey or used in the modelling, it can be requested from the authors, who remain available.
Conceptualisation: F.B., P.F.; Methodology: F.B., P.F.; Writing: F.B. – original draft preparation: F.B.; Writing - review and editing: F.B., M.M.; Funding acquisition: P.F.; Supervision: P.F., M.B., M.M. Material preparation and data collection were performed by F.B., M.M.; M.B. and M.M. performed drone surveys and hydrologic-hydraulic modelling. All authors read and approved the final manuscript.
The contact author has declared that none of the authors has any competing interests.
Publisher's note: Copernicus Publications remains neutral with regard to jurisdictional claims made in the text, published maps, institutional affiliations, or any other geographical representation in this paper. The authors bear the ultimate responsibility for providing appropriate place names. Views expressed in the text are those of the authors and do not necessarily reflect the views of the publisher.
There is an agreement (STI532001 – Accordo Regione Marche “Studi bacino fiume Misa-Nevola” – Farabollini) between the Geology Division of the University of Camerino and the Commissarial structure of the Marche Region for the drafting of technical-economic feasibility projects for risk mitigation in vulnerable areas. Piero Farabollini has received research support from the Marche Region.
This paper was edited by Olga Petrucci and reviewed by two anonymous referees.
Archivio di Stato di Roma: Catasto Gregoriano, https://imagoarchiviodistatoroma.cultura.gov.it/Gregoriano/mappe.php (last access: 12 February 2026), 2026.
Aringoli, D., Bisci, C., Farabollini, P., Gentili, B., Giacopetti, M., Materazzi, M., and Pambianchi, G.: L'estate di San Martino: prime considerazioni sull'alluvione del 10-11-12 novembre e del 1–2 dicembre 2013 nelle Marche, Geologi. Marche, 52, 9–13, 2013.
Aulitzky, H.: Preliminary two-fold classification of torrents, in: Proceedings International Symposium Interpraevent, Bad Ischl., 4, 285–309, 1980.
Barredo, J. I.: Normalised flood losses in Europe: 1970–2006, Nat. Hazards Earth Syst. Sci., 9, 97–104, https://doi.org/10.5194/nhess-9-97-2009, 2009.
Bendia, F., Farabollini, P., Aringoli, D., Bisci, C., Bufalini, M., Gentilucci, M., Lampa, F., Materazzi, M. and Pambianchi, G.: The flood events of September 2022 in the Marche region (Italy): meteo-climatic and geomorphological-hydraulic analysis, in: Proceedings of the 4th Mediterranean Geoscience Union, Spain, 25–28 November 2024, p. 1063, 2025.
Bufalini, M., Farabollini, P., Fuffa, E., Materazzi, M., Pambianchi, G., and Michele, T.: The significance of recent and short pluviometric time series for the assessment of flood hazard in the context of climate change: examples from some sample basins of the Adriatic Central Italy, Aims Geosci., 5, 568–590, https://doi.org/10.3934/geosci.2019.3.568, 2019.
CIMA, 2022: Marche: il punto di vista scientifico, https://www.cimafoundation.org/news/marche-il-punto-di-vista-scientifico/ (last access: 12 February 2026), 2026.
Civil Protection of the Marche region: Rapporto di Evento Preliminare 15–17 Settembre 2022, https://www.regione.marche.it/Regione-Utile/Protezione-Civile/Maltempo-Settembre-2022 (last access: 5 January 2024), 2022.
Copernicus Emergency Management Service, EMSR634: Flood in Marche and Umbria regions, Italy, https://mapping.emergency.copernicus.eu/activations/EMSR634/ (last access: 10 May 2023), n.d..
Corti, M., Francioni, M., Abbate, A., Papini, M., and Longoni, L.: Analysis and modelling of the September 2022 flooding event in the Misa Basin, Ital. J. Eng. Geol. Environ., 1, 69–76, https://doi.org/10.4408/IJEGE.2024-01.S-08, 2024.
De Lucia, C., Amaddii, M., and Arrighi, C.: Tangible and intangible ex post assessment of flood-induced damage to cultural heritage, Nat. Hazards Earth Syst. Sci., 24, 4317–4339, https://doi.org/10.5194/nhess-24-4317-2024, 2024.
Donnini, M., Santangelo, M., Gariano, S. L., Bucci, F., Peruccacci, S., Alvioli, M., Althuwaynee, O., Ardizzone, F., Bianchi, C., Bornaetxea, T., Brunetti, M.T., Cardinali, M., Esposito, G., Grita, S., Marchesini, I., Melillo, M., Salvati, P., Yazdani, M., and Fiorucci, F.: Landslides triggered by an extraordinary rainfall event in Central Italy on September 15, 2022, Landslides, 20, 2199–2211, https://doi.org/10.1007/s10346-023-02109-4, 2023
Dottori, F., Darienzo, M., Fagugli, G., Gabellani, S., Ghizzoni, T., Ottonelli, D., Pignone, F., and Trasforini, E.: Appraising and reducing riverine flood risk: a case study from Central Italy, EGU General Assembly 2024, Vienna, Austria, 14–19 Apr 2024, EGU24-8531, https://doi.org/10.5194/egusphere-egu24-8531, 2024.
European Environment Agency (EEA): “The European environment – state and outlook 2020: Knowledge for transition to a sustainable Europe” EEA Report No. 10/2021, 2021.
European Environment Agency (EEA): “European flood risk assessment” EEA Report No. 10/2020, 2024.
European Parliament and Council: “Directive 2007/60/EC of the European Parliament and of the Council on the assessment and management of flood risks” Official Journal of the European Union, L 288/27, 2007.
Farabollini, P. and Materazzi, M.: Maggio, 2014; Siamo alle solite, È ora di cambiare la rotta!, Geologi. Marche, 54, 4–9, 2014.
Farabollini, P. and Bendia, F.: Assetto geologico e sismotettonico. In: La Microzonazione sismica delle Marche – 10 anni di attività, a cura di Albarello D. and Tiberi P., Ancona, Regione Marche, Direzione Protezione Civile e Sicurezza del Territorio, 77–105, 2022.
Federico, S., Torcasio, R. C., Avolio, E., Caumont, O., Montopoli, M., Baldini, L., Vulpiani, G., and Dietrich, S.: The impact of lightning and radar reflectivity factor data assimilation on the very short-term rainfall forecasts of RAMS@ISAC: application to two case studies in Italy, Nat. Hazards Earth Syst. Sci., 19, 1839–1864, https://doi.org/10.5194/nhess-19-1839-2019, 2019.
Gennari, E., Biagiotti, F., Mengarelli, D., Striglio, G., and Cristallo, C.: La gestione dell'emergenza nell'ultimo miglio: il caso dell'alluvione nelle Marche del 15 settembre 2022, Geologia dell'Ambiente- Periodico trimestrale della Società Italiana di Geologia Ambientale 1/2023, 3–11, https://www.sigeaweb.it/documenti/gda/gda-1-2023.pdf (last access: 12 February 2026), 2023.
Gentilucci, M., Rossi, A., Pelagagge, N., Aringoli, D., Barbieri, M., and Pambianchi, G.: GEV Analysis of Extreme Rainfall: Comparing Different Time Intervals to Analyse Model Response in Terms of Return Levels in the Study Area of Central Italy, Sustainability, 15, 11656, https://doi.org/10.3390/su151511656, 2023.
Guglielmo, G. and Verdicchio, D.: Analisi statistica dell'evento pluviometrico del 15 settembre 2022 nella regione Marche”, Report on line, https://www.meteoregionelazio.it/wpcontent/uploads/2022/10/Analisi-statistica-Marche.pdf (last access: 12 January 2024), 2022.
Idrologia Polito: L'evento pluviometrico del 15 settembre 2022 nelle Marche è eccezionale?, Idrologia@Polito, http://www.idrologia.polito.it/web2/2022/09/levento-pluviometrico-del-15-settembre-2022-nelle-marche (last access: 12 February 2026), 26 September 2022.
Johnson, A. M. and Rodine, J. R.: Debris flow. Slope Instability, Wiley, New York, NY, 257–361 pp., 1984.
Jongman, B., Hochrainer-Stigler, S., Feyen, L., Aerts, J. C., Mechler, R., Botzen, W. W., and Ward, P. J.: Increasing stress on disaster-risk finance due to large floods, Nat. Clim. Change, 4, 264–268, 2014.
Kirpich, Z. P.: Time of concentration of small agricultural watersheds, Civil Eng., 10, 362, 1940.
Mattavelli, R.: Analysis of the erosional processes following the September 2022 flood in the Misa basin, M.S. thesis, School of civil, environmental and land management engineering, Polytechnic University of Milan, Italy, 150, 2022.
Morelli, S., Bonì, R., Guidi, E., De Donatis, M., Pappafico, G., and Francioni, M.: L'alluvione delle Marche del 15 settembre 2022, cause e conseguenze, Cult. Territ. Linguaggi, 24, 136–147, 2023.
Peck, A. J., Adams, S. L., Armstrong, A., Bartlett, A. K., Bortman, M. L., Branco, A. B., Brown, M. L., Donohue, J. L., Kodis, M., McCann, M. J., and Smith, E.: A new framework for flood adaptation: introducing the Flood Adaptation Hierarchy, Ecol. Soc., 27, https://doi.org/10.5751/ES-13544-270405, 2022.
Pulvirenti, L., Squicciarino, G., Fiori, E., Candela, L., and Puca, S.: Analysis and Processing of the COSMO-SkyMed Second Generation Images of the 2022 Marche (Central Italy) Flood, Water, 15, 1353, https://doi.org/10.3390/w15071353, 2023.
Regional Agro- meteorological Service of AMAP Regione Marche: Analisi dell'intenso maltempo delle giornate 15 e 17 settembre 2022, blog meteo ASSAM, http://www2.meteo.marche.it/blogmeteoassam.aspx?postid=d3c62916-2e06-4f99-8a96-444bdd92cc02 (last access: 12 February 2026), 22 September 2022.
Regione Marche (n.d.): Cartografia e informazioni territoriali, https://www.regione.marche.it/Regione-Utile/Ambiente/Cartografia-e-informazioni-territoriali/OpenData (last access: 12 February 2026), 2024.
Santangelo, M., Althuwaynee, O., Alvioli, M., Ardizzone, F., Bianchi, C., Bornaetxea, T., Brunetti, M.T., Bucci, F., Cardinali, M., Donnini, M., Esposito, G., Gariano, S. L., Grita, S., Marchesini, I., Melillo, M., Peruccacci, S., Salvati, P., Yazdani, M., and Fiorucci, F.: Inventory of landslides triggered by an extreme rainfall event in Marche-Umbria, Italy, on 15 September 2022, Sci. Data, 10, 427, https://doi.org/10.1038/s41597-023-02336-3, 2023.
Santoni, G. and Morici, R.: Misa Amaro. Piogge intense, inondazioni e alluvioni storiche a Senigallia, Biblioteca comunale antonelliana Senigallia, https://biblioteca.comune.senigallia.an.it/biblioteca-digitale/libri-digitali/misa-amaro/ (last access: 12 February 2026), 2021.
Savelli, D., Nesci, O., and Basili, M.: Evidenze di un apparato glaciale pleistocenico sul Massiccio del Catria (Appennino Marchigiano), Geogr. Fis. Din. Quat., 18, 331–335, 1995.
SIRMIP: Regional Weather-Hydro-Pluviometric Information System, Centro Funzionale Multirischi della Protezione Civile, http://app.protezionecivile.marche.it/sol/indexjs.sol?lang=it (last access: 12 February 2026), 2022.
Tarquini S., Isola, I., Favalli, M., Battistini, A., and Dotta, G.: TINITALY, a digital elevation model of Italy with a 10 meters cell size (Version 1.1), Istituto Nazionale di Geofisica e Vulcanologia (INGV), https://doi.org/10.13127/tinitaly/1.1, 2023.
Torcasio, R. C., Papa, M., Del Frate, F., Dietrich, S., Toffah, F. E., and Federico, S.: Study of the Intense Meteorological Event Occurred in September 2022 over the Marche Region with WRF Model: Impact of Lightning Data Assimilation on Rainfall and Lightning Prediction, Atmosphere, 14, 1152, https://doi.org/10.3390/atmos14071152, 2023.
Trigila, A., Iadanza, C., Lastoria, B., Bussettini, M., and Barbano, A.: Dissesto Idrogeologico in Italia: Pericolosità e Indicatori di Rischio, ISPRA: Rome, Italy, ISBN 978-88-448-1085-6, 2021.
Valentini, L., Guerra, V., and Nesci, O.: The Mt. Catria–Mt. Nerone Ridge in the North-Marchean Apennines (Central Italy): A Potential Geopark?, Sustainability, 15, 11382, https://doi.org/10.3390/su151411382, 2023.
Wolstenholme, J. M., Skinner, C. J., Milan, D., Thomas, R. E., and Parsons, D. R.: Hydro-geomorphological modelling of leaky wooden dam efficacy from reach to catchment scale with CAESAR-Lisflood 1.9j, Geosci. Model Dev., 18, 1395–1411, https://doi.org/10.5194/gmd-18-1395-2025, 2025.