the Creative Commons Attribution 4.0 License.
the Creative Commons Attribution 4.0 License.
 | 04 Mar 2026
Changing drivers of regional large magnitude avalanche frequency throughout Colorado, USA
Justin T. Martin
Ethan M. Greene
Nicolas Eckert
Adrien Favillier
Jason Konigsberg
Nickolas Kichas
Daniel K. Stahle
Karl W. Birkeland
Kelly Elder
Gregory T. Pederson
Large magnitude snow avalanches (destructive size ≥ D3) impact settlements, transportation corridors, and public safety worldwide. In Colorado, United States, avalanches have killed more people than any other natural hazard since 1950. In March 2019, a large magnitude avalanche cycle occurred throughout the entire mountainous portion of Colorado resulting in more than 1000 reported avalanches during a two-week period. Nearly 200 of these avalanches were size D4 or larger with at least three D5 avalanches. However, placing this 2019 large magnitude avalanche cycle in historic context requires data prior to the instrumental record. Here, we paired tree disturbance data from dendrochronology (1698 to 2020) with meteorological data from the modeled and instrumental record (1901 to 2020) to understand the frequency and climate drivers of large magnitude snow avalanche cycles. The extensive number of downed trees from the 2019 avalanche cycle allowed us to collect 1,188 cross-sections and cores from 1023 individual trees within 24 avalanche paths across the state. From these samples we identified 4135 avalanche-related growth disturbances. We employed a strategic nested sampling design to spatially aggregate avalanche frequency from individual avalanche paths, to counties, to three major sub-regions (i.e., north, central, and south), and across the entire region (i.e., state of Colorado). Over a period spanning more than three centuries (1698 to 2020), we identified 76 avalanche years within 24 individual avalanche paths. Large magnitude avalanche event frequency varied across paths and sub-regions with several notable region-wide avalanche cycles. Both tree-ring and historical written records highlighted 1899 as a year with widespread and large magnitude avalanche activity similar to the March 2019 avalanche cycle. Since the early-20th century (1900 to 2020) regional avalanche probability declined significantly in parallel with decreasing snowpack throughout Colorado. Similarly, dominant avalanche regimes shifted from large magnitude regional cycles driven by above average snowfall years over most of the record, to regional avalanche cycles occurring more commonly in average to low snow years since 1988. In recent decades, a lack of December precipitation and above average March precipitation characterized years with regional large magnitude avalanche activity. Even with declining snow water equivalent, truly extreme regional large magnitude avalanche cycles remain possible – as demonstrated by the 2019 cycle. This underscores that rare but high-impact events are not eliminated by long-term trends. Understanding the changing snow and weather drivers and subsequent behavior of large magnitude avalanche cycles across multiple spatial scales may improve avalanche forecasting and the products and mitigations strategies developed by structural engineers to mitigate avalanche danger. This can decrease the avalanche risk to the public and improve infrastructure design in avalanche terrain.
- Article
(5418 KB) - Full-text XML
-
Supplement
(1781 KB) - BibTeX
- EndNote


Large magnitude avalanches impact settlements, transportation corridors, and public safety worldwide. In Colorado, United States, avalanches alone are responsible for more human fatalities than any other natural hazard since 1950 (CAIC, 2025b). Avalanche safety and forecasting operations protect public safety and require a sound understanding of the weather and snowpack contributory factors that drive regional large magnitude cycles. Most automated forecasting tools explicitly or implicitly use the assumption of a stationary relationship between avalanche activity and snow and weather conditions over time (Dkengne Sielenou et al., 2021; Pérez-Guillén et al., 2022; Viallon-Galinier et al., 2023). However, stationarity can be a poor assumption under a non-stationary climate. Therefore, incorporating temporal changes in the weather and snowpack factors that drive avalanches can improve regional forecasting and predictive capacity of these automated tools.
Although weather directly influences snowpack structure and avalanches on daily to seasonal timescales, climate works as a background influence on snowpack characteristics and ultimately defines the avalanche climate (e.g., coastal, continental) (Mock et al., 2016; Mock and Birkeland, 2000) or prevalent avalanche problem type (e.g. slab, loose, wet, etc.) (Reuter et al., 2023; Haegeli et al., 2021). Hence, identifying factors that control avalanche activity at interannual and decadal time scales places widespread, large avalanche cycles and extreme events in historic context, and advances our understanding of how future changes in avalanche activity may impact society (García-Sellés et al., 2010; McClung, 2013; Haegeli et al., 2021). Several studies link broad (synoptic) atmospheric patterns with avalanche activity in mountainous areas across the world, but specific changes in climate-related avalanche occurrence are often regionally dependent. Despite strong spatial and temporal variability and uncertainty of climate impacts on avalanche activity (Eckert et al., 2024), several studies have demonstrated a decreasing trend in regional large magnitude avalanche activity (Peitzsch et al., 2021a), a decrease in avalanche frequency at low elevations (Giacona et al., 2021) and an increase in avalanche runout elevation (Giacona et al., 2021; Eckert et al., 2010) due to declining snowpacks. Additionally, research suggests warming temperatures drive an increase in the proportion of wet snow avalanches (Pielmeier et al., 2013; Naaim et al., 2016; Ballesteros-Canovas et al., 2018; Mayer et al., 2024), a decrease in the proportion of avalanches with a powder cloud (Eckert et al., 2013), or a shift in avalanche climate types resulting in relatively novel weather-related avalanche events for a region (Eckert et al., 2024). For example, in the northern Rocky Mountains, United States, an increase in spring avalanche events driven by warm spring temperatures potentially counters the general decrease in winter avalanche activity driven by reduced winter snowpack (Peitzsch et al., 2021a). In contrast, avalanche activity at upper elevations increased in parts of the French Alps due to increased precipitation in a warming climate (Lavigne et al., 2015).
The influence of changing atmospheric conditions on avalanche type, behavior, and frequency is evident in future avalanche projections. Several studies project increases in conditions favorable for wet avalanche activity coincident with a decrease in dry slab avalanche activity in the French and Swiss Alps (Castebrunet et al., 2014; Mayer et al., 2023). Before the end of the 21st century, the onset of wet snow avalanches is also expected to occur earlier in late winter to early spring in the Swiss Alps (Kruyt et al., 2023) and Colorado (Lazar and Williams, 2008). Increased precipitation at upper elevations and decreased lower elevation snowpack may also lead to increased avalanche hazard at upper elevations and fewer avalanches at lower elevations (Mayer et al., 2024). These results are consistent with past observations suggesting continued changes in snow and weather conditions in the future (Eckert et al., 2024). However, no prior study has examined decadal and centennial changes in snow and meteorological drivers of regional large magnitude avalanche activity and associated trends in the context of a non-stationary climate.
Understanding past avalanche frequency and magnitude helps place current and projected avalanche behavior, type, and timing in context. In March 2019, a large and extensive state-wide avalanche cycle occurred in Colorado, United States. This event provided an opportunity to collect tree samples to produce a spatially extensive historical dendrogeomorphic-avalanche record making this retrospective avalanche frequency analysis possible.
1.1 March 2019 Colorado avalanche cycle
Prior to the March 2019 state-wide avalanche event, Colorado received abundant early-season snow in late October and early November of 2018. An extended dry period followed in November and early December allowing faceted snow crystals (depth hoar) to develop at the base of the snowpack. Subsequent small storm events in January and February increased snow depths to average and above-average levels across the state. In early March, a series of warm and wet Pacific storms over a period of 16 d brought heavy snowfall to many parts of Colorado where over 350 mm of snow water equivalent (SWE) accumulated across the wettest areas of Colorado, and 150 to 300 mm SWE across most other areas. Throughout the season the basal depth hoar layer gained strength and became less of an instability concern prior to the March storm events. However, the snowfall during this storm cycle eventually exceeded the strength of the critical weak layer, resulting in the largest avalanche cycle throughout Colorado in recent memory (Lazar, 2019).
The Colorado Avalanche Information Center (CAIC) recorded over 200 avalanches size D4 or larger during the early March cycle. For reference, the CAIC only recorded 25 D4 or larger avalanches over the previous nine winters. The March 2019 avalanche cycle impacted transportation and commerce across the state. Avalanches buried several vehicles along State Highway 91 and forced closures along Interstate 70 and U.S. Highway 550. The latter was closed for 18 d. Over the duration of the event, 23 people were caught in avalanches, resulting in two fatalities and four severe injuries. Avalanches damaged powerlines in at least five counties and impacted 10 other structures. The CAIC found no historical evidence of an avalanche cycle as destructive and widespread as the March 2019 cycle through observational records, historical publications, and interviews with longtime avalanche workers (Lazar, 2019).
1.2 Objectives
We examined changing frequency and drivers of large magnitude avalanches in the continental avalanche climate of Colorado. Previous studies demonstrated climate relationships with avalanche activity, but here we investigated how these relationships change in the context of a non-stationary climate. To address our central questions on the potential changing frequency and primary drivers of regional large magnitude avalanche events, we set out to achieve three main study objectives: (1) reconstruct a regional large magnitude avalanche (RLMA) chronology for Colorado (here we define regional as statewide); (2) quantify long-term trends and patterns in that chronology and how these relate to trends in atmospheric and snow conditions; and (3) identify snow and weather conditions that contribute to RLMA events, and study if these have changed over the last 120 years. Additionally, we also compared the extreme RLMA event of March 2019 with other major RLMA events within the 100+ year avalanche history to understand the potential frequency of such spatially extensive and destructive avalanche cycles.
2.1 Study Site
Our Colorado regional study site consists of 24 avalanche paths distributed throughout the state (Fig. 1). The winter climate in Colorado's mountains is characterized by cold temperatures and low relative humidity resulting in a continental avalanche climate (Mock and Birkeland, 2000; Armstrong and Armstrong, 1987). Cold-season snowfall ranges from 247 to 811 cm, with a 30-year (1981–2010) mean of 450 cm (Marraccini et al., 2014) throughout the study area. The starting zone elevation of sampled avalanche paths ranged from 3500 to 4100 m (a.s.l.) with a median elevation of approximately 3800 m (Table S1 in the Supplement). Most of the avalanche path start zones are in either alpine or subalpine environments with tracks and runout zones that descend into forested terrain. We collected 11 to 68 samples in each of the 24 avalanche paths located within three major sub-regions (north, central, and south) (Peitzsch et al., 2024). Individual avalanche paths within each sub-region encompass a range of spatial extents from several hundred meters apart to ∼ 68 km apart. The largest distance between any two sub-regions (north to south) is ∼ 245 km. Sites are adjacent to roads, ski areas, neighborhoods, utilities infrastructure, power transmission lines, and recreational access points.
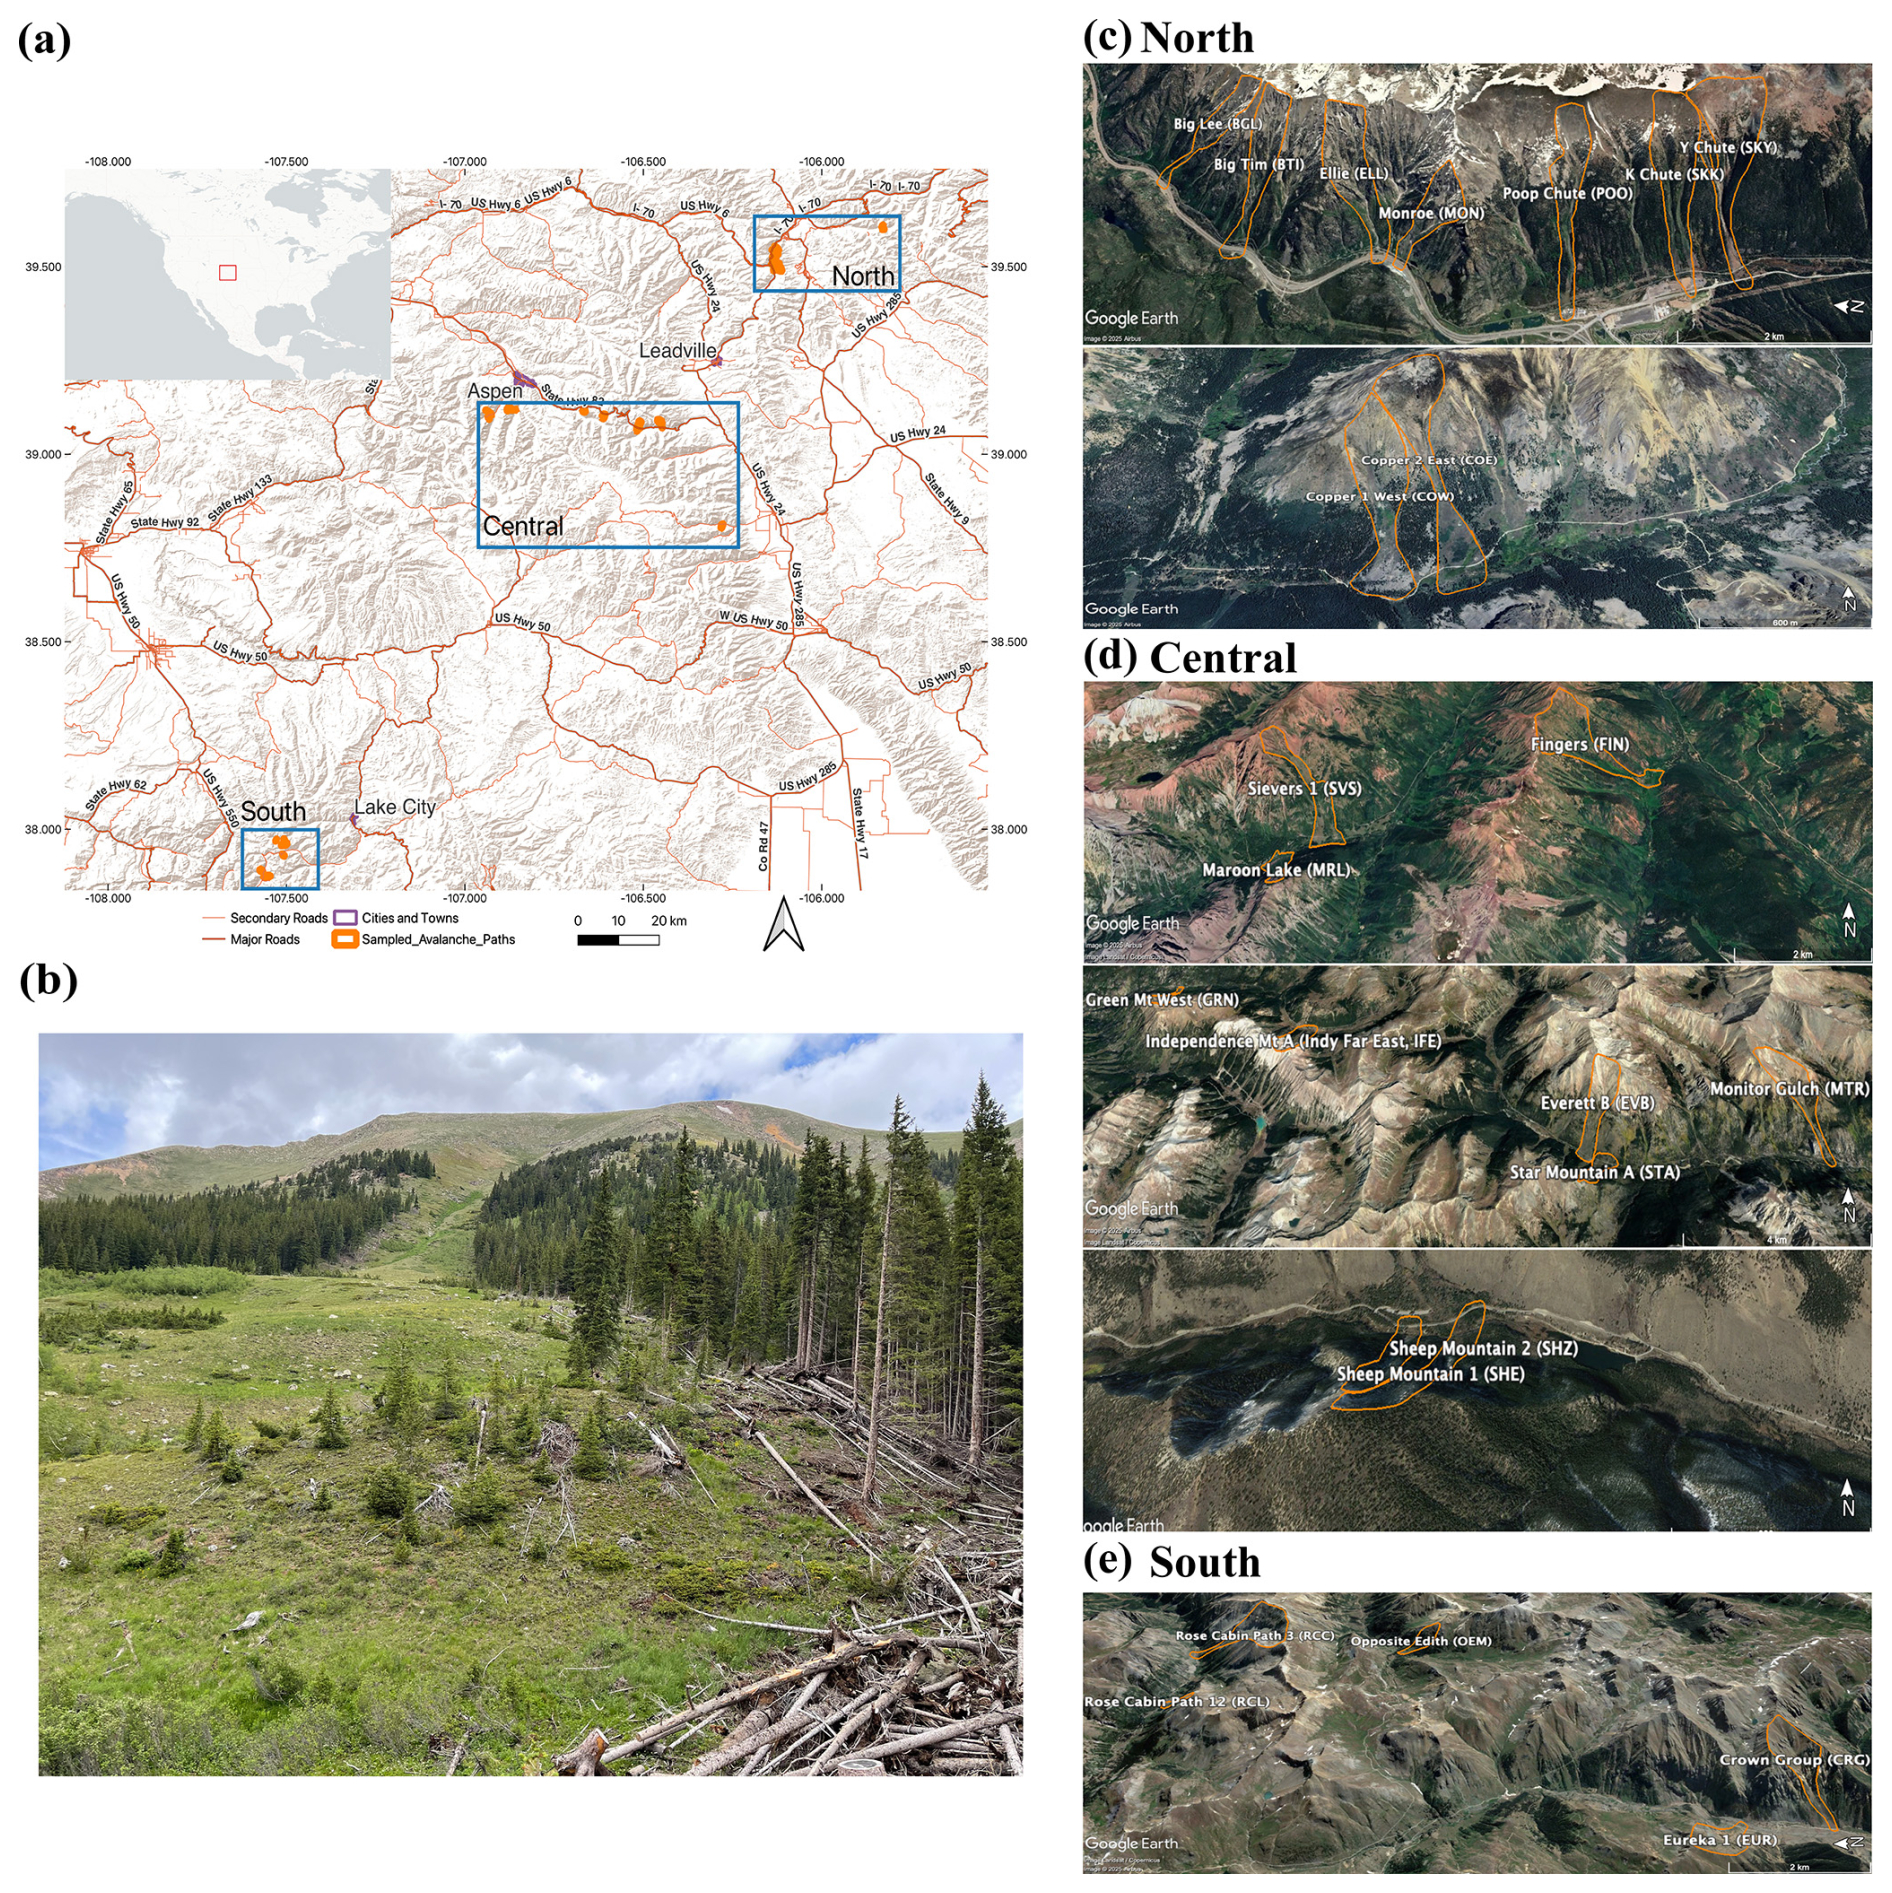
Figure 1(a) Overview of study area. The red rectangle within the inset map of North America represents the study area. (b) Green Mountain – an example avalanche path in the study area with downed trees similar to those sampled in this study. The sampled avalanche paths within the (c) north, (d) central, and (e) south sub-regions. Background maps/imagery in panel (a): ESRI (2025) | Powered by Esri. Satellite imagery in panels (c), (d), and (e): Imagery © 2025 Airbus, Landsat/Copernicus, Map data © 2025 Google. Photo in panel (b): Erich H. Peitzsch, U.S. Geological Survey.
2.2 Avalanche Year Reconstruction and Data
We used established dendrochronological methods that account for changing number and quality of samples through time to reconstruct an avalanche chronology from tree-ring data in each avalanche path (Favillier et al., 2017; Peitzsch et al., 2021b; Stokes and Smiley, 1996). The dataset primarily consisted of sampled cross-sections from dead and downed trees in the runout zone and along the trimline of each avalanche path (refer to Peitzsch et al., 2021b, for a full description of methods). After preparing each sample, we visually and statistically cross-dated the records to calendar year accuracy using tree-ring chronologies developed from undisturbed forests outside the avalanche path, and from nearby pre-existing publicly available tree-ring records (ITRDB, 2022).
We implemented a multi-step process to reconstruct avalanche years by: (1) classifying the quality of each tree-ring growth response (Class 1 to 6) (Reardon et al., 2008); (2) using a threshold for avalanche years based on the number of trees alive in that year and the number of growth responses; and (3) creating a weighted index (Wit) based on growth response quality (Favillier et al., 2018, 2017; Peitzsch et al., 2021b). A full description of this method can be found in Sect. 2.4 in Peitzsch et al. (2021b).
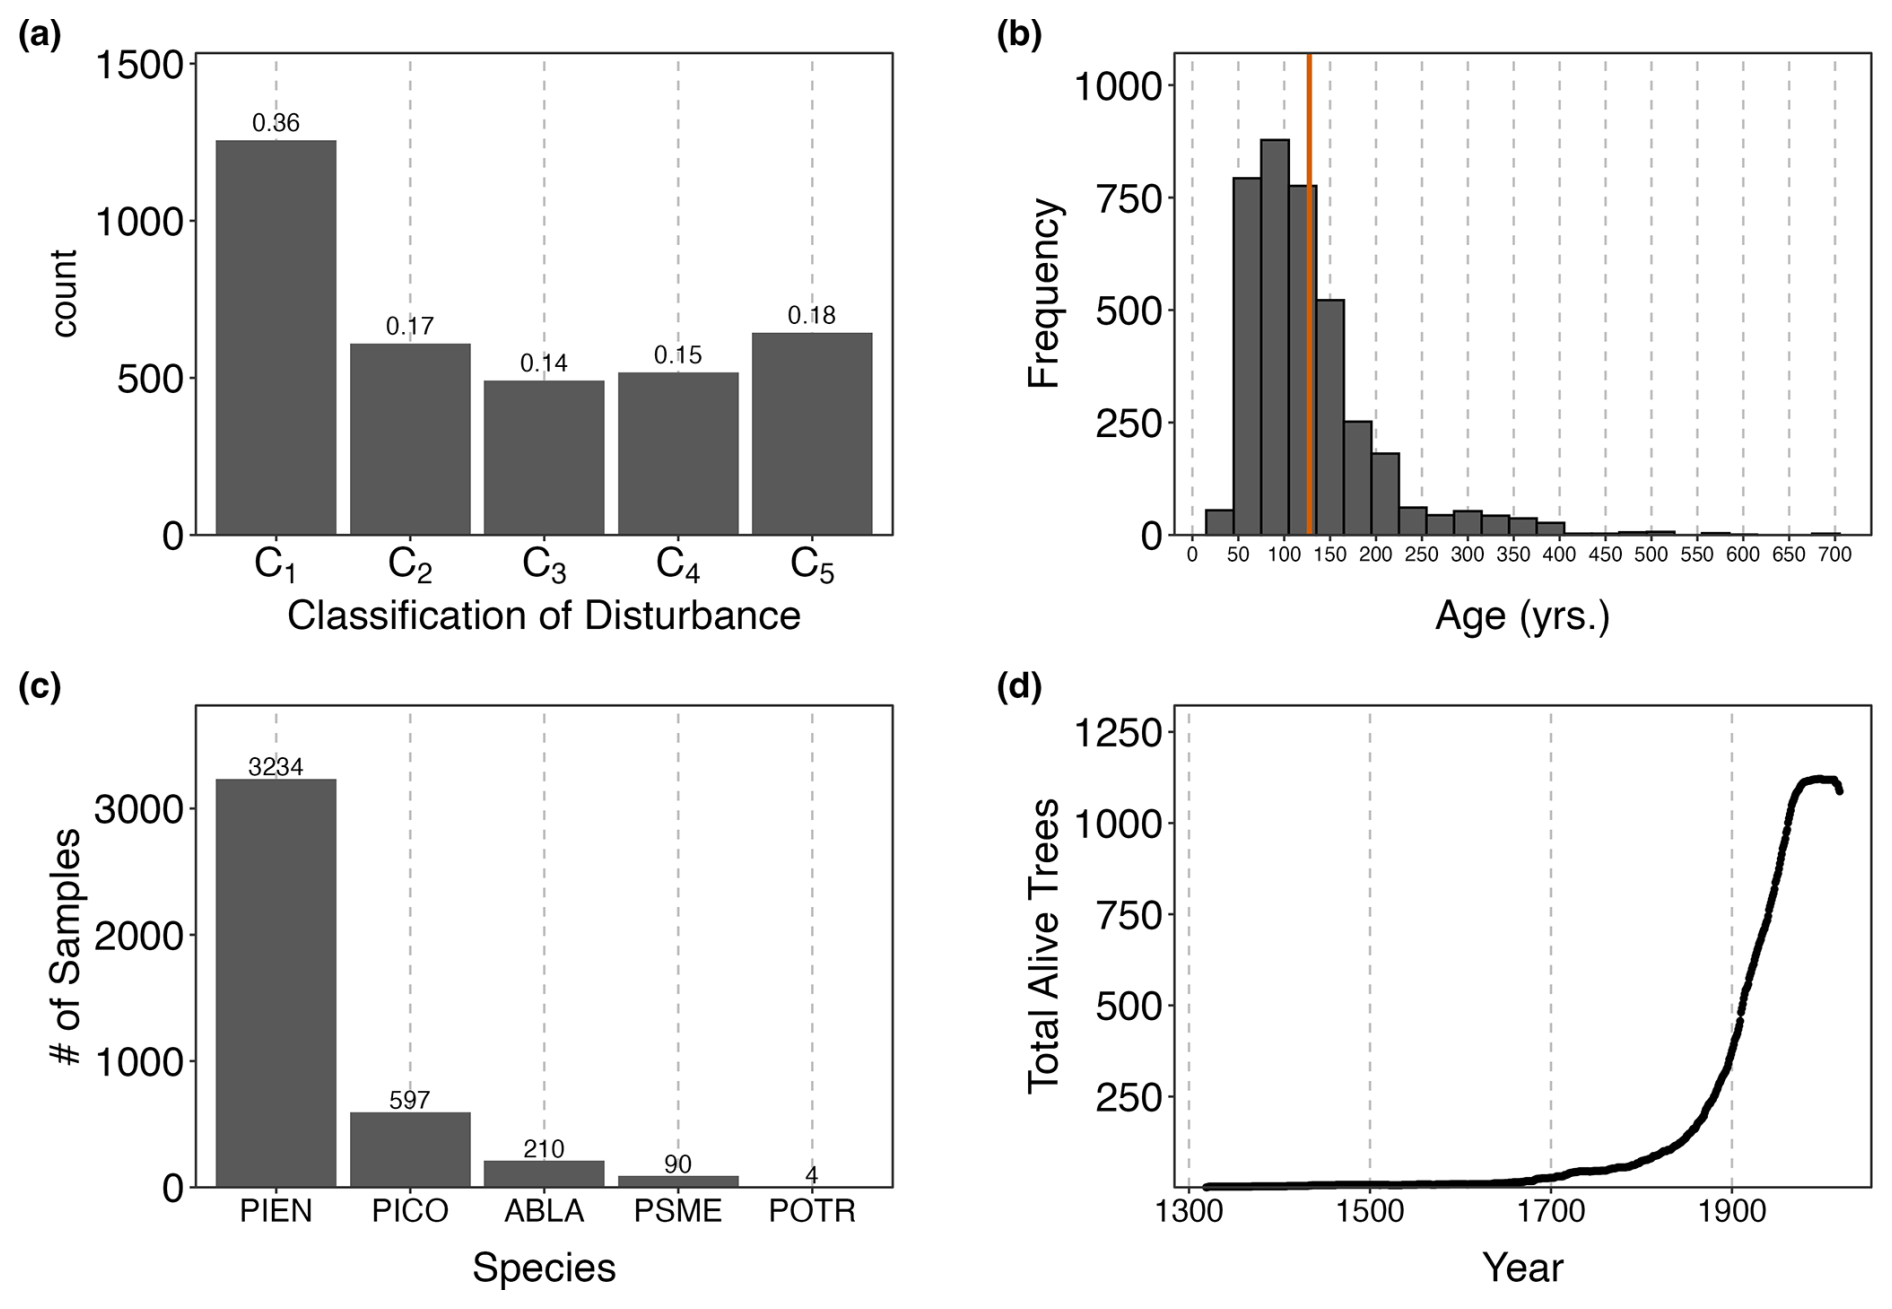
Figure 2Column plots of (a) number and proportion (listed above each bar) of avalanche-related growth disturbances ranked with a response quality classification ranging from C1 (highest quality) to C5 (lowest quality) events, (b) the cambial age of each sample (red line represents mean age), (c) the number (listed above bar) of each species within the dataset. Species codes used in panel (c) represent: PIEN as Engelmann spruce (Picea engelmannii), PICO as lodgepole pine (Pinus contorta), ABLA as subalpine fir (Abies lasiocarpa), PSME as Douglas-fir (Pseudotsuga menziesii), and POTR as quaking aspen (Populus tremuloides), and (d) the total number of sampled trees alive per year across the region.
The extensive number of downed trees from the March 2019 avalanche cycle allowed us to collect 1188 cross-sections and increment cores from 1023 individual trees within 24 avalanche paths across the region. From these samples, we identified 4135 probable avalanche-related growth disturbances. We classified over 30 % of the growth responses as C1 (highest quality), and the mean age of sampled trees was 127 years (Fig. 2a and b). Most of the cross-section samples originated from Engelmann spruce trees (Picea engelmannii) followed by lodgepole pine (Pinus contorta), subalpine fir (Abies lasiocarpa), with a few Douglas-fir (Pseudotsuga menziesii) and quaking aspen (Populus tremuloides) also included (Fig. 2c).
2.3 Time Series of Avalanche Probability
We reconstructed a regional avalanche chronology for Colorado using a hierarchical Bayesian modelling (HBM) approach developed by Favillier et al. (2023) specifically for producing tree-ring derived regional avalanche chronologies. In our study, we define avalanche occurrence in an individual path i (within a total of N paths) in year t (over a total of T years) as a binary Bernoulli variable (avalanche/no avalanche) with probability pit:
The decomposition of time and space at the logit level (0,1) is:
where a0 is a constant related to the overall mean activity, vi is the spatial component of the signal related to topographic variables, such as elevation and aspect, that influence avalanche activity at the single path scale, gt+zt is the detrended temporal anomaly, defined as the sum of the long-term smoothed trend (gt) with interannual variability (zt), and POTit is the dendrogeomorphic potential, or the potential function that accounts for changes in the number of living trees in each path over the study period. The constraints and are set as identifiers using . Favillier et al. (2023) provide a full explanation of the potential function as originally used for dendrogeomorphic applications in a group of avalanche paths.
Our initial attempts in applying the original HBM (Eq. 2) to our dataset identified issues related to one of two central assumptions of the model: (i) a temporal signal common to all paths exists within the dataset, and (ii) this temporal signal can be decomposed as a smooth component with interannual variability. Assumption (i) holds true for our dataset and we could demonstrate a common temporal signal across paths by any measure of similarity between the path-scale timeseries. However, assumption (ii) could not be met due to several individual years of high avalanche activity common across most paths (e.g., the 2019 avalanche cycle).
Consequently, we simplified the model by removing the smooth component (i.e. the model used in Favillier et al., 2023 without the g term [gt=0 for all t]), which eliminated the assumption (ii) requirement from the modeling framework. The revised model consisted of: (i) a generalized linear model, where the logit is decomposed with full separability between space and time; and (ii) the use of spatial and temporal terms modeled as latent Gaussian distributions within the HBM, which structures the signal. Therefore, the full variability of the dataset is decomposed in three terms: spatial, temporal, and tree potential. Compared to the original model from Favillier et al. (2023), the updated model provides the mean annual probability (pt) at the regional scale instead of the mean annual probability and its decomposition between a smooth term and internal variability. These mean annual probabilities account for the expected decrease in, or complete lack of, trees present to record avalanche activity further back in time. As a result, the mean annual avalanche probability for years lacking sufficient evidence of growth disturbances is small but never zero.
To classify years as RLMA years from these probabilities, we first fit a line separating all probabilities resulting from observed growth disturbances (e.g. empirical event frequencies at the regional scale) from those probabilities that resulted solely from the modeled potential of a given path to record avalanche activity based on the number of trees present. Next, we set all probabilities below this line to zero. This approach limited the classification of avalanche years to only those years with actual physical evidence of avalanche activity but still retains HBM mean annual probability estimates that account for the decreasing population of trees present to record path level avalanche activity further back in time. These HBM estimates may be closer to reality further back in time due to limited tree-ring data. However, limiting the classification of RLMA years to only those with physical evidence of RLMA activity also focuses subsequent trend analyses on only those years with clear evidence of RLMA activity but does not change the trend slope or sign resulting from modeled probabilities within those high-confidence years.
We then used this annual regional probability (pt) for trend analysis and identification of temporal breakpoints first across the full sample of paths, from 1806 to 2019, and secondarily for a common-period subset (1900 to 2019) over which many paths had avalanche data available. The full period bounds were chosen because 1806 was the first year with at least two paths with available avalanche data, and after 2019, most of the paths lacked living trees.
2.4 Historical Record Comparison
Historical avalanche observations in Colorado, specifically the central and northern mountains of the state, extend back to the mid-19th century (Martinelli and Leaf, 1999). We qualitatively compared our tree-ring derived avalanche chronology for three sub-regions in Colorado (north, central, and south) to public and professional observations from the CAIC database (CAIC, 2025a) and avalanches documented by Martinelli and Leaf (1999). We chose the period from 1980 to 2019 to maximize quality observations from the historical dataset and leverage the highest temporal resolution of snow and weather data that is consistent with subsequent avalanche-climate analysis. We further limited the observational record used for comparison to only those observations for which confidence in the assessment of destructiveness and spatial distribution was high. Avalanche observations from these sources have become more robust in recent years, and this initial validation for the entire regional chronology provides an independent measure of how well the tree-ring reconstruction captures avalanche activity.
2.5 Avalanche-Climate Relationships
To characterize the weather and snowpack drivers and climate conditions associated with large magnitude avalanche cycles, we utilized several gridded climate datasets along with observation-based and modeled snowpack estimates. We utilized the NClimGrid th degree gridded monthly temperature and precipitation data (Vose et al., 2014) and coupled those data with gridded monthly water balance model estimates of monthly snowfall and total snowpack snow water equivalent (SWE) based on NClimGrid inputs (Wieczorek et al., 2022) for water-years (October–September) 1901 to 2020. A water year is the 12-month period beginning 1 October for any given year through 30 September of the following year. A water year is designated by the calendar year in which it ends. To assess the skill of the monthly water balance model at estimating snowfall over the study area, we compared the gridded snow product with local snow course records from the United States Department of Agriculture Natural Resources Conservation Service (NRCS) (NRCS, 2024). We linked each avalanche path to its th degree grid cell and aggregated path-level 1 April modeled SWE estimates across the full study area to provide a regional modeled estimate of 1 April SWE from 1901–2020. We then identified the closest NRCS snow course site to each path which provided a snow course-based 1 April SWE estimate for each path from one of six snow course sites including Lake City, Saint Elmo, Twin Lakes Tunnel, Shrine Pass, Independence Pass, and Ironton Park. We then aggregated these snow course records across the study area and compared them to the modeled SWE estimates across the 1950–2020 period common to both records. Because no observational record exists for snowfall at the path locations themselves, neither the modeled nor snow-course based estimates can be viewed as a benchmark for the other record. Rather, we observed good agreement between the two records (r = 0.89) and thus consider the modeled snow product to adequately represent annual snowfall and snow cover dynamics over the study area for further analysis (Fig. S1). We then examined linear trends for modeled SWE from 1901 to 2019 to match the modern era record of avalanche probability.
We assessed climate and snowpack associations with large magnitude avalanche cycles over the full 1901–2019 period by comparing seasonal values of air temperature (°C), snowfall (mm SWE), and snowpack (mm SWE) from years with versus years without RLMA events. We calculated seasonal values from the average monthly values across all avalanche paths in the study area. Winter season values are the average of November through March values, and 1 April SWE is the average of the modeled total March snowpack (i.e., modeled total accumulated SWE by the end March) across all paths. We used Wilcoxon's rank-sum test to detect significant difference (α=0.05) in the values of seasonal climate and snowpack variables between avalanche years and non-avalanche years (Fig. S2). We identified the variables that showed significant differences between avalanche and non-avalanche years as potential drivers of large magnitude avalanche cycles.
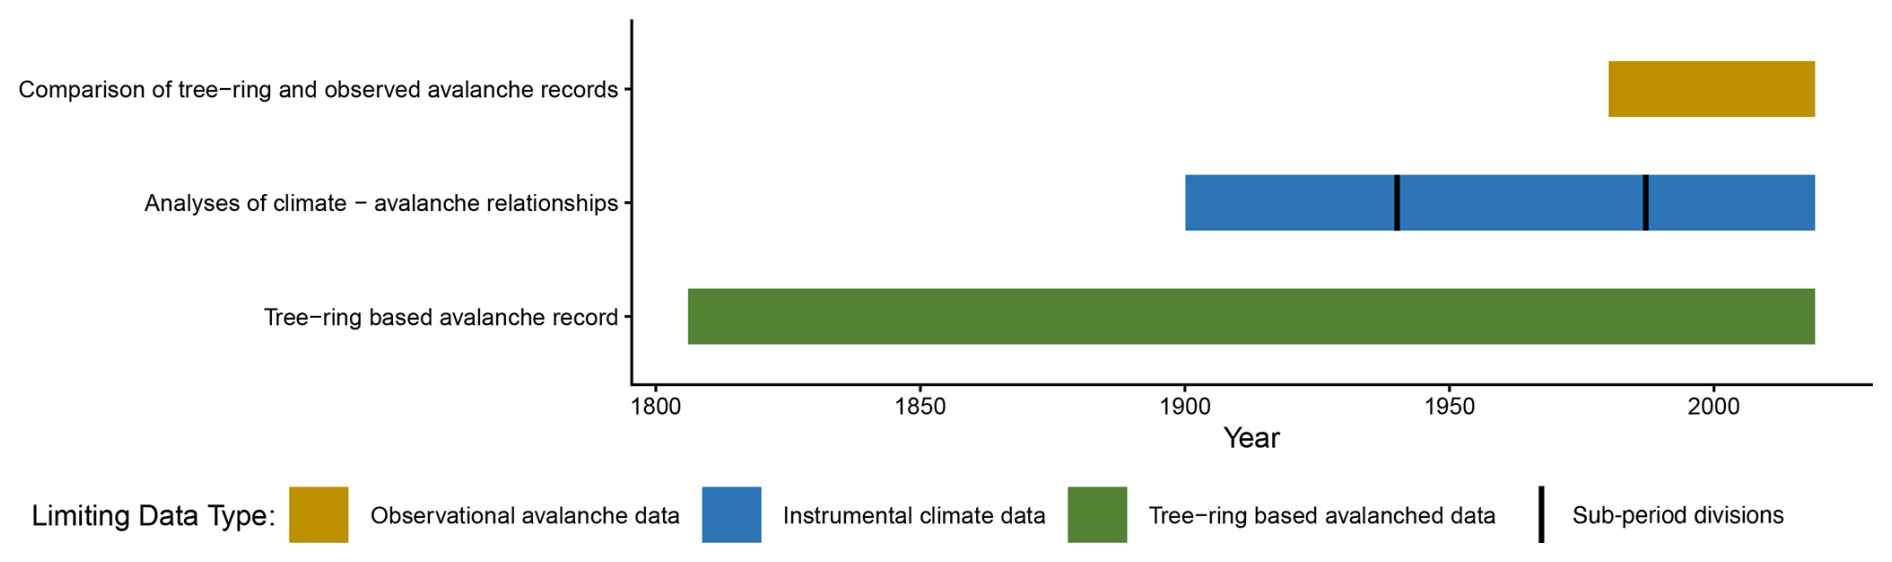
Figure 3Schematic of the methodological framework illustrating the integration of tree-ring–based avalanche chronologies, in-situ avalanche observations, and instrumental and modeled climate records. The timeline highlights sub-period divisions and data type limitations applied in analyses of climate–avalanche relationships and record comparisons.
To detect potential changes over time in the climate drivers of RLMA events, we then repeated the above comparison within a 20-year moving window, progressed 1 year at a time, and noted the change in significant differences between avalanche and non-avalanche years of each variable (as indicated by p-values) for each 20-year period (Fig. S4). This step highlighted persistence in the relationship between large magnitude avalanche events and several key seasonal climate variables exhibiting large differences in RLMA versus non-RLMA years. The analysis also identified several clear shifts in the climate and snow variables most strongly associated with large magnitude avalanche cycles over the 119-year period. Subsequently, we then split the avalanche record into an early period from 1901–1940, a middle period from 1941–1987, and a late period from 1988–2019, and repeated the Wilcoxon rank sum tests described in the paragraph above. This division produced an assessment of potential drivers of regional large magnitude avalanche activity over three distinct 30 to 50-year periods typified by unique combinations of climate and snowpack variables that differed significantly between avalanche and non-avalanche years. Overall, our analyses combined tree-ring avalanche reconstructions, field observations, and multi-decadal meteorological data across varying temporal scales (Fig. 3).
3.1 Reconstructed Avalanche Years and Trends
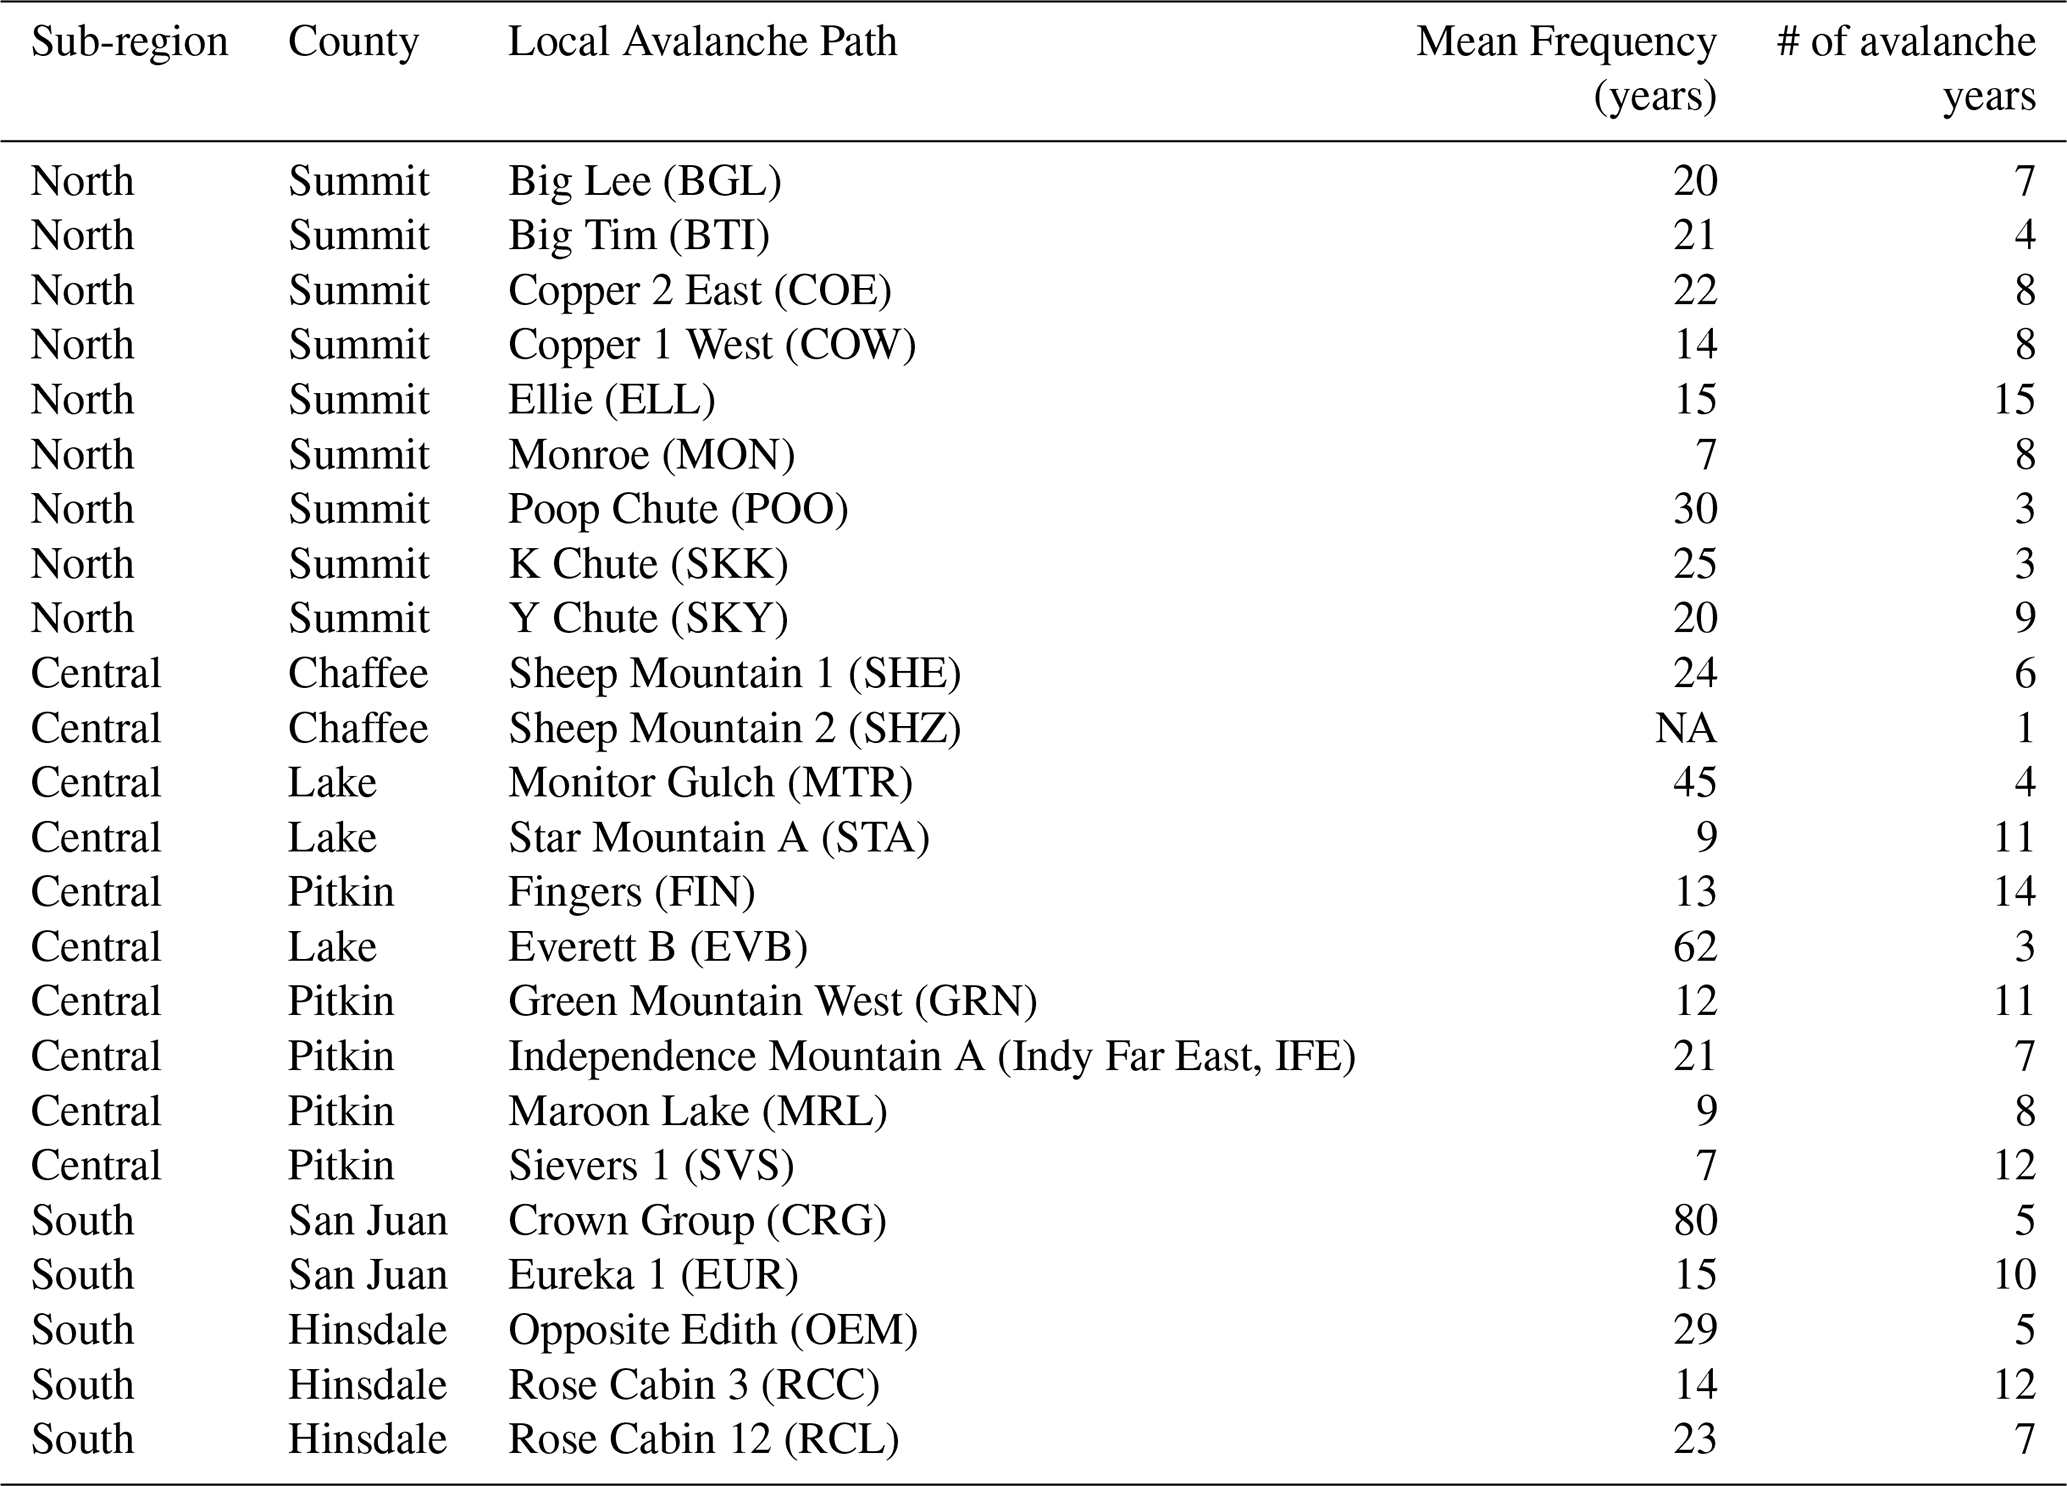
We identified 76 regional avalanche years (Corona et al., 2012) over the period 1698 to 2020 from the 181 individual avalanche years identified across 24 individual avalanche paths. From the reconstructed avalanche years for each avalanche path, we identified 2019 as the largest magnitude avalanche year in our dataset, with evidence of avalanche activity in 24 out of 24 avalanche paths that year (Table 1). The year with the second greatest number of avalanche paths exhibiting large magnitude avalanche activity was 1899 (n = 12). Historical observations also highlight 1899 as a year with widespread large magnitude avalanche activity across the region (Martinelli and Leaf, 1999). Next, we calculated the empirical event frequency of large magnitude avalanche activity in each avalanche path. The event frequency is a measure of avalanche recurrence from the tree-ring reconstructed record and is not a reflection of median (or average) return intervals between two successive events. The lack of recording data (i.e. trees) further back in time precludes us from calculating precise return intervals. Additionally, the number of avalanche years for each individual path is relatively small and is dependent on tree sample availability (Fig. S3). However, using the tree-ring data (Peitzsch et al., 2024) as best-available data, we found a wide range of median empirical event frequencies (4 to 62 years) of large magnitude avalanches in the avalanche paths in our reconstructed dataset.
Table 1The sampled avalanche paths, their empirical frequency metrics, and the estimated number of avalanche events from each dendrochronological record within each sub-region and county. See Table S2 for full frequency metrics and identified avalanche years.
To validate record quality, we compared our tree-ring reconstructed avalanche chronology (Peitzsch et al., 2024) to historical observations from 1980 to 2019 (CAIC, 2025a) and found close agreement between records (Fig. S5). The individual paths in our study site did not necessarily align with paths in the observational dataset, and older avalanche observations often lacked specific avalanche path name and location. Therefore, we grouped individual paths into three climatically similar sub-regions: north, central, and south. The north zone represented all the paths in Summit County. The central zone consisted of all paths from Lake, Chaffee, and Pitkin Counties, and the south zone consisted of all paths from Hinsdale and San Juan Counties. The best agreement between our reconstructed avalanche chronology and the observational record existed in the central and south sub-regions. Six and four avalanche years aligned across these two datasets for the central and south sub-regions, respectively. In both sub-regions, we found two years in our reconstructed record without associated observational evidence, and one year in the observational record not identified in the tree-ring record. In the north sub-region, we found three years in the reconstructed chronology not identified in the observational record, and vice versa.
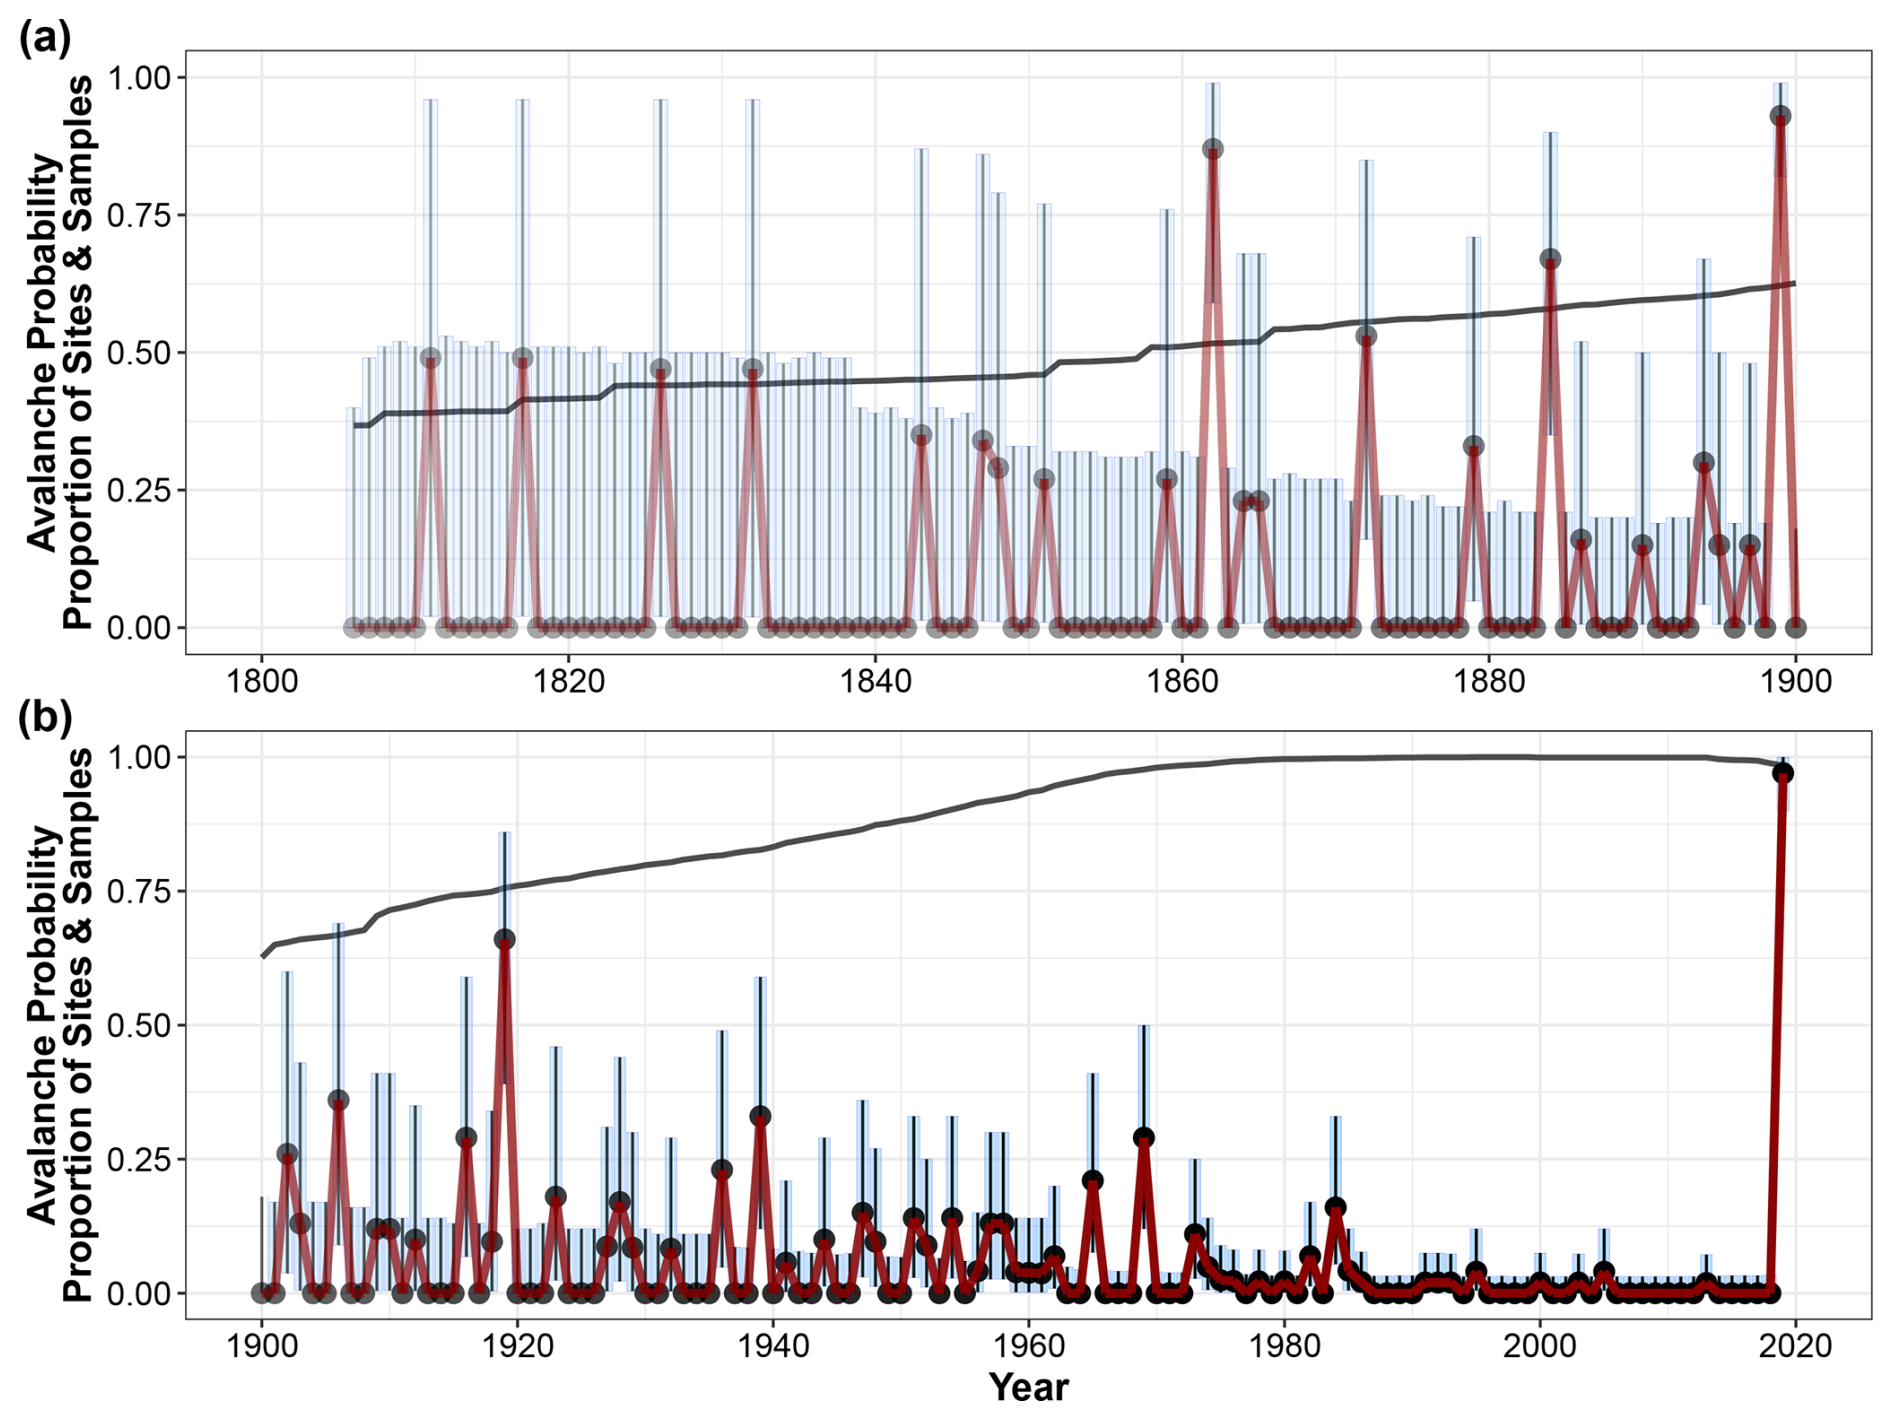
Figure 4Regional (i.e., Colorado-wide) mean annual avalanche probability as estimated from the HBM method shown over (a) the 19th century where the declining number of sites and tree samples result in substantial uncertainty, and (b) the 20th century to present over which sample and site number related uncertainties are greatly reduced. Mean annual avalanche probability (black dots and dark red line) is bounded by 95 % confidence intervals (light blue vertical lines). The dark gray line shows uncertainty due to declining sample depth using the average proportion of the total number of sites and samples through time, which is also represented by the equivalent proportional increase in plot transparency.
We used a hierarchical Bayesian modelling approach to quantify the probability that the observed annual growth disturbances found across all study trees was representative of widespread large magnitude avalanche activity across the region, resulting in annual regional avalanche probabilities for years 1806 to 2019. Over this historical period, years 1899 and 2019 had the greatest mean regional avalanche probability within the record. However, the decreasing site and tree sample number resulted in large uncertainties over the early part of the record (1806 to 1899), which precluded robust trend estimation over the full record length (Fig. 4a). From 1901 to 2019, uncertainty in mean regional avalanche probability decreased substantially as the number of sites and samples recording avalanche related growth disturbances increased (Fig. 4b). Over this 119-year period, mean regional avalanche probability decreased significantly (p < 0.001, τ = −0.50, slope = −0.0002), exhibiting a total decline in the annual RLMA probability of 2.4 %. When we examined the early (1901 to 1940), middle (1941 to 1987), and late (1988 to 2019) periods individually, we found significant decreasing trends in mean avalanche probability in the middle period (p = 0.02, τ = −0.32, slope = −0.002) and no significant trends in the early (p = 0.37, τ = −0.18, slope = −0.002) and late (p = 0.49, τ = 0.23, slope = 0) periods.
3.2 Temporal Changes in Avalanche Drivers
Modeled snowpack across the region declined by 6.2 mm SWE per decade (p < 0.05) from 1901–2019 (Fig. 5a), coinciding with reduced mean avalanche probability. SWE during RLMA years decreased stepwise from early to late periods (Fig. 5b), and when subset by avalanche occurrence, RLMA years showed a significant decline of −7.2 mm per decade (p < 0.05) versus −4.5 mm per decade in non-RLMA years (p = 0.08) (Fig. 5c). SWE correlated positively with avalanche activity (r = 0.22), while maximum temperature showed a negative correlation (r = −0.15) based on mean winter values.
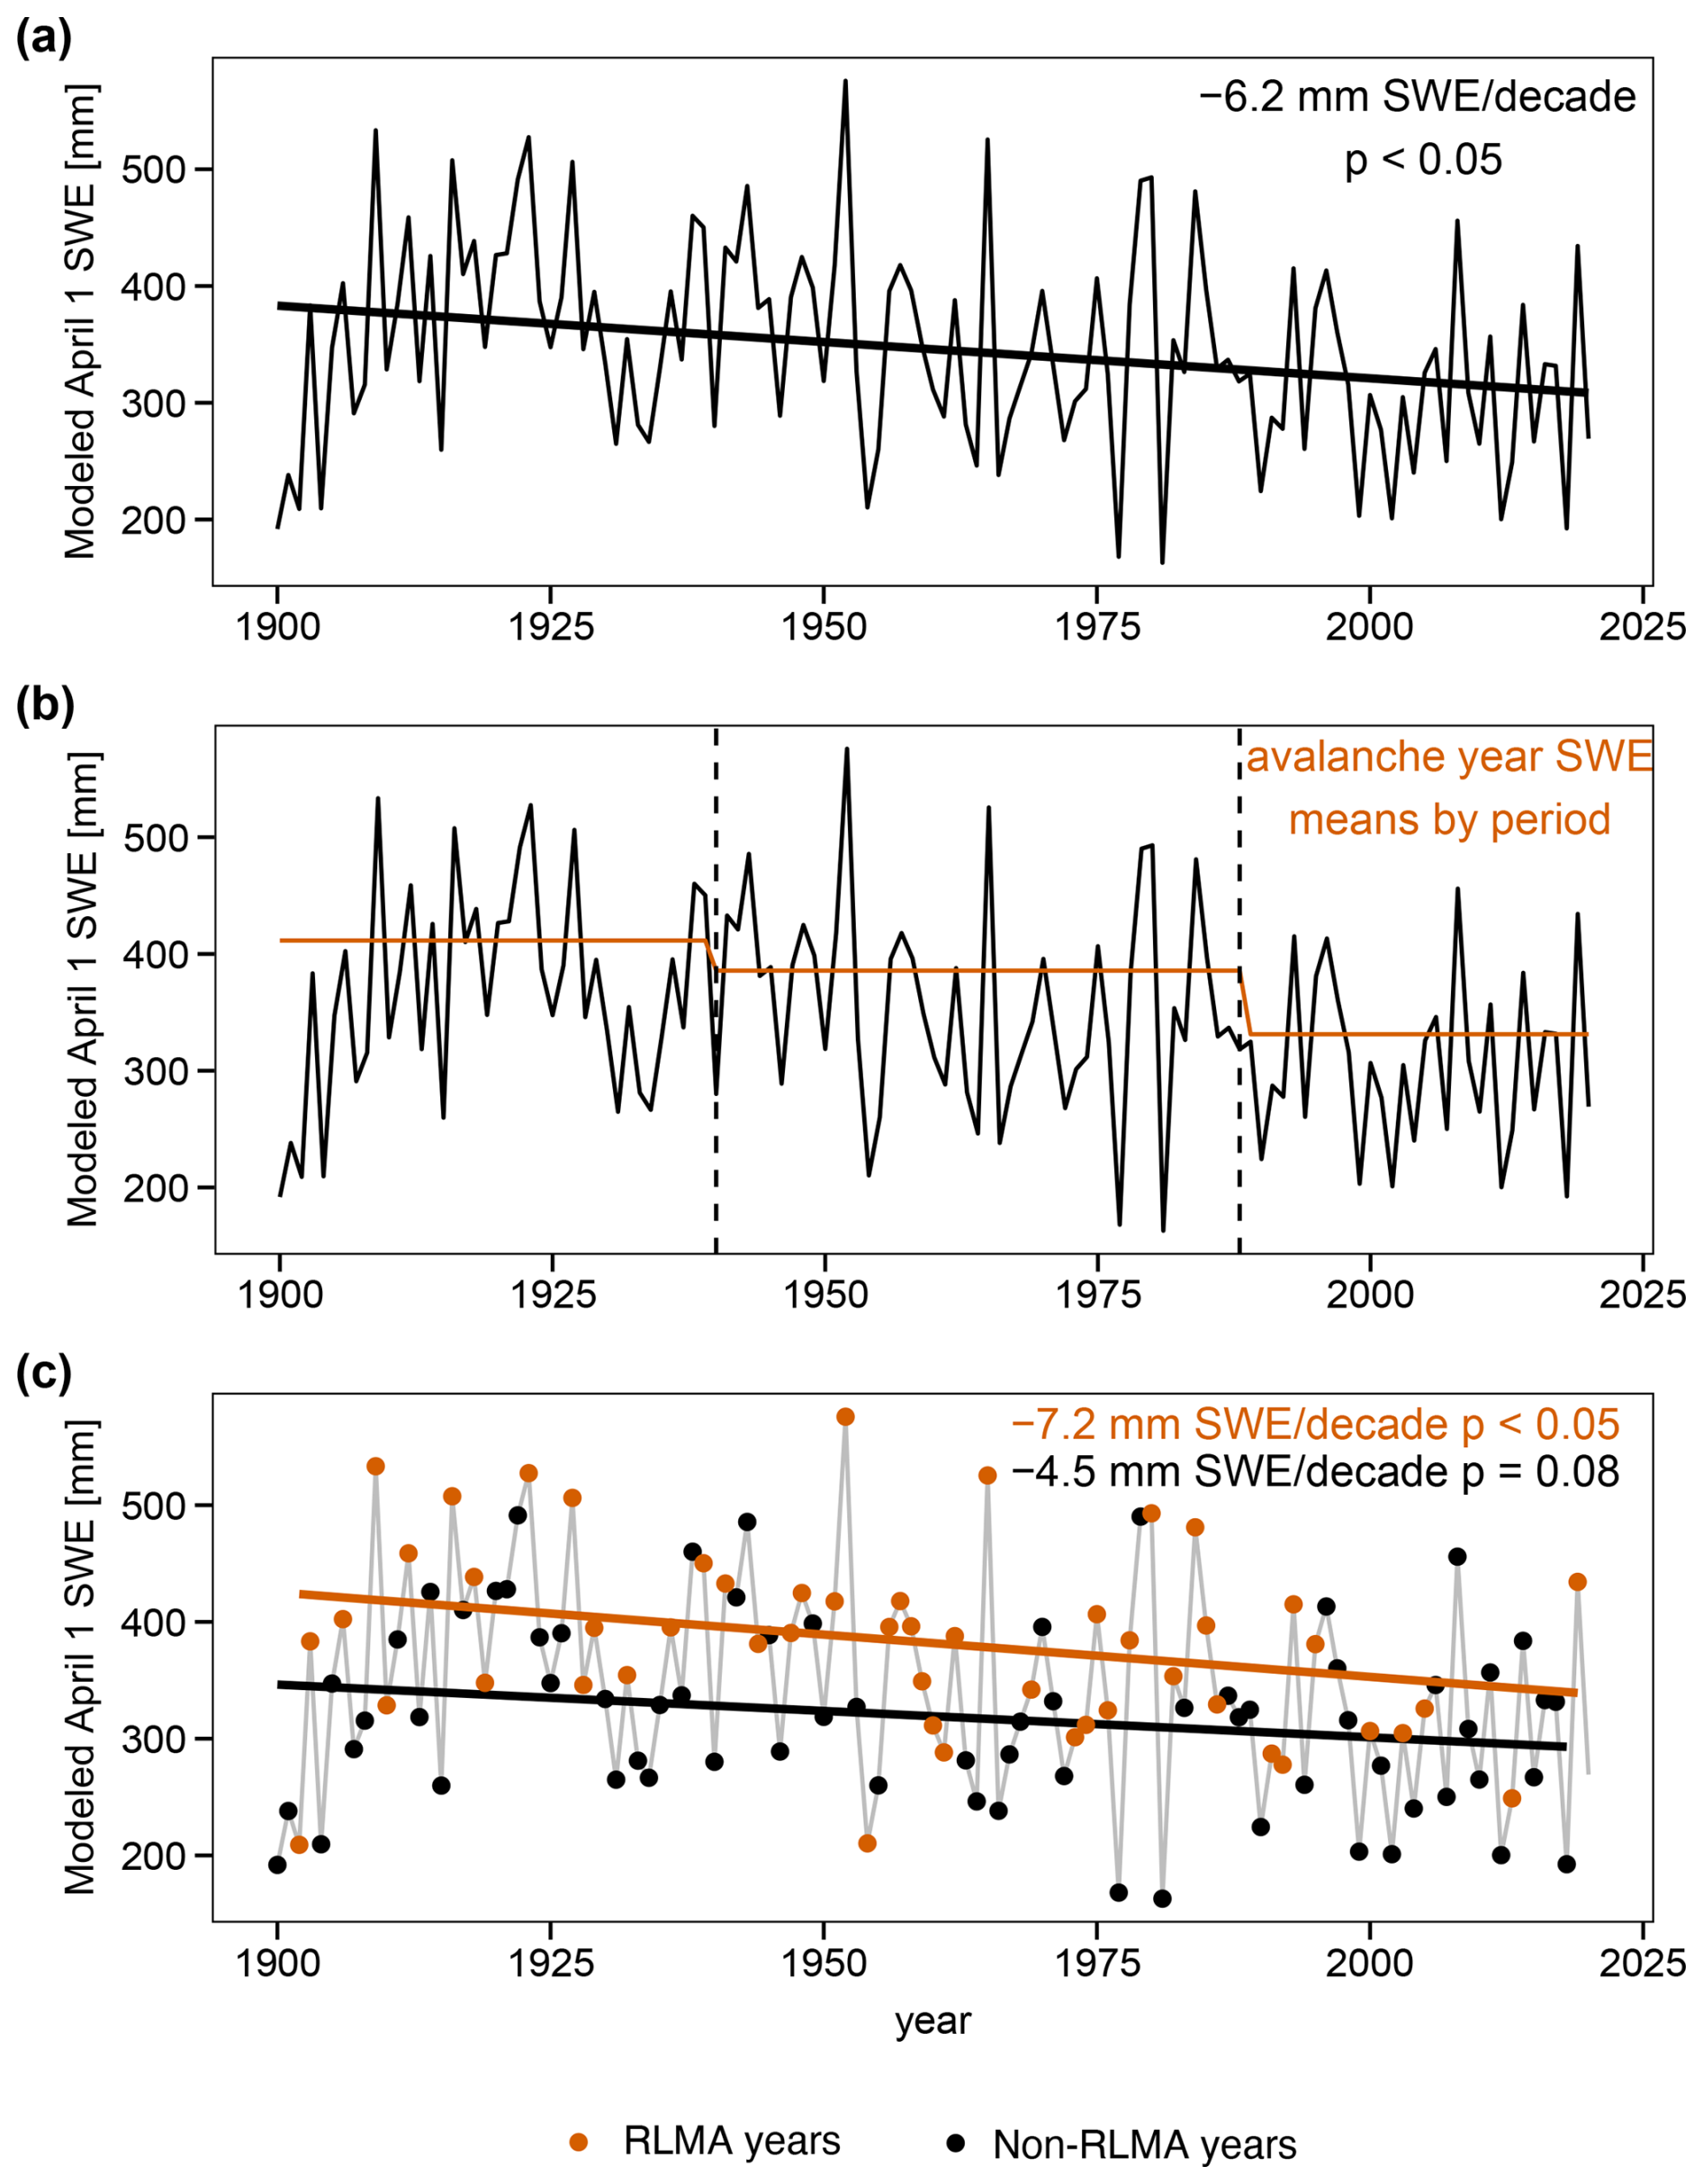
Figure 5(a) Modeled annual 1 April SWE from 1901 to 2019 for the region. The black line represents a significant (p < 0.05) decreasing trend of −6.2 mm SWE per decade. (b) Same as panel (a) but orange lines indicate mean SWE for avalanche years and vertical dashed lines demarcate early (1901 to 1940), middle (1941 to 1987), and late (1988 to 2019). (c) The model estimated trends in snowpack for RLMA (orange points and trend line) and non-RLMA years (black points and trend line).
Based on our analysis of potential climate drivers over the full period of record (Fig. S4), three distinct periods of unique avalanche-climate relationships emerged (early: 1901–1940; middle: 1941–1987; late: 1988–2019). Relationships between regional avalanche activity and modeled snowfall varied across early, middle, and late periods for both monthly (November, December, March) and full-winter totals (Figs. 6 and S6). RLMA years showed greater winter snowfall anomalies than non-RLMA years during early and mid-periods, but anomalies diminished to near average in the late period. Monthly patterns shifted: November anomalies were highest early but near average later; December snowfall declined from near average to substantially below average; and March anomalies peaked in the late period. Overall, early periods were marked by high November snowfall, while late periods featured low December and high March snowfall.
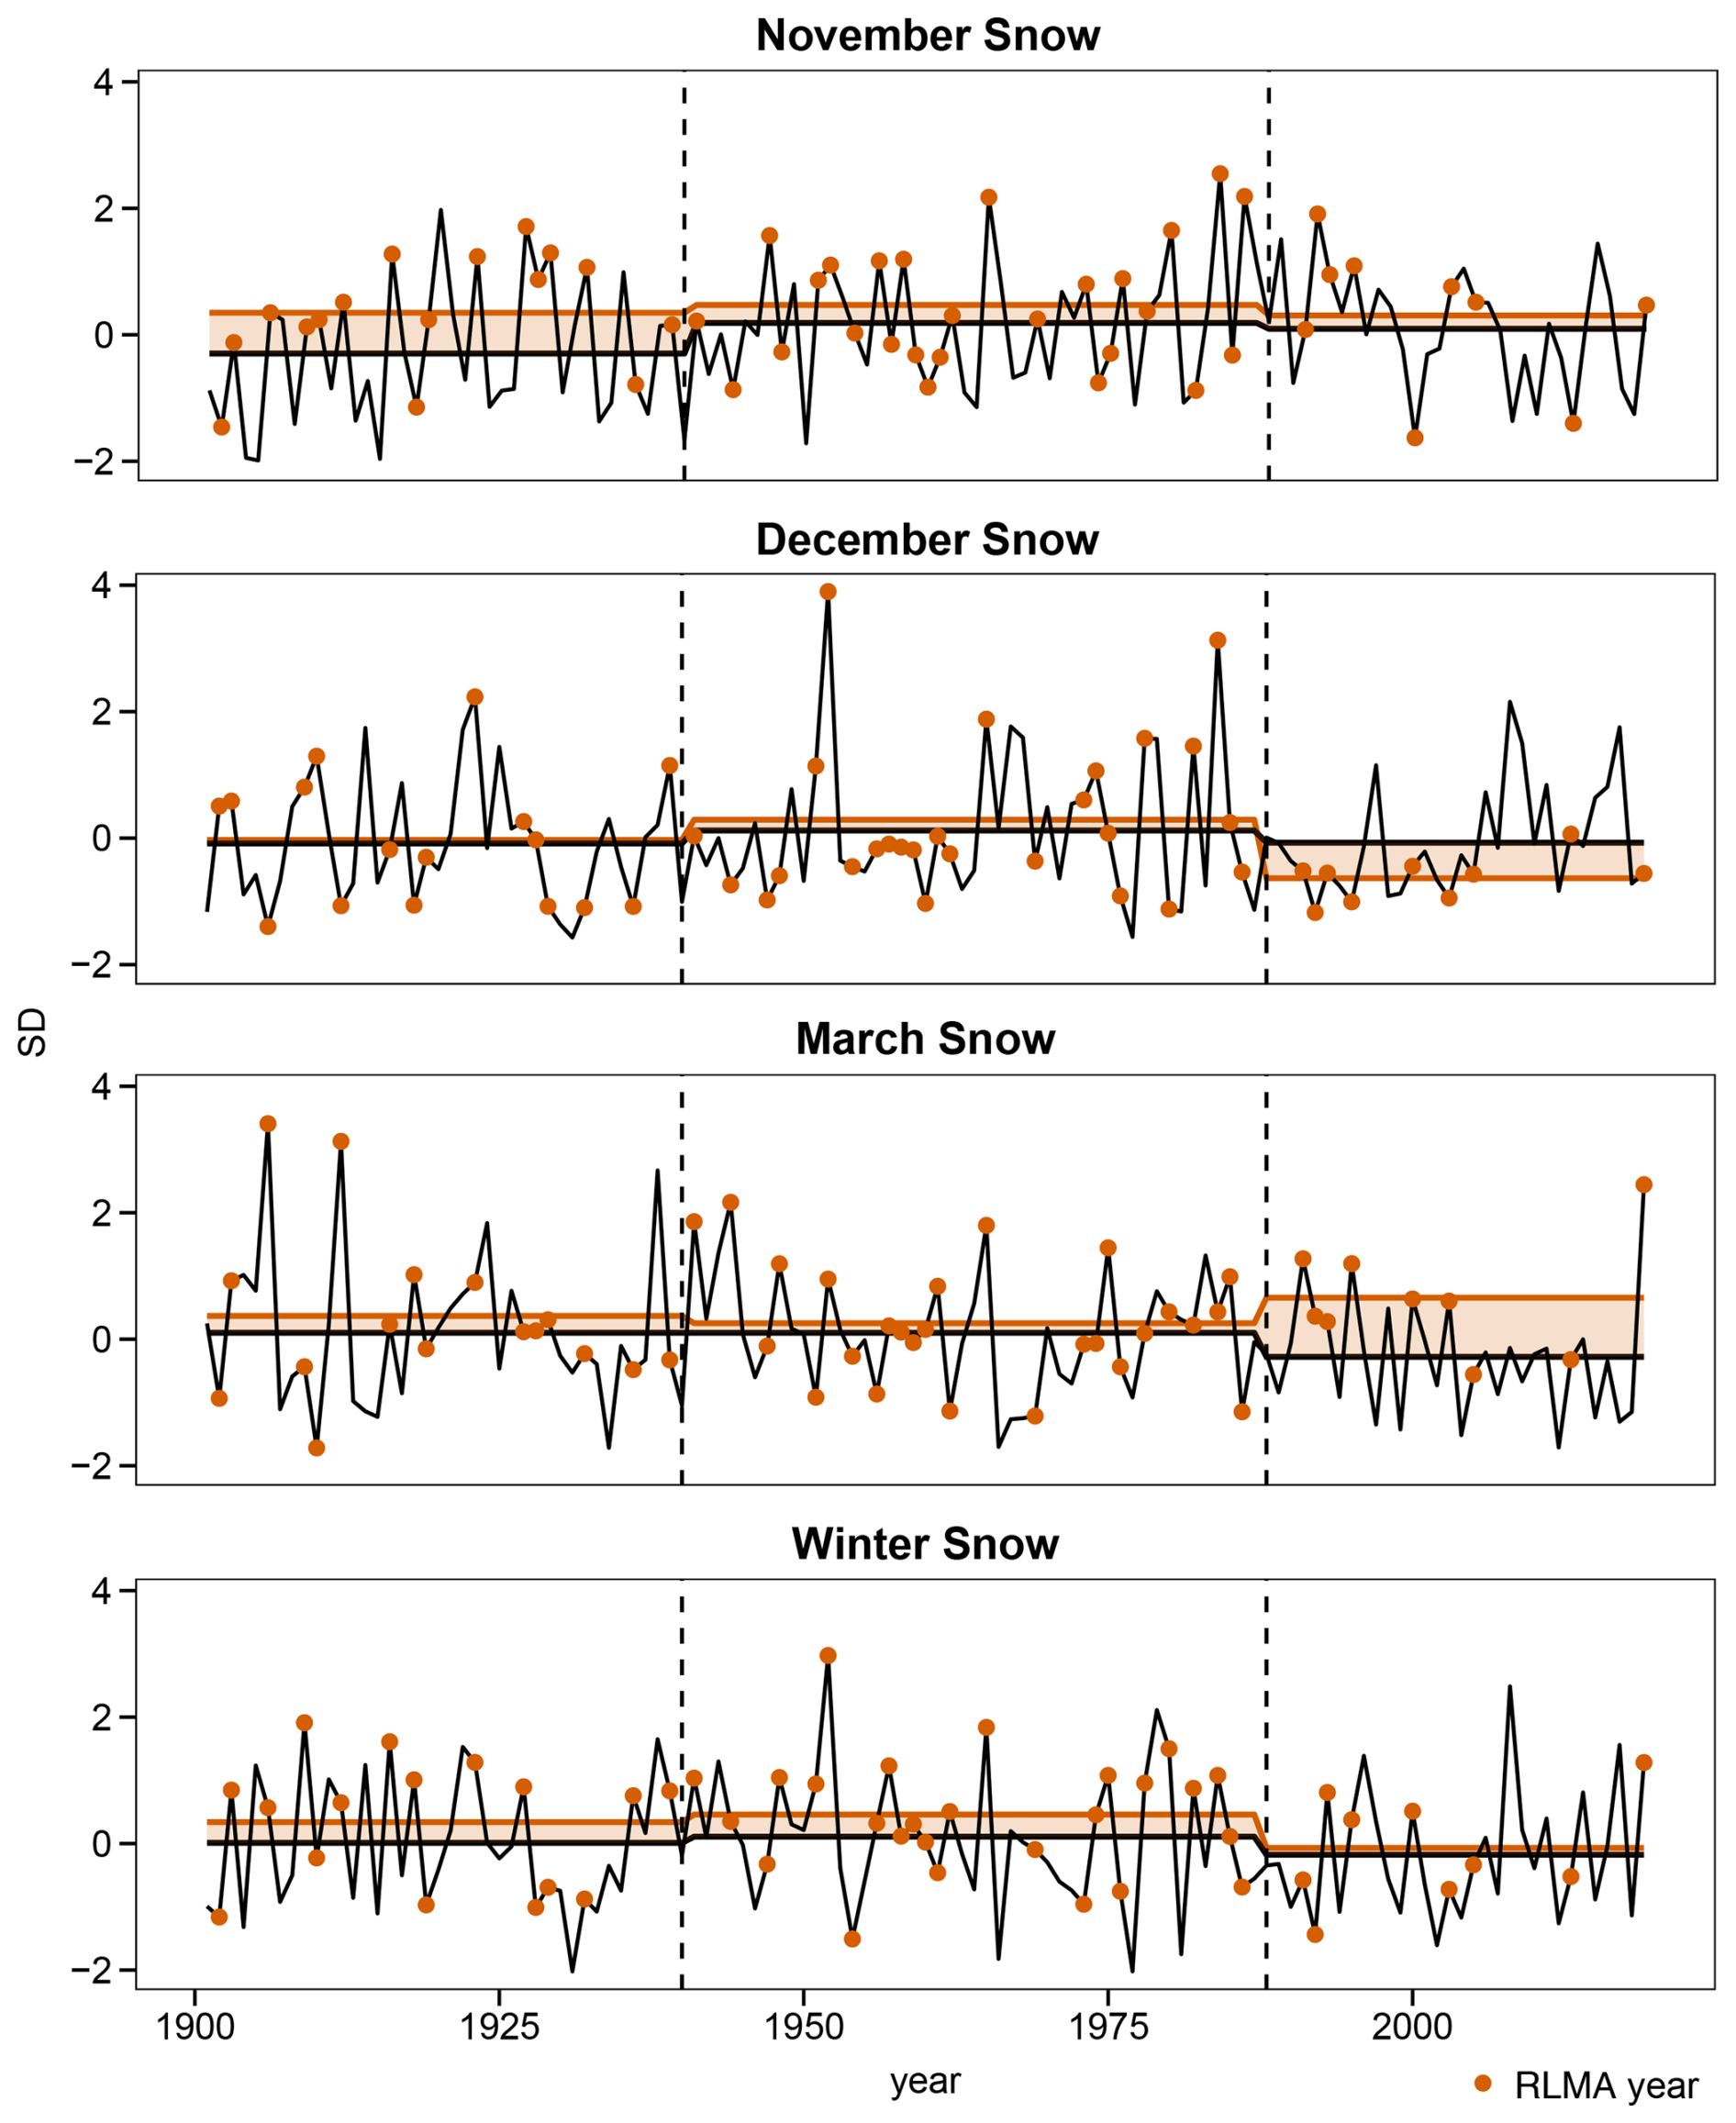
Figure 6Panels show the 119-year time series for monthly and seasonal snowfall anomalies (SD – standard deviation) with dashed vertical lines demarcating early (1901–1940), middle (1941–1987), and late (1988–2019) periods. Within each period, black lines show the mean snow anomaly for the period, orange lines show the mean snow anomaly across avalanche years, and the filled regions denote the difference between the two. Orange points indicate regional avalanche years reconstructed from the dendrochronological record.
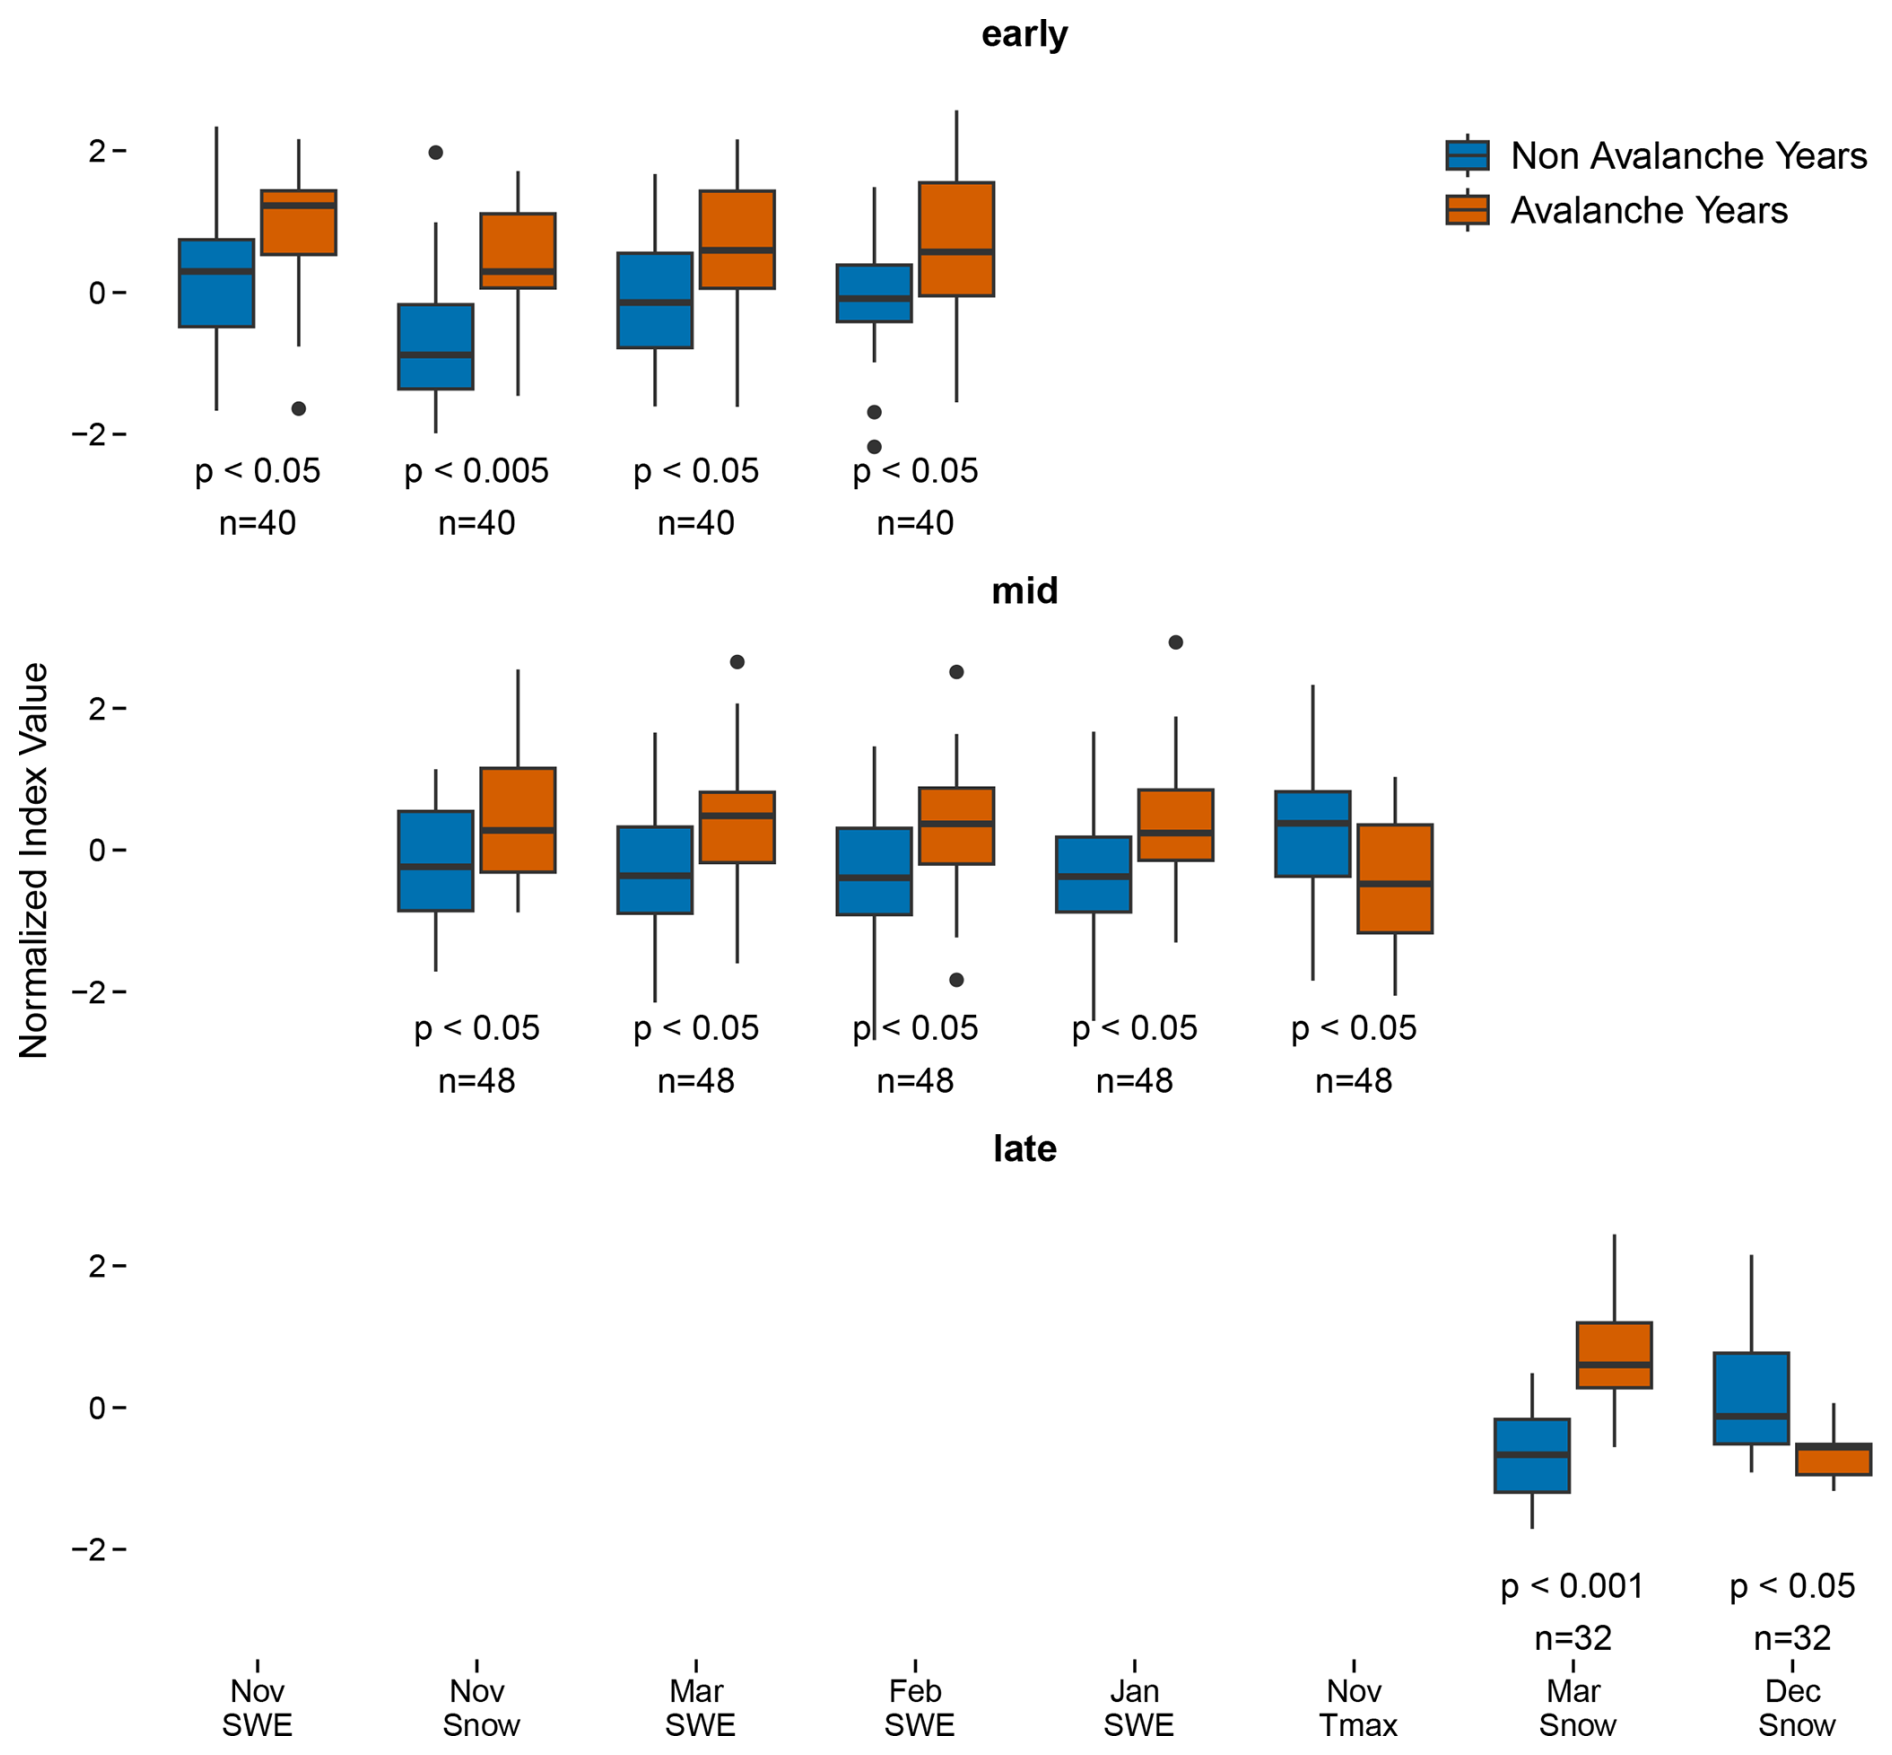
Figure 7Box plot comparisons of monthly snowfall (Snow) and snow water equivalent (SWE) totals and maximum temperature (Tmax) means across avalanche years vs. non-avalanche years within the early (1901–1940), middle (1941–1987), and late (1988–2019) portions of the full study period 1901–2019. Only those climate variables with monthly means that differed significantly between avalanche and non-avalanche years are shown for each period with significant differences (α = 0.05) assessed by Wilcoxon's rank sum test.
Important seasonal climate differences between RLMA and non-RLMA years emerged when assessed in pairwise comparisons within each period (Fig. 7). During the early period (1901 to 1940), RLMA years were characterized by positive November, February, and March SWE and November snowfall anomalies. RLMA years during the mid-period (1941 to 1987) were associated with positive anomalies of November snowfall, January, February, and March SWE, and negative anomalies of maximum November temperature. Throughout the late period (1988 to 2019), positive March snowfall anomalies and negative December snowfall anomalies emerge as the primary indicators of RLMA years.
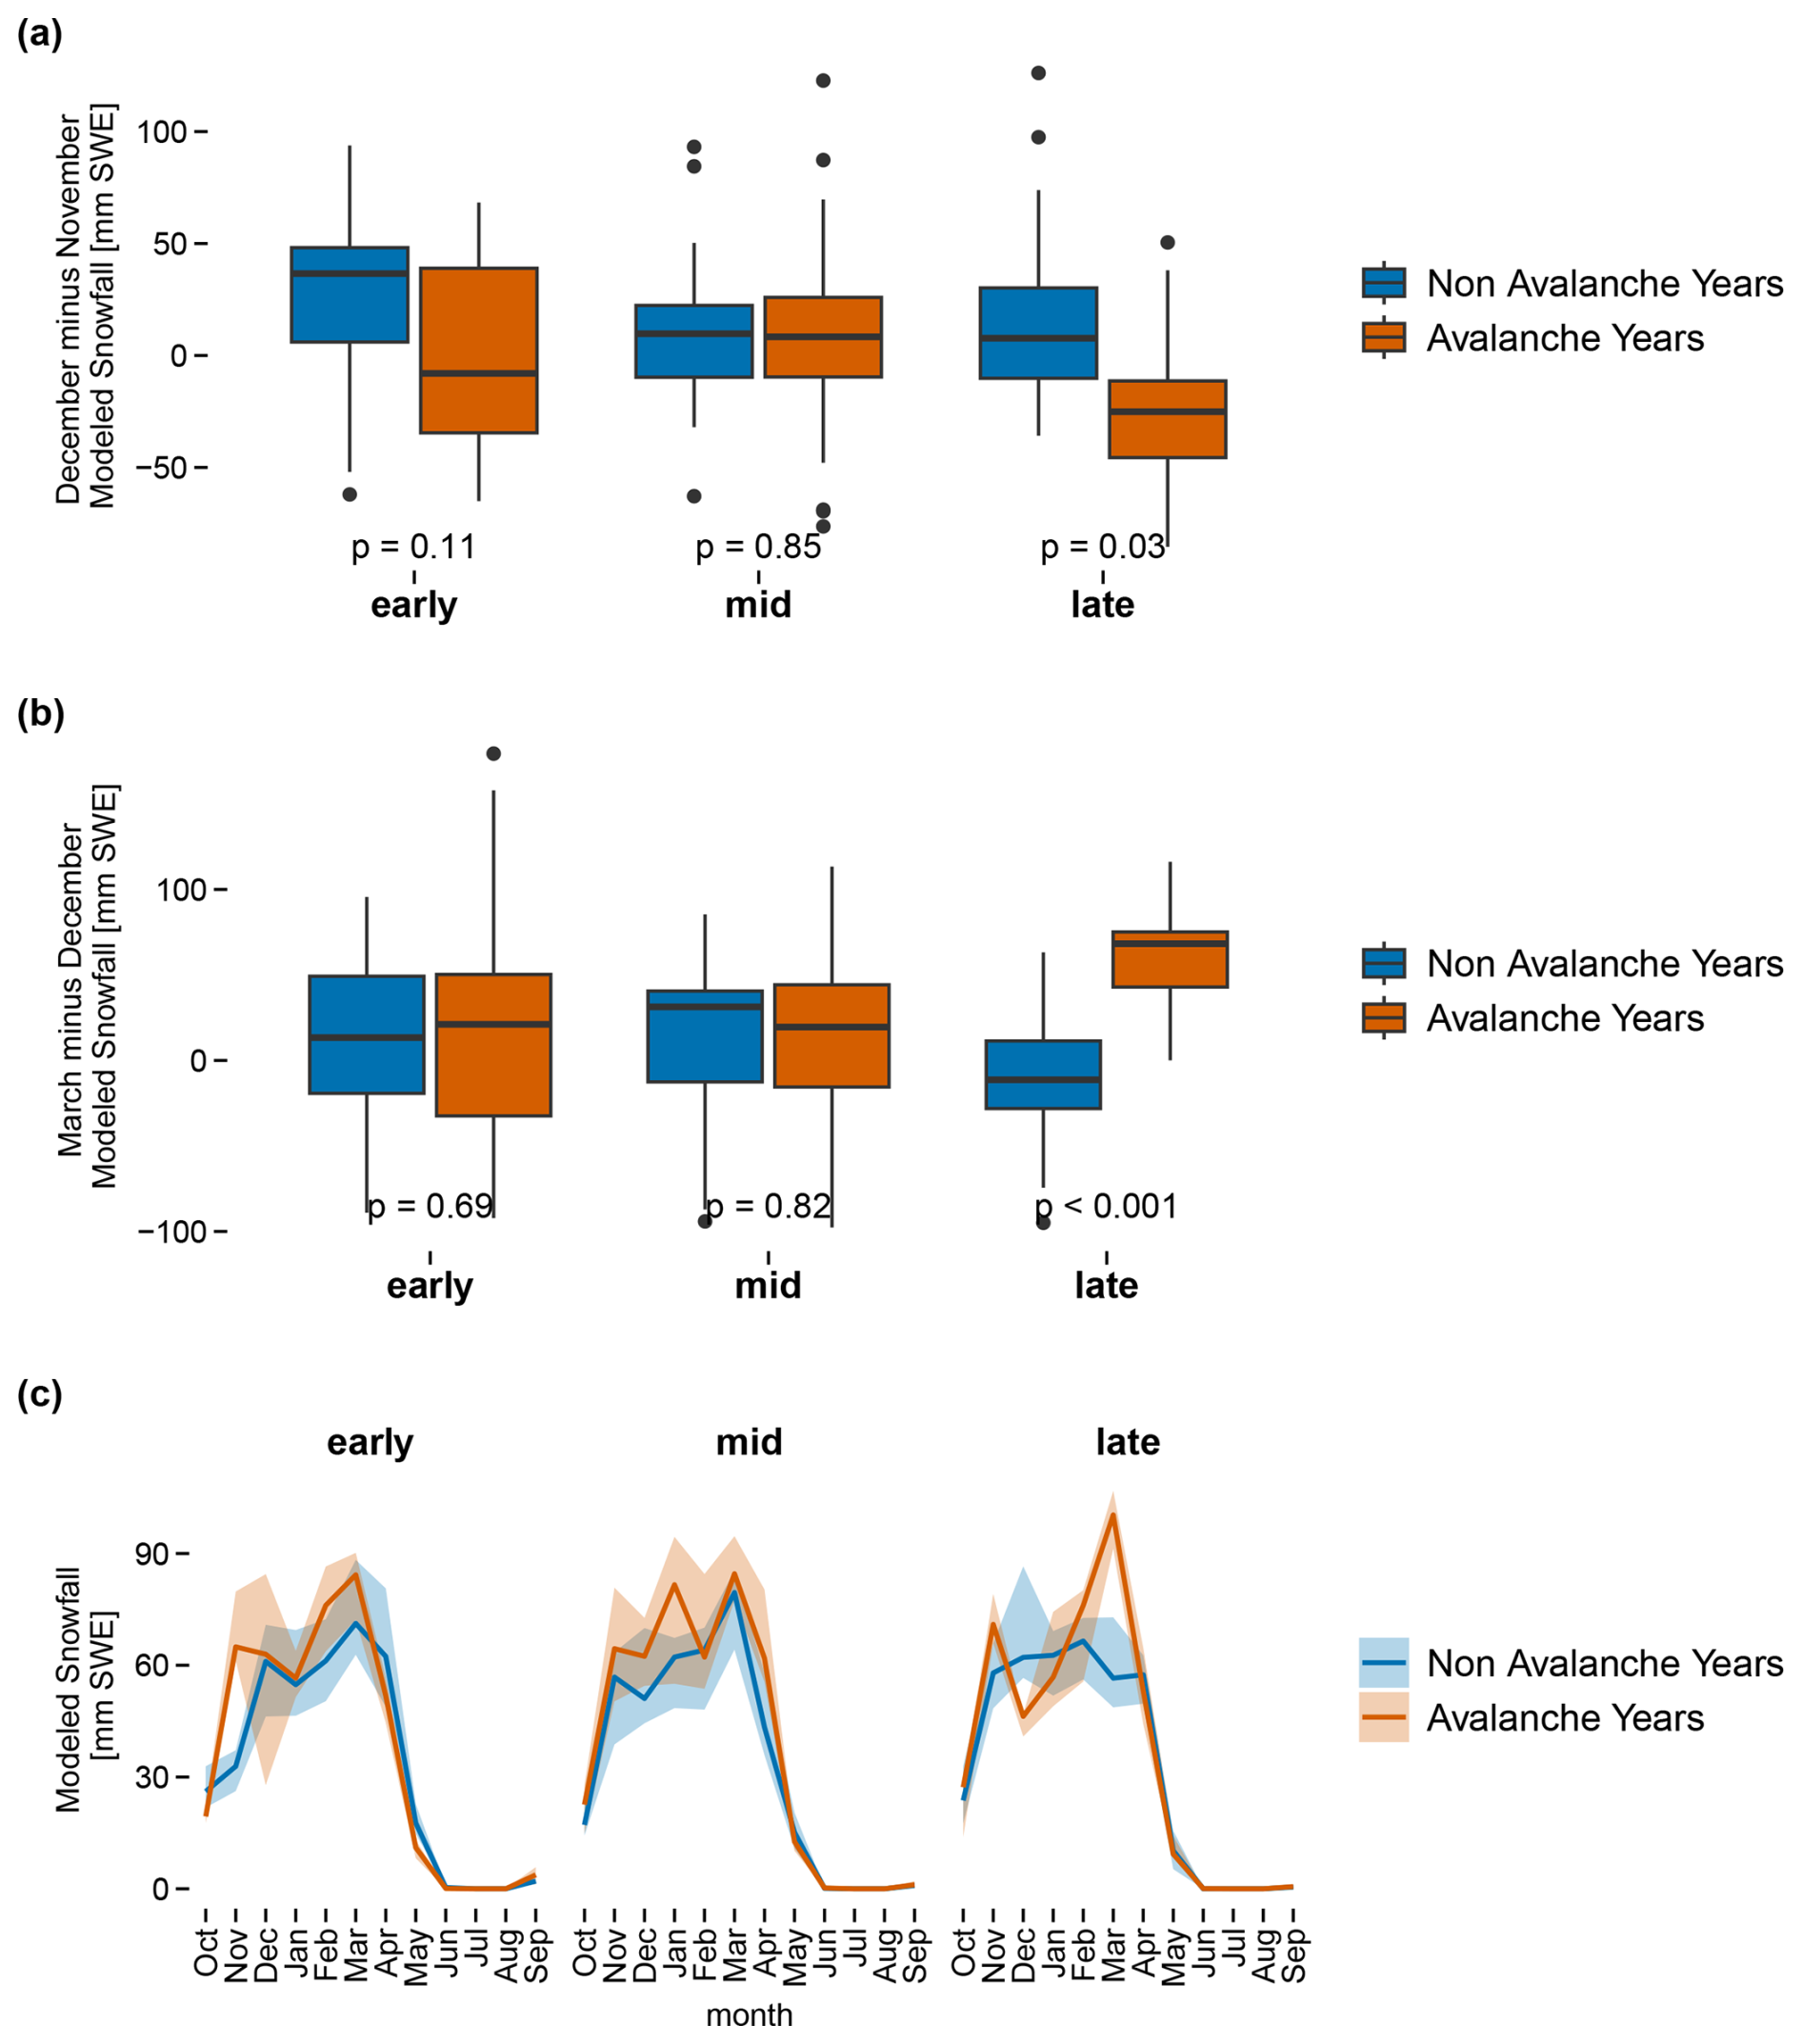
Figure 8(a) Boxplots of early winter modeled snowfall (mm SWE) differences between the months of December and November, (b) boxplots of late winter (or early spring) modeled snowfall (mm SWE) differences between March and December and (c) monthly modeled snowfall (mm SWE) for the three analysis periods (early (1901–1940), middle (1941–1987), and late (1988–2019)). Shading in panel (c) shows the interquartile range of SWE values in each grouping.
Finally, we examined changing seasonal differences in the timing of snowfall during the early winter months (December minus November) and in a comparison of winter with early spring (March minus December) (Fig. 8). Doing so allowed us to better understand the sequential development of the snowpack within individual avalanche years as compared with non-avalanche years. This temporal element is important because the sequence of snowfall events within a winter season influences weak layer development and loading of the snowpack over time. Differences in snowfall timing patterns between RLMA and non-RLMA years were statistically significant only during the late period (Fig. 8a and b). During the late period, RLMA events were usually constrained to years when December snowfall was less than November snowfall, and when March snowfall was much greater than December snowfall. More consistent monthly snowfall throughout the winter characterized RLMA years during the early and middle periods (Fig. 8c).
4.1 Regional Large Magnitude Avalanche Frequency
We used a hierarchical Bayesian modelling approach to reconstruct regional large magnitude avalanche activity from annual probabilities from 1806 to 2019 using 1188 tree-ring samples collected across 24 avalanche paths in Colorado. The high number and quality of the samples combined with the cross-scale methods used to identify and reconstruct historical mean regional avalanche probabilities helped reduce and better quantify uncertainties related to a diminishing record further back in time (Figs. 3 and 4) (Corona et al., 2012). Factors such as the 1899 avalanche cycle, deforestation, and wildfires could affect the mean age of sampled trees. Nonetheless, the presence of older trees throughout the study area, combined with our hierarchical Bayesian framework, supports the conclusion that the tree-ring record provides a robust representation of regional large-magnitude cycles. Comparing our reconstructed avalanche chronology to recent avalanche observations in the three sub-regions of the study area indicated high record quality through better-than-expected agreement between the two record types given the known sources of uncertainty in both datasets (Corona et al., 2012; Reardon et al., 2008).
Over the past two centuries, the regional avalanche record shows numerous widespread and destructive avalanche cycles and evidence for a decreasing frequency of RLMA activity from 1900 to 2019 (Fig. 4). In terms of extreme and destructive regional avalanche cycles, the RLMA years of 2019, 1899, and potentially 1862 rank as the most spatially widespread and severe events captured within the record. The number of paths recording an avalanche event combined with the HBM results suggests that the March 2019 avalanche cycle was probably as large, if not larger, than the avalanche cycles from 1899 and 1862. Together, the three extreme events suggest a plausible empirical return period of approximately 40 to 120 years for widespread avalanche cycles of this magnitude throughout the entire region. Martinelli and Leaf (1999) provided supporting written evidence of the damage caused by the 1899 RLMA cycle, however, no such record exists for the 1862 event. Other regional large magnitude avalanche cycles of reduced severity occurred with a frequency of approximately one event every 20 years until approximately 1980 when the decreasing trend in RLMA cycles caused a 40-year event hiatus lasting until the March 2019 cycle.
Although all the sampled paths were easily accessible by road, it is possible that avalanche activity in several of the more remote paths in our dataset (i.e., those accessed by dirt road) were not observed and not reported in the observational database. This may account for avalanche years present in the tree-ring chronology but not in the observational record. Conversely, the successive damage and removal of trees from events sized D2 or greater impacts the future potential of tree rings to record subsequent events of similar magnitude in each avalanche path (Corona et al., 2012). In other words, if a large magnitude avalanche removes a large swath of trees in one year, then there are fewer trees available to record a slightly smaller, but still large, magnitude avalanche in subsequent years. This can result in the presence of an avalanche year in the observational record, but not a corresponding record in the reconstructed chronology. Additionally, it is possible that a large magnitude avalanche cycle occurred in the sub-region (north, central, south), but not in the specific paths we sampled (Peitzsch et al., 2021b).
4.2 Snowpack Trends Associated with Regional Avalanche Activity
We showed that a significantly decreasing trend in regional large magnitude avalanche activity since the start of the 20th century (Fig. 4) was characterized by a shift from RLMA occurrences that were commonly driven by above average snowfall throughout the winter, towards RLMA years occurring more frequently in low-snow years with a dry December and wet March (Figs. 6 and 8). This distinct shift in drivers of the regional avalanche regime in Colorado has been most pronounced since the late 1980s, though it is worth noting that RLMA activity has been comparatively low since then as well (Figs. 4 and S4). The greater decline of mean winter season snowpack (SWE) during RLMA years versus non-RLMA years (Fig. 5) and the overall negative trend in RLMA occurrence over the period of record (Fig. 4) illustrates the primary influence of consistent winter season snowfall and accumulation on widespread regional avalanche activity. This notable decrease in avalanche activity specifically due to declining snowpack is consistent with findings from research in the northern Rocky Mountains, United States (Peitzsch et al., 2021a), French Alps (Eckert et al., 2013), and the Vosges mountains, France (Giacona et al., 2021). However, the overall correlations between RLMA years, SWE, and temperature are weak, highlighting that simple correlations are often insufficient in detecting complex relationships between avalanche activity and climate. These correlations are based on winter seasonal average values and because the drivers of the high leverage data points in the avalanche activity series are likely driven largely by specific events, the overall correlations fail to explain the changing conditions through time.
4.3 Climate Drivers and Regional Avalanche Activity Change Over Three Distinct Periods
A detailed analysis of the full suite of potential avalanche related climate and snowpack variables provides a more nuanced perspective of the changing climate drivers tied to decreasing RLMA activity identified over three distinctly different periods of region-wide 20th century snowpack decline (Fig. 7). When we compared RLMA years versus non-RLMA years, we found that during the early period (1901–1940) RLMA years were characterized by greater early- and late-season snowfall. During this period, RLMA years experienced nearly twice the amount of November snowfall than non-RLMA years. These results indicate that without sufficient early season snowfall in November, there was an absence of large magnitude avalanche activity across the region. Because non-RMLA years were characterized by such a distinct deficit of November snowfall (Fig. 7), it is possible that the absence of early-season snowfall acted to preclude RLMA events later in the year by limiting the distribution of early-season snow available for weak-layer development (Figs. 7 and S4). Given generally similar amounts of December and January snowfall compared to November, our results suggest that continuous snowfall through those months with abundant late-season precipitation then resulted in widespread avalanche activity rather than a lack of precipitation in January leading to weak layer development in mid-winter.
A similar climate pattern continued through the middle period (1941–1987), but with a smaller difference in November snowfall between RLMA and non-RLMA years, and greater mid-winter snowpack (SWE) development throughout the period (Fig. 8). Colder daytime maximum temperatures in November also existed during RLMA years (Fig. 7). These results suggest that despite an overall decrease in SWE from the early to middle periods, RLMA activity may have persisted due to cold November temperatures leading to weak layer formation and enough incremental snowfall throughout the winter to develop a substantial overlying slab (Schweizer, 2003).
The shift in drivers from the middle period to the late period (1988–2020) highlights a transition from RLMA activity broadly driven by greater snowfall throughout the winter season to a notably different avalanche-climate regime where the timing of snowfall, or a lack thereof, became more influential. Despite an overall decrease in RLMA activity, this analysis also explains the continued occurrences of RLMA years in the latter part of the record. RLMA years since the 1980s were characterized by above average snowfall in November and well below-average snowfall in December followed by abundant snowfall in March (Figs. 6, 7, and 8). This consistent pattern in recent RLMA years suggests early winter snow cover likely developed into a weak layer during dry winter conditions in December, which was subsequently overloaded by heavy March snowfall, leading to large and destructive avalanches throughout the region. This result aligns with the findings of a study of deep slab avalanches in Montana where seasons with deep slab avalanches occurred more frequently with decreased early-season precipitation when compared to seasons without deep slab avalanches (Marienthal et al., 2015). The extreme RLMA event of 2019 highlights this pattern when a weak layer developed in early winter and was followed by slow but continuous slab development until a March storm deposited 150 to 300 mm of SWE leading to a widespread and destructive avalanche cycle. Additionally, in 1986, the year with the second largest avalanche probability in our dataset during the middle period, heavy snowfall in November, followed by a lack of precipitation and cold temperatures in December and January, contributed to widespread large magnitude avalanche cycles across the state (Birkeland and Mock, 2001). Although 1986 is technically within the middle period, it is likely that a gradual transition to the late period drivers occurred rather than an immediate step change in 1988.
In summary, the early and middle period regimes were characterized by abundant snowfall and persistent snow loading, whereas the late-period regime required both relatively dry early winters followed by abundant snowfall in March to produce large avalanche cycles (Figs. 6, 7, and 8). A similar pattern of increased spring precipitation in recent decades that contributed to large magnitude avalanche years associated with negative SWE anomalies also existed in an intermountain climate in the northern Rocky Mountains (Peitzsch et al., 2021a). We recognize that the change in the factors influencing RLMA activity across the three periods could either indicate a gradual transition due to changing climate conditions or stem from a low-frequency, quasi-cyclical ocean-atmosphere connection affecting RLMA activity. This represents substantial uncertainty especially as we use these past findings to inform future avalanche management practices and infrastructure planning in avalanche impacted regions (Eckert et al., 2024).
Weather directly influences snowpack structure and avalanche likelihood, extent, and size on daily to seasonal timescales making it difficult to disentangle the influence of longer-term climate on avalanche frequency and probability. The annual resolution of avalanche frequency derived from tree rings also limits our ability to assess the contribution of monthly climate patterns on RLMA activity. We also acknowledge the sampling bias toward the 2019 avalanche cycle. However, the collection of many samples across a large spatial extent provided the replication needed to minimize these limitations by allowing us to match our scale of analysis to that of region-wide avalanche events and the often-subtle differences in the seasonal climate factors that influence them. Furthermore, the high-quality and extensive RLMA dataset reduced uncertainty associated with a decreasing sample size further back in time (Corona et al., 2012) and allowed for a rigorous analysis of trends in RLMA activity across Colorado since 1901. Relatively good agreement between the observational record and the tree-ring derived record from 1980 to 2020 also provided confidence that our dataset contains a relatively robust timeline of the most substantial RLMA cycles in the Colorado Rockies over the last 12 decades.
Uncertainty in modeled meteorological and snowpack variables also likely leads to unaccounted error in the relationship between long term climate variables and regional large magnitude avalanche activity. For instance, in-situ weather, snowpack structure, and snow properties in the starting zones of the avalanche paths may differ from the modeled values. We reduced this uncertainty by aggregating the avalanche data across the region and pairing it with similarly scaled meteorological and snowpack data. Overall, our results illustrate a general decrease in avalanche activity probability over time, coincident with a long-term decline in snowpack, a change in seasonal snowfall patterns, and a complex interaction with changing climate drivers through time.
In March 2019, a historically large magnitude avalanche cycle occurred throughout the entire state of Colorado. The Colorado Avalanche Information Center (CAIC) recorded over 1000 avalanches during a two-week period. Of these avalanches, 200 were classified as size D4 or larger. From this event, we produced a large tree-ring dataset to reconstruct a regional large magnitude avalanche (RLMA) record spanning over two centuries using a cross-scale methodology that integrated data from individual avalanche paths to three major sub-regions and to the entire state. Although the individual records showed substantial path-level variability in event frequency, as expected, reasonably good agreement existed between observational and reconstructed avalanche records when aggregated to a sub-regional and regional scale. At the regional scale, we found the March 2019 avalanche cycle to be as large or larger than the widespread avalanche cycles in 1899 and 1862, indicating an approximately 40 to 120-year return interval for events of that extreme magnitude. Coincident with decreasing regional snowpack (SWE), the RLMA record showed a statistically significant decrease in RLMA activity since 1901. This trend was accompanied by a shift from regional large magnitude avalanche events that were driven primarily by above average winter season snowfall and deep snowpack towards events occurring more often in low to average snow years capped by large late winter or early spring storms. This observed trend demonstrates a change in snow and weather drivers of regional large magnitude avalanches in Colorado in recent decades compared to much of the last century. A lack of December precipitation and above average March precipitation characterized more recent years with regional large magnitude avalanche activity. Despite observed declines in snow water equivalent, extreme regional large-magnitude avalanche cycles remain possible, as evidenced by the 2019 event. This finding emphasizes that long-term climatic trends do not eliminate the occurrence of rare, high-impact episodes, which must be considered in hazard assessments and risk management frameworks.
We presented a shift in drivers of regional avalanche activity under a non-stationary climate. Despite an overall decreasing trend in regional large magnitude avalanche activity, changing climate conditions produced periods of different emerging drivers of this avalanche activity. Such shifts are important to understand as many analytical approaches rely on stationary climate assumptions. This study shows that assuming stationarity is not valid for the 1901 to 2019 period we analyzed, suggesting that new approaches may be needed when analyzing avalanche activity through time. This study advances understanding of the spatial extent and return frequency of large magnitude avalanche cycles and associated snow and weather drivers across multiple spatial scales. Consequently, this understanding could help avalanche forecasters improve their predictive tools, inform mitigation strategies, and assist infrastructure planners when designing and building in avalanche terrain, particularly in areas where avalanche regimes are changing quickly in response to changing snowpack and climate conditions.
Tree-ring data for this study are publicly available: https://doi.org/10.5066/P1353HSN (Peitzsch et al., 2024).
The supplement related to this article is available online at https://doi.org/10.5194/nhess-26-1059-2026-supplement.
EP, EG, KB, KE, and GP conceived of and designed the study. EP, JK, EG, KE, and DS collected samples. EP, NK, and DS prepared and analyzed tree-ring samples. EP, NE, AF, JM, and GP conducted statistical analysis and interpretation. EP, JM, and GP created figures. All authors contributed to writing and editing.
At least one of the (co-)authors is a member of the editorial board of Natural Hazards and Earth System Sciences. The peer-review process was guided by an independent editor, and the authors also have no other competing interests to declare.
Any use of trade, firm, or product names is for descriptive purposes only and does not imply endorsement by the U.S. Government.
Publisher's note: Copernicus Publications remains neutral with regard to jurisdictional claims made in the text, published maps, institutional affiliations, or any other geographical representation in this paper. The authors bear the ultimate responsibility for providing appropriate place names. Views expressed in the text are those of the authors and do not necessarily reflect the views of the publisher.
We thank Michael Bartley, Mathew Cecil, Mike Cooperstein, Dylan Craaybeek, Jeff Davis, Ryan Zarter, Ron Simenhois, Mike Floyd, Dylan Elder, Rebecca Hodgetts, Matt Huber, Coleman Kane, Brian Lazar, Spencer Logan, Meave McCormick, Lisa Morgan, Chase Quant, Rocky Spencer, Eric McCue, and Banning Starr for their assistance in the field. Author NE is a member of the Grenoble Risk Institute (https://risk.univ-grenoble-alpes.fr/fr, last access: 1 May 2025).
This work was supported by the U.S. Geological Survey Ecosystems – Land Change Science Program.
This paper was edited by Vassiliki Kotroni and reviewed by Frank Techel and Zachary Miller.
Armstrong, R. L. and Armstrong, B. R.: Snow and avalanche climates of the western United States: A comparison of maritime, intermountain, and continental conditions, in: Davos Symposium, September, 1986, Avalanche Formation, Movement and Effects, IAHS Publication, 162, 281–294, 1987.
Ballesteros-Canovas, J. A., Trappmann, D., Madrigal-Gonzalez, J., Eckert, N., and Stoffel, M.: Climate warming enhances snow avalanche risk in the Western Himalayas, P. Natl. Acad. Sci. USA, 115, 3410–3415, dpo:10.1073/pnas.1716913115, 2018.
Birkeland, K. W. and Mock, C. J.: The major snow avalanche cycle of February 1986 in the western United States, Nat. Hazards, 24, 75–95, 2001.
CAIC: Colorado Avalanche Information Center Avalanche Explorer Tool, https://forecasts.avalanche.state.co.us/explorer/ (last access: 3 January 2025), 2025a.
CAIC: About the CAIC, https://avalanche.state.co.us/about-us, (last access: 3 January 2025), 2025b.
Castebrunet, H., Eckert, N., Giraud, G., Durand, Y., and Morin, S.: Projected changes of snow conditions and avalanche activity in a warming climate: the French Alps over the 2020–2050 and 2070–2100 periods, The Cryosphere, 8, 1673–1697, https://doi.org/10.5194/tc-8-1673-2014, 2014.
Corona, C., Lopez Saez, J., Stoffel, M., Bonnefoy, M., Richard, D., Astrade, L., and Berger, F.: How much of the real avalanche activity can be captured with tree rings? An evaluation of classic dendrogeomorphic approaches and comparison with historical archives, Cold Reg. Sci. Technol., https://doi.org/10.1016/j.coldregions.2012.01.003, 2012.
Dkengne Sielenou, P., Viallon-Galinier, L., Hagenmuller, P., Naveau, P., Morin, S., Dumont, M., Verfaillie, D., and Eckert, N.: Combining random forests and class-balancing to discriminate between three classes of avalanche activity in the French Alps, Cold Reg. Sci. Technol., 187, 103276, https://doi.org/10.1016/j.coldregions.2021.103276, 2021.
Eckert, N., Baya, H., and Deschatres, M.: Assessing the response of snow avalanche runout altitudes to climate fluctuations using hierarchical modeling: application to 61 winters of data in France, J. Climate, 23, 3157–3180, 2010.
Eckert, N., Keylock, C. J., Castebrunet, H., Lavigne, A., and Naaim, M.: Temporal trends in avalanche activity in the French Alps and subregions: from occurrences and runout altitudes to unsteady return periods, J. Glaciol., 59, 93–114, https://doi.org/10.3189/2013JoG12J091, 2013.
Eckert, N., Corona, C., Giacona, F., Gaume, J., Mayer, S., van Herwijnen, A., Hagenmuller, P., and Stoffel, M.: Climate change impacts on snow avalanche activity and related risks, Nature Reviews Earth & Environment, https://doi.org/10.1038/s43017-024-00540-2, 2024.
ESRI: Topographic [basemap], World Topographic Map, 4 February 2025, https://www.arcgis.com/home/item.html?id=7dc6cea0b1764a1f9af2e679f642f0f5, last access: 1 May 2025.
Favillier, A., Guillet, S., Morel, P., Corona, C., Lopez Saez, J., Eckert, N., Ballesteros Cánovas, J. A., Peiry, J.-L., and Stoffel, M.: Disentangling the impacts of exogenous disturbances on forest stands to assess multi-centennial tree-ring reconstructions of avalanche activity in the upper Goms Valley (Canton of Valais, Switzerland), Quat. Geochronol., 42, 89–104, https://doi.org/10.1016/j.quageo.2017.09.001, 2017.
Favillier, A., Guillet, S., Trappmann, D., Morel, P., Lopez-Saez, J., Eckert, N., Zenhäusern, G., Peiry, J.-L., Stoffel, M., and Corona, C.: Spatio-temporal maps of past avalanche events derived from tree-ring analysis: A case study in the Zermatt valley (Valais, Switzerland), Cold Reg. Sci. Technol., 154, 9–22, https://doi.org/10.1016/j.coldregions.2018.06.004, 2018.
Favillier, A., Guillet, S., Lopez-Saez, J., Giacona, F., Eckert, N., Zenhäusern, G., Peiry, J. L., Stoffel, M., and Corona, C.: Identifying and interpreting regional signals in tree-ring based reconstructions of snow avalanche activity in the Goms valley (Swiss Alps), Quaternary Sci. Rev., 307, https://doi.org/10.1016/j.quascirev.2023.108063, 2023.
García-Sellés, C., Peña, J. C., Martí, G., Oller, P., and Martínez, P.: WeMOI and NAOi influence on major avalanche activity in the Eastern Pyrenees, Cold Reg. Sci. Technol., 64, 137–145, https://doi.org/10.1016/j.coldregions.2010.08.003, 2010.
Giacona, F., Eckert, N., Corona, C., Mainieri, R., Morin, S., Stoffel, M., Martin, B., and Naaim, M.: Upslope migration of snow avalanches in a warming climate, P. Natl. Acad. Sci. USA, 118, https://doi.org/10.1073/pnas.2107306118, 2021.
Haegeli, P., Shandro, B., and Mair, P.: Using avalanche problems to examine the effect of large-scale atmosphere–ocean oscillations on avalanche hazard in western Canada, The Cryosphere, 15, 1567–1586, https://doi.org/10.5194/tc-15-1567-2021, 2021.
ITRDB: International Tree Ring Data Bank (ITRDB), https://www.ncei.noaa.gov/products/paleoclimatology/tree-ring (last access: 1 May 2025), 2022.
Kruyt, B., Wever, N., Mayer, S., Vergara, J. T., and Schar, C.: Avalanche activity in a changing climate: Changes in wet and dry slab avalanches based on climate simulations over Switzerland, in: Proceedings of the International Snow Science Workshop, 9–13 October 2023, Bend, Oregon, United States, edited by: Peitzsch, E., Marshall, H. P., Savage, S., and Trautman, S., 566–571, 2023.
Lavigne, A., Eckert, N., Bel, L., and Parent, E.: Adding expert contributions to the spatiotemporal modelling of avalanche activity under different climatic influences, J. Roy. Stat. Soc. C-App., 64, 651–671, https://doi.org/10.1111/rssc.12095, 2015.
Lazar, B.: Colorado Avalanche Information Center Season Summary, The Avalanche Review, 38, 42–44, 2019.
Lazar, B. and Williams, M.: Climate change in western ski areas: Potential changes in the timing of wet avalanches and snow quality for the Aspen ski area in the years 2030 and 2100, Cold Reg. Sci. Technol., 51, 219–228, https://doi.org/10.1016/j.coldregions.2007.03.015, 2008.
Marienthal, A., Hendrikx, J., Birkeland, K., and Irvine, K. M.: Meteorological variables to aid forecasting deep slab avalanches on persistent weak layers, Cold Reg. Sci. Technol., 120, 227–236, https://doi.org/10.1016/j.coldregions.2015.08.007, 2015.
Marraccini, B. J., Lazar, B., and Greene, E.: Climate-scale maps of cold-season precipitation in the mountainous areas of Colorado for operational forecasting applications, in: Proceedings of the 2014 International Snow Science Workshop, Banff, Alberta, Canada, 29 September–3 October 2014, edited by: Haegeli, P., 461–464, 2014.
Martinelli, M. and Leaf, C. F.: Historic Avalanches in the Northern Front Range and the Central and Northern Mountains of Colorado, United States Department of Agriculture Forest Service, General Technical Report RMRS-GTR-38, September 1999, 1999.
Mayer, S., Hendrick, M., Michel, A., Richter, B., and van Herwijnen, A.: Projected impact of climate warming on avalanche activity at two sites in the Swiss Alps, in: Proceedings of the International Snow Science Workshop 9–13 October 2023, Bend, Oregon, United States, edited by: Peitzsch, E., Marshall, H. P., Savage, S., and Trautman, S., 573–576, 2023.
Mayer, S., Hendrick, M., Michel, A., Richter, B., Schweizer, J., Wernli, H., and van Herwijnen, A.: Impact of climate change on snow avalanche activity in the Swiss Alps, The Cryosphere, 18, 5495–5517, https://doi.org/10.5194/tc-18-5495-2024, 2024.
McClung, D. M.: The effects of El Nino and La Nina on snow and avalanche patterns in British Columbia, Canada, and central Chile, J. Glaciol., 59, 783–792, https://doi.org/10.3189/2013JoG12J192, 2013.
Mock, C. J. and Birkeland, K. W.: Snow Avalanche Climatology of the Western United States Mountain Ranges, B. Am. Meteorol. Soc., 81, 2367–2392, https://doi.org/10.1175/1520-0477(2000)081<2367:Sacotw>2.3.Co;2, 2000.
Mock, C. J., Carter, K. C., and Birkeland, K. W.: Some Perspectives on Avalanche Climatology, Ann. Am. Assoc. Geogr., 1–10, https://doi.org/10.1080/24694452.2016.1203285, 2016.
Naaim, M., Eckert, N., Giraud, G., Faug, T., Chambon, G., Naaim-Bouvet, F., and Richard, D.: Impact du réchauffement climatique sur l'activité avalancheuse et multiplication des avalanches humides dans les Alpes françaises, Houille Blanche, 102, 12–20, https://doi.org/10.1051/lhb/2016055, 2016.
NRCS: Snow Telemetry (SNOTEL) and Snow Course Data and Products, United States Department of Agriculture, Natural Resources Conservation Service (NRCS), https://www.wcc.nrcs.usda.gov/snow/ (last access: 1 May 2025), 2024.
Peitzsch, E. H., Pederson, G. T., Birkeland, K. W., Hendrikx, J., and Fagre, D. B.: Climate drivers of large magnitude snow avalanche years in the U.S. northern Rocky Mountains, Sci. Rep., 11, https://doi.org/10.1038/s41598-021-89547-z, 2021a.
Peitzsch, E., Hendrikx, J., Stahle, D., Pederson, G., Birkeland, K., and Fagre, D.: A regional spatiotemporal analysis of large magnitude snow avalanches using tree rings, Nat. Hazards Earth Syst. Sci., 21, 533–557, https://doi.org/10.5194/nhess-21-533-2021, 2021b.
Peitzsch, E. H., Milone, K. M., Greene, E., Konigsberg, J., Kichas, N., Stahle, D., Birkeland, K., and Elder, K.: Tree ring dataset for a regional avalanche chronology in Colorado 1319–2022, U.S. Geological Survey data release [data set], https://doi.org/10.5066/P1353HSN, 2024.
Pérez-Guillén, C., Techel, F., Hendrick, M., Volpi, M., van Herwijnen, A., Olevski, T., Obozinski, G., Pérez-Cruz, F., and Schweizer, J.: Data-driven automated predictions of the avalanche danger level for dry-snow conditions in Switzerland, Nat. Hazards Earth Syst. Sci., 22, 2031–2056, https://doi.org/10.5194/nhess-22-2031-2022, 2022.
Pielmeier, C., Techel, F., Marty, C., and Stucki, T.: Wet snow avalnache activity in the Swiss Alps – trend analysis for mid-winter season, in: Proceedings of the International Snow Science Workshop, 7–13 October 2013, Grenoble, France, edited by: Naaim-Bouvet, F., Durand, Y., and Lambert, R., 1240–1246, 2013.
Reardon, B. A., Pederson, G. T., Caruso, C. J., and Fagre, D. B.: Spatial reconstructions and comparisons of historic snow avalanche frequency and extent using tree rings in Glacier National Park, Montana, U.S.A., Arct. Antarct. Alp. Res., 40, 148–160, 2008.
Reuter, B., Hagenmuller, P., and Eckert, N.: Snow and avalanche climates in the French Alps using avalanche problem frequencies, J. Glaciol., 69, 1292–1304, https://doi.org/10.1017/jog.2023.23, 2023.
Schweizer, J.: Snow avalanche formation, Rev. Geophys., 41, https://doi.org/10.1029/2002rg000123, 2003.
Stokes, M. A. and Smiley, T. L.: An Introduction to Tree-Ring Dating, The University of Arizona Press, Tucson, ISBN 9780816516803, 1996.
Viallon-Galinier, L., Hagenmuller, P., and Eckert, N.: Combining modelled snowpack stability with machine learning to predict avalanche activity, The Cryosphere, 17, 2245–2260, https://doi.org/10.5194/tc-17-2245-2023, 2023.
Vose, R. S., Applequist, S., Squires, M., Durre, I., Menne, M. J., Williams, C. N., Fenimore, C., Gleason, K., and Arndt, D.: NOAA Monthly U.S. Climate Gridded Dataset (NClimGrid), Version 1, NOAA National Centers for Environmental Information, https://doi.org/10.7289/V5SX6B56, 2014.
Wieczorek, M. E., Signell, R. P., McCabe, G. J., and Wolock, D. M.: USGS monthly water balance model inputs and outputs for the conterminous United States, 1895–2020, based on ClimGrid data: U.S. Geological Survey data release, https://doi.org/10.5066/P9JTV1T6, 2022.