the Creative Commons Attribution 4.0 License.
the Creative Commons Attribution 4.0 License.
 | 03 Mar 2026
Assessing the intensification and impact of a historical storm in a warmer climate
Johanne Kristine Haandbæk Øelund
Jens Hesselbjerg Christensen
Rune Magnus Koktvedgaard Zeitzen
Henrik Vedel
Henrik Feddersen
Extratropical windstorms pose a major hazard in Northern Europe, with damage primarily arising from the combined effects of high sustained near-surface winds and extreme gusts. While future changes in mid-latitude storms are expected under climate warming, the implications for wind-related impacts remain uncertain. In this study, we investigate the response of thermodynamic warming to an intense historical storm using Storm Anatol, which severely affected Denmark on 3 December 1999, as a representative case.
The storm is simulated using the convection-permitting numerical weather prediction model HARMONIE-AROME within a pseudo-global warming framework. Uniform temperature perturbations are applied throughout the atmosphere, sea surface, and skin layers, while specific humidity is adjusted to maintain relative humidity. Changes in wind speed, gusts, and the spatial and temporal extent of damaging wind conditions are analysed across a range of warming scenarios. To quantify integrated wind exposure, we employ a new cumulative metric applicable to both wind speed and gust diagnostics, referred to as the Cumulative Wind Exposure Index.
The simulations show a systematic intensification of near-surface wind and gust speeds with increasing temperature, accompanied by an expansion in the spatial footprint and duration of extreme wind conditions. The cumulative wind exposure increases markedly in the warmer scenarios relative to the historical simulation. When interpreted in the context of established wind–damage relationships, these changes imply substantially enhanced potential for wind-related impacts.
Overall, the results demonstrate that thermodynamic warming alone can significantly amplify windstorm exposure, highlighting the importance of considering compound wind characteristics, when assessing future wind hazards and their impacts in Northern Europe.
- Article
(12471 KB) - Full-text XML
- BibTeX
- EndNote


High wind speeds related to intense extratropical low pressure systems represent a significant socioeconomic and environmental hazard (IPCC, 2021b). These intense weather events result in substantial impacts on both natural and built environments, with the most immediate consequences for human systems arising from structural damage caused by high sustained wind speeds and, in particular, severe gusts (Gliksman et al., 2023). The forces resulting from the passage of such low-pressure systems can be very destructive (Little et al., 2023), e.g. tearing roofs from buildings, uproot trees, and bring down power lines, resulting in widespread infrastructure disruptions. Transportation networks are particularly vulnerable, with bridge closures, flight cancellations, and railway disruptions leading to substantial economic consequences (Donat et al., 2011a). Additionally, storms are often accompanied by storm surges, which amplify the overall damage to the coastal regions (Souto-Ceccon et al., 2025; Woth et al., 2005).
Extreme wind events are inherently destructive because the force exerted on structures increases sharply with wind speed. Physically, the wind's kinetic energy scales with the square of its velocity, meaning that a doubling of wind speed quadruples the energy acting on buildings (Lorenz et al., 2025). In reality, the relationship between wind intensity and damage is often even steeper: Empirical studies show that economic losses tend to rise with the cube to fifth power of wind speed (Donat et al., 2011b; Klawa and Ulbrich, 2003). Engineering simulations of structural failure sometimes use exponents as high as 8–12 (Prahl et al., 2012), reflecting how seemingly modest intensifications in wind can translate into disproportionately large socioeconomic impacts.
To manage these risks, structural design standards employ standardized reference wind values that define the nominal wind conditions a structure must be capable of withstanding. In Europe, these are set by European Committee for Standardization (2005), which specifies that the basic wind speed represents the 10 min mean wind speed measured at 10 m height over open terrain, expected to be exceeded on average only once every 50 years. More specifically in Denmark, the main focus of the present study, the reference wind speed is 24 m s−1 for most regions, increasing to 27 m s−1 within approximately 25 km of the exposed west coast of Jutland facing the North Sea. Assessing whether these design thresholds remain adequate under climate change, given potential shifts in the frequency and intensity of extreme wind events, therefore represents a key question for future structural and risk assessments.
The development and intensification of extratropical storms are primarily governed by baroclinic instability, a process driven by the convection of available potential energy arising from horizontal temperature gradients into kinetic energy (Eady, 1949; Catto, 2016; Federer et al., 2025). Stronger temperature contrasts within the troposphere enhance this instability, promoting stronger storms, which explains the predominance of storm systems during the winter months when meridional temperature gradients are strongest (Ulbrich et al., 2009; Laurila et al., 2021). Furthermore, latent heat release associated with the condensation of atmospheric moisture also contributes to an intensification of storm systems (Li et al., 2014).
Because baroclinic instability and latent heating both depend on thermal gradients and moisture availability, future warming could substantially modify the energetic environment in which extratropical storms develop. Climate projections consistently show robust thermodynamic changes, particularly increased atmospheric moisture and altered meridional temperature gradients (Christensen and Christensen, 2003; IPCC, 2021c; Lindsey and Dahlmann, 2025), yet the resulting effects on storm intensity and frequency remain uncertain. Some studies report an increase in the number of very intense storms over Northern Europe (Bengtsson et al., 2009), whereas others find no significant long-term trend (The WASA Group, 1998). More recent analyses suggest a tri-polar pattern in projected windstorm activity, with enhanced intensity and frequency over the North Atlantic, the British Isles, and the North Sea region; a possible decrease across central and southern Europe; and mixed or slightly increasing tendencies toward northern Scandinavia (Ruosteenoja et al., 2019; Severino et al., 2024; Little et al., 2023).
In light of these regional disparities and continuing uncertainty about how storm intensity responds to a changing climate, it is instructive to examine well-documented historical extremes that exemplify the upper end of Northern European storm behaviour.
This study focuses on Storm Anatol, one of the most powerful windstorms recorded in Denmark, which struck on 3 December 1999 (Nielsen and Sass, 2003). Anatol provides a valuable reference case for assessing whether current design-level wind speeds, as defined by European Committee for Standardization (2005), adequately represent the upper tail of observed extremes. The storm is classified based on widespread sustained wind speeds exceeding 24.5 m s−1, the Beaufort wind scale definition of Storm (WMO, 1992), a commonly used threshold for defining storm events (Feser et al., 2015), and this criterion will be applied consistently throughout the study, rather than the thresholds used locally in Denmark.
The rapid intensification of Anatol has attracted considerable scientific attention because it exemplifies the type of explosive cyclogenesis that can occur in the North Atlantic–European sector. Reanalyses and mesoscale modelling indicate that its deepening was partly driven by latent heat release within the warm conveyor belt (Kettle, 2021; Zeitzen et al., 2025), consistent with the recognized role of diabatic processes in intensifying baroclinic disturbances (Fink et al., 2012). This interplay between strong thermal gradients and moisture transport provides a physical analogue for the mechanisms expected to become more influential in a warmer and moister atmosphere.
Anatol remains among the strongest windstorms ever measured by anemometers in Denmark, and its impact was profound. Both mean wind and gusts locally exceeded national design thresholds, causing widespread infrastructure damage and substantial economic losses. Although storms of comparable magnitude are estimated to occur only once per century in this region (Ulbrich et al., 2001), their severe societal consequences underscore the importance of revisiting how current design standards represent extreme wind risk with a view to climate change.
While no two storm events are identical, could a similar event become more intense and damaging in a warmer climate?
To address this question, the study employs the pseudo-global warming (PGW) approach (Schär et al., 1996) within a storyline framework (Shepherd et al., 2018). The PGW method modifies the thermodynamic state of the atmosphere, through a systematic adjustment of temperature and humidity, while preserving the original dynamical structure of the observed event. This simplified implementation follows approaches used in previous studies (Hibino et al., 2018; Matte et al., 2022; Brogli et al., 2023). This allows the investigation on how a known extreme system responds to a warmer and more moist climate, without altering the fundamental storm dynamics (Trenberth et al., 2015; Ermis et al., 2024). The storyline approach provides a physically coherent set of “what-if” scenarios, linking climate change to tangible, event based impacts (Sillmann et al., 2021; Shepherd, 2019). Building on the work of Matte et al. (2022) and detailed in Zeitzen et al. (2025), this study examines the impact of the potential intensification of an extreme storm in a warming climate.
While Zeitzen et al. (2025) focused primarily on the meteorological evolution and dynamical mechanisms governing Anatol's development in a warmer atmosphere, the present study addresses the consequences of these changes.
Considering the impact of Analtol on Denmark, we introduce the Cumulative Wind Exposure Index (CWEI) to quantify the integrated spatial and temporal severity of wind exposure, assess the duration of wind threshold exceedances, and analyse directional changes in near-surface winds over land. These aspects provide a complementary perspective on how thermodynamic perturbations may translate into enhanced wind-related impacts.
Rather than evaluating changes in storm frequency, this study isolates the thermodynamic influence of a warmer atmosphere on the intensity, structure, and surface wind impacts of an Anatol-like event under otherwise comparable large-scale conditions.
2.1 Harmonie model and data
Anatol has been the subject of extensive analysis in both meteorological literature and media reporting due to its severe impact in first and foremost Denmark but also more widely across Northern Europe (Kettle, 2021; Ulbrich et al., 2001). In the present study, the storm is re-evaluated using the HARMONIE-AROME limited-area numerical weather prediction (NWP) model to explore its sensitivity to varying temperature conditions (Bengtsson et al., 2017).
The simulations are based on cycle 43h2.2, with a horizontal grid resolution of 2 km with 90 vertical levels between the surface and 10 hPa, corresponding to approximately 25 km above sea level, thereby capturing mesoscale atmospheric processes with high fidelity as evident from routinely operational applications across the Nordic countries and beyond.
A broad model domain extending into the North Atlantic is adopted to ensure a dynamically consistent representation of the large-scale flow influencing the storm evolution. The domain covers a large fraction of the North Atlantic Ocean, enabling the capturing of the development of Anatol from the initial upper level Rossby wave disturbance to grow to a matured storm when reaching Denmark as well as most of the decay on its path over the Baltic Sea. The model employs a rotated Lambert conformal grid covering the area from 28° W to 37° E and 44 to 73° N, ensuring nearly uniform physical grid spacing across the domain. For a visual reference, the grid domain is shown in Fig. A1. This setup enables an extended and dynamically consistent simulation of the storm under PGW-modified conditions.
Initial and lateral boundary conditions are provided by ERA5 reanalysis (Hersbach et al., 2020), and updates every 3 h. Sea surface temperatures are likewise specified by ERA5. All ERA5 data are horizontally and vertically interpolated to the HARMONIE-AROME model grid and vertical levels. To reduce model spin-up effects, the simulations are initialized from ERA5 at the beginning of the experiment, while subsequent integrations are initialized from the preceding model state. Further details on the experimental setup are provided in Zeitzen et al. (2025).
The control simulation uses unmodified ERA5 temperatures, while the pseudo-global warming runs incorporate uniform perturbations to the initial state and model boundaries across the domain. Details of the perturbation methodology are provided in Sect. 2.1. To produce a temporally consistent time series of the storm's life cycle, a mosaic is compiled using model output from forecast hours +09 to +14 from each run. This method ensures continuous hourly coverage during the most dynamically active phase of the storm.
Each simulation comprises 11 forecast cycles, initiated every 6 h between 1 December 1999, 00:00 UTC and 3 December 1999, 12:00 UTC, each providing a 24 h forecast. Model output is saved at hourly intervals, except for wind speed, which is archived every 15 min to capture short-term variability and peak gusts. The control simulation represents the historical 1999 event using unmodified ERA5 temperatures, while four additional experiments apply uniform temperature perturbations of −1, +1, +2, and +3 °C throughout the atmosphere, as well as to the sea surface temperature. These modifications aim to emulate plausible future warming scenarios as well as an approximate preindustrial (PI) climatic condition (IPCC, 2021a). For the approach to have any validity the reference run must be documented to produce forecasts of the storm of high quality when compared to observations of the actual storm. Then the sensitivity simulations remain physically coherent and offer insights into how the same system might evolve under different climate conditions (Ciullo et al., 2021). In part due to the high resolution of the simulations, the reference run conducted with HARMONIE-AROME compares very well with observations, in particular sustained wind speeds and gusts are simulated realistically particularly over Denmark, the main focus of this study, as demonstrated in Zeitzen et al. (2025).
Further details on the adopted HARMONIE-AROME model setup, its physics parametrisation and general performance can be found in Bengtsson et al. (2017) and Zeitzen et al. (2025).
2.2 Pseudo-global warming and story-line approach
The PGW framework is applied to investigate how a meteorological system would respond to systematically altered thermodynamic conditions. In the adopted approach, the temperature field in the initial and boundary conditions is uniformly modified, and specific humidity is recalculated to maintain the original relative humidity. The adjustment ensures that relative humidity remains constant, leading to higher specific humidity with increasing temperature according to the Clausius–Clapeyron relation (see Zeitzen et al., 2025, Supplement).
To portray the sensitivity to a warming climate, only uniform modifications were considered. It has previously been found (e.g. Matte et al., 2022) that applying climate changes found from climate simulations tend to increase overall atmospheric stability and thereby reduce the inherent extremity of the original meteorological conditions, which are a prerequisite for intense synoptic development.
The simulations with −1, +1, +2, and +3 °C perturbations are compared directly with the unmodified control run, providing a physically controlled basis for evaluating changes in storm intensity and structure.
Additionally, two sensitivity simulations were conducted; (1) to test the vertical lapse rate dependency, (2) to test the importance of the meridional temperature gradients. For the first experiment, the lower troposphere lapse rates were altered, with a maximum change at the surface, and a linearly decreasing modification with height until 700 hPa, from where the vertical structure remained unchanged. For the second experiment, the same vertical lapse rates modification was made, however the magnitude at the surface, and hence the following vertical lapse rate change, were made latitude dependent, symmetrical around 55° N, following the approximate storm track.
For both sensitivity experiments, only minor changes to the cyclone development were identified, with similar deepening rates and general wind extents. Furthermore, the enhanced wind drivers discussed, showed no sign of changes, in contrast to the main experiments (see Zeitzen et al., 2025). Motivated by the dominating cyclogenesis drivers; meridional temperature gradient and vertical static stability, these experiments further confirmed that overly smoothed thermodynamic changes may reduce the storm system’s dynamic response, again consistent with findings by Hibino et al. (2018) and Matte et al. (2022).
2.3 Cumulative wind exposure index
To assess the severity of a storm it is essential to consider not only the peak wind speed but also the duration of high wind conditions, as prolonged exposure can significantly affect the structural integrity of materials (Lynn and Stathopoulos, 1985; Wang et al., 2024). In addition, the total economic loss associated with a storm is closely linked to the spatial extent of the impacted area (Grinsted et al., 2019). To capture these combined effects, a novel index is introduced that integrates wind intensity, duration, and spatial coverage; a Cumulative wind exposure index (CWEI), which accounts for both the spatial extent and the duration of wind speeds exceeding a chosen damage threshold. The CWEI is defined as the cumulative sum of grid points and the time steps where wind speeds exceed a predefined threshold:
denotes the mean wind speed at time t at the location (x,y), Wthresh is a predefined threshold, 1(⋅) is the indicator function, equal to 1 if condition is true otherwise 0.
While several storm severity indices exist (e.g., Leckebusch et al., 2008; Gliksman et al., 2023), these mostly rely on percentile-based thresholds that are more appropriate for climatological analysis. For engineering and economic applications, absolute thresholds tied to structural damage or insurance claims are more relevant.
In much of Europe, sustained wind speeds around 24–25 m s−1 are typically regarded as indicative of severe storm conditions. The CWEI integrates wind magnitude, spatial extent, and duration relative to such a threshold, providing a physically based and practically grounded measure of storm severity. The threshold itself is not critical to the index formulation; it can be adjusted to reflect local design standards or specific analytical purposes. CWEI thereby complements existing metrics and is particularly suitable for event-based sensitivity analyses, as applied in this study. In the present analysis, the CWEI is applied to hourly mean wind speed data. However, the formulation is equally applicable to higher-temporal-resolution datasets, such as 15 min gust measurements.
The Storm Anatol impacted Denmark, southern Sweden and northern Germany on 3 December 1999. Anatol developed rapidly over the eastern North Atlantic in early December 1999. Its formation was triggered by the interaction of two atmospheric disturbances, a surface baroclinic wave tracking north-east from Newfoundland and an upper-tropospheric shortwave trough descending from the Labrador Sea. Their interaction enhanced baroclinic instability and initiated rapid cyclogenesis. By the evening of 2 December, a closed surface low had formed west of Ireland, moving eastward along the southern edge of a cold upper-level trough centred over Iceland, (e.g. Ulbrich et al., 2001).
Anatol intensified quickly in a zone of strong temperature gradient, with warm air to the south and exceptionally cold air to the north. By early 3 December, its central pressure had dropped to around 990 hPa near the British Isles and continued falling, reaching a minimum of 952 hPa over eastern Jutland at 18:00 UTC. It then moved across Denmark into Sweden and began weakening after crossing the Baltic Sea (Voldborg, 2000; Ulbrich et al., 2001; Kettle, 2021; Nielsen and Sass, 2003). The modelled trajectory can be found in Fig. A1.
The storm's strongest winds occurred south of its centre, affecting areas from the German and Danish North Sea coasts to Copenhagen. Denmark experienced widespread gale force winds and in the southern part of the country sustained winds reached storm force (>24.5 m s−1), with peak gusts exceeded hurricane force (>40 m s−1) in most of the southern part of Denmark from 14:00 to 22:00 UTC, peaking between 16:00 and 18:00 UTC with the passage of the back-bent front (e.g. Zeitzen et al., 2025)
Anatol produced record-breaking wind speeds. During the event, 10 min mean wind speeds exceeded 41.4 m s−1, before the anemometer at Rømø failed, with gusts reaching 51.4 m s−1 onshore (Cappelen et al., 2018), categorizing it as a 100 year event (Kettle, 2021). The offshore Mærsk Endeavour oil rig recorded a gust of 59.2 m s−1 at 40 m above mean sea level. Additional wind measurements included gusts of 41 m s−1 at Copenhagen Airport and 40 m s−1 on the island of Bornholm (Cappelen et al., 2018).
The storm caused about 800 injuries and 7 fatalities in Denmark, airports were closed, and transport greatly interrupted (Kettle, 2021). Approximately 4 million m3 of forest was damaged and extensive damage to buildings, including the collapse of a large crane at the Odense shipyard were seen. Widespread power outages occurred across Denmark, and the total economic loss was estimated at EUR 1.7 billion, which, adjusted for inflation, corresponds to approximately 2.8 billion EUR in 2024 (Cappelen et al., 2018; Kettle, 2021). In northern Germany the storm losses reached EUR 100 million (Klawa and Ulbrich, 2003) and in Sweden 5 million m3 of forest were damaged (Nilsson et al., 2007).
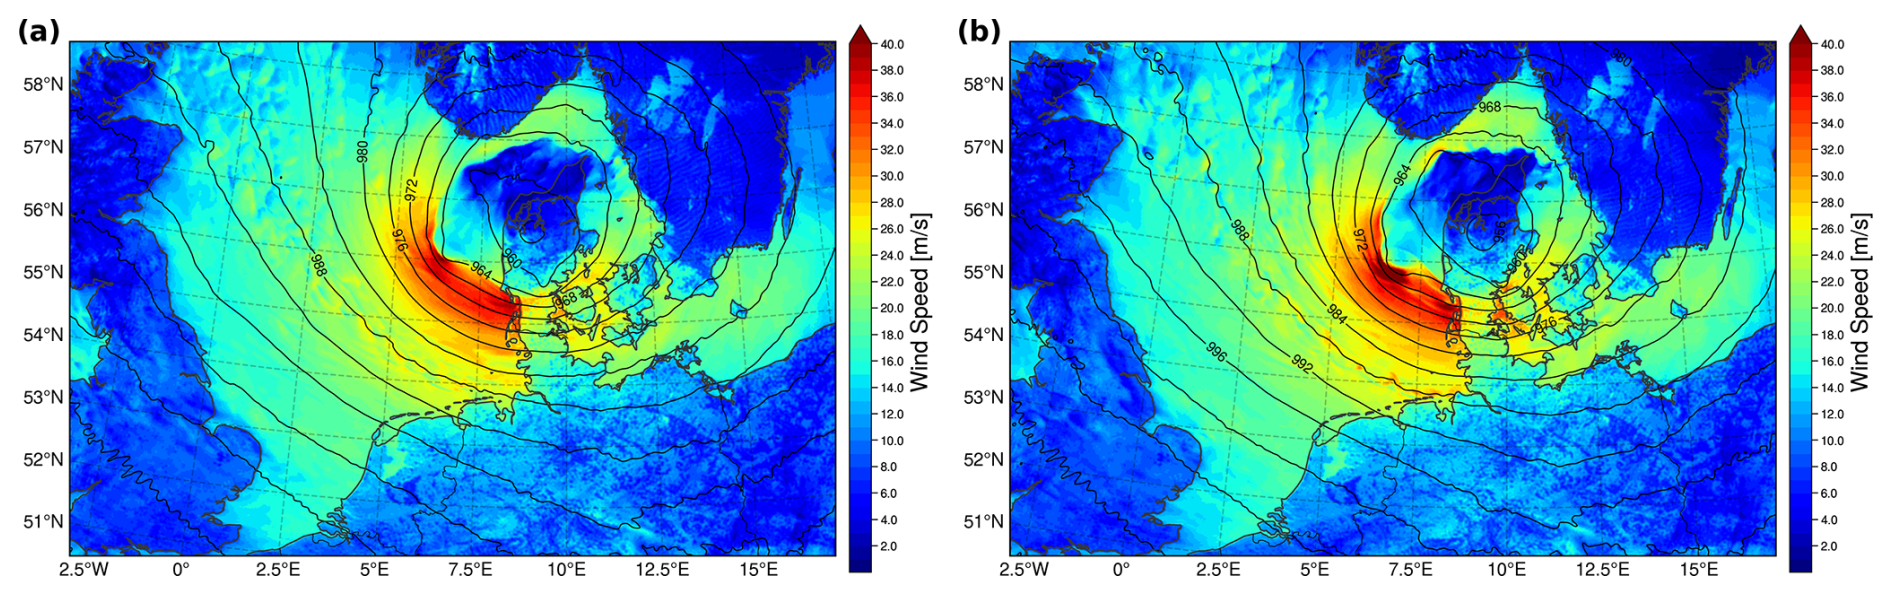
Figure 1The storm intensity, shown by colour, and low pressure system, shown by the black contour-lines, at 3 December, 18:00 UTC, for each of the different model runs of the Control run (a) and +3 °C (b). The plots for the other runs of −1, +1 and +2 °C are shown in Appendix B.
In order to emphasize the role of warming, this study will primarily focus on the difference observed between the control run and the +3 °C warming scenario.
In terms of intensity of the wind speed and structure, the storm event is well reproduced by the HARMONIE model, (Fig. 1). This figure shows the modeled 10 m wind speed and mslp at 18:00 UTC. The spatial structure of the control run, (Fig. 1a) and the +3 °C model run, (Fig. 1b are broadly similar. However, the +3 °C run displays visibly stronger wind speeds, indicated by the darker red shading. Small differences in the exact storm location between the two simulations (Zeitzen et al., 2025) limit the direct interpretability of a difference map. For completeness, however, the difference plot is included in Fig. B1 as a supplementary visual reference.
The other warming scenarios are shown in Fig. B2 illustrating the pressure system and wind for all simulations, highlighting these shifts. The modelled winds from the control run are generally similar to, though slightly higher, than the in-situ measurements from the actual event, providing validation for the models output (see Zeitzen et al., 2025).
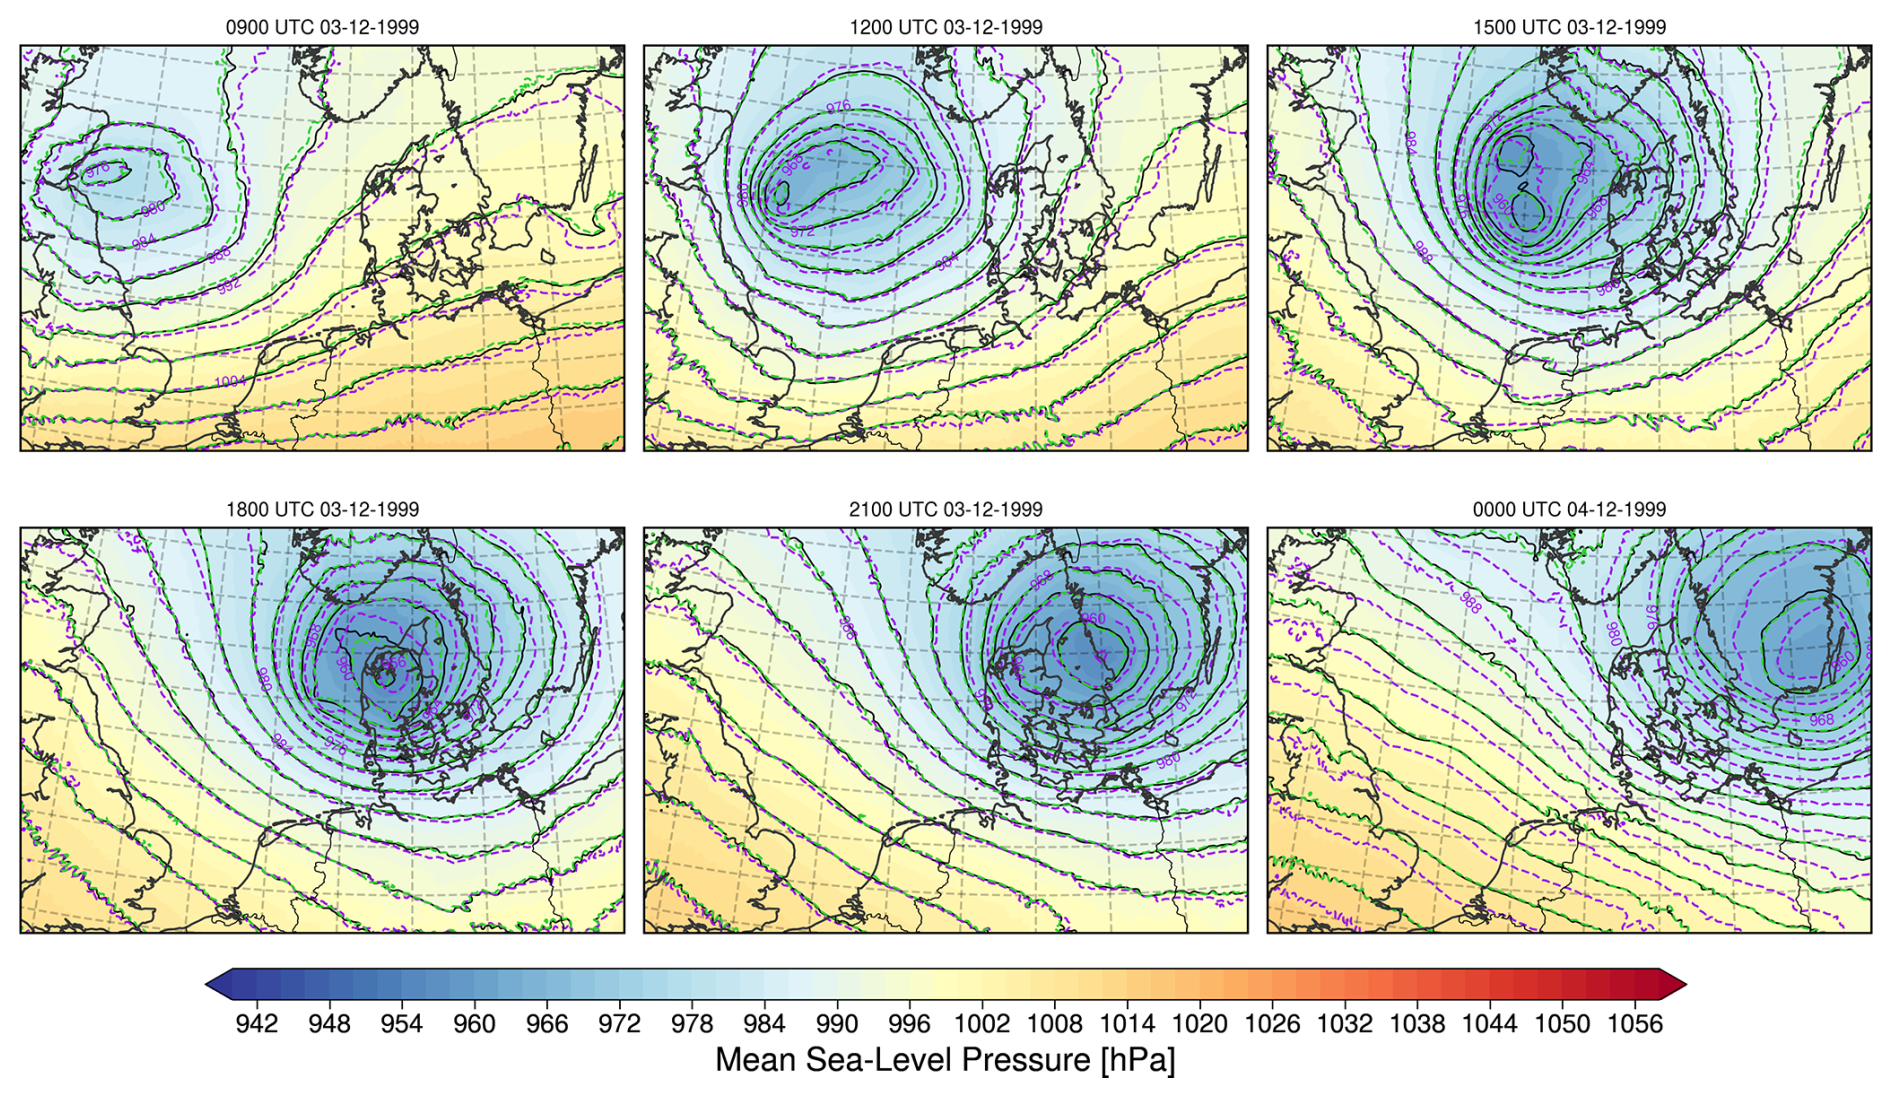
Figure 2The low pressure system for the control run (black line), PI run (green dashed line) and +3 °C run (violet dashed line) at different time. The colourbar follow the control run.
The development of the low-pressure system is pictured in Fig. 2. At 18:00 UTC, corresponding to the onset of peak wind intensity over land, the low-pressure centre is slightly shifted eastward with increasing temperature. This is accompanied by only a modest deepening of the central pressure, from 954 hPa in the control run to 952 hPa in the +3 °C simulation.
The Fig. 3 presents the maximum 10 m wind speed, for both mean and gust wind components, obtained over the entire simulated period and across the full model domain. The simulations indicate a tendency for higher maximum mean wind speeds and gusts under warmer temperature conditions. Max wind speed increases by approximately 0.6 m s−1 per °C of warming (R2=0.78), while gusts show a weaker increase of about 0.7 m s−1 per °C (R2=0.57). The 98 % fractile of the storm only shows a small increase of 0.2 m s−1 per degree of warming (R2=0.37). Although the relationship is not strictly monotonic across all perturbations, these results suggest a modest strengthening of near-surface peak winds in warmer scenarios.
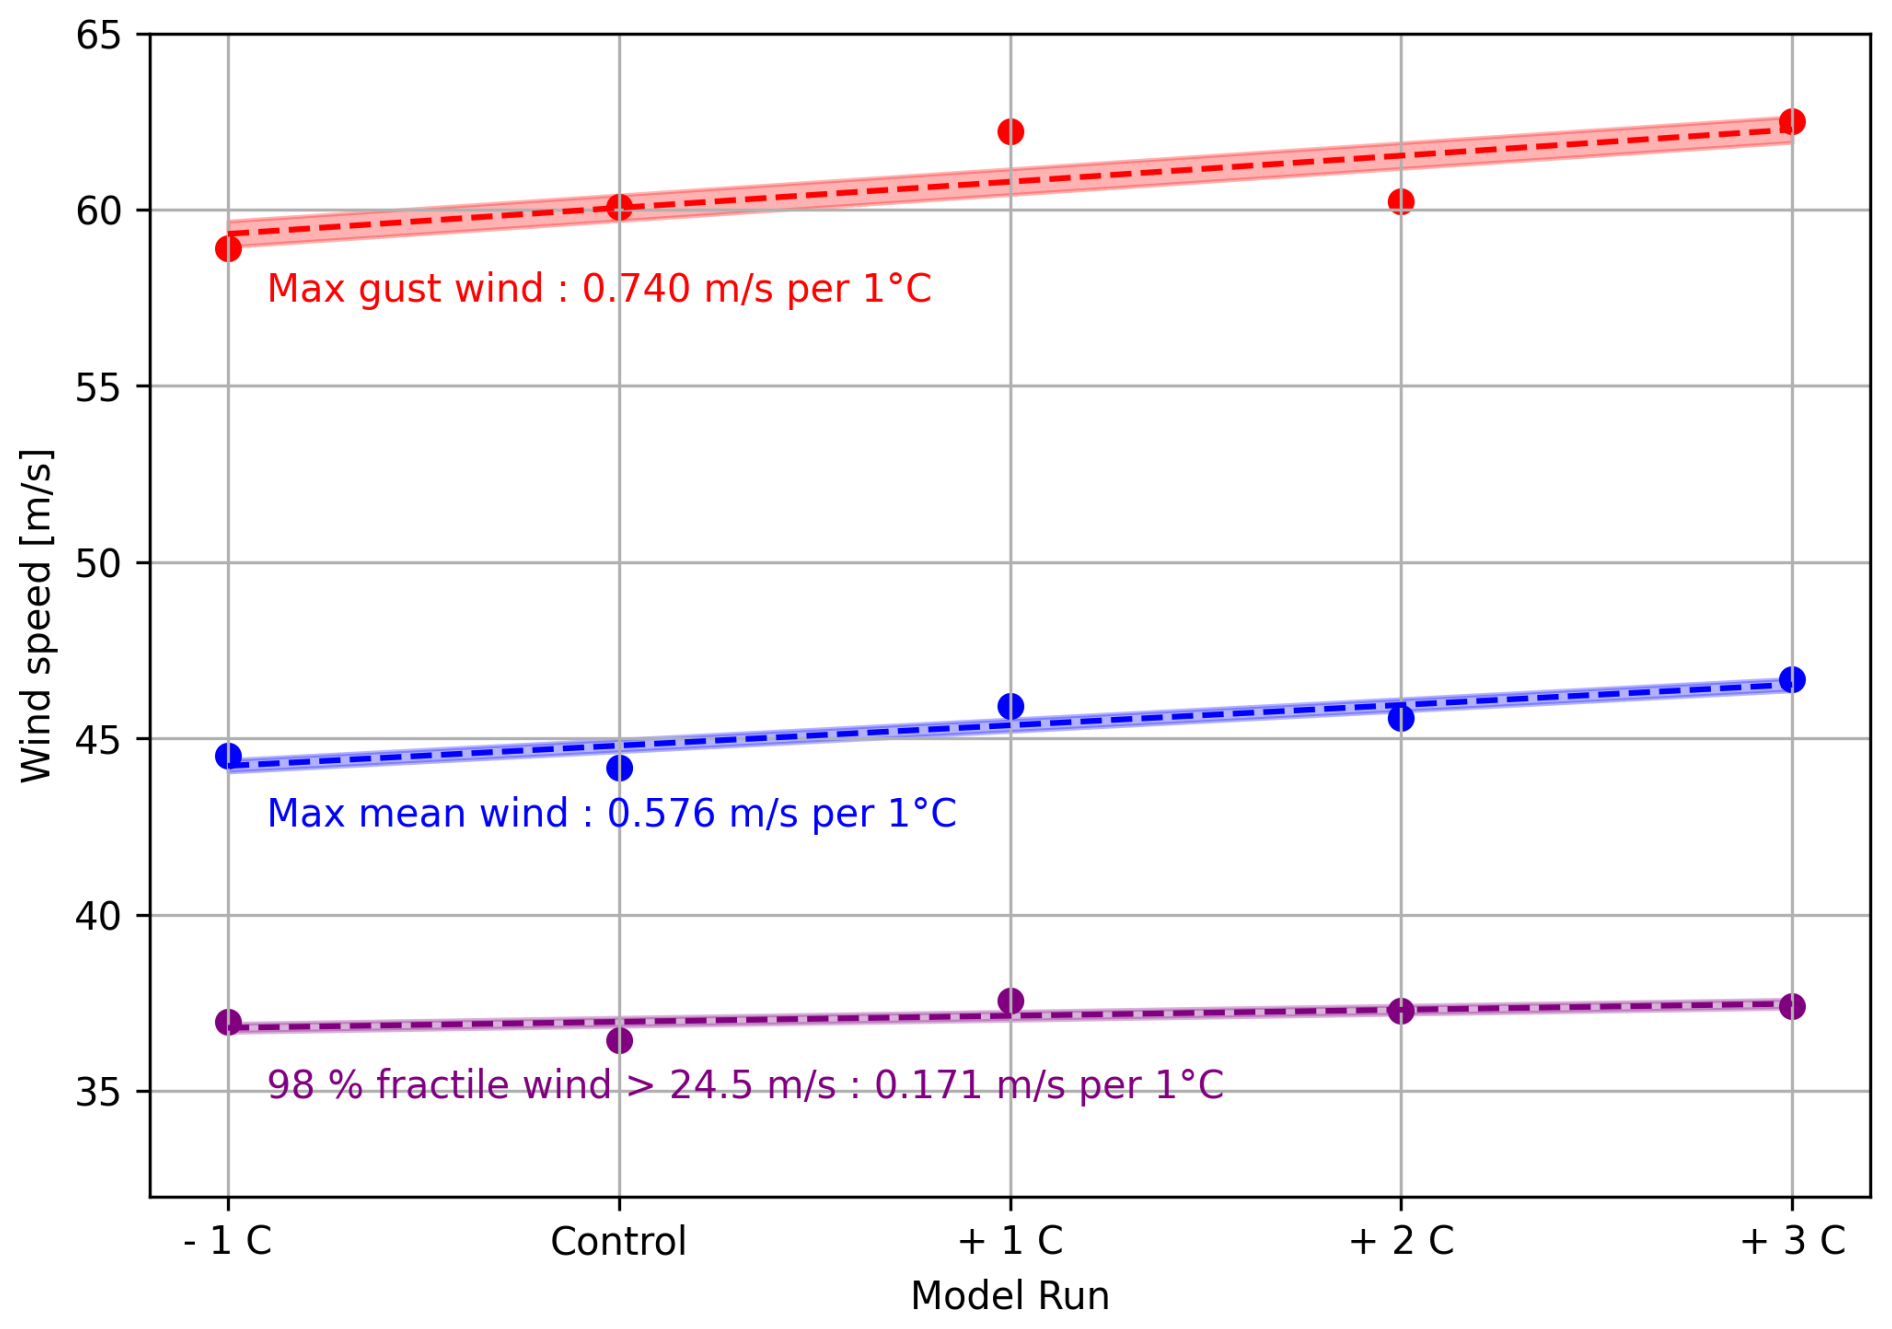
Figure 3Overview of the maximum mean wind speed and wind gust over Denmark for each scenario during the storm period. The figure also illustrates the increase in maximum wind speed per degree of warming for both mean wind and gust.
This increase in maximum wind speed results in an increase in wind pressure on constructions in terms of kinetic energy with 12 % and a power increase of 18 %. The empirical large scale insurance risk model increases in the range of 25 %–32 % and the higher detailed assessment increases by 56 %–94 %. These values are calculated based on the various exponents linked to calculating damages to constructions in terms of inflicted force (v2), risk assessment/insurance (v3–v5) and total failure (v8–v12).
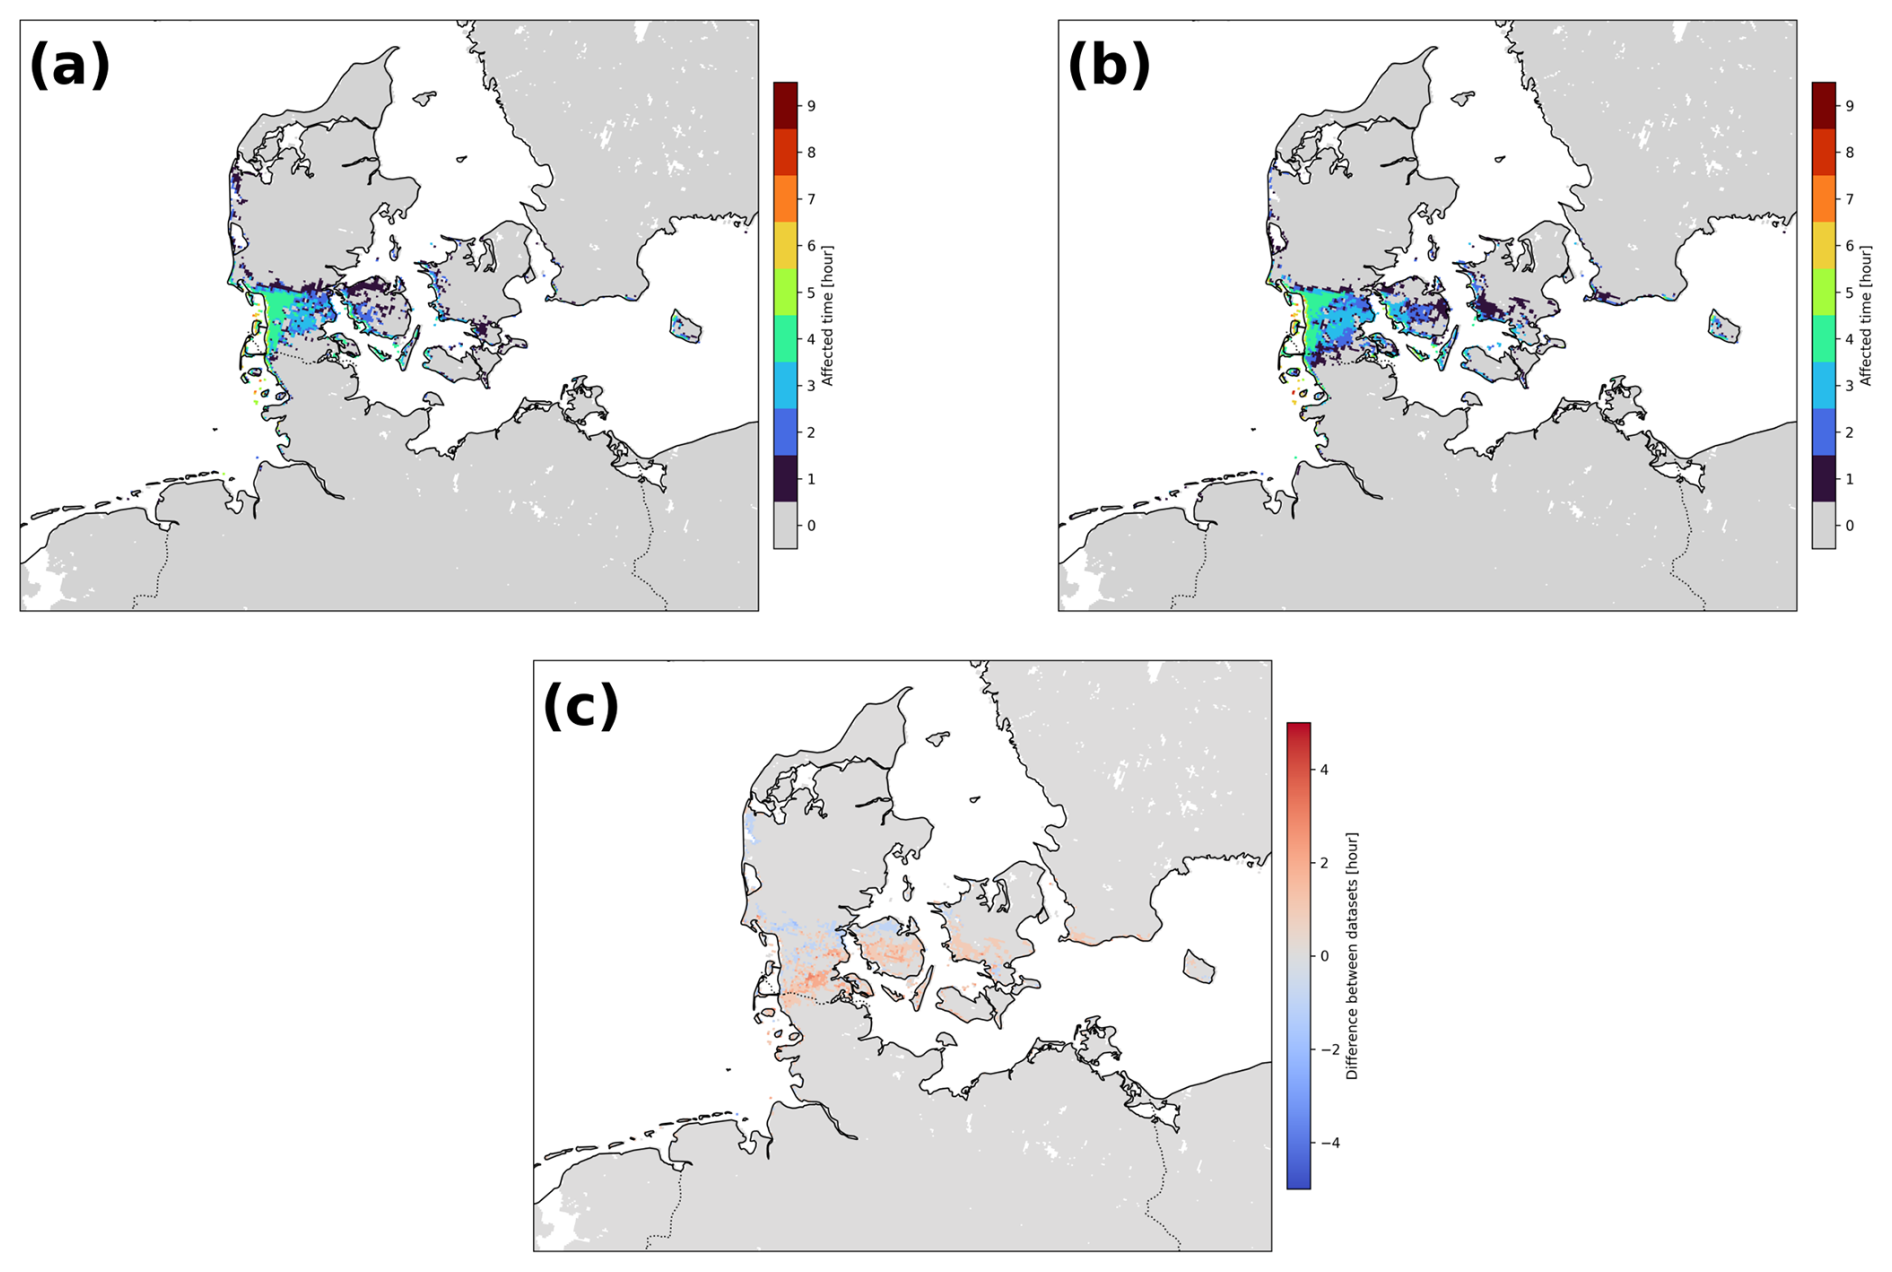
Figure 4The footprint of the storm with wind above 24.5 m s−1 for the control run (a) and the +3 °C (b). The colourbar indicates the time each grid point experiences storm. Panel (c) shows the difference between the 2 model runs.
Figure 4 illustrates the duration of land area affected by wind speeds equal to or exceeding storm-force wind speed (e.g. 24.5 m s−1), emphasizing the substantial impact of Anatol on southern Denmark and the northern most parts of Germany. The figure depicts the full spatial footprint of the storm. As the primary focus of this study is Denmark, arguably the region most strongly impacted by the highest wind speeds, corresponding results for Denmark alone are presented in Fig. C1. In the control run (Fig. 4a) storm-force winds persisted for up to 8 h in the western part of Denmark and northern Germany, where mostly constrained to within a few kilometres from the coast as far south as at the Elbe river mouth. In contrast, the +3 °C scenario (Fig. 4b), the storm remained active for more than 9 h in some areas. As shown, the storm with sustained winds exceeding 24.5 m s−1 was largely concentrated over Denmark, with only limited impacts along the northwestern coastline of Germany and the southernmost parts of Sweden. Table 1 shows the areal percentage of Denmark subjected to storm conditions in various hours. The PI simulation exhibits a systematically higher areal fraction than the control simulation, a difference that is further examined in the Discussion section.
In Fig. 4c the difference in the duration during which storm force conditions are exceeded over land is shown. The northern part of the storm-area seems to experience a decrease in the storm-period from the control run to the +3 °C run, whereas the middle and southern part of the area affected experiences an increase in the storm period of up to 6 h. Overall 13 % of the affected area experiences an increase in storm duration, compared to 8 % showing a decrease.
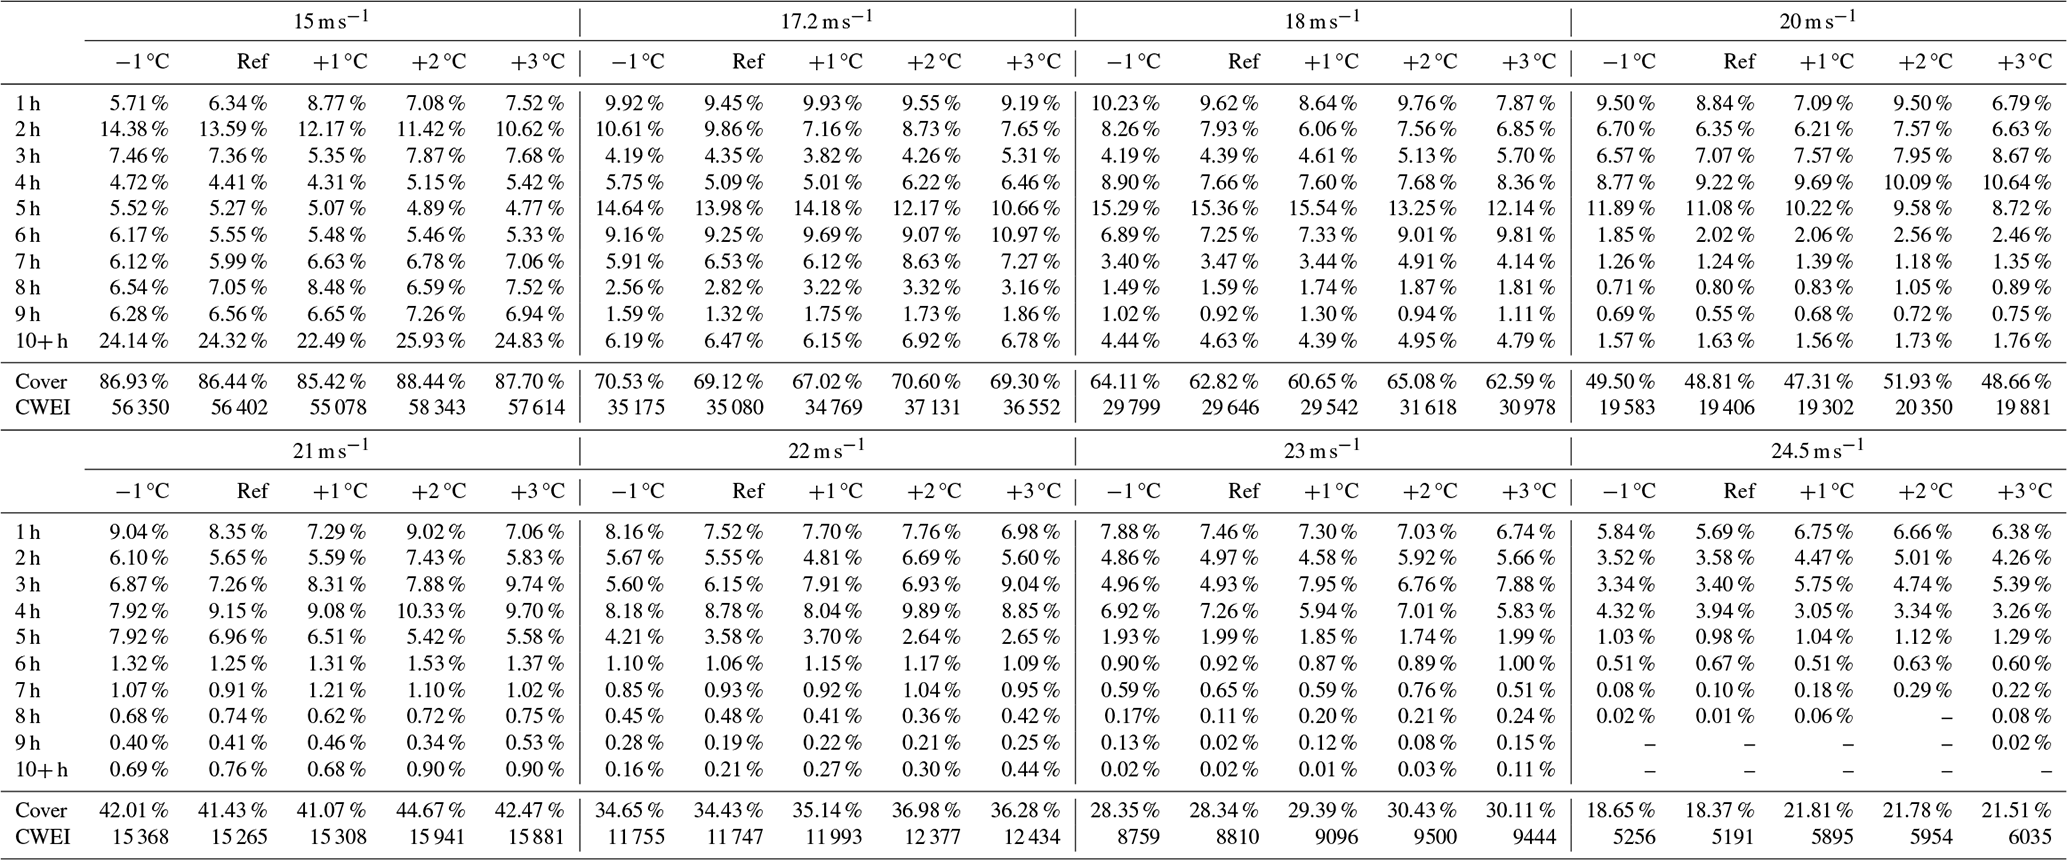
For Denmark the corresponding numbers are 10 % for an increase and 4 % for a decrease (Fig. C1c). Furthermore, the percentage of land area in Denmark affected by wind speeds exceeding 24.5 m s−1 increases from 18.4 % in the control run to 21.5 % in the +3 °C scenario, a difference of approximately 1500 km2, as described in Table 1. Also shown in the table are the CWEI values for each scenario at the wind speed thresholds of 24.5 m s−1, calculated for the period 14:00 to 00:00 UTC with the model resolution of 2 km. 10 723 grid points were included in the calculation. Similarly, for gusts exceeding 40 m s−11, the impacted area rises from 29.5 % in the control run to 32.5 % in the +3 °C scenario, shown in Fig. D1. The full range of coverage percentages for different thresholds (from 15 to 24.5 m s−1) is provided in the Appendix, Table E1.
Table 1Overview of the percentage of Denmark affected by wind speed above 24.5 m s−1 at different durations, the total percentage of Denmark that experienced storm and CWEI. An extended version is presented in Table E1, displaying the results for various thresholds.
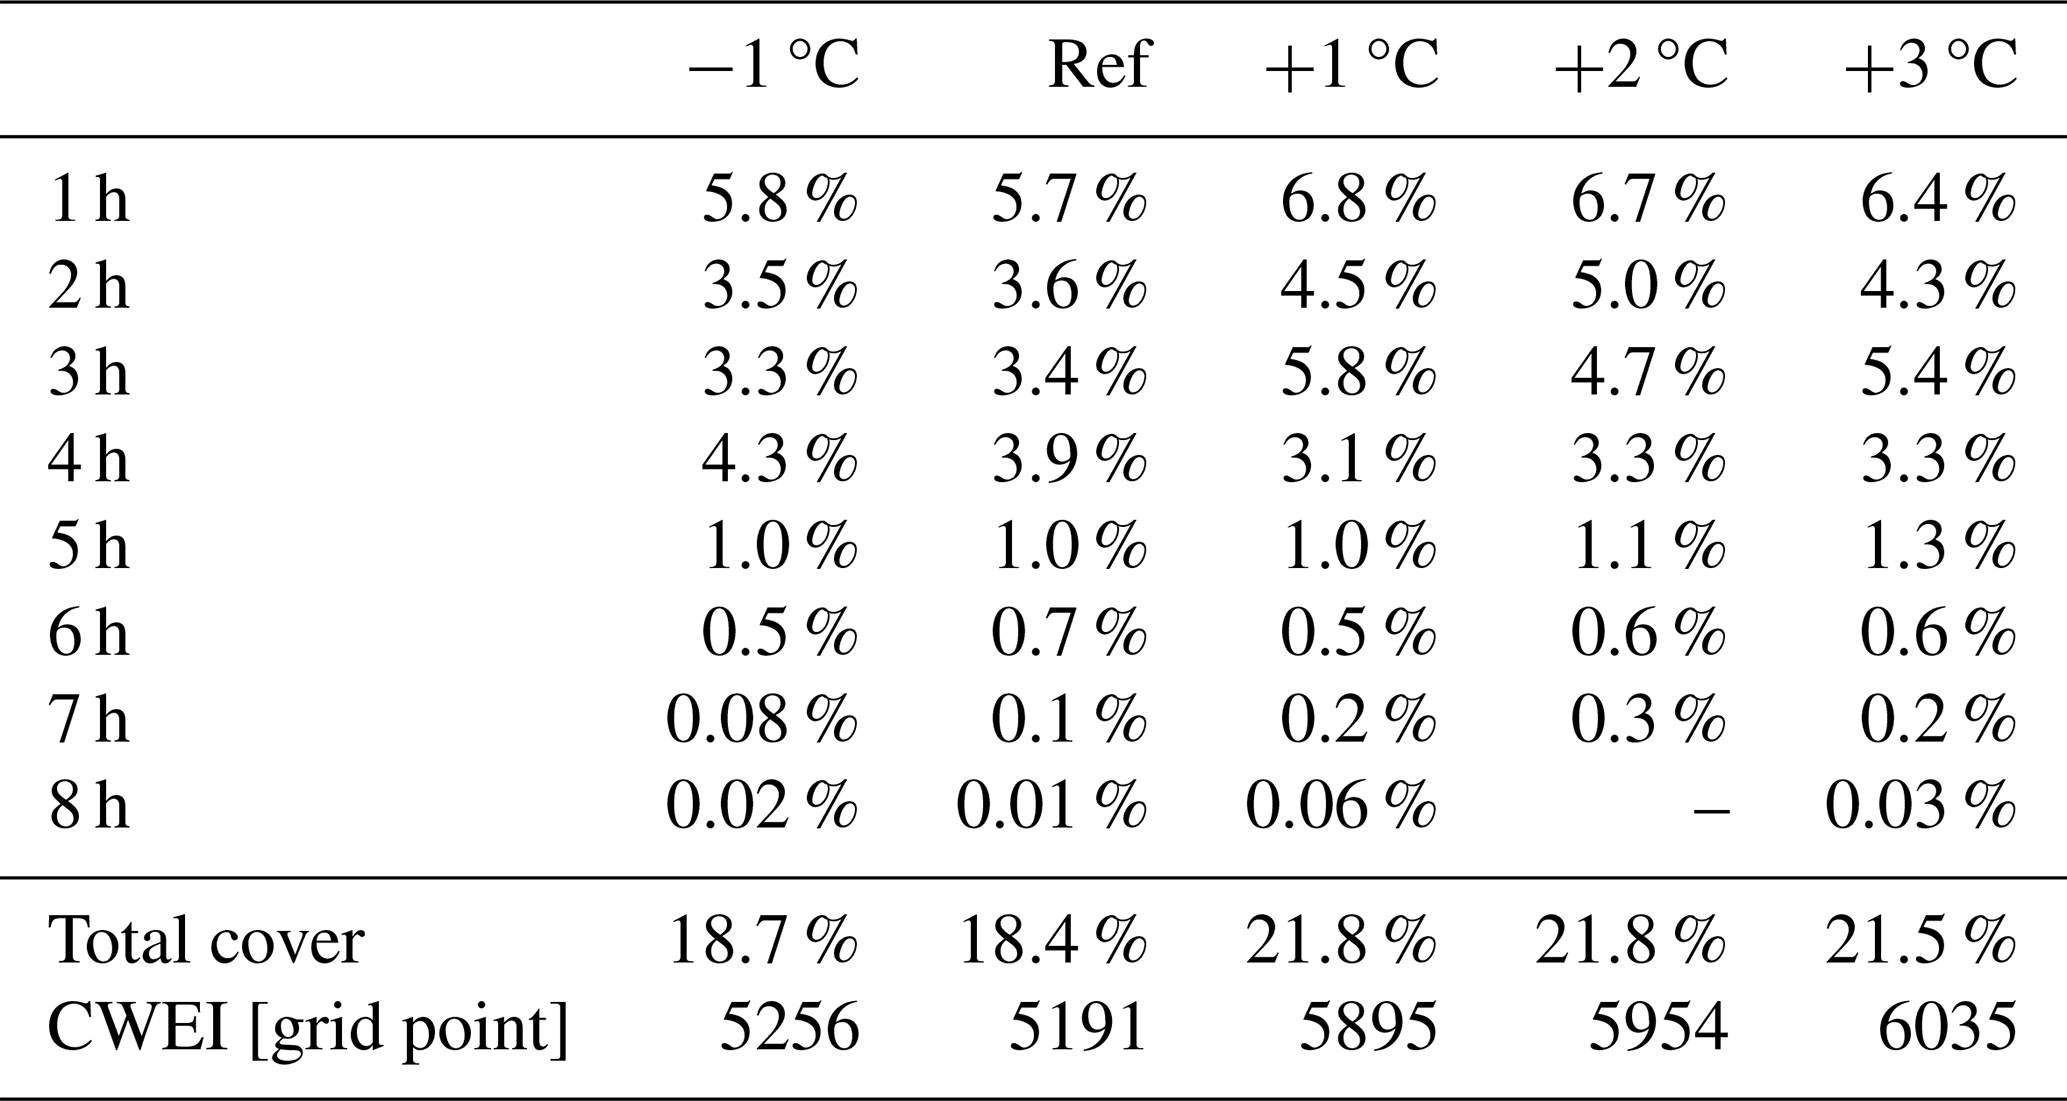
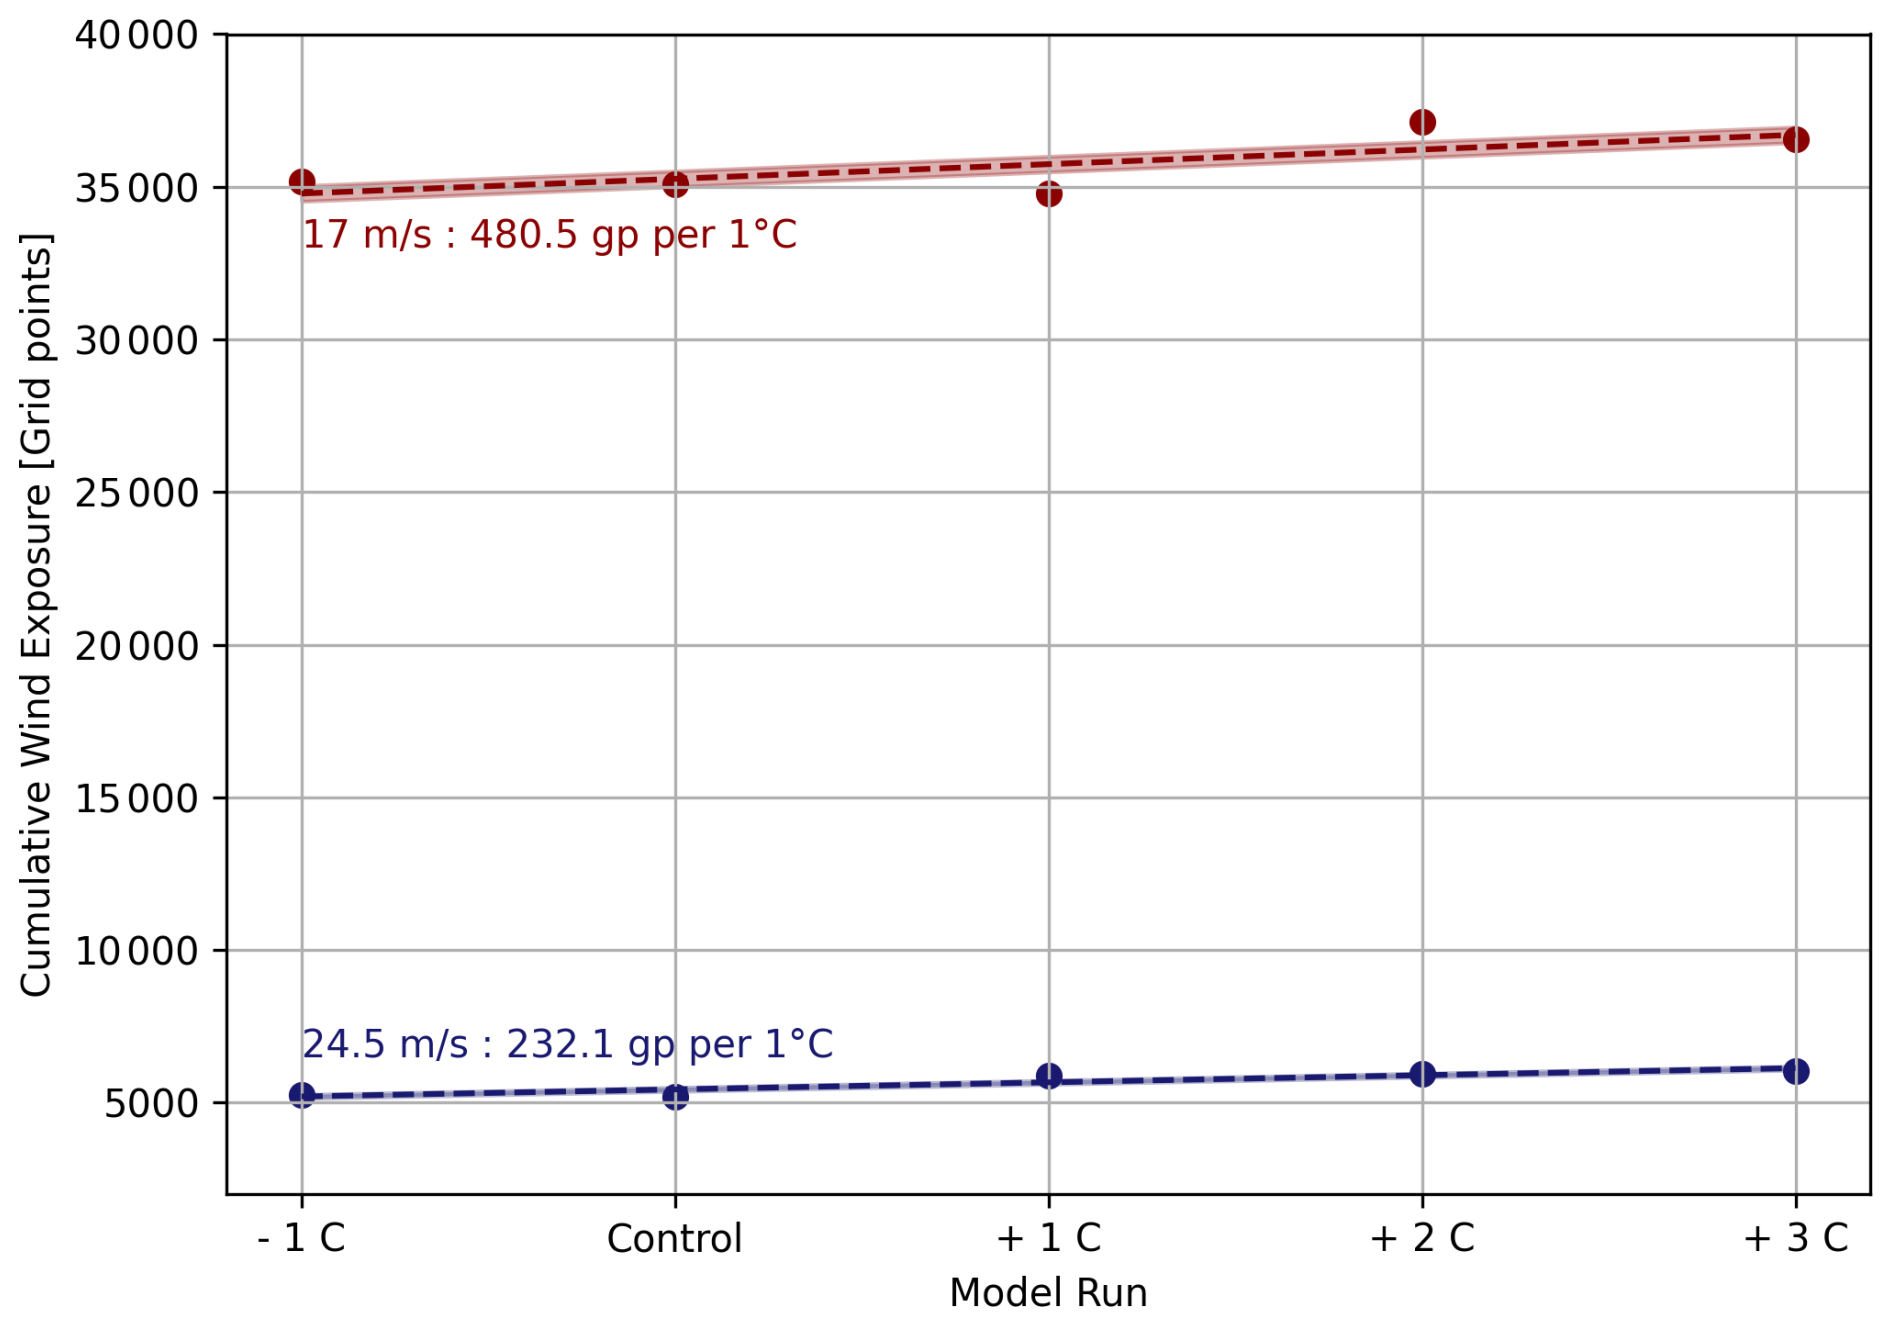
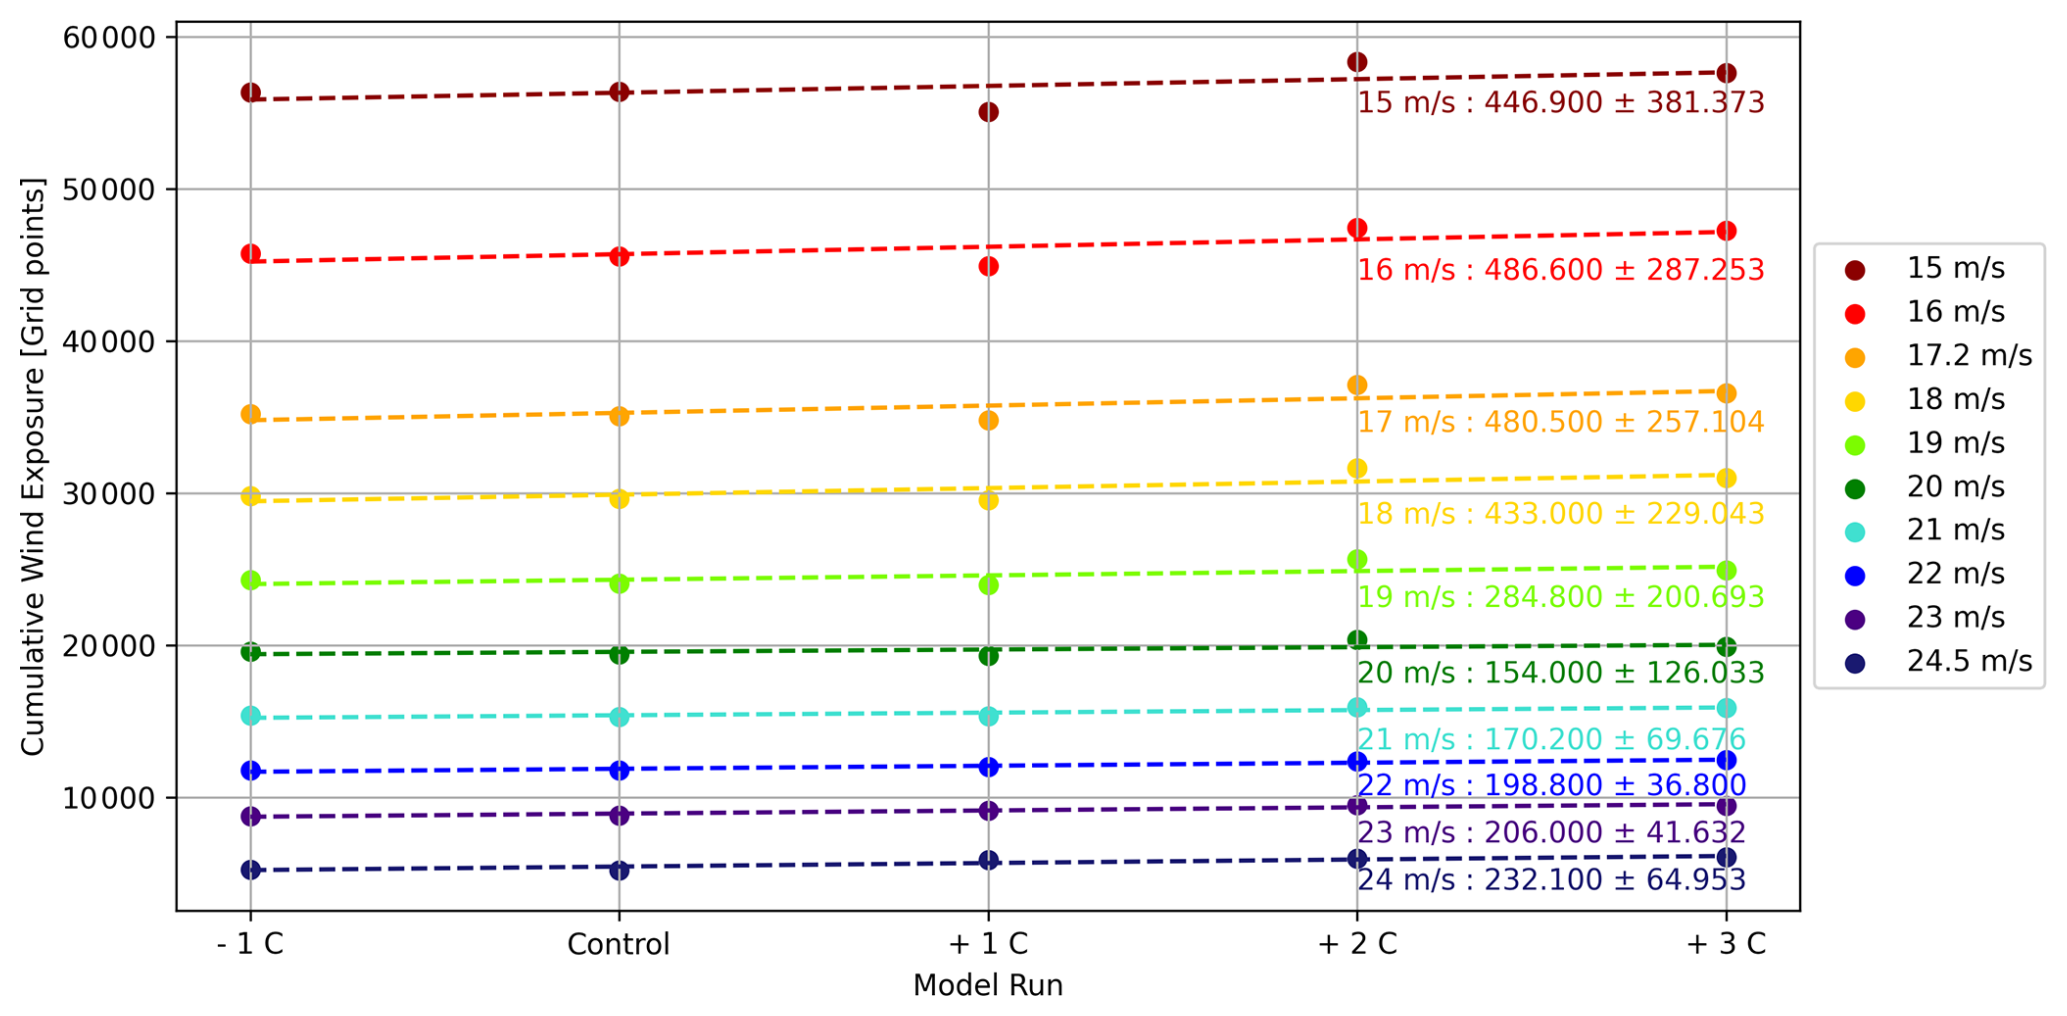
Figure 5Development of the CWEI for the 5 modeled scenarios, showing the increase of Denmark effected over time.
Consequently, Anatol's CWEI increases by approximately 800 km2 h, per degree of warming for strong mean wind speeds (24.5 m s−1), with a statistically significant linear fit (R2=0.81) as shown in Fig. 52.
The temporal evolution of the maximum wind speed over Denmark for all five scenarios during the period when the storm affects Danish land areas is shown in Fig. 6.
Figure 6a shows that the realised maximum wind speed is generally higher in the warmer scenarios, all exceeding 45 m s−1. The control run and the simulation mimicking PI conditions exhibit similar behaviour. However, the PI run reaches a slightly higher peak wind speed.
The timing of peak wind speeds varies among the scenarios. The +2 and +3 °C runs peak later, around 18:00–19:00 UTC, while the +1 °C, control, and −1 °C runs peak slightly earlier, at 17:00–18:00 UTC. Such variations might be expected, as even minor perturbations, including cooling, can influence storm intensity, position, and timing, particularly in mesoscale models where feedback processes are highly sensitive.
Figure 6b presents the proportion of the Danish land area affected by wind speeds exceeding 24.5 m s−1. A clear trend emerges in which the affected area increases with warming. The control and PI runs show nearly identical behaviours, whereas all three warming scenarios exhibit a consistent increase in the affected land area throughout the storm's evolution. Notably, the maximum land area experiencing storm force winds occurs simultaneously for all three warming runs.
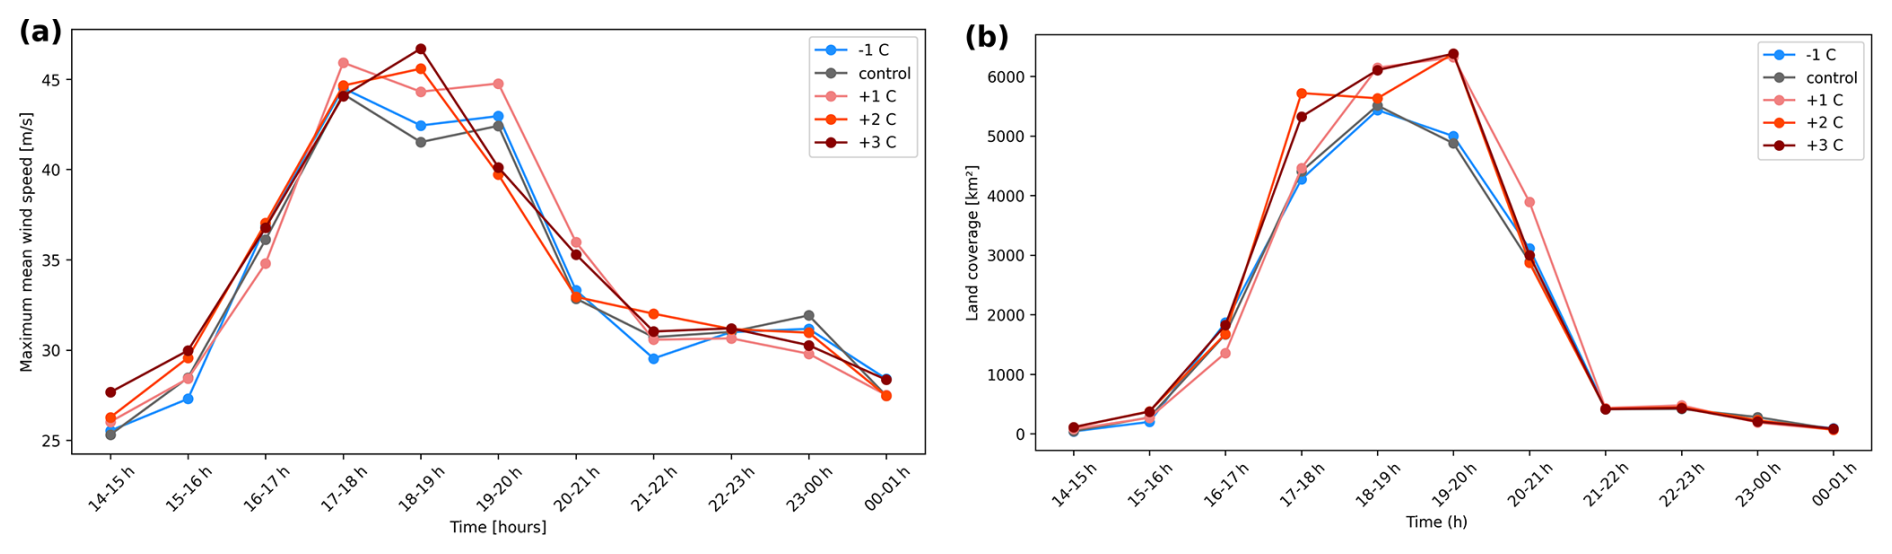
Figure 6The time evolution of the maximum mean wind speed over land (a) and the land affected by mean wind speed above 24.5 m s−1 (b).
Changes in near-surface wind direction were analysed to assess how a warmer and more humid atmosphere modifies not only wind intensity but also the spatial structure of the storm's footprint (Fig. 7). In the warmer-climate simulations (Fig. 7b and d), the large-scale near-surface wind field exhibits a modest but coherent clockwise rotation over much of Denmark and the adjacent North Sea. This behaviour is consistent with a slight displacement of the cyclone track and an eastward shift of the maximum pressure gradient, leading to enhanced westerly to south-westerly flow over Jutland. As a result, strong winds penetrate further inland compared to the reference simulation.
Directional changes are more pronounced for the most intense winds (Fig. 7c and d). In the warming experiments, the strongest near-surface winds shift toward more southerly and south-westerly sectors, particularly along the west coast of Denmark and in inner Danish waters. This reorientation focuses the highest wind speeds along coastal regions that are already highly exposed to storm surge and wave forcing, thereby increasing the potential for compound hazards. From an impact perspective, such directional shifts are particularly relevant, as they modify which coastlines, infrastructure corridors, and population centres are most exposed to damaging winds.
Overall, the combination of a slightly altered storm trajectory, modified pressure-gradient orientation, and enhanced thermal gradients aloft contributes to a moderately broader and directionally altered wind field. These changes extend both the duration and the geographic extent of damaging winds and help explain the increases in cumulative wind exposure quantified by the CWEI. Thus, wind-directional changes provide an additional mechanism, beyond peak wind intensification, through which a warmer atmosphere amplifies the potential impacts of an Anatol-like storm.
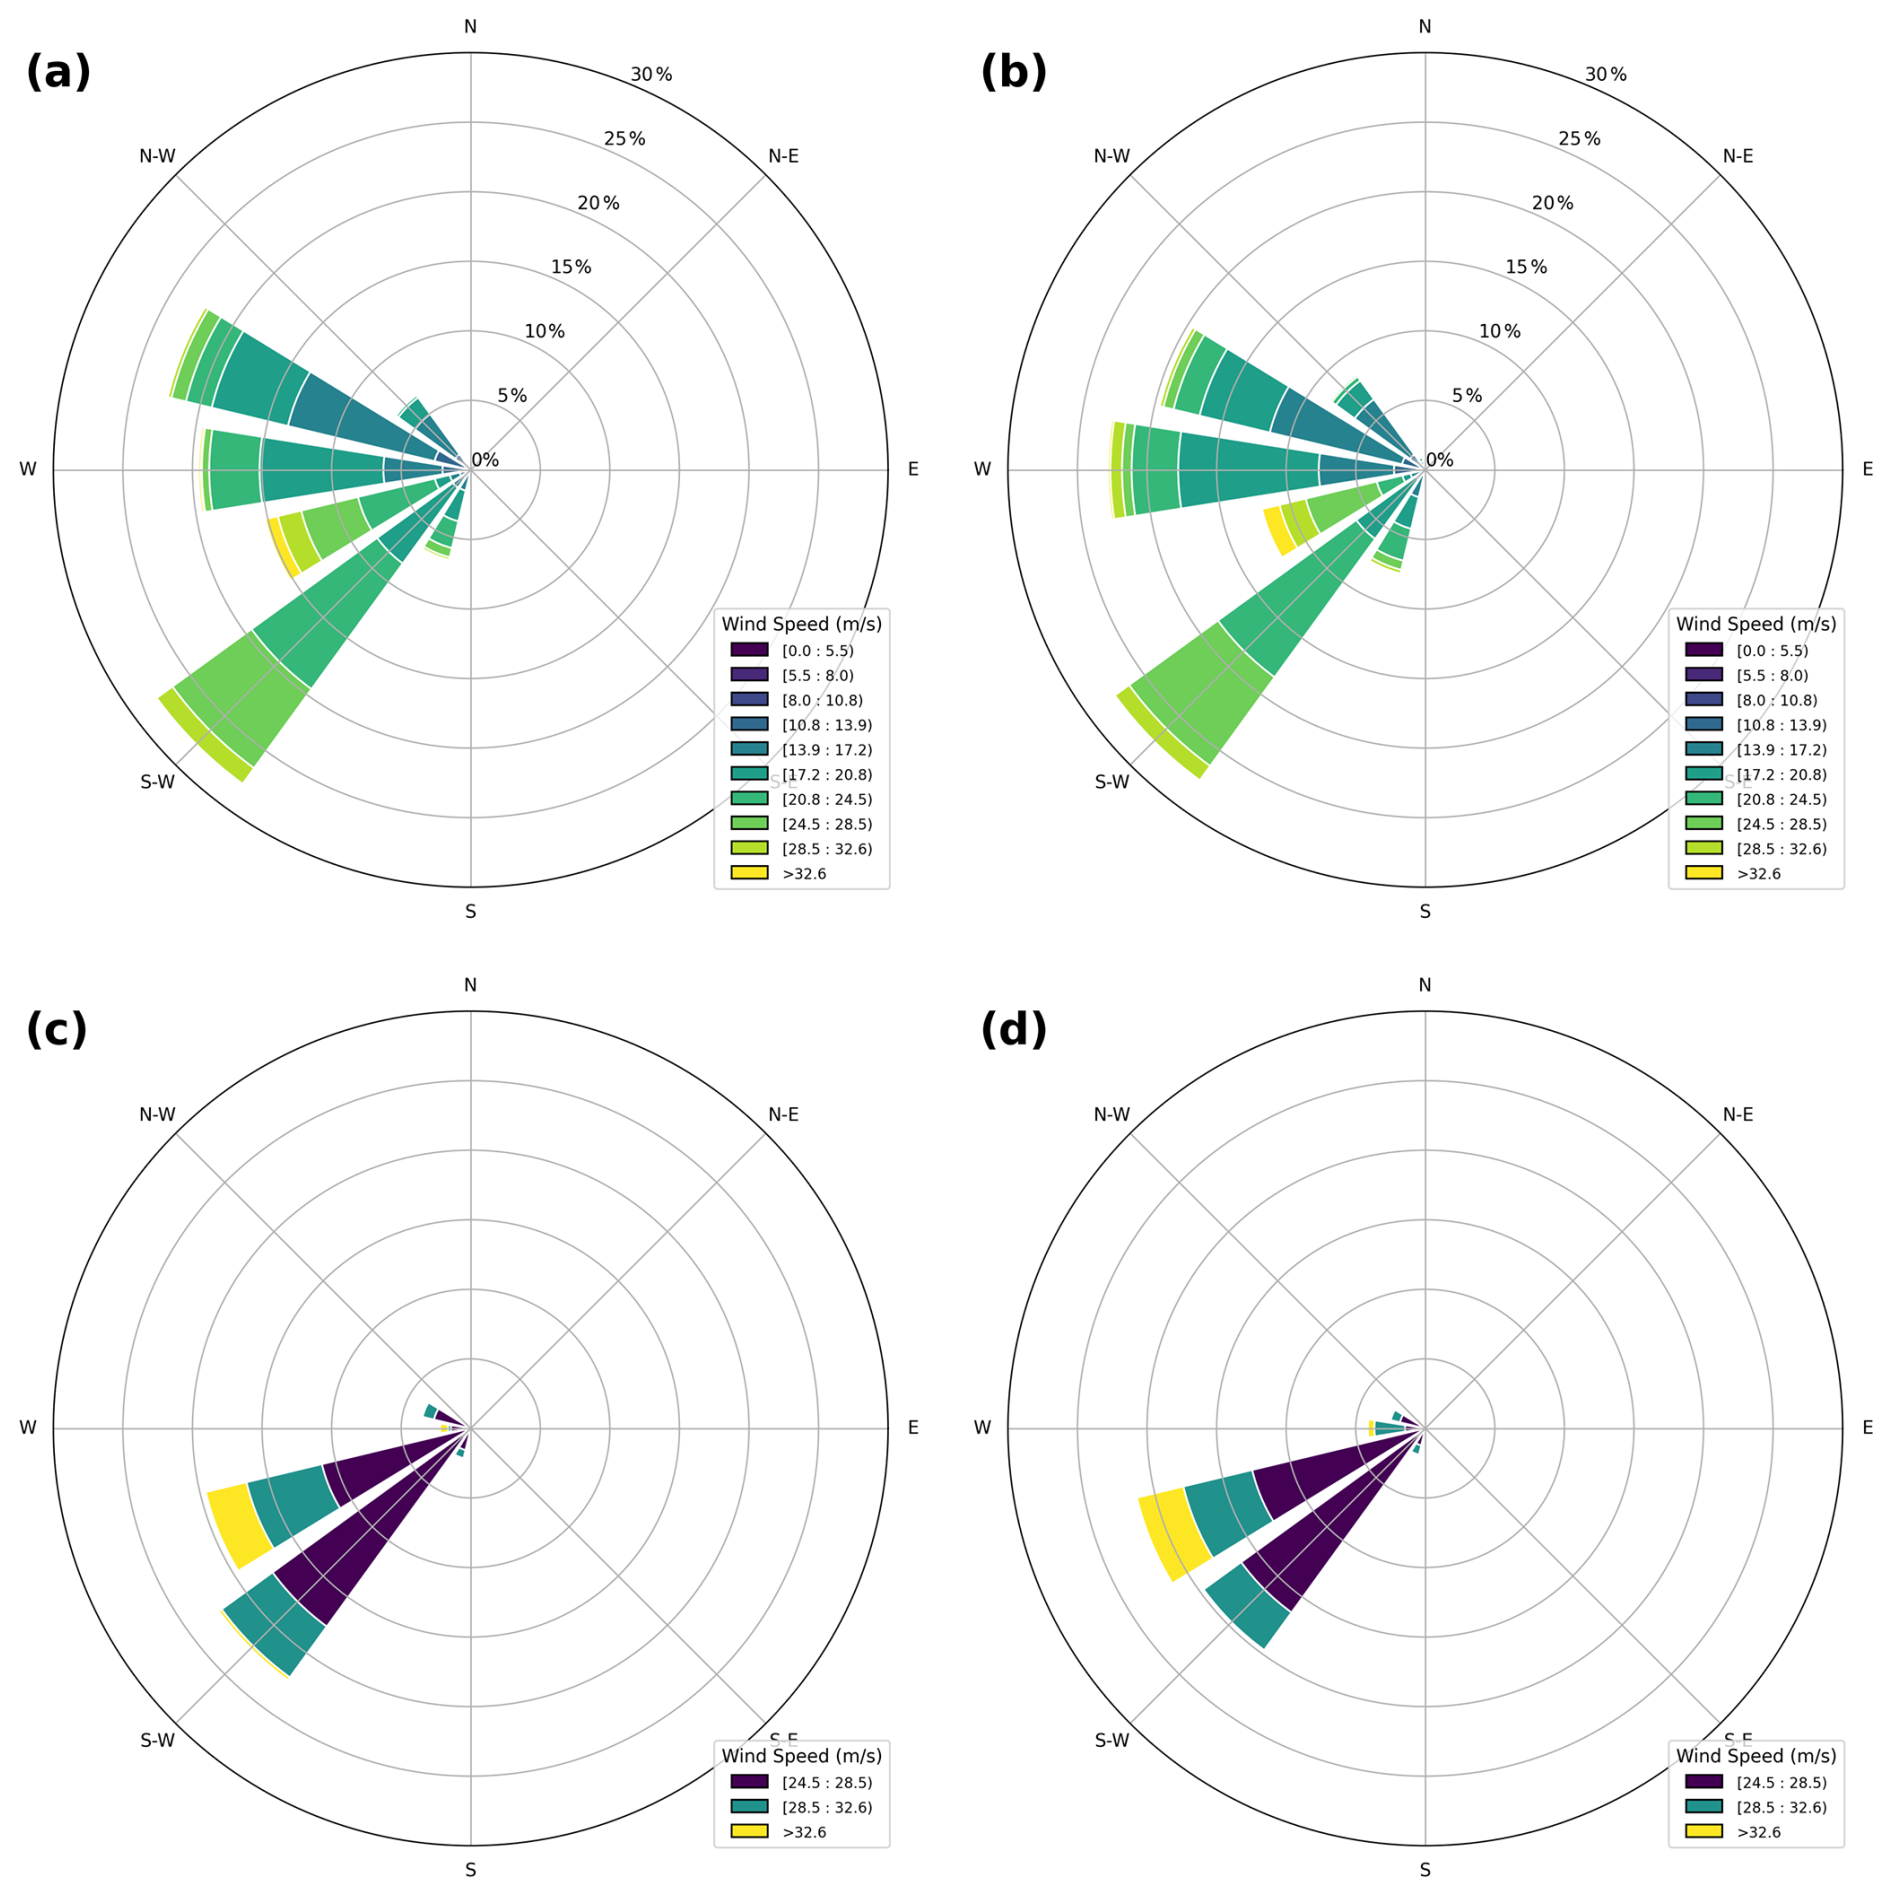
Figure 7Wind roses showing wind direction for two scenarios: control (a) and +3 °C (b), for all mean wind speeds. Panels (c) and (d) show mean wind speeds above 24.5 m s−1 for the control and +3 °C scenarios, respectively. Data represent the maximum values over land during 3–4 December, 14:00–01:00 UTC, corresponding to the peak storm intensity.
The simulation of Storm Anatol under varying temperature scenarios reveals an intensification of the event with warming. Across all scenarios, increases in both mean wind speeds and gusts are supported by the simulations, alongside an expansion in the spatial footprint of winds exceeding storm force and a local lengthening of the storm's duration. These changes are all associated with enhanced potential for infrastructural damage and societal disruption, emphasizing the importance of understanding how extratropical storms may evolve in a warming climate.
The trend of approximately 0.6 m s−1 per degree of warming identified in this study is broadly consistent with the findings of Hawkins et al. (2023), who reported 1 m s−1 per 2 K in their simulation of the historical storm Ulysses. However, given the limited number of experiments considered here, the estimated trend carries substantial uncertainty, and the comparison should be interpreted qualitatively rather than quantitatively.
The simulated increase in the land area affected by storm-force winds is qualitatively consistent with broader projections of enhanced storm exposure under future warming. Priestley and Catto (2016) reported that, under high-emission scenarios such as SSP5–8.5, the area influenced by extreme extratropical cyclones could expand by up to 40 % by the end of the century. While the magnitude of change identified here is smaller, the directional agreement supports the broader understanding that a warmer atmosphere tends to extend the spatial footprint of damaging winds.
It is important to emphasize, however, that the two studies differ fundamentally in scope and methodological design. Priestley and Catto (2022) derived their estimates from coarser resolution multi-model climate simulations representing long-term statistical means, whereas the present analysis examines a single, dynamically consistent event using a non-hydrostatic high resolution weather model in a pseudo-global warming framework. The results should therefore be interpreted as a process-based illustration of how thermodynamic warming can modify storm structure and wind exposure, rather than as a probabilistic projection of future storm statistics. Nevertheless, the correspondence in qualitative trends lends confidence to the physical mechanisms identified here and demonstrates the value of detailed event-based analyses in complementing large-scale model assessments.
Event-based studies pose inherent challenges, as extreme storms are unique phenomena that arise from the precise alignment of multiple meteorological and climatological drivers (Ulbrich et al., 2009). When modifying atmospheric conditions to represent a warmer climate, there is a risk of unintentionally altering the storm's fundamental dynamics, potentially reducing rather than amplifying its extremity (e.g. Matte et al., 2022). Moreover, regional NWP modelling introduces additional uncertainties related to initial conditions, boundary forcing, and physical parametrizations, all of which can influence the simulated storm structure and intensity. Consequently, thorough model validation is essential to ensure that the simulated sensitivities, such as those examined in this study, are physically meaningful.
The control simulation and the PI experiment exhibit broadly similar storm evolution and wind characteristics. However, the PI simulation attains a slightly higher local peak wind speed than the control run. This counterintuitive behaviour may reflect the sensitivity of wind maxima to small-scale dynamical adjustments rather than to thermodynamic forcing alone. In particular, the imposed cooling perturbation may have modified pressure gradients, static stability, or baroclinicity in a manner that locally enhanced near-surface winds, despite the overall reduction in available thermal energy. Small changes in storm trajectory or internal structure may likewise contribute to localized wind maxima that exceed those in the control simulation.
Beyond changes in maximum wind speeds, the CWEI provides a more integrative perspective on storm severity by combining wind intensity, duration, and spatial extent into a single metric. The consistent increase in CWEI with warming (approximately +800 km2 h per °C; R2=0.81) demonstrates that even modest thermodynamic perturbations lead to a substantial rise in total wind exposure. This indicates that the destructive potential of future storms cannot be captured by peak wind metrics alone but requires accounting for the cumulative loading and the area affected over time. The CWEI thus bridges meteorological change and impact relevance, offering a physically grounded yet application-oriented indicator that can be linked directly to damage functions, insurance risk models, or infrastructure design thresholds. Future studies could employ CWEI to compare storm severity across different synoptic types, assess climate-induced changes in regional exposure, or integrate with hydrodynamic models to estimate compound wind–surge hazards.
Notably, the relative increase in CWEI with warming is substantially larger than the corresponding increase in peak wind speed or gust magnitude. This indicates that the intensification signal is dominated not only by stronger winds, but by a combination of prolonged storm duration and an expansion of the area affected by high wind speeds. As a result, integrated exposure metrics such as the CWEI amplify warming-induced changes that may appear modest when considering maximum wind diagnostics alone.
Additional research is essential to build upon these findings. Simulations of other notable storms affecting Denmark and Northern Europe could assess the consistency of warming-induced intensification across different cases. Furthermore, integrating hydrodynamic models would provide valuable insights into how altered wind patterns may affect storm events, storm surges and coastal flooding risk, an especially important consideration for low-lying and exposed regions. This study also does not address potential changes in storm frequency, which remain important but uncertain aspects of climate change impacts. These areas represent key directions for future investigation.
Finally, while much climate research has concentrated on changes in precipitation and flooding, less attention has been devoted to how climate change may affect the severity of windstorms in mid-latitude regions. Some global climate models suggest shifts in storm intensity, frequency, and storm track location under warming, though uncertainties persist, particularly regarding storm genesis and path variability.
Seasonal effects warrant further exploration in future modelling efforts. In particular, the timing of a storm within the annual cycle may be important, as higher autumn sea surface temperatures and increased atmospheric moisture could further amplify storm intensity and associated impacts.
While it is not possible to attribute individual weather events to anthropogenic climate change in a strictly deterministic sense, advances in event attribution science, noticeable through efforts such as the World Weather Attribution (WWA) initiative (e.g., Philip et al., 2020), have demonstrated that the likelihood and severity of many extreme events, such as heatwaves, droughts, and intense rainfall, have been significantly influenced by human-induced global warming. Extratropical storms such as Storm Anatol result from complex interactions involving atmospheric circulation patterns, boundary layer dynamics, and surface conditions. A warmer climate influences many of these background factors, thereby increasing the potential intensity and spatial footprint of such events (Fischer and Knutti, 2015).
This study used the HARMONIE-AROME limited-area model to examine how Storm Anatol might respond to warmer temperature scenarios. The simulations consistently show that increased temperatures lead to stronger winds, both in terms of mean wind and gust, longer storm durations, and larger areas affected by storm-force winds. Although the magnitudes of change are moderate, the signal is robust across all wind thresholds examined, suggesting a strong link between temperature and key storm severity metrics. Importantly, capturing these changes in storm structure and intensity requires the high spatial and temporal resolution provided by the NWP model, which exceeds that of typical climate model simulations and allows for more detailed representation of mesoscale dynamics and extreme wind events.
In addition to confirming a general intensification of near-surface winds under warming, the introduction of the CWEI provides a new means of quantifying storm destructiveness. By integrating wind intensity, duration, and spatial extent, CWEI captures the cumulative exposure that drives real-world damage and disruption. Its systematic increase with temperature underscores that even moderate atmospheric warming can lead to disproportionate growth in wind-related risk. This metric may serve as a valuable diagnostic for future event-based attribution studies and for translating physical wind changes into engineering and societal impact assessments.
The HARMONIE-AROME uses the DINI configuration shown in Fig. A1. This covers the area of Iceland, Great Britain, most of Sweden and Norway and a great part of Europe. This domain is big enough to cover the entire development of Anatol from the initial upper level Rossby wave disturbance started to grow to the storm matured over Denmark and decayed on its path over the Baltic Sea.
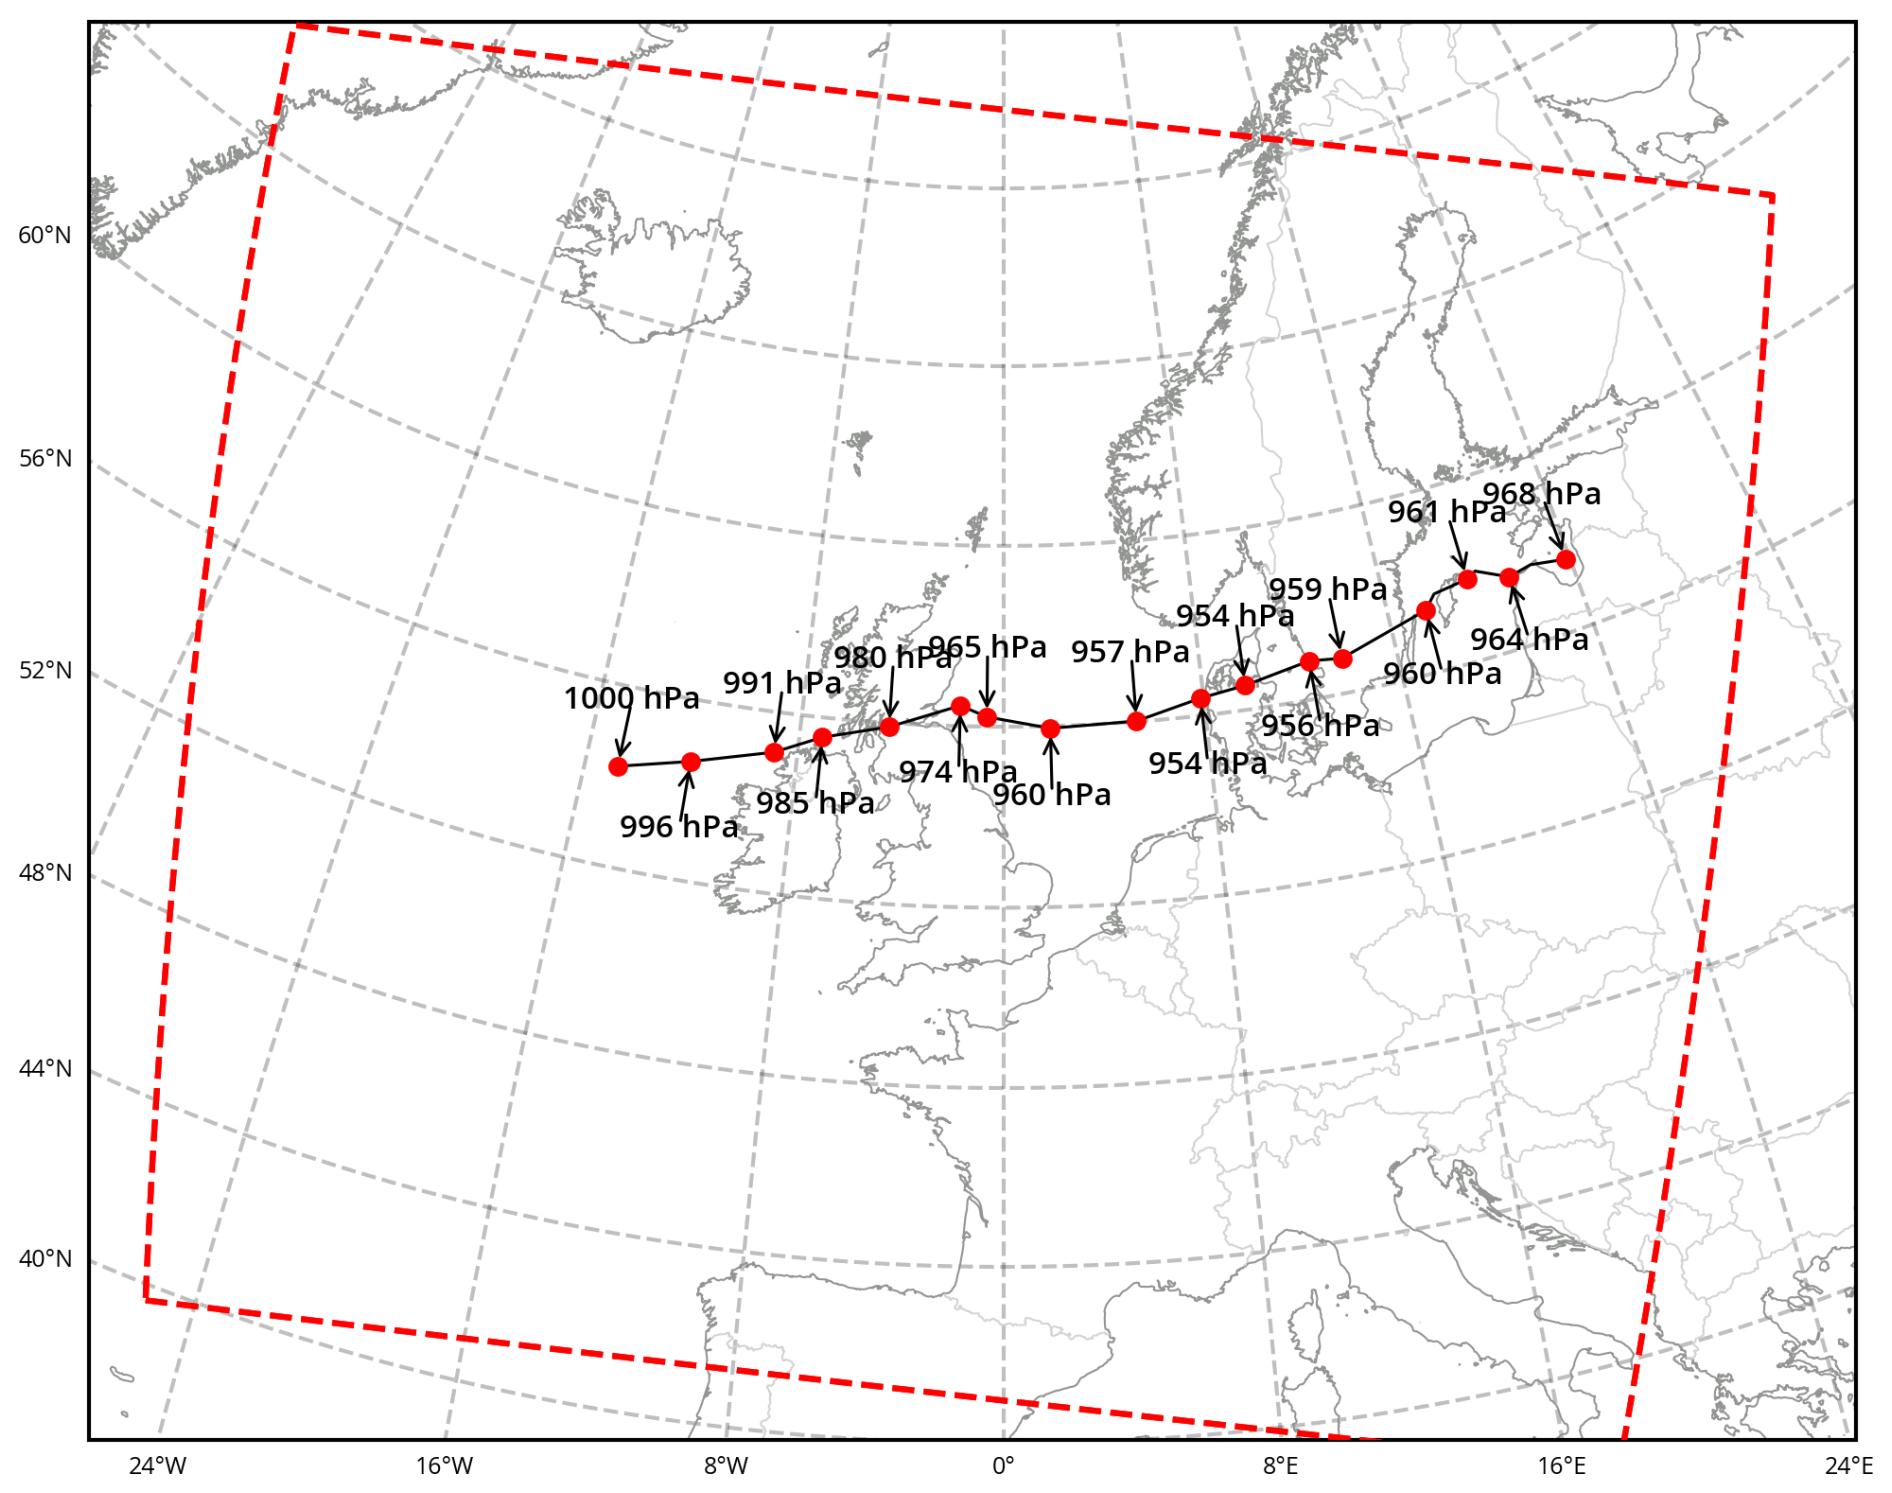
Figure A1The track of the modelled Storm Anatol, with indication of the minimum pressure and location of the storm at 2-hourly intervals from 2 December, 22:00 UTC ending at 4 December, 06:00 UTC. Red dashed lines delineate the HARMONIE model domain, which extend from 28° W–37° E, 44–73° N.
The difference between the control run and the 3 °C warmer run are shown in Fig. B1 for 18:00 UTC.
Figure B2 shows the five scenarios of Storm Anatol at 18:00 UTC, corresponding to its landfall. While the overall structure of the storm remains similar across the scenarios, an intensification of wind speed is evident, as indicated by the increasingly darker shades of red.
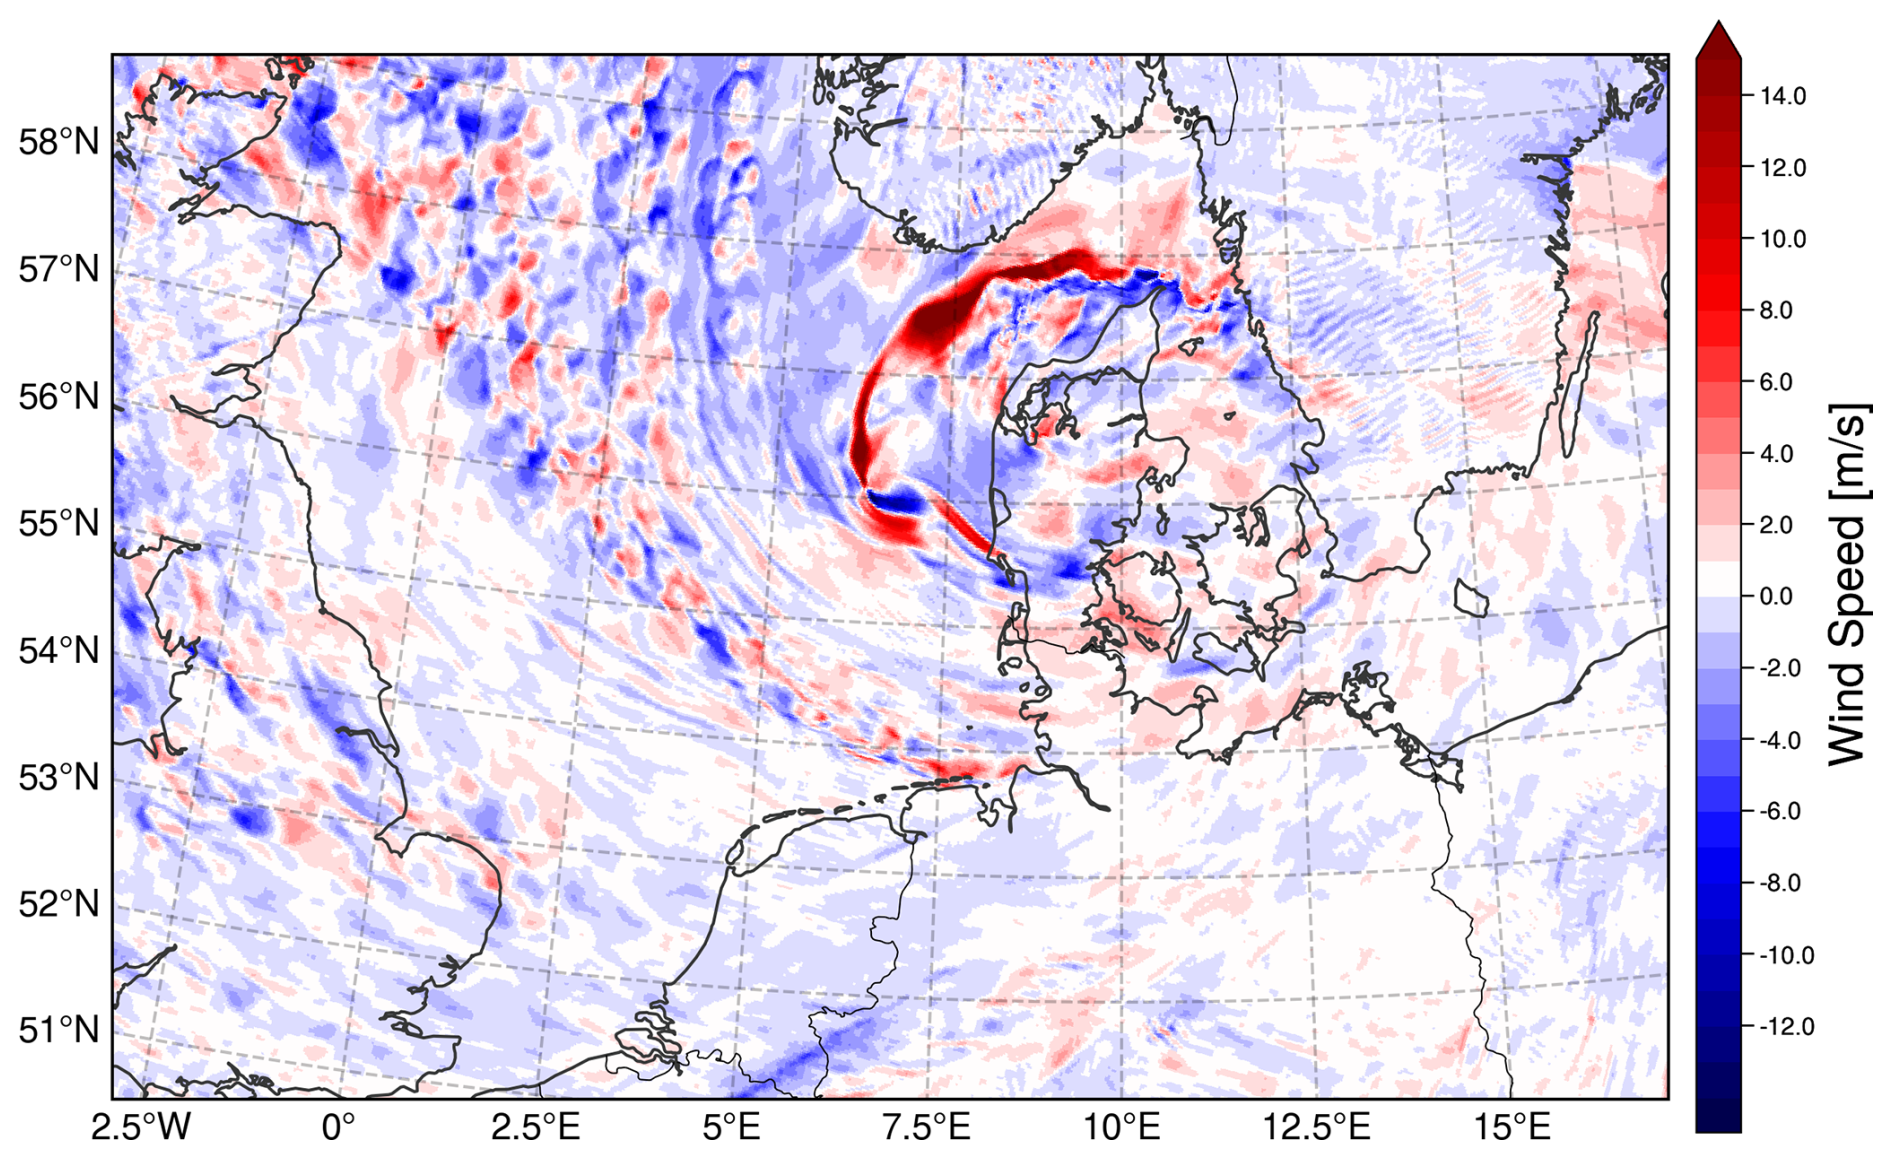
Figure B1The difference between the 3 °C run and the reference run.
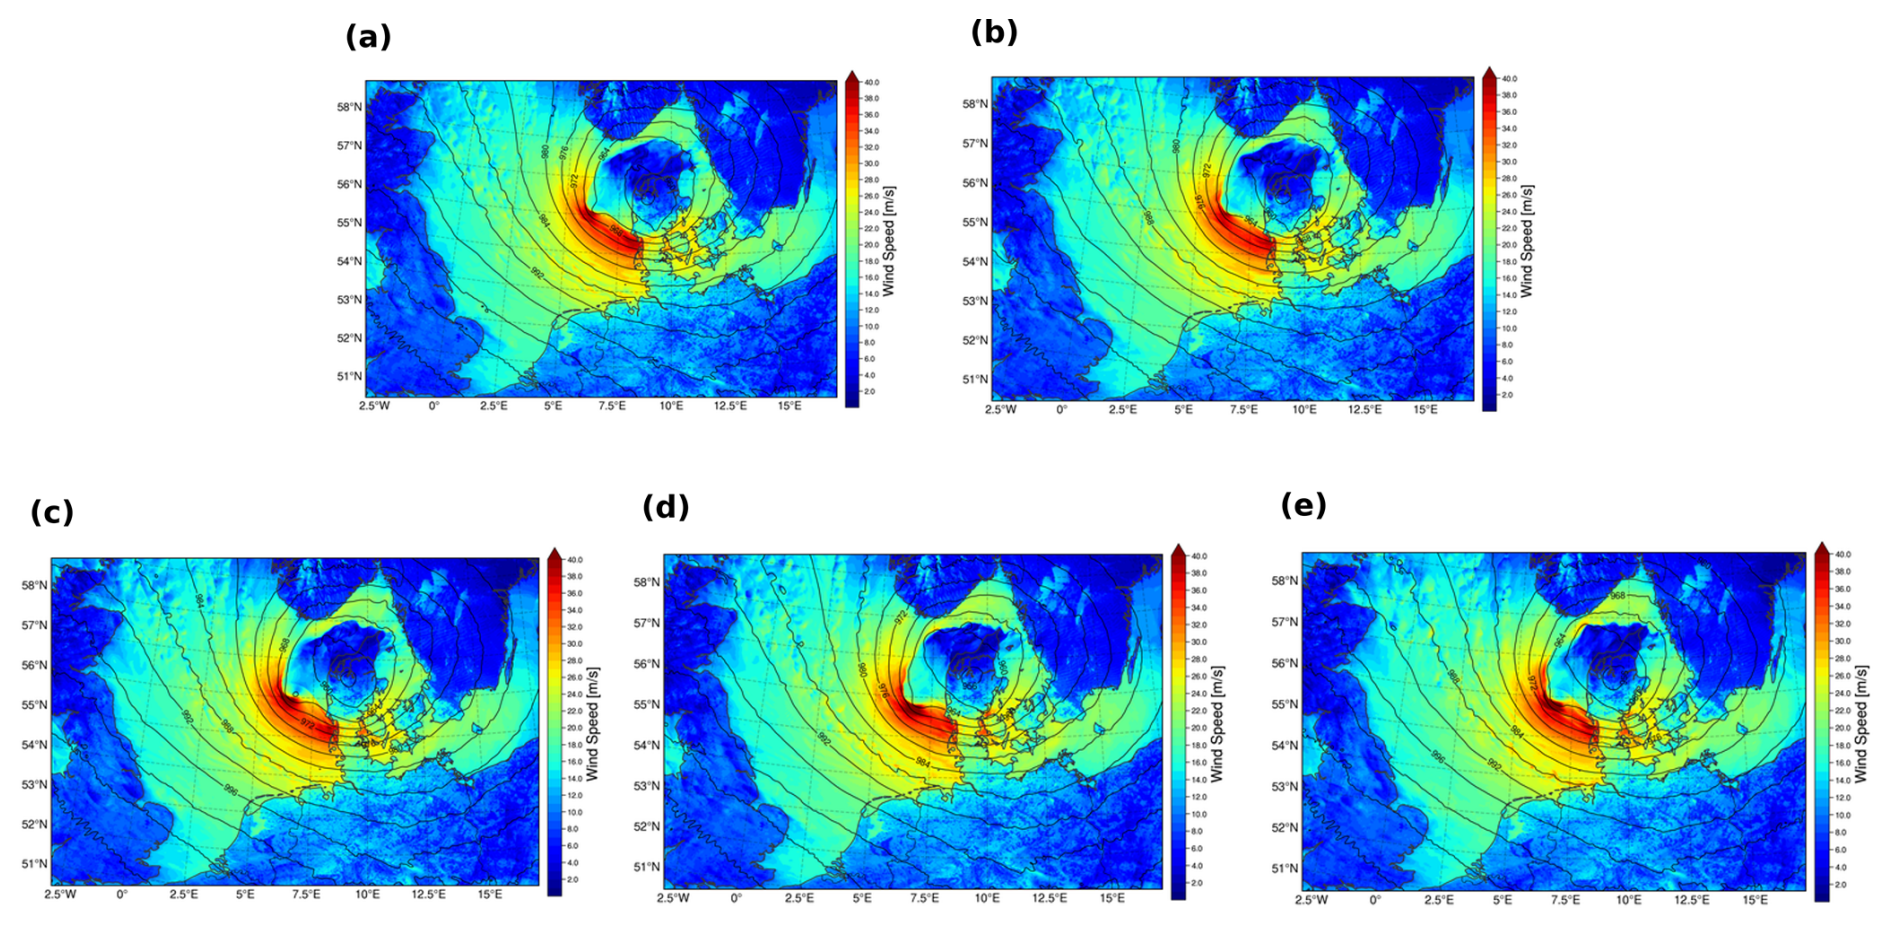
Figure B2The storm intensity and low pressure system at 3 December, 18:00 UTC, when the storm made landfall for each of the different model runs of −1 °C (a), Control run (b), +1 °C (c), +2 °C (d) and +3 °C (e).
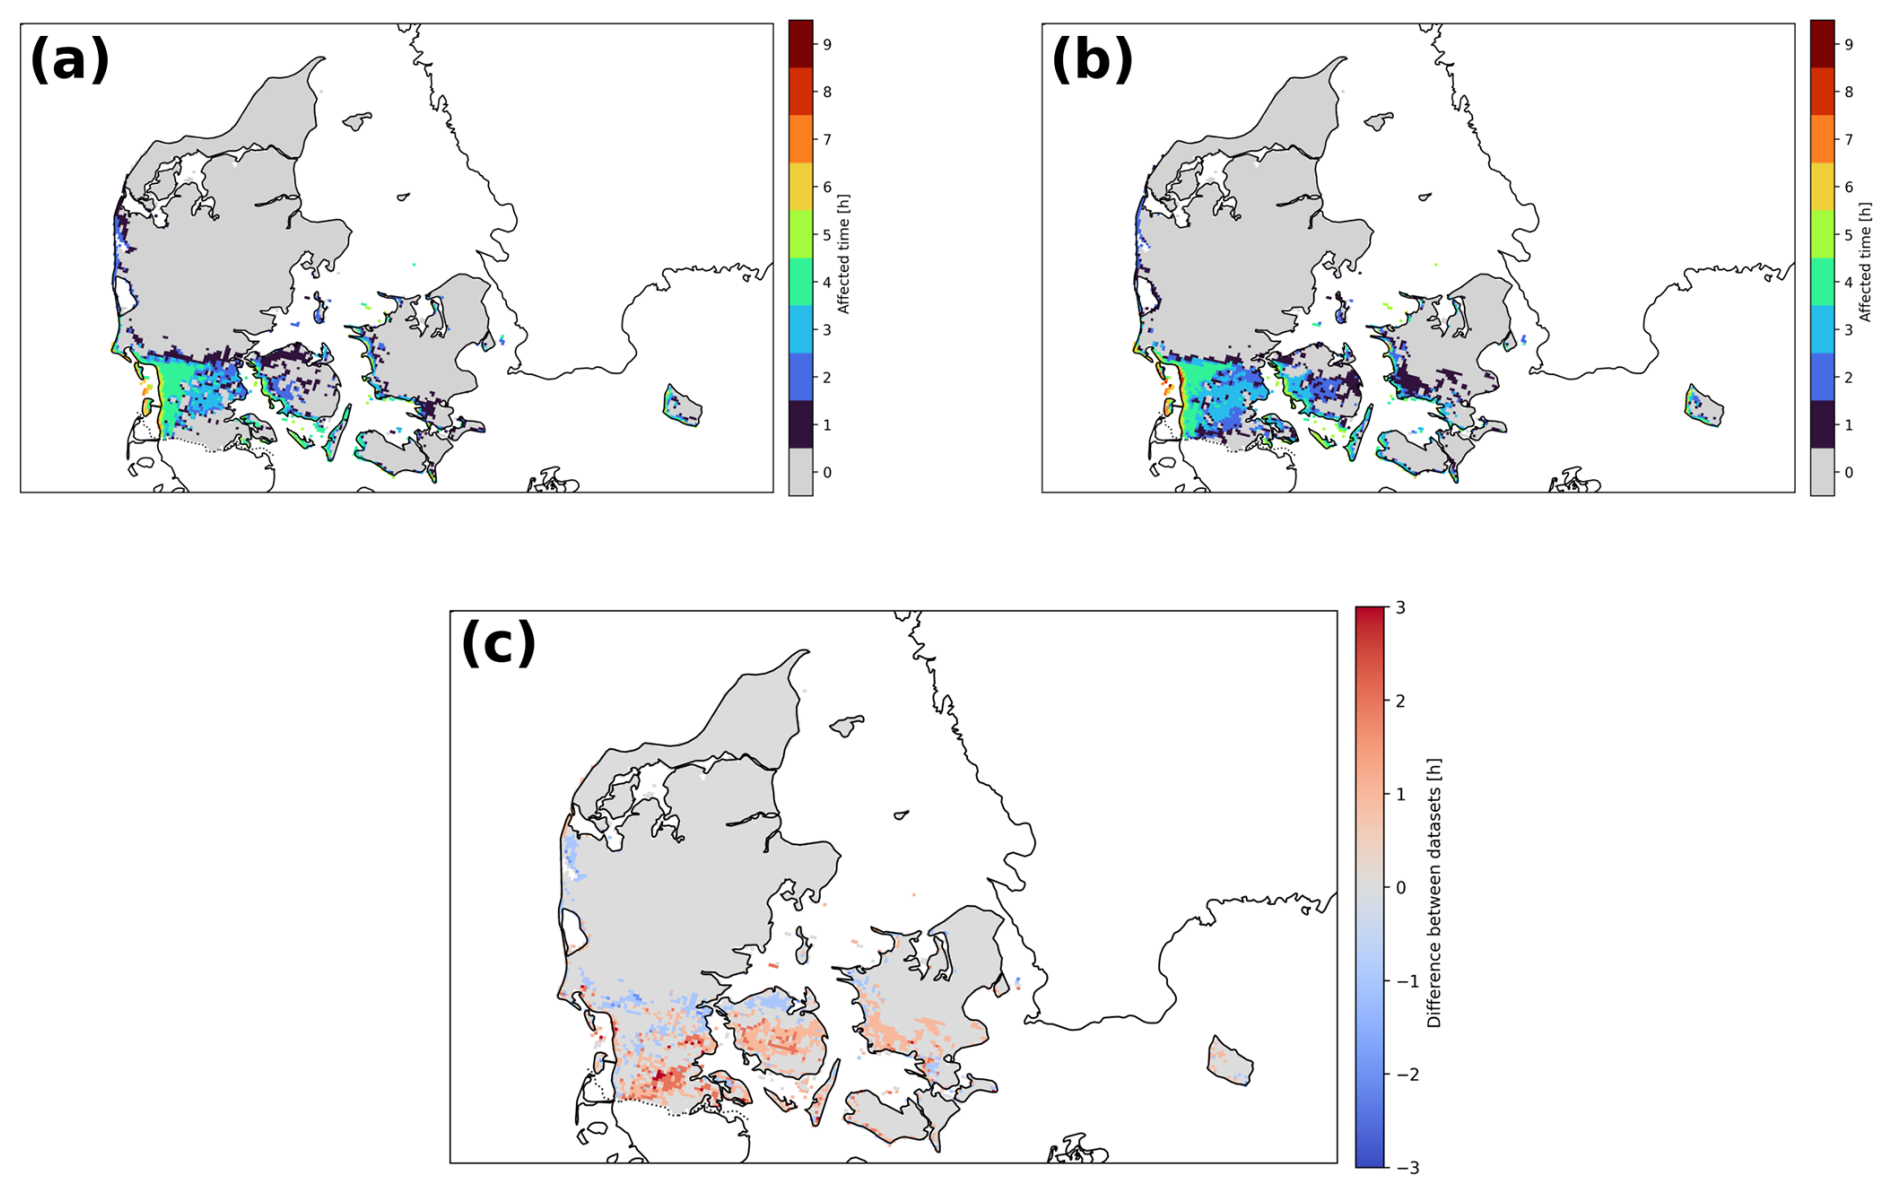
Figure C1Time of which Danish land affected by wind above 24.5 m s−1 for the control run (a) and the +3 °C (b). The colourbar indicates the time each grid point experiences storm. Panel (c) shows the difference between the 2 model runs.
The land area affected by gust exceeding 40 m s−1 is shown in Fig. D1. Although the variations are less pronounced than those observed for the wind-affected area, there is still a general increase in gust exposure, as illustrated in Fig. D1c. Severe gusts are especially pronounced in the southernmost part of Denmark in the warmer climate run.
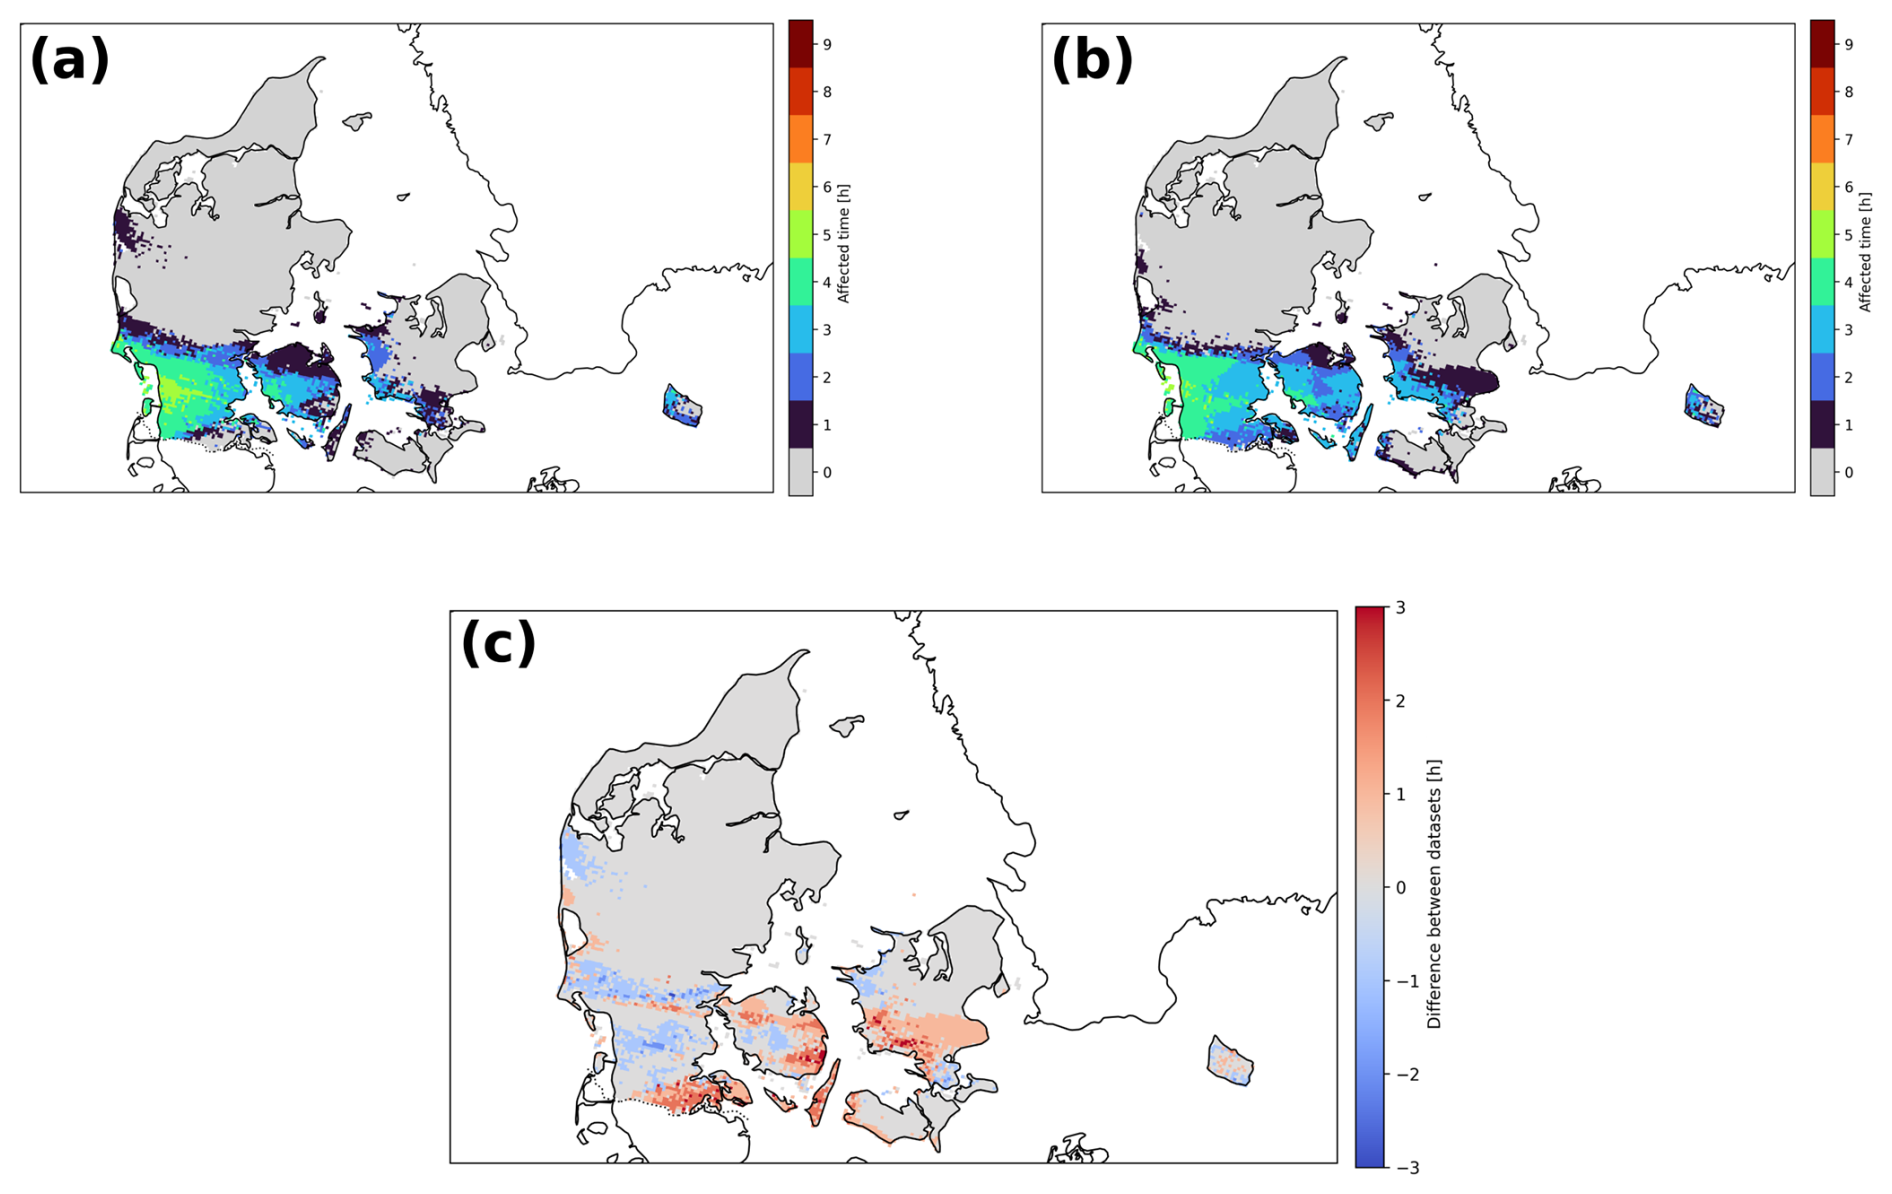
Figure D1Time of which land is affected by gust above 40 m s−1 for the control run (a) and the +3 °C (b). The colourbar indicates the time each grid point experiences gust above 40 m s−1. Panel (c) displayes the difference.
The following Python libraries and tools were used to access and process the data, along with the specific versions employed in this study:
-
cfgrib, version 0.9.10.4 (https://github.com/ecmwf/cfgrib; European Centre for Medium-Range Weather Forecasts, 2023a)
-
ecCodes, version 1.5.0 (https://github.com/ecmwf/eccodes; European Centre for Medium-Range Weather Forecasts, 2023b)
-
xarray, version 2023.7.0 (Hoyer and Hamman, 2023)
These constitute the minimum requirements necessary to handle the GRIB-formatted data used in the analysis. These libraries themselves have additional dependencies, which are typically resolved automatically when using standard installation tools.
JKHØ: Formal analysis, Writing original draft, Investigation, conceptualization. JHC: Conceptualization, Review/ editing. RMKZ: Coding, Analysis, Review/editing. HV: Conceptualization, Review/editing. HF: HARMONIE-AROME simulations, Review/editing.
The contact author has declared that none of the authors has any competing interests.
Publisher's note: Copernicus Publications remains neutral with regard to jurisdictional claims made in the text, published maps, institutional affiliations, or any other geographical representation in this paper. The authors bear the ultimate responsibility for providing appropriate place names. Views expressed in the text are those of the authors and do not necessarily reflect the views of the publisher.
This work was supported by the Realdania Philanthropy project “Metoder til klimatilpasning af det byggede miljø”. Johanne Kristine Haandbæk Øelund acknowledges the support of the Danish government through the National Center for Climate Research (NCKF) Artificial intelligence tools (specifically ChatGPT by OpenAI) were used to assist in improving the clarity and wording of parts of the manuscript. All content was reviewed and verified by the authors.
This research has been supported by the Realdania (grant no. PRJ-2021-00176).
This paper was edited by Joaquim G. Pinto and reviewed by two anonymous referees.
Bengtsson, L., I., H. K., and Keenlyside, N.: Will extratropical storms intensify in a warmer climate, J. Climate, 22, 2276–2301, https://doi.org/10.1175/2008JCLI2678.1, 2009. a
Bengtsson, L., Andrae, U., Aspelien, T., Batrak, Y., Calvo, J., De Roy, W., Gleeson, E., Hansen-Sass, B., Homleid, M., Hortal, M., Ivarsson, K., Lenderink, G., Niemelä, S., Nielsen, C. P., Onvlee, J., Rontu, L., Samuelsson, P., Munoz, D. S., Subias, A., Tijm, S., Toll, V., Yang, X., and Køltzow, M.: The HARMONIE-AROME Model Configuration in the ALADINE-HIRLAM NWP System, Mon. Weather Rev., 145, 1919–1935, 2017. a, b
Brogli, R., Heim, C., Mensch, J., Sørland, S. L., and Schär, C.: The pseudo-global-warming (PGW) approach: methodology, software package PGW4ERA5 v1.1, validation, and sensitivity analyses, Geosci. Model Dev., 16, 907–926, https://doi.org/10.5194/gmd-16-907-2023, 2023. a
Cappelen, J., Olufsen, S., Ribergaard, M. H., Nielsen, J. W., Schmith, T., and Hansen, N.: Decemberorkanen 1999, https://www.dmi.dk/vejr-og-atmosfare/temaforside-decemberorkanen-1999 (last access: 22 February 2026), 2018. a, b, c
Catto, J. L.: Extratropical cyclone classification and its use in climate studies, Rev. Geophys., 54, 486–520, https://doi.org/10.1002/2016RG000519, 2016. a, b
Christensen, J. H. and Christensen, O. B.: Severe summertime flooding in Europe, Nature, 421, 805, https://doi.org/10.1038/421805a, 2003. a
Ciullo, A., Martius, O., Strobl, E., and Bresch, D. N.: A framework for building climate storylines based on downward counterfactuals: The case of the European Union solidarity fund, Climate Risk Management, 33, 100349, https://doi.org/10.1016/j.crm.2021.100349, 2021. a
Donat, M. G., Leckebusch, G. C., Wild, S., and Ulbrich, U.: Future changes in European winter storm losses and extreme wind speeds inferred from GCM and RCM multi-model simulations, Nat. Hazards Earth Syst. Sci., 11, 1351–1370, https://doi.org/10.5194/nhess-11-1351-2011, 2011a. a
Donat, M. G., Pardowitz, T., Leckebusch, G. C., Ulbrich, U., and Burghoff, O.: High-resolution refinement of a storm loss model and estimation of return periods of loss-intensive storms over Germany, Nat. Hazards Earth Syst. Sci., 11, 2821–2833, https://doi.org/10.5194/nhess-11-2821-2011, 2011b. a
European Centre for Medium-Range Weather Forecasts (ECMWF): cfgrib: Python interface to map GRIB files to xarray, version 0.9.10.4, GitHub [code], https://github.com/ecmwf/cfgrib (last access: 25 July 2025), 2023a. a
European Centre for Medium-Range Weather Forecasts (ECMWF): ecCodes: ECMWF encoding/decoding software library for GRIB and BUFR formats, version 1.5.0, GitHub [code], https://github.com/ecmwf/eccodes (last access: 25 July 2025), 2023b. a
Eady, E.: Long Waves and Cyclone Waves, Tellus, 1, 1–71, https://doi.org/10.1111/j.2153-3490.1949.tb01265.x, 1949. a
Ermis, S., Leach, N. J., Lott, F. C., Sparrow, S. N., and Weisheimer, A.: Event attribution of a midlatitude windstorm using ensemble weather forecasts, Environmental research: Climate, 3, https://doi.org/10.1088/2752-5295/ad4200, 2024. a
European Committee for Standardization (CEN) (Ed.):EN 1991-1-4: Eurocode 1: Actions on structures – Part 1–4: General actions – Wind actions, reprinted 2015, CEN, Brussels, Belgium, ISBN 978-0-580-55875-9, 2005. a, b
Federer, M., Papritz, L., Sprenger, M., and Grams, C. M.: Synoptic perspective on the conversion and maintenance of local available potential energy in extratropical cyclones, Weather Clim. Dynam., 6, 211–230, https://doi.org/10.5194/wcd-6-211-2025, 2025. a
Feser, F., Barcikowska, M., Krueger, O., Schenk, F., Weisse, R., and Xia, L.: Storminess over the North Atlantic and northwestern Europe – A review, Q. J. Roy. Meteor. Soc., 141, 350–382, https://doi.org/10.1002/qj.2364, 2015. a
Fink, A. H., Pohle, S., Pinto, J. G., and Knippertz, P.: Diagnosing the influence of diabatic processes on the explosive deepening of extratropical cyclones, Geophys. Res. Lett., 39, https://doi.org/10.1029/2012GL051025, 2012. a
Fischer, E. M. and Knutti, R.: Anthropogenic contribution to global occurrence of heavy-precipitation and high-temperature extremes, Nat. Clim. Change, 5, 560–565, 2015. a
Gliksman, D., Averbeck, P., Becker, N., Gardiner, B., Goldberg, V., Grieger, J., Handorf, D., Haustein, K., Karwat, A., Knutzen, F., Lentink, H. S., Lorenz, R., Niermann, D., Pinto, J. G., Queck, R., Ziemann, A., and Franzke, C. L. E.: Review article: A European perspective on wind and storm damage – from the meteorological background to index-based approaches to assess impacts, Nat. Hazards Earth Syst. Sci., 23, 2171–2201, https://doi.org/10.5194/nhess-23-2171-2023, 2023. a, b
Grinsted, A., Ditlevsen, P., and Christensen, J.: Normalized US hurricane damage estimates using area of total destruction, P. Natl. Acad. Sci. USA, 48, https://doi.org/10.1073/pnas.1912277116, 2019. a
Hawkins, E., Compo, G. P., and Sardeshmukh, P. D.: ESD Ideas: Translating historical extreme weather events into a warmer world, Earth Syst. Dynam., 14, 1081–1084, https://doi.org/10.5194/esd-14-1081-2023, 2023. a
Hersbach, H., Bell, B., Berrisford, P., Hirahara, S., Horányi, A., Muñoz-Sabater, J., Nicolas, J., Peubey, C., Radu, R., Schepers, D., Simmons, A., Soci, C., Abdalla, S., Abellan, X., Balsamo, G., Bechtold, P., Biavati, G., Bidlot, J., Bonavita, M., De Chiara, G., Dahlgren, P., Dee, D., Diamantakis, M., Dragani, R., Flemming, J., Forbes, R., Fuentes, M., Geer, A., Haimberger, L., Healy, S., Hogan, R. J., Hólm, E., Janisková, M., Keeley, S., Laloyaux, P., Lopez, P., Lupu, C., Radnoti, G., de Rosnay, P., Rozum, I., Vamborg, F., Villaume, S., and Thépaut, J.-N.: The ERA5 global reanalysis, Q. J. Roy. Meteor. Soc., 146, 1999–2049, https://doi.org/10.1002/qj.3803, 2020. a
Hibino, K., Takayabu, I., Wakazuki, Y., and Ogata, T.: Physical responses of convective heavy rainfall to future warming condition: Case study of the Hiroshima event, Front. Earth Sci., 6, 35, https://doi.org/10.3389/feart.2018.00035, 2018. a, b
Hoyer, S. and Hamman, J.: xarray: N-D labeled arrays and datasets in Python, version 2023.7.0, J. Open Res. Softw., 5, https://doi.org/10.5334/jors.148, 2023. a
IPCC: Climate Scenarios and Model Experiments, Chap. 4, 140–200, Cambridge University Press, https://doi.org/10.1017/9781009157896.006, 2021a. a
IPCC: Weather and Climate Extreme Events in a Changing Climate, Chap. 11, 1513–1766, Cambridge University Press, https://doi.org/10.1017/9781009157896.013, 2021b. a
IPCC: Weather and Climate Extreme Events in a Changing Climate, in: Climate Change 2021: The Physical Science Basis. Contribution of Working Group I to the Sixth Assessment Report of the Intergovernmental Panel on Climate Change, edited by: Seneviratne, S. I., Zhang, X., Adnan, M., Badi, W., Dereczynski, C., Di Luca, A., Ghosh, S., Iskandar, I., Kossin, J., Lewis, S., Otto, F., Pinto, I., Satoh, M., Vicente-Serrano, S. M., Wehner, M., and Zhou, B., IPCC, 6, 1513–1765, https://doi.org/10.1017/9781009157896.013, 2021c. a
Kettle, A. J.: Storm Anatol over Europe in December 1999: impacts on societal and energy infrastructure, Adv. Geosci., 56, 141–153, https://doi.org/10.5194/adgeo-56-141-2021, 2021. a, b, c, d, e, f
Klawa, M. and Ulbrich, U.: A model for the estimation of storm losses and the identification of severe winter storms in Germany, Nat. Hazards Earth Syst. Sci., 3, 725–732, https://doi.org/10.5194/nhess-3-725-2003, 2003. a, b
Laurila, T. K., Gregow, H., Cornér, J., and Sinclair, V. A.: Characteristics of extratropical cyclones and precursors to windstorms in northern Europe, Weather Clim. Dynam., 2, 1111–1130, https://doi.org/10.5194/wcd-2-1111-2021, 2021. a
Leckebusch, G. C., Renggli, D., and Ulbrich, U.: Development and application of an objective storm severity measure for the Northeast Atlantic region, Meteorol. Z., 17, 575–587, https://doi.org/10.1127/0941-2948/2008/0323, 2008. a
Li, M., Woollings, T., Hodges, K., and Masato, G.: Extratropical cyclones in a warmer, moister climate: A recent Atlantic analogue, Geophys. Res. Lett., 41, 8594–8601, https://doi.org/10.1002/2014GL062186, 2014. a
Lindsey, R. and Dahlmann, L.: Climate change: global temperature, https://www.climate.gov/news-features/understanding-climate/climate-change-global-temperature, last access: 8 January 2025. a
Little, A. S., Priestley, M. D. K., and Catto, J. L.: Future increased risk from extratropical windstorms in northern Europe, Nat. Commun., 14, 4434, https://doi.org/10.1038/s41467-023-40102-6, 2023. a, b
Lorenz, R., Becker, N., Gardiner, B., Ulbrich, U., Hanewinkel, M., and Schmitz, B.: Tree fall along railway lines: modelling the impact of wind and other meteorological factors, Nat. Hazards Earth Syst. Sci., 25, 2179–2196, https://doi.org/10.5194/nhess-25-2179-2025, 2025. a
Lynn, B. A. and Stathopoulos, T.: Wind-induced fatigue on low metal buildings., J. Struct. Eng., 11, 826–839, 1985. a
Matte, D., Christensen, J. H., Feddersen, H., Vedel, H., Nielsen, N. W., Pedersen, R. A., and Zeitzen, R. M. K.: On the potentials and limitations of Attributing a Small-Scale Climate event, Geophys. Res. Lett., 49, https://doi.org/10.1029/2022GL099481, 2022. a, b, c, d, e
Nielsen, N. W. and Sass, B. H.: A numerical, high-resolution study of the life cycle of the severe storm over Denmark on 3 December 1999, Tellus A, 55A, 338–351, https://doi.org/10.3402/tellusa.v55i4.12100, 2003. a, b
Nilsson, C., Goyette, S., and Bärring, L.: Relating forest damage data to the wind field from high-resolution RCM simulations: Case study of Anatol striking Sweden in December 1999, Global Planet. Change, 57, 161–176, https://doi.org/10.1016/j.gloplacha.2006.11.011, 2007. a
Philip, S., Kew, S., van Oldenborgh, G. J., Otto, F., Vautard, R., van der Wiel, K., King, A., Lott, F., Arrighi, J., Singh, R., and van Aalst, M.: A protocol for probabilistic extreme event attribution analyses, Adv. Stat. Clim. Meteorol. Oceanogr., 6, 177–203, https://doi.org/10.5194/ascmo-6-177-2020, 2020. a
Prahl, B. F., Rybski, D., Kropp, J. P., Burghoff, O., and Held, H.: Applying stochastic small-scale damage functions to German winter storms, Geophys. Res. Lett., 39, https://doi.org/10.1029/2012GL050961, 2012. a
Priestley, M. D. K. and Catto, J. L.: Future changes in the extratropical storm tracks and cyclone intensity, wind speed, and structure, Weather Clim. Dynam., 3, 337–360, https://doi.org/10.5194/wcd-3-337-2022, 2022. a
Ruosteenoja, K., Vihma, T., and Venäläinen, A.: Projected Changes in European and North Atlantic Seasonal Wind Climate Derived from CMIP5 Simulations, J. Climate, 32, 6467–6490, https://doi.org/10.1175/JCLI-D-19-0023.1, 2019. a
Schär, C., Frei, C., Lüthi, D., and Davies, H. C.: Surrogate climate-change scenarios for regional climate models, Geophys. Res. Lett., 23, 669–672, https://doi.org/10.1029/96GL00265, 1996. a
Severino, L. G., Kropf, C. M., Afargan-Gerstman, H., Fairless, C., de Vries, A. J., Domeisen, D. I. V., and Bresch, D. N.: Projections and uncertainties of winter windstorm damage in Europe in a changing climate, Nat. Hazards Earth Syst. Sci., 24, 1555–1578, https://doi.org/10.5194/nhess-24-1555-2024, 2024. a
Shepherd, T., Boyd, E., Calel, R., Chapman, S. C., Dessai, S., Dima-West, I. M., Fowler, H. J., James, R., Maraun, D., Martius, O., Senior, C. A., Sobel, A. H., Stainforth, D. A., Tett, S. F. B., Trendberth, K. E., van der Hurk, B. J. J. M., Watkins, N. W., Wilby, R. L., and Zenghelis, D. A.: Storylines: an alternative approach to representing uncertainty in physical aspects of climate change., Clim. Change, 151, 555–571, https://doi.org/10.1007/s10584-018-2317-9, 2018. a
Shepherd, T. G.: Storyline approach to the construction of regional climate change information, P. Roy. Soc. A, 475, 20190013, https://doi.org/10.1098/rspa.2019.0013, 2019. a
Sillmann, J., Shepherd, T. G., van den Hurk, B., Hazeleger, W., Martius, O., Slingo, J., and Zscheischler, J.: Event-Based Storylines to Address Climate Risk, Earth's Future, 9, e2020EF001783, https://doi.org/10.1029/2020EF001783, 2021. a
Souto-Ceccon, P. E., Montes, J., Duo, E., Ciavola, P., Fernández-Montblanc, T., and Armaroli, C.: A European database of resources on coastal storm impacts, Earth Syst. Sci. Data, 17, 1041–1054, https://doi.org/10.5194/essd-17-1041-2025, 2025. a
The WASA Group: Changing waves and storms in the Northeast Atlantic?, B. Am. Meteorol. Soc., 79, 741–760, https://doi.org/10.1175/1520-0477(1998)079<0741:CWASIT>2.0.CO;2, 1998. a
Trenberth, K. E., Fasullo, J. T., and Shepherd, T. G.: Attribution of climate extreme events, Nat. Clim. Change, 5, 725–730, https://doi.org/10.1038/NCLIMATE2657, 2015. a
Ulbrich, U., Fink, A. H., Klawa, M., and Pinto, J. G.: Three extreme storms over Europe in December 1999, Weather, 56, 70–80, https://doi.org/10.1002/j.1477-8696.2001.tb06540.x, 2001. a, b, c, d
Ulbrich, U., Leckebusch, G. C., and Pinto, J. G.: Extra-tropical cyclones in the present and future climate: a review, Theor. Appl. Climatol., 96, 117–131, https://doi.org/10.1007/s00704-008-0083-8, 2009. a, b
Voldborg, H.: Vredens julemåned, Vejret, 82, 1–7, 2000. a
Wang, J., Liu, Y., and Zhang, Z.: Fatigue Damage and Reliability Assessment of Wind Turbine Structure During Service Utilizing Real-Time Monitoring Data, Buildings, 14, https://doi.org/10.3390/buildings14113453, 2024. a
WMO, W. M. O.: International meteorological vocabulary, 2nd edn., World Meteorological Organization, Geneva, Switzerland, ISBN 978-92-63-02182-3, 1992. a
Woth, K., Weisse, R., and von Storch, H.: Climate change and North Sea storm surge extremes: an ensemble study of storm surge extremes expected in a changed climate projected by four different regional climate models., Ocean Dynam., 56, 3–15, https://doi.org/10.1007/s10236-005-0024-3, 2005. a
Zeitzen, R. M. K., Christensen, J. H., Ølund, J. K. H., Feddersen, H., Vedel, H., Nielsen, N. W., and Matte, D.: Windstorm Extremes in a Warmer World: Raising the Bar for Destruction., Geophys. Res. Lett., 52, https://doi.org/10.1029/2025GL115936, 2025. a, b, c, d, e, f, g, h, i, j, k
- Abstract
- Introduction
- Methodology
- The storm Anatol viewed from a Danish perspective
- Results
- Discussion
- Conclusion
- Appendix A: DINI
- Appendix B: Wind
- Appendix C: Storm in hours over Denmark
- Appendix D: Gust
- Appendix E: CWEI
- Code and data availability
- Author contributions
- Competing interests
- Disclaimer
- Acknowledgements
- Financial support
- Review statement
- References