the Creative Commons Attribution 4.0 License.
the Creative Commons Attribution 4.0 License.
 | 18 Nov 2025
Drought hazard assessment across Sweden's diverse hydro-climatic regimes
Claudia Canedo Rosso
Lars Nyberg
Ilias Pechlivanidis
In recent years severe droughts have significantly impacted the water-dependent sectors including water supply, agriculture, energy, and forestry. This study aims to assess the meteorological, agricultural, and hydrological drought risk in Sweden, with a focus on hazard assessment using a set of indicators, including the Standardized Precipitation Index (SPI), Standardized Precipitation and Evapotranspiration Index (SPEI), Standardized Soil Moisture Index (SSMI), and Standardized Streamflow Index (SSI). The indicators were computed at time scales of 1, 3, 6, 12, and 24 months using daily precipitation, evapotranspiration, soil moisture, and streamflow simulations (1975–2021) from the national S-HYPE hydrological model at about 13 km2 spatial resolution for almost 40 000 sub-catchments. Dry periods were next identified and characterized based on their intensity, duration, and frequency, following this a trend analysis was performed for these indicators and periods. Assessing the spatial similarities in soil moisture anomaly led to the categorization of the Swedish river systems into five clusters further improving the understanding of the identified spatial variability of drought indicators and trends. Our findings showed drier conditions and an increasing frequency of dry periods in central- and south-eastern Sweden. Significant negative trends in these regions, along with increasingly wet conditions in northern and western Sweden, were observed when analysed using the SPEI, SSMI, and SSI. Based solely on precipitation (SPI), similar significant wetter conditions were observed in northern and western Sweden; however, no significant decreasing precipitation trends were found in parts of central-eastern Sweden and Gotland Island. The findings of this study can improve climate services and early warning systems of droughts, better understanding the link to sectoral impacts and guiding mitigation practices and adaptation policies.
- Article
(6443 KB) - Full-text XML
-
Supplement
(1866 KB) - BibTeX
- EndNote


Drought is a natural hazard characterized by periods of drier-than-normal conditions with wide-ranging and cascading impacts across societies, ecosystems and economies (Douville et al., 2021; UNDRR, 2021). Drought hazard, human activities, drought management, and their impacts are closely intertwined, meaning droughts cannot be perceived as exclusively natural hazards (UNDRR, 2021). Recognizing this, the Sendai Framework for Disaster Risk Reduction 2015–2030 addresses drought as a significant risk that requires a proactive and multi-hazard management. It advocates for a comprehensive and integrated approach to mitigate drought impacts through global collaboration, local preparedness, and sustainable development policies. In alignment with these principles, the World Meteorological Organization (WMO) and the Global Water Programme launched the Integrated Drought Management Programme (IDMP) in 2013 (see https://www.droughtmanagement.info/, last access: 10 March 2025), identifying three pillars for drought management: (1) Monitoring and Early Warning Systems, (2) Risk and Impact Assessment, and (3) Mitigation and Response. The first pillar on monitoring and Early Warning Systems centres on the monitoring of drought indicators such as precipitation, temperature, soil moisture, and streamflow, and disseminating drought forecasts to stakeholders. The second pillar on risk and impact assessment involves evaluating the impacts of drought and drought risk based on hazard, exposure, and vulnerability, which includes the social, economic, and environmental factors to determine the community's susceptibility to drought hazards. The third pillar on drought mitigation involves implementing measures to limit the adverse impacts of drought, and drought response focuses on providing assistance to meet the basic needs of affected communities.
Focusing on the second pillar of the IDMP, drought risk assessment involves identifying, analysing, and evaluating the risks posed by natural or human-made hazards to people, assets, and the environment. The risk framework proposed by the United Nations' Intergovernmental Panel on Climate Change (IPCC, 2022) indicates that the risk assessment involves the potential occurrence of hazardous events and the associated loss and damage (hazard assessment), the exposure of populations, livelihoods, ecosystems, and assets to these hazards (exposure assessment), and their susceptibility sensitivity to damage and lack of capacity to cope and adapt (vulnerability assessment). To assess drought hazards using this approach, a range of indicators is needed to characterize various aspects, including drought severity, frequency, and likelihood of occurrence (UNDRR, 2021). For instance, the Standardized Precipitation Index (SPI; McKee et al., 1993) and the Standardized Precipitation-Evapotranspiration Index (SPEI; Vicente-Serrano et al., 2010), are extensively applied for meteorological drought analysis. Agricultural and hydrological indicators, such as the Standardized Soil Moisture Index (SSMI; Xu et al., 2018) and the Standardized Streamflow Index (SSI; Modarres, 2007), respectively are used to understand how meteorological drought propagate through the terrestrial water cycle, by quantifying the spatial and temporal variability of the soil moisture and streamflow conditions.
Previous researchers have studied drought hazard in Sweden. Teutschbein et al. (2023a) conducted a nationwide survey among local practitioners, revealing challenges in drought risk planning and management at the local level. Their earlier work (Teutschbein et al., 2020) identified limitations in Sweden's ability to cope with droughts and their consequences. Analysis of streamflow droughts over 6 decades showed a general wetting tendency across Sweden, with less severe, shorter, and less frequent droughts, particularly during winter months (Teutschbein et al., 2022). However, southern regions experienced a slight drying trend in spring and summer. Chen et al. (2020) investigated the shifts in Sweden's precipitation patterns, temperature, and their effects on water resources, highlighting the increased risk of floods and droughts due to climate change. They found hydroclimate changes with most significant wetting in the north, a slightly overall wetting in the south, and a drying in central-eastern areas.
In 2018, Sweden faced its third consecutive year of drought caused by low precipitation and high summer temperatures, leading to a strained situation regarding water availability (Sjöstrand et al., 2019; SMHI, 2024). The drought of 2018 affected the functionality of ecosystems, forestry, water supply, hydropower, industries, and agriculture. The country experienced crop yield reductions of up to 50 % and the slaughter of livestock increased due to lack of affordable fodder and feed (Grusson et al., 2021; SCB and Jordbruksverket, 2018). Besides this, the Swedish agricultural production in 2023 was reported to be among the worst in 30 years (Lantmännen, 2024). Early summer drought followed by excessively wet conditions in late summer led to poor crop quality, resulting in an inability to meet the food production requirements intended for human consumption in some regions. Swedish forests are also affected by droughts. For instance, Aldea et al. (2023) assessed drought vulnerability among boreal tree species in Sweden and found that Norway spruce is the most susceptible to drought in southern Sweden, leading to a higher mortality rate. Foghagen and Alriksson (2023) studied the drought management in the industrial sector. They indicated that farming and tourism companies on the Swedish islands of Öland and Gotland are concerned about the effects of drought and water shortages, however, they perceive the implementation of mitigation measures fall outside their responsibility. Regarding water supply, Barthel et al. (2021) explored the understanding of drought impacts on drinking water sourced from groundwater. They highlighted the linkage between meteorological drought and groundwater recharge, emphasizing the need for improved research on drought monitoring. Moreover, climate change is expected to increase the occurrence of droughts in southern Sweden, including areas around Lakes Vänern and Vättern, affecting water availability due to a higher plant water demand and extended growing seasons (Swedish Ministry of the Environment, 2022). Finally, challenges remain in effectively integrating drought risk management into water resource planning.
To tackle these challenges, it is essential to understand the risk that drought poses countrywide. Thus, the overreaching objective of our research project is to develop a comprehensive drought risk assessment for the country, encompassing the analysis of the hazard, vulnerability, and exposure. To unravel the complexities of drought hazard specifically, we address the following scientific questions: how do spatial and temporal hydro-climatic dynamics shape drought patterns across Sweden? to what extent meteorological, agricultural, and hydrological drought conditions compare in characterizing short- and long-term dry periods? and which regions in Sweden exhibit increasing drought conditions? To answer these questions, this research develops a drought hazard assessment in Sweden, following four main steps: (1) identifying drought-informed regimes using data of soil moisture anomaly, (2) calculating meteorological, agricultural, and hydrological drought indicators, using precipitation, evapotranspiration, soil moisture, and streamflow data, (3) identifying and characterizing dry periods in terms of intensity, duration, and frequency, and (4) evaluating drought trends. The spatiotemporal drought hazard was assessed using drought indicators, including SPI, SPEI, SSMI, and SSI at the time scales of 1, 3, 6, 12, and 24 months from January 1975 to December 2021 covering approximately 40 000 sub-catchments across the entire country. These indicators were derived using daily data of hydro-meteorological variables from the S-HYPE hydrological model.
2.1 Data
In this study we used the hydrological model simulations for Sweden from January 1975 to December 2021. The simulations were derived using the Swedish Hydrological Predictions for the Environment (S-HYPE) model, which was developed at the Swedish Meteorological and Hydrological Institute (SMHI). S-HYPE is a semi-distributed catchment model, which simulates water flow and substances from precipitation through various storage compartments and pathways (Lindström et al., 2010). The model code is open source and describes hydrological processes in different subbasins, the algorithms are based on conceptual nature and physical laws. The model has a large number of parameters, and is calibrated with a regional stepwise calibration for specific hydrological processes using representative gauges to obtain sufficiently robust predictions also in ungauged basins (Girons Lopez et al., 2021, 2025). The S-HYPE model was run using daily temperature, precipitation, and runoff data as input, generating simulations from 1 January 1975 to 31 December 2021, for 39 635 sub-catchments (with an average area of 13 km2) at a daily time interval. The study applied the corrected precipitation (mm), evapotranspiration (mm), soil moisture of upper two soil layers (mm), and the simulated streamflow from subbasin (m3 s−1) simulations for the entire Sweden's land cover and certain transboundary basins from Norway and Finland. The corrected precipitation simulations were adjusted for elevation variations within the subbasin. The potential evapotranspiration was computed based on land use and atmospheric variables (e.g. temperature) using the Jensen–Haise formula (Jensen and Haise, 1963). The streamflow was generated from the upstream area of the subbasin outlet point. The soil water content simulations of upper two soil layers including standing water, depend on the land use and soil type at each hydrological response unit, and are defined based on the field capacity, wilting point, and effective porosity parameters. We assumed that the upper two soil layers represent the rootzone.
2.2 Identifying drought-informed regimes
To understand the spatial patterns of soil moisture variability across Sweden, a clustering was performed based on the daily soil moisture simulations of upper two soil layers (1975–2021) from S-HYPE for the 39 635 studied sub-catchments. For this, the soil moisture anomaly (SMA; see Eq. 1), which is the standardized soil moisture data, was computed through subtracting the mean (μ) of the daily average of soil moisture (SM) and dividing by the standard deviation (σ).
The monthly mean of the daily SMA values was then calculated. Using the average monthly SMA values, 5 spatial clusters were identified as the optimal number of groups based on the Silhouette method (Rousseeuw, 1987), an approach to detect how close each point in a cluster is to other points within the same cluster, and to points in other clusters. We applied the K-means clustering (McKee et al., 1993) using the algorithm of Hartigan and Wong (1979) to the 39 635 monthly SMA records generating clusters based on similarity in anomalies.
2.3 Standardized drought indicators
SPI is based on precipitation data, SPEI accounts for both precipitation and potential evapotranspiration, thus including temperature data (Vicente-Serrano et al., 2010). SSMI is calculated following the same procedure as SPI and SPEI but using the soil moisture of the upper two soil layers, while SSI uses streamflow data. The indicators were derived from the hydro-meteorological simulations of the S-HYPE model (spatial resolution ∼ 13 km2) for the period 1975–2021. A 1 month indicator is an accurate representation of the monthly deviation from the long-term mean (47 years data record) for a given location, which is fitted to a probability distribution. The n month indicator provides information of the deviation of a specific n month period with the same n month long-term mean.
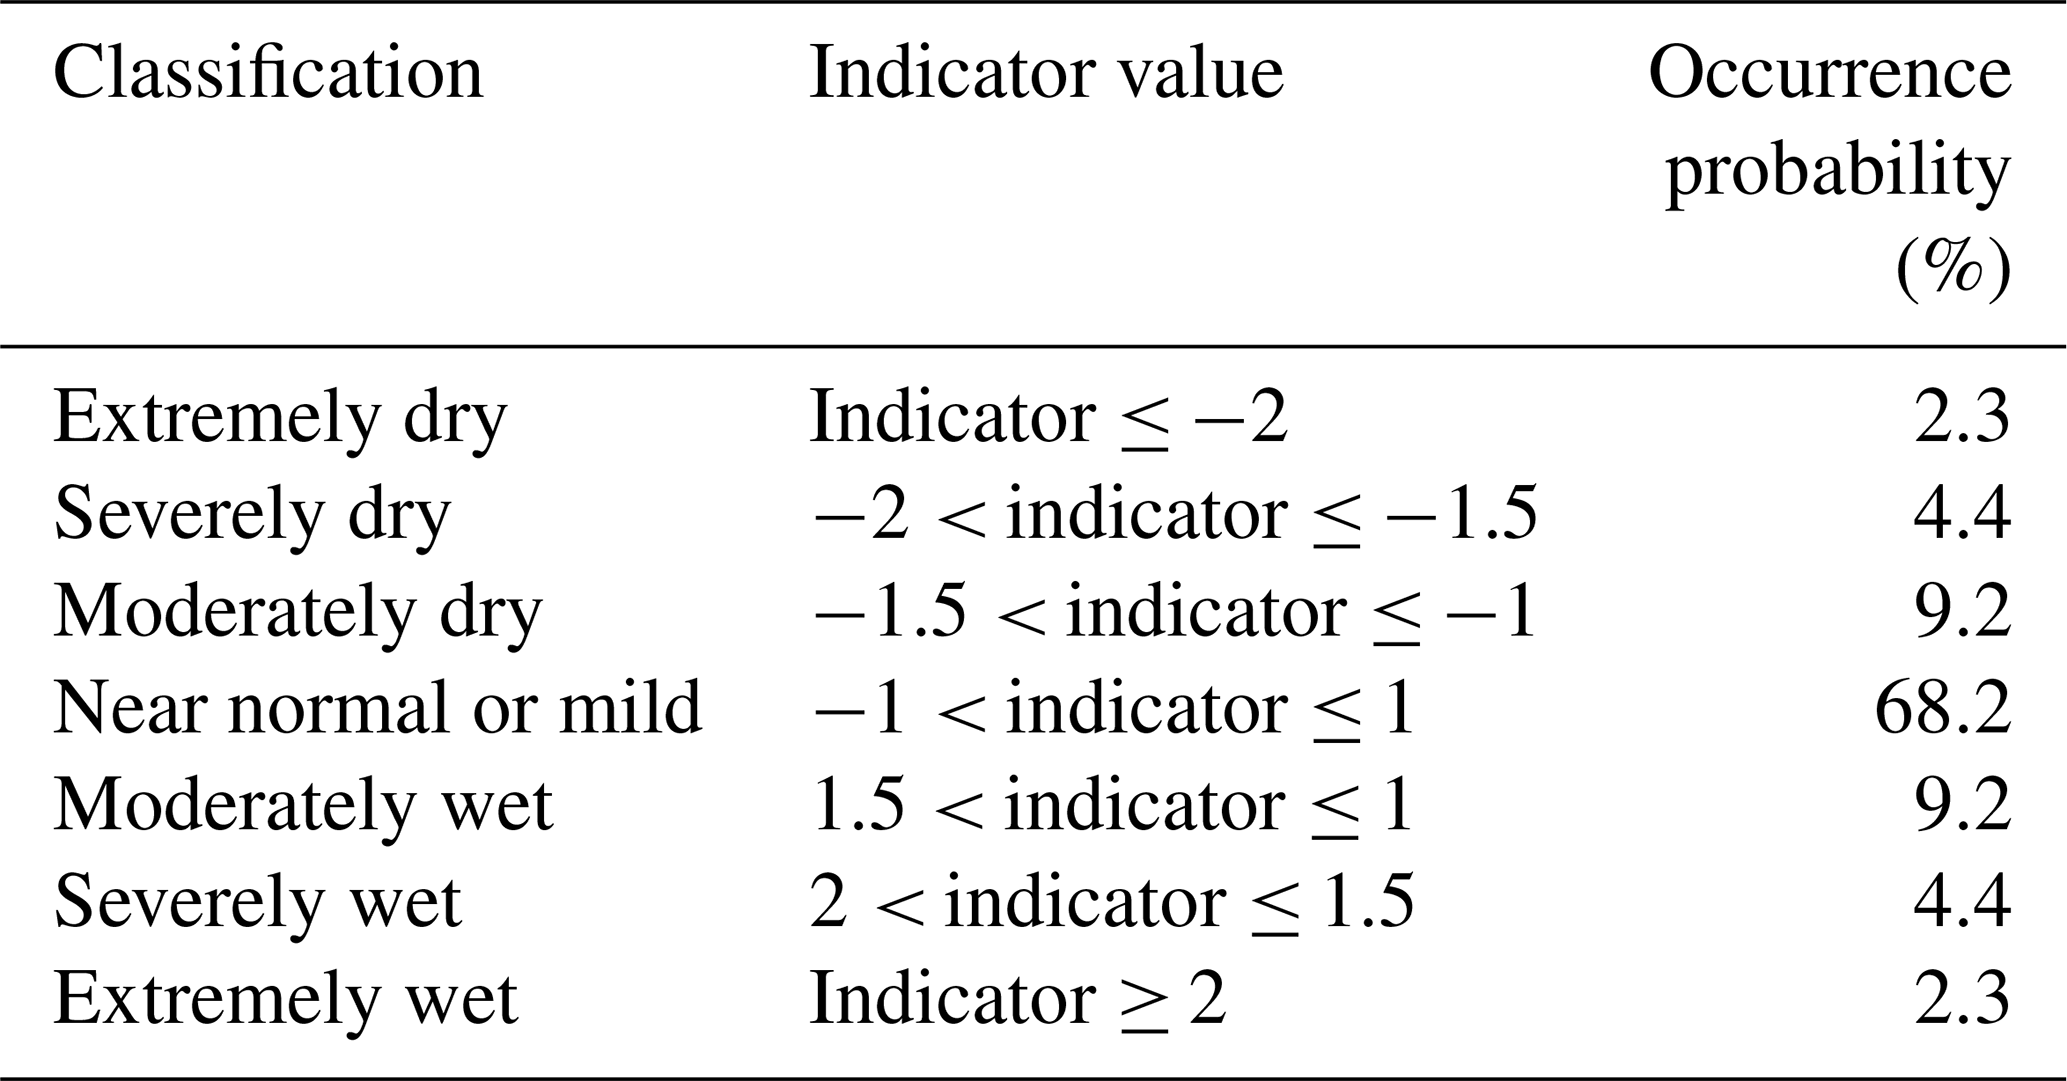
Different accumulation periods serve as an indication for different impacts, including soil moisture reduction, streamflow and water storage reduction, and groundwater recharge reduction, further influenced by local factors and human activity (JRC EDO, 2020b). For the purpose of our analysis, we estimated SPI, SPEI, SSMI, and SSI for each sub-catchment and considered accumulation periods of 1, 3, 6, 12, and 24 months from 1975 to 2021, obtained by applying a corresponding moving average to monthly timeseries. In this study, we defined short-term droughts with timescales of 1 and 3 months, a mid-term drought at 6 months, and a long-term drought at 12 and 24 months. For detailed information on the calculation of the indicators (e.g., fitting distributions, reference period, and others), refer to Sect. S1 in the Supplement. The standardized drought indicators were subsequently classified based on severity levels, with negative values indicating dry conditions and positive values representing wet conditions (see Table 1).
Table 1The drought severity classification scheme of the standardized drought indicators.
2.4 Characterization of dry periods
Following the operational definition of drought (Wilhite and Glantz, 1985; Mishra and Singh, 2010), we identified and characterized dry periods based on quantitative criteria that allow the detection of their onset and termination. In this study, a dry period is defined as a continuous period during which the standardized drought index values remain consistently equal or below −1, and a it concludes when the values exceed −1. Various characteristics of dry periods have been assessed, including duration, severity, intensity, and frequency (Muthiah et al., 2024; Yevjevich, 1967). Drought duration, stated in months, refers to the consecutive period in which a standardized drought indicator remains equal or lower than −1. It spans from the initiation to the termination of a dry period. Drought severity is the cumulative sum of the indicator values over the duration of a dry period. Drought intensity represents the mean of consecutive indicator values during a dry period and is obtained by dividing drought severity by drought duration. Drought frequency is the total number of dry periods identified during the study period. The average drought duration reflects the average length (in months) of dry periods observed during the study period. And the percentage of time in dry conditions (or probability of occurrence) is the fraction of the total study period during which dry conditions occurred. It was estimated dividing the number of months during which dry periods were observed by the total number of months in the dataset multiplied by 100.
2.5 Drought trend analysis
To examine drought trends in Sweden, the Mann–Kendall test was applied using the R function MannKendall (Kendall, 1975; Mann, 1945). This nonparametric statistical method is commonly used in environmental studies to detect significant trends. The Kendall Tau, or Kendall rank correlation coefficient, measures the monotony of the slope, which means it evaluates whether the variables tend to increase or decrease. Kendall's Tau varies between −1 and 1; it is positive when the trend increases and negative when the trend decreases. A trend is considered statistically significant when the p value is equal or less than 0.05. The test was employed to analyse trends in standardized drought indicators as well as the severity, intensity, duration, and frequency of dry periods.
Firstly, trends in standardized drought indicators were defined using the 1975–2021 dataset. Here, the annual and biennial trends were assessed using the 12- and 24-month timescales, respectively, for September of each year. The 12-month timescale for September covers the hydrological year from October of the previous year to September of the reported year, while the 24-month timescale for September spans two hydrological years, from October of the ante-previous year to September of the reported year. The seasonal trends were assessed using the 3-month timescale corresponding to the last month of each season: February for winter (December, January, February), May for spring (March, April, May), August for summer (June, July, August), and November for autumn (September, October, November). In addition, trends specific to dry periods were analysed, including those in severity, intensity, duration, and frequency. The frequency of dry periods was determined by identifying trends in the annual number of drought occurrences.
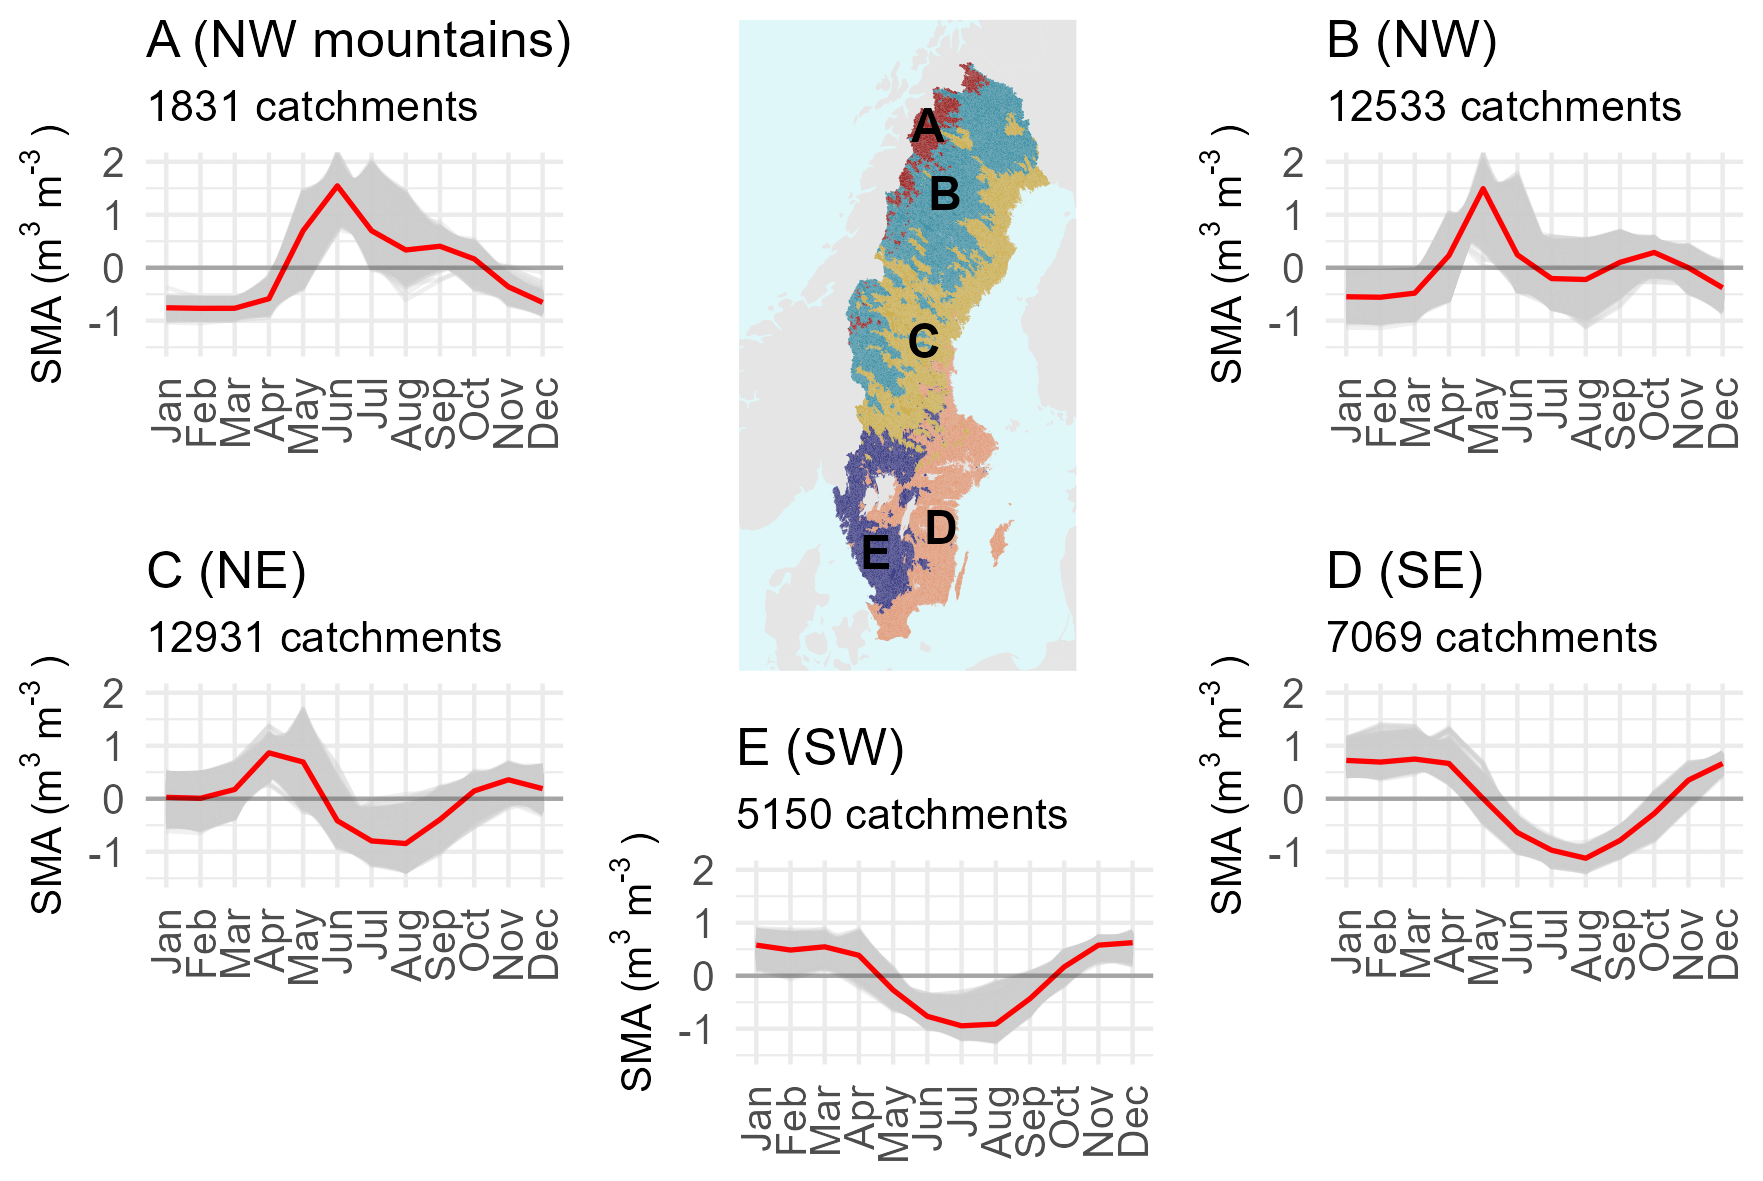
Figure 1Map of Sweden with shaded colours indicating the different clusters (top-centre). Graphs show the monthly soil moisture anomaly (SMA) values for all sub-catchments in each cluster (cluster A–cluster E). Grey band shows the range of SMA values and the red solid line shows the mean monthly SMA.
3.1 Drought-informed regimes in Sweden
The monthly average of the monthly SMA from 1975 to 2021 was used to define five clusters applying the K-means methodology (Hartigan and Wong, 1979; MacQueen, 1967). Figure 1 shows the map of Sweden with the five identified clusters (cluster A–cluster E), and the monthly SMA per cluster. Cluster A, located at the north-western (NW) Sweden, is characterized by mountainous topography. This cluster shows a SMA peak in June–July, while the lowest SMA values are shown from January to March. Cluster B, also located in NW Sweden is mostly covered by forested areas. This cluster shows a SMA peak in May–June, and a second slighter peak in October, the lowest SMA values are shown from January to March. Cluster C, located in the north-eastern (NE) Sweden, in close proximity to the Baltic Sea, shows a peak in April–May, with a second slighter peak in November, while the lowest SMA values are shown in August. Clusters D and E located in south-eastern (SE) and south-western (SW) part of the country are characterized by the highest populated areas in Sweden, with the presence of agricultural land, forests, and the two biggest Swedish lakes, Vänern and Vättern. These clusters show the highest SMA values from January to April, while the lowest values are shown in July and August. Clusters A and B seldom show SMA values lower than −1, while clusters C, D, and E show values lower than −1 in the summer months. Here, SMA values lower than −1 indicate drier than normal conditions (JRC EDO, 2020a). Cluster D shows lower SMA values than C and E in the summer months, especially in August, indicating that this cluster exhibits the lowest soil moisture anomalies and represents the driest region in the country.
Table 2Drought events and drought impacts in Sweden.
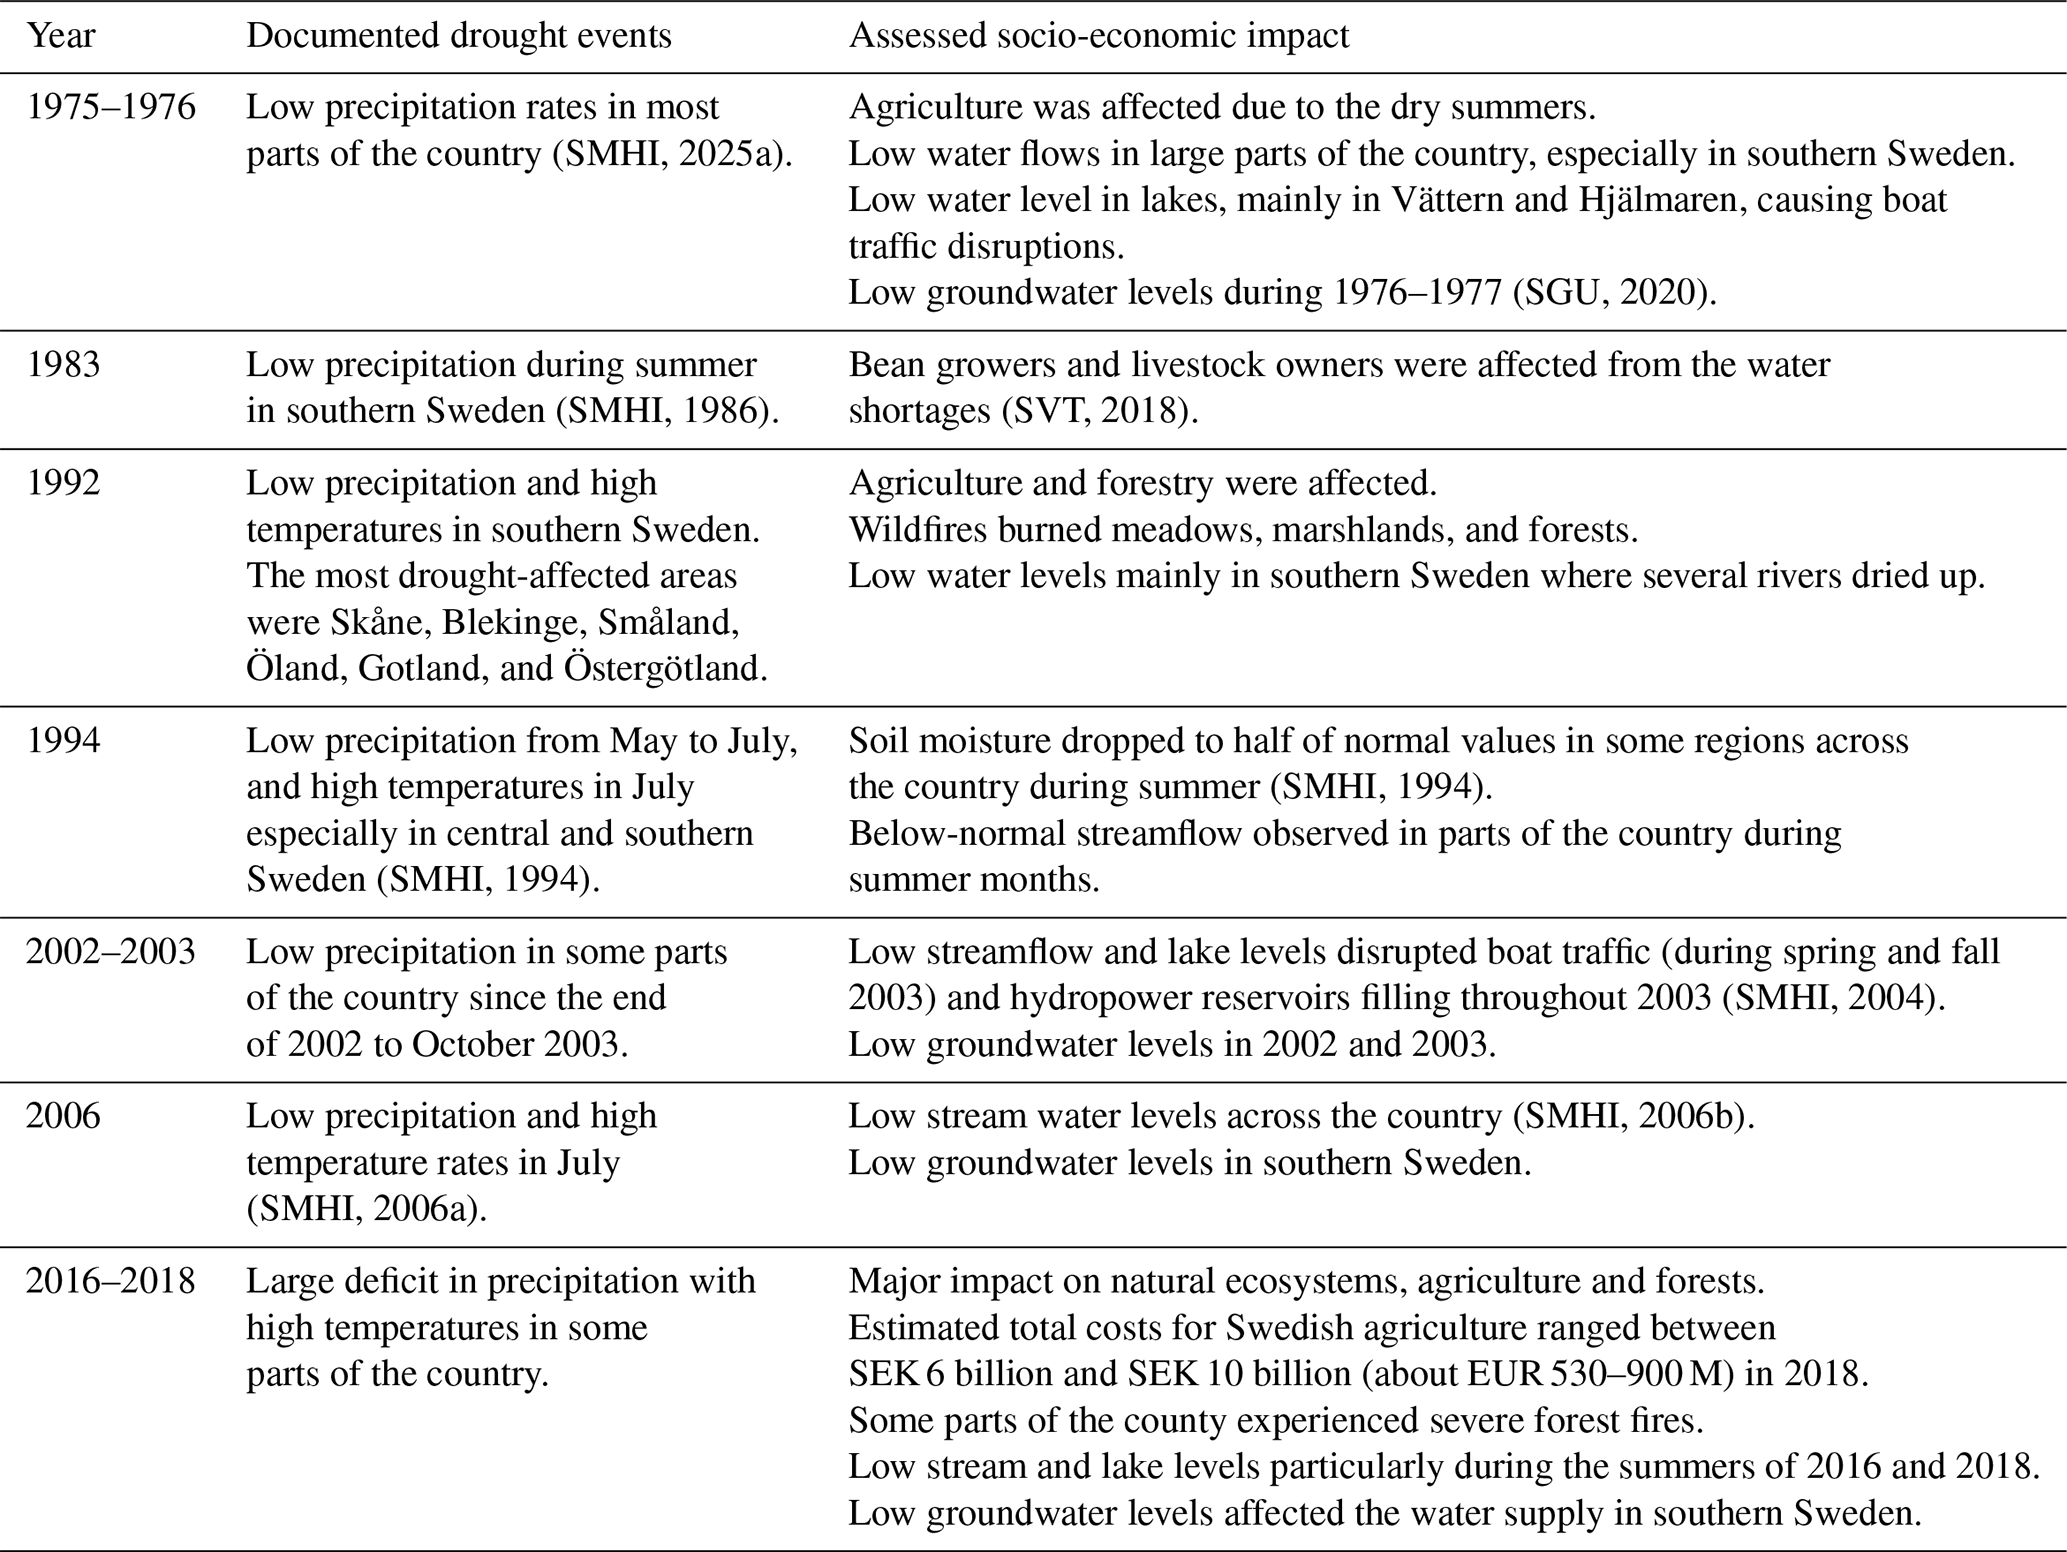
References: (SGU, 2020; SMHI, 1986, 1994, 2004, 2006a, b, 2025a; SVT, 2018).
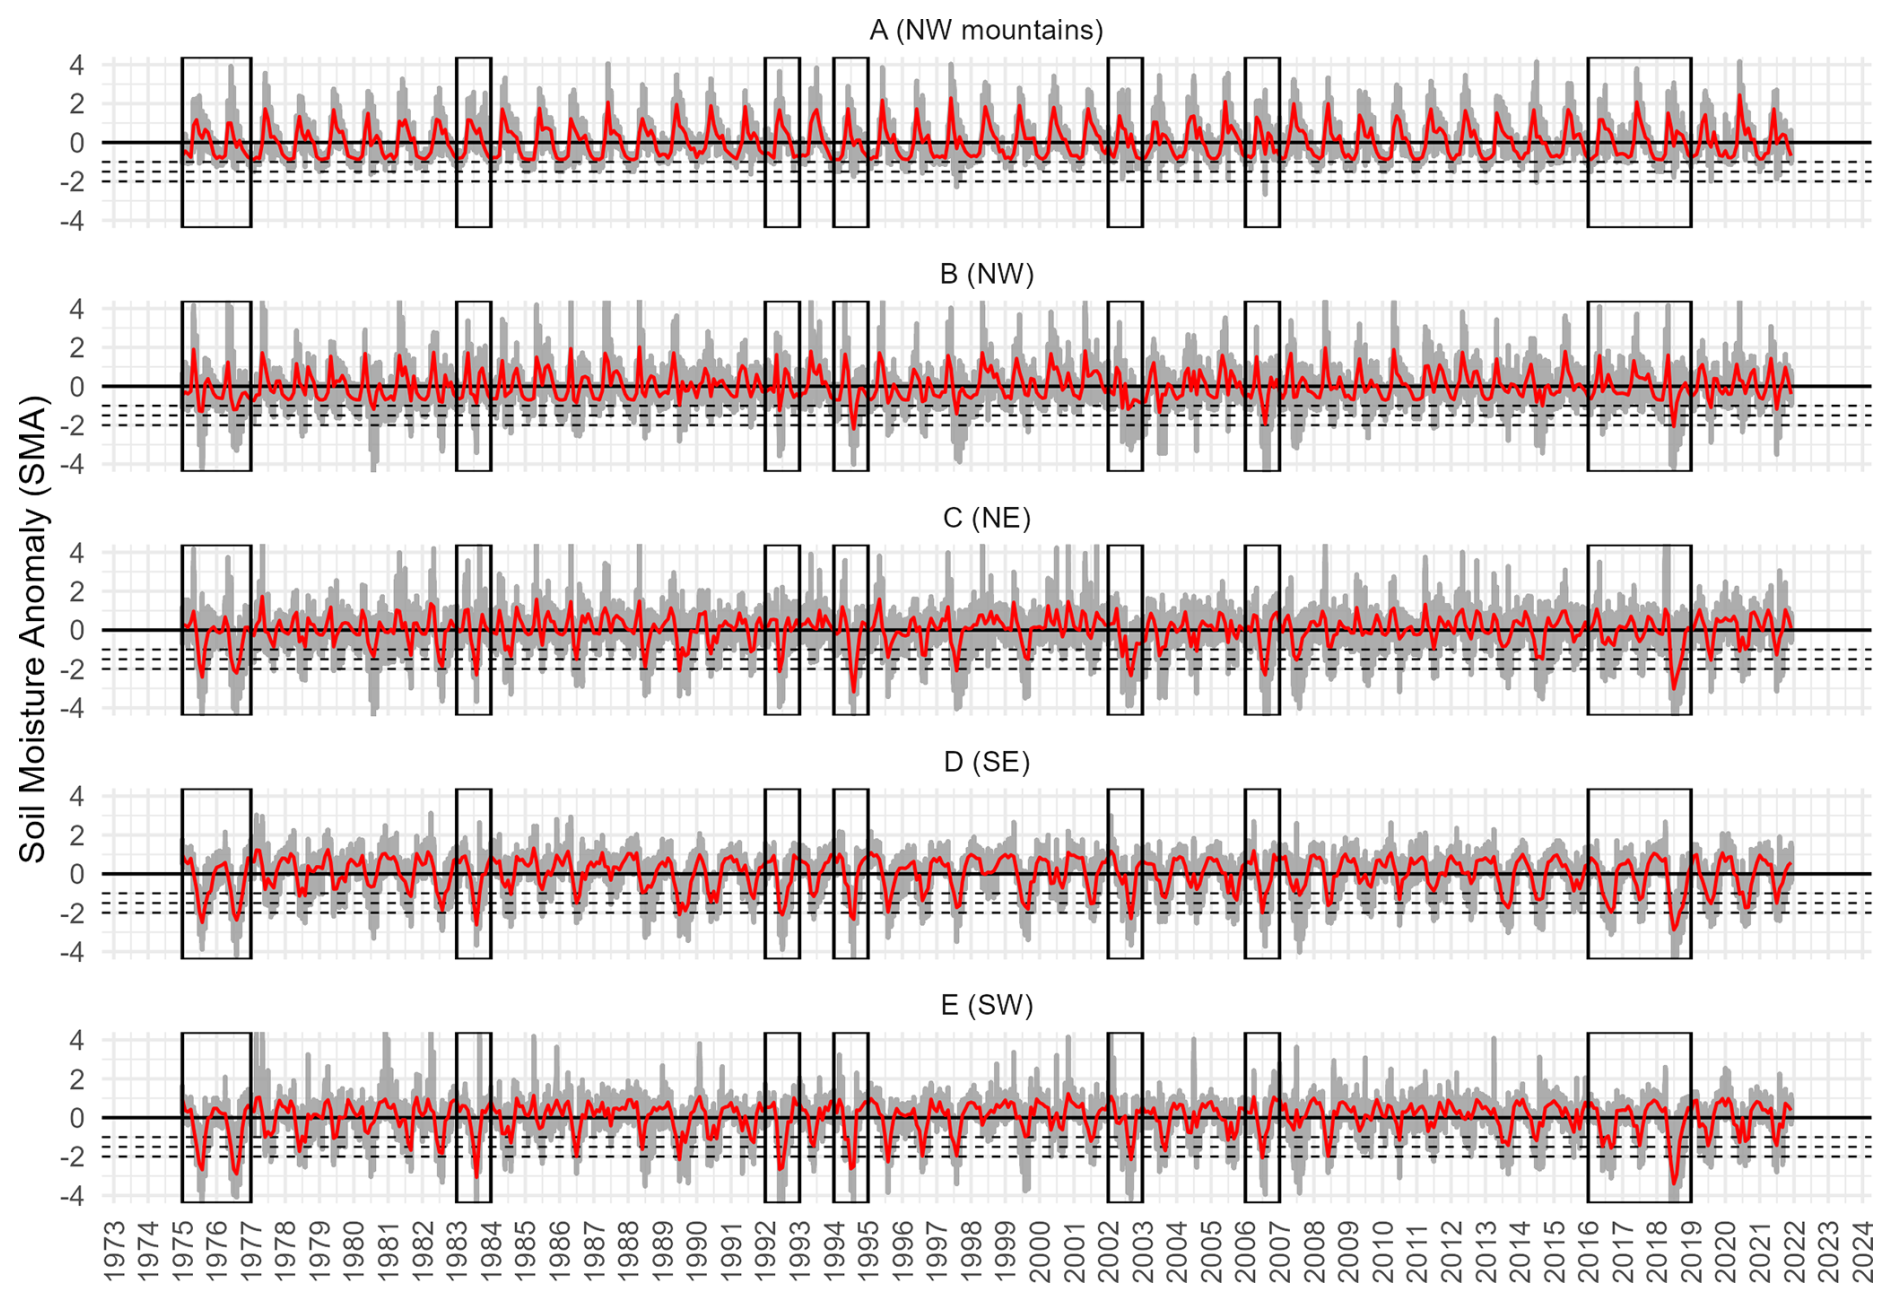
Figure 2The monthly soil moisture anomaly (SMA) values for all sub-catchments in the cluster (grey band), with their mean SMA value presented with a red solid line. The extreme and severe dry periods in 1975–1976, 1983, 1992, 1994, 2002, 2006, and 2016–2018 are highlighted with black vertical rectangles. Horizontal black dashed lines represent drought severity: moderate (−1.5 to −1), severe (−2 to −1.5), and extreme (< −2).
Our findings revealed distinct patterns in soil moisture anomalies between northern and southern regions, as well as between eastern and western areas of Sweden (see Fig. 2). Most of the mean SMA values for cluster A and cluster B were greater than −1, which indicated non-drought conditions (see Fig. S1 in the Supplement). Figure 2 also indicates that dry periods were less frequent in these two clusters (A and B). Cluster B showed severe (SMA from −2 to −1.5) and extreme (SMA < −2) dry periods in 1994, 2006, and 2018 (see Fig. 2). In contrast, they were more frequent in Clusters C, D, and E. Dry periods commonly occurred from June to October, with the most extreme events generally happening in July and August (Fig. S1). Clusters C, D, and E showed extreme dry periods in 1975–1976, 1983, 1992, 1994, 2002, 2006, and 2016–2018 (Fig. 2). Recurrent severe dry periods were observed in clusters D and E, whereas moderate (SMA from −1.5 to −1) dry periods were often detected in all clusters. Table 2 presents a systematic comparison between the identified dry periods and documented historical drought events. The table highlights the temporal correspondence and agreement between severe and extreme dry periods and historically recorded droughts, which could potentially be used for drought detection.
3.2 Characterization of dry periods
Here we examine the dry periods identified based on the SPI, SPEI, SSMI, and SSI indicators. Our findings showed that dry periods were more frequent when measured using SPEI, suggesting that temperature and consequently evapotranspiration plays a significant role in the overall water deficit (see Fig. S2, left). In general, short-term meteorological dry periods were more frequent and widespread, while short-term agricultural and hydrological dry periods were less frequent and showed larger regional variation. Long-term agricultural and hydrological dry periods were also less frequent than meteorological ones. This pattern corresponds with the progression of drought, as only prolonged precipitation and evapotranspiration deficits result in reduced soil moisture and lower streamflow levels (see UNDRR, 2021).
Overall, the percentage of time in dry conditions ranged from 1 % to 30 %, with the highest occurrences falling between 14 % and 20 % (see Fig. S2, right). The larger percentage of time in dry conditions observed with SPEI compared to SPI highlights the influence of temperature and evapotranspiration, which contribute the persistence of dry periods. In certain areas, particularly in southern Sweden, the percentage of time in agricultural and hydrological dry conditions ranged from 20 % to 30 %.
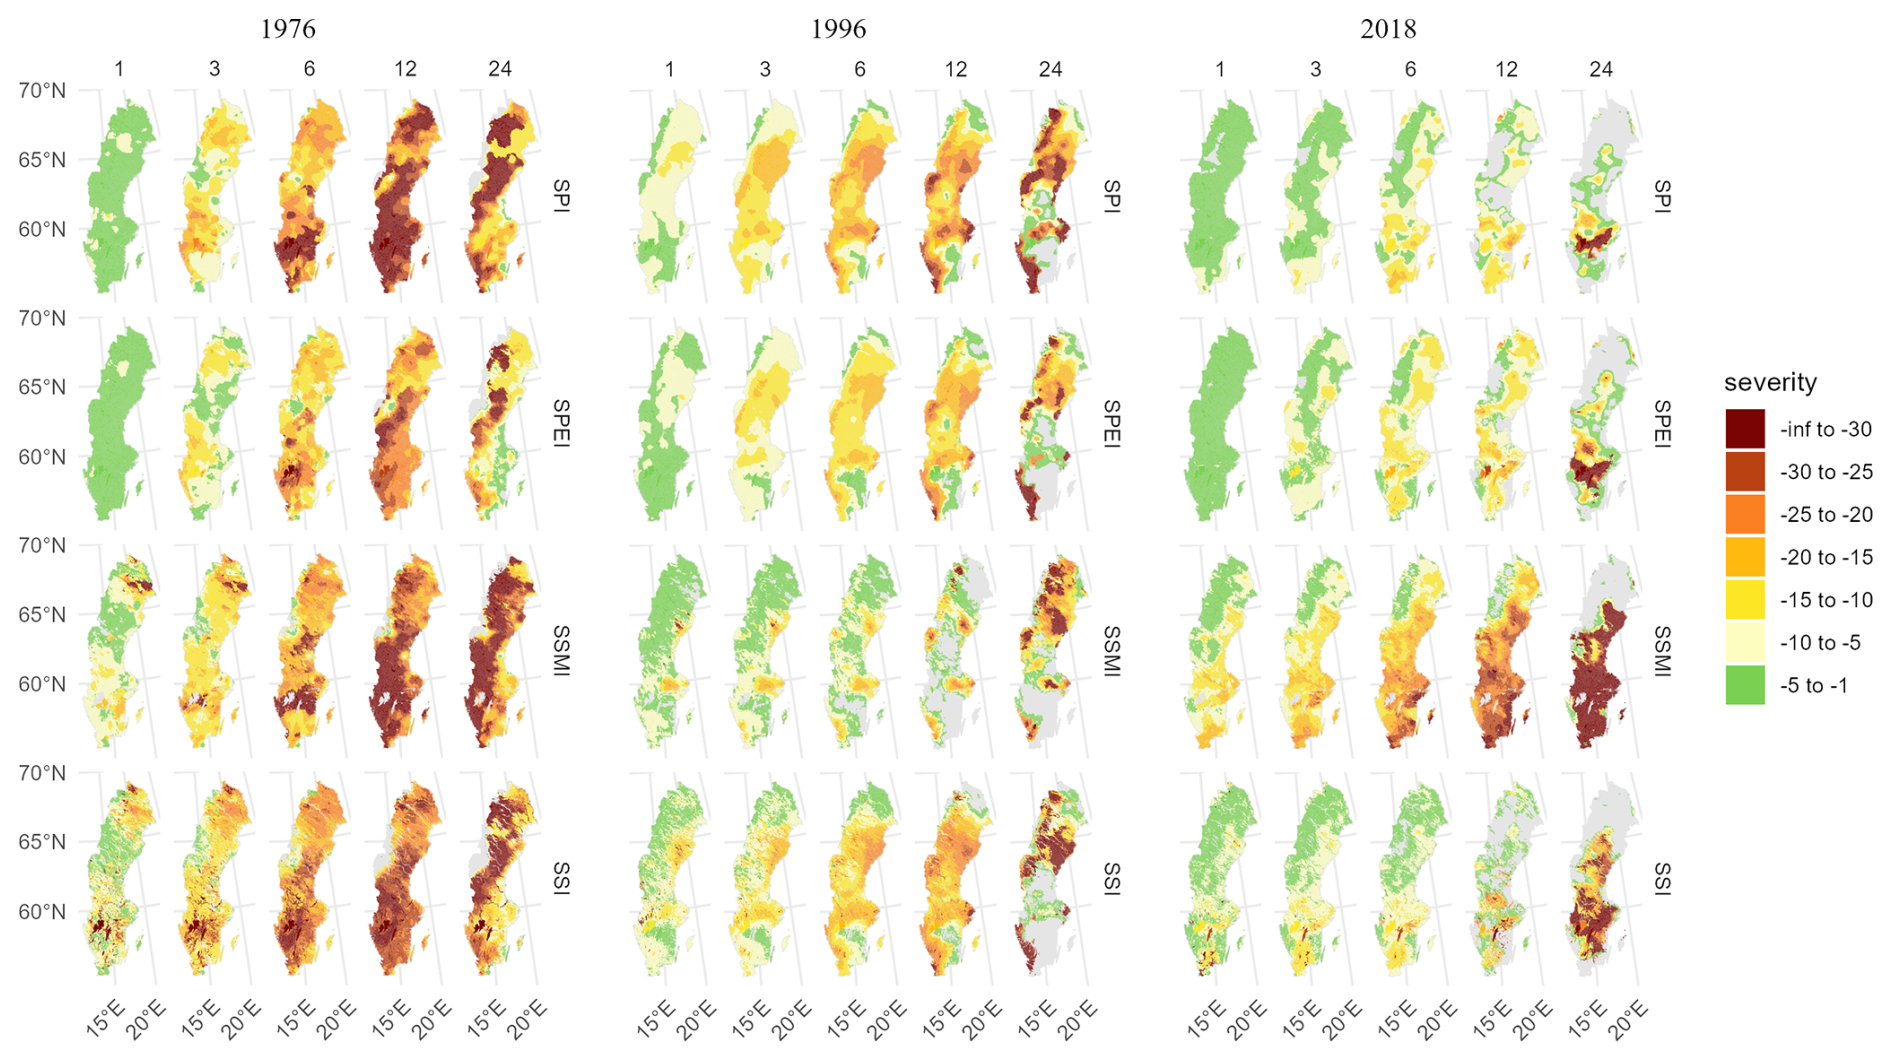
Figure 3Severity of the standardized drought indicators – SPI, SPEI, SSMI, and SSI – for the timescales of 1, 3, 6, 12, and 24 months for the most severe dry periods in 1976 (left), 1996 (centre), and 2018 (right).
The most severe dry periods in 1976, 1996, and 2018 were then identified in order to compare the magnitude of drought (see Figs. 3 and S3). Clear differences were observed among these events. For instance, the event in 1976 showed the highest severity for all meteorological, agricultural, and hydrological drought types. Moreover, the 2018 event exhibited the highest severity for soil moisture (SSMI). The reduction in soil moisture in 2018 could explain the large crop losses experienced during that period (see Grusson et al., 2021; SCB and Jordbruksverket, 2018).
Regarding the characterization of drought-informed regimes, SSMI–1 revealed distinct monthly drought patterns across all clusters, yet they all share prolonged dry conditions (SSMI–1 ≤ −1) during 1975–1976, 2002–2003, and 2016–2018 (Fig. S4). Results also displayed recurring dry conditions during the 1990s in over half of the clusters' catchments, particularly in the spring and summer months. Dry periods were observed in over half of the catchments in clusters A, B, and C from June to December 2002, excluding July. Clusters C, D, and E showed severe (SSMI–1 from −2 to −1.5) or extreme (SSMI–1 ≤ −2) dry conditions in mote than 75 % catchments during June and July 2018. Furthermore, cluster D exhibited severe dry conditions from August to December 2018 in over 50 % of the catchments.
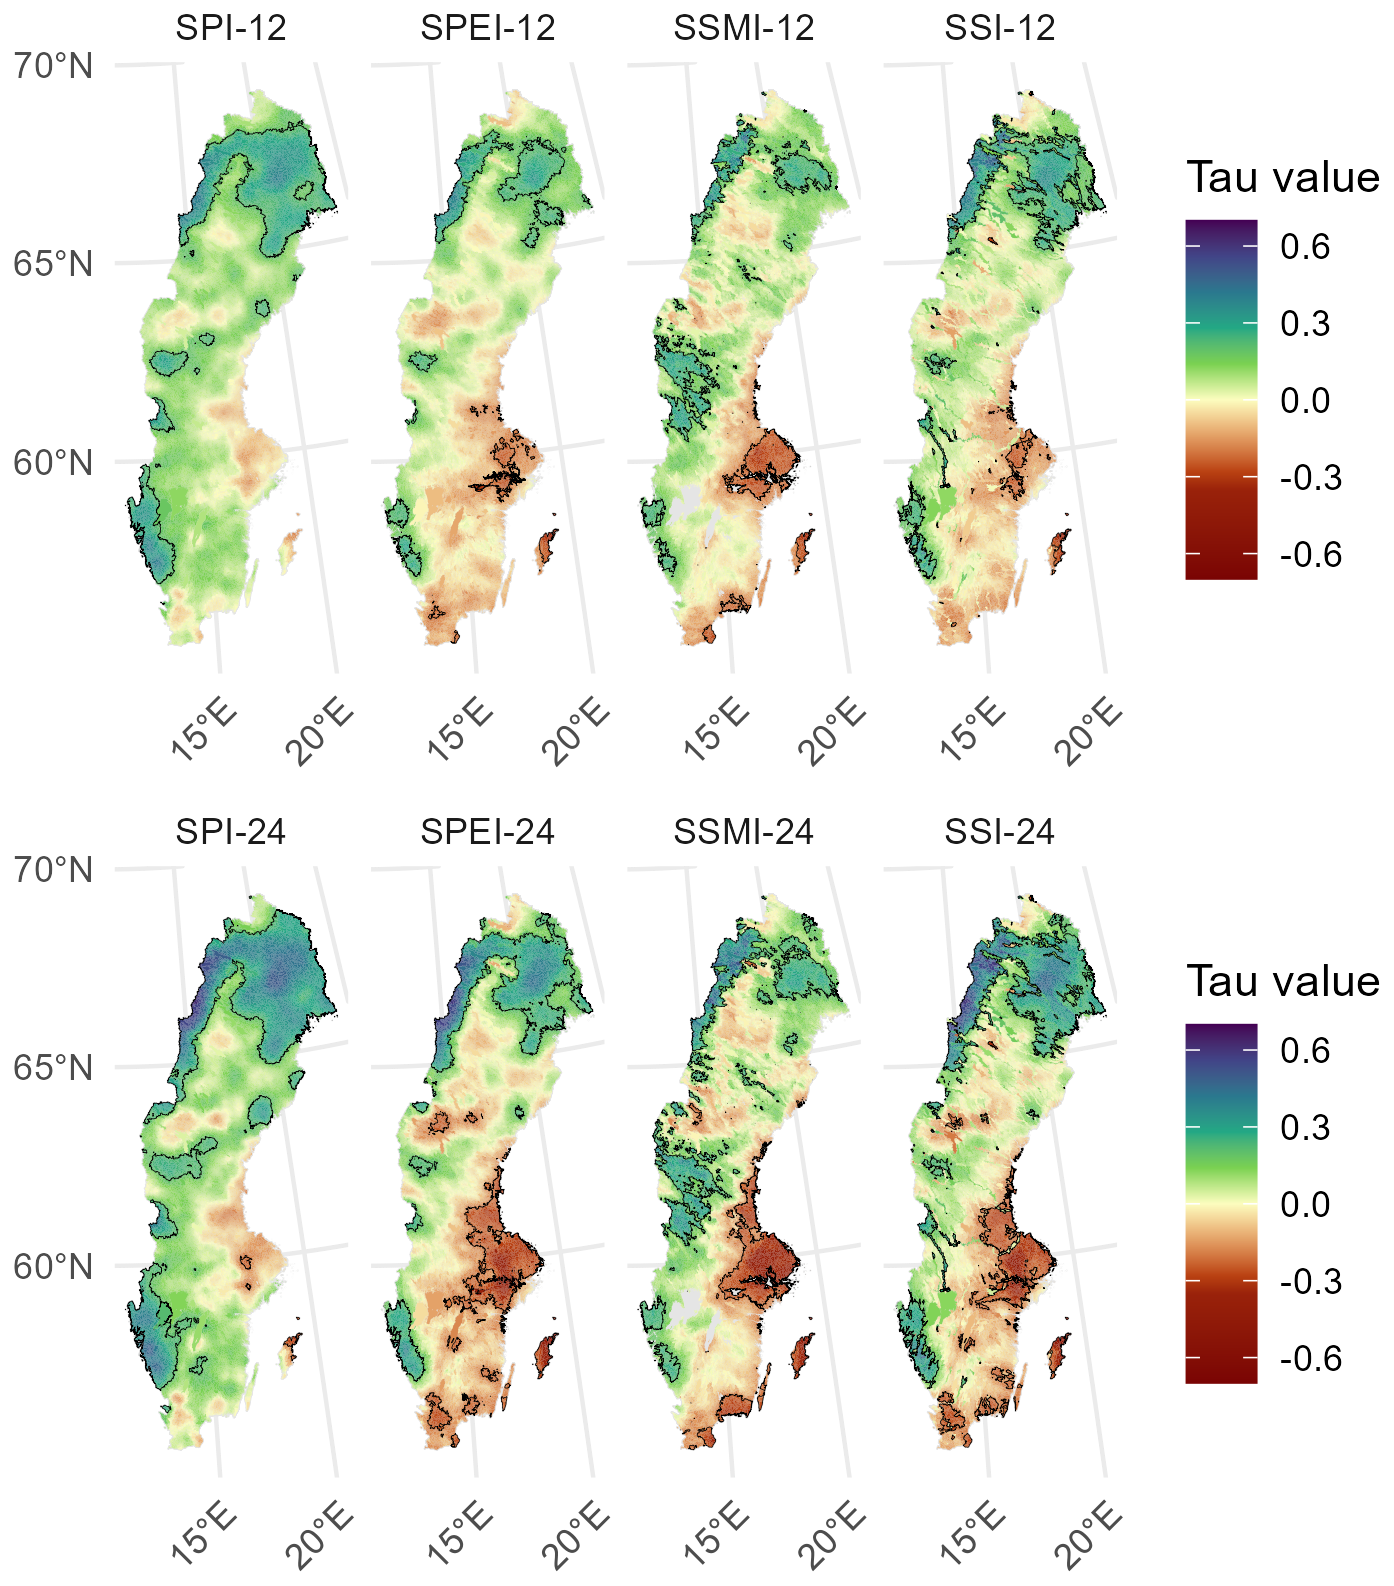
Figure 4Trends of the standardized drought indicators – SPI, SPEI, SSMI, and SSI – for the timescales 12 month (top) and 24 month (bottom) for September from 1975 to 2021. Areas with a black boarder indicate significant tau values (p-value ≤ 0.05).
3.3 Trend of drought indicators
It has been previously shown that between 1951 and 2016, annual precipitation in Sweden increased (Caloiero et al., 2018) with a magnitude of about 2.5–25 mm yr−1 per decade (Chen et al., 2020; Hartmann et al., 2013). However, these trends were not significant in central and south-eastern Sweden (Becker et al., 2013; Chen et al., 2020; Hartmann et al., 2013). Our results from the Mann–Kendall test analysis indicated wetter annual and biennial conditions (for SPI–12 in September and SPI–24 in September, respectively) across most parts of the country, yet trends of dry conditions were observed in the central-eastern Sweden (Fig. 4). Significant positive trends were evident in northern and western Sweden for both SPI–12 and SPI–24 in September. Similar significant positive trends were also found for SPEI–12 and SPEI–24 in northern and western Sweden; however, these indices revealed significant negative trends in parts of central-eastern and southern Sweden. This pattern reflects the observed wetting in northern Sweden due to increased precipitation and drying in southern Sweden, potentially driven by increased temperature and hence evapotranspiration (Cook et al., 2014).
Regarding agricultural droughts, we observed significant positive trends of wet conditions for soil moisture (SSMI–12 and SSMI–24 for September) in northern and western Sweden, and negative trends were evident in central-eastern and parts of southern Sweden (Fig. 4). For hydrological droughts, similar increased wet conditions were observed in northern and western Sweden, while negative trends were noted in parts of central-eastern and southern Sweden for SSI–12 and SSI–24. SSI–12 showed significant trends of drier conditions only in parts of Gotland, Uppsala, and Södermanland Counties, while SSI–24 displayed more widespread significant negative trends across the central-eastern and some parts of southern Sweden.
In contrast, Teutschbein et al. (2022) observed non-significant negative trends in southern Sweden based on their analysis of hydrological drought (using SSI–12 for September) from 1961 to 2020 in Sweden. Their findings indicated that most of the studied Swedish catchments exhibited wetter conditions, with northern catchments showing significant positive trends; however, these patterns vary seasonally (Teutschbein et al., 2022).
Figure 5 further illustrates the spatial patterns of the seasonal SPI, SPEI, SSMI, and SSI trend analyses across Sweden. In particular, SPI–3 showed significant positive trends over parts of northern and southern Sweden in winter (SPI–3 for February) and summer (SPI–3 for August), and over north-western Sweden in spring (SPI–3 for May). SPI–3 for spring also displayed significant negative trends in Gotland County. The SPEI–3 for winter showed significant wetter conditions in northern and western Sweden, while SPEI–3 for spring showed significant drier conditions in parts of central-eastern and southern Sweden. The SPI–3 and SPEI–3 for autumn (November) indicated positive trends of wet conditions in northern Sweden and negative trends in central-eastern and parts of southern Sweden, though most of these trends were not statistically significant.
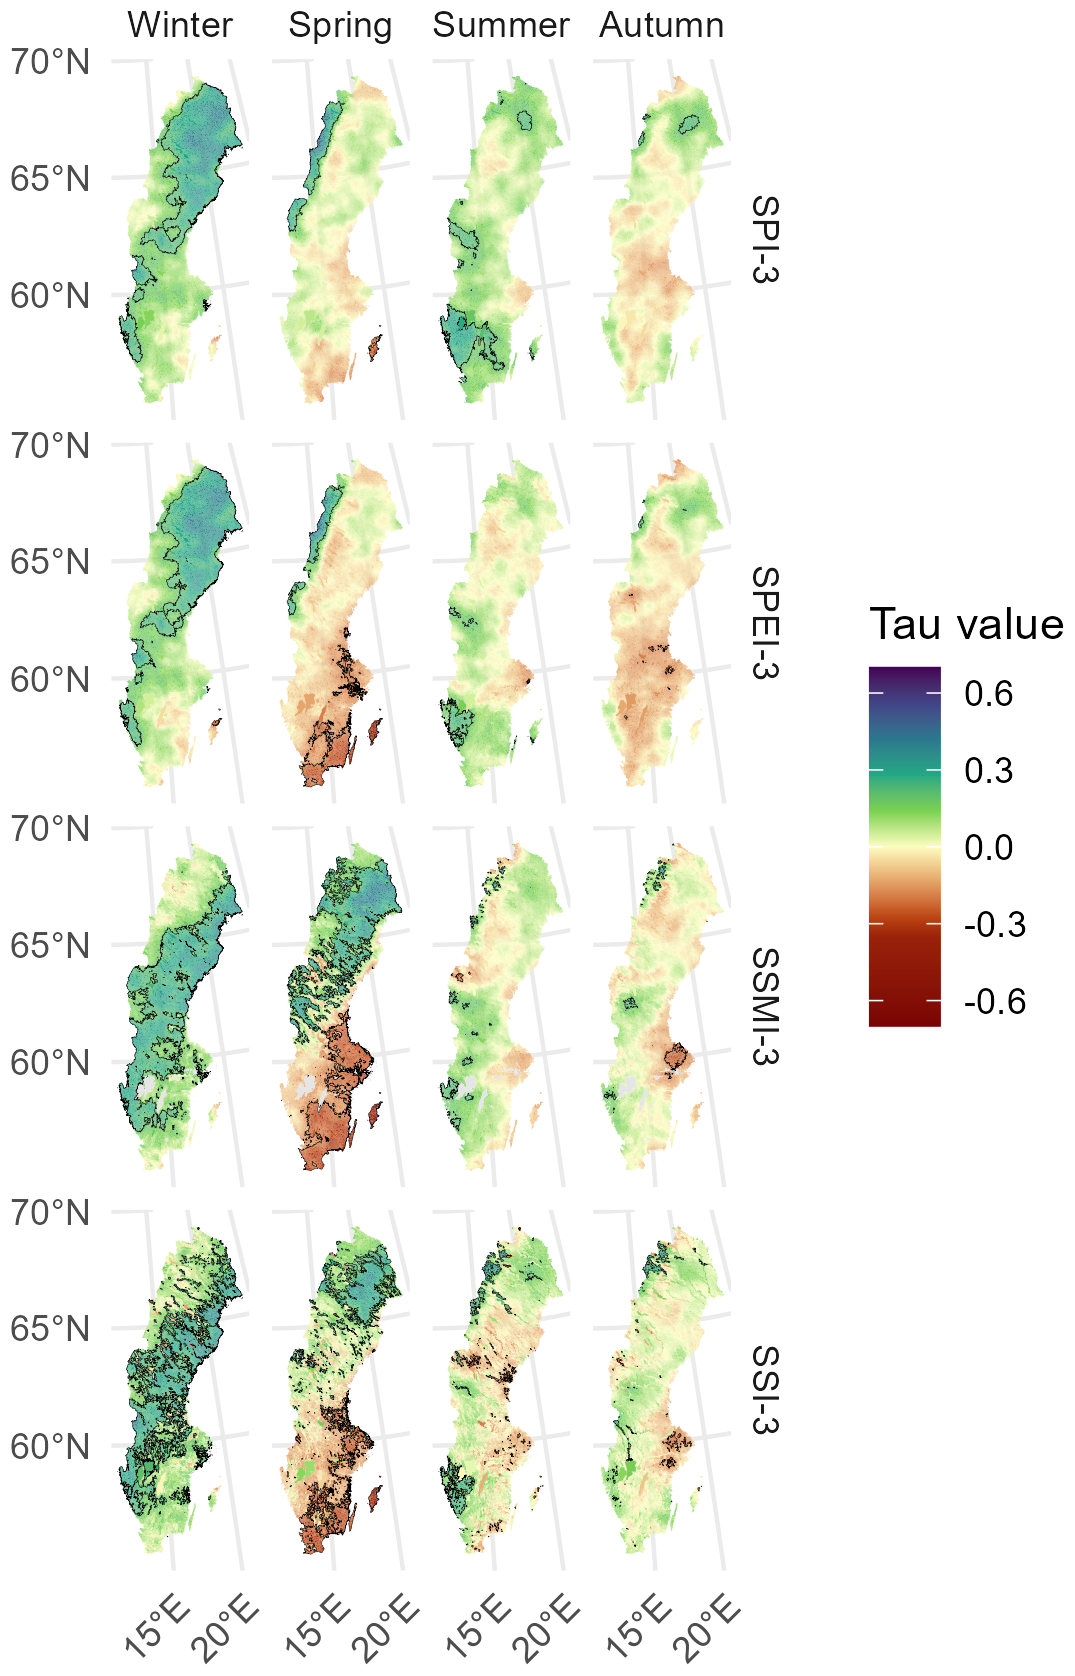
Figure 5Trends of the standardized drought indicators – SPI, SPEI, SSMI, and SSI – for the timescale 3 month from 1975 to 2021, for values in February (winter), May (spring), August (summer), and November (autumn). Areas with a black boarder indicate significant tau values (p value ≤ 0.05).
In addition, we observed increased dry conditions in soil moisture for spring (SSMI–3 for May) across central-eastern and southern Sweden, while northern Sweden displayed increased wet conditions (Fig. 5). In winter, SSMI–3 for February displayed positive trends across most of Sweden, while for summer and autumn, most regions showed no significant trends (for SSMI–3 for August and November, respectively). However, certain areas in central-eastern Sweden exhibited significant negative trends in autumn, and some regions in western Sweden showed significant positive trends in summer and autumn.
Finally, increased wet conditions in streamflow were observed in winter (SSI–3 in February), with significant positive trends evident in most parts of the country, except for southern and north-western Sweden. In spring, negative trends were noted in central and southern Sweden, while positive trends were observed in northern Sweden (for SSI–3 in May). In summer and autumn, most of the trends were not significant for SSI–3 for August and November.
Our results align with Teutschbein et al. (2022), who noted a north-south difference for streamflow trends from 1961 to 2020. For SSI–3 during May (spring), they observed that northern Sweden displayed wetter conditions, while southern Sweden experienced dryer conditions, although they mentioned that only a few locations showed negative significant trends. For SSI–3 during August (summer) and November (autumn), they found that most of the observed trends were not significant. Moreover, significant positive trends were observed for SSI–3 in February (winter) across most parts of Sweden.
Dry periods showed a decrease in frequency in northern and western Sweden, but an increase in the central-eastern and south-eastern parts of the country, based on SPEI, SSMI, and SSI (see Fig. S5). However, only some areas exhibited statistically significant trends (see Fig. S6). In contrast, the frequency of dry periods based on precipitation (SPI) showed significant negative trends (indicating lower frequency) across most parts of the country, except in the central-eastern region, where non-significant positive trends were generally observed.
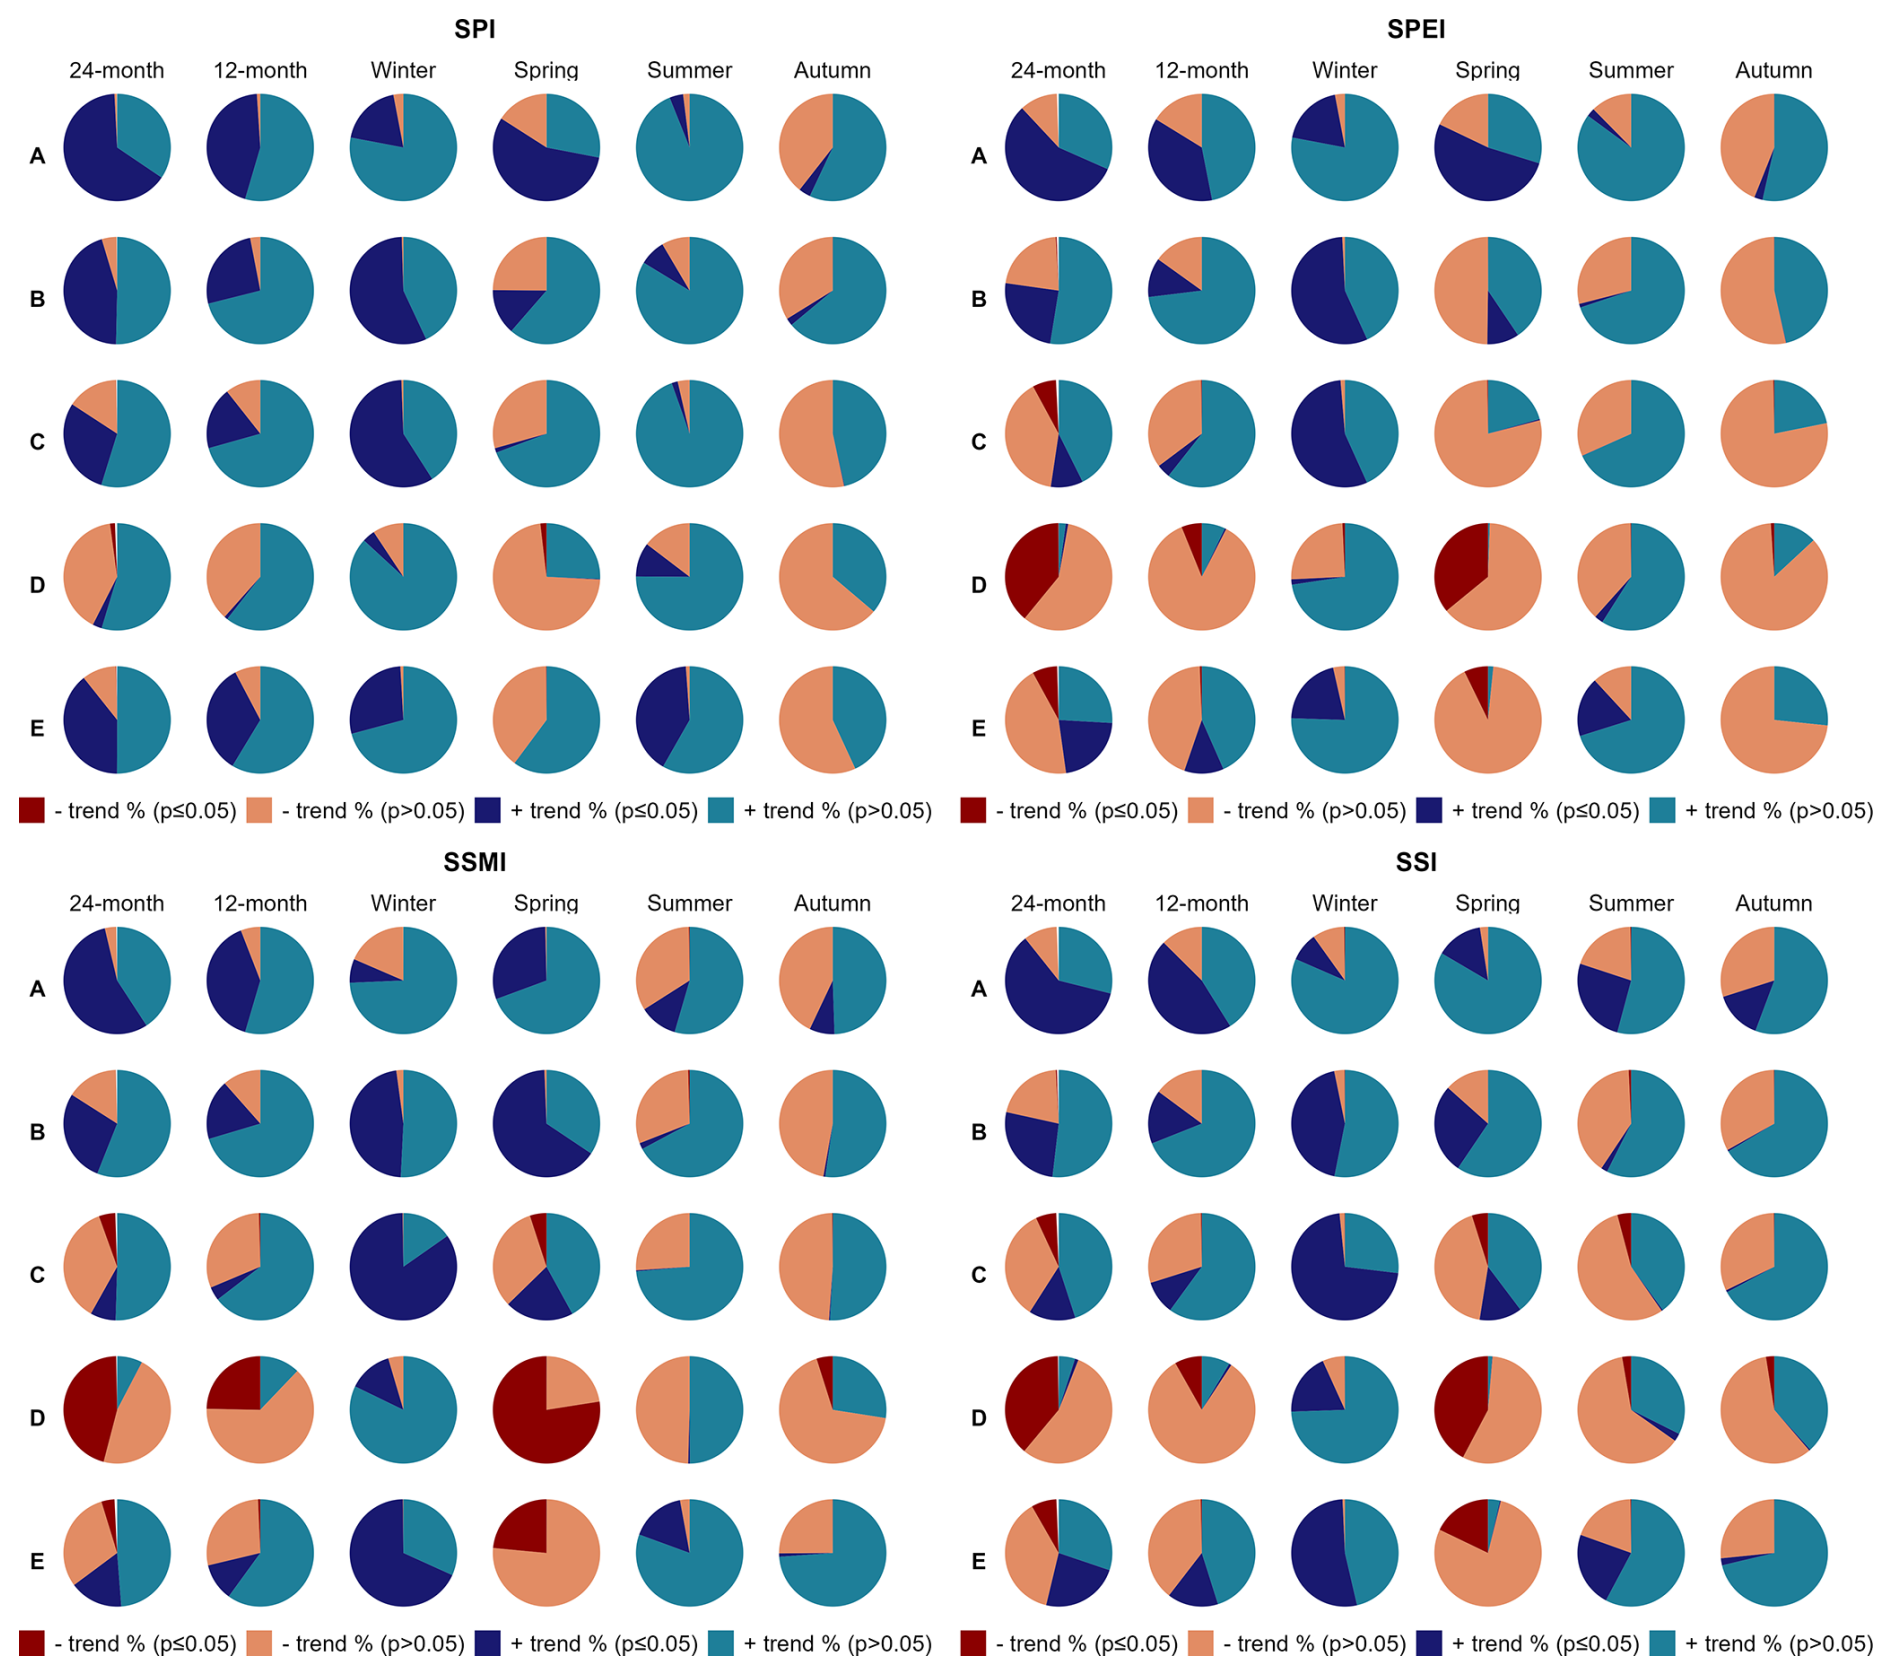
Figure 6Percentage breakdown of trends for the standardized drought indicators – SPI, SPEI, SSMI, and SSI – in catchments for clusters A–E. Values are shown for the timescales: 24 month September (biennial), 12 month September (annual), 3 month February (winter), 3 month May (spring), 3 month August (summer), and 3 month November (autumn).
Figure 6 illustrates the percentage of positive and negative trends of drought indicators – SPI, SPEI, SSMI, and SSI – observed in catchments across all clusters. For the 24- and 12-month timescales, positive trends were predominantly observed for clusters A and B, with over 75 % of the catchments within these clusters showing positive trends. In contrast, clusters C and E exhibited a predominance of positive trends for SPEI, SSMI, and SSI in approximately 60 % (±10 %) of the catchments, while negative trends were observed in about 40 % (±10 %). However, the positive trends were statistically significant in less than 24 % of the catchments within these clusters, and the negative trends in less than 8 % of the catchments. Cluster D, on the other hand, showed more than 98 % of its catchments exhibiting negative trends for SPEI, SSMI, and SSI, with statistically significant trends present in about 40 % of the catchments for the 24 month timescale, and less than 25 % for the 12-month timescale.
The wetting tendency was evident in winter, with the majority of the catchments (> 74 %) showing positive trends for SPI, SPEI, SSMI, and SSI across all five clusters (Fig. 6). However, in cluster D, 26 % of the catchments showed negative trends for SPEI-3 for winter, although these trends were not statistically significant. For spring, clusters A and B exhibited positive trends in over 75 % of the catchments for SPI, SPEI, SSMI, and SSI, except in cluster B for SPEI, where only 50 % of the catchments showed positive trends. In contrast, clusters D and E showed negative trends for SPEI, SSMI, and SSI in most of the catchments (approximately 98 %), with statistically significant trends ranging from 7 % of the catchments in cluster E for SPEI to 77 % of the catchments in cluster D for SSMI. During summer, a wetting tendency was observed for SPI across all clusters, with over 85 % of the catchments exhibiting positive trends, though only few of them showing statistically significant trends. Clusters B, C, and D showed a predominance of positive trends for SPEI and SSMI in summer, with approximately 60 % (± 10 %) of the catchments showing positive trends and about 40 % (± 10 %) showing negative trends, but again, only few catchments showed statistically significant trends. Finally, in autumn, a trend of drying conditions was evident in clusters C, D, and E for SPEI, with over 73 % of the catchments exhibiting negative trends. In contrast, SSMI showed a balanced pattern of wetting and drying conditions, with approximately half of the catchments in clusters A, B, and C showing positive trends and the other half showing negative trends. Notably, SSMI in autumn showed negative trends in 73 % of the catchments for cluster D and positive trends in 75 % for cluster E. SSI predominantly showed positive trends in autumn, with over 67 % of the catchments in clusters A, B, C, and E exhibiting wetting conditions, while cluster D exhibited an opposite pattern, with 61 % of the catchments showing negative trends. However, the overall trends for autumn were generally not statistically significant.
4.1 Comparison with previous investigations
Previous studies have already identified hydrologically similar regions across Sweden based on streamflow data (see Teutschbein et al., 2022; Girons Lopez et al., 2021). Teutschbein et al. (2022) identified five hydrological clusters, using observed monthly streamflow records (1961–2020) for 50 catchments in Sweden. They observed hydrological regimes with high spring and summer peaks along the northern catchments. In our analysis, we observed similar results for clusters A and B (located in north-western Sweden), with high SMA values in late spring and early summer, due to the snowmelt and precipitation during warm months, resulting in increased soil moisture (see Fig. 1). Teutschbein et al. (2022) also observed the peak streamflow during winter and spring, followed by low streamflow during summer months with a period of recovery in autumn across southern Sweden. A similar pattern was observed in our analysis for clusters D and E (located in south-eastern and south-western Sweden) with high soil moisture occurring in winter and spring, and lower soil moisture during the summer months. The reduced streamflow and soil moisture in summer is attributed to less precipitation, higher temperatures and increased evapotranspiration, which deplete the available moisture in the soil and, consequently, affect runoff generation.
Girons Lopez et al. (2021) also analysed the hydrological regimes across about 40 000 sub-catchments by clustering 15 hydrological signatures derived based on the S-HYPE model simulations. They identified seven clusters, each characterized by distinct topography, precipitation patterns, and intra-annual streamflow variability. Interestingly, these clusters exhibit regional differentiation in hydrological regimes, with patterns observed along north-south and east-west gradients. However, the spatial distribution of the seven hydrological clusters differs from our drought-informed results, which could be attributed to the objective of the clustering analysis. Girons Lopez et al. (2021) aimed to identify regimes primarily defined from streamflow-based signatures. Here, we aim for drought-informed regimes based on soil moisture, whose dynamics are slower than those of streamflow (Crochemore et al., 2020). It is consequently expected that fewer clusters with strong spatial proximity would have been identified in comparison to streamflow-based clustering analysis.
In addition, Spinoni et al. (2014, 2015) analysed the global and European drought frequency, duration, and severity during 1951–2010 using SPI and SPEI. Their findings revealed high drought severity and duration during the period 1951–1970, and a low drought severity during the period 1971–2010 in Sweden. Caloiero et al. (2018) examined SPI–3 and SPI–6 in Europe from 1951 to 2016 and identified severe drought conditions in 1964 and extreme drought conditions in 1996, particularly in northern Europe. They also observed prolonged drought periods before the 1990s for SPI–12 and SPI–24. Teutschbein et al. (2022) identified severe and extreme drought events based on SSI–6 in 1976, 1989, 1996, 2003, 2017, and 2018; with the hydrological droughts in 1976, 1996, 2003, and 2018 being particularly widespread, affecting more than half of their study area. Similarly to our results, Caloiero et al. (2018) observed wetter conditions for SPI–12 and SPI–24 across most of Sweden, excluding the central-eastern region. Moreover, Chen et al. (2020) observed significant positive trends of wet conditions in northern Sweden, and significant negative trends in south-eastern Sweden using SPEI–9 for August from 1902 to 2018. However, they did not observe significant increases of wet conditions in south-western Sweden. According to Chen et al. (2020), the positive trend in precipitation was most pronounced in northern Sweden, where annual and winter precipitation has increased significantly. In contrast, central and southern Sweden exhibit weaker or insignificant precipitation increases.
In line with our findings, Dai (2011a, b) reported increasing drought conditions in southern Sweden based on the Palmer Drought Severity Index (PDSI) from 1900 to 2008. However, their results showed some discrepancies in drought trends compared to other studies. For instance, Spinoni et al. (2015) observed a decreasing drought trend using the SPI, SPEI, and Reconnaissance Drought Index (RDI) from 1950 to 2012. Similar to the findings of Dai (2011a, b) and our own, Sheffield et al. (2012) reported a drying tendency in southern Sweden using the PDSI from 1950 to 2008. It is important to note that the varying significance, magnitude, location, and sign of the trends are sensitive to the selection of the drought index, the analysed time period and the applied timescale (Chen et al., 2020).
Regarding seasonal trends, Caloiero et al. (2018) identified significant positive trends in northern and parts of southern Sweden for SPI–3 in February (winter) and found no-significant trends in general for SPI–3 for November (autumn) in their investigation of the temporal evolution of drought in Europe from 1951 to 2016, consistent with our findings. In contrast, they observed significant positive trends of wet conditions for SPI–3 in May (spring) across a wider area in the northern and western parts of the country. Chen et al. (2020) found a consistent trend of drying conditions in the central-eastern Sweden since 1981. They noted that SPI–6 showed no-significant increasing positive trends in spring and summer, in contrast to other parts of the country. Furthermore, they identified significant positive trends in northern Sweden and no-significant negative trends in south-eastern Sweden for summer and autumn, based on SPEI–9 and PDSI analyses from 1902 to 2018.
4.2 Practical implications
Drought indicators based on precipitation are widely used for drought monitoring and early warnings, but there is a need for indicators representing drought propagation in different domains of the hydrological cycle and across various spatial and temporal scales (Bachmair et al., 2016). Addressing this need, the present study analyses historical drought patterns across Sweden using multiple standardized indicators, thereby contributing to improved drought risk assessment and informing long-term planning in sectors such as agriculture, water management, and energy. For example, understanding how soil moisture and streamflow deficits evolve across regions and seasons can help inform agricultural management or reservoir operations in the energy sector.
Building on previous research that analysed drought effects on water, energy, food, and ecosystems (Teutschbein et al., 2023b; Aldea et al., 2023; Campana et al., 2018), this study enhances the understanding of spatial and temporal drought patterns. It provides valuable insights for reservoir management and hydropower production, especially in northern and western Sweden, where future climate projections suggest increased drought risk (Teutschbein et al., 2023b). Additionally, the study's insights into soil moisture trends provide important context for forest management, particularly regarding species like Norway spruce that are highly susceptible to drought damage in southern Sweden (Aldea et al., 2023). Overall, the integrated drought indicator approach offered by this study supports cross-sectoral planning and enhances resilience to current and future drought hazards.
By evaluating the performance and limitations of multiple standardized drought indicators, this study identifies which indicators most accurately capture different dimensions of drought parametrization across various regions and timescales. This comprehensive assessment highlights the strengths and limitations of each metric in capturing the physical processes and impacts of drought. It enables decision-makers and practitioners to select the most relevant indicators tailored to their specific monitoring needs. Additionally, it supports early warning and forecasting systems that can benefit from integrating multiple data sources to better address the complexity of drought as a systemic risk. This approach aligns with the recommendations by Hagenlocher et al. (2023) and Van Loon et al. (2024), who emphasize that effective drought risk management requires moving beyond single-variable, event-based metrics toward multidisciplinary systems that consider hydrological, ecological, and socio-economic factors. The insights provided by this study therefore support the design of drought monitoring tools that are both scientifically robust and operationally practical, improving the ability to anticipate, communicate, and mitigate drought impacts across sectors.
This study aimed to assess drought hazard by analyzing meteorological, agricultural, and hydrological drought dynamics in Sweden. To achieve this, we defined drought-informed regimes, characterized dry periods in terms of intensity, duration, and frequency, and evaluated drought trends. A set of indicators was utilized to capture short- and long-term drought conditions, incorporating precipitation, evapotranspiration, soil moisture, and streamflow data for 39 635 sub-catchments in Sweden over the period from 1975 to 2021.
The conclusions from this study are the following:
-
Regional variation in drought severity and occurrence was observed across the five clusters of drought-informed regimes. Drought conditions occurred less often in clusters located in north-western Sweden, whereas catchments in the south-western and south-eastern parts of the country experienced moderate, severe and extreme dry periods more frequently. In addition to the north-south contrast, an east-west gradient was observed, with the catchments located in the north-eastern Sweden exhibiting dry conditions more often than the north-western catchments, though still less frequently than those in the south.
-
Dry periods were more frequently observed when assessed based on precipitation and evapotranspiration, highlighting the effect of temperature on water depletion through increased evapotranspiration. Notably, the most severe drought observed using soil moisture data occurred in 2018 and was likely a major factor contributing to the substantial crop losses reported during that period.
-
Central-eastern and south-eastern Sweden exhibited increasing frequency of dry periods as evaluated based on precipitation-evapotranspiration, soil moisture, and streamflow indicators. These regions also showed both annual and biennial trends of drying conditions for these indicators, with a similar pattern observed in autumn. In spring, however, the negative trend was evident across both south-eastern and south-western Sweden. In contrast, winter showed a tendency toward wetter conditions across the entire country.
Overall, this study provides novel insights by adopting a comprehensive approach to drought hazard, integrating climatological, agricultural, and hydrological perspectives to assess drought conditions across the country's diverse hydro-climatic regimes. By examining multiple dimensions of drought, results enhance our understanding of drought regional variability and the interconnected factors driving drought conditions. By characterizing dry periods and evaluating drought trends, this study contributes to a deeper understanding of drought hazard in Sweden and their consequences for water-dependent sectors. These results can contribute to the development of drought monitoring, early warning systems, reducing vulnerability, advance understanding of sector-specific impacts, and support the formulation of drought resilience strategies.
The HYPE model code, which was used in the national S-HYPE model setup, is available from the HYPEweb portal (https://hypeweb.smhi.se/model-water/ (last access: 10 August 2025); SMHI, 2025b). The meteorological data used for driving the S-HYPE model can be obtained upon contact with SMHI, and the hydrological data used are available from the Vattenwebb portal (https://vattenwebb.smhi.se/ (last access: 10 August 2025); SMHI, 2025c).
The R scripts used to compute the drought indicators, along with the resulting datasets, are openly available at a FAIR-aligned public repository via Zenodo: https://doi.org/10.5281/zenodo.16539105 (Canedo Rosso, 2025).
The supplement related to this article is available online at https://doi.org/10.5194/nhess-25-4577-2025-supplement.
The contact author has declared that none of the authors has any competing interests.
CCR conceived the study, performed the analysis, and prepared the manuscript. LN and IP contributed to data interpretation, discussion of results, and manuscript revision. All authors read and approved the final version of the paper.
Publisher's note: Copernicus Publications remains neutral with regard to jurisdictional claims made in the text, published maps, institutional affiliations, or any other geographical representation in this paper. While Copernicus Publications makes every effort to include appropriate place names, the final responsibility lies with the authors. Views expressed in the text are those of the authors and do not necessarily reflect the views of the publisher.
The study was supported by the Centre of Natural Hazards and Disaster Science (CNDS) and the Centre for Societal Risk Research (CSR) at Karlstad University. We gratefully acknowledge Swedish Meteorological and Hydrological Institute (SMHI) for providing the climatological and hydrological simulations utilized in this research.
This paper was edited by David J. Peres and reviewed by Antonia Longobardi and one anonymous referee.
Aldea, J., Dahlgren, J., Holmström, E., and Löf, M.: Current and future drought vulnerability for three dominant boreal tree species, Global Change Biology, 30, e17079, https://doi.org/10.1111/gcb.17079, 2023.
Bachmair, S., Stahl, K., Collins, K., Hannaford, J., Acreman, M., Svoboda, M., Knutson, C., Smith, K. H., Wall, N., Fuchs, B., Crossman, N. D., and Overton, I. C.: Drought indicators revisited: the need for a wider consideration of environment and society, WIREs Water, 3, 516–536, https://doi.org/10.1002/wat2.1154, 2016.
Barthel, R., Stangefelt, M., Giese, M., Nygren, M., Seftigen, K., and Chen, D.: Current understanding of groundwater recharge and groundwater drought in Sweden compared to countries with similar geology and climate, Geografiska Annaler Series A-Physical Geography, 103, 323–345, https://doi.org/10.1080/04353676.2021.1969130, 2021.
Becker, A., Finger, P., Meyer-Christoffer, A., Rudolf, B., Schamm, K., Schneider, U., and Ziese, M.: A description of the global land-surface precipitation data products of the Global Precipitation Climatology Centre with sample applications including centennial (trend) analysis from 1901–present, Earth Syst. Sci. Data, 5, 71–99, https://doi.org/10.5194/essd-5-71-2013, 2013.
Beguería, S. and Vicente Serrano, S. M.: SPEI: Calculation of the Standardized Precipitation-Evapotranspiration Index, version 1.8.1, the R Project for Statistical Computing, https://doi.org/10.32614/CRAN.package.SPEI, 2023.
Caloiero, T., Veltri, S., Caloiero, P., and Frustaci, F.: Drought Analysis in Europe and in the Mediterranean Basin Using the Standardized Precipitation Index, Water, 10, 1043, https://doi.org/10.3390/w10081043, 2018.
Campana, P. E., Zhang, J., Yao, T., Andersson, S., Landelius, T., Melton, F., and Yan, J.: Managing agricultural drought in Sweden using a novel spatially-explicit model from the perspective of water-food-energy nexus, Journal of Cleaner Production, 197, 1382–1393, https://doi.org/10.1016/j.jclepro.2018.06.096, 2018.
Canedo Rosso, C.: Drought indicators across Sweden (1975–2021) (R version 4.2.0 or later), Zenodo [data set], https://doi.org/10.5281/ZENODO.16539105, 2025.
Chen, D., Zhang, P., Seftigen, K., Ou, T., Giese, M., and Barthel, R.: Hydroclimate changes over Sweden in the twentieth and twenty-first centuries: a millennium perspective, Geografiska Annaler Series A-Physical Geography, 103, 103–131, https://doi.org/10.1080/04353676.2020.1841410, 2020.
Cook, B. I., Smerdon, J. E., Seager, R., and Coats, S.: Global warming and 21st century drying, Clim. Dynam., 43, 2607–2627, https://doi.org/10.1007/s00382-014-2075-y, 2014.
Crochemore, L., Ramos, M.-H., and Pechlivanidis, I. G.: Can Continental Models Convey Useful Seasonal Hydrologic Information at the Catchment Scale?, Water Resources Research, 56, e2019WR025700, https://doi.org/10.1029/2019WR025700, 2020.
Dai, A.: Characteristics and trends in various forms of the Palmer Drought Severity Index during 1900–2008, J. Geophys. Res., 116, D12115, https://doi.org/10.1029/2010JD015541, 2011a.
Dai, A.: Drought under global warming: a review, WIREs Climate Change, 2, 45–65, https://doi.org/10.1002/wcc.81, 2011b.
Douville, H., Raghavan, K., Renwick, J., Allan, R. P., Arias, P. A., Barlow, M., Cerezo-Mota, R., Cherchi, A., Gan, T. Y., Gergis, J., Jiang, D., Khan, A., Pokam Mba, W., Rosenfeld, D., Tierney, J., and Zolina, O.: Water Cycle Changes, in: Climate Change 2021: The Physical Science Basis. Contribution of Working Group I to the Sixth Assessment Report of the Intergovernmental Panel on Climate Change, edited by: Masson-Delmotte, V., Zhai, P., Pirani, A., Connors, S. L., Péan, C., Berger, S., Caud, N., Chen, Y., Goldfarb, L., Gomis, M. I., Huang, M., Leitzell, K., Lonnoy, E., Matthews, J. B. R., Maycock, T. K., Waterfield, T., Yelekçi, O., Yu, R., and Zhou, B., Cambridge University Press, Cambridge, United Kingdom and New York, NY, USA, 1055–1210, https://doi.org/10.1017/9781009157896.010, 2021.
Foghagen, C. and Alriksson, S.: Mitigation of water shortage impacts among tourism and farming companies on the islands of Öland and Gotland, Sweden, Environ. Dev. Sustain., 26, 7509–7527, https://doi.org/10.1007/s10668-023-03019-0, 2023.
Girons Lopez, M., Crochemore, L., and Pechlivanidis, I. G.: Benchmarking an operational hydrological model for providing seasonal forecasts in Sweden, Hydrol. Earth Syst. Sci., 25, 1189–1209, https://doi.org/10.5194/hess-25-1189-2021, 2021.
Girons Lopez, M., Bosshard, T., Crochemore, L., and Pechlivanidis, I. G.: Leveraging GCM-based forecasts for enhanced seasonal streamflow prediction in diverse hydrological regimes, Journal of Hydrology, 650, 132504, https://doi.org/10.1016/j.jhydrol.2024.132504, 2025.
Grusson, Y., Wesström, I., and Joel, A.: Impact of climate change on Swedish agriculture: Growing season rain deficit and irrigation need, Agricultural Water Management, 251, 106858, https://doi.org/10.1016/j.agwat.2021.106858, 2021.
Hagenlocher, M., Naumann, G., Meza, I., Blauhut, V., Cotti, D., Döll, P., Ehlert, K., Gaupp, F., Van Loon, A. F., Marengo, J. A., Rossi, L., Sabino Siemons, A. S., Siebert, S., Tsehayu, A. T., Toreti, A., Tsegai, D., Vera, C., Vogt, J., and Wens, M.: Tackling Growing Drought Risks—The Need for a Systemic Perspective, Earths Future, 11, e2023EF003857, https://doi.org/10.1029/2023EF003857, 2023.
Hartigan, J. A. and Wong, M. A.: Algorithm AS 136: A K-Means Clustering Algorithm, Applied Statistics, 28, 100, https://doi.org/10.2307/2346830, 1979.
Hartmann, D. L., Klein Tank, A. M. G., Rusticucci, M., Alexander, L. V., Brönnimann, S., Charabi, Y., Dentener, F. J., Dlugokencky, E. J., Easterling, D. R., Kaplan, A., Soden, B. J., Thorne, P. W., Wild , M., and Zhai, P. M.: Observations: Atmosphere and Surface, in: Climate Change 2013: The Physical Science Basis. Contribution of Working Group I to the Fifth Assessment Report of the Intergovernmental Panel on Climate Change, edited by: Stocker, T. F., Qin, D., Plattner, G.-K., Tignor, M., Allen, S. K., Boschung, J., Nauels, A., Xia, Y., Bex , V., and Midgley, P. M., Cambridge University Press, Cambridge, United Kingdom and New York, NY, USA, https://doi.org/10.1017/CBO9781107415324 (last access: 6 February 2025), 2013.
IPCC: Climate Change 2022: Impacts, Adaptation and Vulnerability. Contribution of Working Group II to the Sixth Assessment Report of the Intergovernmental Panel on Climate Change, edited by: Pörtner, H.-O., Roberts, D. C., Tignor, M. M. B., Poloczanska, E. S., Mintenbeck, K., Alegría, A., Craig, M., Langsdorf, S., Löschke, S., Möller, V., Okem, A., and Rama, B., Cambridge University Press, UK and New York, NY, USA, 3056 pp., https://doi.org/10.1017/9781009325844, 2022.
Jensen, M. E. and Haise, H. R.: Estimating Evapotranspiration from Solar Radiation, Journal of the Irrigation and Drainage Division, 89, 15–41, 1963.
JRC EDO: EDO indicator factsheet: Soil Moisture Anomaly (SMA), European Commission via the Copernicus European Drought Observatory (EDO) operated by the Joint Research Centre (JRC), https://drought.emergency.copernicus.eu/data/factsheets/factsheet_soilmoisture.pdf (last access: 29 April 2024), 2020a.
JRC EDO: EDO indicator factsheet: Standardized Precipitation Index (SPI), European Commission via the Copernicus European Drought Observatory (EDO) operated by the Joint Research Centre (JRC), https://drought.emergency.copernicus.eu/data/factsheets/factsheet_spi.pdf (last access: 26 January 2025), 2020b.
Kendall, M. G.: Rank correlation methods, 4. edn., 2. impr., Griffin, London, 202 pp., ISBN 9780852641996, 1975.
Lantmännen: Årets svenska skörd är bland de sämsta på 30 år [press release], https://www.lantmannen.se/om-lantmannen/press-och-nyheter/pressmeddelanden/2023/arets-svenska-skord-ar-bland-de-samsta-pa-30-ar/ (last access: 14 June 2024), 2024.
Lindström, G., Pers, C., Rosberg, J., Strömqvist, J., and Arheimer, B.: Development and testing of the HYPE (Hydrological Predictions for the Environment) water quality model for different spatial scales, Hydrology Research, 41, 295–319, https://doi.org/10.2166/nh.2010.007, 2010.
MacQueen, J.: Some methods for classification and analysis of multivariate observations, in: Proceedings of the Fifth Berkeley Symposium on Mathematical Statistics and Probability, Volume 1: Statistics, vol. 5.1, University of California Press, 281–298, https://projecteuclid.org/Proceedings/berkeley-symposium-on-mathematical-statistics-and-probability/ (last access: 26 March 2024), 1967.
Mann, H. B.: Nonparametric Tests Against Trend, Econometrica, 13, 245, https://doi.org/10.2307/1907187, 1945.
McKee, T. B., Doesken, N. J., and Kleist, J.: The relationship of drought frequency and duration of time scales, Eighth Conference on Applied Climatology, Anaheim, California, 1979–1986, https://www.scirp.org/reference/ReferencesPapers?ReferenceID=2099290 (last access: 23 March 2023), 1993.
Mishra, A. K. and Singh, V. P.: A review of drought concepts, Journal of Hydrology, 391, 202–216, https://doi.org/10.1016/j.jhydrol.2010.07.012, 2010.
Modarres, R.: Streamflow drought time series forecasting, Stoch. Environ. Res. Risk Assess., 21, 223–233, https://doi.org/10.1007/s00477-006-0058-1, 2007.
Muthiah, M., Sivarajan, S., Madasamy, N., Natarajan, A., and Ayyavoo, R.: Exploring short- and long-term meteorological drought parameters in the Vaippar Basin of Southern India, Sci. Rep., 14, 13428, https://doi.org/10.1038/s41598-024-62095-y, 2024.
Rousseeuw, P. J.: Silhouettes: A graphical aid to the interpretation and validation of cluster analysis, Journal of Computational and Applied Mathematics, 20, 53–65, https://doi.org/10.1016/0377-0427(87)90125-7, 1987.
SGU: Lägst uppmätta grundvattennivåer, The Geological Survey of Sweden (SGU), https://www.sgu.se/grundvatten/grundvattennivaer/om-grundvattennivaer/lagst-uppmatta-grundvattennivaer/ (last access: 10 August 2025), 2020.
Sheffield, J., Wood, E. F., and Roderick, M. L.: Little change in global drought over the past 60 years, Nature, 491, 435–438, https://doi.org/10.1038/nature11575, 2012.
Sjöstrand, K., Lindhe, A., Söderqvist, T., Dahlqvist, P., and Rosén, L.: Marginal Abatement Cost Curves for Water Scarcity Mitigation under Uncertainty, Water Resour. Manage., 33, 4335–4349, https://doi.org/10.1007/s11269-019-02376-8, 2019.
SMHI: Nederbörds- och humiditetsklimat i Sverige under vegetationsperioden, Bertil Eriksson, Swedish Meteorological and Hydrological Institute (SMHI), Norrköping, Sweden, Reports on Meteorology and Climatology RMK 46, ISSN 0347-2116, https://www.smhi.se/publikationer-fran-smhi/sok-publikationer/ (last access: 10 August 2025), 1986.
SMHI: Väder och Vatten 1994, Carla Eggertsson Karlström, Swedish Meteorological and Hydrological Institute (SMHI), Norrköping, Sweden, ISSN 0281-9619, https://www.smhi.se/publikationer-fran-smhi/sok-publikationer/1994-12-30-vader-och-vatten-1994 (last access: 10 August 2025), 1994.
SMHI: Vattenåret 2003, Torbjörn Jutman, Swedish Meteorological and Hydrological Institute (SMHI), Norrköping, Sweden, Faktablad N 18, https://www.smhi.se/publikationer-fran-smhi/sok-publikationer/2004-05-25-vattenaret-2003 (last access: 10 August 2025), 2004.
SMHI: Temperatur och nederbörd – Juli 2006, Swedish Meteorological and Hydrological Institute (SMHI), https://www.smhi.se/klimat/klimatet-da-och-nu/manadens-vader-och-vatten-i-sverige/manadens-vader-och-vatten-i-sverige/2006-08-02-juli-2006---temperatur-och-nederbord (last access: 10 August 2025), 2006a.
SMHI: Vattenföring, markvatten och grundvatten – Juli 2006, Swedish Meteorological and Hydrological Institute (SMHI), https://www.smhi.se/klimat/klimatet-da-och-nu/manadens-vader-och-vatten-i-sverige/manadens-vader-och-vatten-i-sverige/2006-08-02-juli-2006---vattenforing-markvatten-och-grundvatten (last access: 10 August 2025), 2006b.
SMHI: Klimatanpassning: Torka, Swedish Meteorological and Hydrological Institute (SMHI), https://www.klimatanpassning.se/hur-klimatet-forandras/klimateffekter/torka-1.21291 (last access: 21 May 2024), 2024.
SMHI: Historiska torrperioder, Swedish Meteorological and Hydrological Institute (SMHI), https://www.smhi.se/kunskapsbanken/hydrologi/historiska-torrperioder (last access: 10 August 2025), 2025a.
SMHI: HYPEwebb, Swedish Meteorological and Hydrological Institute (SMHI), https://hypeweb.smhi.se/model-water/ (last access: 10 August 2025), 2025b.
SMHI: Vattenwebb, Swedish Meteorological and Hydrological Institute (SMHI), https://www.smhi.se/data/sjoar-och-vattendrag/vattenwebb (last access: 10 August 2025), 2025c.
Spinoni, J., Naumann, G., Carrao, H., Barbosa, P., and Vogt, J.: World drought frequency, duration, and severity for 1951-2010: WORLD DROUGHT CLIMATOLOGIES FOR 1951-2010, Int. J. Climatol., 34, 2792–2804, https://doi.org/10.1002/joc.3875, 2014.
Spinoni, J., Naumann, G., Vogt, J., and Barbosa, P.: European drought climatologies and trends based on a multi-indicator approach, Global and Planetary Change, 127, 50–57, https://doi.org/10.1016/j.gloplacha.2015.01.012, 2015.
SCB and Jordbruksverket: Statistiska Meddelanden – Skörd av spannmål, trindsäd, oljeväxter och slåttervall 2018, the Swedish Statistical Office (SCB) and Jordbruksverket, JO 19 SM 1802, ISSN 1654-4226, 2018.
SVT: Fem av de värsta somrarna de senaste 100 åren, SVT Nyheter, 9 July 2018.
Swedish Ministry of the Environment: Sweden's Adaptation Communication – A report to the United Nations Framework Convention on Climate Change, Regeringen och Regeringskansliet, Stockholm, Sweden, https://www.svt.se/nyheter/inrikes/fem-av-de-varsta-torkorna-de-senaste-100-aren (last access: 10 August 2025), 2022.
Teutschbein, C., Albrecht, F., Grabs, T., and Blicharska, M.: A culture of proactive drought management? Unraveling the perception and management of droughts in Swedish municipalities, EGU General Assembly 2020, Online, 4–8 May 2020, EGU2020-18879, https://doi.org/10.5194/egusphere-egu2020-18879, 2020.
Teutschbein, C., Quesada Montano, B., Todorović, A., and Grabs, T.: Streamflow droughts in Sweden: Spatiotemporal patterns emerging from six decades of observations, Journal of Hydrology-Regional Studies, 42, 101171, https://doi.org/10.1016/j.ejrh.2022.101171, 2022.
Teutschbein, C., Albrecht, F., Blicharska, M., Tootoonchi, F., Stenfors, E., and Grabs, T.: Drought hazards and stakeholder perception: Unraveling the interlinkages between drought severity, perceived impacts, preparedness, and management, Ambio, 52, 1262–1281, https://doi.org/10.1007/s13280-023-01849-w, 2023a.
Teutschbein, C., Jonsson, E., Todorović, A., Tootoonchi, F., Stenfors, E., and Grabs, T.: Future drought propagation through the water-energy-food-ecosystem nexus – A Nordic perspective, Journal of Hydrology, 617, 128963, https://doi.org/10.1016/j.jhydrol.2022.128963, 2023b.
Tian, L., Zhang, B., and Wu, P.: A global drought dataset of standardized moisture anomaly index incorporating snow dynamics (SZIsnow) and its application in identifying large-scale drought events, Earth Syst. Sci. Data, 14, 2259–2278, https://doi.org/10.5194/essd-14-2259-2022, 2022.
UNDRR: GAR Special report on drought 2021, United Nations Office for Disaster Risk Reduction, Geneva, Switzerland, 173 pp., 2021.
Van Loon, A. F., Kchouk, S., Matanó, A., Tootoonchi, F., Alvarez-Garreton, C., Hassaballah, K. E. A., Wu, M., Wens, M. L. K., Shyrokaya, A., Ridolfi, E., Biella, R., Nagavciuc, V., Barendrecht, M. H., Bastos, A., Cavalcante, L., De Vries, F. T., Garcia, M., Mård, J., Streefkerk, I. N., Teutschbein, C., Tootoonchi, R., Weesie, R., Aich, V., Boisier, J. P., Di Baldassarre, G., Du, Y., Galleguillos, M., Garreaud, R., Ionita, M., Khatami, S., Koehler, J. K. L., Luce, C. H., Maskey, S., Mendoza, H. D., Mwangi, M. N., Pechlivanidis, I. G., Ribeiro Neto, G. G., Roy, T., Stefanski, R., Trambauer, P., Koebele, E. A., Vico, G., and Werner, M.: Review article: Drought as a continuum – memory effects in interlinked hydrological, ecological, and social systems, Nat. Hazards Earth Syst. Sci., 24, 3173–3205, https://doi.org/10.5194/nhess-24-3173-2024, 2024.
Vicente-Serrano, S. M., Beguería, S., and López-Moreno, J. I.: A Multiscalar Drought Index Sensitive to Global Warming, Journal of Climate, 23, 1696–1718, https://doi.org/10.1175/2009JCLI2909.1, 2010.
Wilhite, D. A. and Glantz, M. H.: Understanding: the Drought Phenomenon: The Role of Definitions, Water International, 10, 111–120, https://doi.org/10.1080/02508068508686328, 1985.
Xu, Y., Wang, L., Ross, K., Liu, C., and Berry, K.: Standardized Soil Moisture Index for Drought Monitoring Based on Soil Moisture Active Passive Observations and 36 Years of North American Land Data Assimilation System Data: A Case Study in the Southeast United States, Remote Sensing, 10, 301, https://doi.org/10.3390/rs10020301, 2018.
Yevjevich, V. M.: An objective approach to definitions and investigations of continental hydrologic droughts, Colorado State University Fort Collins, CO, USA, http://hdl.handle.net/10217/61303 (last access: 20 August 2024), 1967.