the Creative Commons Attribution 4.0 License.
the Creative Commons Attribution 4.0 License.
 | 13 Nov 2025
The EAWS matrix, a decision support tool to determine the regional avalanche danger level (Part A): conceptual development
Frank Techel
Christoph Mitterer
Avalanche forecasting is central to managing risk in snow-covered mountain regions. Standards for regional avalanche forecasting were initially developed at national levels. The introduction of the five-level European Avalanche Danger Scale (EADS) in 1993, still in use today, marked a milestone in harmonizing the assessment and communication of avalanche danger. Since then, both forecasting concepts and terminology have evolved. In this study, we present the updated European Avalanche Warning Services (EAWS) Matrix – a consensus-based decision-support tool developed to support consistent and transparent danger level assessments across Europe. The Matrix links three key factors – snowpack stability, its frequency, and avalanche size – to the five danger levels of the EADS. We describe the participatory development process involving avalanche forecasters from across Europe, including expert surveys and operational testing over three winters. The updated Matrix reflects current best practices in regional avalanche forecasting in Europe and complements the Conceptual Model of Avalanche Hazard (CMAH), while avoiding ambiguous likelihood terminology. Its design aligns with the operational forecasting workflow and explicitly addresses inherent uncertainties. We highlight key findings, such as persistent challenges in reliably assessing the factor classes, uncertainty in danger level assignment around certain transition zones, and the need for clearer definitions and better data. Finally, we argue that the Matrix, now adopted as an EAWS standard, provides a robust foundation for future revisions of the European Avalanche Danger Scale.
- Article
(3798 KB) - Full-text XML
- Companion paper
- BibTeX
- EndNote


Snow avalanches represent a natural hazard in snow-covered, mountainous regions. Avalanches may lead to injury or loss of life, and can cause damage or destroy property and infrastructure. For instance, in Europe in the 50 years between 1974–2023, more than 5900 (annual mean: 118) people have died in avalanches (EAWS, 2023a). To reduce adverse effects resulting from avalanches, avalanche warning services disseminate regional avalanche forecasts to inform and warn the general public as well as local authorities in charge of avalanche risk management, on current and expected avalanche conditions.
The assessment of current and future avalanche conditions involves the analysis of a wide variety of heterogeneous data, including field observations, measurements, models, and weather forecasts. Although the interpretation of snow and weather parameters follows a deterministic cause-and-effect approach, actual forecasting decisions are reached using inductive logic (LaChapelle, 1980). Thus, the quality of avalanche forecasts is influenced by a combination of factors, including the forecaster's experience and reliability (Stewart and Lusk, 1994; McClung, 2002), as well as the dynamic nature of the snowpack, which varies spatially and temporally (Schweizer et al., 2008). Due to the inherent uncertainty in predicting the exact timing and location of avalanche events and due to a lack of relevant data, the assessment of avalanche danger remains mainly of qualitative nature. Unlike weather forecasting, which is commonly focused on the precise prediction of numerical variables like air temperature or precipitation amounts, the complex and multifaceted nature of avalanches are assessed and communicated using symbolic representations, encompassing danger levels, classes, terms, and text (Hutter et al., 2021).
In regional avalanche forecasting, the focus of this study, the severity of expected avalanche conditions is summarized using the concept of danger levels. Despite advances in model-driven predictions of avalanche danger levels (e.g. Giraud, 1992; Pérez-Guillén et al., 2022), assigning danger levels has remained primarily a subjective process. Complete consensus between individual forecasters is unattainable, but random variations inherent to human judgment should be minimized. Consistency between a forecaster's best judgment and the forecasts they produce is as important as consistency between forecasters, as both directly impact the quality of forecasts (Murphy, 1993; Stewart, 2001). High consistency are a prerequisite to accurate forecasts, which in turn enhance their value to decision-makers (Murphy, 1993). Consequently, high-quality forecasts can increase safety when recreating in avalanche terrain and contribute to reducing avalanche-related damage and loss.
Avalanche forecasts are structured as an information pyramid, with the most synthesized information – the danger level (D) – at the top (EAWS, 2023c). The importance of D for decision-making in avalanche terrain has been shown in numerous studies, including, for instance, during the trip planning stage (e.g. Morgan et al., 2023), impacting the decision whether to ski a slope or not (e.g. Furman et al., 2010), or the correlation between the forecast danger level and avalanche risk during backcountry skiing (e.g. Techel et al., 2015; Winkler et al., 2021). Given the importance of avalanche danger levels to support decision-making for avalanche forecast users, ensuring consistent assignment of danger levels is paramount. Yet, considerable variation persists between forecasters from different or neighboring warning services (Lazar et al., 2016; Techel et al., 2018) but also within warning services (Techel et al., 2024). Additionally, inconsistencies persist when describing dry- and wet-snow avalanche conditions in terms of the likelihood and size of natural avalanches (Clark, 2019; Hutter et al., 2021).
Several standards and tools have been developed within the European Avalanche Warning Services (EAWS) and related organizations to structure the process of public regional avalanche forecasting. However, some of these frameworks date back more than 30 years, during which both knowledge and terminology have significantly evolved. To enhance consistency in the assessment of regional avalanche danger levels across forecasters and warning services, the EAWS launched a coordinated initiative to revise the core components guiding such assessments. As part of this effort, a dedicated EAWS working group redefined the factors determining the avalanche danger level (D) and established a shared operational workflow to support its assessment (EAWS, 2022b; Müller et al., 2023). In parallel, the EAWS Matrix – a central decision aid for assigning danger levels in many European warning services for almost ten years – was revised to align with the updated definitions and terminology. This process unfolded in three steps:
-
Conceptual and methodological development. Definition of key assessment factors and initial revision of the Matrix and workflow. This package of definitions, workflow, and Matrix was formally adopted by the EAWS General Assembly in 2022 (EAWS, 2022b).
-
Operational testing. Evaluation of the revised Matrix, workflow, and assessment factors under real operational forecasting conditions, presented in two separate analyses (Techel et al., 2024, 2025a).
-
Refinement and integration. Targeted adjustments based on findings from the operational testing phase, resulting in a consolidated Matrix. The proposed changes were formally adopted by the EAWS General Assembly in 2025.
This iterative exchange between methodological development and operational practice was instrumental in enhancing the clarity, usability, and consistency of the Matrix across forecasters and warning services. It also highlights the importance of structured evaluation in the development of forecasting tools.
The goal of this paper is to document the multi-stage development of the new EAWS Matrix and its accompanying workflow, to present the final revised Matrix, and to provide a critical reflection supporting future refinements and the further evolution of the European avalanche danger scale.
The development process has the following components outlined in two papers, this paper and Techel et al. (2025a):
-
Background (Sect. 2). Overview of existing standards for assessing regional avalanche danger in Europe and North America, with particular focus on the avalanche danger scale and the evolution of various look-up tables supporting danger level assignment. This section outlines the rationale for revising the Matrix.
-
Development step 1: Definitions (Sect. 3). Establishing shared definitions for the key factors that determine avalanche danger.
-
Development step 2: Forecaster survey (Sect. 4). A Europe-wide survey among avalanche forecasters to align the EAWS Matrix with updated terminology and definitions, deriving a revised Matrix grounded in current practice and supported by collective judgment.
-
Development step 3: Operational testing (Sect. 5). Key lessons from two companion analyses (Techel et al., 2024, 2025a) and their implications for further refinements. Techel et al. (2024) examined the reliability of estimating the input factors to the Matrix, and Techel et al. (2025a) focused on how the Matrix was used in day-to-day forecasting operations. The two studies were published separately to keep this paper focused.
-
The EAWS Matrix, its usage and limitations (Sect. 6). Presentation of the revised Matrix and accompanying workflow as adopted by EAWS in 2025, critical reflection on limitations, and discussion of integration into the broader conceptual framework of standards used in regional avalanche forecasting in North America.
2.1 The European Avalanche Danger Scale
Avalanche bulletins have been published since the winter 1945/46 in Switzerland. Although neither standardized nor defined nor used in a consistent manner, avalanche danger was already described in winter 1951/52 in Switzerland as being low, moderate, considerable, high and very high, sometimes in connection with modifiers like general and local (e.g. SLF, 1953, p. 68ff). A first description of the danger levels used in Switzerland was published in 1985 (Föhn, 1985), allowing consistent use by forecasters and transparent communication to users. Similarly, in France, eight typical avalanche situations were used to assess and communicate avalanche conditions (Giraud et al., 1987). These were later on also used in Italy. Despite the formation of a European Avalanche Warning Services (EAWS) working group in 1983, which aimed to promote cooperation across national borders, the Alpine countries France, Italy, Switzerland, Germany and Austria continued to use their own danger scales with a varying number of six to eight danger levels (Mitterer and Mitterer, 2018). In 1993, the EAWS introduced the five-level European Avalanche Danger Scale (EADS, SLF, 1993; Meister, 1995), which was largely based on the wording and definitions used in Switzerland (Föhn, 1985). This adoption of a standardized danger scale marked a pivotal moment for international avalanche warning services, simplifying procedures for all parties involved, and facilitating communication of avalanche danger particularly for forecast users when traveling to different countries (Meister, 1995). Except for minor tweaks in 1994, the EADS has remained unchanged and has provided a common way of expressing the avalanche danger level across institutions and borders. Thus, impacting “the forecasting process itself, as all forecasters are working to an agreed, common, and at least nominally binding definition of avalanche danger.” (Techel et al., 2018, p. 2698).
The EADS uses two columns to describe each danger level (Table 1). The first column describes snowpack stability and includes a qualitative indication of the frequency of the respective locations. The second column describes the likelihood of triggering an avalanche by indicating the typical avalanche size and their distributions, the likelihood of natural avalanches occurring or the typical load required to trigger an avalanche. Frequency of avalanches and potential triggering locations or the likelihood of avalanche release are again described qualitatively.
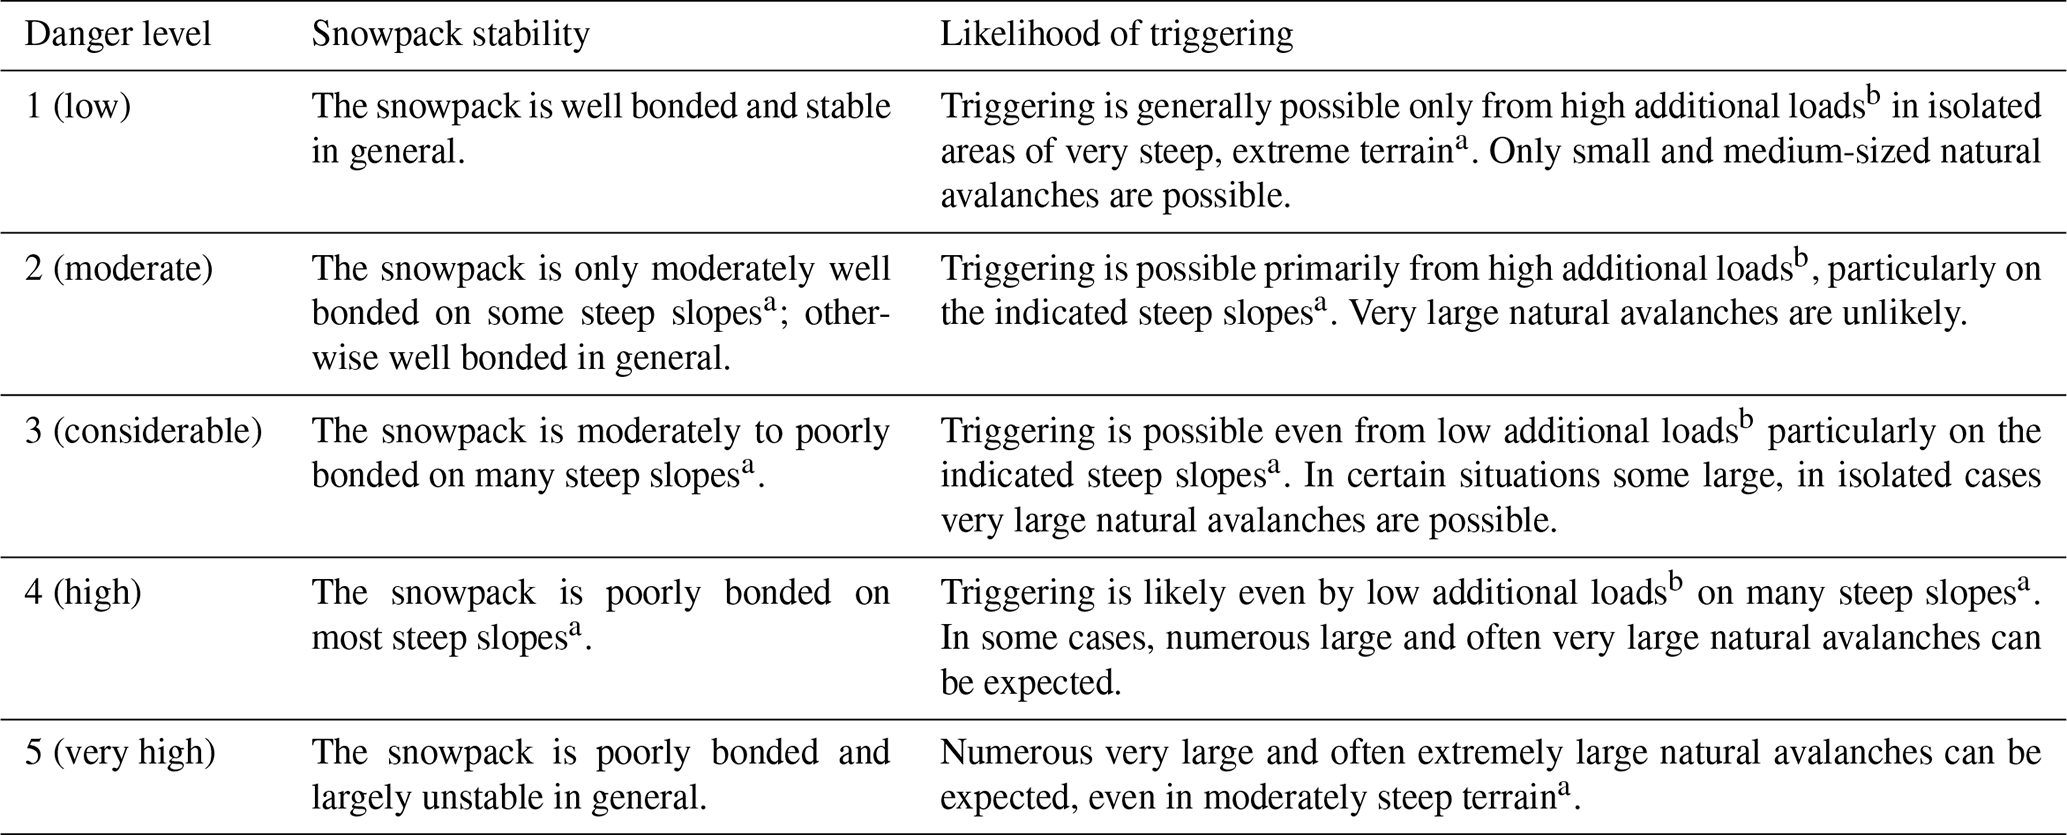
a The avalanche-prone locations are described in greater detail in the avalanche forecast (elevation, slope aspect, type of terrain): moderately steep terrain: slopes shallower than about 30°; steep slopes: slopes steeper than about 30°; very steep, extreme terrain: particularly adverse terrain related to slope angle (more than about 40°), terrain profile, proximity to ridge, smoothness of underlying ground surface.
b Additional loads: low: individual skier/snowboarder, riding softly, not falling; snowshoer; group with good spacing (minimum 10 m) keeping distances. high: two or more skiers/snowboarders etc. without good spacing (or without intervals); snowmachine; explosives. natural: without human influence.
The EADS has several shortcomings as a tool to summarize avalanche conditions in a region:
-
The terminology in the EADS is vague, leaving ample room for interpretation. For instance, clear definitions for classes describing snowpack stability and the frequency of triggering locations are lacking.
-
Qualitative terms expressing probability or uncertainty are not defined, which according to Morgan (2017) is inadequate as the same term can have different meaning to different people, but also to the same person in a different context. Not surprisingly, even among avalanche professionals large differences in numeric estimates of probability were observed (Thumlert et al., 2020).
-
The load necessary to trigger an avalanche is correlated to snowpack stability (Schweizer and Camponovo, 2001). Thus, both columns in the EADS contain similar and redundant information on snowpack stability and triggering.
-
The short descriptions of each danger level do not cover the range of all possible combinations. For instance, snowpack stability decreases from moderately well bonded to moderately to poorly bonded from 2 (moderate) to 3 (considerable) while its frequency increases from some to many steep slopes. But the EADS does not provide guidance when the situation is best described by a snowpack that is moderately to poorly bonded on some steep slopes.
-
When the EADS was translated into other languages, sometimes deviations from the original (German) text were introduced. Moreover, it is possible that individual warning services have developed their own guidelines on how to interpret the danger levels over the years, which may be one source for the observed differences in the use of the danger levels in the European Alps (Techel et al., 2018).
Due to these shortcomings, the European Avalanche Danger Scale (EADS) is currently undergoing revision. The updated version will address the identified issues and align the scale with the terminology and definitions currently adopted by EAWS for describing avalanche danger. Moreover, the revised EADS will need to be integrated with the operational forecasting workflow and the EAWS Matrix presented in this paper.
2.2 North American Public Avalanche Danger Scale and the Conceptual model of avalanche hazard
The EADS was, with minor adjustments, adopted in North America in 1994 (Dennis and Moore, 1996). It was used until 2007, when the North American Public Avalanche Danger Scale (NAPADS) was introduced by Statham et al. (2010). In contrast to the EADS, the NAPADS, was intended and designed for public communication only. This revision also triggered work on a general concept for avalanche hazard assessment resulting in the Conceptual Model of Avalanche Hazard (CMAH, Statham et al., 2018). The CMAH identifies the key components of avalanche hazard and structures them into a systematic, consistent workflow for hazard assessments. The method is applicable to all types of avalanche forecasting operations, and the underlying principles can be applied at any scale in space or time (Statham et al., 2018). The workflow sequentially addresses the four questions: “What type of avalanche problem(s) exists? Where are these problems located in the terrain? How likely is it that an avalanche will occur? and How big will the avalanche be?” (Statham et al., 2018, p. 671). While the CMAH has become the standard workflow for avalanche forecasting in North America, it was comparably slowly adopted in regional avalanche forecasting in Europe despite there being a general agreement with the concept. Potential reasons for this slow uptake likely include: (i) The CMAH does (deliberately) not conclude with a danger level (Statham et al., 2018). (ii) The CMAH described the locations and spatial distribution of the avalanche problem rather than solely assessing snowpack stability. Analyses in Europe clearly distinguished between the frequency of points with a certain snowpack stability (potential triggering spots) and their actual location (e.g. close to ridge lines, in bowls, …) (Schweizer et al., 2020b; Techel et al., 2020; Hutter et al., 2021) stating that only the frequency component is relevant for determining the danger level. And lastly, (iii) while the terminology used in the CMAH worked well in the English language, it worked poorly in many European languages (Müller et al., 2016).
Avalanche problems, such as persistent weak layers or wind slabs, describe typical avalanche scenarios and are integral to the CMAH and the avalanche danger assessment. They are defined as a “set of factors that describe the avalanche hazard” (Statham et al., 2018). These factors include the sensitivity to triggers, spatial distribution and avalanche size in the terminology of the CMAH. The naming convention for avalanche problems differs slightly between North America and Europe, but are generally congruent in operational applications (EAWS, 2025).
2.3 Historic development of the EAWS Matrix
The avalanche danger scale offers brief descriptions of the five danger levels, including typical values for the key factors that define each level. However, they lack clarity on the subtleties and do not specify exactly when a transition from one danger level to the next should occur. To address this limitation, look-up tables were introduced with the goal of explicitly linking danger levels to all possible combinations of the determining factors. Compared to the scale alone, these tables provide clearer and more comprehensive guidance for assigning danger levels. The intention is to achieve more consistent application of the scale and aims to harmonize danger level assessments among European avalanche forecasters.
The first look-up table formally adopted by the EAWS was the so-called Bavarian Matrix (BM), developed by Bavarian forecasters in 2003 (see Fig. B1 in the Appendix). The BM was split into two sub-matrices: one relating to the potential for human-triggered avalanches and the other to natural avalanche occurrence. Relying on the terminology of the EADS, a danger level was indicated for each possible combination describing the probability of avalanche release and the distribution of hazardous sites within the two sub-matrices. The main benefit of the BM was that it provided a suggestion for scenarios for which the EADS provided no guidance. However, the BM inherited the short-comings noted for the EADS as the factors determining avalanche danger, like spatial distribution, avalanche size and probability, were still not clearly separated nor defined.
In 2016, Müller et al. (2016) attempted to bridge the gap between the concepts introduced in the CMAH and the structure of the Bavarian Matrix leading to the proposition of the Avalanche Danger Assessment Matrix (ADAM; see also Fig. B2 in the Appendix). This was the first attempt to tailor the CMAH to the specific needs of European public avalanche forecasters – an approach that laid the foundation for subsequent iterations of the EAWS Matrix. ADAM provided a workflow similar to the one suggested by the CMAH and integrated the concept of the spatial distribution in the assessment process. ADAM avoided the issue of the poorly defined probability terms used in the EADS by first evaluating snowpack stability against its spatial distribution separately, resulting in a likelihood-score ranging from unlikely to very likely when merging them. In a further step, likelihood is combined with avalanche size resulting in a danger level. ADAM was presented in two versions, one using the terminology in line with EADS and another one using the terminology from the CMAH. Thus, ADAM also provided a first translation between the terminologies of EADS and CMAH.
At about the time when Müller et al. (2016) developed ADAM, a working group of EAWS presented an updated version of the BM in 2017, which we refer to as EAWS-Matrix-v2017. This matrix introduced avalanche size as a separate dimension, and, thus, allowed forecasters to adjust the danger level described by the distribution of hazardous sites and the probability of avalanche release. However, most identified shortcoming of the EADS and BM were still present in the EAWS Matrix.
Covering the dimensions of snowpack stability (sensitivity to triggers), frequency (spatial distribution), and avalanche size, ADAM, the EAWS Matrix, and their later iterations can be seen as a specialized adaptation of the CMAH hazard chart (Fig. C1), tailored specifically to the needs of regional public avalanche forecasters.
In North America, Thumlert et al. (2020) proposed numerical values to five likelihood terms, which were related to the frequency of natural avalanches releasing in 100 avalanche paths. The five likelihood terms differed compared to any of the other scales in use. Based on the concept presented in ADAM, Thumlert et al. (2020) combined these likelihood terms with avalanche size, introducing a first North American version of an avalanche danger assessment matrix (see also Fig. B3 in the Appendix).
Common to all the above mentioned matrices was that they were exclusively based on expert judgments and had been designed by small groups of forecasters (sometimes from only one or two warning services). As a result, avalanche forecasters in Europe did not use a common matrix when assigning a danger level; instead each warning service had a preference for one of the three matrices (BM, EAWS-Matrix-v2017, ADAM) or none. What was lacking was either data or a consensus within the European avalanche forecaster community on how to resolve the current issues. Consequently, Techel et al. (2020) tackled this issue and derived a first data-based characterization of the factors determining avalanche danger, which they termed snowpack stability, the frequency distribution of snowpack stability, and avalanche size. Analyzing a large data set of stability tests and avalanche observations from Switzerland and Norway, Techel et al. (2020) showed that the frequency of the locations with the lowest snowpack stability increased with increasing danger level. However, a similarly clear correlation between avalanche size and danger level was not evident. It was observed that the size of the largest avalanche per day and warning region increased only for the higher danger levels. Building upon these insights and drawing inspiration from the matrix layout employed in ADAM, Techel et al. (2020) introduced a data-driven matrix. This new matrix utilized simulated stability distributions along with information on the largest avalanche size (refer to Fig. B4 in the Appendix).
The terminology used in the European Avalanche Danger Scale (EADS) and the EAWS Matrix lacked clear and consistent definitions. As a first step in the development process, we clarified these terms and established common definitions to ensure a shared understanding among European regional avalanche forecasters. With these definitions in place, forecasters from across Europe were asked to assign a danger level to all possible combinations of the defined factors and their respective classes (Sect. 4).
3.1 Definition of factors determining avalanche danger (levels)
Following the developments described in Sect. 2.3, a working group of the EAWS adopted the concept and terminology used in Techel et al. (2020) for the factors determining avalanche danger, namely snowpack stability, the frequency of snowpack stability, and avalanche size, and provided the following definitions for these factors and their respective classes (EAWS, 2025):
-
The avalanche danger level is a function of snowpack stability, the frequency distribution of snowpack stability and avalanche size for a given unit (area and time). There are five avalanche danger levels: 5 (very high), 4 (high), 3 (considerable), 2 (moderate), 1 (low).
-
Snowpack stability is a local property of the snowpack, measured at individual point locations, describing the propensity of a snow-covered slope to avalanche (Reuter and Schweizer, 2018). Snowpack stability is described using four classes (Table 2, Figs. A1–A3).
-
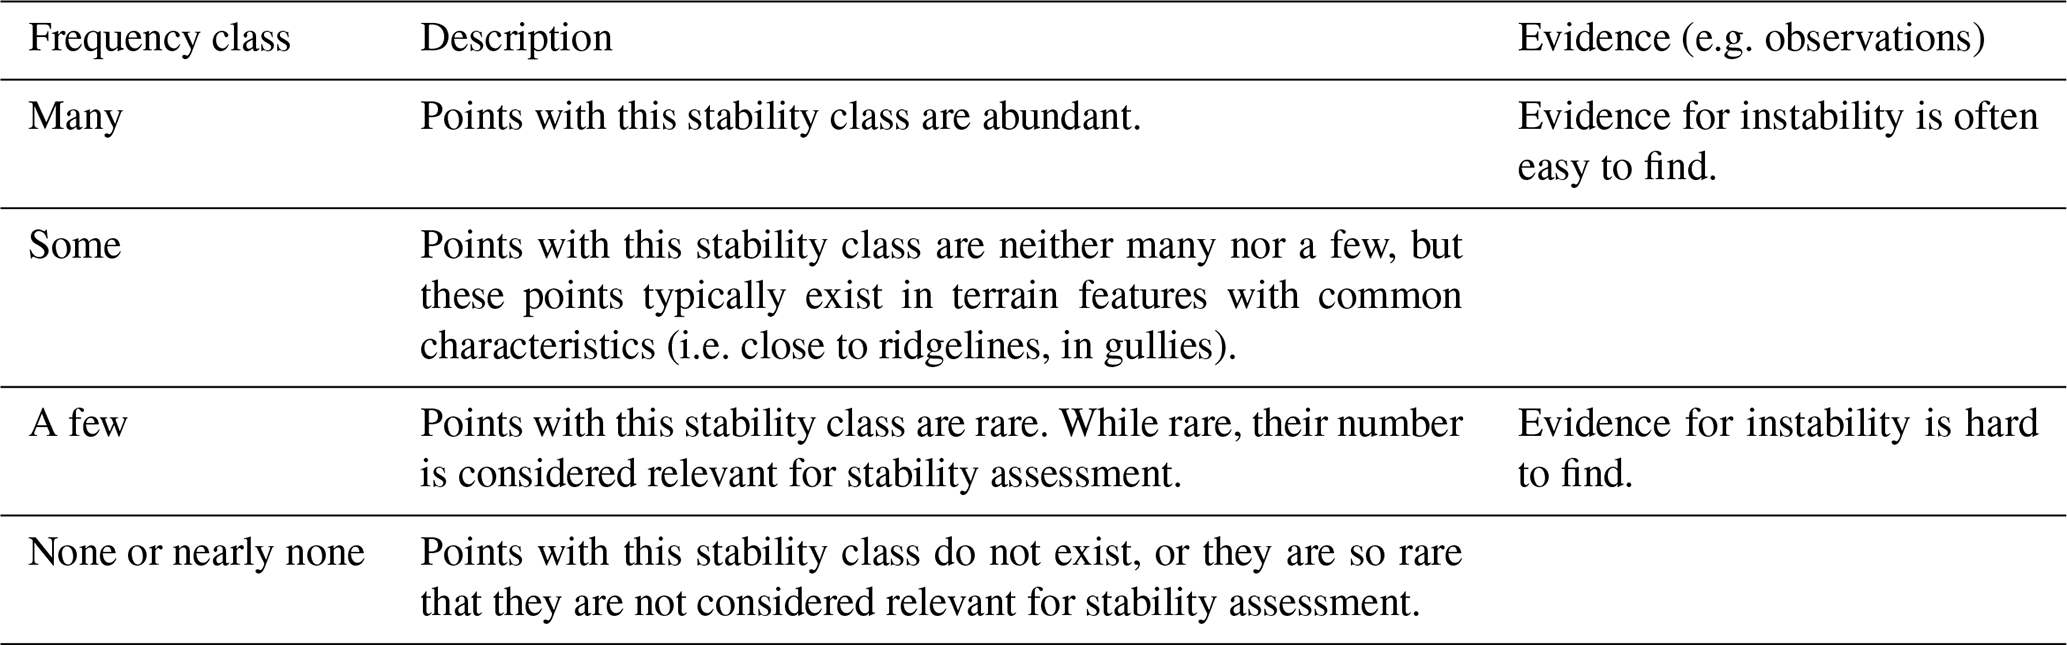
The frequency distribution of snowpack stability describes the percentages of points for each stability class relative to all points in avalanche terrain. Thus, the frequency f for all points with stability class i (ni) compared to all points (n) is . The frequency distribution of snowpack stability is described in four classes (Table 3).
-
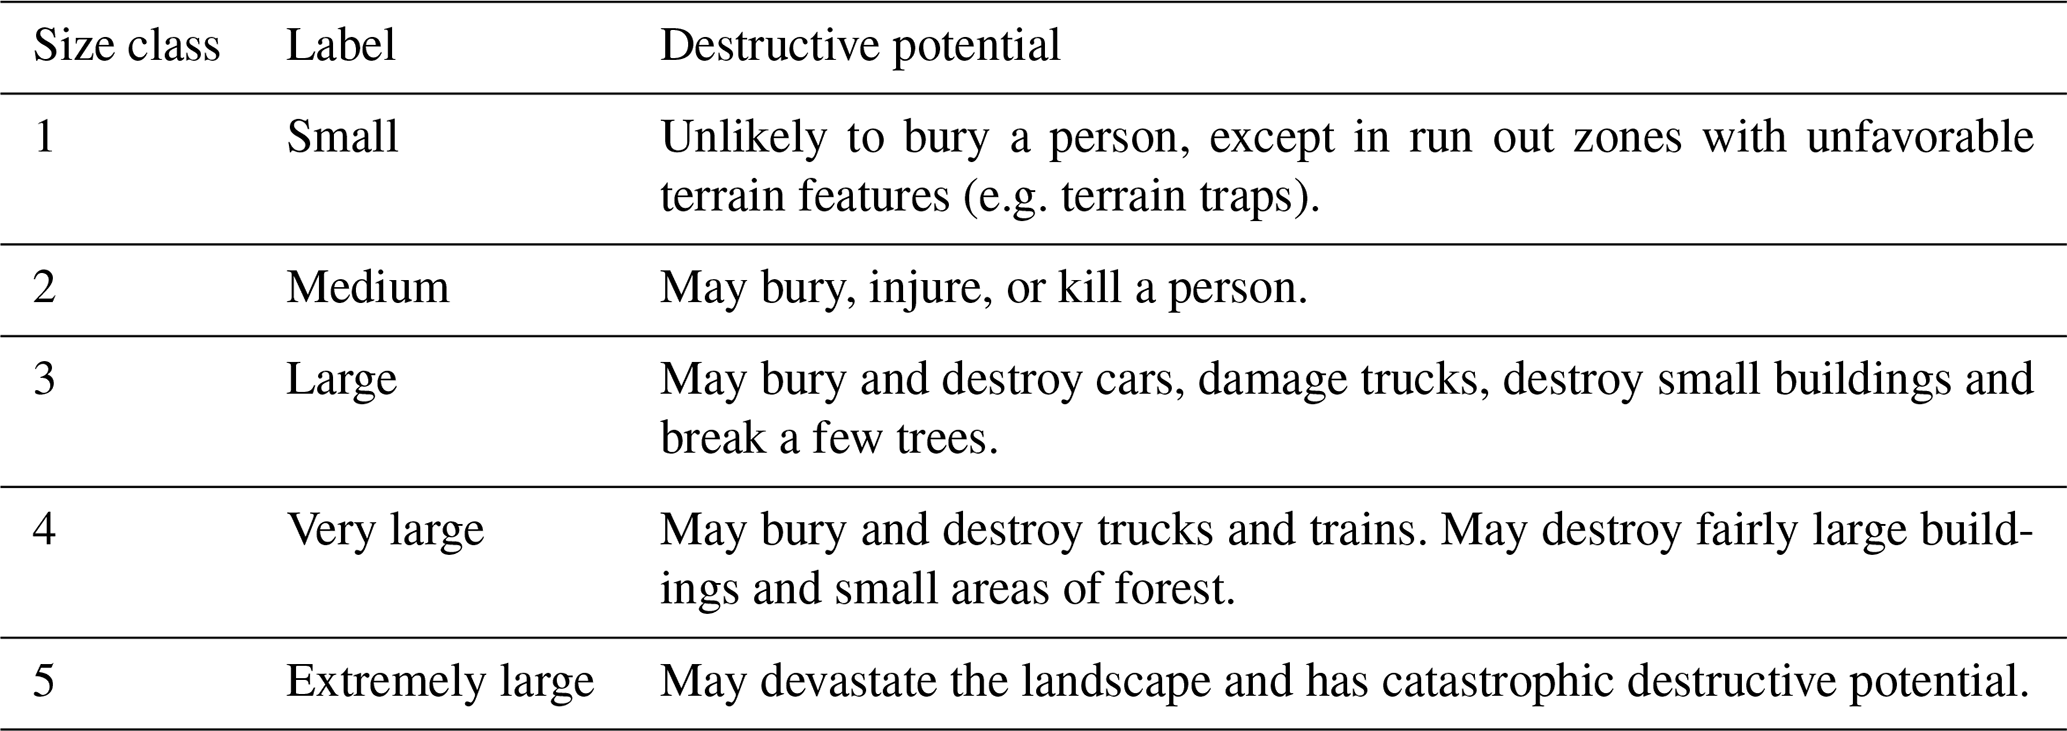
Avalanche size describes the destructive potential of avalanches (Table 4).
Table 2Snowpack stability classes referring to the point scale and the type of triggering typically associated with these classes. For further details, including typical observations related to each class, see Sect. A1 or EAWS (2025). Values in parentheses indicate that the trigger or evidence is not typical but may occur.
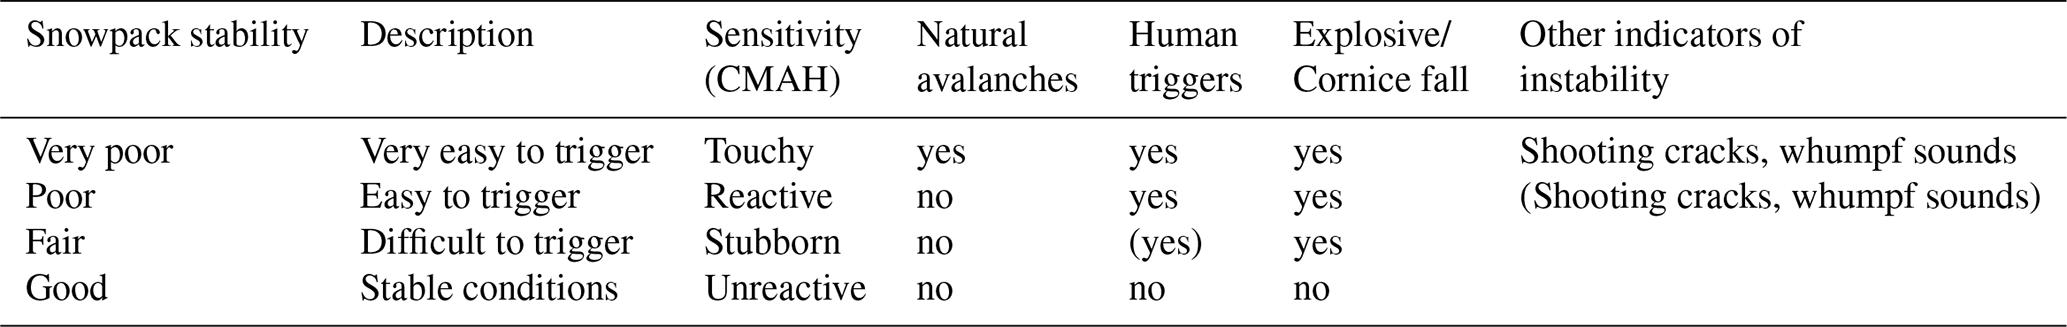
Table 3Frequency classes of snowpack stability. For further detail and remarks see Sect. A2 or EAWS (2025).
The guiding questions are: “How easy is it to trigger an avalanche?” and “How large can avalanches become?”. In theory, the EAWS workflow requires forecasters to estimate the frequency distribution of snowpack stability classes across all points in avalanche terrain within a warning region. Independent of the spatial scale of the forecasting problem, assessing snowpack stability has traditionally relied heavily on observations of avalanche activity, signs of instability, and stability test results (Reuter and Schweizer, 2018). More recently, this has been complemented by stability information extracted from one-dimensional physical snowpack models (e.g. Mayer et al., 2022; Herla et al., 2022; Binder and Mitterer, 2023). In practice, however, estimating snowpack stability at every point in a large region remains impossible. Forecasters therefore infer the distribution of stability classes across a region by combining sparse point observations and model data (when available), and their expertise and experiences. The estimated proportion of potentially unstable points, relative to a specific triggering level, reflects the average likelihood of triggering an avalanche in avalanche terrain within a region. This likelihood, combined with the potential avalanche size, determines the regional danger level. This approach aligns with the hazard chart in the CMAH, which categorizes avalanche danger based on the likelihood and size of avalanches (Statham et al., 2018).
The revision of the factors determining avalanche danger by the EAWS in 2022 (Sect. 2.3, Tables 2–4) led to a mismatch compared with the terminology used in the EAWS-Matrix-v2017 and EADS (Table 1). Therefore, as a first step, a matrix with the updated terminology was needed.
Most of the previous matrices (Müller et al., 2016; EAWS, 2017) were developed relying on the joint experience of a small group of forecasters consisting, for instance, for the Bavarian Matrix of one forecaster from Austria, Germany, France, Italy, Spain, and Switzerland. Unfortunately, the process on how the avalanche danger levels for individual cells within the matrices were assigned, was not documented. Beside the data-driven matrix developed by Techel et al. (2020), which relied on Swiss data and the Swiss perspective of interpreting danger levels, there is a general lack of data allowing a quantitative characterization of the danger levels. Moreover, even if relevant data were available in time and space, assigning a danger level to available evidence remains an expert judgment as avalanche danger cannot be measured or calculated (by algorithms) in a strict sense (e.g. Elder and Armstrong, 1987; Schweizer and Föhn, 1996).
4.1 Data collection
Given the subjective nature of avalanche danger assessments and the lack of relevant objective data for revising the Matrix, expert elicitation offers a structured and transparent method to harness expert judgment in complex, data-sparse contexts where human perception is central (Rowe and Wright, 2001). We therefore followed a similar path as for previous matrix versions by combining multiple expert opinions and drawing on the collective knowledge of avalanche forecasters and their perception of the factors and danger levels. It is well known that the meaning of terms can vary across individuals, cultures, and languages, and even within the same individual depending on the context (e.g. Ogden and Richards, 1925; Morgan, 2017). Therefore, some variability in how combinations of factors were linked to danger levels was expected. To minimize linguistic and cultural bias in the final matrix, we deliberately sought input from a broad cross-section of forecasters across EAWS.
Compared to earlier revisions, the current survey engaged a larger and more diverse group of experts. All EAWS forecasters were considered to possess the necessary expertise and were therefore regarded as equally competent to contribute to this task. This approach is grounded in the principle that the aggregated judgments of multiple independent experts tends to be more accurate than those of a single individual (e.g. Stewart, 2001). Additionally, by actively involving EAWS forecasters to contribute their interpretation of the matrix with the updated terminology and definitions, we aimed to gain broader engagement and greater acceptance of the revised version.
We invited avalanche forecasters to participate in a survey via the EAWS mailing list and/or the heads of warning services during the spring of 2022. We provided the following instructions:
-
Assign a danger level for each combination of classes describing snowpack stability, the frequency of snowpack stability, and largest expected avalanche size (Tables 2–4). For instance, assign a danger level to a scenario that could be described as “Many locations exist, where poor snowpack stability prevails. Avalanches can reach up to size 3.”, where italicized words describe the classes determining avalanche danger.
- a.
Begin with the most unfavorable stability class (very poor), which is typically associated with natural avalanches (Table 2), and assign a danger level to every frequency – avalanche size – combination.
- b.
Next, consider poor as the determining stability class. Assume that the frequency of locations with stability class very poor is none or nearly none, or at most a few (Table 3).
- c.
Repeat the process for fair stability. When good is assessed as the lowest stability class, avalanche danger is low.
- a.
-
Indicate a primary (more weight) and secondary danger level (less weight) if uncertain between two danger levels.
-
Leave the cell empty if a combination of factors is implausible or if unsure about the appropriate danger level.
Participants were encouraged to fill in all cells for which they felt confident assigning a danger level, leaving the stability category fair as optional with the aim to increase participation rates.
Following best practices for expert elicitation, we instructed forecasters to complete this task independently of other forecasters. Most importantly, the danger levels determined for specific combinations of stability, frequency, and avalanche size should not be discussed among forecasters until after they had submitted their responses.
We received 60 responses to the survey. To derive the updated matrix, we additionally considered the following sources:
-
Working group members provided their version of the matrix at a meeting in 2019, and again in 2022 (N=5 and 9, respectively). We employed the test-retest reliability methodology (Ashton, 2000) to evaluate the consistency of their responses and to obtain more reliable estimates. Additionally, the second round served as a pilot study to test the survey distributed to EAWS forecasters outside the working group.
-
We incorporated two quantitative studies into our analysis (N=2; Swiss data: Techel et al., 2020; Hutter et al., 2021).
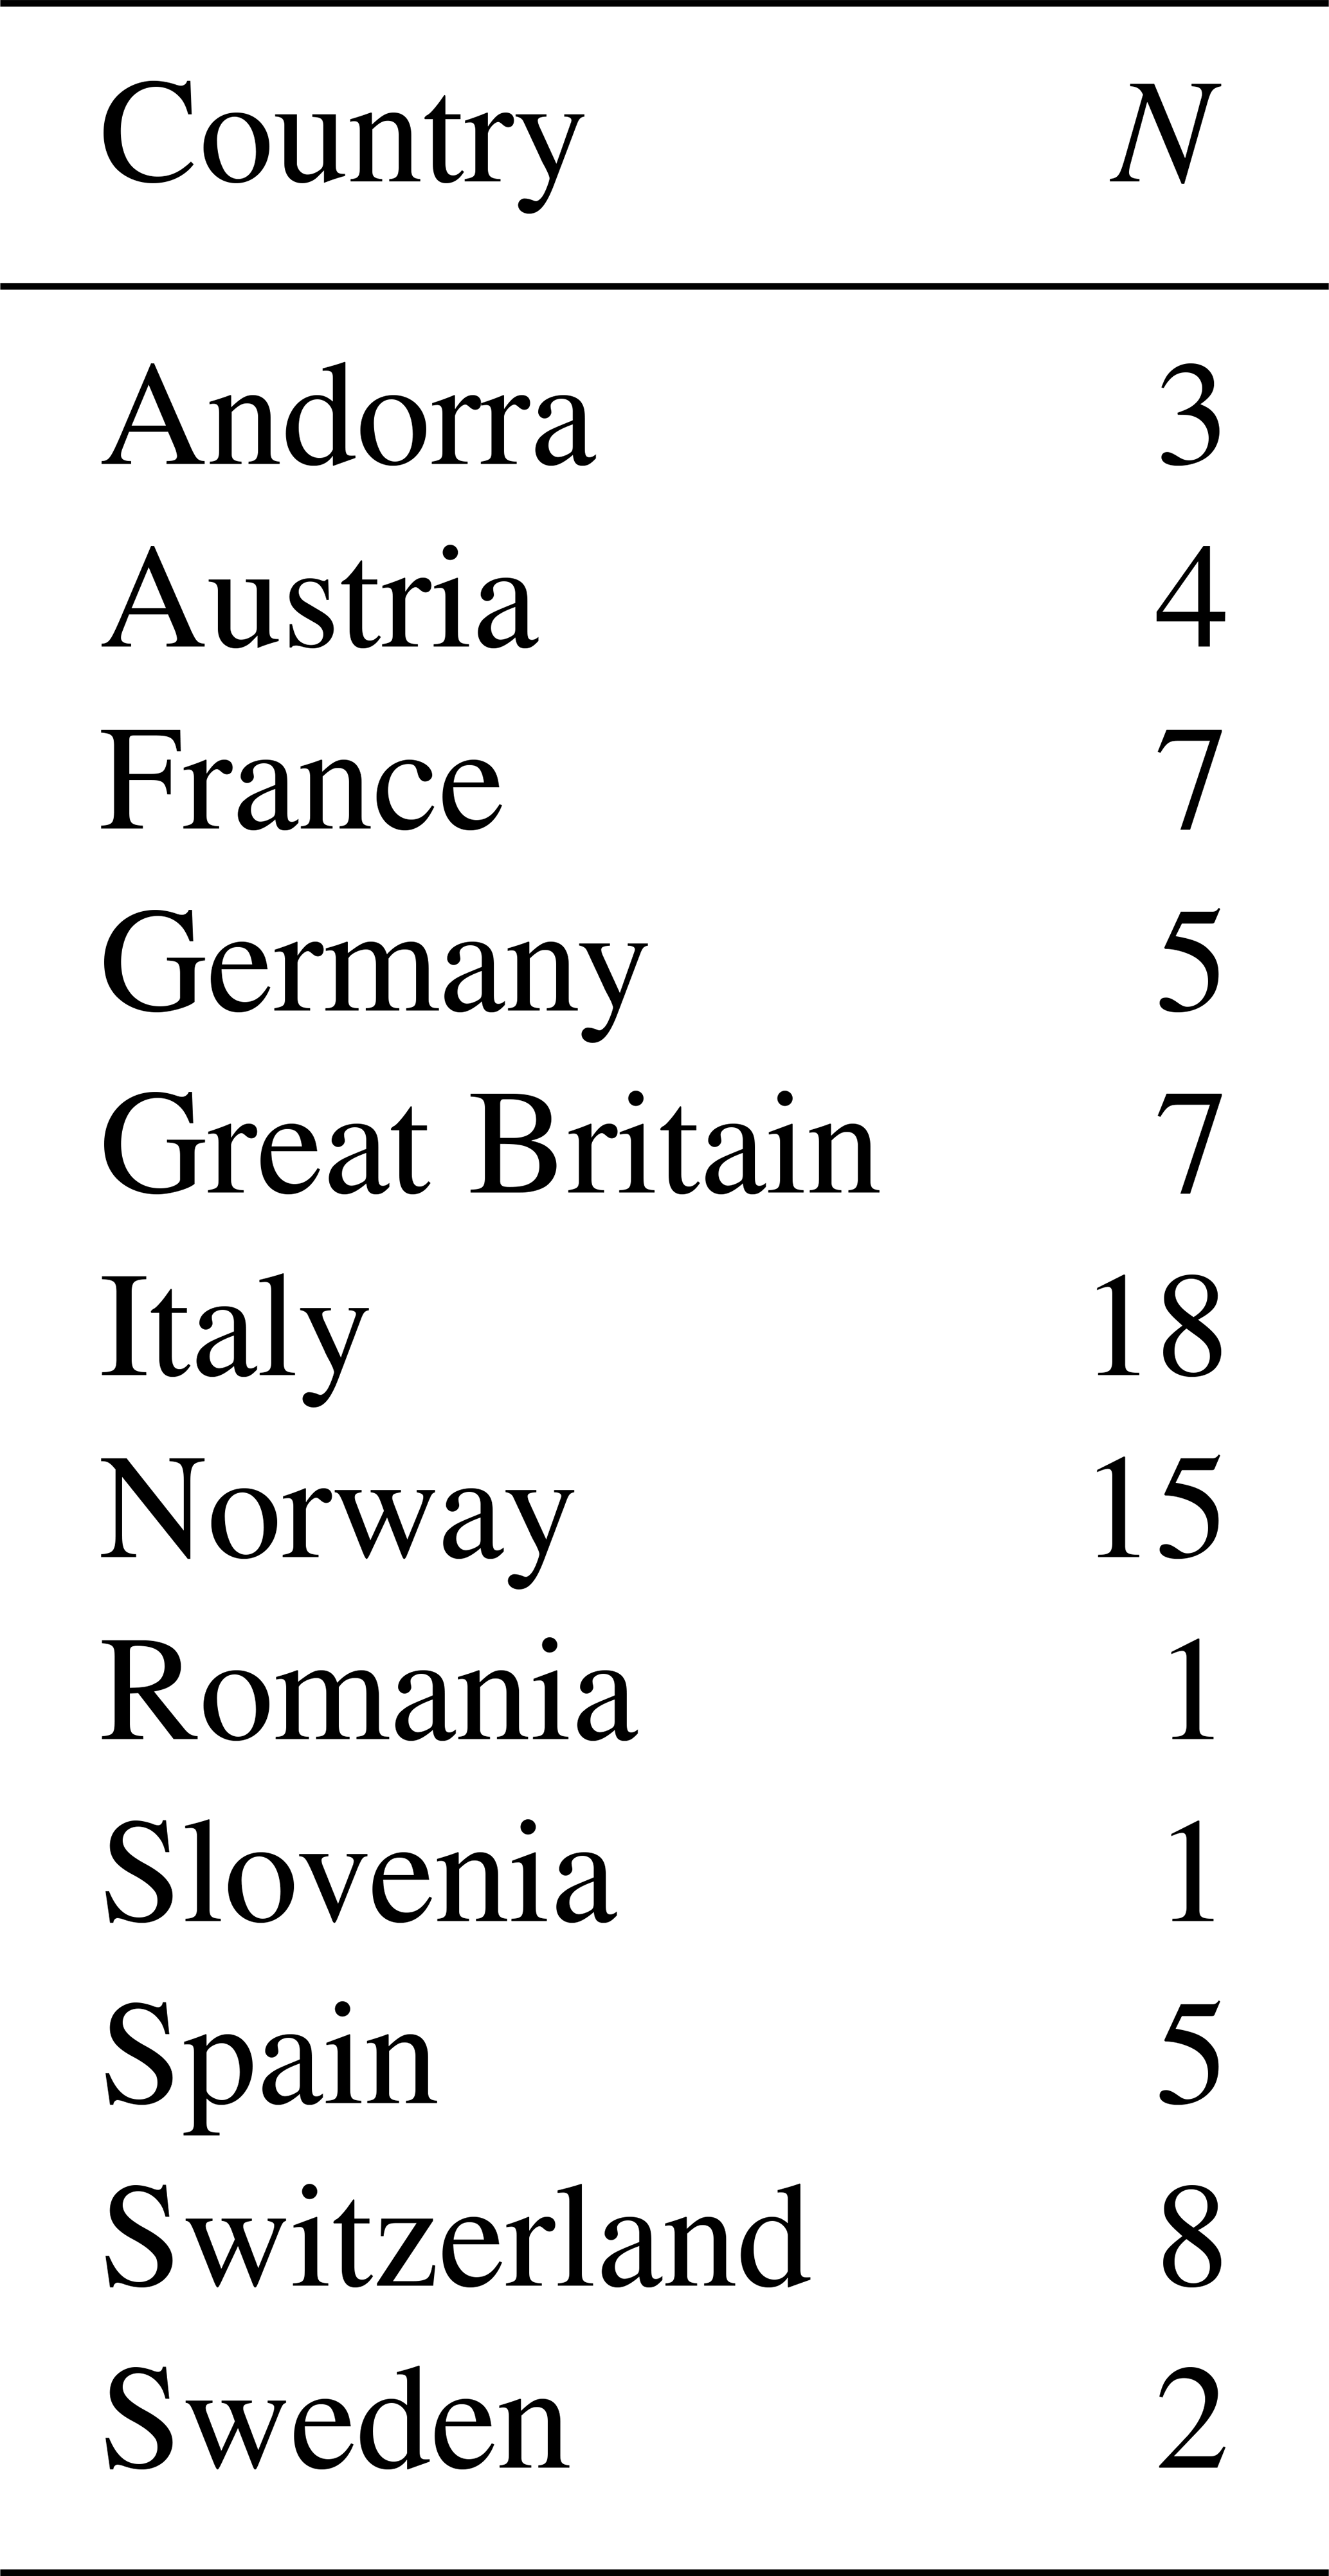
In total, we had 76 responses from 12 different European countries (Table 5), which we consider a comprehensive pool of opinions reflecting the current state of avalanche danger assessment practices in Europe.
Table 5Distribution of the 76 matrix responses received by country. Forecasters in the Czech Republic, Finland, Iceland, Poland and Slovakia were approached, but did not respond.
4.2 Survey analysis
In line with best-practice approaches when combining judgments from experts (e.g. Dietrich and Spiekermann, 2023), and not favoring any one opinion, we opted to calculate the median danger level for each combination of stability, frequency, and avalanche size. In addition, we checked whether the median danger level was also the danger level proposed by the majority of respondents. Since respondents could provide both a first and second danger level, we weighted their answers accordingly:
-
If a forecaster provided a single danger level, this danger level was weighted with 100.
-
If a forecaster provided two danger levels, the first danger level was weighted with 67 and the second with 33.
4.3 Survey results
Figure 1 shows the distribution of responses for each factor combination and danger level. As can be seen, a range of factor combinations was used for each danger level. While the survey provides insights into the most typical combinations for each danger level, there were also some combinations, which were rarely or never selected (blank cells). In line with the definition of the avalanche danger levels, Fig. 1 shows that, as danger levels increase, snowpack stability decreases while frequency and avalanche size increase. Notably, the combinations with the highest response rate for each danger level often have secondary choices diagonally above or below that value. This suggests that two factors can offset each other to qualify for the same danger level. For instance, a higher probability of triggering might be balanced by lower consequences (smaller avalanches).
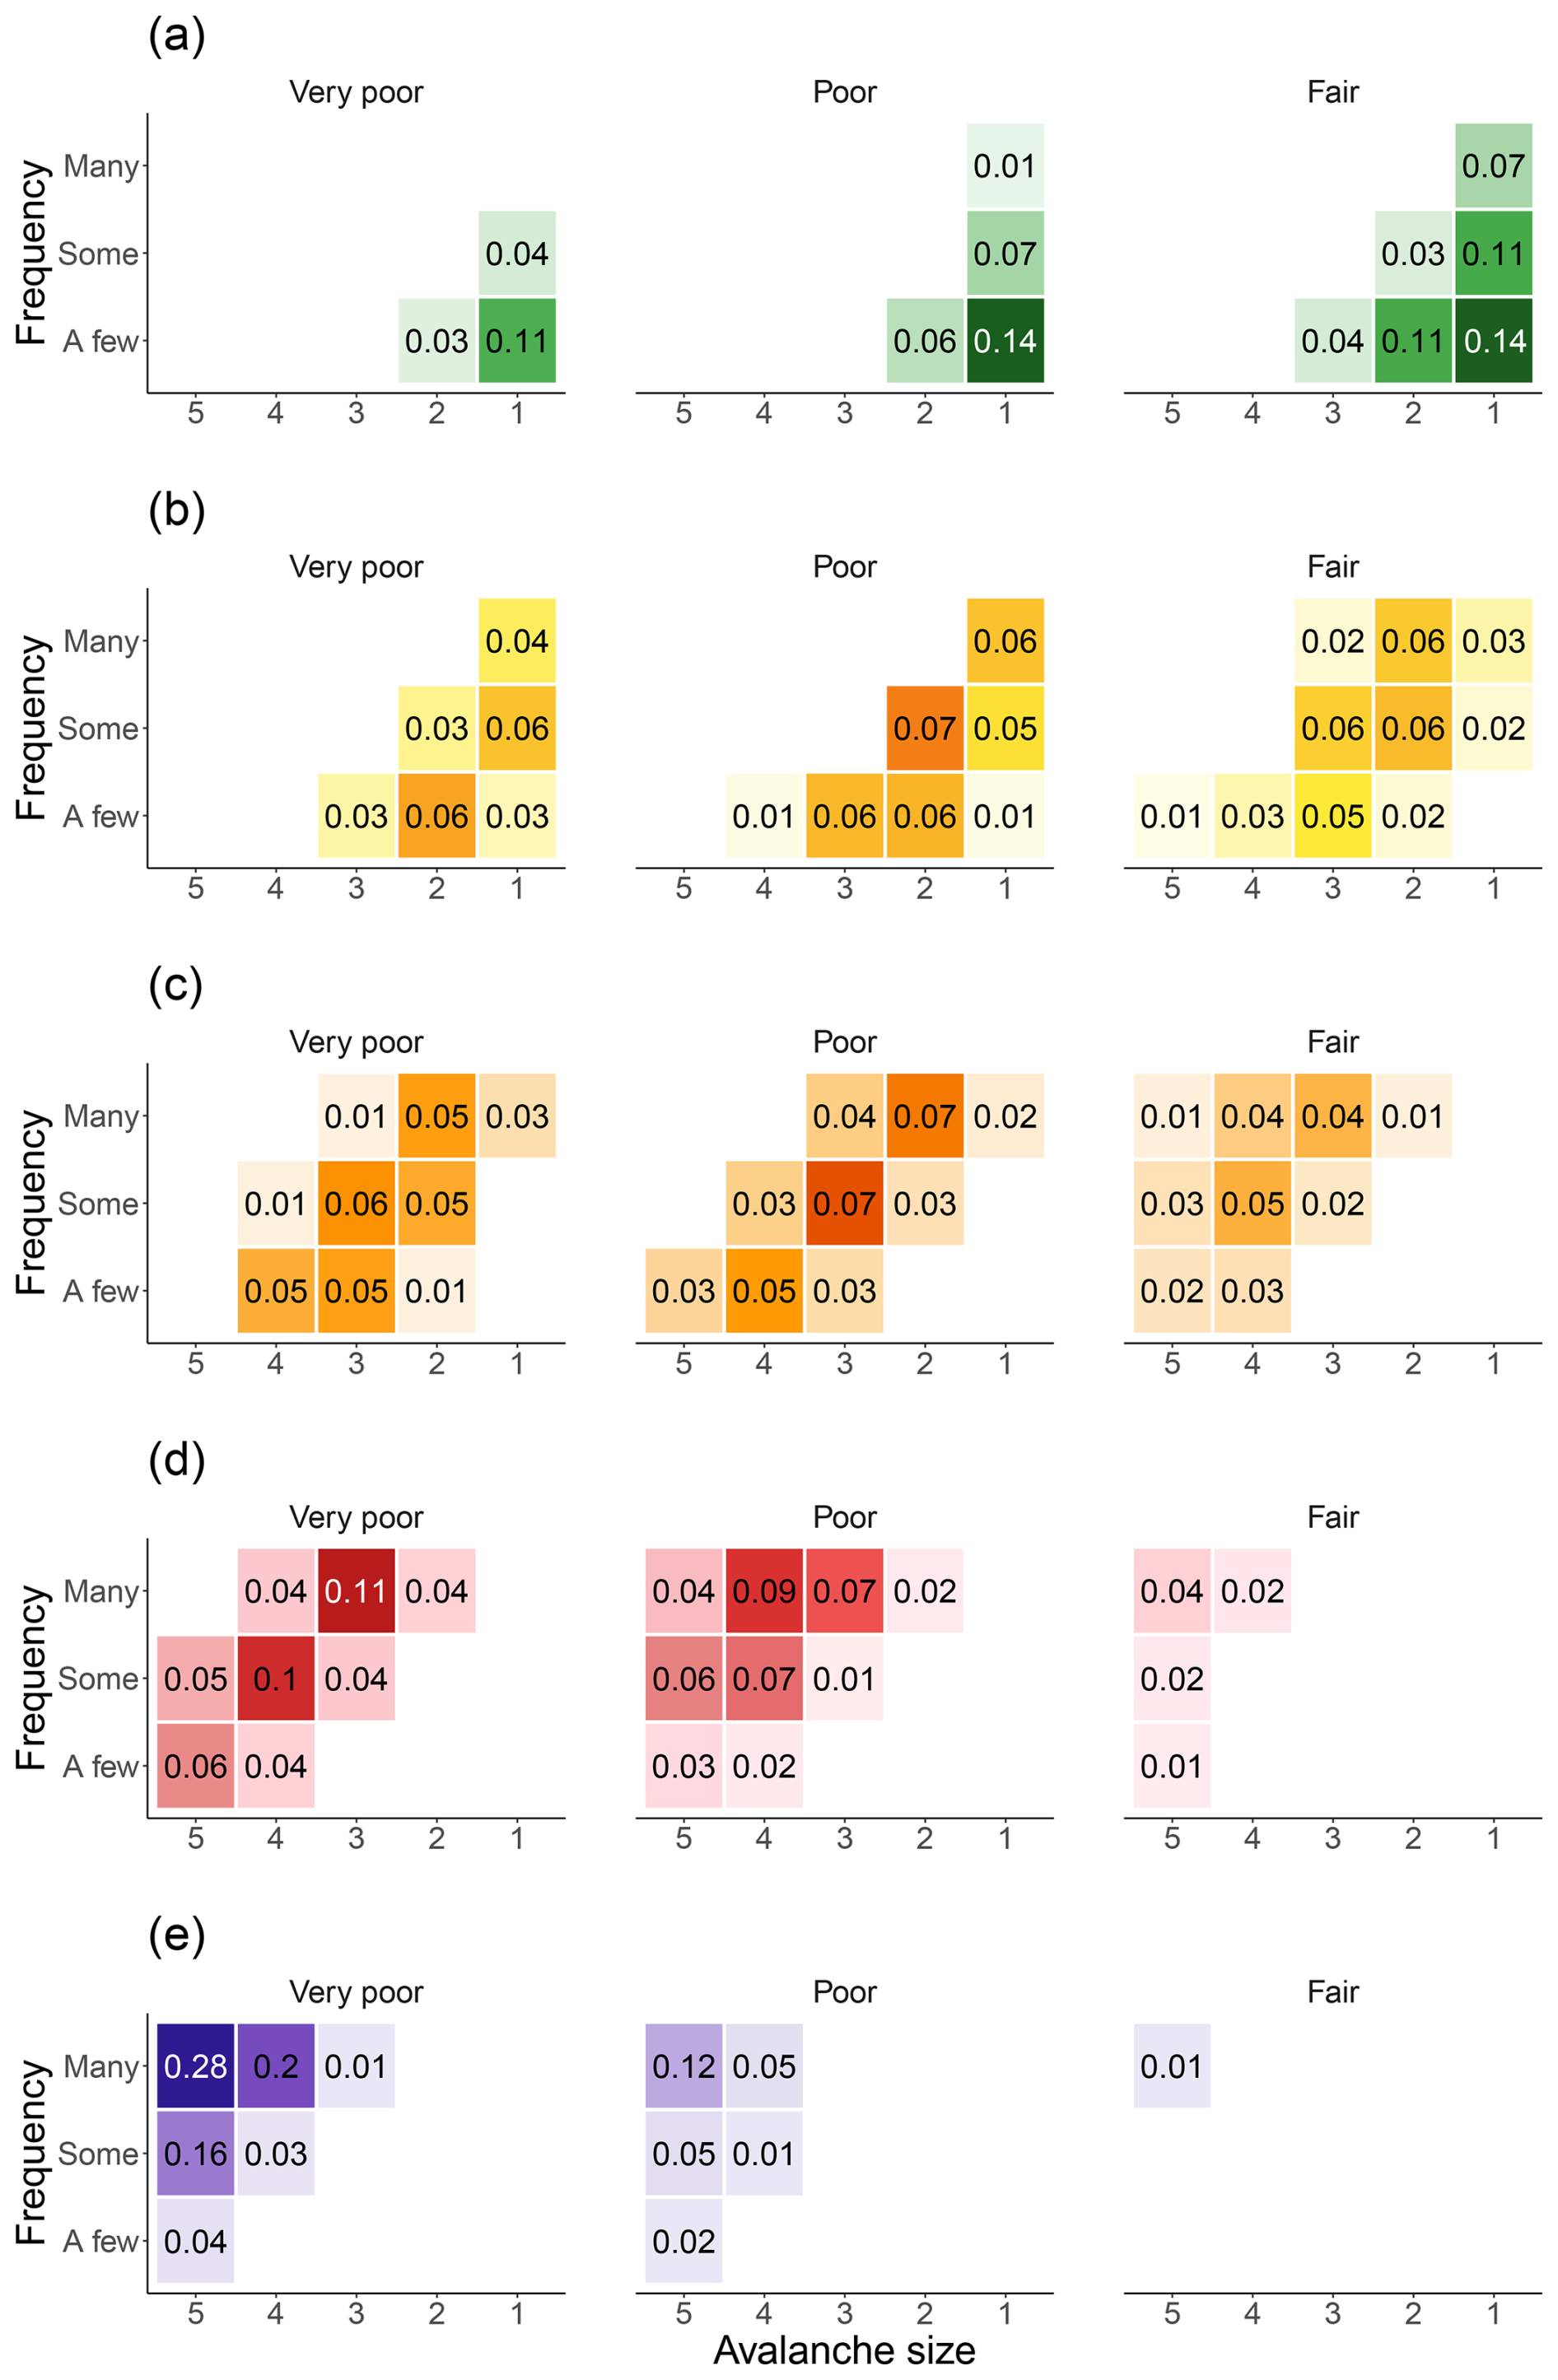
Figure 1Distribution of survey responses for each danger level (a D=1 to e D=5). Shown are the proportions for each combination of stability, frequency, and avalanche size summing up to 1 for each D. Values are displayed if they received ≥0.01 of the votes. Stronger color saturation indicates a larger proportion of responses favoring a specific combination.
Rank-ordering the danger level responses for each combination of stability, frequency, and avalanche size, we derived the median danger level, referred to as D1, and any second danger level, D2, falling within the interquartile range (Fig. 2a). Analyzing the responses across the 45 cells, we find that 27 cells contain a D2, indicating considerable variability in opinions. A clear majority vote existed for only 18 of the 45 possible factor combinations (Fig. 2b). Not surprisingly, the cells with highest agreement define the limits of the danger scale (fair-a few-size 1, D1=1: 97 %; very poor-many-size 5, D1=5: 99 %; Fig. 2b). The other two cells that stand out with regard to a high agreement of responses are very poor-many-size 3 (D1=4: 85 %) and poor-some-size 3 (D1=3: 84 %). These two combinations align well with the description of danger levels 3 (considerable) and 4 (high) in the EADS (Table 1), which likely explains the clear preference for one danger level in the survey. Otherwise, cells of comparably high agreement are scattered across the matrix, with no obvious pattern connected to one of the factors or to D. On average across all cells, one danger level was supported by 67 % of the votes, the remaining votes generally went to a second danger level. Seven combinations showed particularly low agreement rates (proportion ≤0.55), indicating that the median danger level may be less representative for these cases (e.g. fair-a few-size 4).
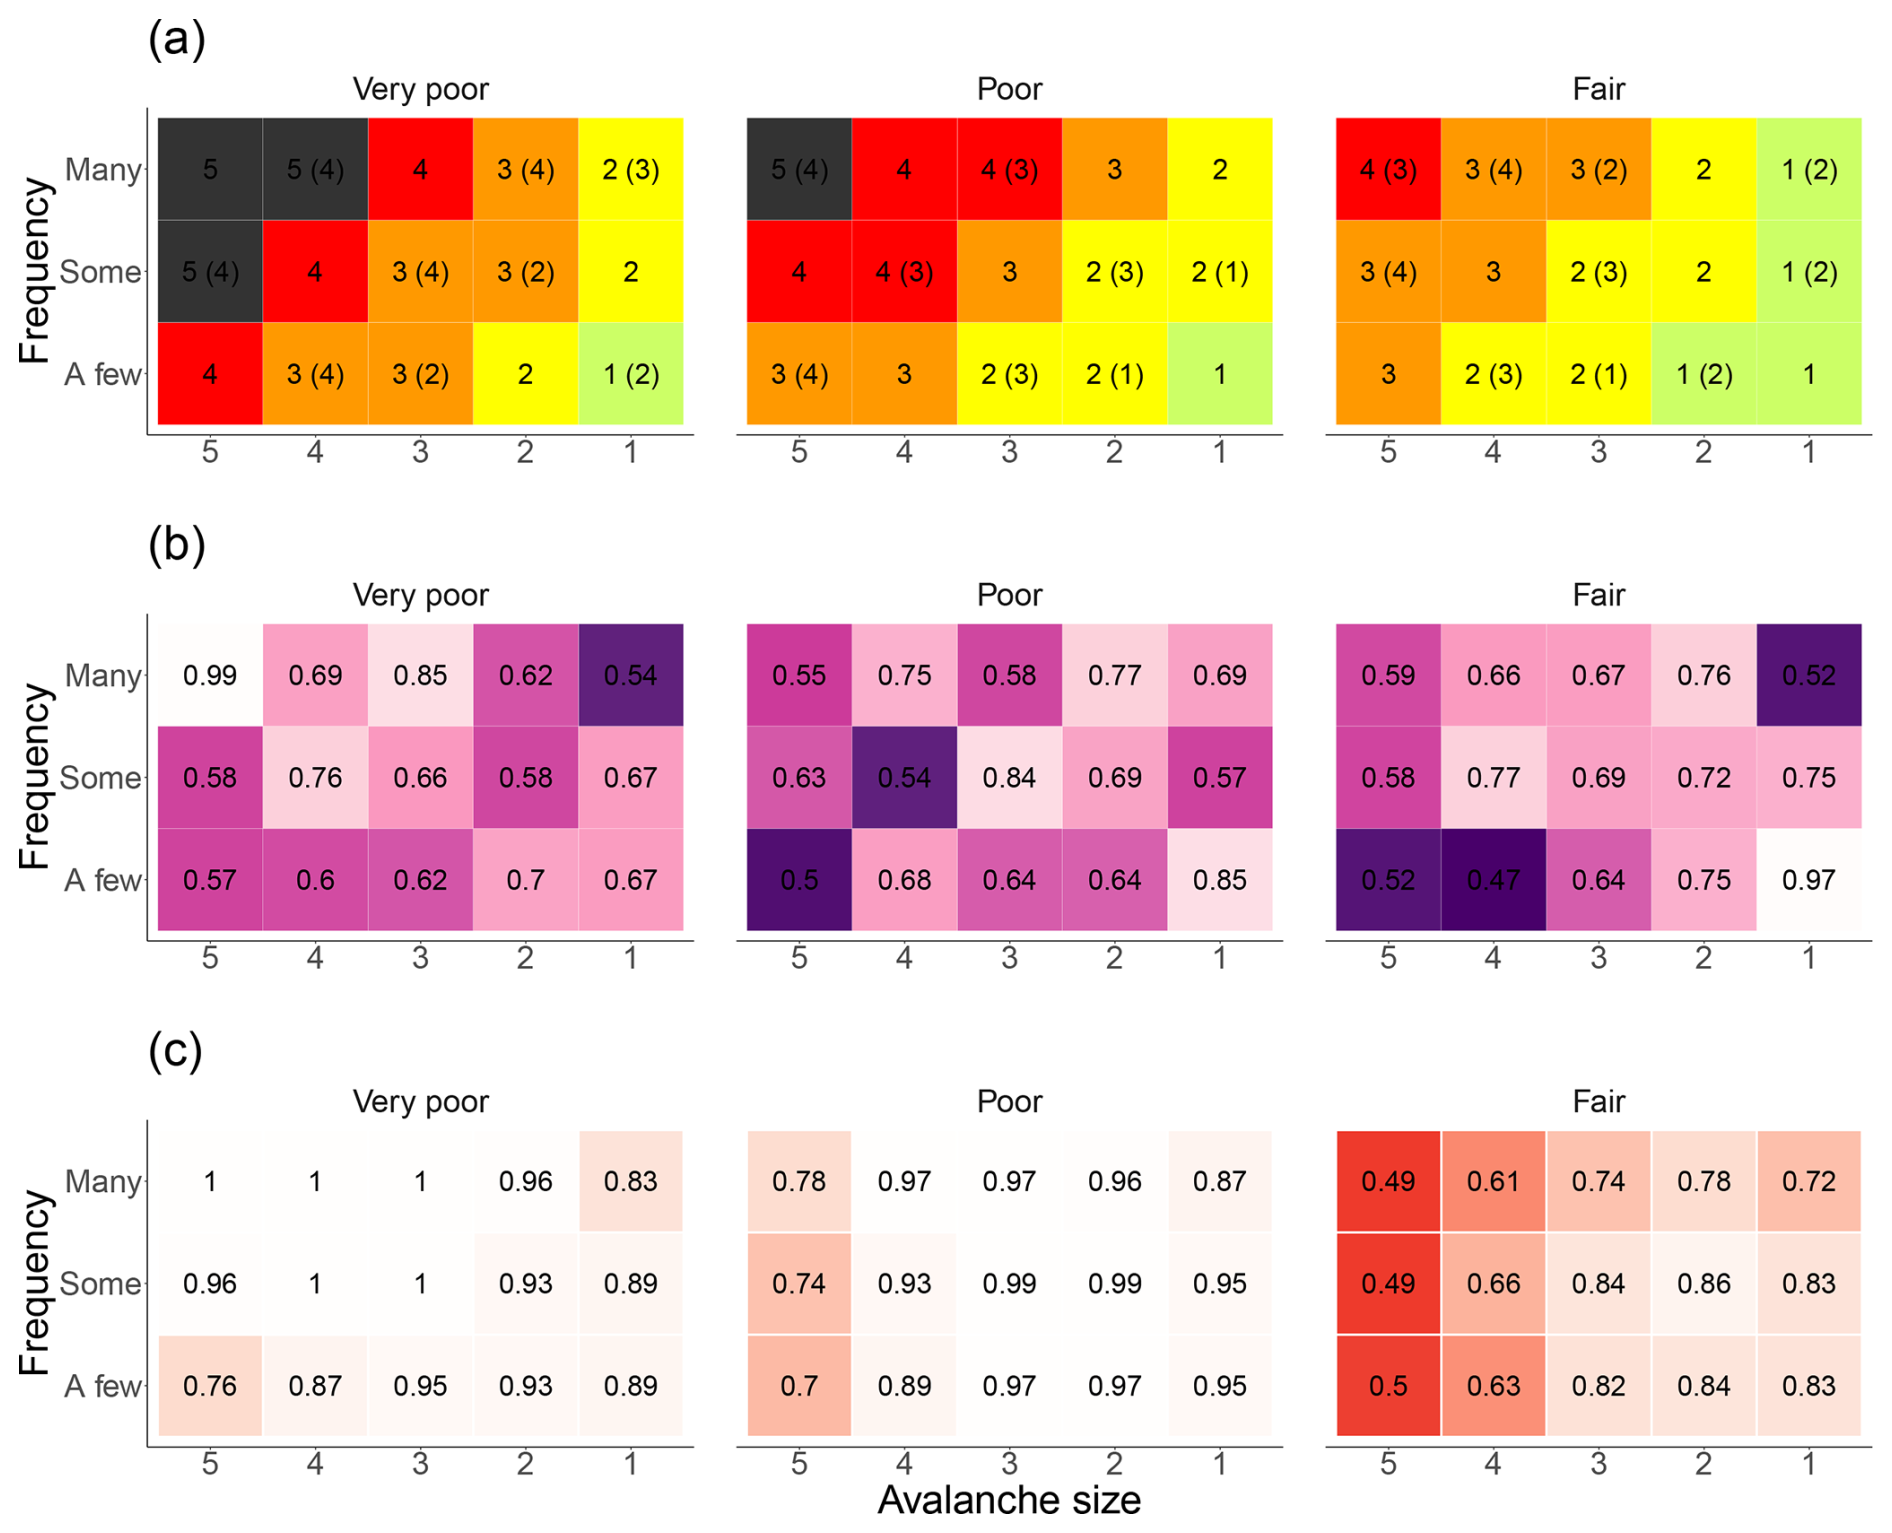
Figure 2Survey responses for each combination of stability (panels), frequency (y axis), and avalanche size (x axis). (a) Median danger level (D1), with the second most frequent level (D2) shown in brackets if within the interquartile range (see text for details). (b) Proportion of responses that agree with D1. (c) Proportion of participants providing a danger level estimate. Stronger color saturation indicates lower agreement (b) or fewer responses (c).
Figure 2c illustrates the support, or the percentage of participants providing a response, for each specific combination. On average, participants provided danger level values for 85 % of the possible 45 combinations. Notably, cells with very poor and poor stability received responses from 72 of the 76 participants (≥95 %) for 17 of the 30 combinations. Although stability fair was optional in our survey, it received responses in over 82 % of cases when combined with frequency classes a few and some and avalanche sizes 1, 2, and 3. Fair stability had lower response rates when paired with avalanche size 4 (≤66 %) or size 5 (≤50 %). Possibly, this indicates that a considerable share of forecasters rated these combinations as less plausible.
It is not surprising that the 76 responses from various European countries and warning services revealed considerable variability in the assignment of D across most factor combinations. Moreover, as shown in EAWS (2022a), “cultural” differences can be observed when comparing responses by country. For instance, the mean response by Scottish forecasters resulted in five matrix cells with D1=5, whereas only two such cells were assigned D1=5 by Norwegian or Swiss forecasters. Similar “cultural” differences have been documented before, such as when assigning danger levels (Lazar et al., 2016; Techel et al., 2018) or estimating avalanche size (Hafner et al., 2023). Despite the EADS being in use for three decades, the absence of unambiguous, standardized guidelines – and a shared understanding of definitions – likely contributes to these variations across European Avalanche Warning Services (Techel et al., 2018).
Given these divergent perceptions of danger levels, it was all the more important to involve a large number of forecasters with varied operational backgrounds to ensure that the updated Matrix would reflect a broad and representative understanding across services.
The EAWS Matrix, based on the survey (Fig. 3a), reflects the collective judgment of European avalanche forecasters. It was developed as a desktop exercise – a so-called cold-state assessment (Roiser and Sahakian, 2013), as forecasters answered the survey outside an operational context and without the pressures of real forecasting. To move from this conceptual foundation to a tool suited for operational danger level assessment, we evaluated the Matrix in day-to-day forecasting practice. We focused on two critical aspects, presented in two separate analyses: (i) the reliability with which forecasters could estimate the Matrix input factors (Techel et al., 2024), as reliable estimation is a prerequisite for meaningful use; and (ii) how the Matrix was applied in real-time operational forecasting across Europe (Techel et al., 2025a). While the first analysis highlights limitations of Matrix use – taken up in Sect. 6.3, the second revealed two main insights that directly informed the revised Matrix shown in Fig. 3b, hereafter referred to as the EAWS Matrix or simply the Matrix.
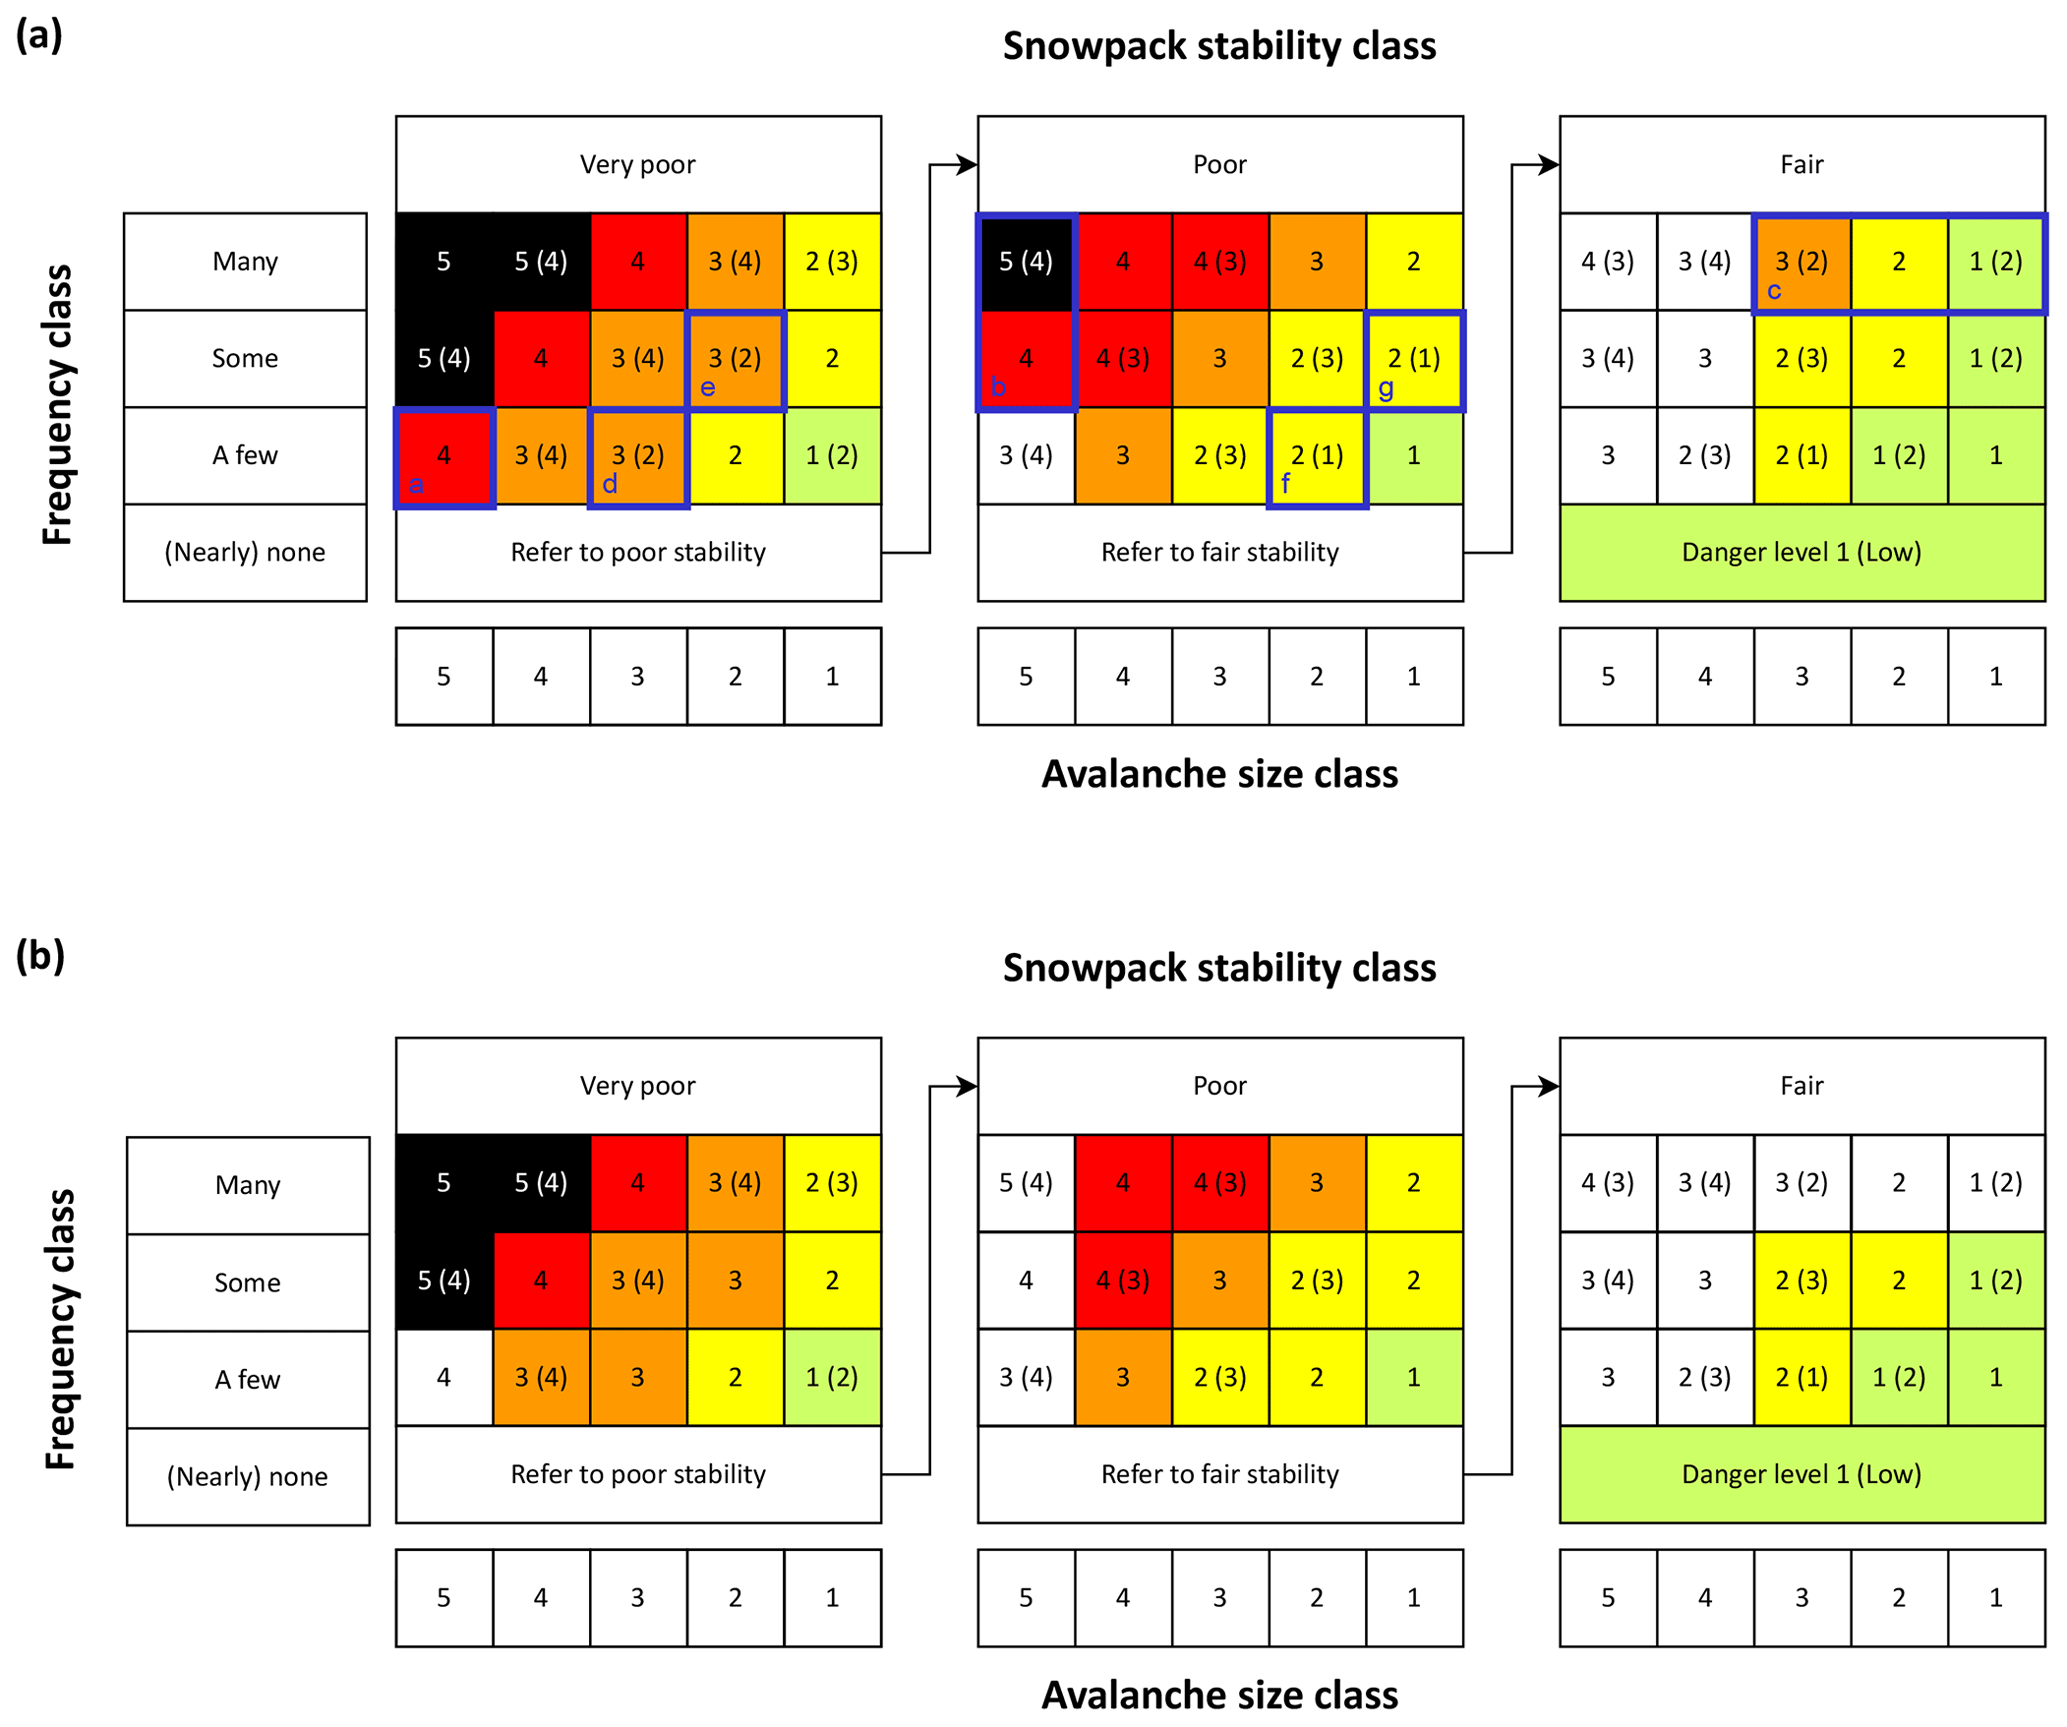
Figure 3EAWS Matrix, (a) as based on the survey, and (b) after operational testing. The Matrix links the weakest snowpack stability class (panels), the frequency of that class (rows, y axis), and the largest expected avalanche size (columns, x axis) to the five danger levels. Numbers show the recommended danger level (D1), with an alternative level (D2), in brackets where forecasters diverged in the survey. Arrows indicate the stepwise logic for evaluating conditions with increasing snowpack stability. In (a), cells a–c were rarely selected, while d–g consistently mapped to a single level. In (b), color shading is removed from a–c, and the secondary level is dropped from d–g.
The two main insights were: First, several Matrix cells were rarely or never used in operational practice (<1 % of cases), so that the danger levels assigned to these cells could not be validated. Many of these same cells also had low support (≤80 %) in the survey (Fig. 2c). To reflect the resulting uncertainty, the underlying color was removed in six cells (a–c in Fig. 3a). Second, some Matrix cells were used almost exclusively for a single danger level, even though the Matrix showed two choices, one in brackets. To reflect this consensus, the bracketed danger level was removed from four cells (d–g in Fig. 3a).
The structure of the Matrix shown in Fig. 3b builds on the recognition that the frequency of locations with the weakest snowpack stability is often the most decisive factor for determining avalanche danger levels (Techel et al., 2020). Accordingly, the layout features three separate panels for the stability classes very poor, poor, and fair, linked by arrows from left to right. Each panel summarizes combinations of frequency and avalanche size, supporting a step-by-step assessment: the forecaster begins in the upper left corner, representing the most severe conditions, and proceeds through the Matrix by sequentially ruling out unlikely combinations. This progression helps ensure that more severe scenarios are considered first, before settling on the cell that best reflects the expected conditions.
Since survey results did not always yield a clear consensus for a given factor combination (Fig. 2b), cells may contain one or two danger levels (Fig. 3). The integer values of the danger levels are shown (e.g. 1 for 1 (low)). The primary Matrix-recommended level D1 reflects the median forecaster response and determines the cell's color. If the interquartile range of responses included a second, distinct level, and operational usage did not warrant simplification, it is shown in brackets as D2, thereby retaining variation in expert opinion. For example, for the combination very poor–some–size 3 (Fig. 3b), the Matrix shows D1=3 and D2=4; indeed, 34 % of forecasters favored a level other than 3 (considerable) for this case (Fig. 2c). Matrix cells are left uncolored if fewer than 80 % of respondents provided a danger level estimate (Fig. 2c).
6.1 General usage
The first step in applying the Matrix is to define the spatial and temporal unit of assessment. Most European avalanche warning services issue forecasts valid for 24 h, although in rapidly changing conditions the danger may also be assessed for shorter periods. In such cases, a separate assessment may be required. In addition, assessments are typically made for specific elevation bands and/or slope aspects, which align with the locations where the relevant avalanche problems are present.
The avalanche danger assessment process begins by addressing: “What is (are) the avalanche problem(s)?” This is followed by: “Where and when does the problem exist?”, which is answered separately for each relevant problem. For example, under daytime warming, a wet-snow problem may be relevant in the afternoon below a certain elevation threshold on sun-exposed slopes. The frequency of locations with very poor stability is then determined for the spatial unit. If very poor stability is absent or irrelevant, i.e. frequency is assessed as none or nearly none (see Table 3), the assessment continues with the next stability class, following the directional flow of the Matrix. This stepwise evaluation may continue through the poor and fair panels. If the lowest stability class is assessed as good, the danger level defaults to 1 (low). In some cases, more than one stability class may be relevant – e.g. when both very poor and poor stability are anticipated, but the latter is more frequent. In such situations, two stability panels may be considered (Fig. 4a). The final step is to estimate the largest avalanche size expected for the avalanche problem over the spatial unit. If one factor combination is selected, the Matrix proposes a primary danger level and, in many cases, an alternative. If two cells are selected, the cell with the higher danger level should guide the final danger level choice. Uncertainty in factor class assignment, e.g. due to limited information, can be expressed by marking a range of cells in the Matrix (Fig. 4b). In such cases, the most frequently indicated danger level should be selected; if two levels are equally supported, the higher one should be chosen. In the example shown in Fig. 4b, the resulting danger level would be 3 (considerable).
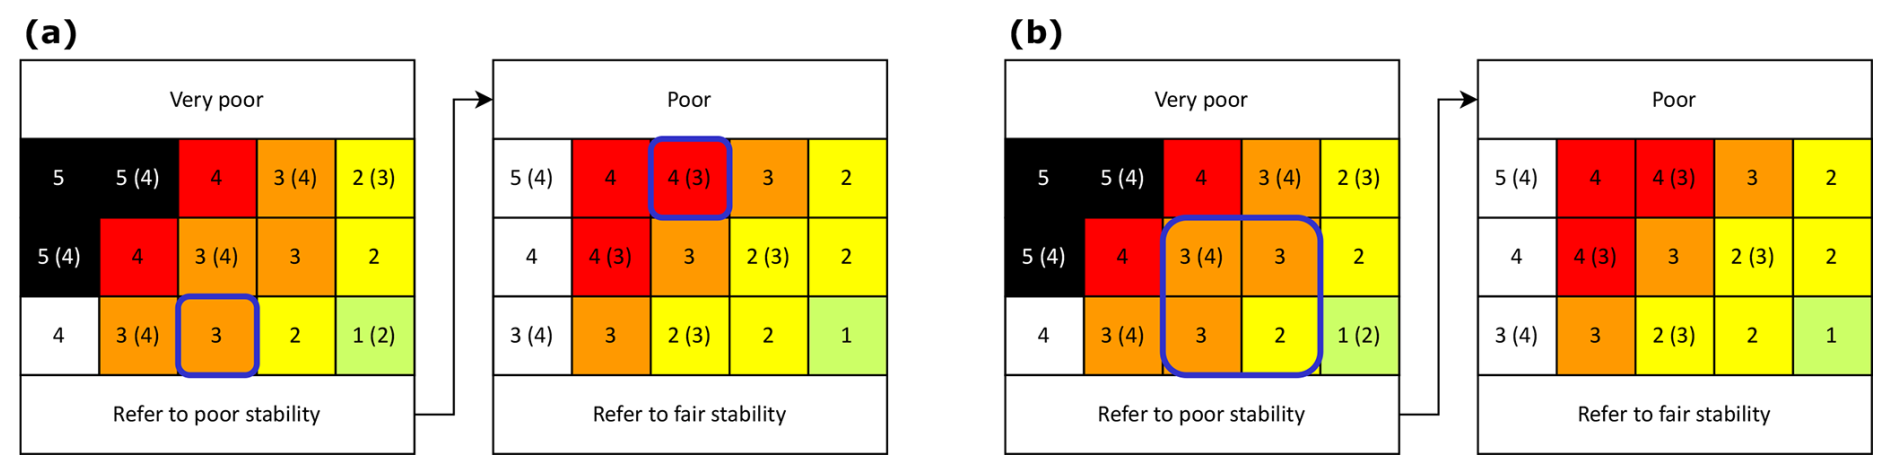
Figure 4EAWS Matrix (extract) with several cells marked as relevant (blue border) to accommodate (a) a range of possible combinations or (b) uncertainty. In (a), two combinations of stability and frequency are considered for the same avalanche problem (very poor-a few-size 3, poor-some-size 3), the highest resulting danger rating should be chosen. In (b) uncertainty relates to frequency (a few or some) and avalanche size (size 2 or 3). For explanations refer to text.
If avalanche problems affect different spatial units within a warning region (e.g. wet-snow avalanches at lower elevations on sunny slopes, and wind slabs at high elevations on shady aspects), the highest of the two suggested danger levels should be issued – unless separate ratings by elevation or aspect can be communicated in the forecast. If the problems overlap spatially, the combined danger may warrant a higher danger level than the Matrix suggests for each problem individually.
The structured workflow and Matrix design ensure systematic evaluation of all relevant factors, promoting consistent danger level assessments given a shared understanding of factor classes among forecasters.
The Matrix workflow is broadly aligned with the CMAH but tailored to public regional avalanche forecasting, where a single danger rating typically applies across a warning region. In this context, specific terrain features are not treated as an independent factor affecting the danger level. However, they might be mentioned in the corresponding textual avalanche forecast (e.g. Hutter et al., 2021).
6.2 Example: Applying the Matrix
The following example demonstrates step by step how the Matrix is used to derive a danger level assessment.
Consider a situation in which the terrain is well covered with snow, with no pronounced persistent weak layers in the snowpack. The snow surface is generally smooth and soft across all aspects. Over the next 24 h, 40 cm of new snow is forecast above treeline, with periods of moderate to strong northwesterly winds, and air temperature rising from −10 °C to about −3 °C at typical avalanche starting-zone elevations.
Let us assume a forecaster who identifies two relevant avalanche problems based on this forecast. The forecaster envisions the following avalanche conditions:
-
New snow. Natural loose-snow avalanches are possible on very steep, wind-sheltered slopes but are expected to be small (size 1). In more open terrain, avalanches are expected to be easy to trigger and reach medium size (size 2); natural releases are also possible.
-
Wind slabs. Natural slab avalanches are expected particularly on lee aspects most affected by wind loading above treeline. Avalanche size is uncertain (size 2–3), depending on snowfall and loading patterns.
Wet snow avalanches and persistent weak layers are not considered relevant avalanche problems in this scenario.
For the new-snow problem, the forecaster considers all aspects above treeline as relevant, for the wind-slab problem, the relevant spatial unit are Eastern and Southern aspects above treeline. For each of these avalanche problems, the forecaster assesses the classes for the three Matrix factors that best describe the expected conditions in this unit. In this example, let us assume that the following choices for stability, frequency, avalanche size result:
-
New snow (dry-loose avalanches). very poor-many-size 1 → Matrix suggests D1=2, D2=3
-
New snow (slab avalanches). poor-many-size 2 → Matrix suggests D=3
-
Wind slabs. very poor-some-size 2/3 → Matrix suggests D=3 or D1=3, D2=4
In this case, slab avalanches associated with new snow and wind transport present the main concern. Depending on the wind conditions, large avalanches (size 3) may need to be considered, adding uncertainty. The threat of loose-snow avalanches releasing within the new snow results in the lowest danger rating and is assessed as the least threatening.
Both slab-related problems individually suggest a danger level of 3 (considerable). Incorporating the uncertainty regarding avalanche size, the forecaster may also consider a Matrix cell corresponding to D=3(4). If this scenario were selected as most likely, the Matrix still suggests 3 (considerable) though opting for 4 (high) might also be warranted. In such cases, the forecaster must weigh the reliability and uncertainty of the available data and determine whether the suggested danger level adequately reflects the regional hazard. In simpler cases, where only one avalanche problem is relevant – for example, an isolated wind slab problem – the Matrix-suggested danger level can often be adopted directly. This example underscores the role of the Matrix as a decision-support tool: it provides structure and guidance, but the final decision remains an expert judgment.
6.3 Current limitations
The EAWS Matrix has two main purposes: to structure and increase transparency in the danger level assessment process, and to enhance consistency between individual forecasters and warning services. To ensure a consistent and practical application of the EAWS Matrix, it is crucial that the definitions for the factors are clear and easily applicable in an operational setting. For instance, avalanche size is defined by physical properties, such as volume or mass, or by the destructive potential of the avalanche. Similarly, the definition of snowpack stability is closely linked to observable triggering mechanisms (e.g. explosives or a skier, Fig. A1). These definitions, grounded in observable evidence, also support clearer mental imagery – that is, forecasters can more readily form vivid internal representations of what a size 3 avalanche or very poor stability might look like, even in the absence of direct observations. In contrast, frequency classes are more difficult to define unambiguously, particularly since the absolute frequency of locations with very poor or poor stability is generally low. In particular, the class some is broad and the interfaces to a few and many remain indistinct.
Variations in factor estimates directly affect the selected Matrix cell and thus the resulting danger level. Findings from the study on agreement in factor estimates between forecasters (Techel et al., 2024) suggest that this unreliability in factor estimation is currently the limiting factor for improving consistency in danger level assessments. Disagreements arise from several sources, including the availability and reliability of relevant data, variations in forecasters' skills to retrieve and interpret evidence, and finally, ordinalization – that is, categorizing information into a limited number of classes (Techel et al., 2024). To increase reliability in factor assessments, the following points need to be addressed (Techel et al., 2024):
-
increasing the availability of relevant data to reduce uncertainty, for example by integrating snowpack simulations with machine learning to provide information on the evolution of weak layer properties, snowpack stability, or avalanche release probability (e.g. Herla et al., 2024; Techel et al., 2025c);
-
strengthening forecasters' skills in information retrieval and interpretation through targeted training and regular operational exchange within and across warning services;
-
aligning forecast resolution – spatially, temporally, and categorically – with the resolution of forecasters' assessments given the available data; and
-
improving reliability by combining individual assessments from multiple forecasters within a warning service, thus benefiting from the wisdom-of-crowds effect.
Currently, about half of the Matrix cells lack full consensus and still include a secondary danger level in brackets (D2). While some of these cells are rarely used, two stand out as being frequently selected for two adjacent danger levels – both in the survey and in operational practice: poor–some–size 2 and very poor–some–size 3 (Techel et al., 2025a). The presence of two danger levels thus reflects a persistent ambiguity. Operational testing, however, did not clarify the reasons behind this ambiguity or offer clear strategies for resolving it. Particularly in warning services where forecasters in general more frequently chose D2 over D1, poor–some–size 2 was often linked to 3 (considerable) rather than 2 (moderate), as suggested in the Matrix. In contrast, services relying more strongly on the Matrix, assigned this danger level primarily when conditions were assessed as having either lower stability (very poor), higher frequency (many), or larger avalanche size (size 3) (Techel et al., 2025a). This highlights a core challenge: the Matrix's structure itself influences how it is applied – particularly among forecasters who tend to stick with the Matrix-recommended primary danger level. As such, further targeted discussion and investigation of these transition zones is critical to refine guidance and reduce interpretive variability in Matrix use.
It is also essential that forecasters can express uncertainty inherent in the forecasting task when working with the Matrix. As suggested in Sect. 6.1, this may include the option to select multiple cells. To facilitate discussion in case of variations, forecasters could indicate where within a class their assessment lies – toward the lower or higher end, or near the center (e.g. as in some warning services in the Alps, Techel et al., 2025a). Indicating relative trends within a factor class could help identify patterns, support consensus-building, and ultimately highlight whether further subdivision of broad classes like some is warranted.
6.4 Relation to Conceptual Model of Avalanche Hazard (CMAH)
The CMAH provides a systematic framework for avalanche hazard assessment by addressing avalanche problems, their location, the associated likelihood of avalanches, and their size (Sect. 2.2). It has a broad scope and was designed to serve various avalanche operations from back-country guiding to road safety to regional public forecasting. In contrast, the EAWS Matrix was developed specifically to standardize regional public avalanche forecasts across Europe.
6.4.1 Different approaches to spatial variability
While both the CMAH and the EAWS Matrix aim to support consistent and reliable hazard assessments, they handle the spatial component differently. The CMAH focuses on the spatial distribution of the avalanche problem. The EAWS Matrix, however, centers on the frequency of locations with the weakest snowpack stability – an approach that reflects empirical findings that the frequency of the lowest stability class is often the most decisive factor when determining the danger level (Techel et al., 2020). Importantly, these two concepts – spatial distribution of avalanche problem and frequency of snowpack stability – do not always align. Presumably, it is generally easier to assess where the avalanche problem exists in the terrain than it is to assess the frequency of the different classes of snowpack stability. Thus, simply translating the spatial distribution of an avalanche problem to the frequency of potential triggering locations given a specific trigger can lead to a mismatch likely overestimating the frequency term and, consequently, leading towards higher danger ratings. Whether the reliability of estimating the spatial distribution or the frequency class is higher has not yet been investigated. However, in forecasts, often a combination is used (Hutter et al., 2021): frequency descriptors are often used to describe the number of triggering locations in a region and can be linked to specific danger levels. However, they are commonly paired with location-specific narrative, helping forecasters convey both how often avalanches may occur and where within the terrain they are most likely.
Despite these differences, the Matrix and CMAH are complementary. Several European services where forecasters are trained primarily using the CMAH – such as in Sweden and Scotland – have successfully integrated the Matrix into their operations. However, it is important to emphasize that neither CMAH nor the Matrix should be applied rigidly. Avalanche forecasting is an iterative process carried out under significant uncertainty, often with sparse or ambiguous data. The Matrix is intended to support structured thinking and reduce inconsistency in similar conditions. Its design has been shaped by the CMAH's structured approach, adapted to the operational needs of regional forecasting in Europe.
6.4.2 Connecting Matrix and CMAH: a rearranged layout
As discussed in Sect. 6.1, the Matrix guides forecasters from left (very poor stability) to right (fair stability), reflecting the central role of the weakest stability class in determining D (Techel et al., 2020). Conceptually, the Matrix can be seen as a variant of the CMAH hazard chart (see Fig. C1 for an example). In this interpretation, snowpack stability and its frequency jointly represent the CMAH dimension of the likelihood of avalanches, which is then combined with avalanche size. This approach follows the alternative layout proposed as ADAM (avalanche danger assessment matrix) by Müller et al. (2016, see also Fig. B2) and further developed in the data-driven Matrix by Techel et al. (2020, see also Fig. B4).
Rearranging the Matrix according to the ADAM design aligns it with the classic structure of hazard matrices, where hazard increases from the lower left to the upper right corner (Duijm, 2015). Figure 5 shows the EAWS Matrix rearranged according to the CMAH workflow. This layout facilitates comparisons across stability–frequency combinations, making the connection to the CMAH more visible and intuitive. The workflow also becomes closer to CMAH logic: first determine the likelihood of avalanches (through stability and frequency) in the left panel, then assess consequences (avalanche size) in the right panel.
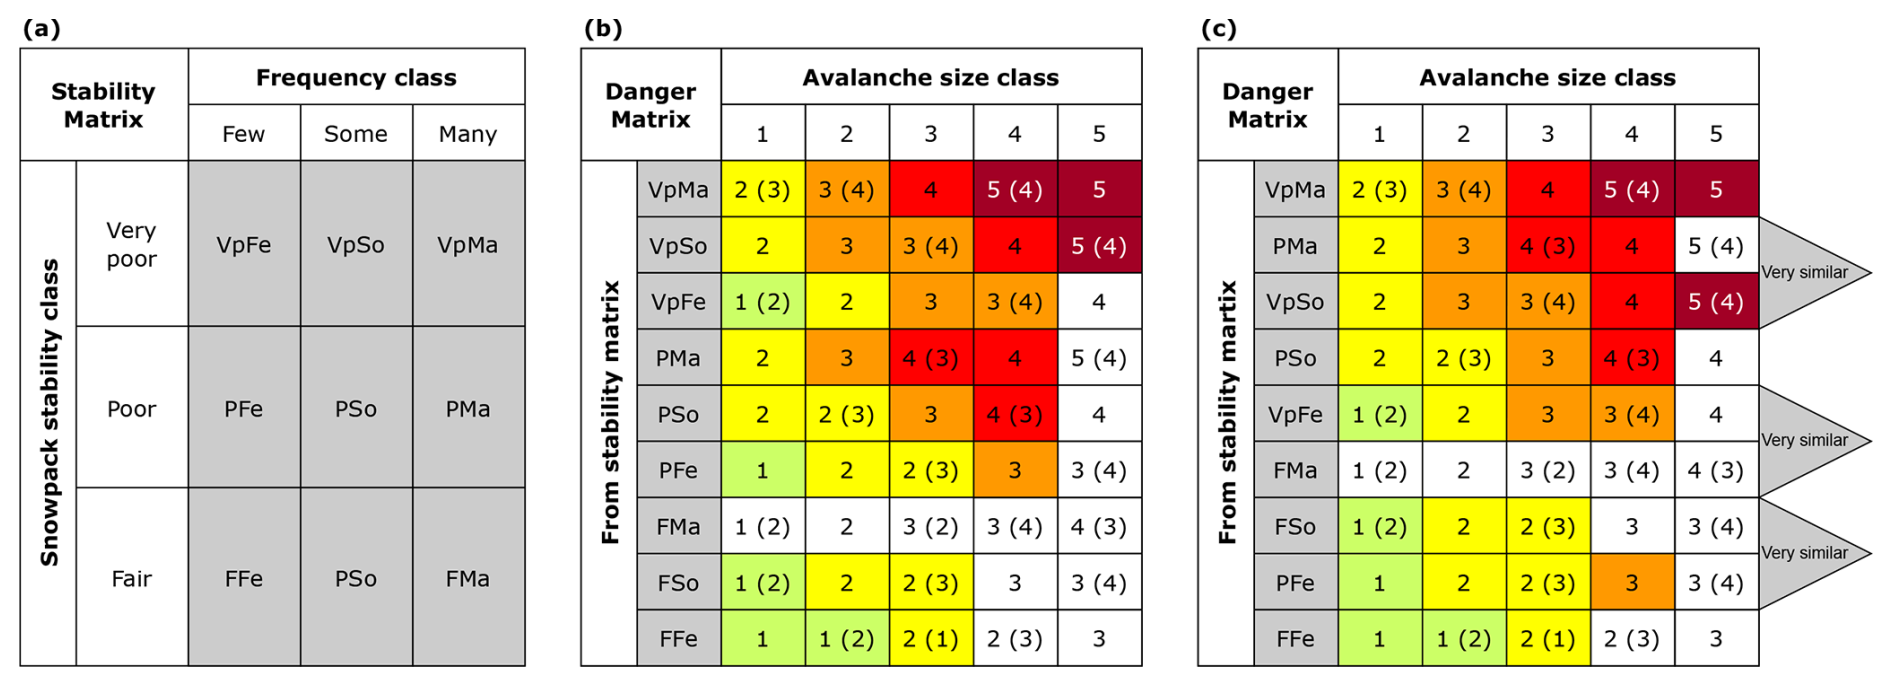
Figure 5EAWS Matrix (Fig. 3) rearranged to follow the CMAH workflow. (a) shows a matrix of snowpack stability and frequency combinations, representing the likelihood of avalanches as defined in the CMAH. In (b), these combinations are paired with avalanche size and reordered by increasing snowpack stability. (c) then sorts the same rows by decreasing resulting danger level (D), allowing visual identification of rows that produce very similar danger ratings. Rows where the maximum difference across all avalanche sizes is less than one danger level are marked with grey triangles and labeled “very similar.” These rows can be considered for merging without significant loss of information, as demonstrated in the compact Matrix shown in Fig. 6.
The layout also reveals structural improvements – such as merging similar rows – and highlights clusters of rarely used or unsupported combinations in the lower left corner (Fig. 6). Notably, problematic combinations like very poor–some–size 3 and poor–some–size 2 appear adjacent in this layout and span danger levels 2–4, highlighting the continuous nature of avalanche danger and emphasizing the need for refinement. Compared to earlier matrices, specifically the ADAM matrix (Fig. B2) and the data-driven matrix (Fig. B4), the rearranged EAWS Matrix (Fig. 6) offers greater detail and is fully compatible with current EAWS standards.
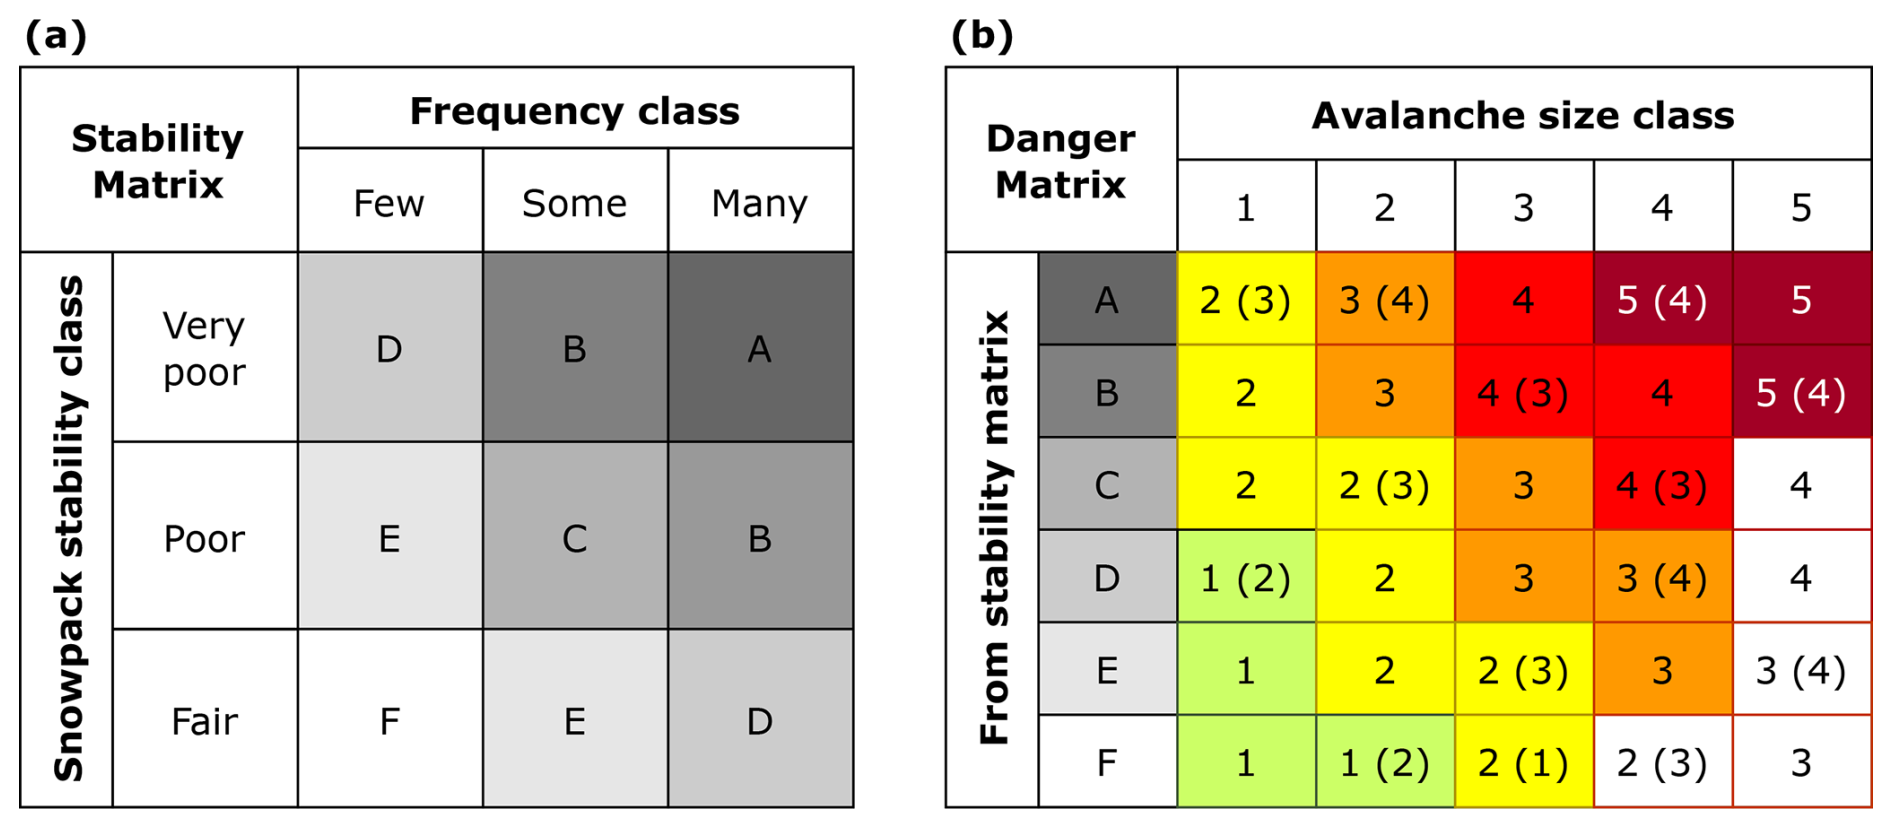
Both the EAWS Matrix (Fig. 3b) and its ADAM-style rearrangement (Fig. 6) yield identical danger level suggestions. However, the ADAM layout embeds the Matrix more naturally within the CMAH logic, leveraging its widespread use and conceptual clarity.
Public avalanche forecasting requires both a robust assessment of current and future snow and weather conditions and clear, consistent communication of the associated hazard. The process is inherently categorical, relying on defined factor classes, avalanche problems, and danger levels. The quality and consistency of these forecasts depend on forecaster expertise, data availability, and a shared understanding of these core categories.
In this paper, we presented the development of the EAWS Matrix, built through broad engagement from European avalanche warning services. The Matrix (Fig. 3b) offers a structured framework for determining avalanche danger levels (D) based on three key factors: snowpack stability, the frequency of snowpack stability, and avalanche size. It reflects the latest consensus among public avalanche forecasters across Europe and has been well received, both as an operational forecasting tool and as a training aid, supporting transparency and consistency in forecasting decisions.
The Matrix is not intended to be applied rigidly. It is a support tool designed to promote structured reasoning and facilitate expert judgment – particularly in complex or uncertain situations. Forecasters may select multiple cells to reflect complex conditions or uncertainty ranges. Additionally, enabling forecasters to indicate where within a class their assessment lies (e.g. near the lower or upper end of “some”) can support more nuanced and transparent evaluations.
The introduction of a secondary danger level (D2) in selected cells recognizes that uncertainty and disagreement still persist, especially in combinations with low survey response rates, different perceptions, or infrequent an/or inconsistent operational use. Particularly noteworthy are the cells very poor–some–size 3 and poor–some–size 2, which frequently span two danger levels (i.e. 3–4 and 2–3, respectively). These cases highlight the need for clearer definitions – especially of the frequency class some – and call for closer examination of transition zones between danger levels.
Improving the consistency of factor assessments will require progress on several fronts: increasing the availability of relevant data (e.g. high-resolution snowpack simulations), enhancing forecaster training and operational exchange, and better alignment between forecast resolution and the granularity of expert judgment. Evaluating and improving inter-rater reliability is critical for ensuring forecast quality.
The Matrix was developed as a standalone tool, but is closely aligned with the Conceptual Model of Avalanche Hazard (CMAH). It mirrors CMAH's structure while avoiding vague likelihood terms (e.g. “likely,” “possible”). The proposed alternative layout further clarifies this connection by explicitly separating likelihood (stability and frequency) from consequences (size), consistent with the structure of classic risk matrices.
At present, the Matrix, its terminology, and workflow diverge from the current European Avalanche Danger Scale (EADS). A revision of the EADS is therefore necessary to ensure alignment with current definitions, structures, and principles. The Matrix and its accompanying tools represent a significant step forward in harmonizing regional avalanche danger assessment and risk communication across Europe based on expert consensus, structured reasoning, and operational applicability. Ongoing monitoring, operational feedback, and collaborative refinement will be key to further progress.
A1 Remarks on snowpack stability
-
Depending on the avalanche type, snowpack stability is described by:
- a.
Failure initiation, crack propagation and slab tensile support (slab avalanche) (Reuter and Schweizer, 2018).
- b.
Loss of strength/bonding (loose-snow avalanche) (e.g. McClung and Schaerer, 2006).
- c.
Loss of basal friction and slab tensile and/or compressive support (glide-snow avalanche) (e.g. Bartelt et al., 2012).
- a.
-
Since snowpack stability is a local property, it is inversely related to the probability of avalanche release. Snowpack stability describes the snowpack to fail given a specific trigger (Statham et al., 2018), as for instance a person skiing a slope. It differs to avalanche occurrence probability which depends on scale and is the result of stability and its distribution (frequency of triggering locations) for a given area (Schweizer et al., 2020a).
-
The term local refers to a point which ranges in size from a potential trigger location or stability test to a starting zone.
-
All snowpack stability assessments may refer to either the future (forecast) or the present (nowcast), based on observations or models. For example, if the snowpack stability in a release area is considered fair today and a layer of new snow is expected by tomorrow, the stability of tomorrow's snowpack – including the new snow layer – must be reassessed. It is likely that stability will have decreased to poor or even very poor by that time.
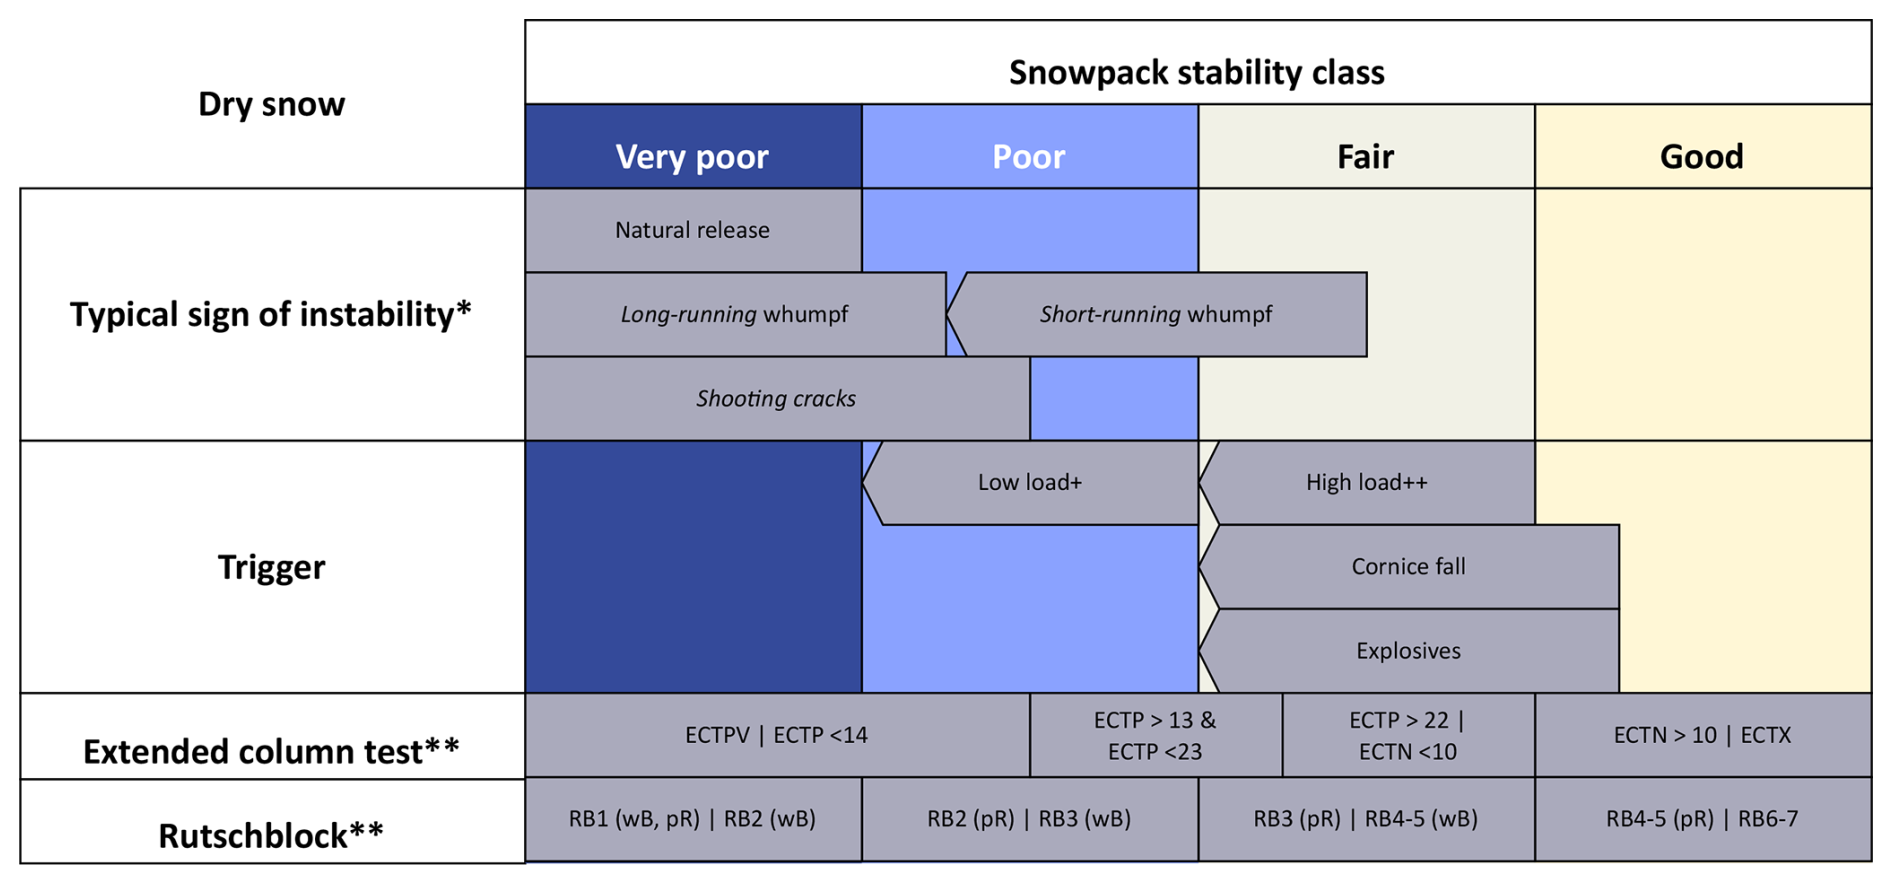
Figure A1Dry snow conditions: Common evidence or indications for snowpack stability classes focusing on dry-snow slab avalanches. Arrows indicate that existence towards lower stability classes is imperative. Natural avalanches are a clear indication for the class very poor, while a low and a high additional load are considered approximately equivalent to poor and fair stability. Observations and stability test results should be regarded as indicative only. Abbreviations: Extended Column Test (ECT), Rutschblock (RB), whole block (wB), partial release (pR). Schweizer et al. (2020a)*, Techel et al. (2020)**, +single skier not falling, ski-cut, ++single skier falling, group of skiers, person on foot.
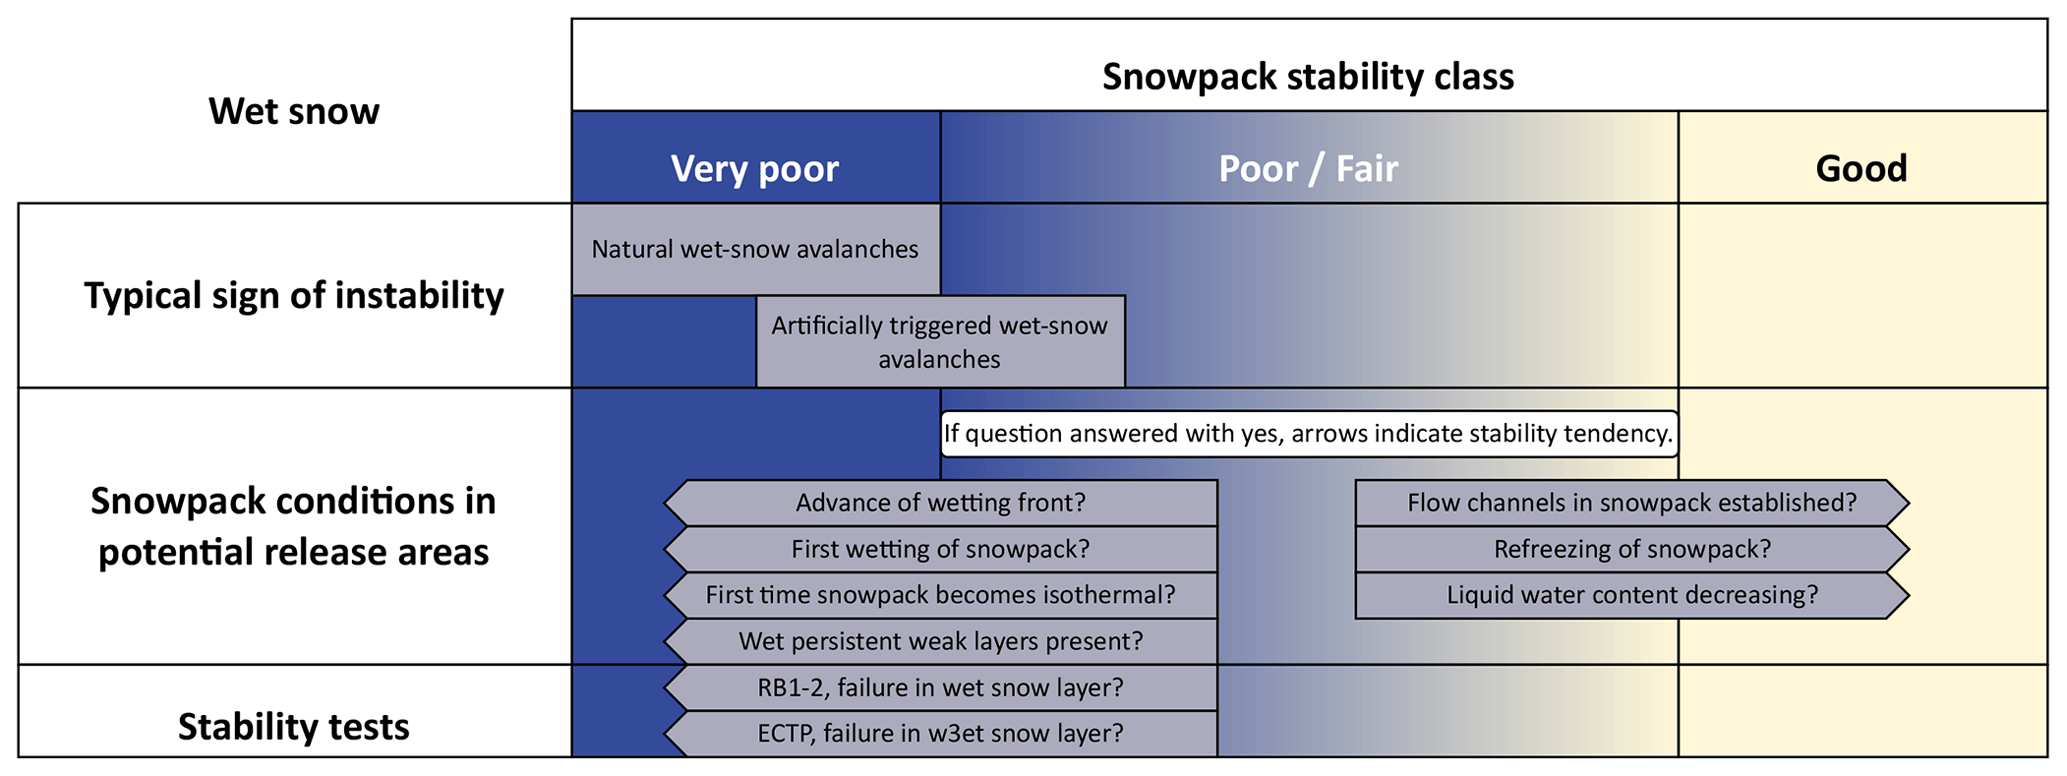
Figure A2Wet snow conditions: Common evidence or indications related to wet-snow stability. If no liquid water is present in the snowpack, wet-snow avalanches are not possible.
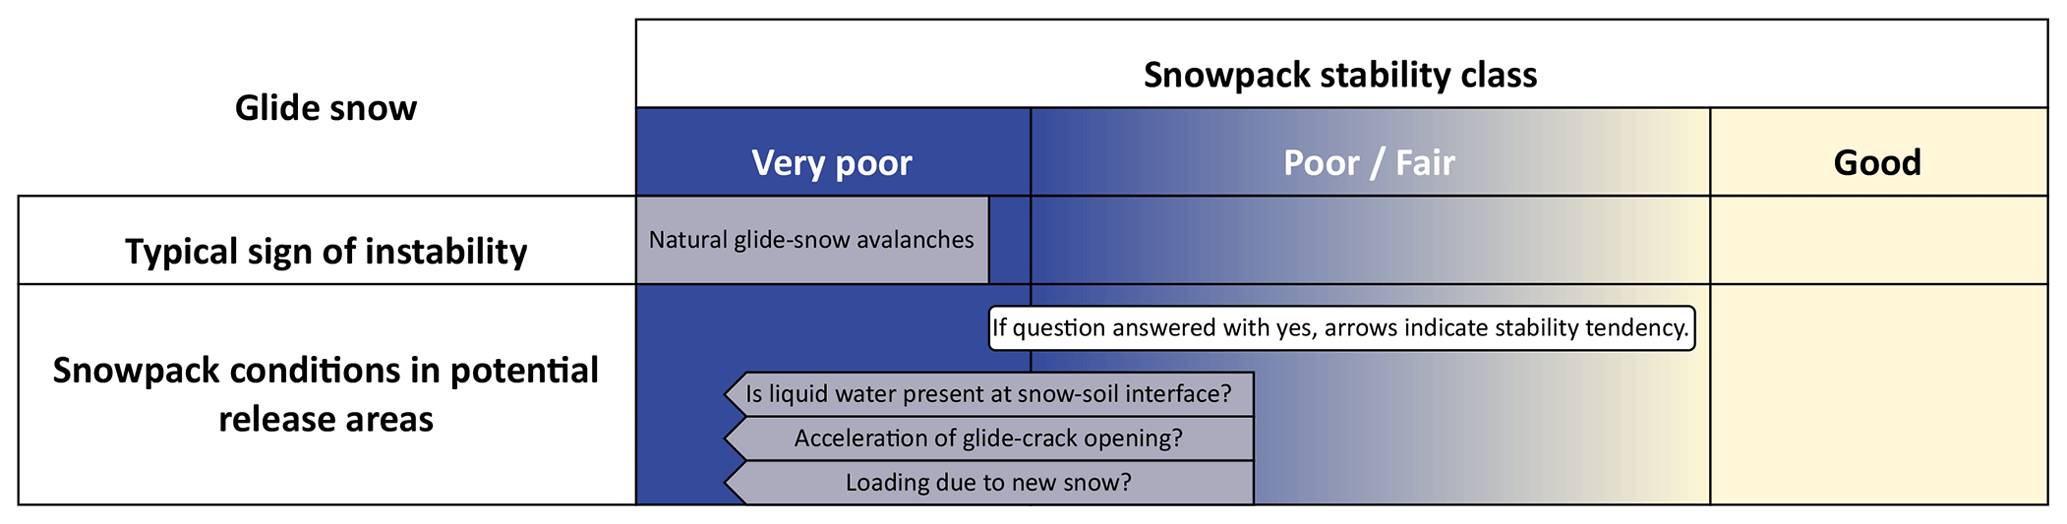
Figure A3Glide snow conditions: Common evidence or indications related to glide-snow stability. Glide-snow avalanches are not possible if there is no liquid water present at the snow-soil interface.
A2 Remarks on frequency of snowpack stability
-
The frequency distribution of snowpack stability refers to multiple points (i.e. stability tests, snowpack models or potential triggering locations) or avalanche starting zones.
-
The frequency must be assessed for a warning region which must be equal to or larger than the reference unit.
-
In theory, the definition asks for a percentage. In practice, however, this is often impossible to determine precisely as the frequency distribution must often be inferred from sparse data. Percentages or thresholds for many, some, a few, or none or nearly none differ depending on the measurement/evidence used or available. For instance, the percentage of slopes that produce spontaneous avalanches might be lower than the percentage of points with stability tests that indicate very poor stability though both may be called many.
A3 Remarks on avalanche size
Forecasters must estimate the largest avalanche size to be reckoned with for the given avalanche problem under the given or expected conditions – that is, the largest size class that can occur if an avalanche is triggered or released. For example, for a situation that could be described as: “If avalanches release, they may reach up to size-3.”. Avalanches of size-1, -2, and -3 are to be reckoned with, whereas size-4 and -5 avalanches are not expected. We therefore assign size-3 as the avalanche size to be used in the matrix (see Table A1).
Table A1Overview of avalanche size classes and description of expectation of occurrence. In this example, size-3 is the largest size to be reckoned with.
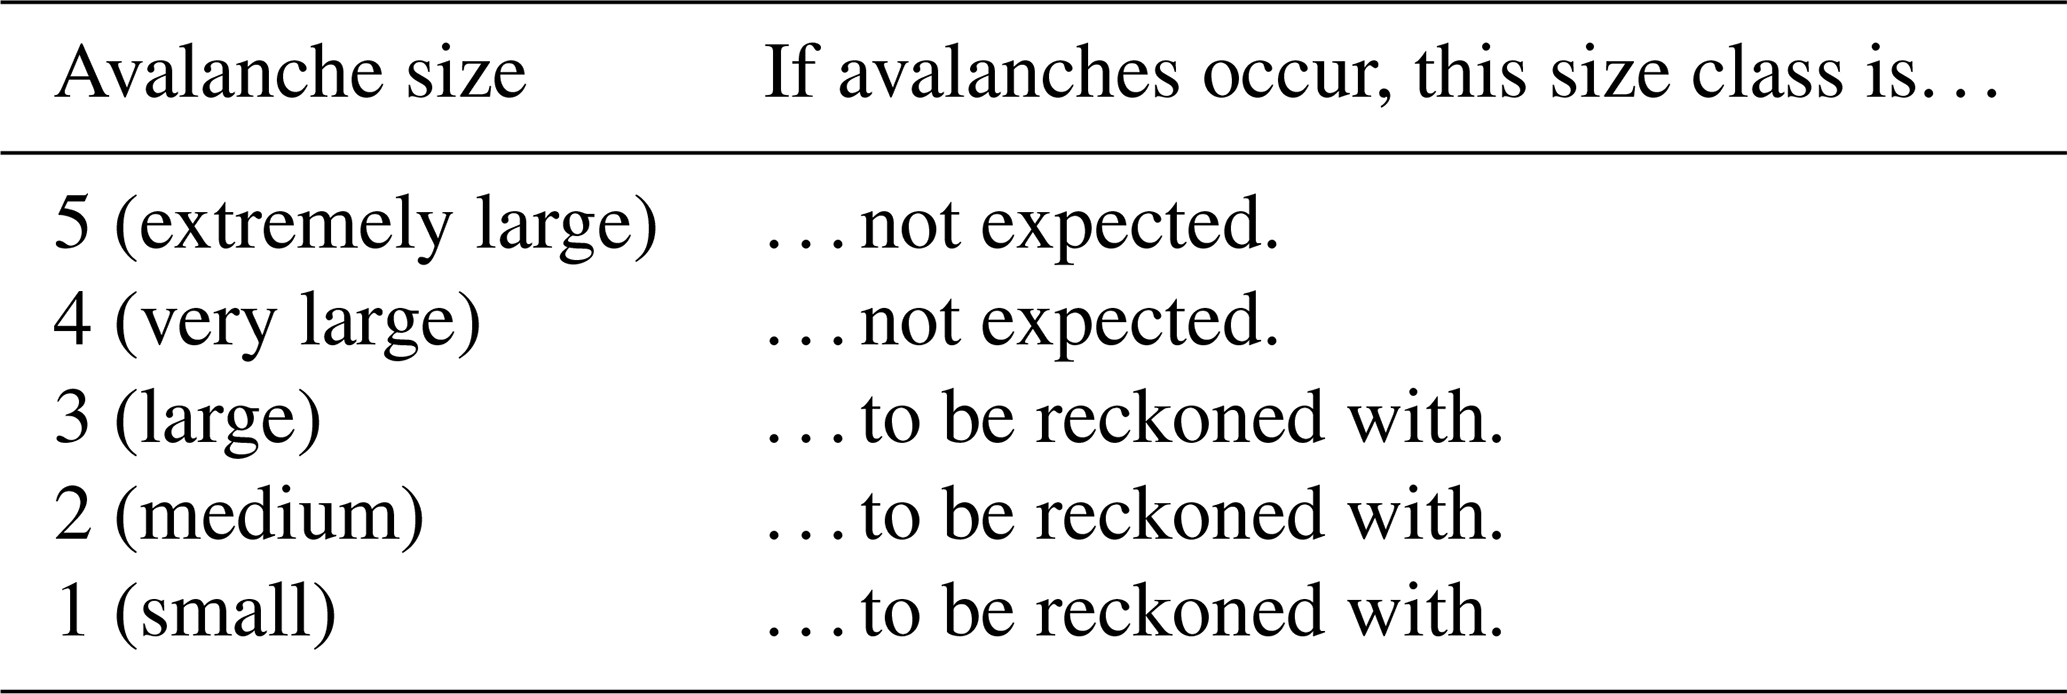
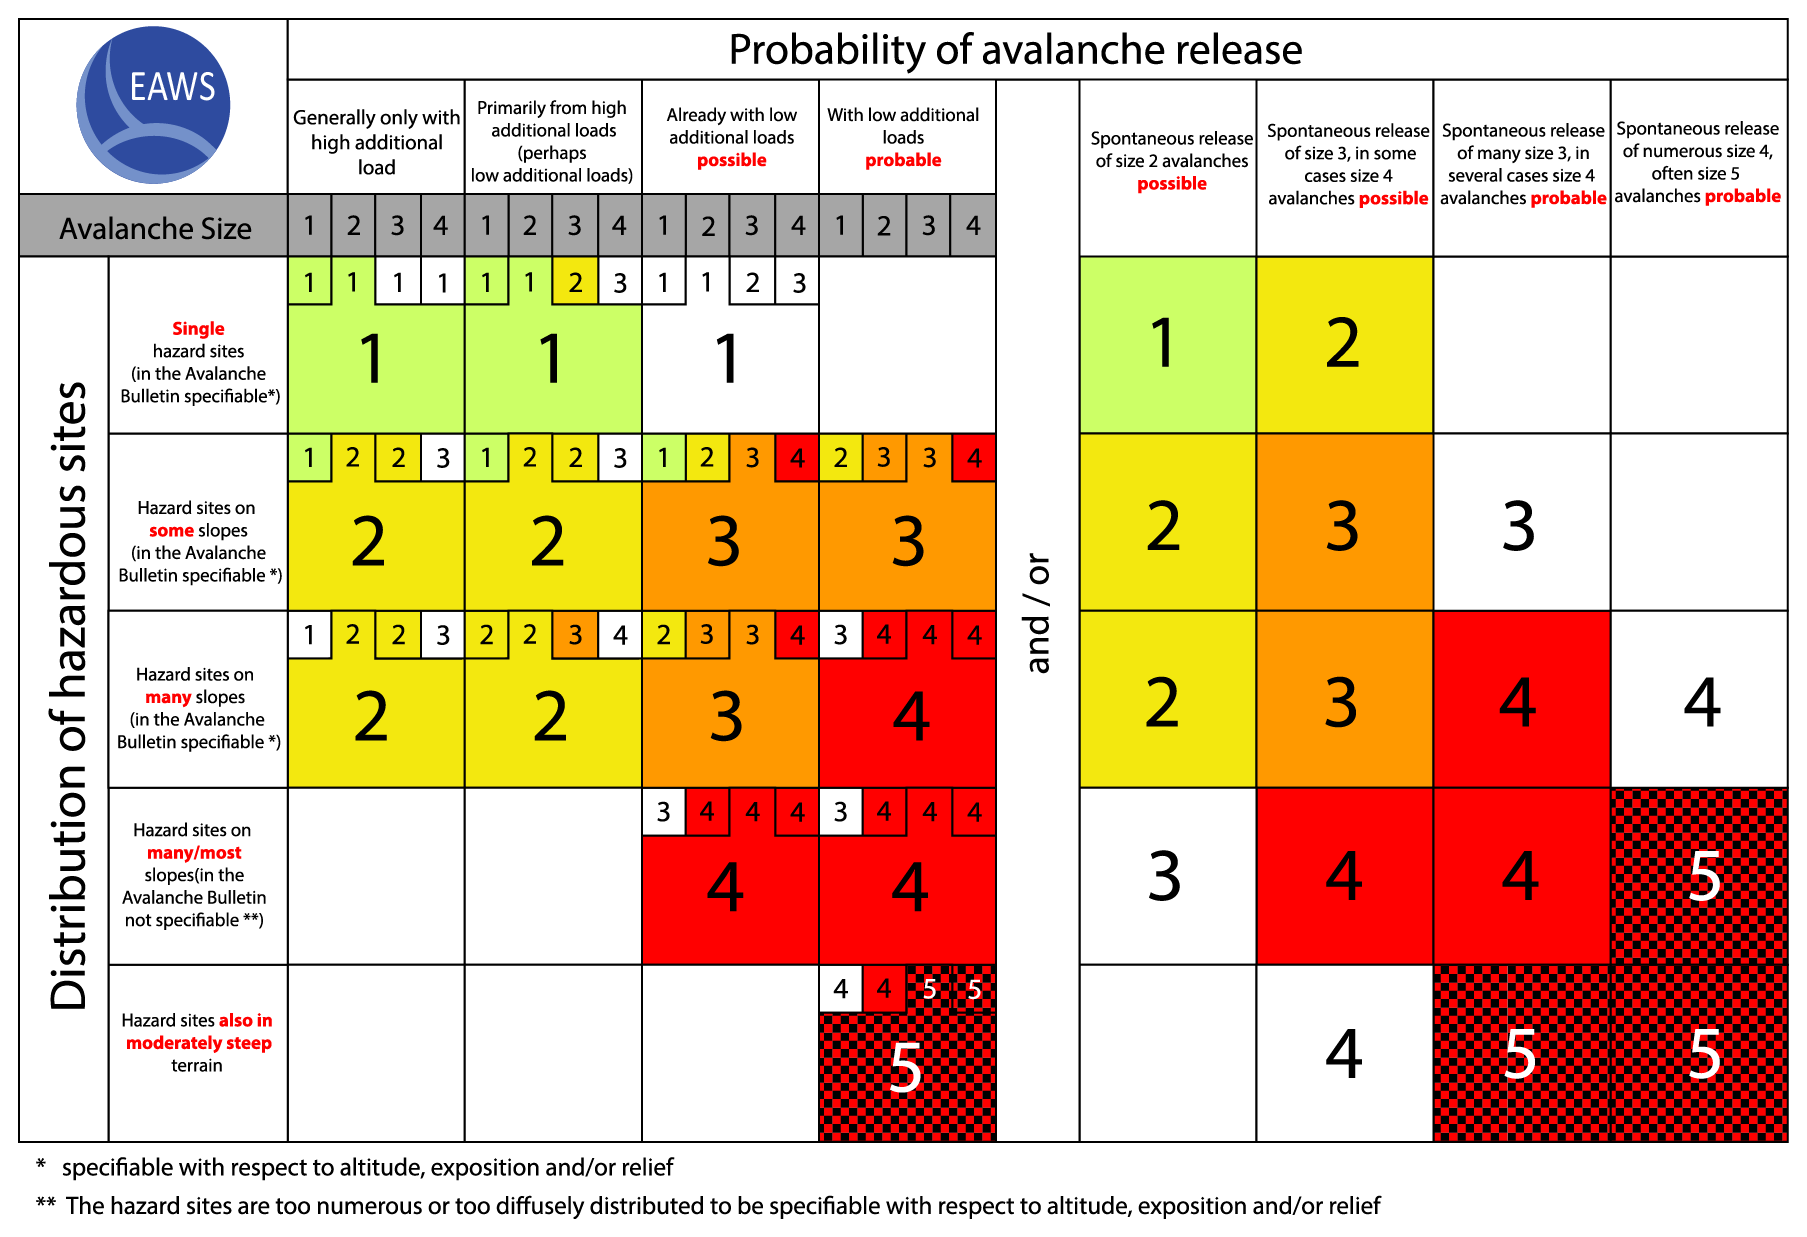
Figure B1EAWS-Matrix-v2017 (figure taken from EAWS, 2017), which is essentially identical to the Bavarian Matrix (BM, Müller et al., 2016) when considering the large cells only. The BM illustrates the distribution of hazardous zones against the probability of avalanche release. Initially, the left-hand side, which dealt with artificially triggered avalanches, lacked the factor of avalanche size entirely. Meanwhile, the right-hand side focused on naturally triggered avalanches, providing indications of expected sizes in the column headings. However, an update in 2017 integrated avalanche size (small cells) into the left-hand side as a third dimension, leading to its transformation into the EAWS-Matrix-v2017 (EAWS, 2017).
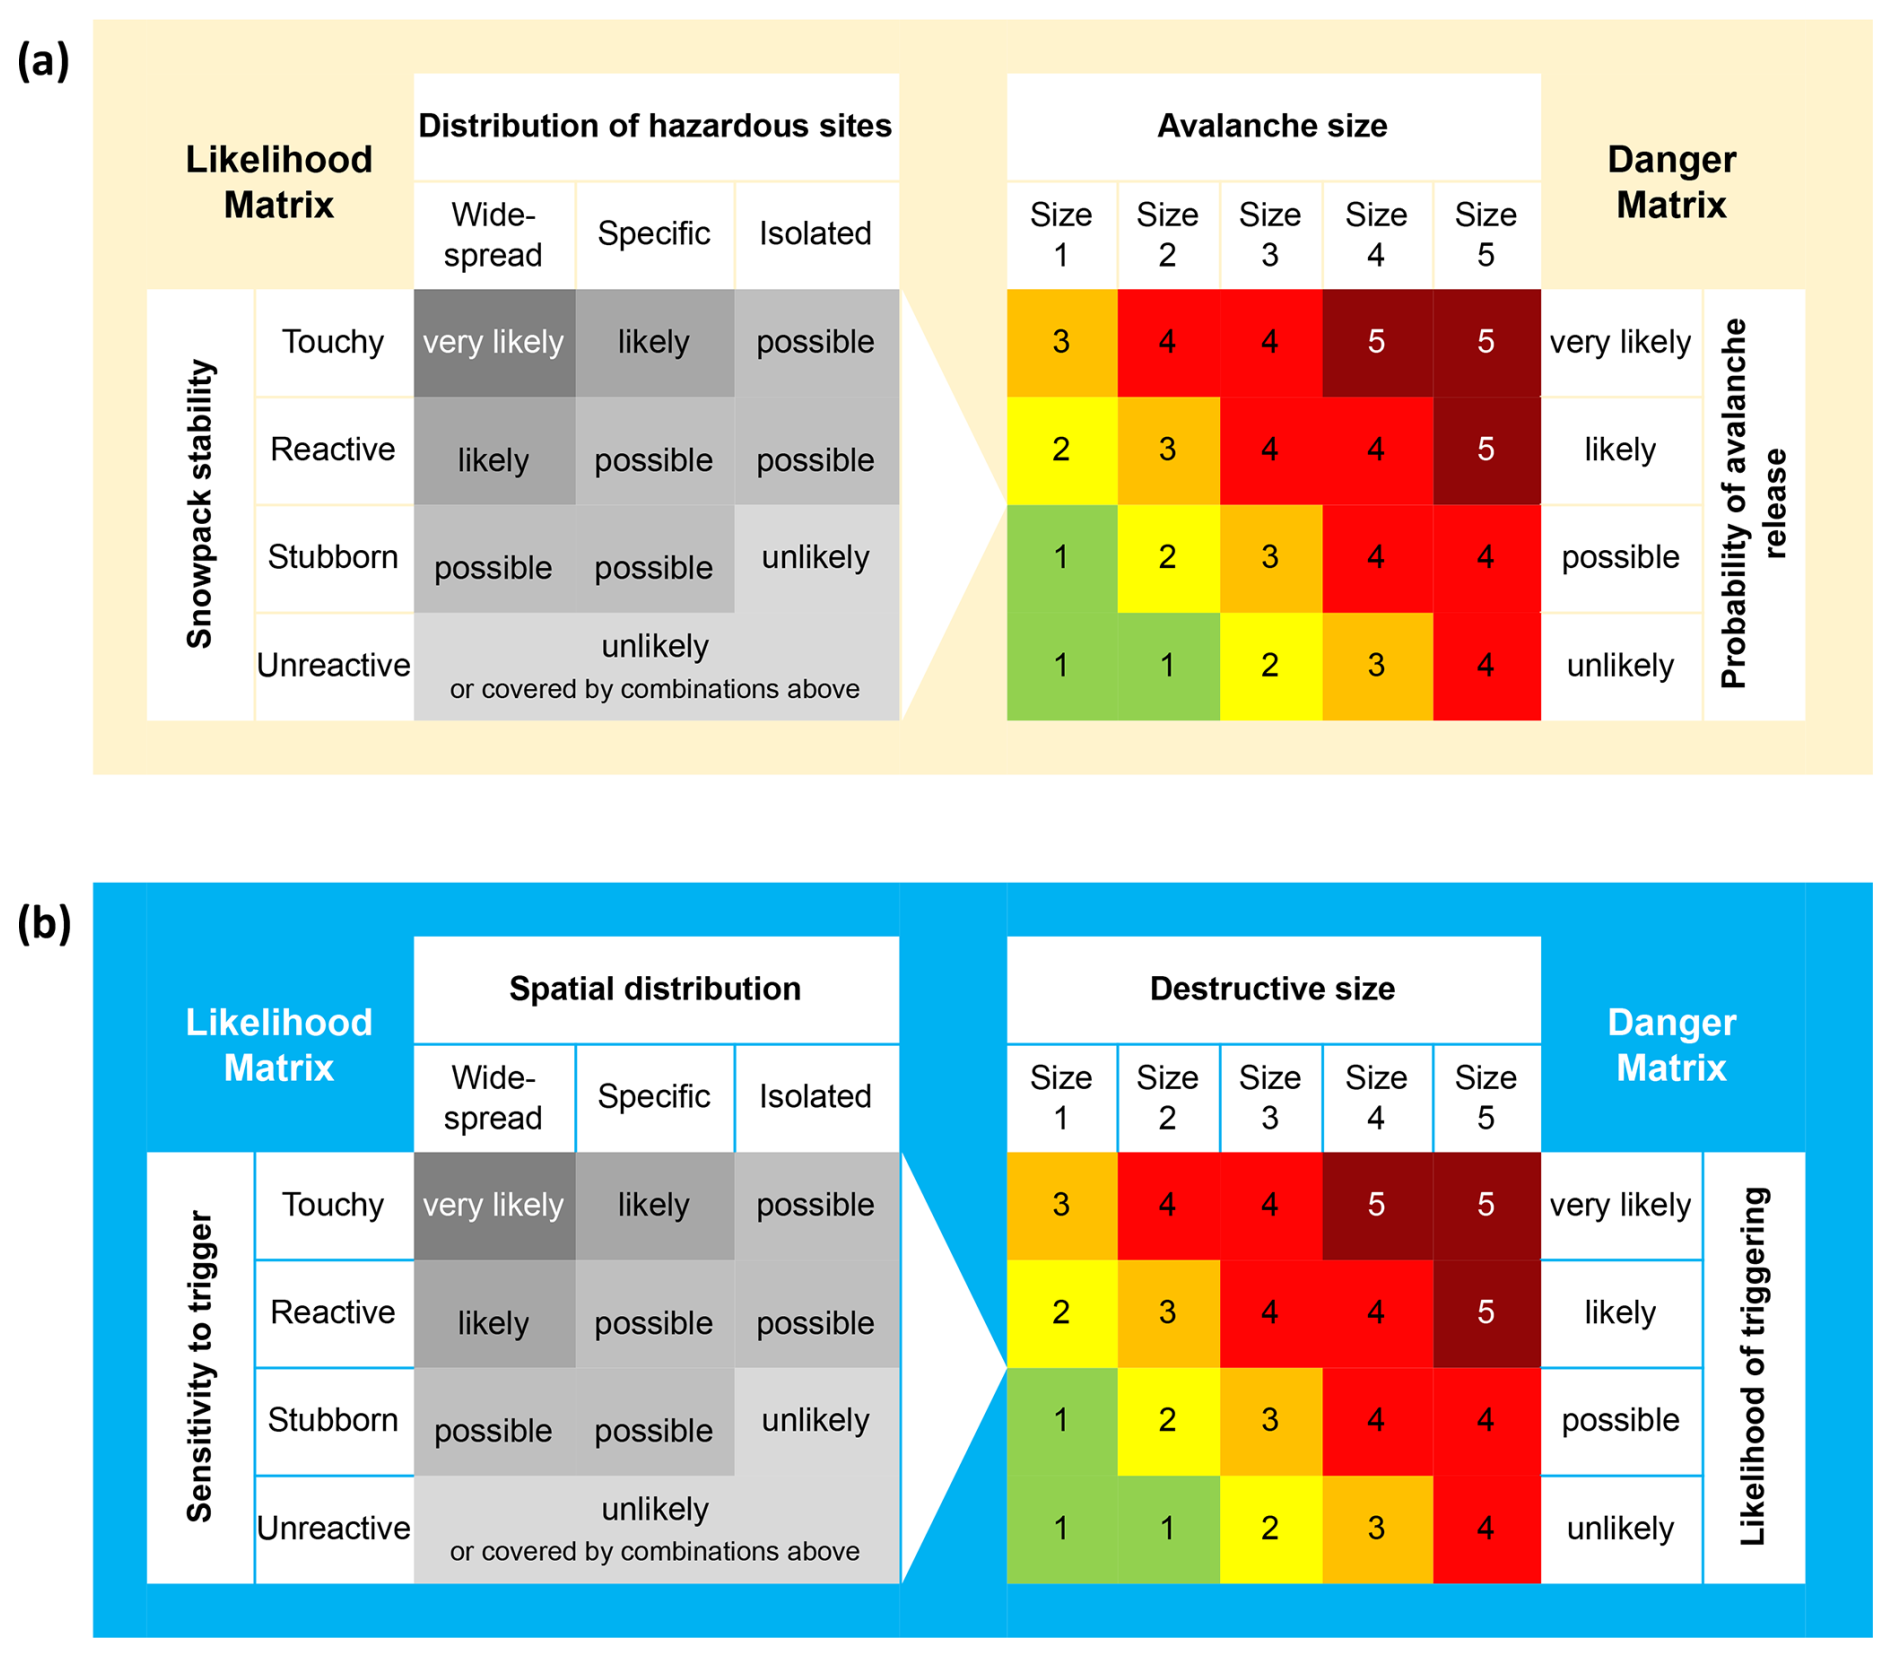
Figure B2Avalanche Danger Assessment Matrix (ADAM), as published by Müller et al. (2016), presents two versions: (a) aligning with the terminology of the European Avalanche Danger Scale (EADS, Table 1) and (b) adhering to the Conceptual Model of Avalanche Hazard (CMAH). ADAM consists of a likelihood matrix (left-hand side), which defines likelihood terms based on the spatial distribution and snowpack stability (sensitivity to trigger), and the Danger Matrix (right-hand side), which provides guidelines for determining the appropriate danger level by combining the likelihood of triggering with avalanche size.
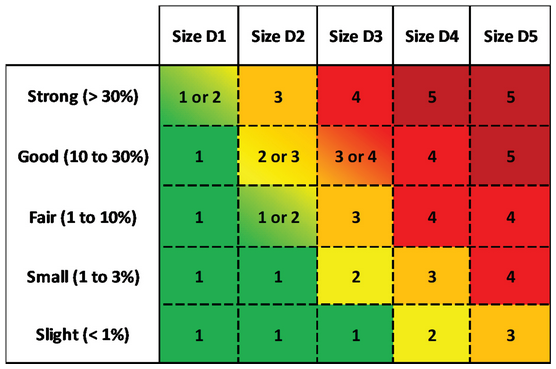
Figure B3Likelihood matrix proposed by Thumlert et al. (2020) addresses concerns highlighted in their survey, revealing a broad spectrum of interpretations of likelihood terms outlined in the Conceptual Model of Avalanche Hazard (CMAH, Statham et al., 2018) among avalanche professionals. The aim was to move away from likelihood terms commonly linked with higher probabilities and instead introduce levels of chance paired with a percentage range. The resulting likelihood matrix shown here bears resemblance to the danger matrix on the right-hand side of ADAM (Müller et al., 2016). Intermediate levels are recommended for situations with higher chances and smaller avalanches.
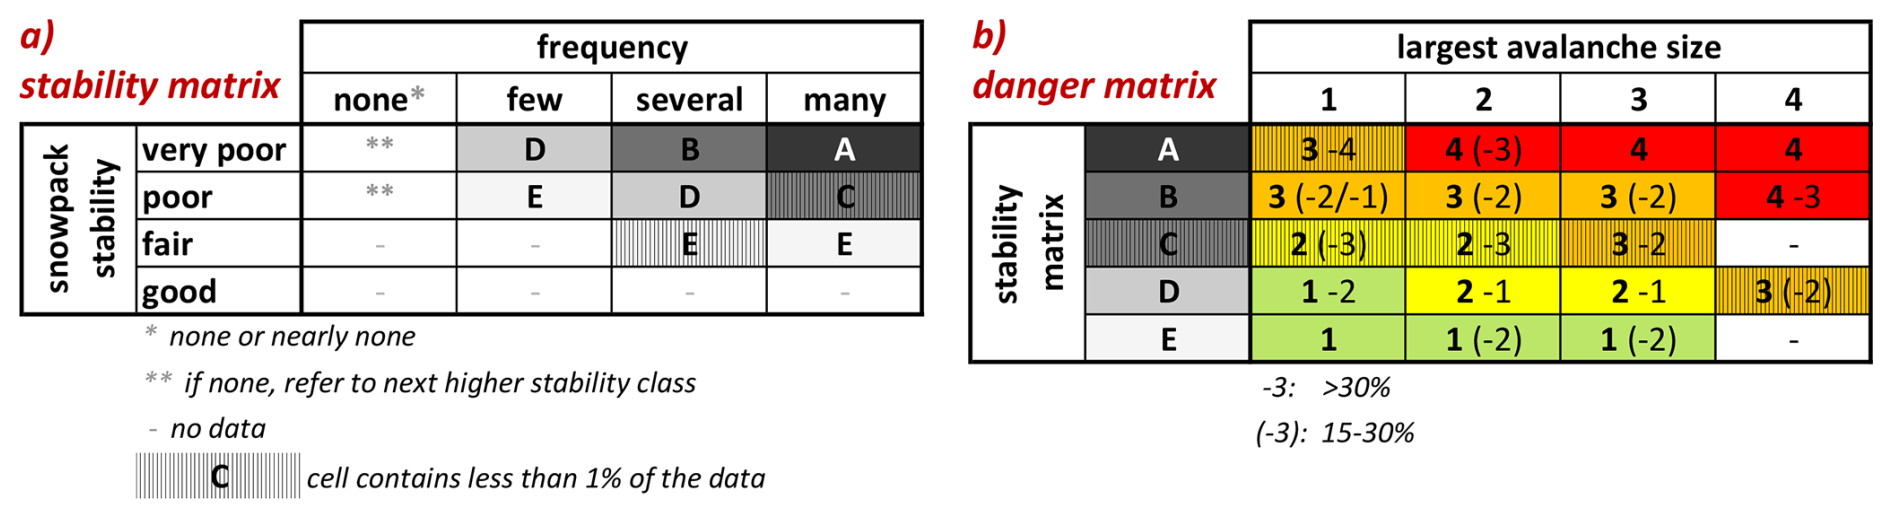
Figure B4Data-driven look-up table for avalanche danger assessment (figure and caption taken from Techel et al., 2020). The (a) stability matrix combines the frequency class of the most unfavorable snowpack stability class (columns) and the snowpack stability class (rows) to obtain a letter describing specific stability situations, the (b) danger matrix combines the largest avalanche size (columns) and the specific stability situations (letter) obtained in the stability matrix (rows) to assess the danger level. In (b): The most frequent danger level is shown in bold. If the second most frequent danger level was present more than 30 % of the cases, the value is shown with no brackets, if present between 15 %–30 % it is placed in brackets. In (a) and (b): Cells containing less than 1 % of the data are marked.
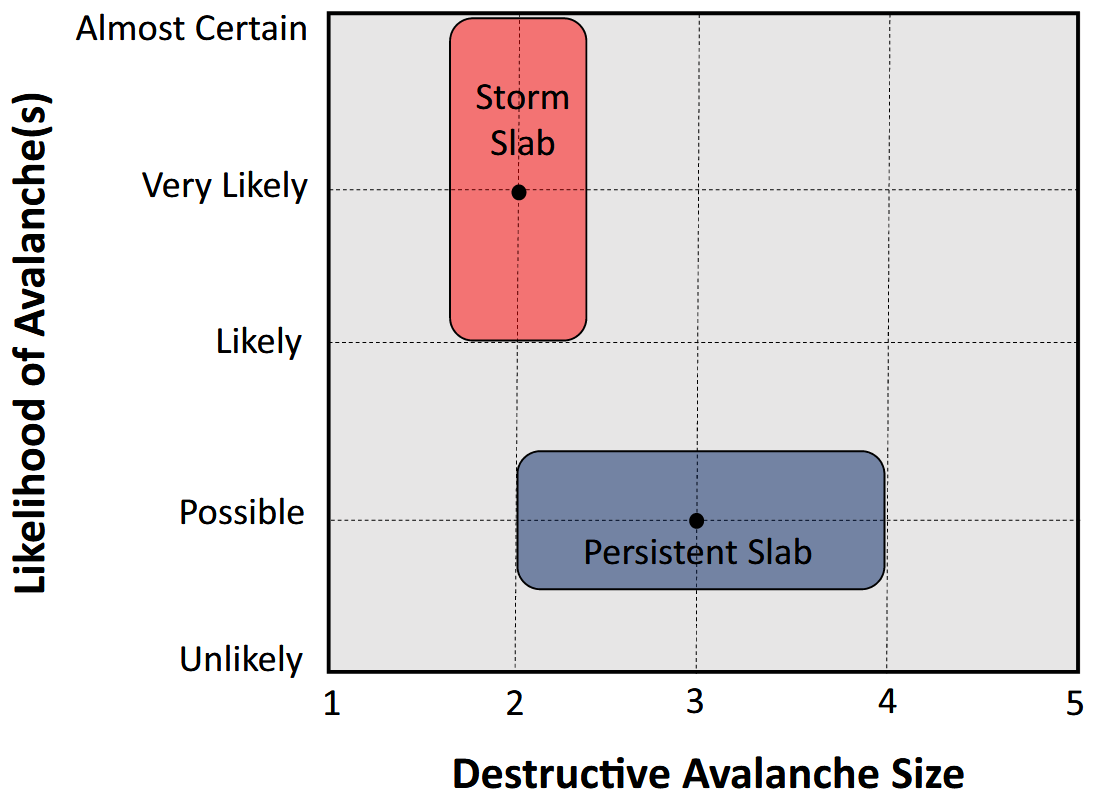
Figure C1Avalanche hazard chart illustrating two avalanche problems, adapted from Statham et al. (2018, Fig. 3). The y axis represents increasing likelihood of avalanches, while the x axis indicates increasing avalanche size. In this example, persistent slab avalanches are considered possible with sizes ranging from 2 to 4, whereas storm slab avalanches are assessed as likely to almost certain, predominantly around size 2.
The survey responses are available at https://doi.org/10.5281/zenodo.17086424 (Techel et al., 2025b).
KM (project lead, study design, data curation, writing, reviewing), FT (study design, data curation, formal analysis, writing, reviewing), CM (study design, data curation, writing, reviewing).
The contact author has declared that none of the authors has any competing interests.
Publisher's note: Copernicus Publications remains neutral with regard to jurisdictional claims made in the text, published maps, institutional affiliations, or any other geographical representation in this paper. While Copernicus Publications makes every effort to include appropriate place names, the final responsibility lies with the authors. Views expressed in the text are those of the authors and do not necessarily reflect the views of the publisher.
This article is part of the special issue “Latest developments in snow science and avalanche risk management research – merging theory and practice”. It is a result of the International snow science Workshop, Bend, Oregon, USA, 8–13 October 2023.
We thank Stefano Sofia, Petter Palmgren, Anne Dufour, Nicolas Roux, Fabiano Monti, Giacomo Villa, Guilem Martin Bellido, and Lorenzo Bertranda for invaluable discussions within the EAWS working group Matrix and Scale. We thank the EAWS workgroup coordinators Thomas Stucki and Thomas Feistl for their support over the years we were working on the EAWS Matrix. We greatly appreciate the valuable feedback provided by Rune Engeset, Markus Eckerstorfer, Matthias Walcher, and by the two reviewers Grant Statham and Erich Peitzsch. We further thank Editor Pascal Haegeli for his valuable feedback on several manuscript versions. Parts of the manuscript text were polished for language clarity using ChatGPT (OpenAI). The authors are fully responsible for the content and interpretation.
This paper was edited by Pascal Haegeli and reviewed by Grant Statham and Erich Peitzsch.
Ashton, R. H.: A review and analysis of research on the test–retest reliability of professional judgment, Journal of Behavioral Decision Making, 13, 277–294, https://doi.org/10.1002/1099-0771(200007/09)13:3<277::AID-BDM350>3.0.CO;2-B, 2000. a
Bartelt, P., Feistl, T., Bühler, Y., and Buser, O.: Overcoming the stauchwall: Viscoelastic stress redistribution and the start of full-depth gliding snow avalanches, Geophys. Res. Lett., 39, https://doi.org/10.1029/2012GL052479, 2012. a
Binder, M. and Mitterer, C.: Initializing snow cover simulations with observed snow profiles, in: Proceedings International Snow Science Workshop 2023, Bend, Oregon, 108–114 pp., https://arc.lib.montana.edu/snow-science/item.php?id=2861 (last access: 7 November 2025), 2023. a
Clark, T.: Exploring the link between the Conceptual Model of Avalanche Hazard and the North American Public Avalanche Danger Scale, Master's thesis, Simon Fraser University, 115 p., https://summit.sfu.ca/item/18786 (last access: 7 November 2025), 2019. a
Dennis, A. and Moore, M.: Evolution of public avalanche information: the North American experience with avalanche danger rating levels, in: Proceedings of the 1996 International Snow Science Workshop, Banff, Canada, 60–66, https://arc.lib.montana.edu/snow-science/item.php?id=1405 (last access: 7 November 2025), 1996. a
Dietrich, F. and Spiekermann, K.: Jury theorems, in: The Stanford Encyclopedia of Philosophy, edited by: Zalta, E. N. and Nodelman, U., Metaphysics Research Lab, Stanford University, Spring 2023 edn., ISSN 1095-5054, 2023. a
Duijm, N. J.: Recommendations on the use and design of risk matrices, Safety Science, 76, 21–31, 2015. a
EAWS: EAWS Matrix (version 2017), European Avalanche Warning Services, https://www.avalanches.org/standards/eaws-matrix/ (last access: 21 May 2022), 2017. a, b, c
EAWS: The revised EAWS-Matrix, presented at EAWS General Assembly, Davos, June 2022, https://www.avalanches.org/wp-content/uploads/2022/12/eaws_matrix_poster_v1.pdf (last access: 12 February 2024), 2022a. a
EAWS: Determination of the avalanche danger level in regional avalanche forecasting, European Avalanche Warning Services, https://www.avalanches.org/wp-content/uploads/2025/08/EAWS_matrix_definitions_EN.pdf (last access: 7 November 2025), 2022b. a, b
EAWS: Fatalities statistics, https://www.avalanches.org/fatalities/fatalities-statistics/, last access: 9 November 2023a. a
EAWS: Standards: European Avalanche Danger Scale, Tech. rep., European Avalanche Warning Services (EAWS), https://www.avalanches.org/wp-content/uploads/2022/09/European_Avalanche_Danger_Scale-EAWS.pdf, last access: 5 July 2023b. a
EAWS: Standards: Information pyramid, https://www.avalanches.org/standards/information-pyramid/, last access: 13 November 2023c. a
EAWS: EAWS standards, https://www.avalanches.org/standards/ (last access: 7 November 2025), 2025. a, b, c, d, e
Elder, K. and Armstrong, B.: A quantitative approach for verifying avalanche hazard ratings, in: Symposium at Davos 1986 on Avalanche Formation, Movement and Effects, Vol. 162 of International Association of Hydrological Sciences Publication, 593–603, 1987. a
Föhn, P.: Das Schweizerische Lawinenbulletin – eine Interpretationshilfe für den Benutzer (translation: The Swiss avalanche bulletin – guideline for users), Tech. Rep. 38, Eidgenössisches Institut für Schnee- und Lawinenforschung SLF, Weissfluhjoch/Davos, Switzerland, 1985. a, b
Furman, N., Shooter, W., and Schumann, S.: The roles of heuristics, avalanche forecast, and risk propensity in the decision making of backcountry skiers, Leisure Sciences, 32, 453–469, https://doi.org/10.1080/01490400.2010.510967, 2010. a
Giraud, G.: MEPRA: an expert system for avalanche risk forecasting, in: Proccedings International Snow Science Workshop ISSW 1992, Breckenridge, CO, USA, 97–106, 583–591, https://arc.lib.montana.edu/snow-science/item.php?id=1242 (last access: 7 November 2025), 1992. a
Giraud, G., Lafeuille, J., and Pahaut, E.: Evaluation de la qualité de la prevision du risque d'avalanche, in: Avalanche Formation, Movement and Effects, Proceedings of the Davos Symposium, September 1986, Int. Ass. Hydrol. Sci. Vol. 162, 1987. a
Hafner, E. D., Techel, F., Daudt, R. C., Wegner, J. D., Schindler, K., and Bühler, Y.: Avalanche size estimation and avalanche outline determination by experts: reliability and implications for practice, Nat. Hazards Earth Syst. Sci., 23, 2895–2914, https://doi.org/10.5194/nhess-23-2895-2023, 2023. a
Herla, F., Haegeli, P., and Mair, P.: A data exploration tool for averaging and accessing large data sets of snow stratigraphy profiles useful for avalanche forecasting, The Cryosphere, 16, 3149–3162, https://doi.org/10.5194/tc-16-3149-2022, 2022. a
Herla, F., Binder, M., Lanzanasto, N., Perfller, M., Widforss, A., Reisecker, M., Müller, K., and Mitterer, C.: Synthesizing regional snowpack stability and avalanche problems in the operational AWSOME framework, in: Proceedings, International Snow Science Workshop, Tromsø, Norway, 272–277, https://arc.lib.montana.edu/snow-science/objects/ISSW2024_P1.33.pdf (last access: 7 November 2025), 2024. a
Hutter, V., Techel, F., and Purves, R. S.: How is avalanche danger described in textual descriptions in avalanche forecasts in Switzerland? Consistency between forecasters and avalanche danger, Nat. Hazards Earth Syst. Sci., 21, 3879–3897, https://doi.org/10.5194/nhess-21-3879-2021, 2021. a, b, c, d, e, f
LaChapelle, E.: The fundamental process in conventional avalanche forecasting, J. Glaciol., 26, 75–84, https://doi.org/10.3189/S0022143000010601, 1980. a
Lazar, B., Trautmann, S., Cooperstein, M., Greene, E., and Birkeland, K.: North American avalanche danger scale: Do backcountry forecasters apply it consistently?, in: Proceedings International Snow Science Workshop, 2–7 October 2016, Breckenridge, CO, 457–465, https://arc.lib.montana.edu/snow-science/objects/ISSW16_O20.01.pdf (last access: 7 November 2025), 2016. a, b
Mayer, S., van Herwijnen, A., Techel, F., and Schweizer, J.: A random forest model to assess snow instability from simulated snow stratigraphy, The Cryosphere, 16, 4593–4615, https://doi.org/10.5194/tc-16-4593-2022, 2022. a
McClung, D.: The elements of applied avalanche forecasting part I: The human issues, Nat. Hazards, 26, 111–129, 2002. a
McClung, D. and Schaerer, P.: The Avalanche Handbook, 3rd edn., The Mountaineers, Seattle, WA, ISBN 13:978-0-89886-809-8, 2006. a
Meister, R.: Country-wide avalanche warning in Switzerland, in: Proceedings ISSW 1994. International Snow Science Workshop, 30 October–3 November 1994, Snowbird, UT, 58–71, 1995. a, b
Mitterer, C. and Mitterer, L.: 25 Jahre Europäische Lawinengefahrenstufenskala, Bergundsteigen, 67–76, https://assets.bergundsteigen.com/2021/08/67-7625-jahre-europaeische-lawinengefahrenstufenskala.pdf (last access: 7 November 2025), 2018. a
Morgan, A., Haegeli, P., Finn, H., and Mair, P.: A user perspective on the avalanche danger scale – insights from North America, Nat. Hazards Earth Syst. Sci., 23, 1719–1742, https://doi.org/10.5194/nhess-23-1719-2023, 2023. a
Morgan, M. G.: Characterizing, analyzing, and communicating uncertainty, Cambridge University Press, https://doi.org/10.1017/9781316882665.009, 209–243, 2017. a, b
Müller, K., Mitterer, C., Engeset, R., Ekker, R., and Kosberg, S.: Combining the conceptual model of avalanche hazard with the Bavarian matrix, in: Proceedings International Snow Science Workshop, 2–7 October 2016, Breckenridge, CO, USA, 472–479, https://arc.lib.montana.edu/snow-science/objects/ISSW16_O20.03.pdf (last access: 7 November 2025), 2016. a, b, c, d, e, f, g, h
Müller, K., Techel, F., Mitterer, C., Feistl, T., Sofia, S., Roux, N., Palmgren, P., Bellido, G., and Bertranda, L.: The EAWS Matrix, a look-up table for regional avalanche danger level assessments, and its underlying concept, in: Proceedings International Snow Science Workshop, 8–13 October, Bend, OR, https://arc.lib.montana.edu/snow-science/objects/ISSW2023_O5.05.pdf (last access: 7 November 2025), 2023. a
Murphy, A. H.: What is a good forecast? An essay on the nature of goodness in weather forecasting, Weather Forecast., 8, 281–293, https://doi.org/10.1175/1520-0434(1993)008<0281:WIAGFA>2.0.CO;2, 1993. a, b
Ogden, C. K. and Richards, I. A.: The Meaning of Meaning: A Study of the Influence of Language upon Thought and of the Science of Symbolism, Vol. 29, Harcourt, Brace, ISBN O-15-658446-8, https://pure.mpg.de/rest/items/item_2366948_3/component/file_2366947/content (last access: 7 November 2025), 1925. a
Pérez-Guillén, C., Techel, F., Hendrick, M., Volpi, M., van Herwijnen, A., Olevski, T., Obozinski, G., Pérez-Cruz, F., and Schweizer, J.: Data-driven automated predictions of the avalanche danger level for dry-snow conditions in Switzerland, Nat. Hazards Earth Syst. Sci., 22, 2031–2056, https://doi.org/10.5194/nhess-22-2031-2022, 2022. a
Reuter, B. and Schweizer, J.: Describing snow instability by failure initiation, crack propagation, and slab tensile support, Geophys. Res. Lett., 45, 7019–7027, https://doi.org/10.1029/2018GL078069, 2018. a, b, c
Roiser, J. P. and Sahakian, B. J.: Hot and cold cognition in depression, CNS Spectrums, 18, 139–149, https://doi.org/10.1017/S1092852913000072, 2013. a
Rowe, G. and Wright, G.: Expert Opinions in Forecasting: The Role of the Delphi Technique, Springer US, Boston, MA, https://doi.org/10.1007/978-0-306-47630-3_7, 125–144, 2001. a
Schweizer, J. and Camponovo, C.: The skier's zone of influence in triggering slab avalanches, Ann. Glaciol., 32, 314–320, https://doi.org/10.3189/172756401781819300, 2001. a
Schweizer, J. and Föhn, P.: Avalanche forecasting – an expert system approach, J. Glaciol., 42, 318–332, https://doi.org/10.3189/S0022143000004172, 1996. a
Schweizer, J., Kronholm, K., Jamieson, J. B., and Birkeland, K. W.: Review of spatial variability of snowpack properties and its importance for avalanche formation, Cold Reg. Sci. Technol., 51, 253–272, https://doi.org/10.1016/j.coldregions.2007.04.009, 2008. a
Schweizer, J., Mitterer, C., Reuter, B., and Techel, F.: Avalanche danger level characteristics from field observations of snow instability, The Cryosphere, 15, 3293–3315, https://doi.org/10.5194/tc-15-3293-2021, 2021. a, b
Schweizer, J., Mitterer, C., Techel, F., Stoffel, A., and Reuter, B.: On the relation between avalanche occurrence and avalanche danger level, The Cryosphere, 14, 737–750, https://doi.org/10.5194/tc-14-737-2020, 2020b. a
SLF: Schnee und Lawinen in den Schweizer Alpen. Winter 1951/52, Eidg. Institut für Schnee- und Lawinenforschung Weissfluhjoch Davos, 231 pages (Nr. 15), https://www.research-collection.ethz.ch/bitstreams/9fdcf12c-7bae-4b66-9679-98fbf429ac16/download (last access: 7 November 2025), 1953. a
SLF: Interpretationshilfe zum Lawinenbulletin des Eidgenössischen Institutes für Schnee- und Lawinenforschung Weissfluhjoch, Davos, in: Mitteilung des Eidgenössischen Institutes für Schnee- und Lawinenforschung, Vol. 49, p. 24, Eidgenössischen Institutes für Schnee- und Lawinenforschung, https://www.slf.ch/fileadmin/user_upload/SLF/Lawinenbulletin_Schneesituation/Wissen_zum_Lawinenbulletin/Interpretationshilfe/Interpretationshilfe_DE.pdf (last access: 7 November 2025), 1993. a
Statham, G., Haegeli, P., Birkeland, K., Greene, E., Israelson, C., Tremper, B., Stethem, C., McMahon, B., White, B., and Kelly, J.: The North American public avalanche danger scale, in: Proceedings International Snow Science Workshop, 17–22 Oct, Lake Tahoe, CA, 117–123, https://arc.lib.montana.edu/snow-science/item/353 (last access: 7 November 2025), 2010. a
Statham, G., Haegeli, P., Greene, E., Birkeland, K., Israelson, C., Tremper, B., Stethem, C., McMahon, B., White, B., and Kelly, J.: A conceptual model of avalanche hazard, Nat. Hazards, 90, 663–691, 2018. a, b, c, d, e, f, g, h, i
Stewart, T. R.: Improving reliability in judgemental forecasting, in: Principles of Forecasting: A Handbook for Researchers and Practitioners, Springer Science + Business Media, LLC, 81–106, https://doi.org/10.1007/978-0-306-47630-3_5, 2001. a, b
Stewart, T. and Lusk, C.: Seven components of judgmental forecasting skill: implications for research and the improvement of forecasts, Journal of Forecasting, 13, 579–599, 1994. a
Techel, F., Zweifel, B., and Winkler, K.: Analysis of avalanche risk factors in backcountry terrain based on usage frequency and accident data in Switzerland, Nat. Hazards Earth Syst. Sci., 15, 1985–1997, https://doi.org/10.5194/nhess-15-1985-2015, 2015. a
Techel, F., Mitterer, C., Ceaglio, E., Coléou, C., Morin, S., Rastelli, F., and Purves, R. S.: Spatial consistency and bias in avalanche forecasts – a case study in the European Alps, Nat. Hazards Earth Syst. Sci., 18, 2697–2716, https://doi.org/10.5194/nhess-18-2697-2018, 2018. a, b, c, d, e
Techel, F., Müller, K., and Schweizer, J.: On the importance of snowpack stability, the frequency distribution of snowpack stability, and avalanche size in assessing the avalanche danger level, The Cryosphere, 14, 3503–3521, https://doi.org/10.5194/tc-14-3503-2020, 2020. a, b, c, d, e, f, g, h, i, j, k, l, m
Techel, F., Lucas, C., Pielmeier, C., Müller, K., and Morreau, M.: Unreliability in expert estimates of factors determining avalanche danger and impact on danger level estimation with the Matrix, in: Proceedings International Snow Science Workshop, Tromsø, Norway, 23–29 September 2024, 264–271, https://arc.lib.montana.edu/snow-science/objects/ISSW2024_P1.31.pdf (last access: 7 November 2025), 2024. a, b, c, d, e, f, g, h
Techel, F., Müller, K., Marquardt, C., and Mitterer, C.: The EAWS matrix, a look-up table to determine the regional avalanche danger level (Part B): Operational testing and use, EGUsphere [preprint], https://doi.org/10.5194/egusphere-2025-3349, 2025a. a, b, c, d, e, f, g, h
Techel, F., Müller, K., and Mitterer, C.: Data for publication: The EAWS matrix, a decision support tool to determine the regional avalanche danger level (Part A): Conceptual development, Natural Hazards Earth System Sciences, Zenodo [data set], https://doi.org/10.5281/zenodo.17086424, 2025b. a
Techel, F., Purves, R. S., Mayer, S., Schmudlach, G., and Winkler, K.: Can model-based avalanche forecasts match the discriminatory skill of human danger-level forecasts? A comparison from Switzerland, Nat. Hazards Earth Syst. Sci., 25, 3333–3353, https://doi.org/10.5194/nhess-25-3333-2025, 2025. a
Thumlert, S., Statham, G., and Jamieson, B.: The likelihood scale in avalanche forecasting, The Avalanche Review, 38, 31–33, 2020. a, b, c, d
Winkler, K., Schmudlach, G., Degraeuwe, B., and Techel, F.: On the correlation between the forecast avalanche danger and avalanche risk taken by backcountry skiers in Switzerland, Cold Reg. Sci. Technol., 188, 103299, https://doi.org/10.1016/j.coldregions.2021.103299, 2021. a
- Abstract
- Introduction
- Background
- Development step 1: Definitions
- Development step 2: Forecaster survey
- Development step 3: Operational testing
- The EAWS Matrix
- Conclusions
- Appendix A: Supplementary notes on definitions of Matrix factors
- Appendix B: Avalanche Danger Matrices
- Appendix C: CMAH hazard chart
- Data availability
- Author contributions
- Competing interests
- Disclaimer
- Special issue statement
- Acknowledgements
- Review statement
- References