the Creative Commons Attribution 4.0 License.
the Creative Commons Attribution 4.0 License.
 | 29 Oct 2025
Assessment of coastal inundation triggered by multiple drivers in Ca Mau Peninsula, Vietnam
Quan Quan Le
Viet Dung Nguyen
Hai Dac Do
Hung Duc Pham
Tan Hong Cao
Toan Quang To
Melissa Wood
Ivan D. Haigh
The Ca Mau Peninsula (CMP) plays a critical role in the agricultural and aquaculture productivity of the Vietnamese Mekong Delta (VMD), central to regional food security as well as the population's economic and social welfare. Unfortunately, the region faces persistent flood risks from seasonal Mekong flows and high tides. Climate change is expected to worsen these threats through sea level rise, extreme rainfall, and more frequent storm surges, while, human-induced factors such as land subsidence and riverbed lowering can further complicate the situation. Quantification of potential hazards associated with these drivers is therefore essential for shaping the future sustainability for the region and its ability to adapt to both current and forthcoming changes. In this study, we assess the impact of compounding hazards by developing regional inundation maps and analysing flood dynamics in the CMP using a large-scale hydrodynamic model encompassing the entire VMD. The model was enhanced with updated bathymetric data for major river channels, along with synchronized information on the dyke across the VMD from the 2018–2019 period, resulting in a substantial performance improvement. It was then applied across multiple future scenarios based on both individual drivers and their combinations, representing a wide but plausible range of anthropogenic and climate changes. Our findings show that upstream high flows, riverbed lowering, and occurrences of storm surges affecting the mainstream Mekong River have limited impact on regional inundation dynamics. However, land subsidence, rising sea levels, and their combined effects emerge as the primary drivers behind the escalation in both extent and intensity of the regional inundations in the future. These results, hence, are expected to serve as vital groundwork for strategic development and investment as well as for emergency decision-making and flood management planning, providing essential insights for shaping development policies and devising investment strategies related to infrastructure systems in this rapidly developing area.
- Article
(12074 KB) - Full-text XML
- BibTeX
- EndNote


Deltas, home to over 500 million people globally, play a crucial role in agriculture and food production due to their fertile soils (Pont et al., 2002; Attaher et al., 2009; Edmonds et al., 2020). These low-lying regions, between river and coast, are highly susceptible to flooding, which can be further exacerbated by impacts of climate change (e.g. sea level rise, atmospheric changes), and human activities such as water abstraction (linked to land subsidence), river damming, and increased sand mining (Syvitski et al., 2009; Giosan et al., 2014; Bevacqua et al., 2019; Best, 2019; Edmonds et al., 2020). According to current climate change projections, future flooding in coastal deltas is projected to intensify due to more frequent extreme rainfall and storm surges (IPCC, 2023). Previous research on delta flooding mainly examines individual flood drivers, such as riverine or tidal influences, with less focus on the compounded effects of multiple flood drivers occurring simultaneously. However, several studies emphasize the significance of compound flooding, highlighting that the impact of simultaneous flood sources can exceed the sum of their individual effects (e.g., Leonard et al., 2014; Paprotny et al., 2018; Wahl et al., 2018; Ward et al., 2018; Ganguli and Merz, 2019). For instance, Olbert et al. (2017) assess compound flooding in Cork City, Ireland, showing that while high sea levels alone may not cause flooding, they can worsen it when combined with river flooding. Similarly, Leonard et al. (2014) showed an increasing inundation change when substantial river discharges coincided with extreme sea levels, compared to each source acting independently. Chen and Liu (2014) used a hydrodynamic model to study flooding in the Tsengwen River basin, southern Taiwan, revealing that extreme storm surges and high upstream discharges together intensify flood severity more than either factor alone. These studies highlight the importance of assessing future compound flooding for effective planning, risk management, and mitigation. A comprehensive understanding of current and future flood hazards allows for the implementation of engineering solutions to reduce fatalities, infrastructure challenges, environmental damage, and societal impacts (Leonard et al., 2014; Haigh et al., 2014; Wahl et al., 2018; Ward et al., 2018; Paprotny et al., 2018; Edmonds et al., 2020), while optimizing flood protection and levee systems (Leonard et al., 2014; Ward et al., 2018).
For the Vietnamese Mekong delta (VMD), previous research provides insight into the present challenges that exacerbate flood risk in the region. A substantial increase in extreme storm surges projected along this coastline by the year 2050 has been attributed to the increased frequency of intense tropical cyclones (Wood et al., 2023). Recent river damming and sand mining in the VMD have considerably lowered the riverbed, raising concerns about their impact on the hydraulic regime (Kummu et al., 2010; Bravard et al., 2013; Lu et al., 2014; Hackney et al., 2021). For instance, two principal channels of the Mekong delta (the Mekong and Bassac Rivers) experienced riverbed lowering of an average of 2.5 m (σ = 3.9 m) between 1998 and 2018, which heightened tidal inundation risk (Vasilopoulos et al., 2021; Eslami et al., 2019). Within the broader VMD area, the average sinking of land is a recent phenomenon now occurring at rates approximately around 0.03 m per year (Erban et al., 2014). This subsidence is expedited by the extraction of groundwater linked to agricultural practices and the expanding population within the delta (Erban et al., 2014; Minderhoud et al., 2020). For the future, the IPCC report considers that the VMD will be one of the zones that will be most affected by climate change (IPCC, 2007), with SSP5-8.5 (very high emissions scenarios) projections suggesting a sea level rise of up to approximately 1 m by the end of the century (Fox-Kemper et al., 2021), potentially increasing flood magnitudes (Västilä et al., 2010; Lauri et al., 2012; Hoang et al., 2016; Tran et al., 2016; Minderhoud et al., 2019). For example, a projected 0.8 m rise in mean sea level could submerge approximately 51 % of the VMD plain (Minderhoud et al., 2019).
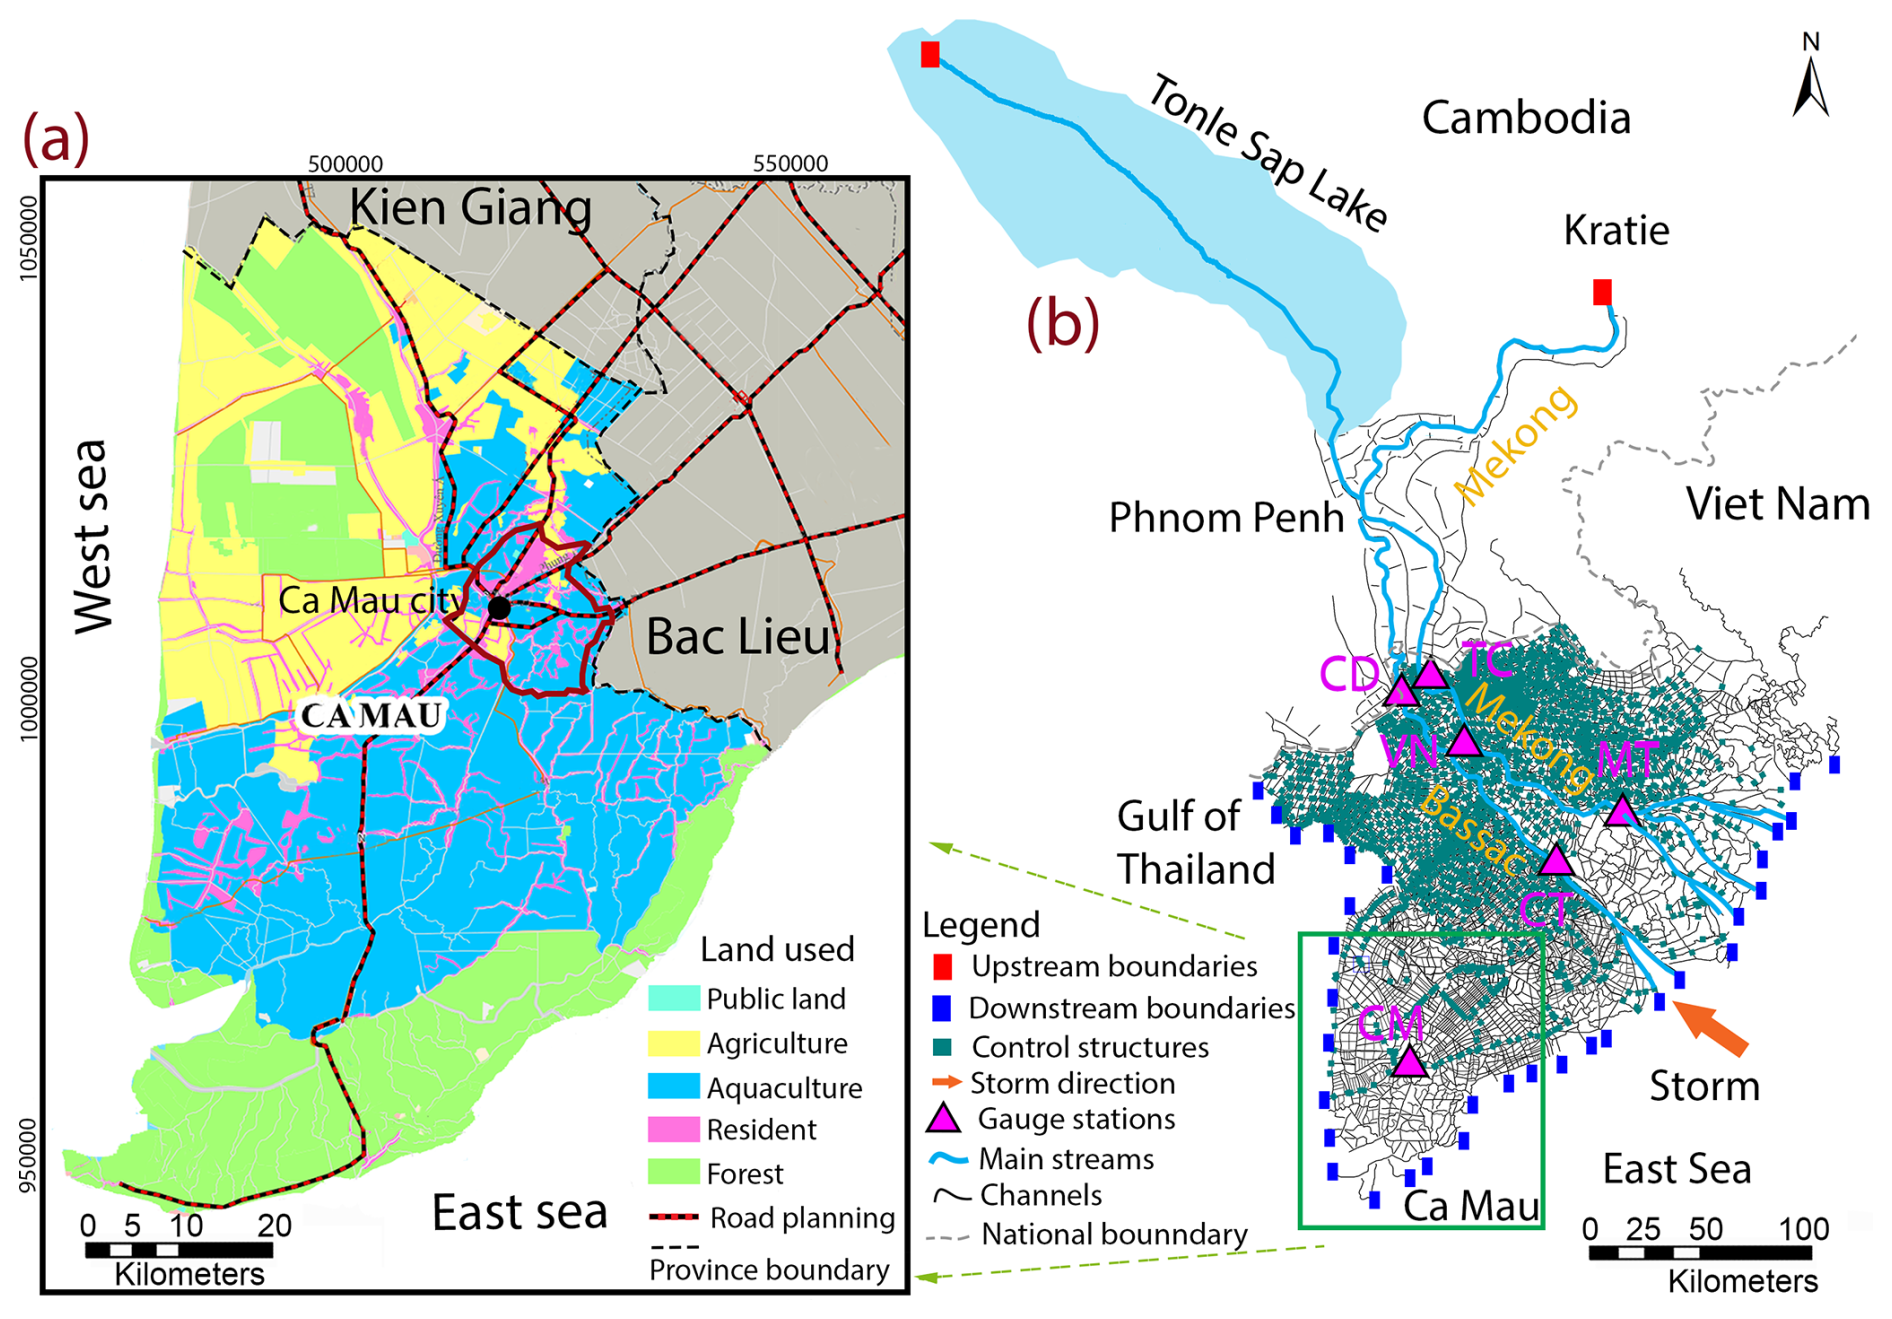
Figure 1(a) Location of the study area and land use data for the year 2022 (The People's Committee of Ca Mau Province, 2023); (b) the 1D model used in this study.
Although previous studies have provided valuable insights into flooding in the VMD (Van et al., 2012; Hoang et al., 2016; Duc Tran et al., 2018; Triet et al., 2020), attention has not yet been focused on the Ca Mau Peninsula (CMP), the most flood-prone coastal region within the VMD, where the local population faces recurrent flooding events (Fig. 1a for exact locations). Moreover, these studies use bathymetric data from various sources, which may lead to inconsistencies and errors when merged, and are potentially outdated due to substantial anthropogenic-induced riverbed lowering in the VMD (Bravard et al., 2013; Vasilopoulos et al., 2021). Additionally, while these studies focus on water level estimations within river channels, they fail to address inundation in surrounding areas and do not consider the potential rise in storm surge frequency in the Mekong region due to projected climate change.
Therefore, our study aims to comprehensively assess the compound flooding dynamics of the coastal areas of the CMP, a region increasingly vulnerable to a variety of environmental and human-driven changes. We specifically focus on understanding how shifts in key factors, such as storm surges, sea level rise, river discharge, land subsidence, human-induced riverbed lowering, interact to trigger flooding events. By providing a more detailed understanding of the interactions between natural and anthropogenic forces, we aim to offer actionable insights that can enhance flood preparedness, foster resilient infrastructure, and support adaptive regional planning. In doing so, we strive to help mitigate flood hazards and contribute to long-term sustainability in the CMP. Future planning, based on projections, will include water control systems, expressways, coastal embankments to manage tidal surges in the West and East Seas, and saltwater control gates along the Bassac River. These measures are crucial for relevant authorities, such as the Ministry of Natural Resources and Environment (MONRE), the Ministry of Transport (MOT), the Ministry of Construction (MOC), the Ministry of Agriculture and Rural Development (MARD), and the Ministry of Planning and Investment (MPI), in making informed, long-term development decisions. Successful implementation will enhance the region's flood resilience and foster sustainable growth in the face of climate change. The article aims to achieve the following objectives:
-
Develop a set of flooding calculation tools for the CMP with a higher level of detail than existing tools to support long-term research and development for the region;
-
Analyse in detail for the first time the causes of compound flooding on the CMP, quantifying the impact of each cause and compound factors based on hydraulic models. The study examined both present and future scenarios, encompassing variations in upstream freshwater flow, human-induced riverbed lowering, land subsidence, and eustatic sea-level rise; and
-
Establish and compare the levels of inundation change in the study area, serving as a basis and direction for the construction and development of infrastructure to protect residents, transportation (expressways, internal routes), and the distribution of more effective industrial clusters and wider VMD zones.
2.1 Study area
The Ca Mau Peninsula (CMP), located in the southern coastal region of the VMD, covers an area of about 5210 km2 and is currently inhabited by 1.19 million people (General Statistics Office of Vietnam, 2024) (Fig. 1a). In 2020, the aquaculture sector in the CMP expanded to 285 500 ha, representing 37.16 % of the Mekong Delta's aquaculture area and 26.49 % of the nation's total. The total fishery output reached 590 191 t, contributing to 12.2 % and 6.8 % of the fishery output within the VMD and the entire nation, respectively (General Statistics Office of Vietnam, 2024). Furthermore, the CMP, home to 77 % of the mangrove forests in the VMD region, plays a crucial role in managing, conserving, and promoting the sustainable development of the Mui Ca Mau Biosphere Reserve (Tinh et al., 2009; Son et al., 2015; Thuy et al., 2020). The region is recognized as one of the country's top geographical, cultural, and ecological landmarks, with its unique river mouth and coastal ecosystems.
The hydro-climate in the broader VMD region is tropical, with its hydrology influenced by a monsoon seasonal flood-pulse, marked by distinct dry and flood seasons (MRC, 2005). The flood season typically spans from mid-May to October, representing over 90 % of the annual precipitation in the VMD (Kingston et al., 2011), and accounts for 80 %–90 % of the total annual river flows (Triet et al., 2017). The CMP is a low-lying area that is frequently flooded. Its average elevation ranges from 0.2 to 1.5 m above mean sea level (Karlsrud et al., 2020; Tran et al., 2024), with a coastline bordering 154 km the Gulf of Thailand in the west and facing 100 km the East Sea in the east (The People's Committee of Ca Mau Province, 2023). In the East Sea, a semi-diurnal tidal pattern with an amplitude ranging from 2.5 to 4.0 m is observed, whereas the Gulf of Thailand experiences a diurnal tidal regime with amplitudes varying from 0.8 to 1.2 m (Gugliotta et al., 2017). This region is characterized by a dense network of natural and human-made rivers, canals and is currently undergoing infrastructure development, including expressways, coastal embankments, and water control works along the West Sea and East Sea coasts (The People's Committee of Ca Mau Province, 2023).
2.2 Flood model
We utilized a one-dimensional (1D) hydrodynamic model covering the entire Mekong Delta, extending from Kratie, Cambodia to the coastal zone in Vietnam. The model was initially developed by Dung (2011) using the modelling package MIKE11-HD developed by the Danish Hydraulic Institute (DHI). It was set up to represent the complex river network and floodplains and numerous flood control structures (e.g dikes, sluice gates) in the VMD (Fig. 1b). The model includes approximately 4235 river branches and 564 floodplain compartments across the VMD, with secondary channel data in the CMP having a resolution ranging from 1 to 3 km per channel. The model utilizes the WGS84 coordinate system, with elevations referenced to the Hon Dau Mean Sea Level. For the Mekong River's main channels and the Tonle Sap Lake system, topographic data were compiled and updated through various projects of varying accuracy. The representation of floodplains differs between regions due to their unique characteristics. In the Cambodian Mekong Delta, where floodplains lack significant channelization and dike infrastructure, they are represented as channels with broad cross-sections. Conversely, in the VMD, the floodplains are highly compartmentalized into numerous flood cells to safeguard agricultural activities. These cells are depicted as wide cross-section channels enclosed by dikes. This 1D-hydrodynamic modelling approach, with its detailed floodplain representation, is justified as a practical and efficient solution for capturing the essential hydrodynamic processes within the model domain. Additionally, by incorporating a quasi-2D representation of the floodplains, it strikes a balance between the oversimplicity of non-hydrodynamic and purely 1D approaches, and the highly computational demands of fully 2D models. More details on the model development can be found in Dung (2011). The main input boundary is the daily discharge data at Kratie, supplied by the Mekong River Commission (MRC: https://portal.mrcmekong.org/monitoring/river-monitoring-telemetry, last access: 25 March 2024). Hourly tidal stage measurements from coastal stations along the VMD coastline are used to establish the downstream boundary conditions, provided by the Southern Regional Hydro-Meteorological Center (SRHMC) (Fig. 1b). The model uses approximately 30 000 computational nodes across the domain and operates with a 5 min time step to ensure stability and enable accurate, dynamic simulations of hydrodynamic processes. Simulated water levels are output hourly.
A key contribution of this study is the updating of datasets to be fed into the modelling. This includes updating dyke heights throughout the VMD, from data provided by Southern Institute of Water Resources Research (SIWRR) (surveys carried out 2018–2019). Additionally, the tidal and saline prevention culvert systems along the western coastal of VMD have been updated up to 2019. Riverbed topography data for the mainstream of the Mekong River within VMD was updated in 2018, adopted from Vasilopoulos et al. (2021).
A Digital Elevation Model (DEM) for the CMP, has been acquired from the MONRE in 2008 for the purpose of creating inundation maps (Tran et al., 2016) (Appendix A, Fig. A1). This DEM utilizes the WGS84 coordinate system and is based on the Hon Dau means sea level vertical datum, featuring a resolution of 5 m × 5 m. The DEM is using survey points and the topographical maps with the elevation points and contour lines, which were obtained from geodetic survey and photogrammetric data. Terrain data are aggregated and selected from topographic maps of the largest scale and best quality (Tran et al., 2016). The DEM is considered as the best elevation data currently available for the VMD, and it was used for the inundation in VMD under projection of future sea level rise in Vietnam (Tran et al., 2016) as well as other study (Vu et al., 2021; Dang et al., 2023).
2.3 Model calibration and validation
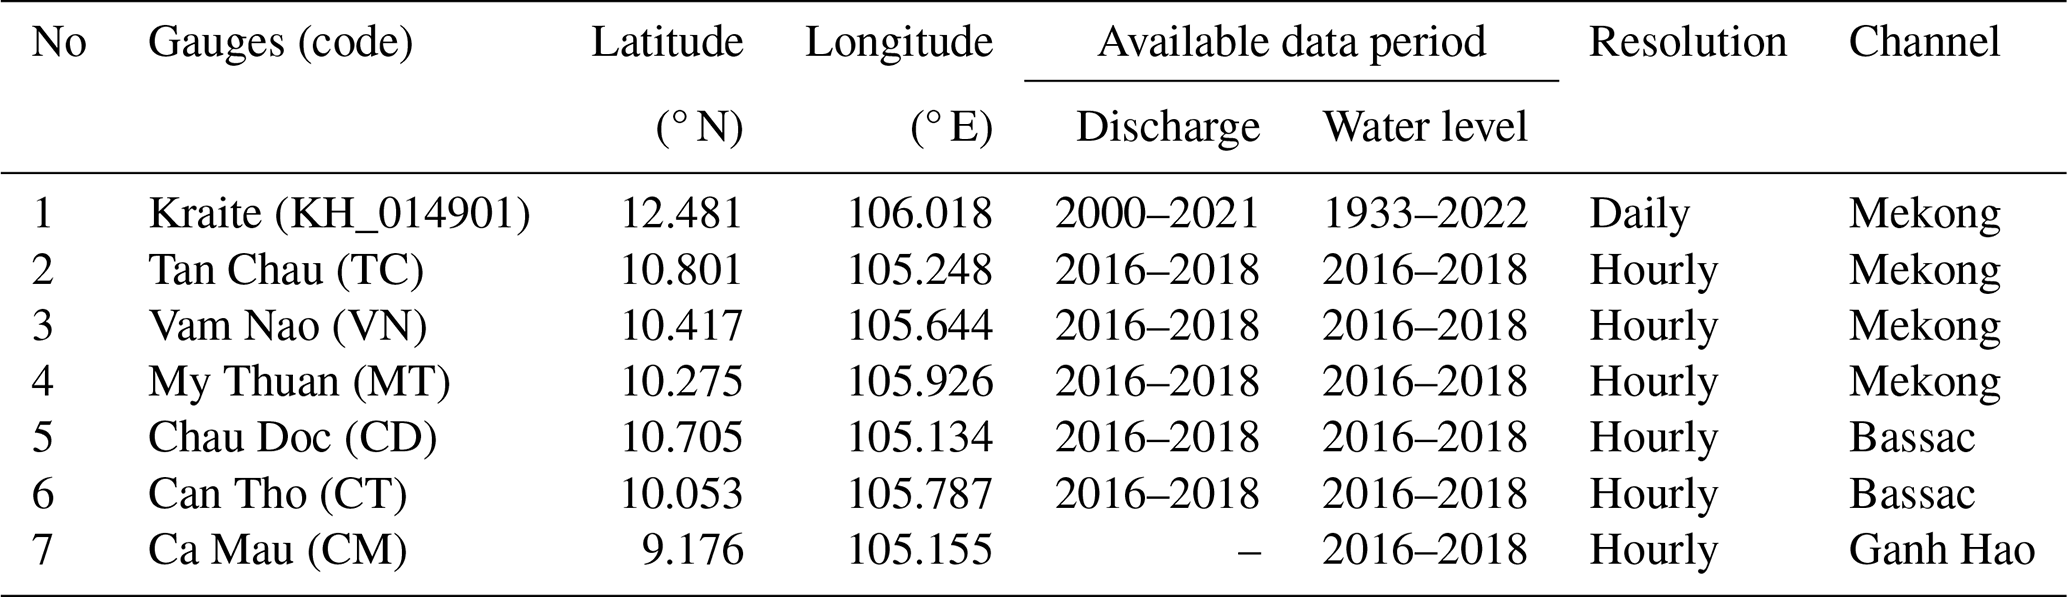
The updated model has been re-calibrated using observed data from the high-water flux event in 2018, with a water volume of 454 billion m3 at Kratie (Fig. 2). In comparison, the annual water volume at Kratie from 2000 to 2021 averaged at 390 billion m3. The 2018 hydraulic year had annual volume exceedance frequency is approximately 20 %, relative to the 2000–2021 data range. The model was then validated using data from 2016, a low-flow year with a water volume of 331 billion m3 and an exceedance frequency of about 78 % within the same historical range (Fig. 2). The choice of these particular years was based on their close alignment with the observed bathymetry used in the model, signifying minimal changes in the riverbed. As a result, the model underwent calibration for a high flood event, and validation against a low flood event, enabling an evaluation of the model's suitability across a broad range of potential flood magnitudes. The calibration and validation compared hourly simulated and observed water levels and discharge at various stations located across the primary channels of the VMD and the maximum water within the Ca Mau region (see Table 1 and Fig. 1b for specific locations). These measurements were provided by SRHMC, and were made available through SIWRR.
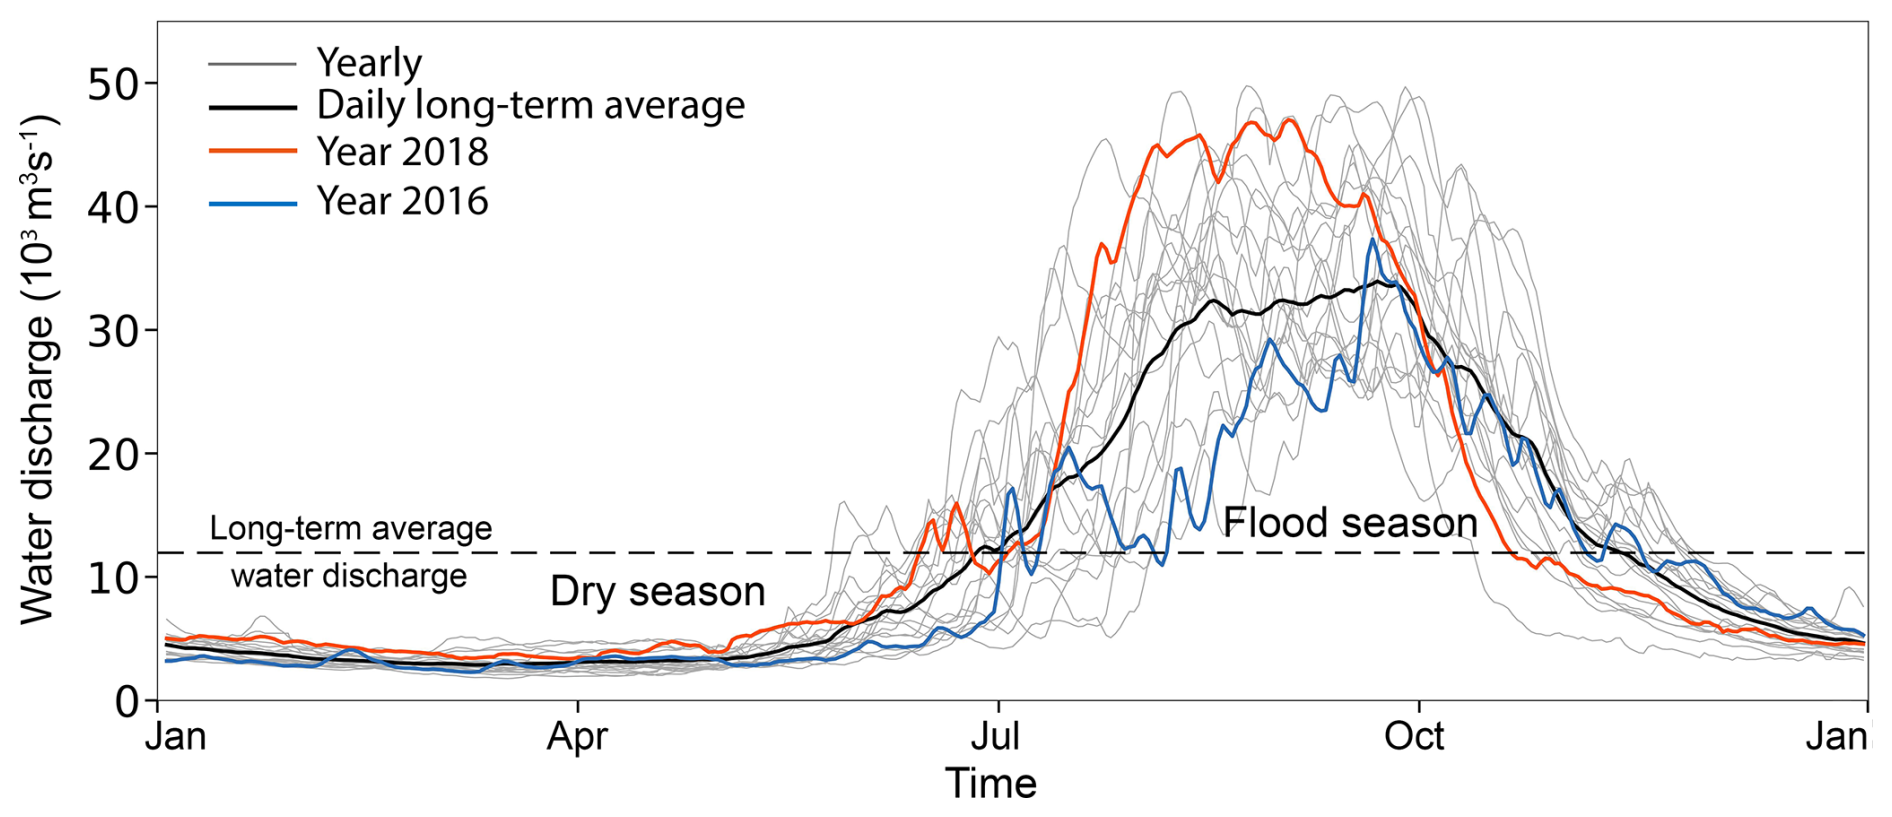
Figure 2The daily discharge at Kratie was utilized as the upstream boundary for the modelling scenarios, which including the daily long-term average water discharge spanning from 2000 to 2021 and the observed water discharge for the year 2018 and 2016. The dashed line represents the long-term average discharge at Kratie (12 370 m3s−1), used to distinguish dry and flood seasons: dry when discharge falls below, and flood when it exceeds this average, following MRC (2011) definitions.
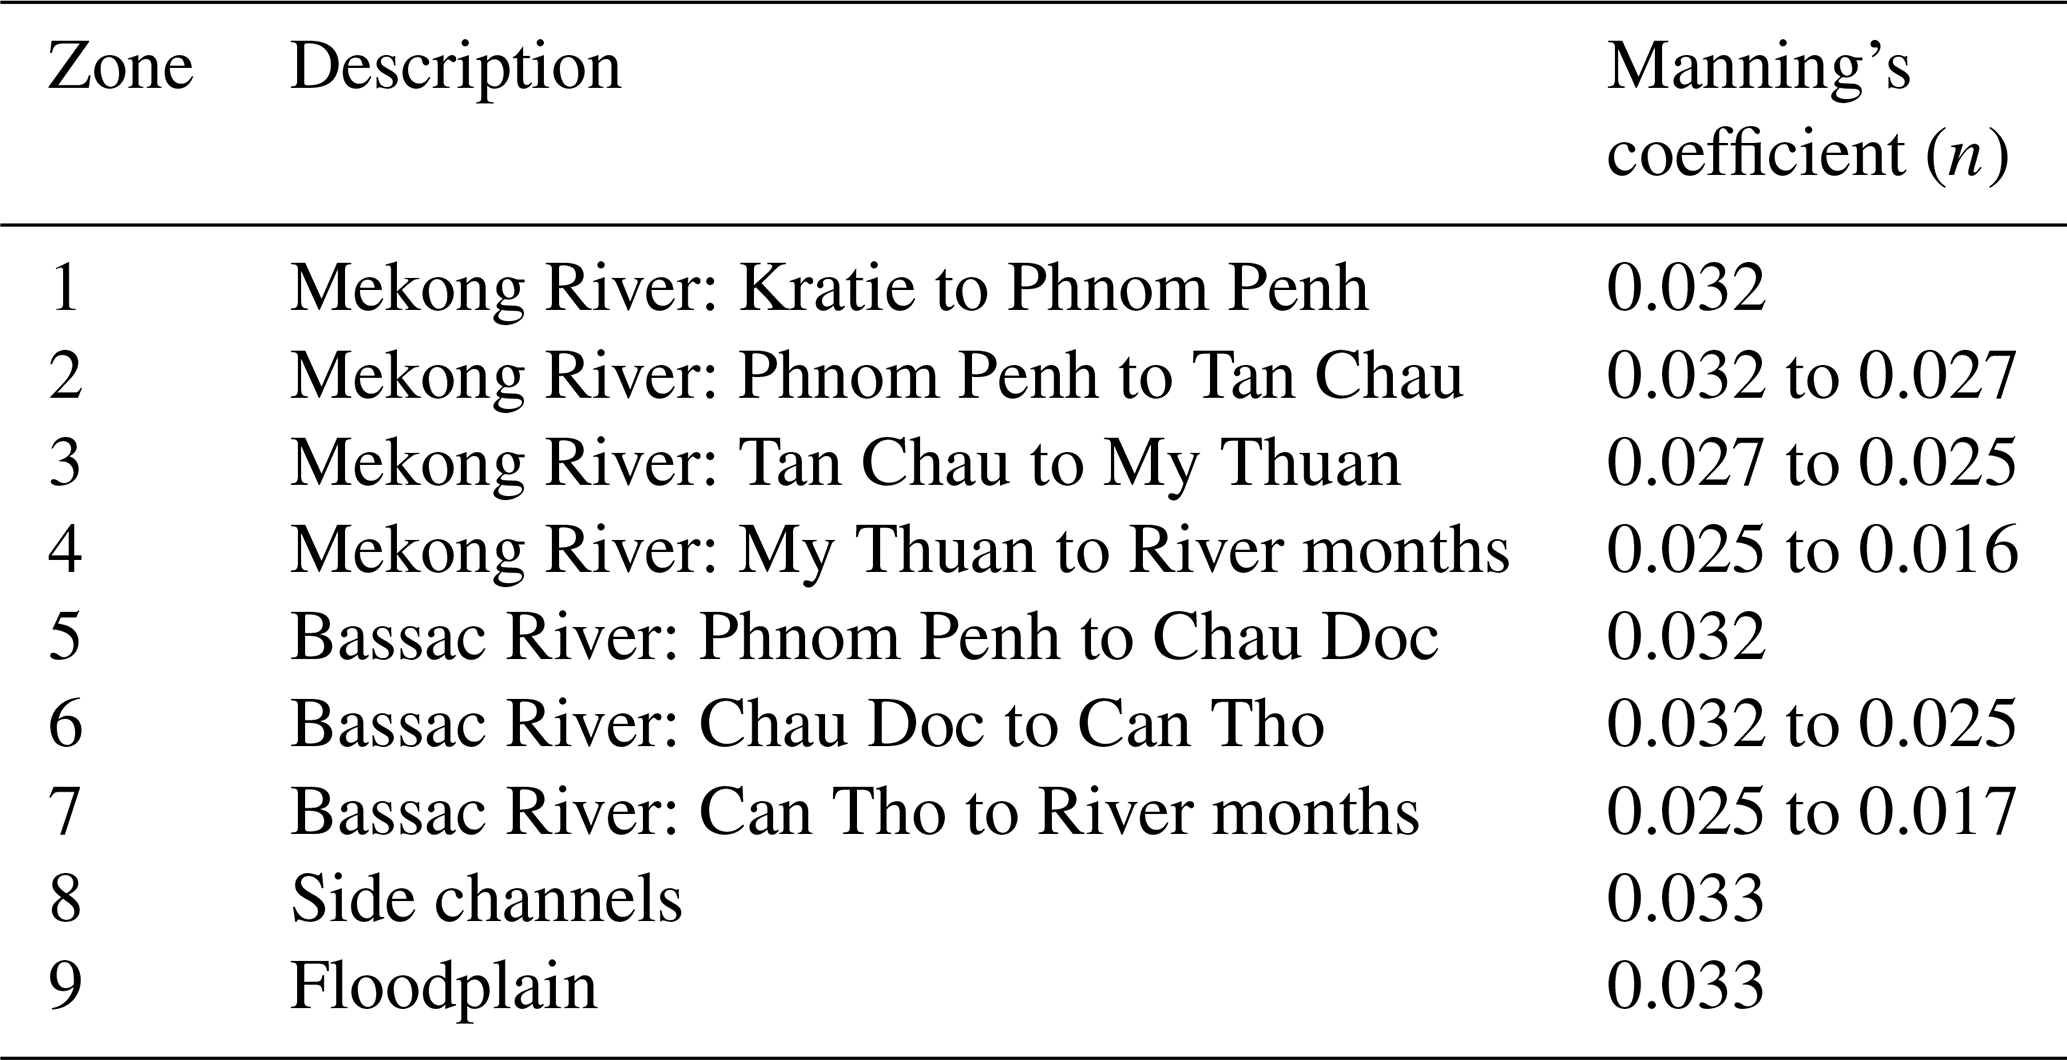
The calibration procedure entailed fine-tuning of the Manning roughness parameters, a standard practice in hydraulic models. The initial roughness values were assigned by dividing the model domain into distinct zones, with each zone given a specific roughness Manning's n value to represent its unique hydraulic characteristics (Manh et al., 2014). These roughness values were systematically refined to achieve the best agreement between the model's predicted water levels and discharges and the observed data. Specifically, the calibration process utilized monitoring stations located along the main Mekong channel in Vietnam (Fig. 1b, Table 1). Model outputs were compared with observed water levels and discharges, and any discrepancies prompted adjustments to the zone-specific roughness values (Fig. 3 and Table 2). The model was iteratively rerun until optimal results were achieved. The final calibrated Manning's n values are detailed in Table 3. In the subsequent validation phase, the model was evaluated using data from a different hydrological year (2016). A comprehensive result and discussion of the calibration and validation procedures follow in the next paragraph.
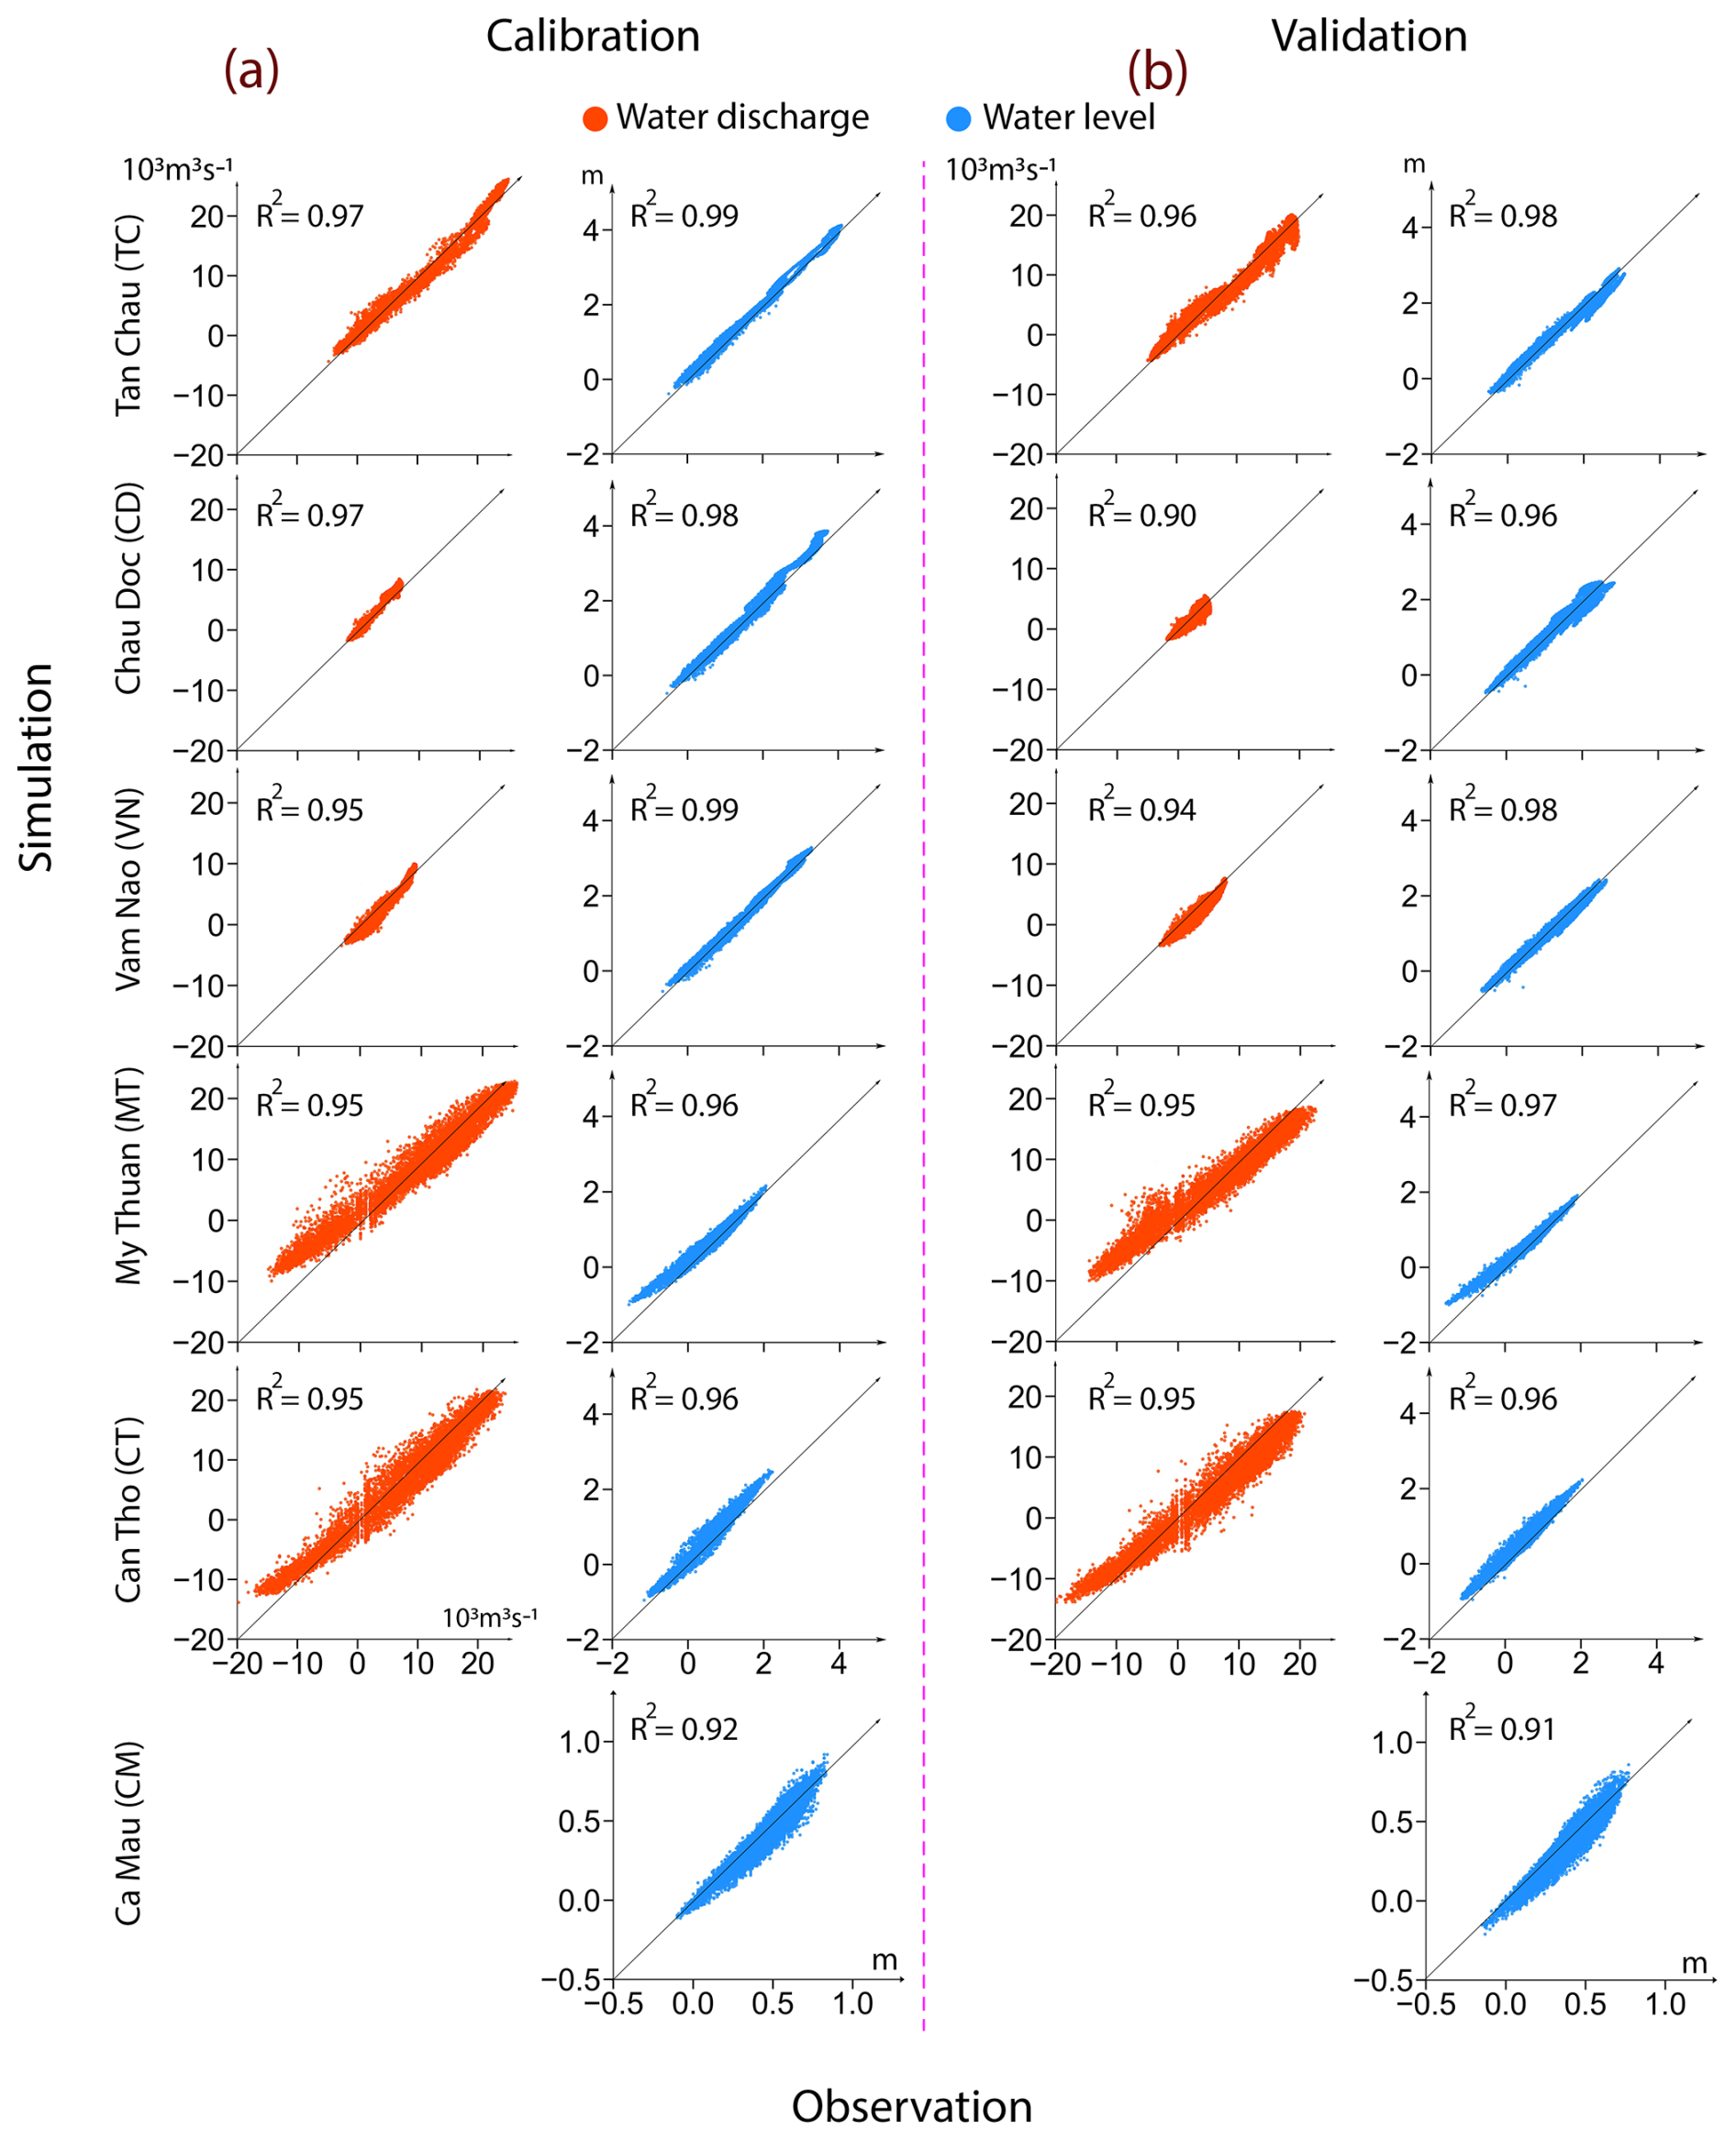
Figure 3Assessing the agreement between the predicted and observed hourly data for water level and water discharge at monitoring stations throughout the VMD during the calibration run in 2018 and validation run in 2016 along with the coefficient of determination (R2).
Table 2The NSE coefficient was calculated across a range of river gauge stations spanning the VMD for distinct dry and flood season periods during the calibration and validation steps.
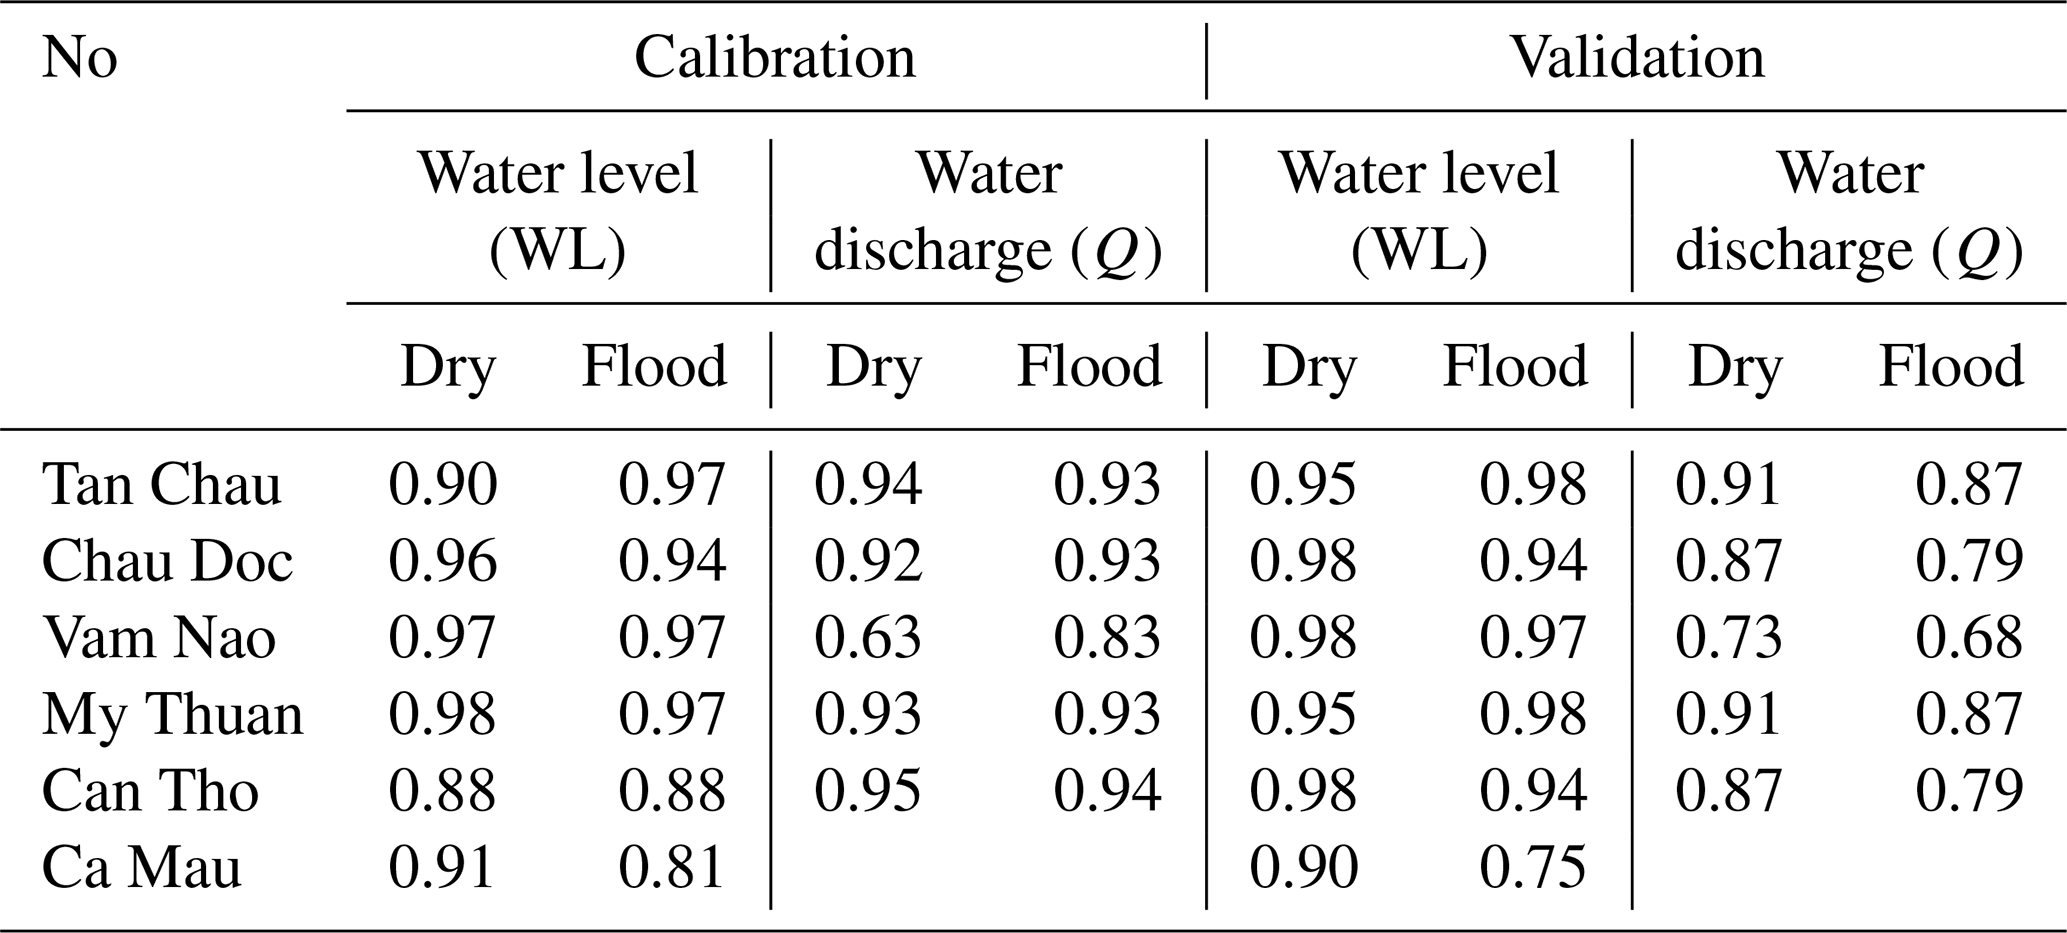
Table 3The Manning roughness coefficient (n) is categorized based on different zones using in the modelling. The Manning roughness in the channel changing for different cross-sections within the same zone.
The Nash-Sutcliffe model efficiency coefficient (NSE) (Nash and Sutcliffe, 1970), as specified in Eq. (1), along with the coefficient of determination (R2), as defined in Eq. (2), which indicates the proportion of variance in both simulated and observed data explained by the model (Moriasi et al., 2007) was utilized to assess the accuracy of the comparison between the recently calibrated predictions and the observed data
In this equation, represents the mean of observed values and is the observed hourly data at time t (from 1 to T), represents the mean of simulated value, is the hourly simulated value at time t, Generally, NSE values below 0.5 indicate suboptimal calibration performance, while NSE values surpassing 0.5 suggest a satisfactory model performance. NSE values exceeding 0.65 indicate a well-performing calibration, and values surpassing 0.8 indicate a highly accurate calibration (Ritter and Muñoz-carpena, 2013) R2 ranges from 0 to 1, with higher values indicating less error variance (Moriasi et al., 2007).
The simulated and observed water discharge and water levels results are categorized into dry seasons, characterized by water discharge (at Kratie) falling below the long-term average values (12 370 m3 s−1) spanning from 2000 to 2021, and flood seasons, identified by days when water discharge surpasses the average values within the same dataset (MRC, 2011) are used to calculate the NSE and R2 values.
During the calibration step, the results show excellent agreement between the simulated and observed water levels and discharges across all gauging stations within the VMD (Fig. 3a and Table 2). The water discharge NSE values at these gauging stations exceed 0.8, with the exception of Vam Nao station, where the NSE for discharge calibration is 0.63, still indicating acceptable model performance (Table 2). The simulated and observed water levels show consistent agreement across all gauging stations, demonstrating the model's strong ability to capture the water level regime, with NSE values exceeding 0.8 at every gauging station (Table 2). Minor overestimations are observed during low-flow periods at My Thuan (Mekong River) and Can Tho (Bassac River), with deviations of approximately 20 and 10 cm, respectively (Fig. 3a). However, these discrepancies are relatively small when compared to the daily water level fluctuation of about 2.5 m at these stations during dry season. Given that the primary objective of this study is to generate maximum inundation maps for flood hazard assessment, slight inaccuracies during low-water conditions have minimal influence on the overall outcomes.
Across the study area, the model also demonstrates strong performance at the Ca Mau gauging station. The simulated maximum water level is approximately 0.92 m, slightly overestimating the observed value of 0.84 m by around 0.08 m. This small discrepancy may be attributed to the exclusion of local water extraction for agriculture and aquaculture in the model. However, given the region's dense network of side channels, the influence of such withdrawals on overall water levels is likely minimal. This small difference is negligible compared to the daily water level fluctuation of around 2.5 m in the area. Importantly, both the NSE and R2values demonstrate excellent agreement between the simulated and observed water level data, further confirming the model's capability to accurately represent the dynamics of water levels in the system, making it a valuable tool for flood hazard prediction and management, particularity for the study area.
For the validation stage, the results reveal a consistently strong agreement between the simulated outcomes and the corresponding observed data across the VMD gauging stations (Fig. 3b and Table 2). There is a persistent pattern of high agreement in water level values and an overall strong agreement in terms of water discharge. At the Ca Mau gauging station, the simulated maximum water level was 0.86 m, compared to the observed value of 0.77 m, an overestimation of only about 0.09 m indicating good model performance.
By integrating 2018 riverbed bathymetry data and 2019 infrastructure information within the VMD, the calibration and validation results reveal that the updated flood model performs well in capturing flood dynamics across the VMD, showcasing the model's ability to effectively simulate diverse hydraulic conditions. Consequently, this model will be utilized to comprehensively investigate the flooding regime in the VMD through various simulation scenarios.
2.4 Simulation scenarios
In order to assess the potential future inundation across the study area, a range of scenarios involving variations in upstream freshwater flow, human-induced riverbed lowering, land subsidence, storm surge and eustatic sea-level rise were introduced into the modelling process for analysis. The details of each scenario are outlined in Table 4 and are discussed in more detail in the sub-sections below.
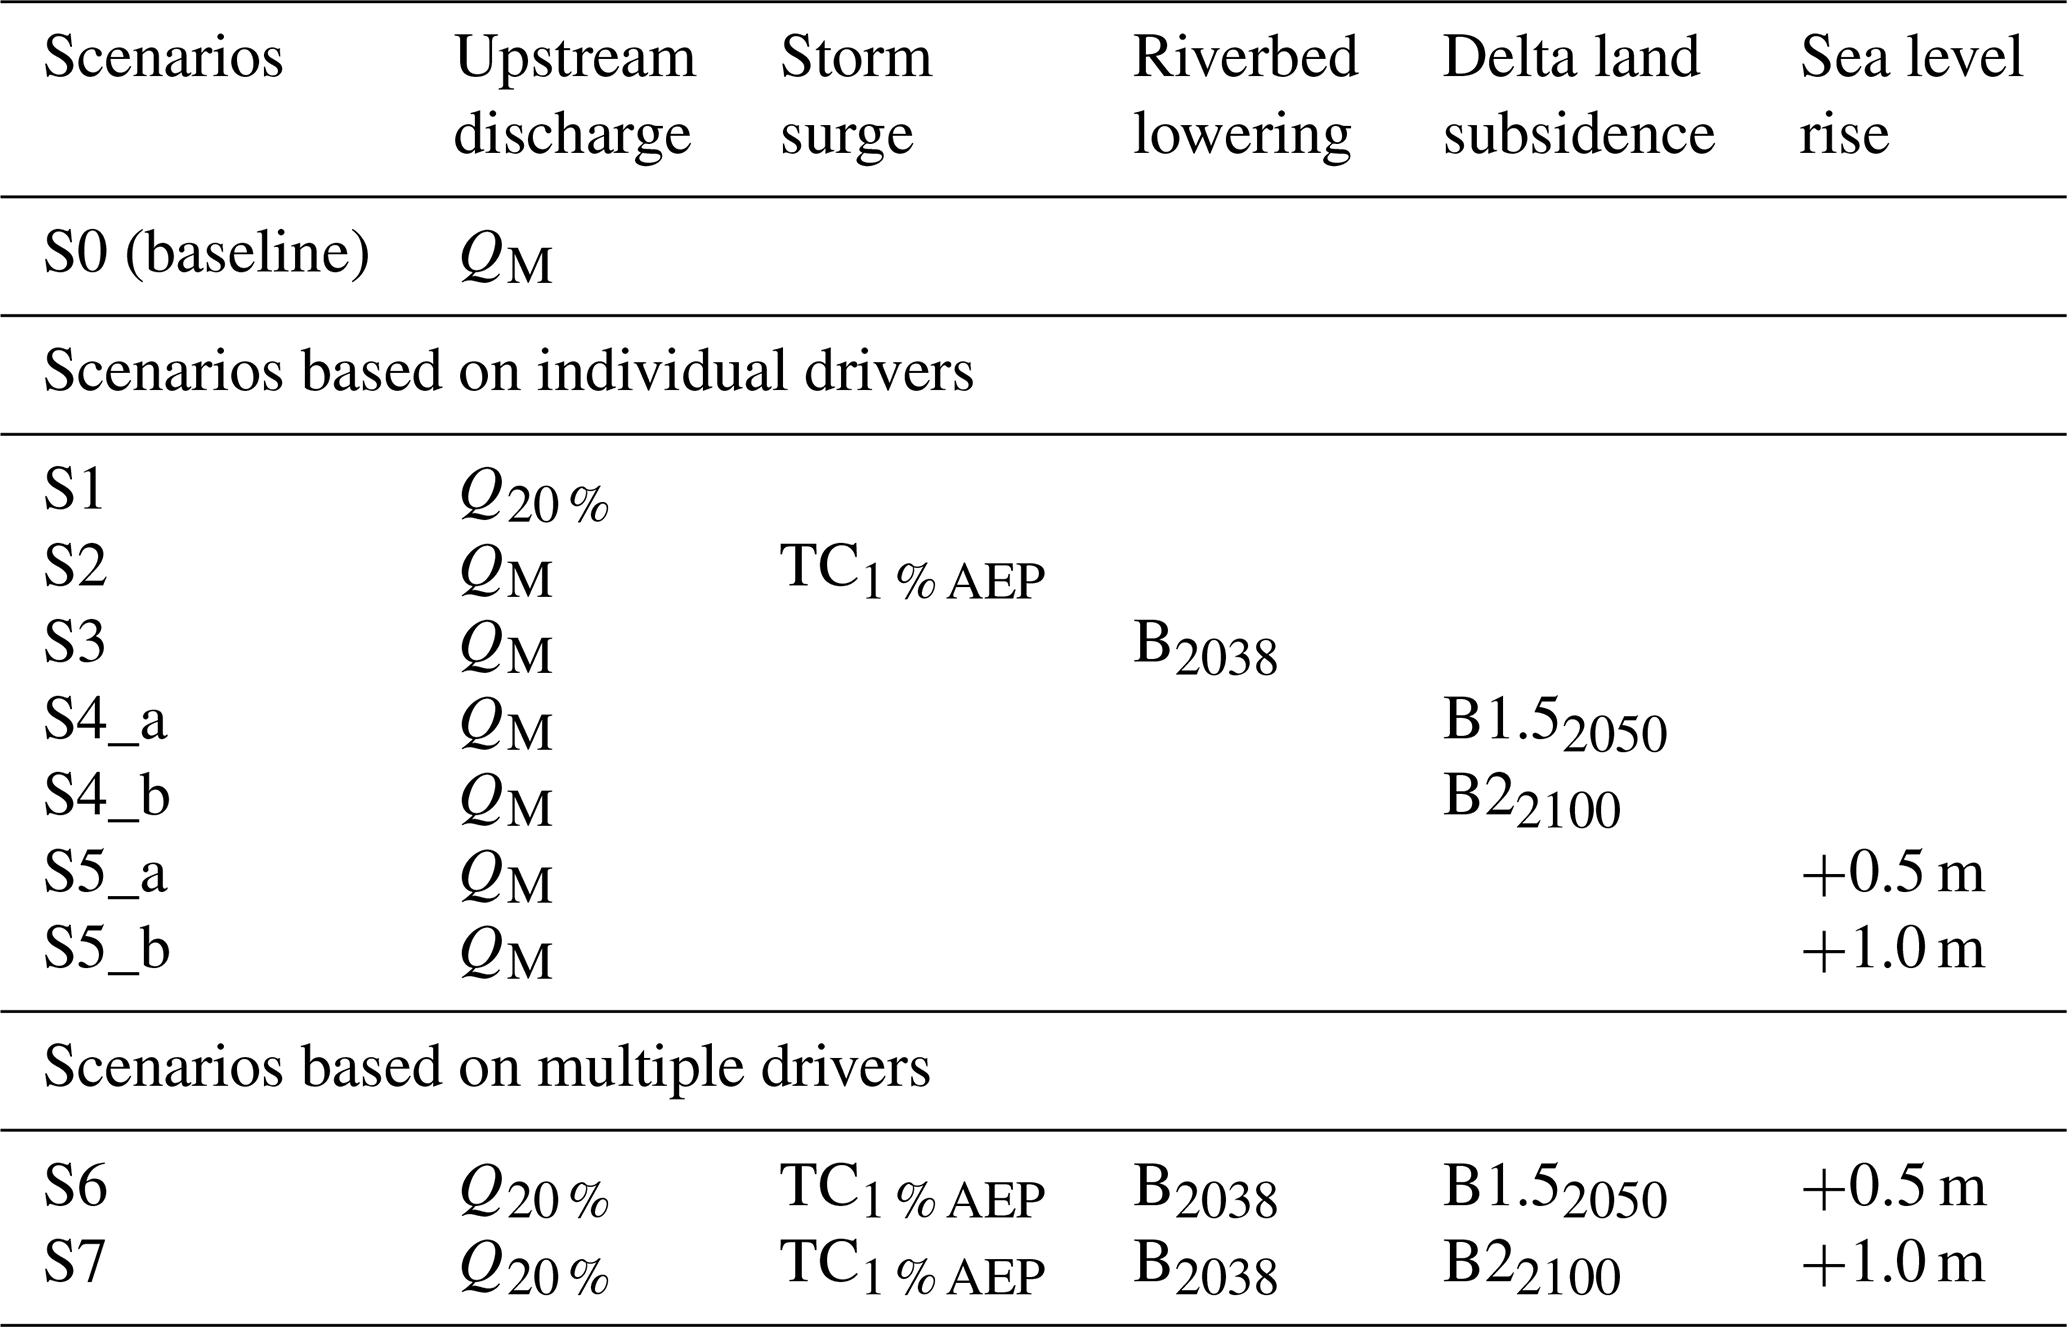
Table 4Scenarios utilized to explore the impact of elevated upstream water flow, storm surge, anthropogenic riverbed lowering, delta subsidence, and sea-level rise on the risk of inundation for the CMP.
2.4.1 Individual drivers
First, we ran a Baseline scenario (S0). This simulation uses the daily time series of long-term mean flow at Kratie (QM) spanning from 2000 to 2021 (Fig. 2), where the water volume at Kratie is approximately 390 billion m3 and the downstream boundary conditions were determined using hourly observed tidal stage measurements taken along the Mekong coastal zone for the year 2018. This scenario serves as the foundation for modelling average flooding in the CMP and is employed for comparison with alternative flood scenarios.
We then ran 7 other scenarios, varying the upstream discharge, storm surge, lowering the riverbed, accounting for land subsidence and sea level rise, as described below.
-
High upstream flow (S1): The observed water discharge at Kratie for the year 2018 (Q20 %) was employed as the upstream water discharge, which involved a water volume estimated at around 454 billion m3 and the total volume exceedance frequency is approximately 20 % within the historical data range from 2000 to 2021. This scenario is utilized to evaluate inundation in the study areas under high water upstream flux.
-
Storm surge (S2): This scenario assesses the impact of storm surge inundation, caused by tropical cyclone, in the CMP. The chosen location for the scenario's storm surge impact is the Bassac channel mouth along the VMD coastal area (Fig. 1b). This selection is based on the Bassac River being the primary stream in the VMD, capable of transmitting storm surge impacts further inland and its close proximity to the study area. Information on the tropical cyclone annual exceedance probability of 1 % AEP (TC1 %) affecting the VMD at the Bassac River mouths, has been utilized for this scenario. The timing of the tropical cyclone occurrence was chosen in the middle of September, coinciding with the period when flooding caused by high upstream water discharge typically takes place. The rise in water level due to the tropical cyclone impacting the VMD at the Bassac River mouth has been synchronized with a full tidal cycle in the VMD coastal zone at the time of the storm, serving as the downstream boundaries. This integration results in the maximum water level at the Bassac River mouth boundary rising up to 2.9 m during the storm. These storm surge data for the VMD coastal zone has been adopted from Wood et al. (2023).
-
Human-induced riverbed lowering (S3): This scenario evaluates the effects of riverbed lowering caused by upstream damming and sand mining within the VMD delta on inundation in the study area. The anticipated bathymetry for the main Mekong channel within the VMD in 2038 (B2038) as derived from Vasilopoulos et al. (2021) has been employed in the scenarios. This riverbed bathymetry for 2038 was generated by incorporating the riverbed bathymetry from 2018 into the riverbed lowering trend observed from 2008 to 2018, as detailed in Vasilopoulos et al. (2021). This results in the riverbed bathymetry for 2038 being lower than that of 2018, with an average decrease of 2.8 m. The cross-sections, spaced approximately every 3 km along the entire Mekong and Bassac rivers, for the 2038 bathymetry were then integrated into the model.
-
Delta Subsidence (S4_a, S4_b):These scenarios evaluate the changes in inundation associated with land subsidence in the projected future. It is important to note that, we only assess the impact of groundwater extraction-induce land subsidence and does not include other contributing factors such as natural subsidence, tectonic movements, or other human activities (Minderhoud et al., 2017; Zoccarato et al., 2018; Karlsrud et al., 2020). This focus is due to the fact that land subsidence in the CMP is primarily driven by groundwater extraction (Minderhoud et al., 2017; Karlsrud et al., 2020). The spatial map depicting future land subsidence within the VMD is derived from Minderhoud et al. (2020). This dataset includes land subsidence scenarios labeled B1.5 for the year 2050 (B1.52050) and B2 for the year 2100 (B22100). The B1.5 scenario simulates land subsidence under a moderate increase in groundwater extraction, serving as a pathway between the B1 scenario (moderate increase) and the B2 scenario (extreme increase). Both scenarios follow a non-mitigation pathway, where groundwater extraction continues to increase without any reduction measures, leading to greater land subsidence over time (Minderhoud et al., 2020). In this study, we use the land subsidence scenarios B1.52050 and B22100, which are referred to as the S4_a and S4_b scenarios, respectively. The S4_a scenario represents an average land subsidence of 0.38 m (σ = 0.21 m), while the S4_b scenario reflects 1.12 m (σ = 0.59 m) of subsidence in the CMP.
-
Sea-level rise (S5_a, S5_b): These scenarios evaluated SLR, an inevitable consequence expected to persist for centuries to millennia due to ongoing deep ocean warming and ice sheet melting. However, human activities, particularly the release of greenhouse gases, have unequivocally contributed to global warming (IPCC, 2023). One of the outcomes of this trend is rising sea levels, extensively explored in various studies (e.g., Kopp et al., 2014; Garner et al., 2018; IPCC, 2023). Since SLR is not just a future prediction but a current phenomenon impacting coastal regions worldwide, it requires attention not only for long-term strategic planning but also for immediate emergency readiness and other short-term considerations (Hall et al., 2019). In this study, consistent with the forecasts outlined in the IPCC Sixth Assessment Report (AR6) (Fox-Kemper et al., 2021) for the Mekong Delta coastal zone, two scenarios for eustatic SLR were developed. These scenarios involve projections of 0.5 m for the mid-century (2050) (referred to as S5_a) and 1.0 m for the end of this century (2100) (referred to as S5_b), under SSP5-8.5 scenarios with low confidence, in comparison with the sea level in the year 2018, respectively. It is note that these projections do not solely rely on future predictions of sea-level rise, but also consider the dynamic processes involved. For instance, the sea-level rise projections used in this study, sourced from NASA's SLR Projection Tool, already account for Vertical Land Motion, including land subsidence, which can influence regional sea-level rise rates. To prevent potential double-counting, we have treated land subsidence as a separate factor in our analysis, considering only subsidence driven by groundwater extraction (see Delta Subsidence Scenarios: S4_a, S4_b). In contrast, the SLR scenarios already incorporate land subsidence associated with Vertical Land Motion. Following this, the values representing sea-level rise scenarios are incorporated into the time series of tidal levels from the year 2018, functioning as downstream boundaries for the model scenarios.
2.4.2 Multiple/combined drivers
We then ran 2 other scenarios in which we combined drivers, as described below.
-
Projected until Mid-Century (S6): This scenario combined inundation changes when the high upstream flow (observed water flux of 2018) with storm of 1 % AEP entering the Bassac River mouth, incorporating lowered riverbed (2038 riverbed bathymetry), subsidence scenario until 2050 and SLR until 2050.
-
Projected until End of the Century (S7): This scenario combined inundation changes when the high upstream flow (observed water flux of 2018) with storm of 1 % AEP entering the Bassac River mouth. This scenario incorporates the lowered riverbed (2038 bathymetry), the severe subsidence scenario until the end of the century (B2_2100 scenario), and SLR until 2100.
2.5 Inundation mapping and statistics
The direct outcome of the 1D flood model simulations include hourly water levels at all computational nodes (∼ 30 000) within the VMD, for a simulation period 1 June to 30 November for each year. Subsequently, we extracted the maximum water level and utilized it for spatial interpolation in ArcGIS (using the Natural Neighbour method) to create a water level map with a resolution of 5 m across the study area. The maximum inundation map was then derived by subtracting the ground elevation from the DEM of the region. Areas with a depth < 0.1 m are classified as unflooded. Flood maps illustrating the change in inundation levels between simulation scenarios (see Sect. 2.4) have also been derived. Based on this mapping, we estimated flooding area statistics, providing flooding areas corresponding to each of the following 10 classes: below 0.1, 0.1–0.4, 0.4–0.7, 0.7–1.0, 1.0–1.3, 1.3–1.6, 1.6–1.9, 1.9–2.2, 2.2–2.5, above 2.5 m. Additionally, maps illustrating the increasing risk of flooding by comparing different scenarios with the S0 scenario have been created. We estimated increasing flooding area statistics for the 10 inundation classes: below −0.1 m (reduce the inundation), −0.1–0.1 m (unchanged), 0.1–0.4, 0.4–0.7, 0.7–1.0, 1. 0–1.3, 1.3–1.6, 1.6–1.9, 1.9–2.2, above 2.2 m.
Spatial maps depicting the maximum water level, inundation, and the inundation change, relative to the baseline, are shown in Figs. 4, 5 and 6, respectively, for each scenario in the Ca Mau Peninsula (CMP). The key results for each of the scenarios are described below. The areas flooded in the CMP region under the scenarios are listed in Table 5. The accumulated increase in flooded area, compared to the baseline (S0), is given in Table 6.
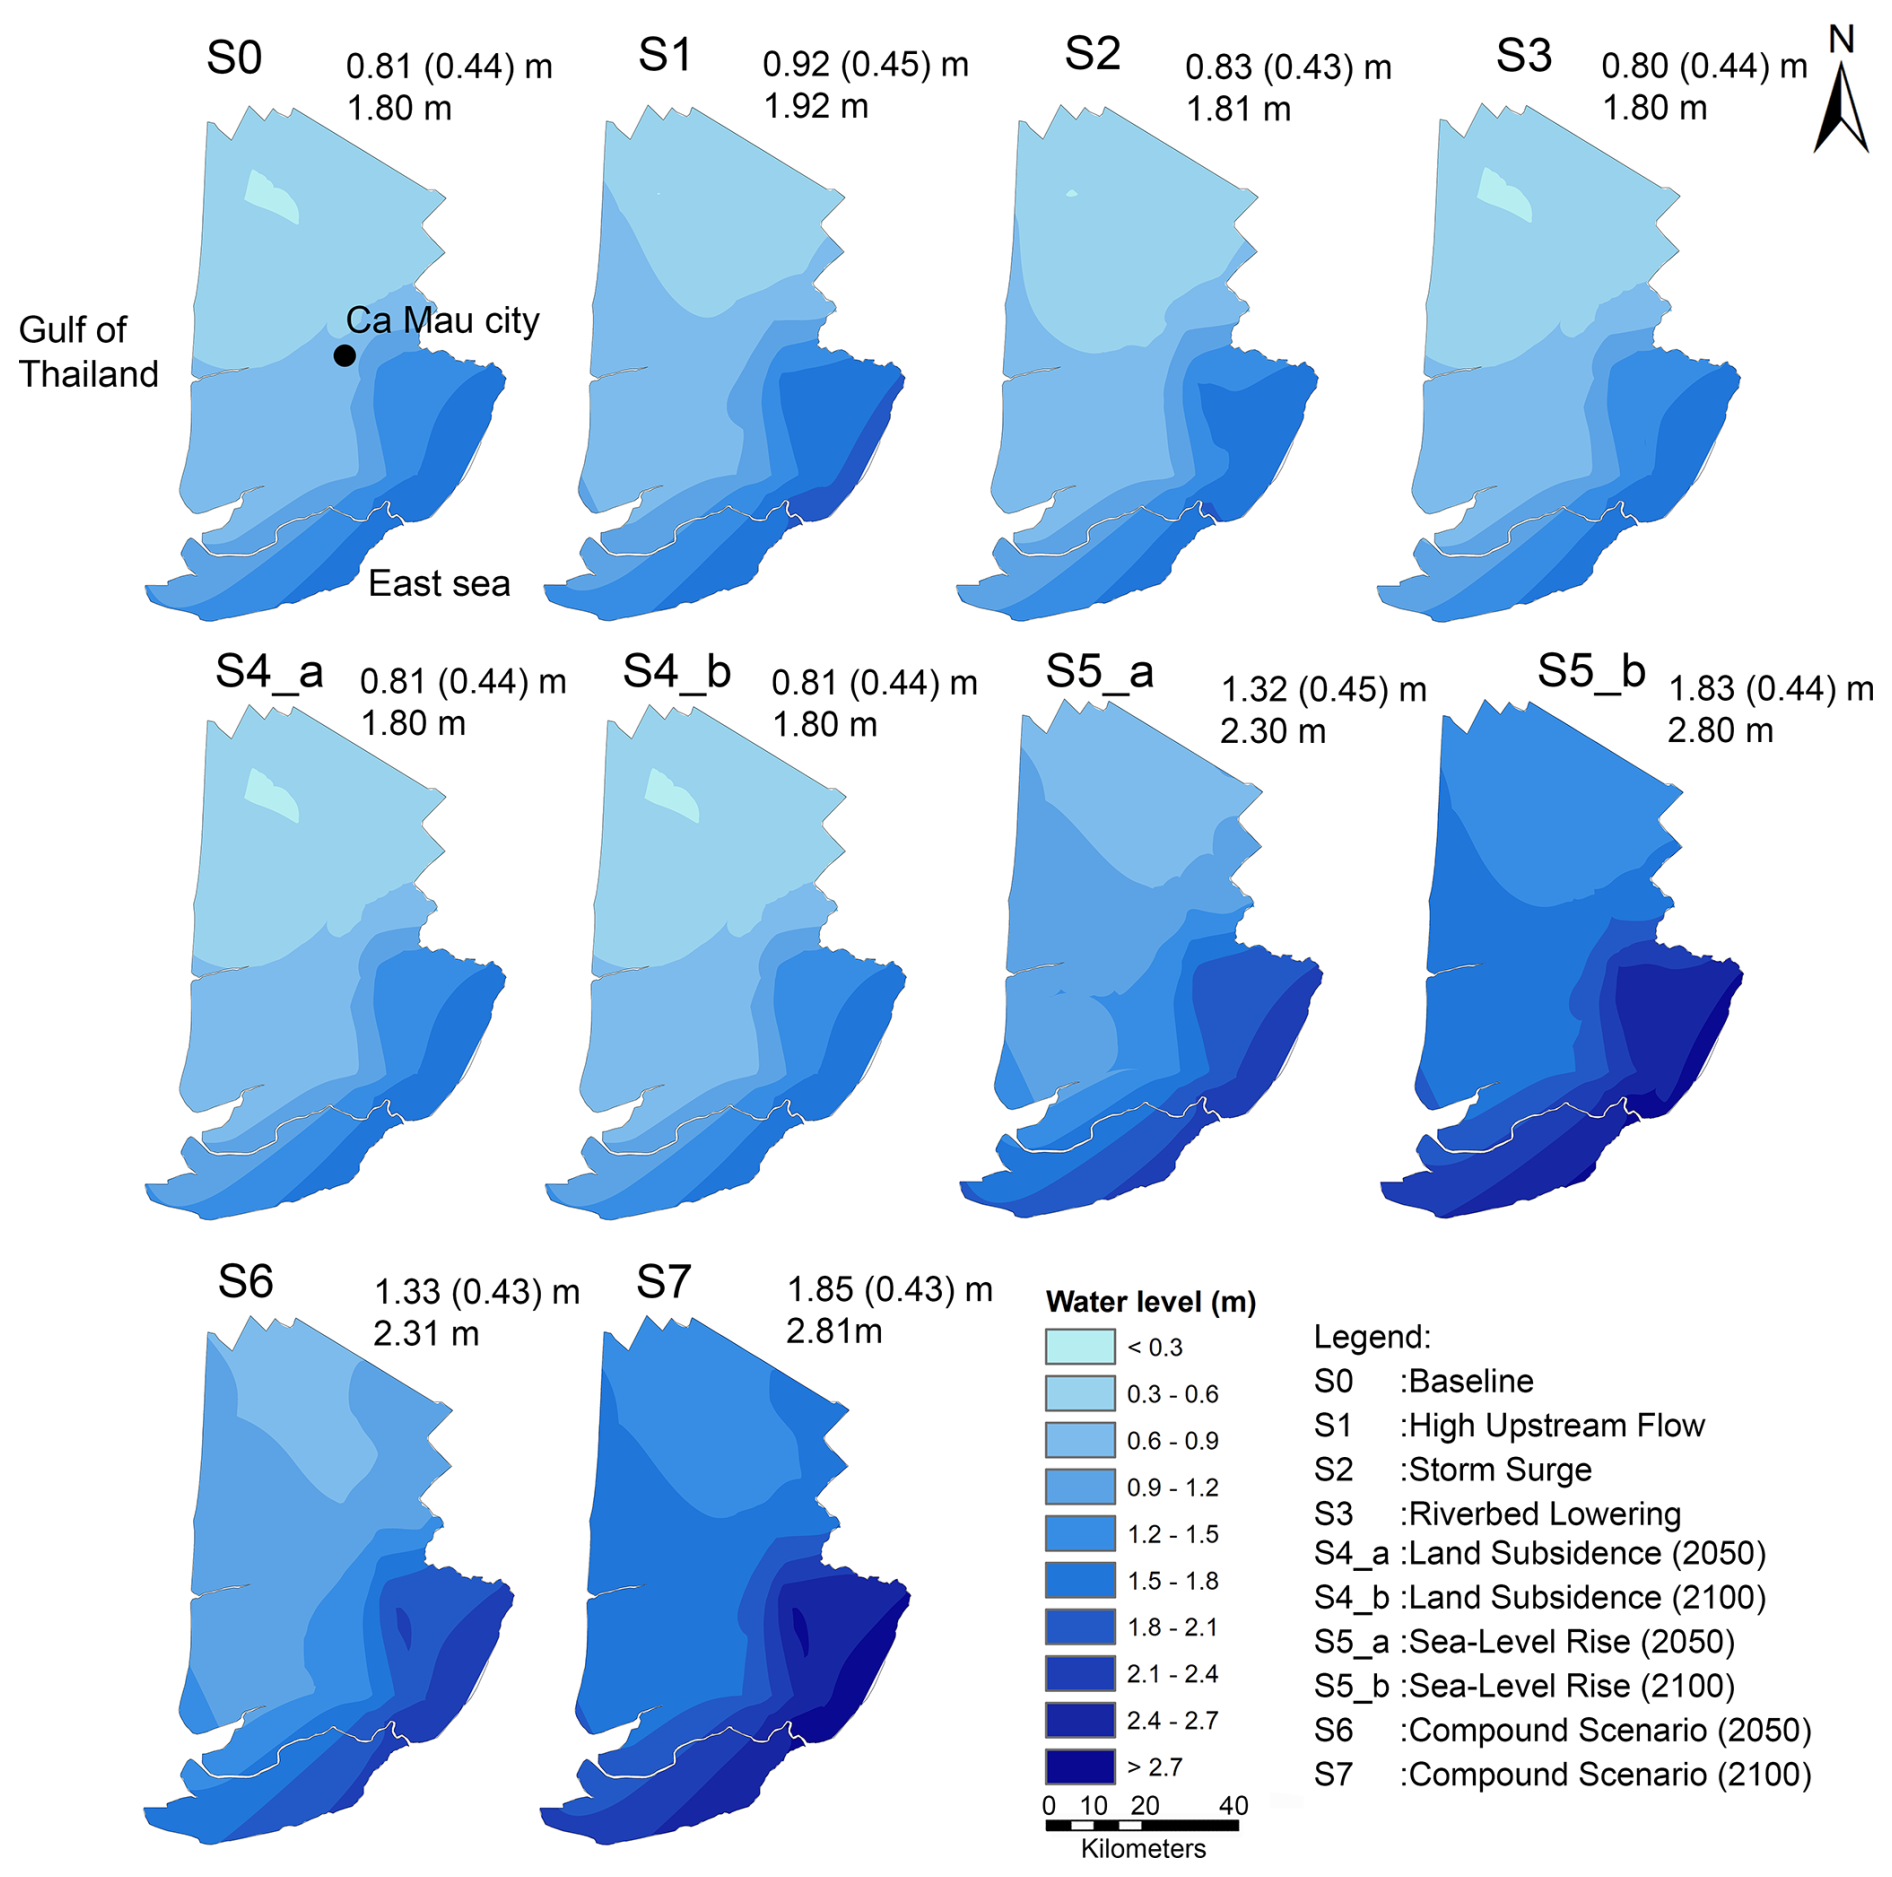
Figure 4The map depicting the maximum water levels in the Ca Mau Peninsula (CMP) under various scenarios. The number in each panel present the average maximum water level (m) and standard deviation (m) (top), along with the peak of these maximum water levels (bottom).
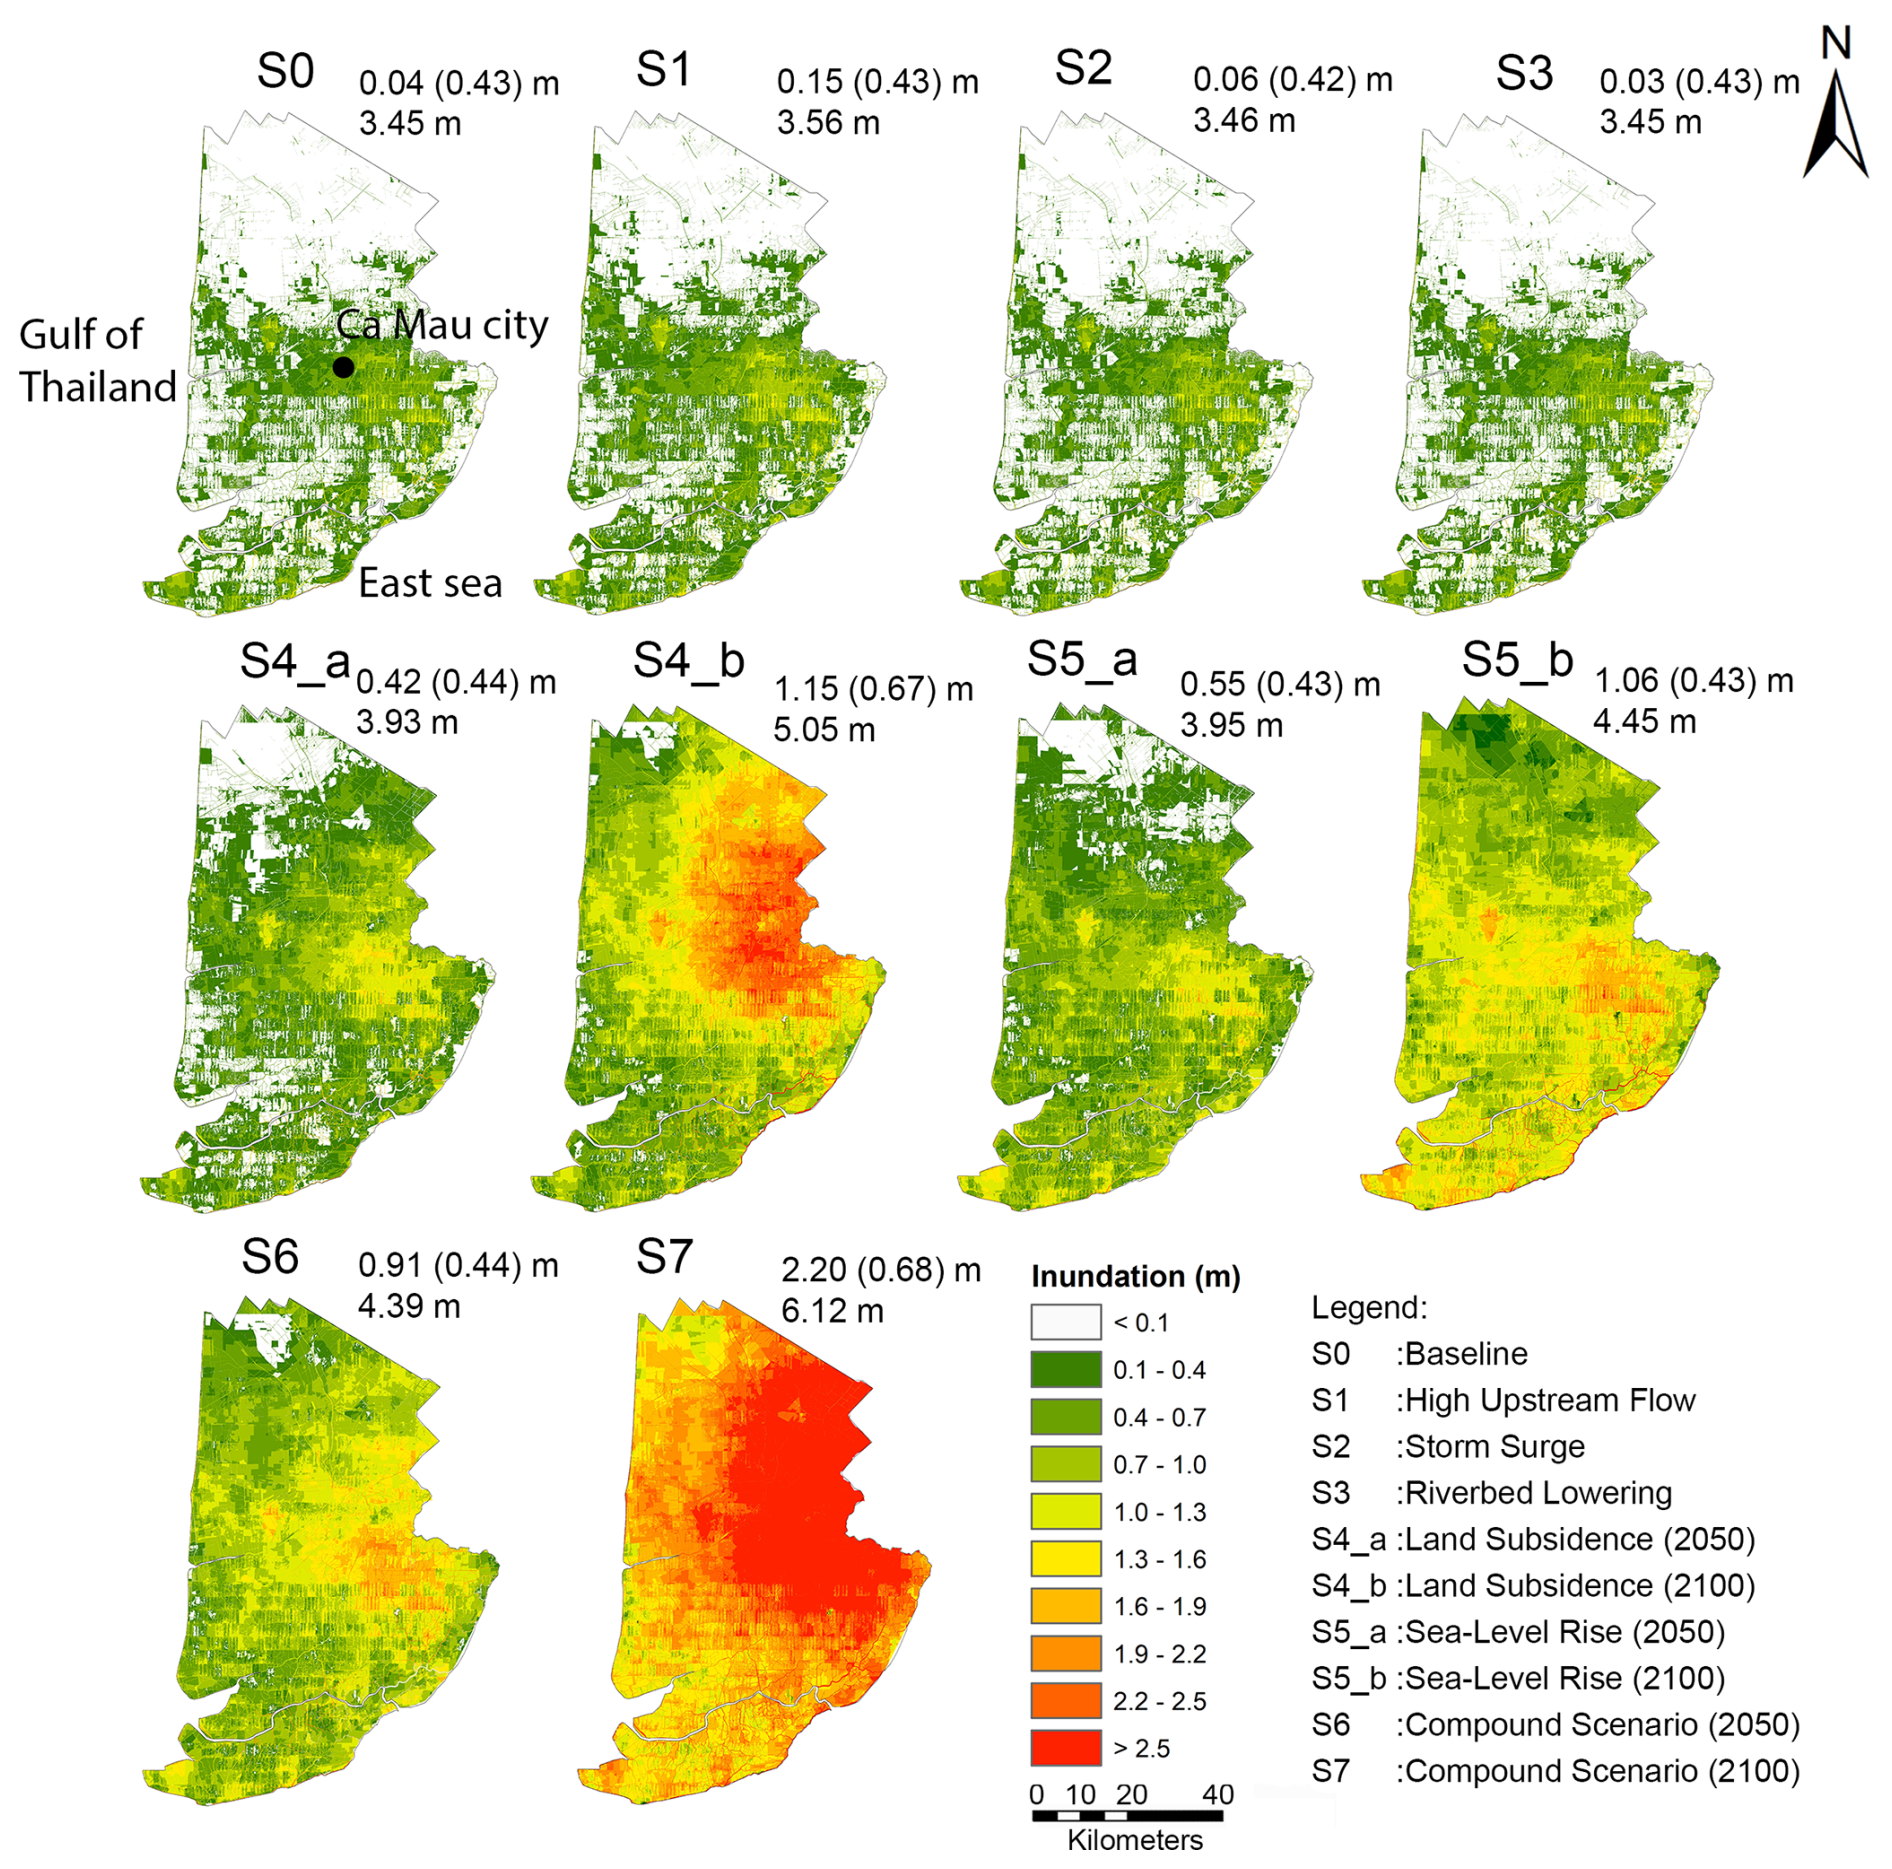
Figure 5Maps of inundation depth in the CMP across different scenarios. The number in each panel present the mean inundation (m) and standard deviation (m) (top), along with the maximum of the inundation level (bottom).
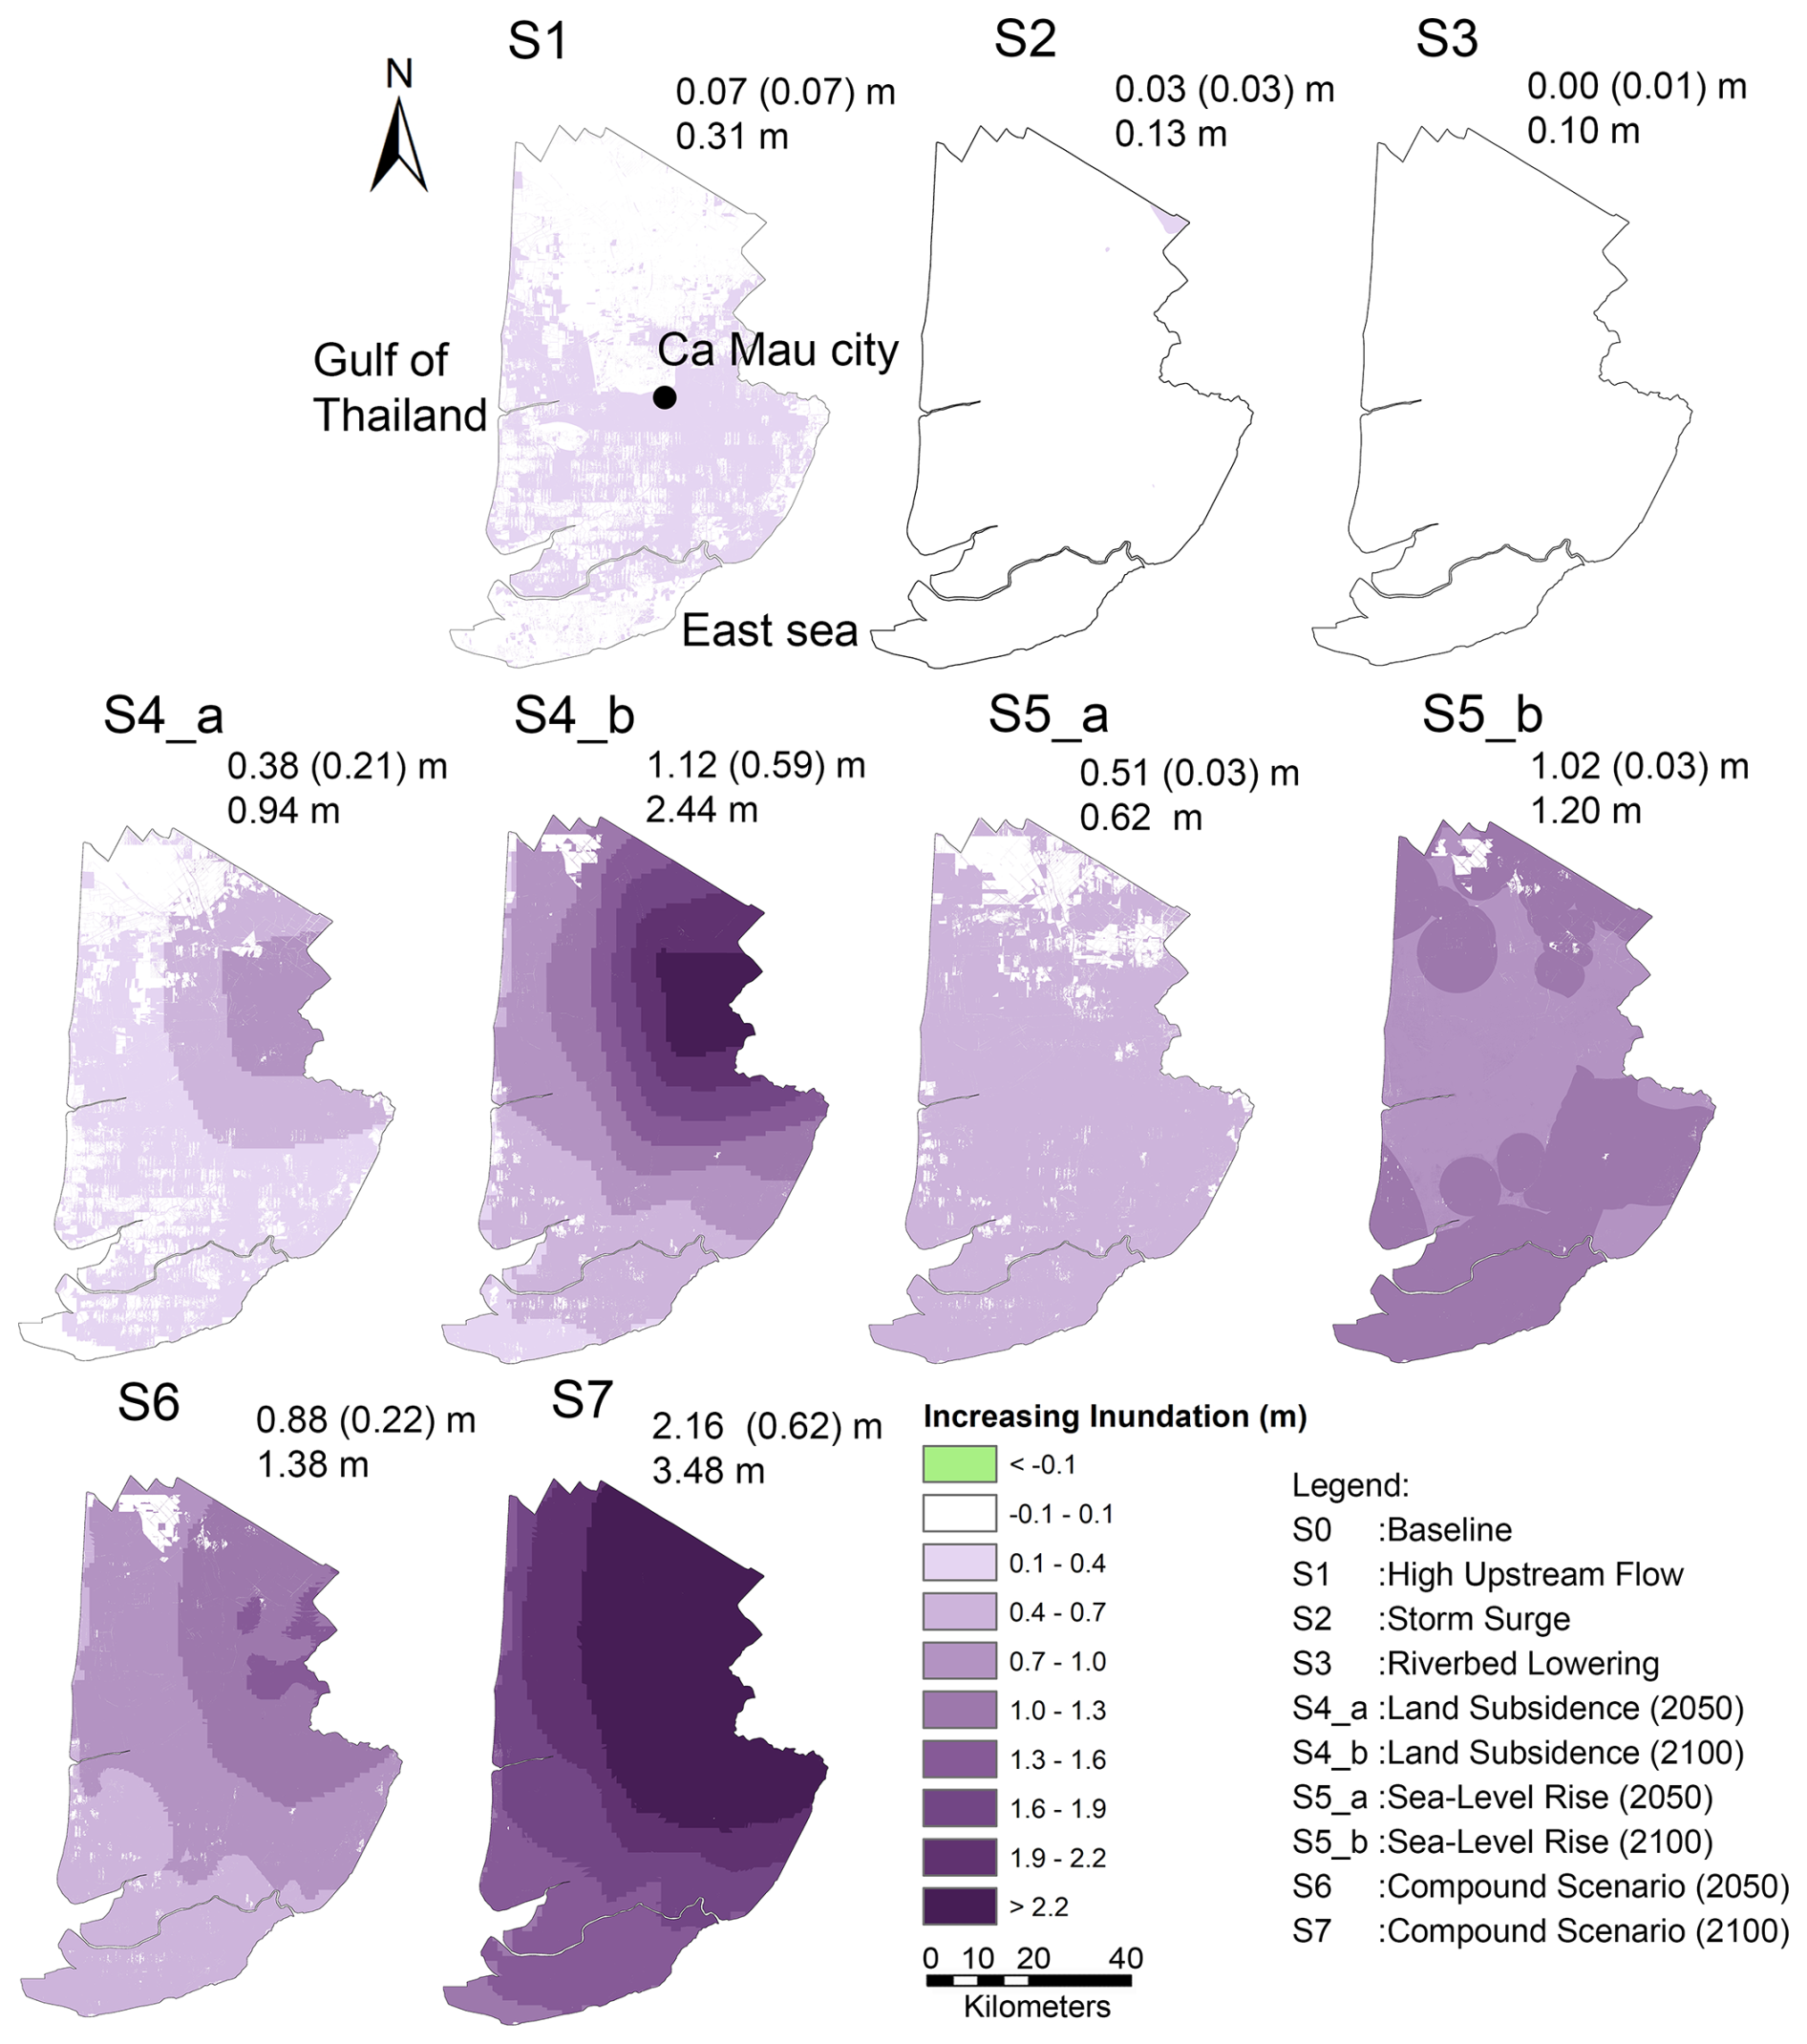
Figure 6The map illustrating the increasing risk of inundation in the CMP across different scenarios in comparison with the baseline scenarios (S0). The number in each panel present the mean increasing of inundation level (m) and standard deviation (m) (top), along with the peak of these increasing of inundation level (bottom).
Table 5The statistics on the flooded area at different levels in the CMP region in our model scenarios.
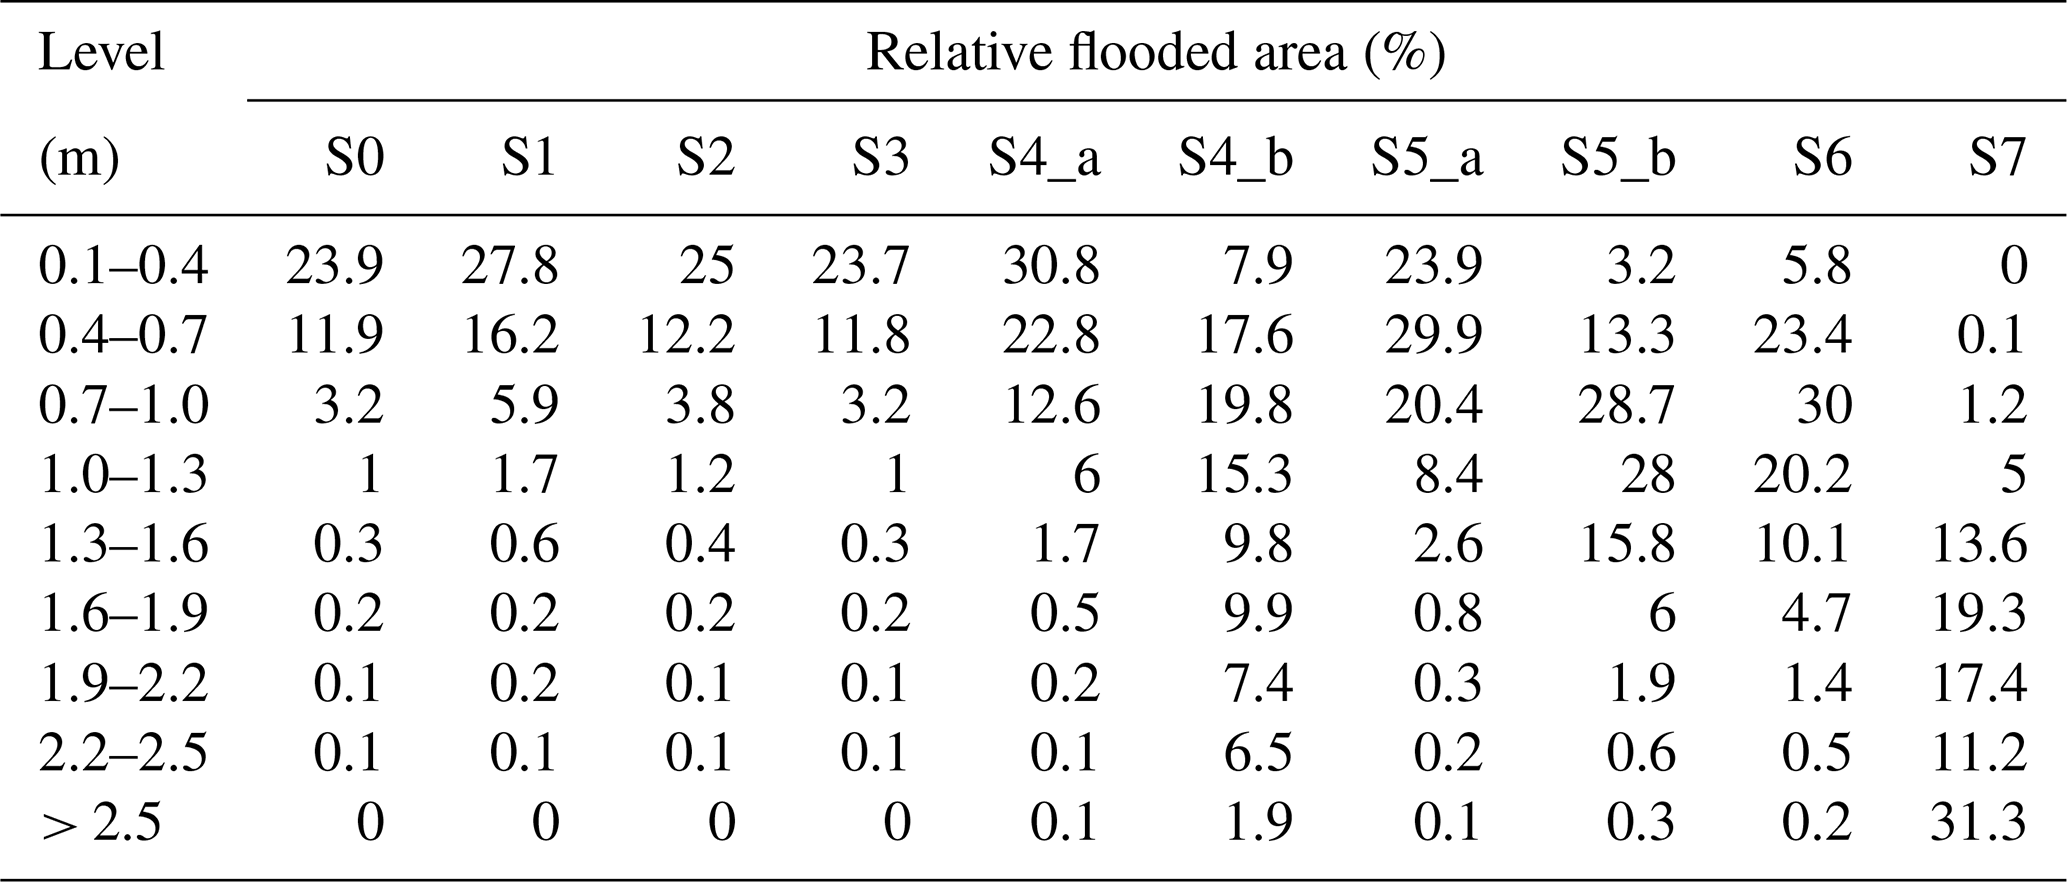
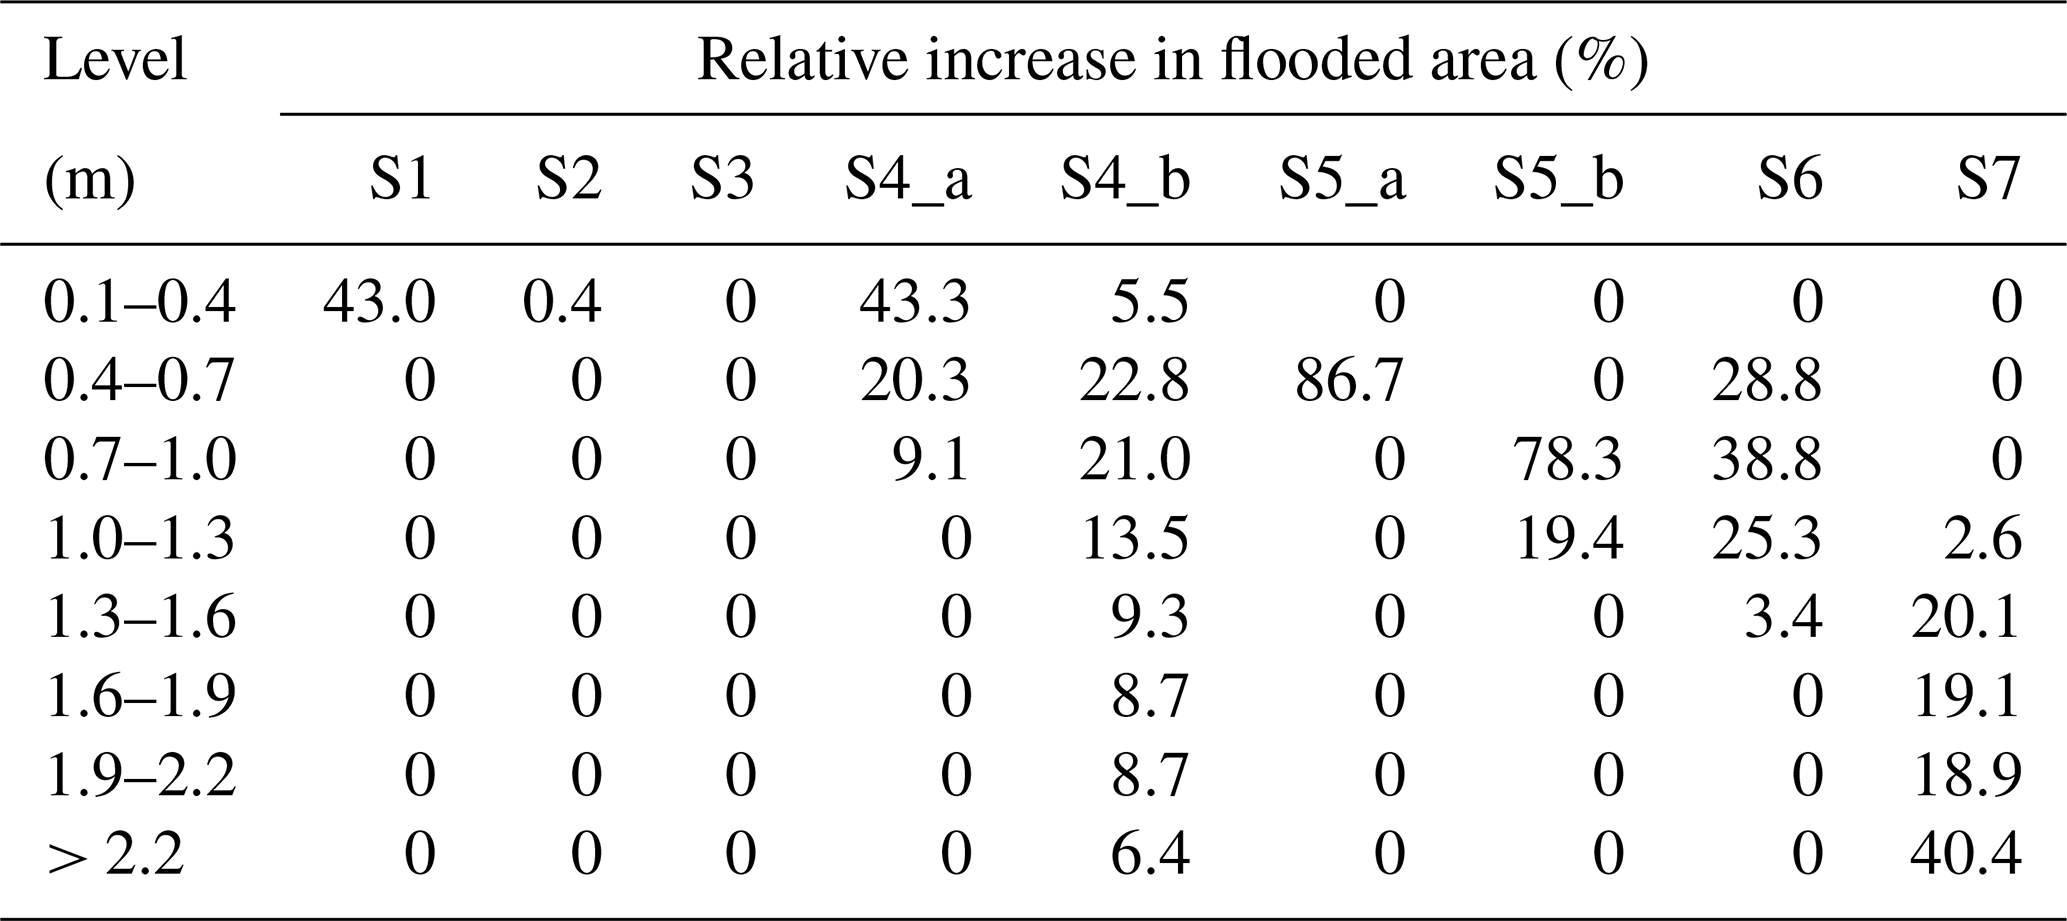
Table 6The percentage increase in area of flooding in each model scenario, compared to the baseline scenario (S0) at different levels in the CMP region.
In the baseline scenarios (S0), the average maximum water level in the study area could reach 0.81 m (σ = 0.44 m), and the peak of the maximum water level could reach 1.8 m in the East Sea coastal zone (Fig. 4). This scenario could result in an average inundation depth of 0.04 m (σ = 0.43 m) (Fig. 5). Furthermore, within these baseline scenarios, the estimated flood coverage is about 23.9 % of the study area, featuring inundation depths between 0.1 and 0.4 m (Table 5).
In scenario S1 (which evaluates the impact of high upstream water discharge involved the total annual volume exceedance frequency of approximately 20 % within the historical data range from 2000 to 2021), the average maximum water level shows a slight increase, reaching 0.92 m (σ = 0.45 m), and the peak of maximum water level could reach 1.92 m in the East Sea coastal zone (Fig. 4). This highlights the small rise in water levels in this coastal area resulting from the combination of high-water discharge and sea water level. Moreover, this scenario results in a rise in average inundation depth to 0.15 m (σ = 0.43 m) (Fig. 5), affecting around 27.8 % of the area with flood depths between 0.1 to 0.4 m and nearly 16.2 % of study area with inundation depths ranging from 0.4 to 0.7 m (Table 5). The impact of solely high upstream water discharge results in a 43 % increase in the study area where inundation depths range from 0.1 to 0.4 m compared to the corresponding values in scenario S0 (Fig. 6 and Table 6).
In scenario S2 (which evaluates the effect of a storm surge with exceedance probability of 1 % AEP reaching the Bassac River mouth; Fig. 1b), the results indicate minimal changes in both the maximum water level and the extent of inundation compared to the baseline scenarios S0 (Figs. 4–6, Tables 5–6). This implies that the potential impact of a storm surge reaching the main Bassac River is likely to be minimal in this area. Similarly, in scenario S3, where the effect of riverbed lowering on the main stream Mekong and Bassac channel is assessed, the findings also demonstrate insignificant alterations in both the maximum water level and the extent of inundation when compared to the baseline scenarios S0 (Figs. 4–6, Table 3).
In scenario S4_a (which investigates the effects of land subsidence up to 2050), results underscore the importance of land subsidence on area inundation. Specifically, the average inundation level shows an increase, rising from 0.04 m (σ = 0.43 m) in the S0 scenarios to 0.42 m (σ = 0.44 m), with peak inundation reaching up to 3.93 m in the vicinity of Ca Mau city (Fig. 5). In addition, it is projected that the inundated area would cover approximately 30.8 % of the study area, with flood depths ranging from 0.1 to 0.4 m (Table 5). Furthermore, this land subsidence scenario could increase the flooding risk by an average of 0.38 m (σ = 0.21 m), with a maximum increase in flooding risk of 0.94 m compared to the baseline S0 scenarios (Fig. 6) and expanding inundation depths by 0.1–0.4 m across 43.3 % of the study area compared to the baseline S0 scenarios (Table 6). Additionally, approximately 20.3 % and 9.1 % of the study area could see rises in inundation depths ranging from 0.4 to 0.7 and 0.7 to 1.0 m, respectively, compared to the baseline scenarios S0 (Table 6).
In scenario S4_b (which analyses the impact of land subsidence up to the end of this century), the results demonstrate a noticeable increase in inundation both spatially and in magnitude. Specifically, the projected land subsidence could elevate the average inundation depth to 1.15 m (σ = 0.67 m) (Fig. 5), affecting 1.9 % of the study area with inundation depths exceeding 2.5 m, while 17.6 % and 19.8 % would face depths of 0.4–0.7 and 0.7–1.0 m, respectively (Table 5). Consequently, this land subsidence level could increase the flooding by an average of 1.12 m (σ = 0.59 m), with the maximum increase in flooding risk being 2.44 m compared to the base scenarios S0 (Fig. 6). Additionally, it could expand the area experiencing 0.4–0.7 m of additional inundation by 22.8 %, while 6.4 % of the region could face water depths exceeding 2.2 m relative to the baseline S0 (Table 6).
In scenario S5_a (which evaluates the impact of a SLR up to 2050 with a value of 0.5 m), the results indicate that the increase in sea level could elevate the average maximum water level up to 1.32 m (σ = 0.45 m), with the maximum water level reaching 2.30 m in the East Sea coastal zone (Fig. 4). Moreover, this rise in sea level also results in an increase in the average inundation depth by 0.55 m (σ = 0.43 m) (Fig. 5), affecting 20.4 % of the study area with inundation depths ranging from 0.7 to 1.0 m, around 29.9 % of the study area with inundation depths ranging from 0.4 to 0.7 m and approximately 23.9 % of the study area with inundation depths ranging from 0.1 to 0.4 m (Table 5). Compared to the S0 baseline scenario, a 0.5 m sea level rise could elevate both the average and peak maximum water levels by 0.51 m (σ = 0.03 m) and 0.62 m, respectively (Fig. 6). Additionally, this sea level rise could expand inundation in 86.7 % of the study area, with water depths increasing by 0.4–0.7 m relative to the S0 scenario (Table 6).
In scenario S5_b (which examines the impact of a 1.0 m sea level rise by 2100), the findings reveal that the results show that the sea level rise raises both the average maximum water level to 1.83 m (σ = 0.44 m) and the peak maximum water level to 2.80 m. As a result, nearly the entire study area is inundated, with an average inundation depth of 1.06 m (σ = 0.43 m) and a peak depth of 4.45 m. About 28.7 % of the area experiences inundation depths ranging from 0.7 to 1.0 m, while the risk of severe flooding increases, affecting 28.0 % of the region with depths ranging from 1.0 to 1.3 m (Table 5). Compared to the S0 scenarios, a 1.0 m sea level rise would raise the average and peak maximum water levels by 1.02 m (σ = 0.03 m) and 1.20 m, respectively (Fig. 6). Additionally, this sea level rise would expand inundation across 78.3 % of the study area, with water depths increasing from 0.7 to 1.0 m, while 19.4 % of the region would experience depths between 1.0 and 1.3 m compared to the S0 scenarios (Table 6).
In combined scenarios S6 (which combine a series of drivers up to 2050; Table 4), the combined factors drive the average maximum water level up to 1.33 m (σ = 0.43 m), with the peak of maximum water level reaching 2.31 m in the East Sea coastal zone (Fig. 4). Additionally, these combined factors result in an average inundation depth of 0.91 m (σ = 0.44 m), with the maximum inundation depth reaching up to 4.39 m (Fig. 5). Most areas experiencing inundation depths ranging from 0.7 to 1.0 m cover 30.0 % study area, with nearly 0.2 % of study area experiencing inundation depths higher than 2.5 m (Table 5). It is noteworthy that the areas experiencing high inundation depths are in the vicinity of Ca Mau city, where the population density is high, making these regions particularly vulnerable to the impacts of flooding. Regarding the increase in inundation compared to corresponding values in S0 scenarios, it is highlighted that these combined factors could elevate the average and peak of maximum water level to 0.88 m (σ = 0.22 m) and 1.38 m respectively, in compared to S0 scenarios (Fig. 6). Furthermore, the influence of these combined factors could lead to an expansion in the area of 38.8 % of study area where the increasing inundation depths range from 0.7 to 1.0 m, while there are 3.4 % study area where the increasing inundation depths range from 1.3 to 1.6 m compared to those in the S0 scenarios. (For further details, see Table 6).
In scenarios S7 (which combines a series of drivers up to 2100; Table 4), these combined factors could result in substantial inundation in the CMP, driving the average maximum water level up to 1.85 m (σ = 0.43 m), with the peak of maximum water level reaching up to 2.81 m in the East Sea coastal zone (Fig. 4). This scenario could also result in an average inundation depth of 2.20 m (σ = 0.68 m) (Fig. 5). A substantial portion of the study area (31.3 %) could experience inundation depths exceeding 2.5 m (Table 5), with particularly high inundation depths (up to 6.12 m) occurring in the vicinity of Ca Mau city. Regarding the increase in inundation compared to corresponding values in S0 scenarios, it is highlighted that these combined factors could elevate the average and peak of maximum water level to 2.16 m (σ = 0.62 m) and 3.48 m respectively (Fig. 6). Furthermore, the influence of these combined factors could lead to an expansion in the area of 2.6 % of study area with the increasing inundation depths ranges from 1.0 to 1.3 m, while there are nearly 40.4 % of study area where the increasing inundation depths exceed 2.2 m compared to those in the S0 scenarios. For further details, please refer to Table 6.
The simulation results underscore the potential anthropogenic impact on the evolution of the inundation regime across the Ca Mau Peninsula (CMP). Specifically, while riverbed lowering in the primary Mekong Rivers and storm surges along the mainstream Mekong River are not expected to substantially impact the inundation patterns in this region, the effect of high-water discharge has caused a slight rise in inundation, ranging from 0.1 to 0.3 m. These minimal impacts are largely due to the fact that high-water discharge, riverbed lowering, and storm surges are concentrated in the upstream regions or in the main Mekong and Bassac Rivers. Given the study area's position further from these main rivers and closer to the coastal zone, these impacts tend to diminish. However, the results emphasizes that land subsidence and tidal influence combined with SLR will be the primary factors driving the escalation of the inundation regime in the CMP in the future, both in extent and magnitude. In the projected future by the mid-century, under the S6 scenarios, a combination of high-water discharge, storm surge, land subsidence, and sea level rise are projected to inundate 96 % of the CMP, with an average inundation depth of 0.91 m (σ = 0.44 m). Looking towards the end of the 21st century under the S7 scenarios, the compounded effects of high-water discharge, storm surge, land subsidence, and a sea level rise are expected to inundate 99 % of the CMP, with an average inundation depth of 2.20 m (σ = 0.68 m). However, it should be noted that these projections are based on the SSP5-8.5 scenarios, which represent the low likelihood, high impact situations. The ramifications of this increasing trend in inundation are now deliberated in relation to the region's future sustainability and its capacity to adapt to present and future changes.
The increasing inundation resulting from land subsidence and SLR poses a considerable threat of saltwater intrusion into inland regions, which will have severe consequences for agriculture, aquaculture, and infrastructure within the CMP. This area is not only economically important but also home to one of the most diverse natural ecosystems in the VMD, with over 79 100 ha of mangrove forests that play a vital role in maintaining the region's ecological balance. These mangrove forests are essential for protecting coastal zones, regulating freshwater flow, and supporting local biodiversity. However, recent years have seen substantial anthropogenic pressure on this ecosystem, particularly from the development of transportation infrastructure, irrigation systems, and water control structures. These developments have led to considerably degradation of the mangrove forests (Son et al., 2015; Hauser et al., 2020; Thuy et al., 2023), further compounded by the potential rise in inundation levels driven by land subsidence and SLR. This combination of factors threatens to accelerate the loss of these critical ecosystems, undermining their ability to provide natural coastal defence, support biodiversity, and mitigate the effects of climate change (Barbier et al., 2008; Temmerman et al., 2013; Jones et al. 2020; Sunkur et al., 2023).
Although land subsidence and SLR contribute to elevation loss and increased inundation, they may also create conditions favourable for sediment deposition in flooded areas. This sediment trapping mechanism has the potential to partially offset elevation loss over time, thereby influencing future inundation depths. However, the effectiveness of this natural compensatory process is significantly constrained by the sharp reduction in sediment flow from upstream rivers, largely due to damming (Kondolf et al., 2014a). These dams have resulted in a projected 57 % decrease in suspended sediment flux, from 99 Mt yr−1 (1980–2009) to 43 Mt yr−1 by 2020–2029 (Bussi et al., 2021). Sediment transport is crucial for maintaining coastal stability, replenishing eroded areas, and preserving elevation. The decline in sediment supply, driven by upstream dams and other human activities, has worsened the region's vulnerability, accelerating coastal erosion and shoreline retreat (Anthony et al., 2015; Tu et al., 2019).
In addition, the study also reveals concerns regarding the region's infrastructure, particularly road construction. According to the national North-South Expressway's design specifications for the period 2021–2025 (No: 912/QĐ-BGTVT), the road crest is set 2.2 m above mean sea level in the Ca Mau area (Fig. 1a). However, land subsidence projections of approximately 0.77 m by mid-century and 2.34 m by the end of the century could potentially lower the road crest to 1.43 and −0.14 m, respectively. These reductions may not ensure adequate protection, especially considering predicted maximum water levels of approximately 1.59 m by 2050 and 2.20 m by 2100. This assessment is based on Vietnam's road construction standards (TCVN 4054: 2005). Furthermore, the development of infrastructure contributes additional pressure to the deltaic land surface, exacerbating land subsidence in these areas.
To mitigate the impacts of flooding caused by SLR and land subsidence in the CMP, it is crucial to implement a combination of sustainable strategies that address both the natural and anthropogenic drivers of flood risk. A primary focus must be on reducing groundwater extraction, the leading cause of land subsidence in the region (Minderhoud et al., 2020). This is critical not only for mitigating land subsidence but also for enhancing the area's resilience to the escalating impacts of climate change (Minderhoud et al., 2020). Additionally, increasing sediment flow from upstream rivers is essential for both replenishing eroded coastal areas and counteracting the effects of land subsidence. By improving sediment management in river systems, such as restoring natural sediment transport pathways and enabling the release of sediment trapped behind dams through flushing operations (Kondolf et al., 2014b; Lai et al., 2024; Laksitaningtyas et al., 2022), the flow of sediment can be enhanced. Moreover, implementing water-saving technologies, such as efficient irrigation systems and the upgrading of water channels from the Bassac River, can significantly reduce the demand for groundwater in agriculture and domestic use. Developing alternative water sources, such as, rainwater harvesting, desalination, and surface water reservoirs, which can reduce dependency on groundwater, ensuring reliable water supplies during periods of drought or high demand. In parallel, restoring and protecting the natural balance between saltwater and freshwater systems is essential. The creation or rehabilitation of tidal marshes and mangrove forests along the coastline can serve as natural barriers, filtering salinity, protecting against erosion and storm surges, and providing critical habitat for biodiversity while sustaining local livelihoods (Barbier et al., 2008; Temmerman et al., 2013; Jones et al., 2020; Sunkur et al., 2023; De Dominicis et al., 2023). In addition, the integration of engineered infrastructure, including tidal barriers, levees, and dikes, can help prevent saltwater intrusion and manage flood risks, particularly in areas most vulnerable to the effects of SLR. Community engagement is also equally important in ensuring the long-term success of these strategies. Raising awareness about the negative impacts of excessive groundwater extraction and the benefits of sustainable water use can foster local participation in conservation efforts. Educational campaigns and training programs can also empower local stakeholders to adopt water-saving practices, contributing to the sustainable management of this vital resource. Finally, investing in robust monitoring systems is essential for tracking groundwater levels, land subsidence rates, and water usage patterns. Accurate, real-time data can inform effective decision-making, enabling authorities to prioritize interventions and manage resources efficiently. By integrating these natural, infrastructural, and community-based strategies, the CMP can build resilience against flooding, safeguard its ecosystems, and ensure the sustainability of its agricultural and aquacultural industries, even in the face of rising seas and land subsidence.
In this study, flood hazard in the CMP was assessed using 1D modelling, considering both individual and combined flood-inducing factors. Although the results provide useful insights, it is essential to recognize the inherent uncertainties associated with the model scenarios and methodologies used. One limitation arises from the use of a one-dimensional model, which calculates water levels in the floodplain through spatial interpolation from the water levels in surrounding channels. While this approach may be less accurate compared to a 2D model. However, by integrating a quasi-2D representation of the floodplains, the model improves its capability to simulate hydrodynamic behaviour more accurately, offering a reasonable estimate when compared to 2D modelling. The model does not account for long-term sediment transport, which could influence changes in the floodplain area, with sedimentation potentially counteracting land subsidence (Hung et al., 2014; Zoccarato et al., 2018). While this limitation is acknowledged, the study partially addresses it by incorporating predicted bathymetric changes in the main Mekong River up to 2038, considering factors such as sediment deficits and sand mining activities (Vasilopoulos et al., 2021). These adjustments are intended to capture certain aspects of sediment dynamics and their potential impact on the delta.
Although the accuracy of topographic DEMs in the VMD remains a topic of ongoing discussion (Minderhoud et al., 2019), this study utilized a Digital Elevation Model (DEM) for the CMP developed by the Ministry of Natural Resources and Environment (MONRE) in 2008 (Tran et al., 2016). This DEM, with a resolution of 5 m × 5 m, is based on the WGS84 coordinate system and the Hon Dau mean sea level datum, and was created using high-quality survey data, topographic maps, and photogrammetric information (Tran et al., 2016). While this methodology aligns with the TOPO DEM by Minderhoud et al. (2019), which is known for its accuracy at a coarser resolution (500 m × 500 m), the higher resolution of our DEM is better suited for localized analyses of the CMP, providing greater precision in capturing the region's topography and inundation dynamics. The use of a 5 × 5 m resolution DEM in this study has provided a detailed representation of the topographical variations within the study area. However, this high level of detail also introduces certain artefacts that become apparent in Figs. 5 and 6. These artefacts stem from the granularity of the DEM dataset, which captures subtle variations in elevation between adjacent cells. Such elevation differences are particularly pronounced in the mapping of inundation levels, where thresholds such as < 0.1 m (unflooded; white colour, Fig. 5) and 0.1–0.4 m (flooded; green colour, Fig. 5) highlight the varying extents of inundated areas. While this granularity allows for a more precise delineation of inundation zones, it also introduces abrupt transitions in the inundation extent that may not accurately reflect real-world conditions. These artefacts are especially noticeable in flat or low-lying areas, where small discrepancies in elevation can disproportionately affect the modelled inundation extent. Despite these limitations, the 5 × 5 m DEM provides valuable insights into the spatial distribution of inundation areas at a resolution suitable for regional-scale assessments. The artefacts observed in this study highlight the importance of balancing DEM resolution with the study's scale and objectives to ensure accurate and reliable outcomes. The assumption that areas with a depth of less than 0.1 m are classified as unflooded is typically used to identify negligible inundation. However, in urban areas, even shallow water depths can become hazardous when associated with high flow velocities. Such conditions can lead to risks, such as infrastructure damage, heightened erosion, and potential threats to public safety. Additionally, the use of a DEM from 2008 introduces a temporal discrepancy when combined with sea level rise (SLR) and land subsidence scenarios derived from 2018 data. Between 2008 and 2018, SLR in the coastal region was relatively small, with an estimated increase of less than 5 cm according to MONRE projections (Tran et al., 2016), which had minimal impact on the analysis. However, land subsidence during this period was more pronounced, with a maximum of 15 cm in certain areas (Minderhoud et al., 2017). Although these changes could introduce slight inaccuracies in the DEM's topography, the variations in relative elevation from 2008 to 2018 remain negligible within the scope of this study. Specifically, sea level rise scenarios range from 0.5 to 1 m, and land subsidence scenarios range from 0.38 m (σ = 0.21 m) to 1.12 m (σ = 0.59 m), reflecting regional variability. Thus, the relative elevation changes from 2008 to 2018 are considered minimal within the scope of our analysis.
Regarding land subsidence scenarios, this study focuses solely on the impact of groundwater extraction, excluding other factors contributing to land subsidence, such as natural subsidence, tectonic movements, or other human activities (Minderhoud et al., 2017; Zoccarato et al., 2018; Karlsrud et al., 2020). This emphasis is based on the fact that groundwater extraction is the primary driver of land subsidence in the CMP (Minderhoud et al., 2017; Karlsrud et al., 2020). However, it is important to acknowledge that reduced sediment input from upstream could exacerbate natural subsidence processes, particularly through natural compaction, as discussed by Zoccarato et al. (2018). Therefore, while this study does not account for these additional subsidence factors, the broader context of sediment deficits should be considered as a contributing factor to the overall land subsidence in the region.
Finally, the inundation scenarios in this study are based on long-term projections that consider the cumulative impacts of land subsidence and sea level rise up to 2100. While these projections are essential for evaluating future risks and guiding long-term planning, they may not fully account for short-term fluctuations or temporary environmental changes, potentially leading to an overestimation of short-term impacts. Although the focus on long-term trends offers valuable insights into future scenarios, further research that includes short-term variability is needed to provide a more comprehensive understanding of the region's vulnerability to flooding and land subsidence in the near term.
The Ca Mau peninsula (CMP) is identified as one of the most promising economic hubs for agriculture and aquaculture within both the Vietnamese Mekong Delta (VMD) region and Vietnam as a whole. Nonetheless, this area also experiences considerable flood risk. This study aimed to predict inundation patterns across the CMP by modelling the impacts of various flood-inducing factors, both individually and in combination. The 1D hydrodynamic model, initially proposed by Dung (2011), has been enhanced with updated bathymetry data of the main Mekong River bed within the VMD in 2018, and with infrastructure features (such as dykes, sluices) in 2019 across the entire VMD. The model has been fully calibrated and validated to accurately simulate the flood regime within the VMD and study area.
The findings indicate that factors such as increased high-water flow from upstream, riverbed lowering in the main Mekong channel, and occurrences of storm surges along the mainstream Bassac River are unlikely to substantial impact the inundation dynamics in this CMP. However, the study underscores that land subsidence, rising sea levels, and their combined effects are primary drivers behind the escalation of inundation events in the CMP, both in terms of extent and intensity, in the foreseeable future.
In the projected future by the mid-century, a compounded effect of factors including high-water discharge (with a total annual volume exceedance frequency of approximately 20 %), storm surge (with an annual exceedance probability of 1 % AEP along the Bassac river mouth), land subsidence (averaging around 0.38 m (σ = 0.21 m), and a SLR of 0.5 m is expected to result in the inundation of 96 % of the CMP area, with an average inundation depth of 0.91 m (σ = 0.44 m). Looking further into the end of the century, under a compounded influence of high-water discharge (with a total volume exceedance frequency of approximately 20 %), storm surge (with an annual exceedance probability of 1 % AEP along the Bassac river mouth), land subsidence (averaging around 1.12 m (σ = 0.59 m)), and a SLR of 1 m, the projected inundation of the CMP is expected to encompass 99 % of the area, with an average inundation depth of 2.20 m (σ = 0.68 m).
These results show that the future potential risks associated with the rising inundation levels in this study area need to be carefully considered concerning the future sustainability of the region and its ability to adapt to both current and forthcoming pressures due to human activity and climate change. This objective of these findings is to provide insight for strategic planners as they contemplate various avenues for spatial development within the CMP. They represent a crucial foundation for shaping policies and devising investment strategies related to infrastructure systems, including flood defences, tidal defence dykes, and irrigation and especially for safe transportation. Furthermore, the projected rise in inundation levels in this region, largely attributed to SLR and land subsidence, poses a significant challenge to the preservation of one of the pristine mangrove forest ecosystems in the VMD. This ecosystem is already under threat from ongoing infrastructure developments in the area. Therefore, it is imperative to implement measurement, planning, and adaptation strategies to address this issue effectively in the future.
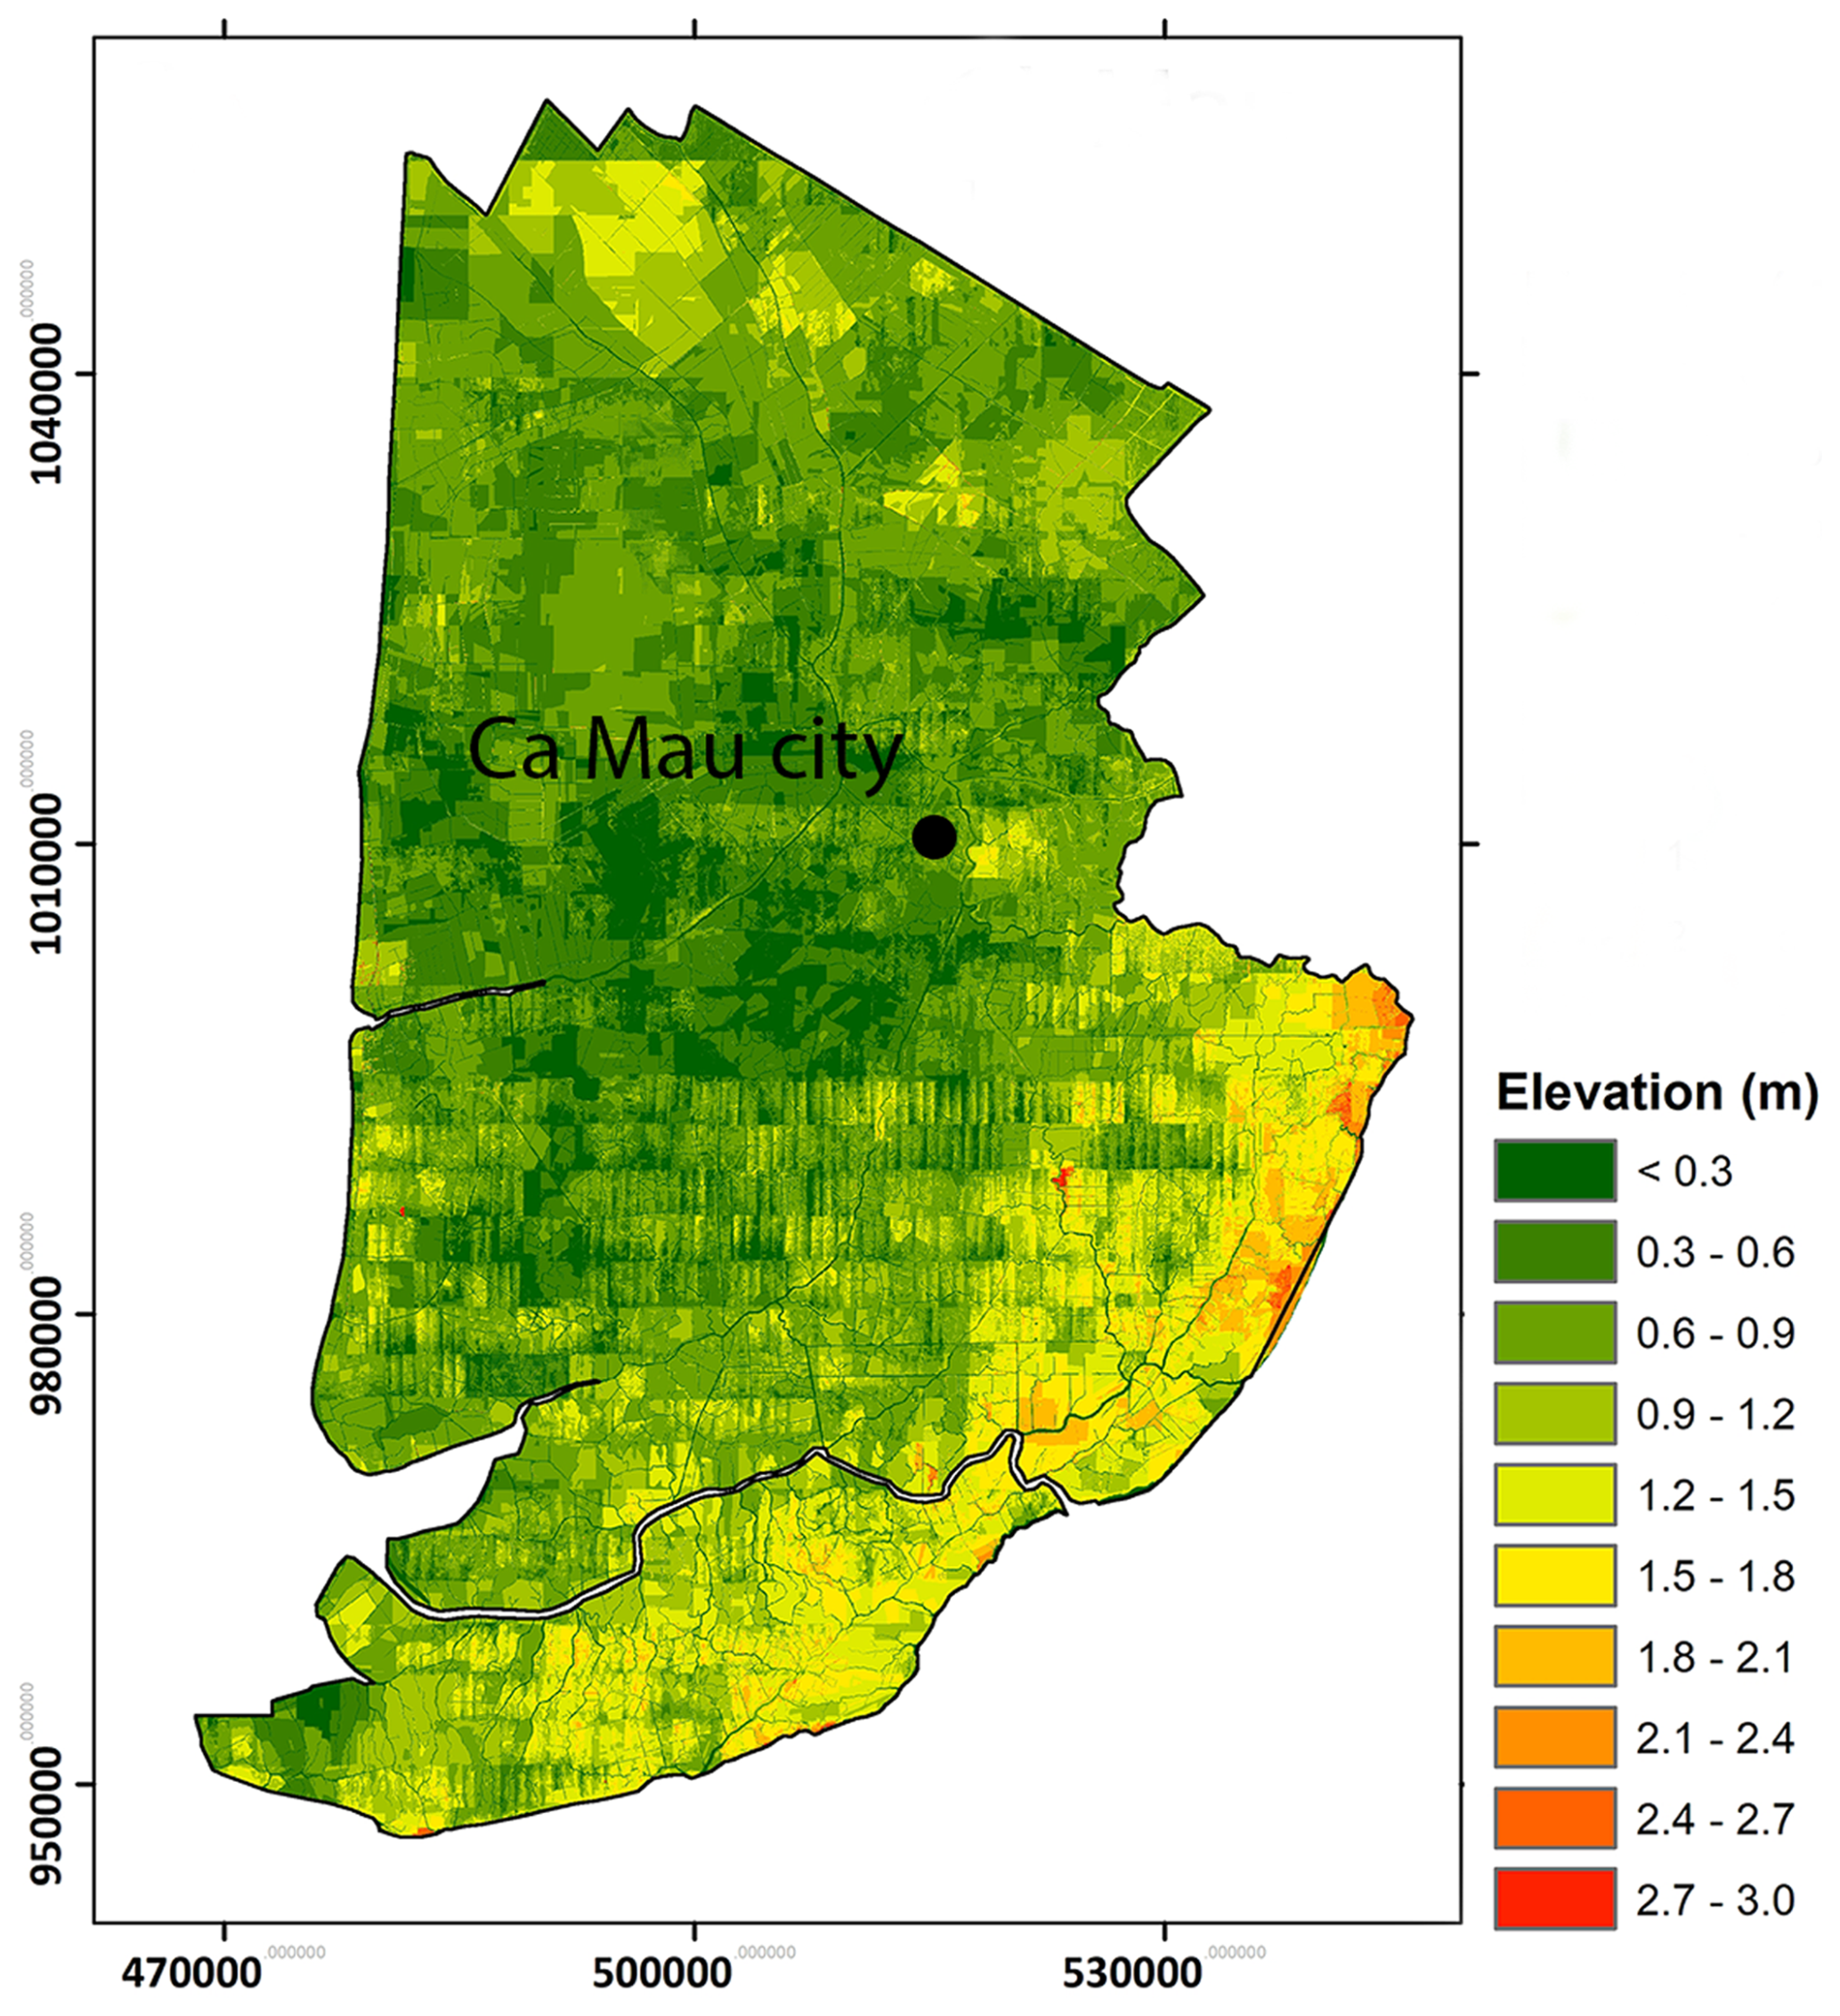
Figure A1DEM illustrates the flat terrain of the CMP acquired from the Ministry of Natural Resources and Environment (MONRE) in 2008 (Tran et al., 2016).
Hydrological data for gauging stations in Cambodia are available from the Mekong River Commission Data Portal (https://portal.mrcmekong.org/monitoring/river-monitoring-telemetry, last access: 27 October 2025). Hydrological data for gauging stations in Vietnam can be requested from the Southern Regional Hydro-Meteorological Centre (SRHMC; https://www.kttv-nb.org.vn/index.php, last access: 27 October 2025), Vietnam. Storm surge data for the Vietnamese Mekong coastal zone were obtained from Wood et al. (2023) and are available upon request from the corresponding author of that study. Riverbed lowering data for the Mekong River were adopted from Vasilopoulos et al. (2021) and are publicly available at https://hydra.hull.ac.uk/resources/hull:17951 (last access: 27 October 2025). Delta subsidence data for the Vietnamese Mekong Delta were derived from Minderhoud et al. (2020) and are available upon request from the corresponding author of that study. The DEM of the Ca Mau Peninsula and the 1D model of the Lower Mekong Basin can be requested from the Southern Institute of Water Resources Research (SIWRR; https://www.siwrr.org.vn/, last access: 27 October 2025), Vietnam.
HNN: Conceptualization, Methodology, Resources, Modelling, Formal Analysis, Writing – original draft, Writing – review & editing. QQL: Conceptualization, Methodology, Data curation, Modelling, Validation, Formal Analysis, Visualization, Writing – original draft, Writing – review & editing. VDN: Conceptualization, Methodology, Investigation, Writing – original draft, Writing – review & editing. HDD: Methodology, Writing – review & editing. HDP: Writing – review & editing. THC: Writing – review & editing. TQT: Writing – review & editing. MW: Conceptualization, Methodology, Writing – review & editing. IDH: Conceptualization, Methodology, Writing – review & editing.
The contact author has declared that none of the authors has any competing interests.
Publisher's note: Copernicus Publications remains neutral with regard to jurisdictional claims made in the text, published maps, institutional affiliations, or any other geographical representation in this paper. While Copernicus Publications makes every effort to include appropriate place names, the final responsibility lies with the authors. Views expressed in the text are those of the authors and do not necessarily reflect the views of the publisher.
This article is part of the special issue “Strengthening climate-resilient development through adaptation, disaster risk reduction, and reconstruction after extreme events”. It is not associated with a conference.
The authors sincerely thank Dr. Philip S. J. Minderhoud for providing the land subsidence scenarios for the Mekong Delta. We also express our gratitude to Dr. Grigorios Vasilopoulos for his assistance in supplying the bathymetric data of the Mekong River. Quan Quan Le acknowledges financial support from the Department of Geography and Environment, Loughborough University, UK.
This research has been supported by the National Foundation for Science and Technology Development (grant no. NE/S003150/1).
This paper was edited by Marvin Ravan and reviewed by three anonymous referees.
Anthony, E. J., Brunier, G., Besset, M., Goichot, M., Dussouillez, P., and Nguyen, V. L.: Linking rapid erosion of the Mekong River delta to human activities, Sci. Rep., 5, https://doi.org/10.1038/srep14745, 2015.
Attaher, S. M., Medany, M. A., and Abou-Hadid, A. F.: Possible adaptation measures of agriculture sector in the Nile Delta to climate change impacts, Adv. Sci. Res., 3, 123–126, https://doi.org/10.5194/asr-3-123-2009, 2009.
Barbier, E. B., Koch, E. W., Silliman, B. R., Hacker, S. D., Wolanski, E., Primavera, J., Granek, E. F., Polasky, S., Aswani, S., Cramer, L. A., Stoms, D. M., Kennedy, C. J., Bael, D., Kappel, C. V., Perillo, G. M. E., and Reed, D. J.: Coastal ecosystem-based management with nonlinear ecological functions and values, Science, 319, 321–323, https://doi.org/10.1126/science.1150349, 2008.
Best, J.: Anthropogenic stresses on the world's big rivers, Nat. Geosci., 12, 7–21, https://doi.org/10.1038/s41561-018-0262-x, 2019.
Bevacqua, E., Maraun, D., Vousdoukas, M. I., Voukouvalas, E., Vrac, M., Mentaschi, L., and Widmann, M.: Higher probability of compound flooding from precipitation and storm surge in Europe under anthropogenic climate change, Sci. Adv., 5, 1–7, https://doi.org/10.1126/sciadv.aaw5531, 2019.
Bravard, J. P., Goichot, M., and Gaillot, S.: Geography of Sand and Gravel Mining in the Lower Mekong River, EchoGéo, 1–20, https://doi.org/10.4000/echogeo.13659, 2013.
Bussi, G., Darby, S. E., Whitehead, P. G., Jin, L., Dadson, S. J., Voepel, H. E., Vasilopoulos, G., Hackney, C. R., Hutton, C., Berchoux, T., Parsons, D. R., and Nicholas, A.: Impact of dams and climate change on suspended sediment flux to the Mekong delta, Sci. Total Environ., 755, https://doi.org/10.1016/j.scitotenv.2020.142468, 2021.
Chen, W. B. and Liu, W. C.: Modeling flood inundation induced by river flow and storm surges over a river basin, Water, 6, 3182–3199, https://doi.org/10.3390/w6103182, 2014.
Dang, A. T. N., Reid, M., and Kumar, L.: Coastal Melaleuca wetlands under future climate and sea-level rise scenarios in the Mekong Delta, Vietnam: vulnerability and conservation, Reg. Environ. Chang., 23, 1–13, https://doi.org/10.1007/s10113-022-02009-8, 2023.
De Dominicis, M., Wolf, J., van Hespen, R., Zheng, P., and Hu, Z.: Mangrove forests can be an effective coastal defence in the Pearl River Delta, China, Commun. Earth Environ., 4, https://doi.org/10.1038/s43247-022-00672-7, 2023.
Duc Tran, D., van Halsema, G., Hellegers, P. J. G. J., Phi Hoang, L., Quang Tran, T., Kummu, M., and Ludwig, F.: Assessing impacts of dike construction on the flood dynamics of the Mekong Delta, Hydrol. Earth Syst. Sci., 22, 1875–1896, https://doi.org/10.5194/hess-22-1875-2018, 2018.
Dung, N. V.: Multi-objective automatic calibration of hydrodynamic models – development of the concept and an application in the Mekong Delta, http://elib.uni-stuttgart.de/opus/volltexte/2012/6831/ (last access: 16 January 2024), 2011.
Edmonds, D. A., Caldwell, R. L., Brondizio, E. S., and Siani, S. M. O.: Coastal flooding will disproportionately impact people on river deltas, Nat. Commun., 11, 1–8, https://doi.org/10.1038/s41467-020-18531-4, 2020.
Erban, L. E., Gorelick, S. M., and Zebker, H. A.: Groundwater extraction, land subsidence, and sea-level rise in the Mekong Delta, Vietnam, Environ. Res. Lett., 9, https://doi.org/10.1088/1748-9326/9/8/084010, 2014.
Eslami, S., Hoekstra, P., Trung, N. N., Kantoush, S. A., Binh, D. V., Dung, D. D., Quang, T. T., and Vegt, M. V. .: Tidal amplification and salt intrusion in the Mekong Delta driven by anthropogenic sediment starvation, Sci. Rep., 9, 1–10, https://doi.org/10.1038/s41598-019-55018-9, 2019.
Fox-Kemper, B., Hewitt, H. T., Xiao, C., Aðalgeirsdóttir, G., Dri- jfhout, S. S., Edwards, T. L., Golledge, N. R., Hemer, M., Kopp, R. E., Krinner, G., Mix, A., Notz, D., Nowicki, S., Nurhati, I. S., Ruiz, L., Sallée, J.-B., Slangen, A. B. A., and Yu, Y.: Ocean, Cryosphere and Sea Level Change, in: Climate Change 2021: The Physical Science Basis, Contribution of Working Group I to the Sixth Assessment Report of the Intergovernmental Panel on Climate Change, edited by: Masson-Delmotte, V., Zhai, P., Pirani, A., Connors, S. L., Péan, C., Berger, S., Caud, N., Chen, Y., Goldfarb, L., Gomis, M. I., Huang, M., Leitzell, K., Lonnoy, E., Matthews, J. B. R., Maycock, T. K., Waterfield, T., Yelekçi, O., Yu, R., and Zhou, B., Cambridge Univ. Press. UK New York, NY, USA, 1211–1362, https://doi.org/10.1017/9781009157896.011, 2021.
Ganguli, P. and Merz, B.: Trends in Compound Flooding in Northwestern Europe During 1901–2014, Geophys. Res. Lett., 46, 10810–10820, https://doi.org/10.1029/2019GL084220, 2019.
Garner, A. J., Weiss, J. L., Parris, A., Kopp, R. E., Overpeck, J. T., and Horton, B. P.: Evolution of 21st Century Sea Level Rise Projections, Earth's Futur., 1603–1615, https://doi.org/10.1029/2018EF000991, 2018.
General Statistics Office of Vietnam: https://www.nso.gov.vn/, last access: 25 March 2024.
Giosan, L., Syvitski, J., Constantinescu, S., and Day, J. W.: Climate change: Protect the world's deltas, Nature, 516, 31–33, https://doi.org/10.1038/516031a, 2014.
Gugliotta, M., Saito, Y., Nguyen, V. L., Ta, T. K. O., Nakashima, R., Tamura, T., Uehara, K., Katsuki, K., and Yamamoto, S.: Process regime, salinity, morphological, and sedimentary trends along the fluvial to marine transition zone of the mixed-energy Mekong River delta, Vietnam, Cont. Shelf Res., 147, 7–26, https://doi.org/10.1016/j.csr.2017.03.001, 2017.
Hackney, C. R., Vasilopoulos, G., Heng, S., Darbari, V., Walker, S., and Parsons, D. R.: Sand mining far outpaces natural supply in a large alluvial river, Earth Surf. Dynam., 9, 1323–1334, https://doi.org/10.5194/esurf-9-1323-2021, 2021.
Haigh, I. D., Wijeratne, E. M. S., MacPherson, L. R., Pattiaratchi, C. B., Mason, M. S., Crompton, R. P., and George, S.: Estimating present day extreme water level exceedance probabilities around the coastline of Australia: Tides, extra-tropical storm surges and mean sea level, Clim. Dyn., 42, 121–138, https://doi.org/10.1007/s00382-012-1652-1, 2014.
Hall, J. A., Weaver, C. P., Obeysekera, J., Crowell, M., Horton, R. M., Kopp, R. E., Marburger, J., Marcy, D. C., Parris, A., Sweet, W. V., Veatch, C., and White, K. D.: Rising Sea Levels: Helping Decision-Makers Confront the Inevitable, Coast. Manag., 47, 127–150, https://doi.org/10.1080/08920753.2019.1551012, 2019.
Hauser, L. T., Hauser, L. T., Binh, N. A., Hoa, P. V., Quan, N. H., and Timmermans, J.: Gap-Free Monitoring of Annual Mangrove Forest Dynamics in Ca Mau Province, Vietnamese Mekong Delta, Using the Landsat-7–8 Archives and Post-Classification Temporal Optimization, Remote Sens., https://doi.org/10.3390/rs12223729, 2020.
Hoang, L. P., Lauri, H., Kummu, M., Koponen, J., van Vliet, M. T. H., Supit, I., Leemans, R., Kabat, P., and Ludwig, F.: Mekong River flow and hydrological extremes under climate change, Hydrol. Earth Syst. Sci., 20, 3027–3041, https://doi.org/10.5194/hess-20-3027-2016, 2016.
Hung, N. N., Delgado, J. M., Güntner, A., Merz, B., Bárdossy, A., and Apel, H.: Sedimentation in the floodplains of the Mekong Delta, Vietnam. Part I: suspended sediment dynamics, Hydrol. Process., 28, 3132–3144, https://doi.org/10.1002/hyp.9856, 2014.
IPCC: Climate Change 2007: Impacts, Adaptation and Vulnerability. Contribution of Working Group II to the Fourth Assessment Report of the Intergovernmental Panel on Climate Change, edited by: Parry, M. L., Canz, O. F., Palutikof, J. P., van der Linden, P. J., and Hanson, C. E., Cambridge Univ. Press, Cambridge, UK, 976 pp., ISBN 978-0-521-70597-4, 2007.
IPCC: Climate change 2023 Synthesis Report, Summary for Policymakers, Contrib. Work, Groups I, II III to Sixth Assess. Rep. Intergov. Panel Clim. Chang., edited by: Core Writ. Team, Lee, H., and Romero, J., IPCC, Geneva, Switzerland, 1–34, https://doi.org/10.59327/IPCC/AR6-9789291691647.001, 2023.
Jones, H. P., Nickel, B., Srebotnjak, T., Turner, W., Gonzalez-Roglich, M., Zavaleta, E., and Hole, D. G.: Global hotspots for coastal ecosystem-based adaptation, PLoS One, 15, 1–17, https://doi.org/10.1371/journal.pone.0233005, 2020.
Karlsrud, K., Tunbridge, L., Quoc Khanh, N., and Quoc Dinh, N.: Preliminary results of land subsidence monitoring in the Ca Mau Province, Proc. IAHS, 382, 111–115, https://doi.org/10.5194/piahs-382-111-2020, 2020.
Kingston, D. G., Thompson, J. R., and Kite, G.: Uncertainty in climate change projections of discharge for the Mekong River Basin, Hydrol. Earth Syst. Sci., 15, 1459–1471, https://doi.org/10.5194/hess-15-1459-2011, 2011.
Kondolf, G. M., Rubin, Z. K., and Minear, J. T.: Dams on the Mekong: Cumulative sediment starvation, Water Resour. Res., 50, 5158–5169, https://doi.org/10.1002/2013WR014651, 2014a.
Kondolf, G. M., Gao, Y., Annandale, G. W., Morris, G. L., Jiang, E., Zhang, J., Cao, Y., Carling, P., Fu, K., Guo, Q., Hotchkiss, R., Peteuil, C., Sumi, T., Wang, H. W., Wang, Z., and Wei, Z.: Sustainable sediment management in reservoirs and regulated rivers: Experiences from five continents, Earth's Futur., 256–280, https://doi.org/10.1002/2013EF000184, 2014b.
Kopp, R. E., Horton, R. M., Little, C. M., Mitrovica, J. X., Oppenheimer, M., Rasmussen, D. J., Strauss, B. H., and Tebaldi, C.: Probabilistic 21st and 22nd century sea-level projections at a global network of tide-gauge sites, Earth's Futur., 383–407, https://doi.org/10.1002/2014EF000239, 2014.
Kummu, M., Lu, X. X., Wang, J. J., and Varis, O.: Basin-wide sediment trapping efficiency of emerging reservoirs along the Mekong, Geomorphology, 119, 181–197, https://doi.org/10.1016/j.geomorph.2010.03.018, 2010.
Lai, Y. G., Huang, J., and Greimann, B. P.: Hydraulic Flushing of Sediment in Reservoirs: Best Practices of Numerical Modeling, Fluids, 1–30, 2024.
Laksitaningtyas, A. P., Legono, D., Istiarto, and Jayadi, R.: Preliminary Experiment on Reservoir Sediment Flushing, IOP Conf. Ser. Earth Environ. Sci., 1105, https://doi.org/10.1088/1755-1315/1105/1/012031, 2022.
Lauri, H., de Moel, H., Ward, P. J., Räsänen, T. A., Keskinen, M., and Kummu, M.: Future changes in Mekong River hydrology: impact of climate change and reservoir operation on discharge, Hydrol. Earth Syst. Sci., 16, 4603–4619, https://doi.org/10.5194/hess-16-4603-2012, 2012.
Leonard, M., Westra, S., Phatak, A., Lambert, M., van den Hurk, B., Mcinnes, K., Risbey, J., Schuster, S., Jakob, D., and Stafford-Smith, M.: A compound event framework for understanding extreme impacts, Wiley Interdiscip. Rev. Clim. Chang., 5, 113–128, https://doi.org/10.1002/wcc.252, 2014.
Lu, X. X., Kummu, M., and Oeurng, C.: Reappraisal of sediment dynamics in the Lower Mekong River, Cambodia, Earth Surf. Process. Landforms, 39, 1855–1865, https://doi.org/10.1002/esp.3573, 2014.
Manh, N. V., Dung, N. V., Hung, N. N., Merz, B., and Apel, H.: Large-scale suspended sediment transport and sediment deposition in the Mekong Delta, Hydrol. Earth Syst. Sci., 18, 3033–3053, https://doi.org/10.5194/hess-18-3033-2014, 2014.
Minderhoud, P. S. J., Erkens, G., Pham, V. H., Bui, V. T., Erban, L., Kooi, H., and Stouthamer, E.: Impacts of 25 years of groundwater extraction on subsidence in the Mekong delta, Vietnam, Environ. Res. Lett., 12, https://doi.org/10.1088/1748-9326/aa7146, 2017.
Minderhoud, P. S. J., Coumou, L., Erkens, G., Middelkoop, H., and Stouthamer, E.: Mekong delta much lower than previously assumed in sea-level rise impact assessments, Nat. Commun., 1–13, https://doi.org/10.1038/s41467-019-11602-1, 2019.
Minderhoud, P. S. J., Middelkoop, H., Erkens, G., and Stouthamer, E.: Groundwater extraction may drown mega-delta: projections of extraction-induced subsidence and elevation of the Mekong delta for the 21st century, Environ. Res. Lett., https://doi.org/10.1088/2515-7620/ab5e21, 2020.
Moriasi, D. N., Arnold, J. G., Liew, M. W. V., Bingner, R. L., Harmel, R. D., and Veith, T. L.: Model evaluation guidelines for systematic quantification of accuracy in watershed simulations, Am. Soc. Agric. Biol. Eng., 50, 885–900, https://doi.org/10.13031/2013.23153, 2007.
MRC: Overview of the Hydrology of the Mekong Basin, Mekong River Commission, Vientiane, https://archive.iwlearn.net/mrcmekong.org/download/free_download/Hydrology_report_05.pdf (last access: 16 January 2024), 2005.
MRC: Flood Situation Report, MRC Technical Paper No. 36, Mekong River Commission, 57 pp., https://www.mrcmekong.org/publications/flood-situation-report-2011/ (last access: 16 January 2024), https://doi.org/10.52107/mrc.ajgt7r, 2011.
Nash, J. E. and Sutcliffe, J. V.: River flow forecasting through conceptual models part I – A discussion of principles, J. Hydrol., 10, 282–290, https://doi.org/10.1016/0022-1694(70)90255-6, 1970.
Olbert, A. I., Comer, J., Nash, S., and Hartnett, M.: High-resolution multi-scale modelling of coastal flooding due to tides, storm surges and rivers inflows. A Cork City example, Coast. Eng., 121, 278–296, https://doi.org/10.1016/j.coastaleng.2016.12.006, 2017.
Paprotny, D., Vousdoukas, M. I., Morales-Nápoles, O., Jonkman, S. N., and Feyen, L.: Compound flood potential in Europe, Hydrol. Earth Syst. Sci. Discuss. [preprint], https://doi.org/10.5194/hess-2018-132, 2018.
Pont, D., Day, J. W., Hensel, P., Franquet, E., Torre, F., Rioual, P., Ibànez, C., and Coulet, E.: Response scenarios for the deltaic plain of the Rhône in the face of an acceleration in the rate of sea-level rise with special attention to Salicornia-type environments, Estuaries, 25, 337–358, https://doi.org/10.1007/BF02695978, 2002.
Ritter, A. and Muñoz-carpena, R.: Performance evaluation of hydrological models: Statistical significance for reducing subjectivity in goodness-of-fit assessments, J. Hydrol., 480, 33–45, https://doi.org/10.1016/j.jhydrol.2012.12.004, 2013.
Son, N., Chen, C., Chang, N., Chen, C., Chang, L., and Thanh, B.: Mangrove Mapping and Change Detection in Ca Mau Peninsula , Vietnam , Using Landsat Data and Object-Based Image Analysis, IEEE J. Sel. Top. Appl. Earth Obs. Remote Sens., 8, 503–510, https://doi.org/10.1109/JSTARS.2014.2360691, 2015.
Sunkur, R., Kantamaneni, K., Bokhoree, C., and Ravan, S.: Mangroves' role in supporting ecosystem-based techniques to reduce disaster risk and adapt to climate change: A review, J. Sea Res., 196, 102449, https://doi.org/10.1016/j.seares.2023.102449, 2023.
Syvitski, J. P. M., Kettner, A. J., Overeem, I., Hutton, E. W. H., Hannon, M. T., Brakenridge, G. R., Day, J., Vörösmarty, C., Saito, Y., Giosan, L., and Nicholls, R. J.: Sinking deltas due to human activities, Nat. Geosci., 1–6, https://doi.org/10.1038/ngeo629, 2009.
Temmerman, S., Meire, P., Bouma, T. J., Herman, P. M. J., Ysebaert, T., and De Vriend, H. J.: Ecosystem-based coastal defence in the face of global change, Perspective, 504, 79–83, https://doi.org/10.1038/nature12859, 2013.
The People's Committee of Ca Mau Province: Comprehensive report on planning for Ca Mau Province during 2021–2030, with a vision to 2050: Ca Mau, https://www.camau.gov.vn/quy-hoach-tinh-ca-mau/quyet-dinh-so-1386-qd-ttg-cua-thu-tuong-chinh-phu-ve-viec-phe-duyet-quy-hoach-tinh-ca-mau-thoi-k-253627 (last access: 10 January 2024), 2023.
Thuy, L., Nguyen, M., Hoang, H. T., Ta, H. Van, and Park, P. S.: Comparison of Mangrove Stand Development on Accretion and Erosion Sites in Ca Mau, Vietnam, Forests, 11, 1–16, 2020.
Thuy, L., Nguyen, M., Thi, H., Choi, E., and Sun, P.: Estuarine, Coastal and Shelf Science Distribution of mangroves with different aerial root morphologies at accretion and erosion sites in Ca Mau Province, Vietnam, Estuar. Coast. Shelf Sci., 287, 108324, https://doi.org/10.1016/j.ecss.2023.108324, 2023.
Tinh, H. Q., Pacardo, E. P., Buot, I. E., and Antonio, J.: Composition and structure of the mangrove forest at the protected zone of Ca Mau Cape National Park, Vietnam, J. Environ. Sci. Manag., 14–24, https://www.ukdr.uplb.edu.ph/journal-articles/4148 (last access: 20 February 2024), 2009.
Tran, A. Van, Brovelli, M. A., Ha, K. T., Khuc, D. T., Tran, D. N., Tran, H. H., and Le, N. T.: Land Subsidence Susceptibility Mapping in Ca Mau Province, Vietnam, Using Boosting Models, ISPRS Int. J. Geo-Information, 13, 1–24, https://doi.org/10.3390/ijgi13050161, 2024.
Tran, T., Nguyen, V., Huynh, T., Mai, V., Nguyen, X., and HP, D.: Climate change and sea level rise scenarios for Vietnam, Publishing House of Natural Resources, Enviroment and Cartography, Ministry of Natural Resources and Environment, Ha Noi, p. 188), https://imh.ac.vn/files/doc/KichbanBDKH/CCS_SPM_2016.pdf (last access: 10 February 2024), 2016 (in Vietnamese).
Triet, N. V. K., Dung, N. V., Fujii, H., Kummu, M., Merz, B., and Apel, H.: Has dyke development in the Vietnamese Mekong Delta shifted flood hazard downstream?, Hydrol. Earth Syst. Sci., 21, 3991–4010, https://doi.org/10.5194/hess-21-3991-2017, 2017.
Triet, N. V. K., Dung, N. V., Hoang, L. P., Duy, N. Le, Tran, D. D., Anh, T. T., Kummu, M., Merz, B., and Apel, H.: Future projections of flood dynamics in the Vietnamese Mekong Delta, Sci. Total Environ., 742, 140596, https://doi.org/10.1016/j.scitotenv.2020.140596, 2020.
Tu, L. X., Thanh, V. Q., Reyns, J., Van, S. P., Anh, D. T., Dang, T. D., and Roelvink, D.: Sediment transport and morphodynamical modeling on the estuaries and coastal zone of the Vietnamese Mekong Delta, Cont. Shelf Res., 64–76, https://doi.org/10.1016/j.csr.2019.07.015, 2019.
Van, P. D. T., Popescu, I., van Griensven, A., Solomatine, D. P., Trung, N. H., and Green, A.: A study of the climate change impacts on fluvial flood propagation in the Vietnamese Mekong Delta, Hydrol. Earth Syst. Sci., 16, 4637–4649, https://doi.org/10.5194/hess-16-4637-2012, 2012.
Vasilopoulos, G., Quan, Q. L., Parsons, D. R., Darby, S. E., Tri, V. P. D., Hung, N. N., Haigh, I. D., Voepel, H. E., Nicholas, A. P., and Aalto, R.: Establishing sustainable sediment budgets is critical for climate-resilient mega-deltas, Environ. Res. Lett., 16, 064089, https://doi.org/10.1088/1748-9326/ac06fc, 2021.
Västilä, K., Kummu, M., Sangmanee, C., and Chinvanno, S.: Modelling climate change impacts on the flood pulse in the lower mekong floodplains, J. Water Clim. Chang., 1, 67–86, https://doi.org/10.2166/wcc.2010.008, 2010.
Vu, H. T. D., Trinh, V. C., Tran, D. D., Oberle, P., Hinz, S., and Nestmann, F.: Evaluating the impacts of rice-based protection dykes on floodwater dynamics in the vietnamese mekong delta using geographical impact factor (Gif), Water, 13, https://doi.org/10.3390/w13091144, 2021.
Wahl, T., Ward, P., Winsemius, H., AghaKouchak, A., Bender, J., Haigh, I., Jain, S., Leonard, M., Veldkamp, T., and Westra, S.: When Environmental Forces Collide, Eos, 99, https://doi.org/10.1029/2018eo099745, 2018.
Ward, P. J., Couasnon, A., Eilander, D., Haigh, I. D., Hendry, A., Muis, S., Veldkamp, T. I. E., Winsemius, H. C., and Wahl, T.: Dependence between high sea-level and high river discharge increases flood hazard in global deltas and estuaries, Environ. Res. Lett., 13, https://doi.org/10.1088/1748-9326/aad400, 2018.
Wood, M., Haigh, I. D., Le, Q. Q., Nguyen, H. N., Tran, H. B., Darby, S. E., Marsh, R., Skliris, N., Hirschi, J. J.-M., Nicholls, R. J., and Bloemendaal, N.: Climate-induced storminess forces major increases in future storm surge hazard in the South China Sea region, Nat. Hazards Earth Syst. Sci., 23, 2475–2504, https://doi.org/10.5194/nhess-23-2475-2023, 2023.
Zoccarato, C., Minderhoud, P. S. J., and Teatini, P.: The role of sedimentation and natural compaction in a prograding delta: insights from the mega Mekong delta, Vietnam, Sci. Rep., 8, 1–12, https://doi.org/10.1038/s41598-018-29734-7, 2018.