the Creative Commons Attribution 4.0 License.
the Creative Commons Attribution 4.0 License.
 | 28 Oct 2025
Particle and front tracking in experimental and computational avalanche dynamics
Michael Neuhauser
Anselm Köhler
Anna Wirbel
Felix Oesterle
Wolfgang Fellin
Johannes Gerstmayr
Falko Dressler
Understanding particle motion in snow avalanches is crucial for improving the representation of flow dynamics in numerical models. In this study, we develop and apply a general framework for testing and calibrating thickness-integrated flow models using in-flow sensor data from AvaNodes, radar measurements, and simulations with the com1DFA module of the open-source AvaFrame framework. This includes an implementation of particle tracking functionalities and focuses on assessing a modified Voellmy friction relation.
Radar measurements of the avalanche front and three-dimensional AvaNode trajectories provide a comprehensive observational basis for model comparison. By minimizing the differences between measured and simulated velocities and front positions, we identify parameter sets that achieve high agreement with observed dynamics, yielding deviations below 5 %–10 % in maximum velocity and travel distance. However, the results reveal a trade-off between accurately reproducing particle vs. front behaviour, reflecting model limitations and the presence of equifinality in the parameter space.
We also find that the simulated particle velocities are primarily controlled by initial position, contrasting with experimental observations that show more complex particle interactions. These findings underline the need for enhanced model formulations to better capture flow regime transitions and particle-scale effects. Our results highlight the potential of combining multiple measurement types for calibration and future improvements in avalanche modelling.
- Article
(6275 KB) - Full-text XML
-
Supplement
(2992 KB) - BibTeX
- EndNote


Snow avalanches are dynamic and complex natural phenomena that involve the movement of large masses of snow down a slope. These masses are composed of a wide range of particles, from tiny ice crystals and aerosols to much larger snow aggregates, each with distinct properties and behaviours. At one end of the spectrum, snow avalanches can contain fine, airborne particles such as ice crystals, which are relevant to studies on aerosols (Rastello et al., 2011). These fine particles are typically associated with the powder cloud of powder snow avalanches. At the other end, avalanches can involve much larger snow aggregates, which are formed by the consolidation of snow grains into more substantial granules (Bartelt and McArdell, 2009). These aggregates are particularly relevant to dense snow avalanches, whether dry or wet. Wet snow granules, for example, are generally larger and heavier compared to the smaller snow granules found in dry avalanches (Steinkogler et al., 2015).
In this study, we focus on dense flow avalanches, which are characterized by the movement of snow aggregates made up of hundreds or even thousands of individual snow granules. These aggregates exhibit different dynamics compared to smaller particles like individual ice grains and are of particular interest due to their potential for high impact pressures and larger scale flow behaviour (Sovilla et al., 2018). The observation and study of such dense flow avalanches, which involve a significant interaction between snow granules, is crucial for understanding avalanche dynamics and improving predictive models.
So far particle tracking in avalanche dynamics has gained little attention, mainly due to the constrained engineering interest from a macroscopic perspective, coupled with limitations in computational power and available measurement systems (Bartelt et al., 2012). Developments in avalanche modelling, in combination with the availability of low cost sensors and existing measurement technologies, built the foundation of investigating avalanche mobility and transport phenomena on a particle level.
In recent years, radar measurements have become the most commonly used technique to capture the dynamic evolution of avalanches (Gauer et al., 2007). These measurements provide a comprehensive overview of avalanches' temporal and spatial evolution, offering a characterization of the flow regime (Köhler et al., 2018).
Another experimental technique gaining attention involves in-flow sensors, initially applied in snow chute experiments (Vilajosana et al., 2011) and more recently explored in full-scale rockfall applications (Caviezel et al., 2019). Adapted for snow avalanches in recent years (Winkler et al., 2024; Neurauter et al., 2023), these AvaNode measurements produce unprecedented datasets on avalanche dynamics at a particle level (Neuhauser et al., 2023). Particle measurements are valuable for exploring particle behaviour in response to environmental influences and terrain.
The true significance of particle measurements emerges when they are combined with radar measurements. This synergy allows scientists to determine particle location within the avalanche and their behaviour relative to the avalanche body and in particular the respective flow front.
Tools for the simulation of snow avalanches include a wide range of flow models and numerical implementations (e.g. Christen et al., 2010b; Sampl and Zwinger, 2004; Zugliani and Rosatti, 2021; Li et al., 2021; Hergarten and Robl, 2015; Mergili et al., 2017; Rauter et al., 2018; Oesterle et al., 2022). Their tasks range from simulations for regional avalanche terrain analysis (Toft et al., 2023), identification of endangered terrain for hazard zone mapping or protection forest classification, to detailed simulations used for dimensioning mitigation measures. Depending on the application, each model has its own advantages and disadvantages. For large scale or large area simulations, conceptual data driven models such as Flow-Py (D'Amboise et al., 2022) are used, but also process based, physical models are used (Issler et al., 2023; Bühler et al., 2018). Classically detailed simulations are performed for operational engineering practice with tools such as RAMMS (Christen et al., 2010b), the former SamosAT (Sampl and Zwinger, 2004) and now AvaFrame (Oesterle et al., 2022); or research questions are investigated in a scientific setting using OpenFOAM (Rauter et al., 2018) or lately for example the MPM method (Li et al., 2021).
As the model parameters of complex avalanche flow models, such as the friction parameters, cannot practically be determined directly by laboratory or field experiments, flow model applications rely on parameter suggestions from guidelines (Gruber and Bartelt, 2007) or parameter optimization through back calculations (Ancey et al., 2003). Within the variety of applied optimization approaches (Eckert et al., 2007; Gauer et al., 2009; Naaim et al., 2013; Fischer et al., 2015) the potential of possible combinations of flow models, friction relations and best fit parameter combinations appears endless, often causing equifinality, which describes the wealth of valid solutions (Canli et al., 2018; Mergili et al., 2018).
Snow granules within avalanches undergo a range of complex processes, including segregation by size and density, mixing, and secondary flow structures (Edwards et al., 2022). Additionally, the granules themselves evolve over time through aggregation and crushing, directly affecting flow dynamics (Marks and Einav, 2015, 2017). These mechanisms play a central role in shaping avalanche behaviour and internal structure yet are often difficult to observe directly. Understanding these granular interactions is essential for interpreting particle-level measurements and their implications for avalanche dynamics.
In this context, it is important to acknowledge the fundamental differences between natural snow granules, the synthetic sensor particles (AvaNodes), and the numerical particles used in thickness-integrated models such as AvaFrame::com1DFA. The AvaNodes are rigid, cubic objects with fixed size and density that interact with the granular snow medium, potentially undergoing effects such as geometrical trapping, density-driven segregation, and complex mixing processes. In contrast, the numerical particles represent thickness-integrated flow columns and do not capture these micro-scale interactions, with an artificial numerical size that does not directly relate to a physical scale. Despite these inherent limitations, the implementation of particle tracking in the simulation allows for a first-order comparison between observed and simulated particle behaviour. This enables an evaluation of whether such models can reproduce key trends in avalanche dynamics, such as the timing, spatial evolution, and magnitude of particle velocities, even without explicitly resolving granular physics. Such comparisons are an important first step toward enhancing model realism and integrating in-flow sensor data into model validation frameworks.
Following this introduction, Sect. 2 summarizes the key objectives of this work. Section 3 provides a detailed description of the avalanche event, the radar and AvaNode measurements, and the simulation setup, including the implementation of particle tracking functionalities within the AvaFrame::com1DFA module. The results are presented in Sect. 4 and subsequently discussed in Sect. 5, followed by conclusions and an outlook in Sect. 6.
This study aims to evaluate and improve the capability of a thickness-integrated flow model to reproduce observed avalanche dynamics by making use of a unique dataset combining radar-based front tracking and in-flow measurements from three synthetic sensor nodes (AvaNodes). A central challenge in this context lies in the conceptual difference between measured and simulated particles: while the measured AvaNodes are designed to mimic snow granules moving three-dimensionally with the avalanche flow, the numerical particles in the simulation represent columns with thickness-integrated properties constrained to two-dimensional motion along the digital elevation model.
The first key objective of this work is the development of a general framework for testing and calibrating thickness-integrated flow models, demonstrated here using an extended Voellmy law including cohesive effects, based on high-resolution field data. The second objective is the implementation of particle tracking functionalities within the open-source simulation module AvaFrame::com1DFA, enabling a direct comparison between simulated and measured particle trajectories and velocities.
Together, these developments allow for a comprehensive investigation of the spatio-temporal evolution of the avalanche front and particle velocities. In addition, they enable an analysis of how initial and boundary conditions, such as the starting location or underlying topography, affect resulting quantities like maximum velocity and runout distance. Ultimately, this work contributes to a more detailed understanding of how thickness-integrated models can be aligned with real avalanche behaviour through targeted calibration and validation efforts.
3.1 Avalanche experiment: AvaNode and radar measurements
The data sets used in this article originate from an avalanche experiment (number #20220025) that was performed on the 22 February 2022, at the test site Nordkette, Seilbahnrinne, in Austria. The avalanche was released during avalanche control work after a new snow precipitation event of around 40 cm new snow at Seegrube. Some parts of the avalanche reached the catching dam at 1800 resulting in a maximum altitude difference ΔZ of 400 m and a projected travel length Δsxy of 690 m along the main flow direction. More details to this avalanche event is found in Neuhauser et al. (2023).
The used particle measurement devices are AvaNodes Generation II, with enabled Doppler velocity tracking (Neuhauser et al., 2023). The AvaNodes are equipped with a Global Navigation Satellite System (GNSS) that collects positions and velocities at 10 Hz on three axes. In this experiment three AvaNodes, namely C10 and C09 with a density of 415 kg m−3 and AvaNode C07 with a higher density of 688 kg m−3 recorded data. While snow particles in avalanches tend to have densities between 100–400 kg m−3 during the movement and 250–400 kg m−3 in the deposition (Dent et al., 1998), it was the goal to achieve similar densities for the AvaNodes. The AvaNodes are cube-like bodies with an outer length of 16 cm, which is comparable to the typical size of snow granules found in the deposition zone (Bartelt and McArdell, 2009). The inclusion of a higher-density node (688 kg m−3) was intended to introduce variation, facilitating the investigation of potential differences in the behaviour of varying densities during flow.
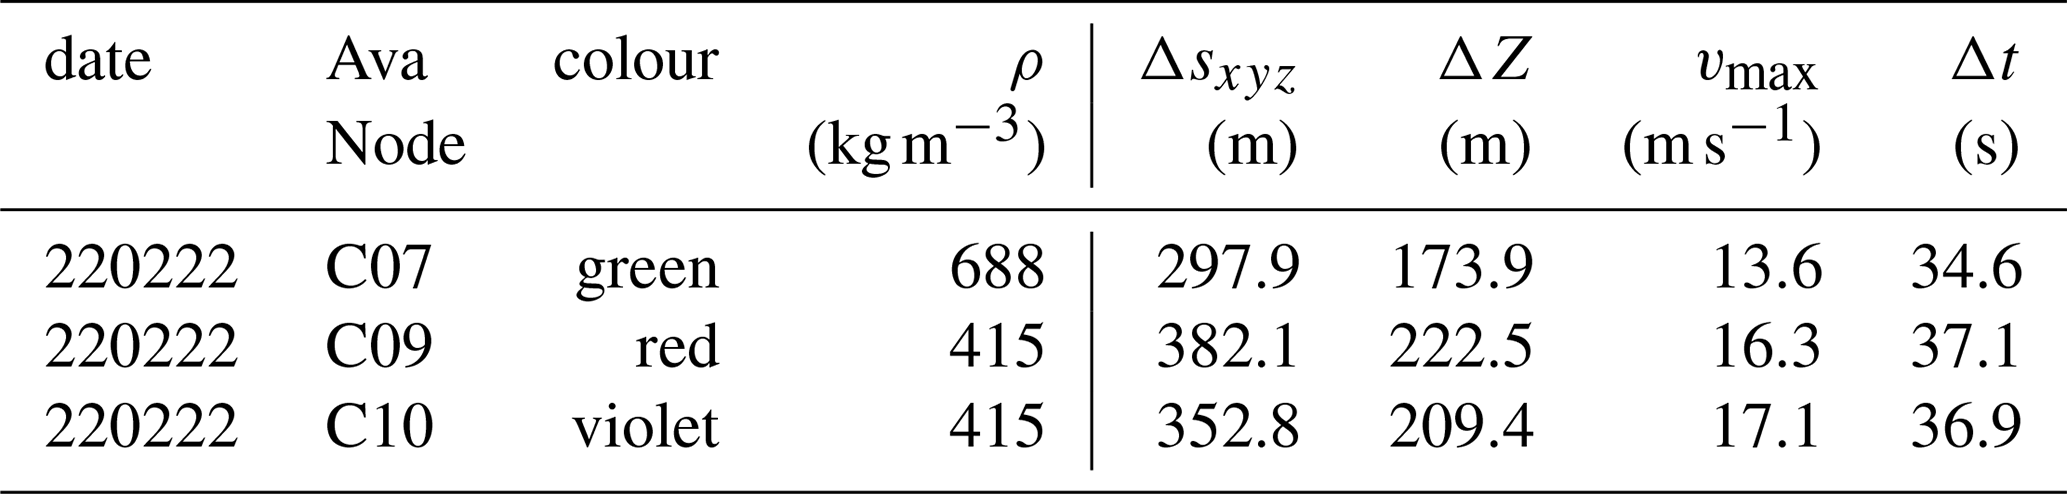
With the gained experience and further advancements in using these sensors in avalanche experiments, it is now possible to produce a wider range of densities and likely reduce the minimum density of the AvaNodes. The recorded positions have a horizontal position accuracy of m and the recorded velocities have an accuracy of m s−1 on every axis (u-blox, 2022). Table 1 gives an overview of the collected particle datasets, starting with three-dimensional travel length Δsxyz, altitude difference between release and deposition ΔZ, maximum velocity vmax and duration of overall movement with Δt along each particle trajectory. Due to challenging weather conditions the recovery of the AvaNodes took place some days after the experiment, and therefore no information about the burial depths could be observed.
Table 1Summary of the measurement on 22 February 2022 (220222) for the three AvaNodes C07, C09, and C10 with their respective density ρ. The first block lists trajectory properties (three dimensional trajectory lengths Δsxyz and altitude difference ΔZ), the second block summarizes a first dynamic view on the experiments with maximum velocity vmax and flow duration Δt. A consistent colouring for each AvaNode is used for all visualisations in the following figures and given in the table row colour.
Additional measurements have been performed with a modulated continuous wave (FMCW) radar, the mGEODAR (Köhler et al., 2020), to gain an overview on the flow evolution. The radar system was positioned at Seegrube at 1900 , approximately 700 m away from the release area of the Seilbahnrinne, providing a clear line of sight to the main avalanche path. In the lower part of the track, at a distance of 200 m, the radar view becomes obstructed and the full run-out is not captured. The radar operates with a range resolution of 0.375 m per bin at a sampling frequency of 50 Hz, enabling the precise tracking of the avalanche front over time. The radar data are typically displayed in range-time diagrams, or so-called moving target indication (MTI) plot, that highlight moving parts (red) and suppressing the static background (yellow) (Fig. 2). The range corresponds to the line-of-sight distance between the radar position and the avalanche track, and the slope of features can be directly attributed to an approach velocity as indicated by the velocity legend in the top right corner. Based on prior evaluations, the expected positional uncertainty of the radar-tracked avalanche front is estimated to be approximately ±1–2 m, which corresponds to around five radar range bins. This provides reliable observations for tracking the avalanche front's evolution, especially in the middle section of the path where radar line of sight aligns well with the flow direction.
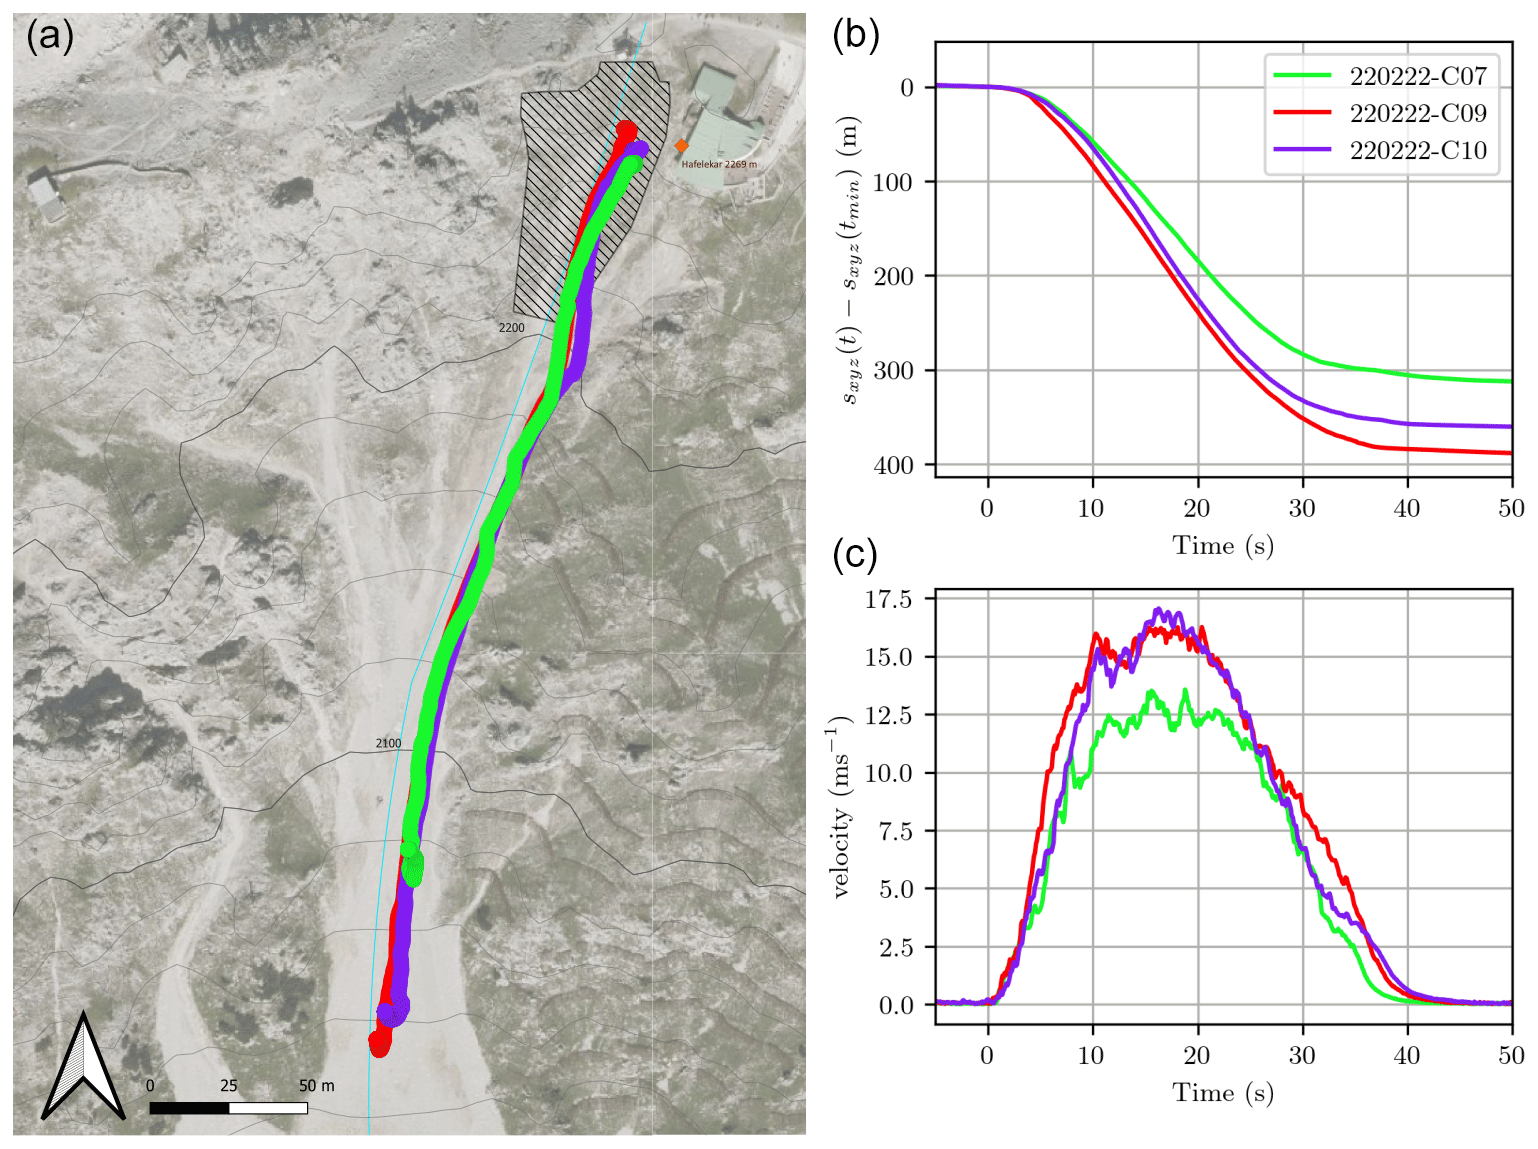
Figure 1Test site Nordkette and experimental data: In (a) trajectories or GNSS positions of the experiment 220222 are displayed. The dot size of 5 m corresponds to the accuracy stated by the manufacturer. The hatched area represents the release Area. In (b) the trajectory length sxyz and the temporal velocity evolution of the AvaNodes are shown. tmin indicates the starting of the movement and refers to t=0.
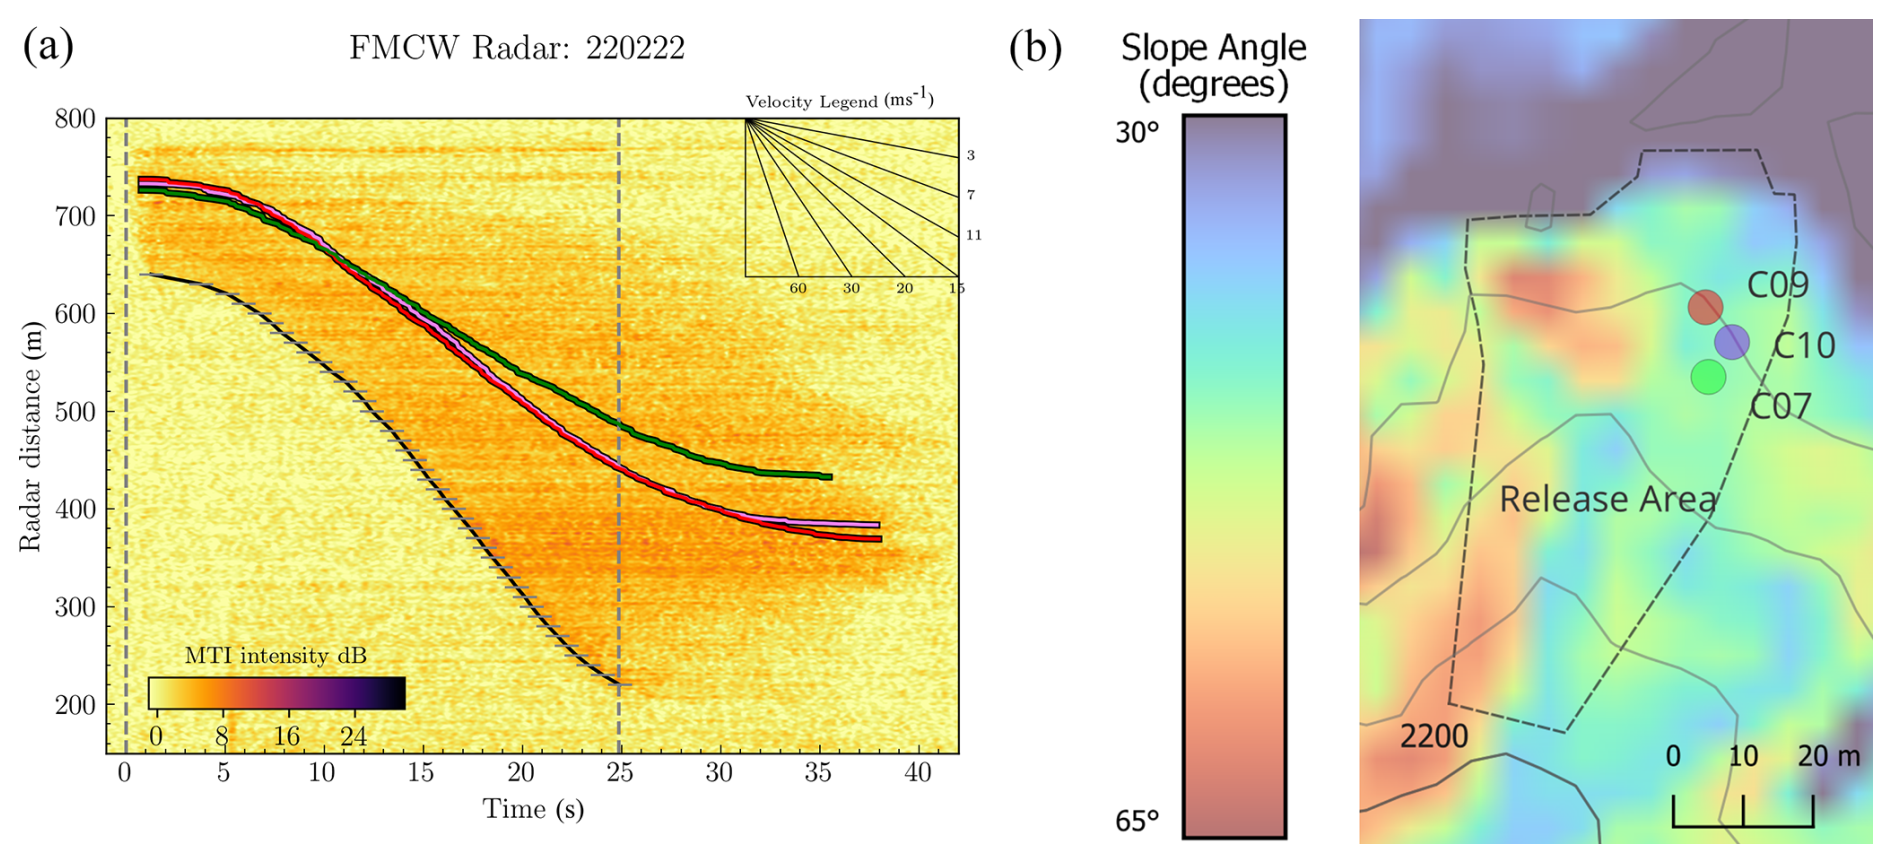
Figure 2Radar measurement and particles distribution in release area. (a) The range-time radar analysis captured on 22 February 2022 depicts the motion of the avalanche and pinpoints the AvaNode positions in relation to the avalanche front. The black line defines the tracked front, while the coloured lines trace the trajectories of the AvaNodes. (b) Spatial distribution of the AvaNodes in the release area, also highlighting the slope inclination.
While the radar offers high temporal and spatial resolution of the avalanche evolution and in particular the avalanche front, the AvaNodes provide complementary data on particle-level dynamics, particularly in the tail of the avalanche. The combination of both systems allows to bring the particle measurements in the perspective of the full avalanche and offers a more comprehensive view of avalanche dynamics. Figure 2 combines the radar measurement with the AvaNode GNSS positions that are transformed into the radar coordinate system and synchronized to the time of release. The radar measurement unfortunately does not include the whole run out in the lower part of the test site, because the avalanche track continues to the side of the radar position and causes the flow to exit the radar's field of view. This geometric short coming of the radar measurements causes a false impression of deceleration below 250 m in the radar data, but in reality the flow continues until 1800 , thus below the radar location.
Analysis of the radar measurement yields the approach velocity with a maximum value of 26 m s−1 in the center part of the avalanche path, where radar line of sight and main flow direction are closely aligned. It also shows the relation of the avalanche front to the AvaNode positions, that are travelling in the middle part of the avalanche approximately 80–100 m behind the front until 15 s, and afterwards separating further towards the tail. Additional information on the exact radar location and the evaluation of radar and AvaNode data is provided in Neuhauser et al. (2023).
3.2 Avalanche simulations: AvaFrame::com1DFA
AvaFrame is an open-source framework that alongside well-established computational modules, provides various tools for geo data handling, testing, analysis and comparison as well as the possibility to directly add new functionalities. The particle simulations are performed with AvaFrame's computational module com1DFA version 1.71 for dense flow avalanches. AvaFrame::com1DFA is based on a thickness-integrated flow model, solved by a numerical particle grid method (Tonnel et al., 2023). For this study, particle tracking functionalities are added to AvaFrame::com1DFA, allowing us to track the numerical particles that start within a predefined radius of a given coordinate point, for example around the initial positions of the AvaNodes. One important aspect for avalanche simulations is the chosen friction relation. For the current study we use an adapted friction relation (Fischer, 2013) referenced as a Voellmy minimum shear stress model, including a classical Coulomb, Voellmy-like turbulent drag (Voellmy, 1955) and a shear stress limit, termed minimum shear stress (Sampl and Zwinger, 2004) which similar to the effect of snow cohesion (Ligneau et al., 2022), which needs to be exceeded to initiate movement.
where μ=tan (δ) refers to the Coulomb friction coefficient, ξ is the turbulent-friction coefficient and τ0 represents a shear stress minimum which induces a flow thickness threshold for the initiation of movement. The term with ξ in Eq. (1) increases the friction with increasing velocity and constrains the maximum velocity. The superscript (b) means basal and refers to the shear stress at the bottom surface for τ(b) and normal stress at the bottom for σ(b). To test if we can identify suitable parameter sets within a plausible parameter space, that allow us to reproduce the measurements, we perform simulations varying μ between 0.1–0.8, with step size 0.1, ξ between 1000–10 000 m s−2, with step size 1000, and τ0 between 0–150 Pa, with step size 25. Equidistant sampling covers the investigated parameter space and yields 1050 resulting parameter sets.
As this study represents the first iteration, the parameter ranges were deliberately chosen to be as broad as possible to capture the full spectrum of potential outcomes (Fischer et al., 2015). In a subsequent iteration, narrower parameter ranges could be employed to focus on the most relevant regions identified in this initial exploration.
The delineation of the release area is based on the local assessment and performed considering slope angle (between 30–60°), terrain curvature and the fracture length of 100–120 m derived from radar measurements (compare Fig. 2). The corresponding release thickness is estimated 70 cm, taking into account local storm board observations and weather station data sets.
3.3 Spatial and temporal reference systems
It is necessary to choose a common and appropriate coordinate system when comparing measurements with simulations. Distances derived from radar data are always measured in line of sight towards the radar and therefore one dimensional. For radar measurements it therefore makes sense to keep the comparison in one dimensional space (Fischer et al., 2014). We follow the approach of Rauter and Köhler (2019), by optimizing the front position between simulation and radar data in the one dimensional radar coordinates.
However, AvaFrame::com1DFA calculations are based on the thickness-integrated governing equations, delivering surface parallel velocities. Particle measurements collect datasets in three dimensional space. Regarding particle simulations and AvaNode measurements it makes sense to keep the overall information about the particle velocity and spatial evolution in three dimensional space. This retains all available information by not transforming it into a one- or two-dimensional coordinate system.
To achieve time synchronization between the measurement and the simulation, a global synchronization time step, tbomb, is used. This time step refers to the release time of the avalanche, defined as 07:52:23 UTC. With this interpretation, t0 from the simulation corresponds to tbomb in the datasets from AvaNode and radar.
It is important to point out that AvaNode C07 has a higher density as the two other AvaNodes (C09 and C10) and in particular compared to the expected snow granule density. The radar measurement lasts for 25 s, after which there is no available information regarding the avalanche front position. This absence of data is attributed to the avalanche front being obscured by an avalanche deflecting dam, causing it to exit the radar's field of view. Consequently, the front comparison is restricted to this specific time frame. The AvaNode measurements have a duration of roughly 35–40 s (compare Table 1) before the movement stops.
3.4 Particle and front tracking
Particle tracking is performed with the GNSS modules in the AvaNodes, resulting in positions with 10 Hz temporal resolution and m horizontal position accuracy. The initial position of the AvaNode in the release area and σp,h is used to determine which particles are tracked in the simulation. Each particle in the simulation has its own ID, which is saved throughout the entire simulation. A circle with a radius of 2.5 m around the AvaNode's starting position defines the simulated particle ID's for comparison with the measured particle trajectories. We effectively track around 15–20 particles within this radius in the simulation, saving values such as position and velocity at each time step for each particle along its trajectory.
When comparing data from the in-flow sensors (AvaNodes) to the numerical particles of the AvaFrame::com1DFA simulations, there are several theoretical differences between the two that hinder a direct comparison and have to be discussed. The AvaNode sensors that flow with the avalanche can be redistributed within the avalanche due to complex flow patterns or due to effects caused, for example, by differences in the density or size of the snow granules. In AvaFrame::com1DFA, numerical particles refer to columns of incompressible snow mass that are forced to travel along the predefined surface. These numerical particles have thickness-integrated properties, such as flow velocity for example and represent the thickness-averaged flow of the avalanche. By comparing the velocity evolution of measurement particles and tracked particles in the simulation, we analyze the thickness-integrated flow model's capability and limitations of replicating the measured particles' behavior.
In order to quantitatively evaluate and compare the simulations to the measured avalanche front (see Fig. 2) we employ a similar tracking method for the simulated avalanche front. Assuming the avalanche moves continuously downhill we track the front by determining the particle with the lowest altitude z value for each time step. In the case of the avalanche front, the tracked particle ID can vary throughout the simulation, as different particles can have the lowest z value at the respective time step.
To ensure that there are enough particles to track at the starting locations of the Avanodes, a dense particle distribution in the release area is needed. The initialization method for the particles in AvaFrame::com1DFA was set to mass per particle through number of particles per kernel radius (MPPKR) and the number per particles in kernel radius (nPPK) was set to 50. While the default setting would yield 458 particles, the adjusted setup in this study result in a more densely distributed particle setup of 2559 particles. Additional information on the simulation setup, the necessary input data (DEM and release) and the corresponding parameter setting (configuration files for the AvaFrame::com1DFA simulation) can be found in the Supplement.
GNSS measurements have an output frequency of 10 Hz, while the simulations on the other hand allow the user to export the particle information for a predefined time step. For this analysis, considering computational cost and the effective size of the resulting data set, we compare measurement and simulations on a temporal resolution of 1 Hz.
3.5 Particle velocity and front position error
For avalanche simulation optimization the runout or deposition area is mostly used to determine the best-fit model parameters (Sampl and Zwinger, 2004; Christen et al., 2010a; Bühler et al., 2011). These areas rely more on observations made after the event, making them easier to obtain and more numerous compared to inflow measurements taken during an avalanche experiment. Contrarily, our emphasis here is on employing a dynamic evaluation method. This involves comparing range-time data for the avalanche front position and velocity-time data along the individual particle trajectories. When comparing information regarding the avalanche front position, like its spatial and temporal evolution, the chosen coordinate system is the line of sight towards the radar (Rauter and Köhler, 2019). The AvaNodes record position and velocity in a three-dimensional World Coordinate System, where the axes are defined as follows: x points East, y points North, and z points vertically upward. All further analyses, including the comparison between measurements and simulations, are consistently performed in this World Coordinate System. Deviations are first computed separately along each axis in three dimensions (as defined in Eq. 2), and are then combined into a single magnitude (as defined in Eq. 3).
When comparing the trajectories one has to keep in mind the obvious differences, with measured velocities representing free flowing particles in an avalanche, while simulated particle velocities in the AvaFrame::com1DFA module of AvaFrame are thickness averaged properties along the predefined mountain topography.
There are several possibilities to compare the velocities of simulation and measurement. Here we apply a method, evaluating three dimensional velocities to ensure that the trajectories of the tracked particles are similar. Therefore we calculate the root mean square error (RMSE) between measurement and simulation, for the tracked particle velocity evolution ϵv, on the x (East) axis:
where vmeas represents the velocity of the AvaNode particle measurement and vsim the velocity of the tracked simulation particle assigned to the respective AvaNode for each time step i in the total number of measurement time steps n. Analogously to Eq. (2), values for the particle velocity errors ϵv,y and ϵv,z are calculated for the y (north) and z (vertical upwards) axis respectively.
Furthermore the velocity error in all three dimensions, x, y, and z can then be summarized in a general or tracked particle velocity error magnitude ϵv, with:
For further analysis the magnitude of the velocity error ϵv is used.
When taking a closer look at the measurement datasets in Fig. 3 one can see that there is a slight time delay between the z component and the x and y component. While there is an earlier onset of recorded velocities along x and y axes, velocities also decrease to zero earlier along these coordinate axes when compared to the z axis. As known from Neuhauser et al. (2023) the velocity measurements have included Kalman-filters; regarding Fig. 3 it looks like the Kalman-filter is strongest on the z value of the GNSS velocity measurement.
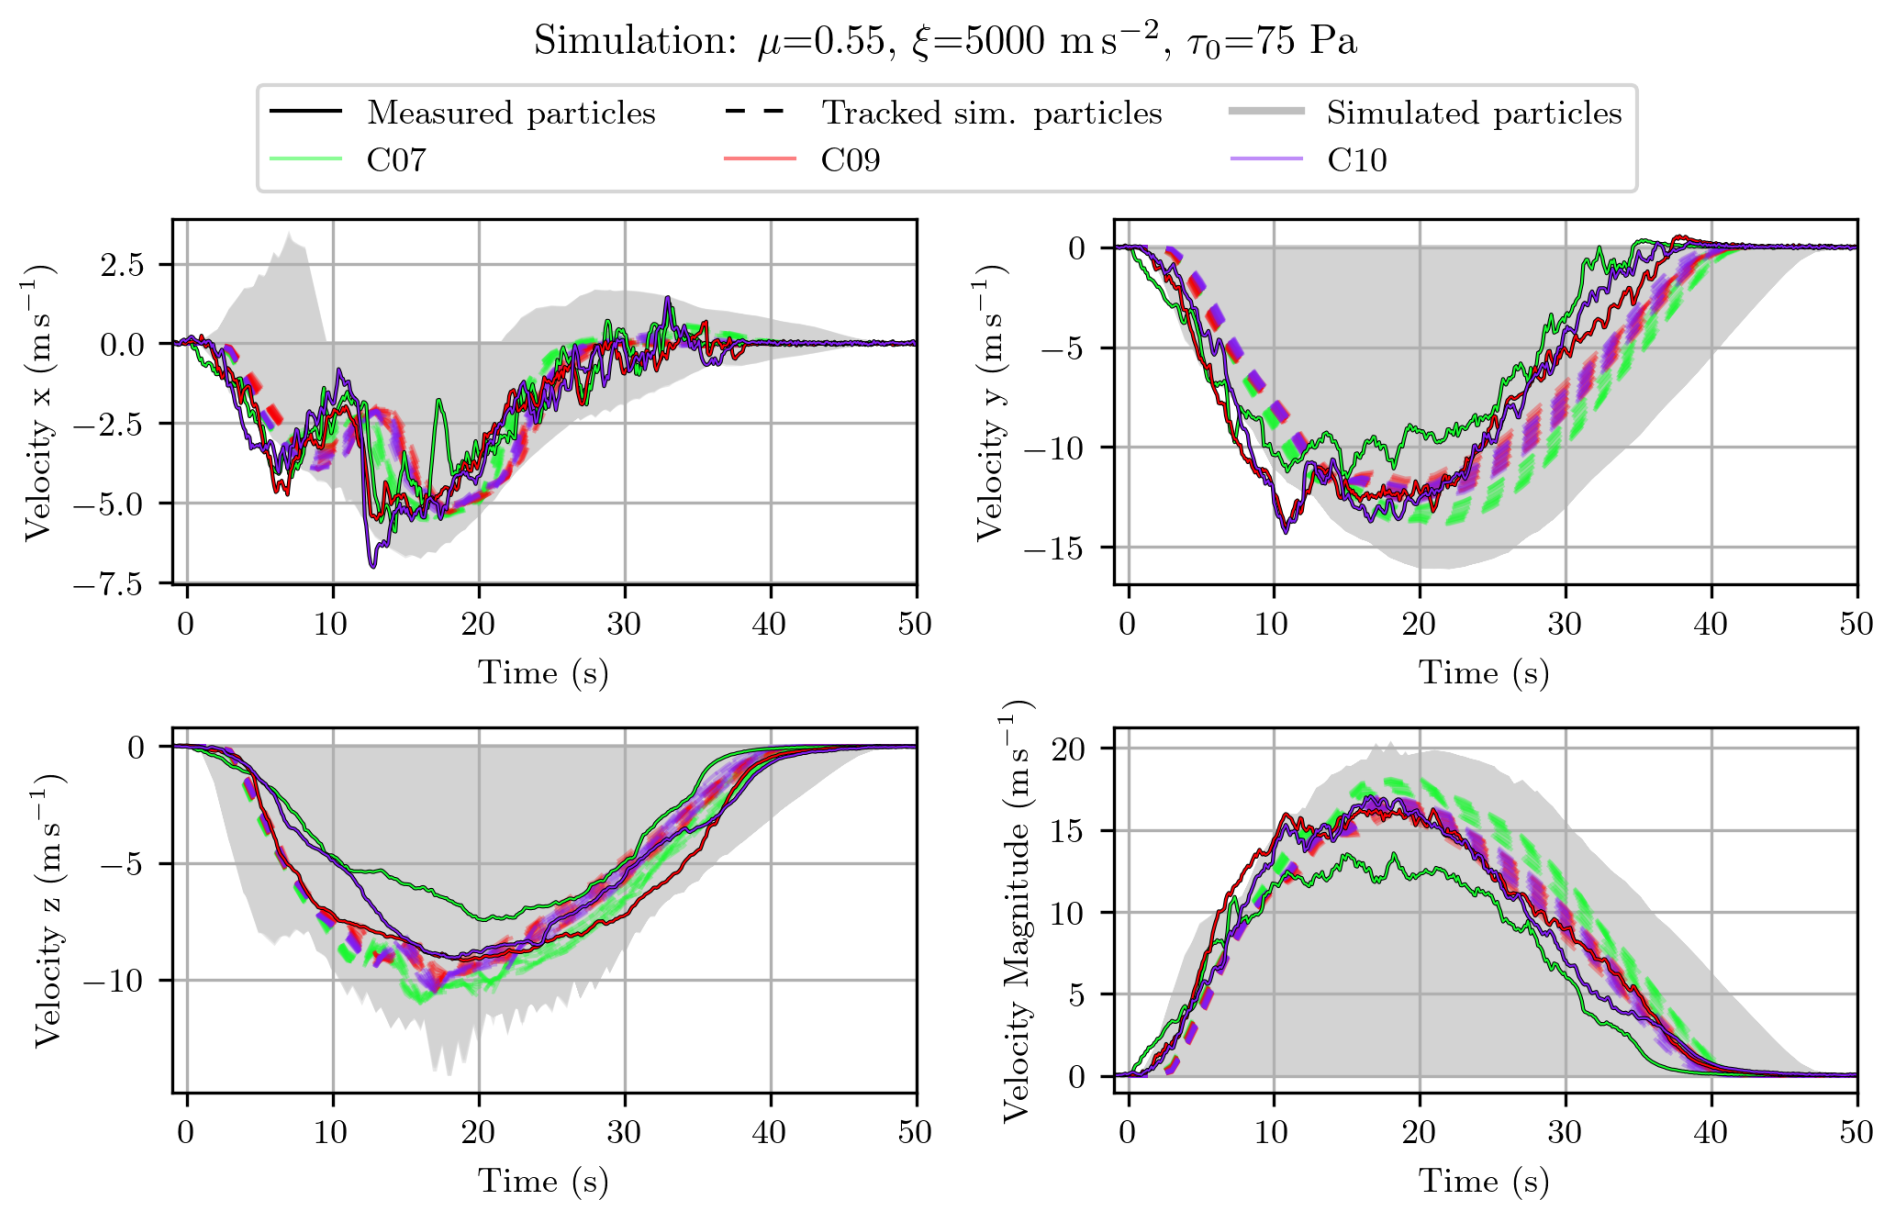
Figure 3Temporal evolution of the velocity along each axis and the corresponding magnitude for the best-fit simulation fitting AvaNode C10 measurements. All simulated particles are visualized in grey, the tracked particles from the simulation are shown as dashed lines and the solid lines represent the measurements.
Through particle tracking in the simulations and linking them towards the initial position of the AvaNode, both simulated and measured particles have the same or at least similar underlying topographic features along their trajectories within the release area.
For the spatial deviation between experimental and computational results of the front tracking we introduce the position RMSE of the tracked front evolution ϵp:
where dmeas represents the front distance to radar in the measurement, and dsim the corresponding distance of the simulated particle with the smallest radar range for each time step i in the total number of measurement time steps n.
The parameter variation from Sect. 3.2 results in 1050 avalanche simulations. The number of tracked numerical particles that are initially within the radius of the horizontal positional accuracy of the AvaNodes C07, C09, and C10 are 18, 19, and 16 respectively.
4.1 Tracked particle velocities
For each simulation, the velocity errors ϵv,x, ϵv,y, and ϵv,z are calculated between the measured particle and the tracked simulated ones, and they are then combined to estimate the velocity error magnitude ϵv (Eq. 3). This results in multiple ϵv values for every tracked particle. For further analysis and model interpretation, we used the mean value of ϵv for all tracked particles from one simulation, that are assigned to their respective AvaNodes. In Fig. 4 the variation of ϵv for AvaNode C10 is displayed, ranging between 1.7–14.3 m s−1, with one parameter always held constant at the best-fit simulation parameter set. Interestingly one can identify the equifinality with a narrow band of parameter combinations that provide solutions with similar velocity error magnitude for all single parameters, almost covering the entire parameter space. The parameter set with the lowest mean ϵv value for AvaNode C10 is μ=0.55, ξ=5000 m s−2, and τ0=75 Pa, with ϵv=1.74 m s−1. This parameter set is henceforth referenced as the best-fit for AvaNode C10. The parameter set with the lowest mean ϵv value for AvaNode C09 is μ=0.5, ξ=3000 m s−2, and τ0=75 Pa, with ϵv=1.77 m s−1 and for AvaNode C07 μ=0.5, ξ=3000 m s−2, and τ0=150 Pa, with ϵv=1.64 m s−1.
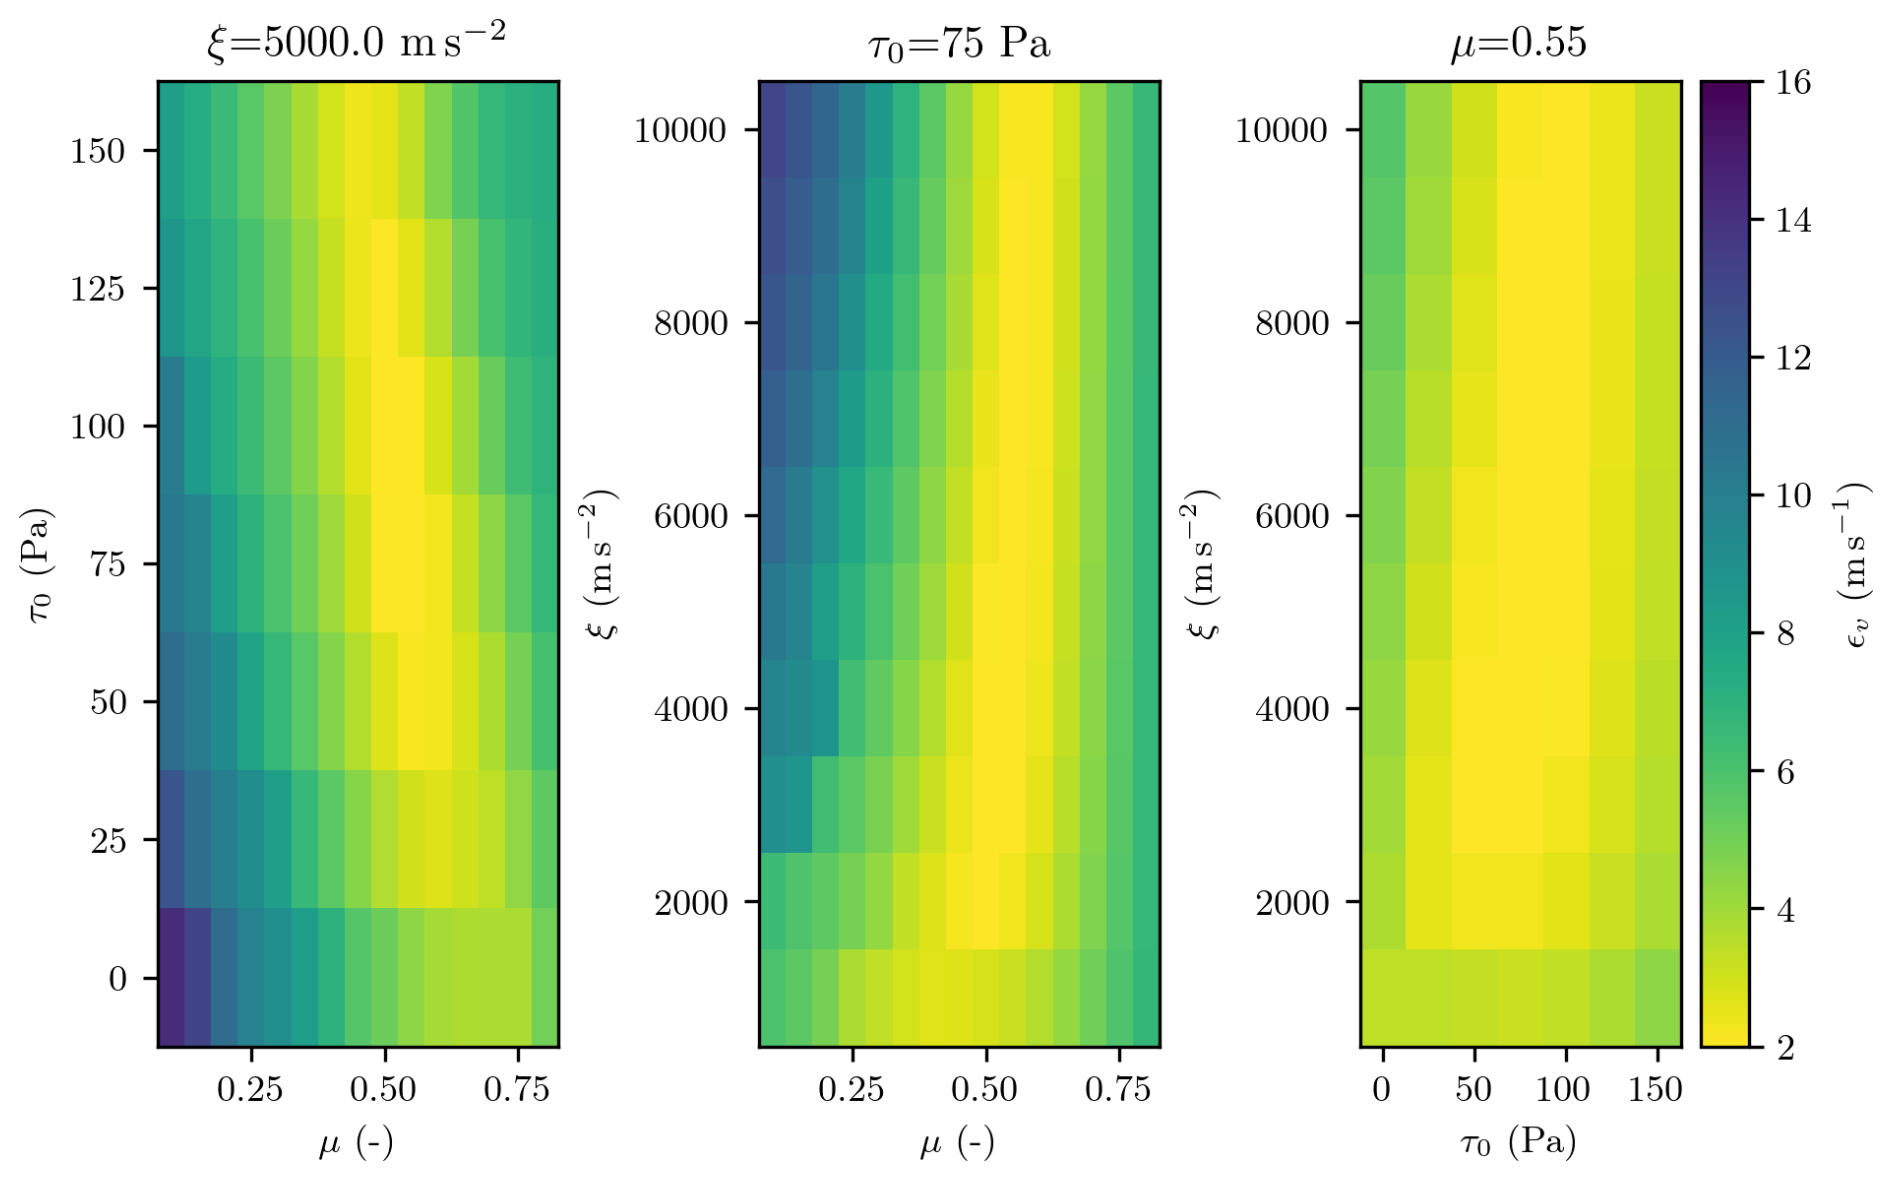
Figure 4Velocity error magnitude ϵv for AvaNode C10 averaged over the 16 corresponding tracked simulation particles, ranging from 2 to 14 m s−1 in the parameter space around the best-fit parameters.
4.2 Tracked front positions
Figure 5 is similar to Fig. 4, but shows the variation of the front position error ϵp (Eq 4), again with one parameter held constant on the best-fit simulation parameter set. The position error values reach from ϵp=4.34 m for the best-fit to ϵp=213.4 m for the worst-fit simulation. The best-fit parameter for the front is μ=0.4, ξ=5000 m s−2, and τ0=125 Pa, resulting in a minimum position error RMSE value of ϵp=4.34 m. Technically this is the best-fit, but considering RMSE values lower then ϵp<20 m, Fig. 5 indicates a band with possible parameters (light yellow) causing equifinality.
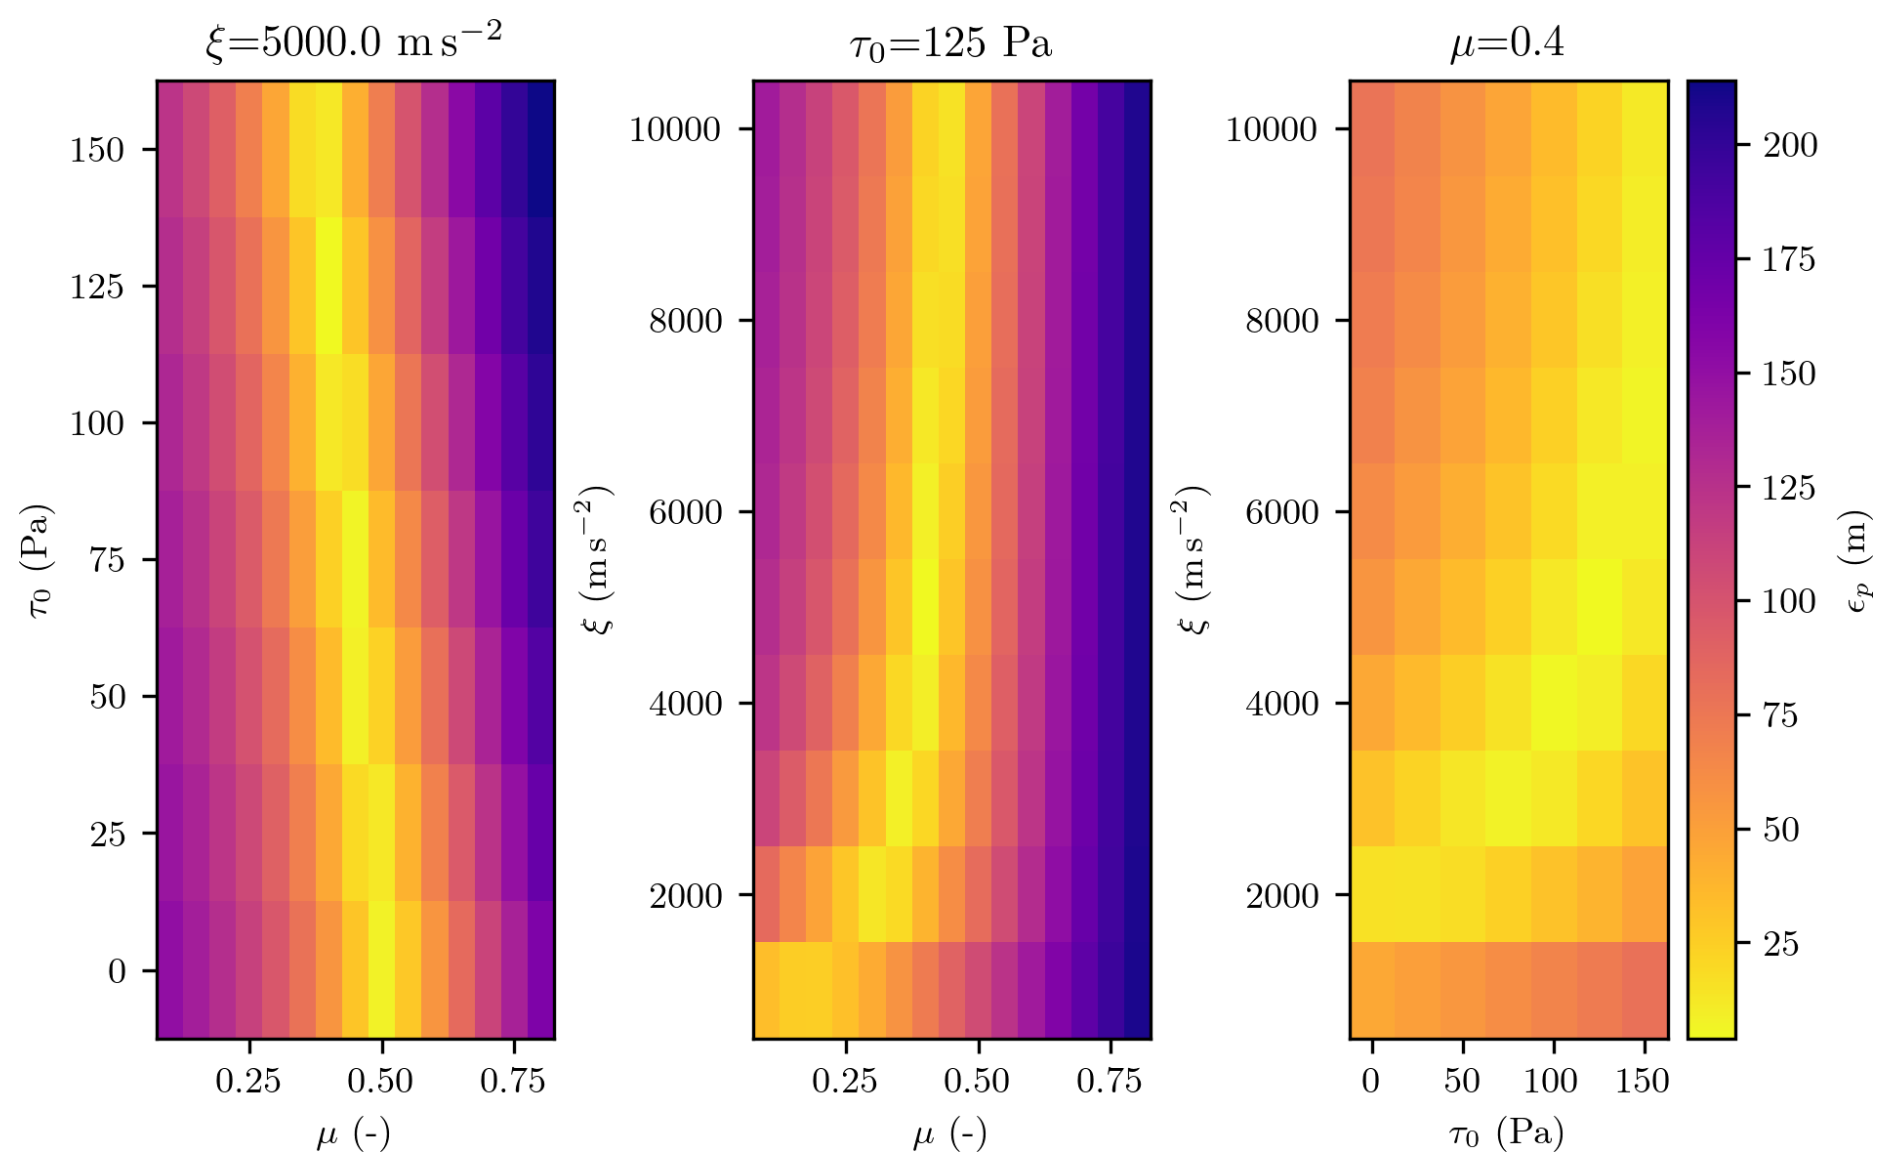
Figure 5Front position error ϵp ranging from 4 to 213 m in the investigated parameter space around the best-fit parameter set.
The left panel of Fig. 6 shows the spatial evolution of the avalanche front distance towards the radar derived from the radar measurements (black solid), extracted from the best-fit front simulation (black dashed) and from the best-fit AvaNode C10 simulation (black dash-dotted). The extracted fronts from all simulations are coloured with the corresponding ϵp value. Since the avalanche exits the radar's field of view after 25 s, only this time period is used for the RMSE analysis, nevertheless this is the most dynamic part in the avalanche track including the acceleration state in the steepest part along on the avalanche track. The best-fit simulation for AvaNode C10 has a deviation of ϵp=63.57 m, and the corresponding simulated front is slower which yields an offset of 100 m at 25 s compared to the measured front.
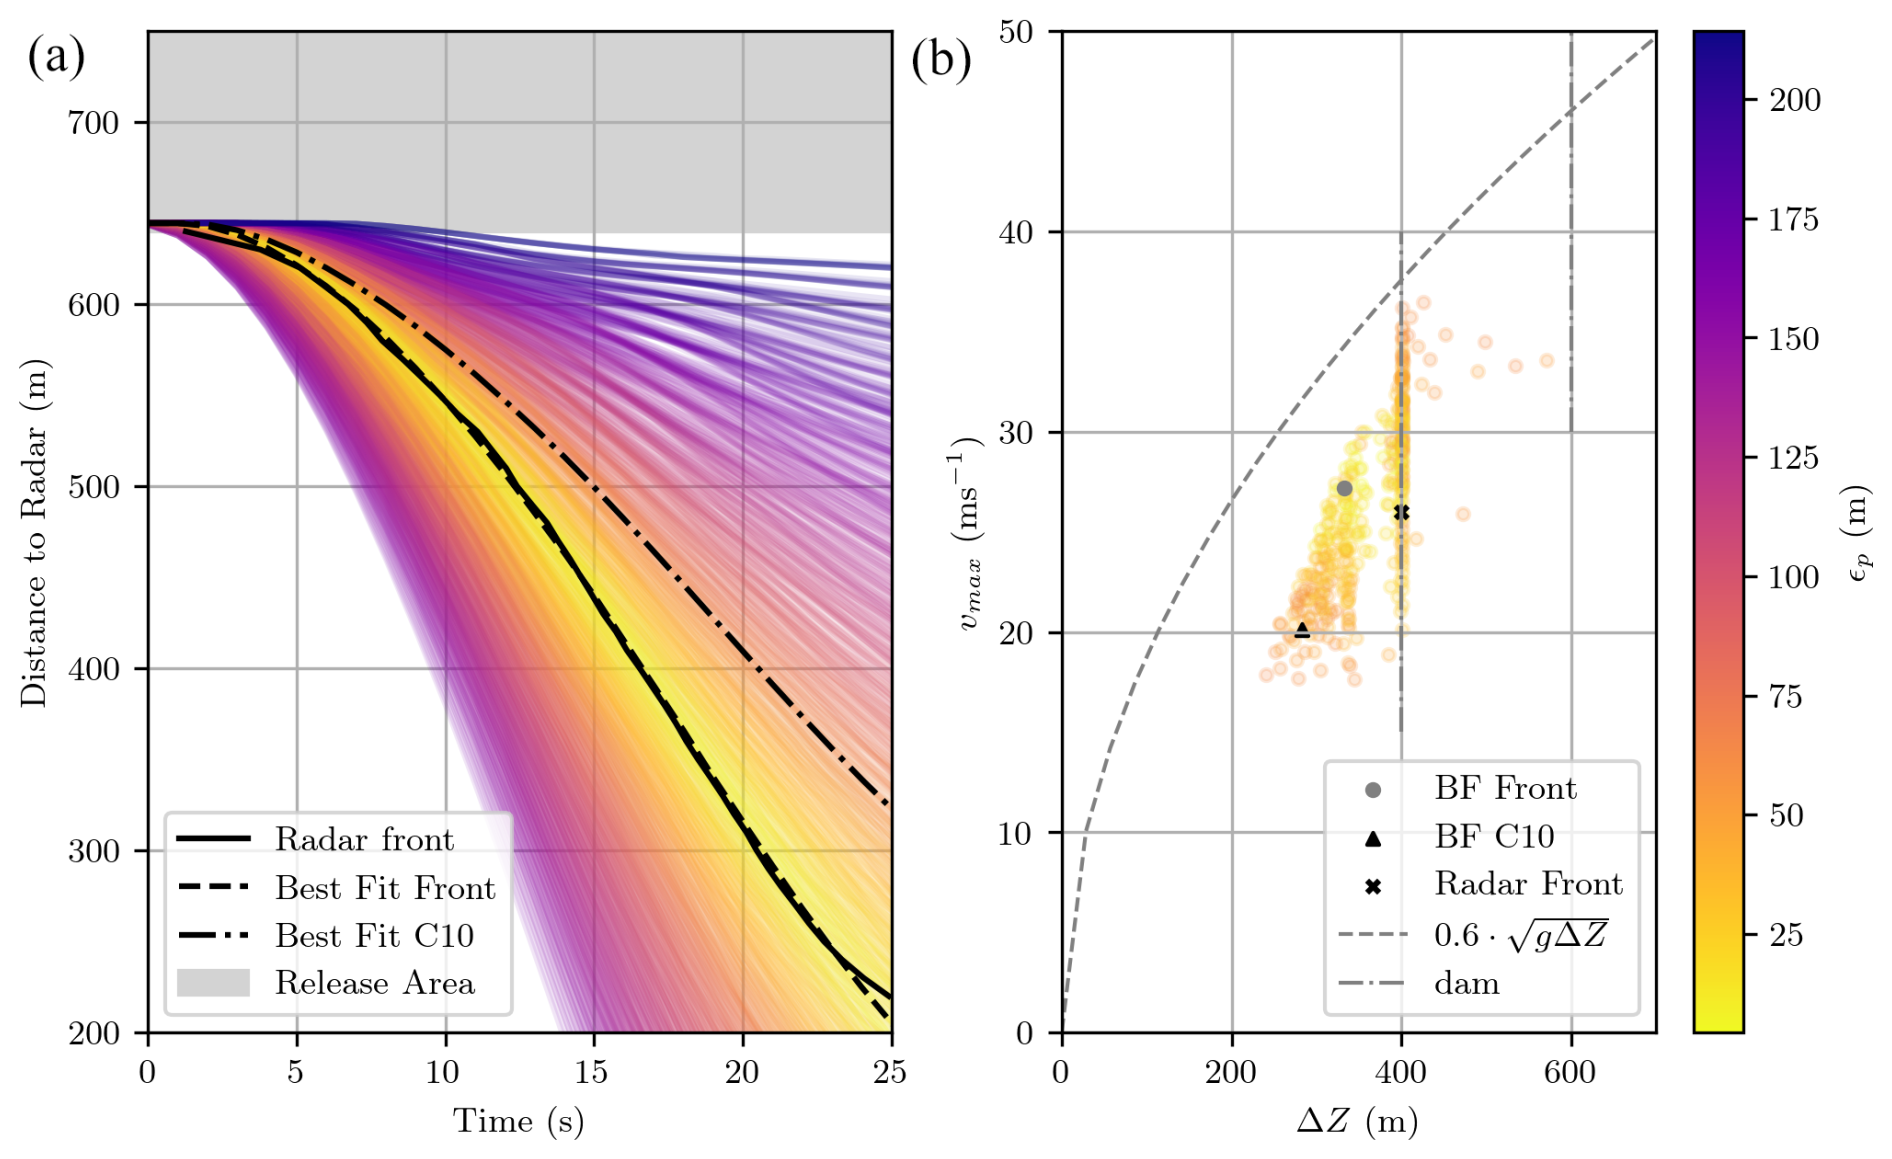
Figure 6(a) shows the avalanche front positions in relation to the radar, with the corresponding colour from the position RMSE ϵp calculation. The black solid line indicates the radar measurement, the black dashed line the best-fit front simulation and the dashed-dotted line the best-fit simulation for AvaNode C10. (b) shows the altitude difference ΔZ vs. the maximum velocity vmax of the avalanche front. The x marks the radar measurement, the circle the best-fit front simulation and the triangle the best-fit simulation for C10. The coloured points belong to simulations with an ϵp<63.57 m.
We also analysed the total altitude difference vs. the maximum velocity for all simulations with a better fit than the deviation of C10, e. g. ϵp<63.57 m. All these simulations are coloured with their corresponding ϵp value and shown in the right panel of Fig. 6. The black cross marks the radar measurement, the grey circle indicates the best-fit front simulation and the black triangle the best-fit simulation for AvaNode C10. The dashed line indicates the maximum velocity an avalanche can obtain according to its altitude difference, following the suggestion of McClung and Schaerer (2006) and Gauer (2014). The relation of maximum velocity and altitude difference originates from observations of many avalanches, however, our simulations show a different behaviour, potentially indicating the influence of the local topography. The vertical grey dashed-dotted line at ΔZ=400 m indicates the catching dam in the avalanche track at 1800 , where the dilute part of the avalanche stopped. We find many simulations that come to rest in the dam with varying maximal velocities. However, the best-fit simulations for the front and for the AvaNode C10, do not reach the dam. Interestingly, these best-fit simulations and the radar measurement are 20 %–30 % slower than the maximal achievable velocities (grey dashed line), indicating that the relation is a conservative approximation for an upper velocity limit.
4.3 Comparison of particle and front tracking
The analysis of the best-fit parameters shows rather similar results for the three tracked particles and larger differences when compared to the best-fit front parameters. In order to analyze these differences we focus on one of the particle simulations (AvaNode C10) and compare the simulations results to the best-fit front simulation.
Figure 7 shows the temporal evolution of particle velocity (upper panels) and trajectory length (lower panels) for the best-fit simulations fitting the particle measurement data of AvaNode C10 (left) and the recorded radar front (right). All particles of the simulation are visualized in grey as the envelope of mininum and maximum values for all particles at each time step. The tracked particles from the simulation are shown as dashed lines and the solid lines represent the measurements of the AvaNodes. The direct comparison of the two best fit simulations shows that the best-fit front optimization generally yields larger velocities. Although the total duration of the flow is similar in both cases (compare measurement results in Table 1 and Fig. 1), higher velocities and correspondingly longer travel length beyond 600 m appear in the best-fit front simulation.
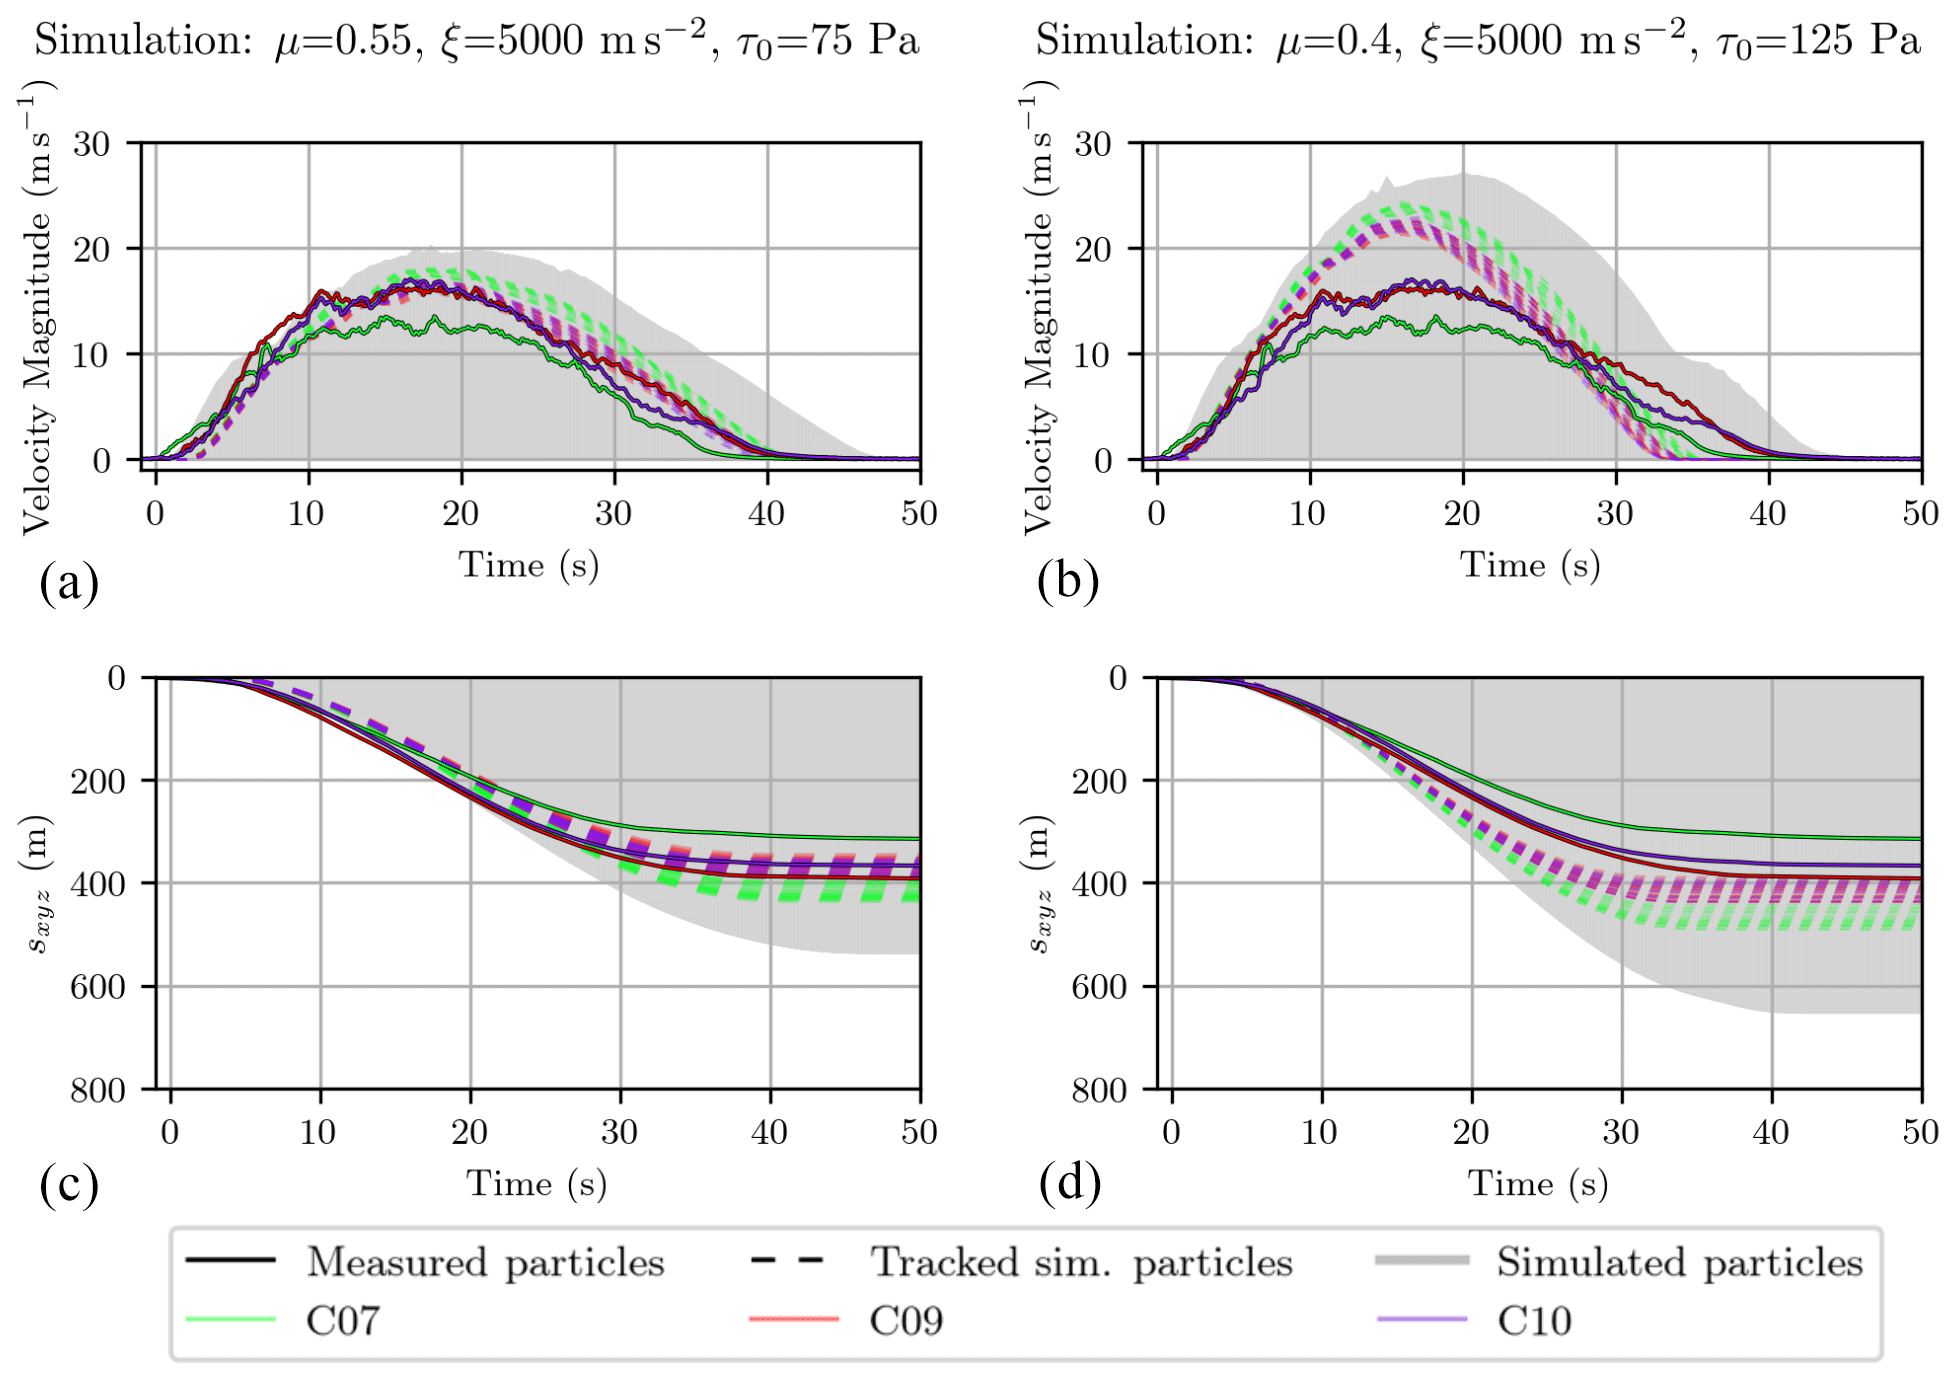
Figure 7Shown are the temporal evolution of the measurement and simulation particle velocities (a, b) and trajectory length (c, d). Two best-fit simulations are presented: Best-fit simulation for particle velocities of AvaNode C10 with ϵv=1.74 m s−1 (a) and the best-fit for the radar front (b, ϵp=4.34 m). All particles are visualized in grey, the tracked particles from the simulation are shown as dashed and the solid lines represent the measurements.
Figure 8 shows the Range-Time diagram of the best-fit particle (left) and front (right) tracking simulation parameters. This visualization can be seen as a synthetic radar plot where the simulations are evaluated in the radar line-of-sight coordinates and is thus similar to the MTI plot in Fig. 2. It is particularly useful because it includes front position and velocity data at the same time, for simulation and measurement. The coloured area represents the maximum velocity of all particles at a given radar distance and time step. The black stars indicate the radar measurements of the front positions in time and the coloured solid lines represent the AvaNode measurements. One has to be aware that the slope of the particle trajectories corresponds to approach velocities in the radar coordinate system, which slightly differ compared to the surface parallel velocities of the simulations and the measurement velocities of the AvaNodes, in this case between 5 %–10 %.
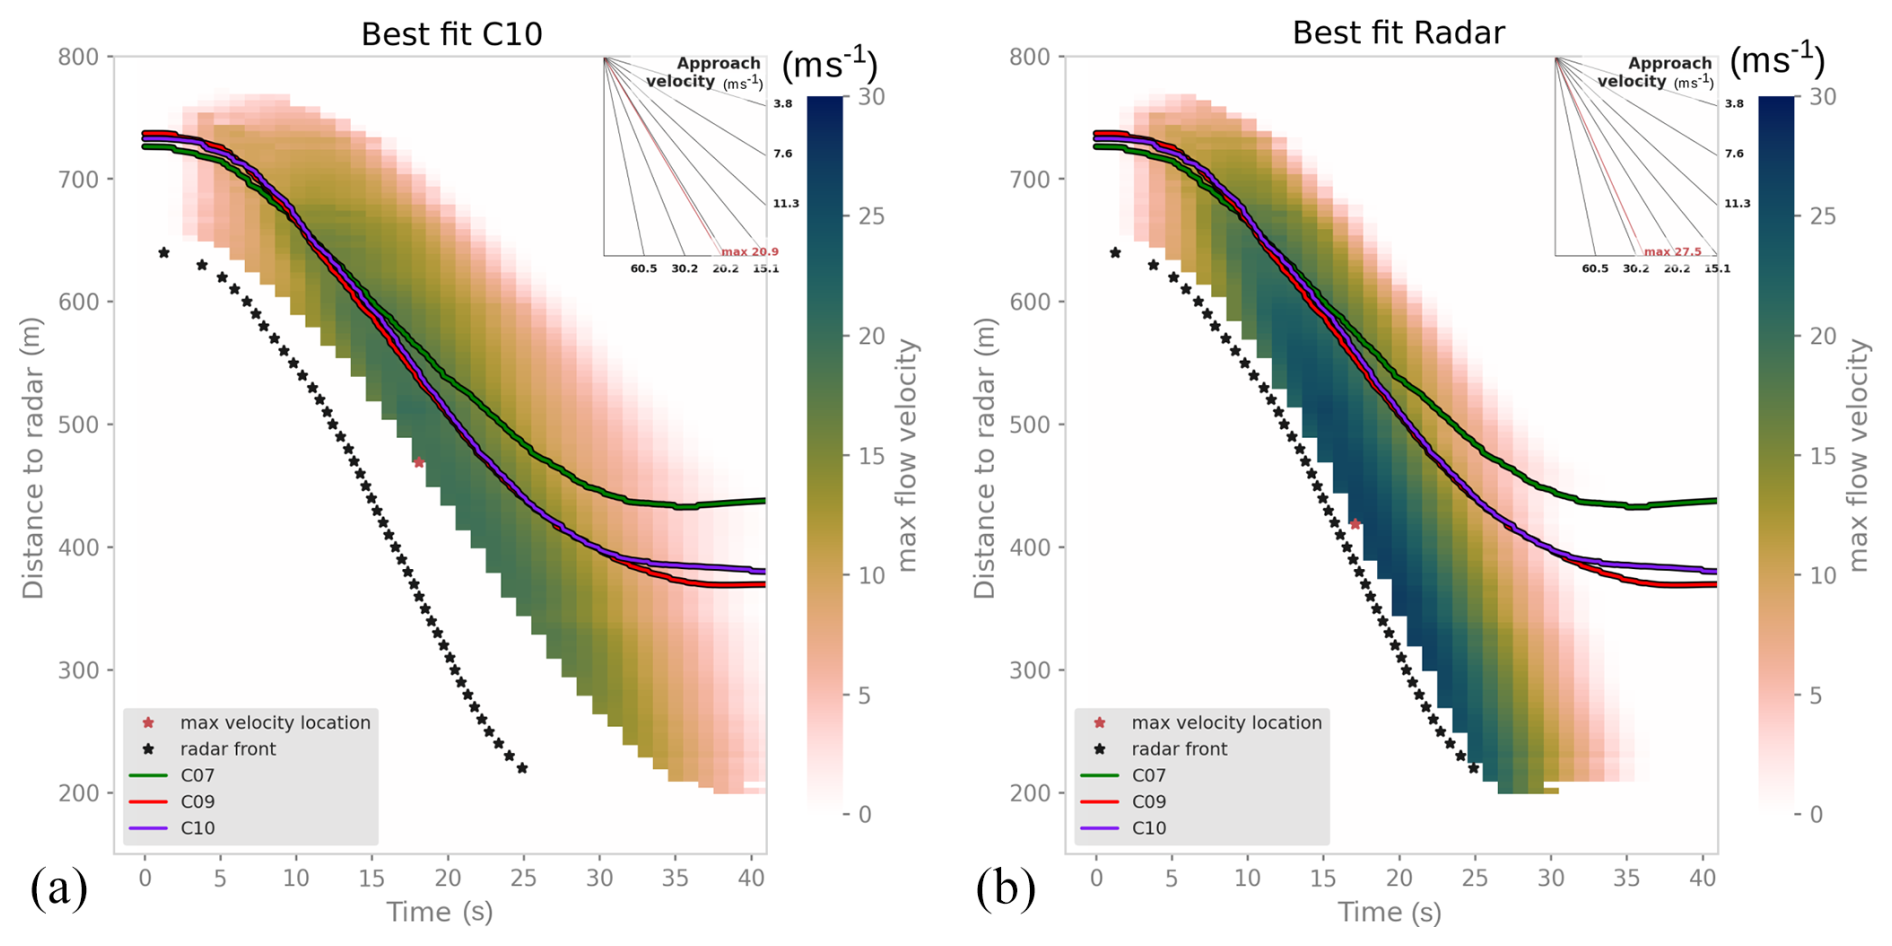
Figure 8Range-time diagram of the best-fit C10 (a) and front (b) simulations, showing the temporal evolution of the maximum flow velocities with distance to the radar. The black stars show the measured the avalanche front, the coloured lines show the AvaNode measurements. The corresponding simulation animation in three dimensional terrain can be found in the Supplement.
The comparison of the two best fit simulations highlights the differences in velocities which also explain the rather large range of the front position error towards the end of the avalanche movement. Similarly to the corresponding measurement (Fig. 2) one can see that the AvaNodes tend to be transported in the main body and towards the tail of the avalanche.
Table 2 summarizes the parameter sets and resulting velocity and position errors for the best-fit simulations, matching the corresponding measurement data. Frontal position and mean particle velocity error (ϵp,ϵv) are highlighted for each best-fit simulation. The magnitude of the errors reflects the similarity of the best-fit simulations, particularly comparing the the different AvaNode measurements. The front optimization leads to a slightly different parameter result, along with lower position errors and slightly larger velocity error magnitudes. However it is important to note that both, the front position and particle velocity error still remains in a medium range (50 m, 3.24 m s m s−1) for their non best-fit simulations. This indicates that suitable solutions are identified, albeit with reduced accuracy. In Figs. 4–6 one can identify the corresponding equifinality bands of parameter sets that lead to low RMSE values. The area for low RMSE solutions is wider for the particle fit in Fig. 5 than for the front fit in Fig. 4. This indicated that there are more parameter sets with low RMSE values when particle velocities are optimized, compared to when front positions are optimized. With the presented method one can now use those bands and search for overlapping areas between best-fit particle and front simulations, with low RMSE values for both simulations. There are many ways of combining these two parameter ranges.
Table 2Summary of the best-fit parameters for front and AvaNodes, with the corresponding RMSE values. The minimum RMSE value resulting for the corresponding measurement and simulation is highlighted in boldface.
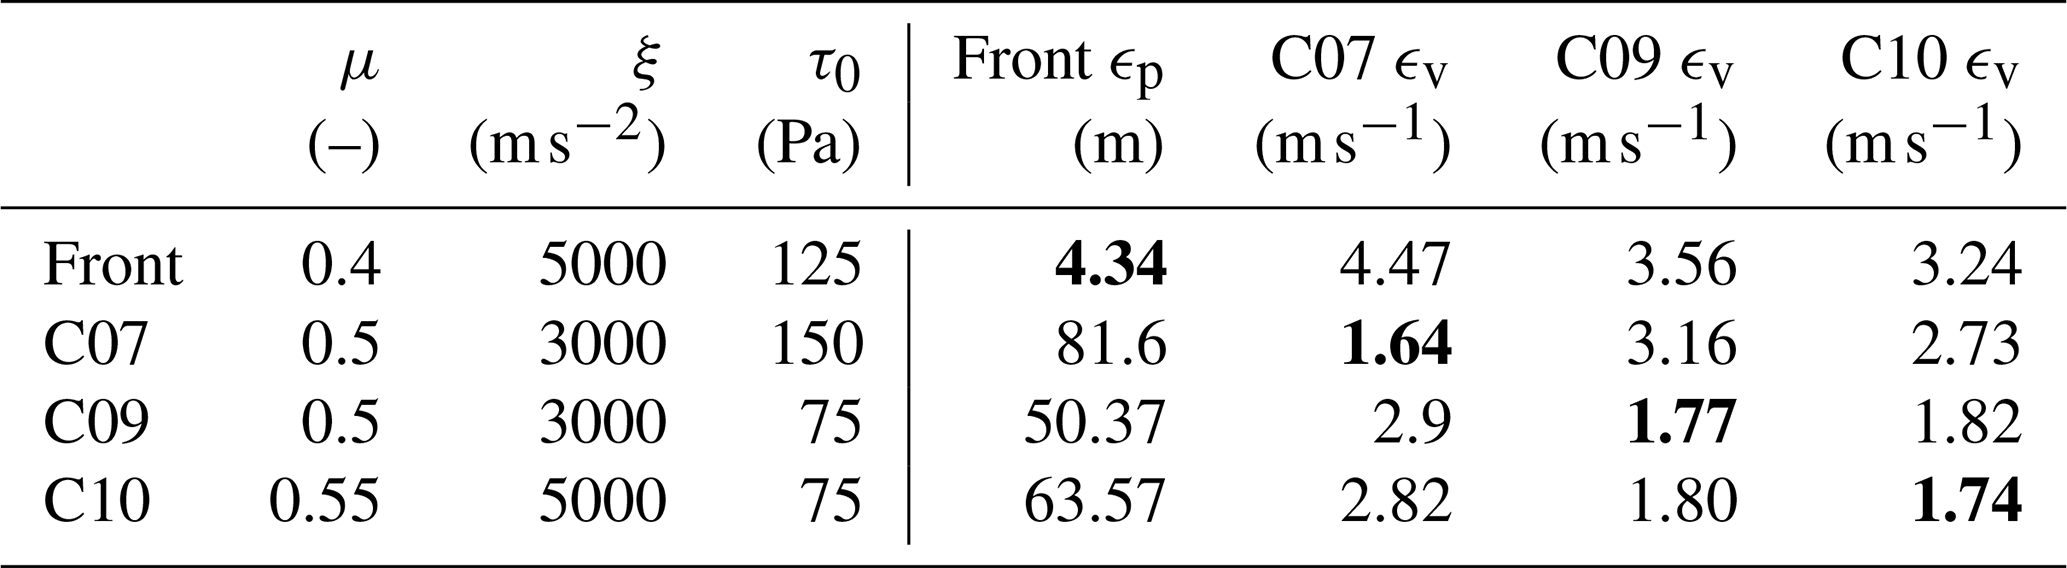
Table 3 summarizes selected simulation results corresponding to Figs. 7 and 8. The respective measurement data is highlighted in Fig. 1 and summarized in Table 1.
Table 3Summary of simulation results of the best fit simulations for the front and each AvaNode with the corresponding values highlighted in boldface. Listed are the maximum front velocities vfront and frontal altitude difference ΔZ) (Fig. 8) as well as maximum velocity , travel length and altitude difference (Fig. 7) averaged for the corresponding tracked simulation particles and each AvaNode.
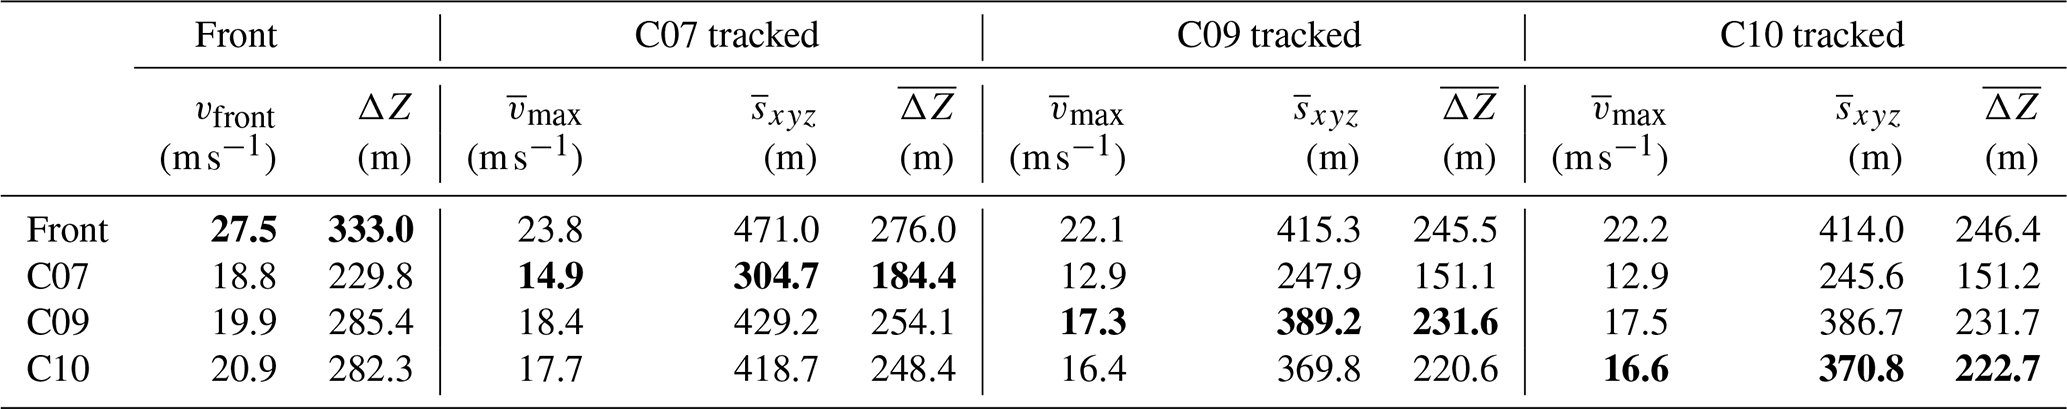
Comparing computational and experimental data allows us to deduce the accuracy of the best fit simulations. The resulting differences between maximum particle velocities between measurements (Table 1) and simulations (Table 3) range between 1.0–1.3 m s−1, which is less than 10 % of the maximum velocity values. Additionally it is possible to evaluate the travel lengths (ΔSxyz) or related altitude differences (ΔZ) along their individual trajectories, with the simulated resulting travel lengths deviating between 6–18 m from the measurements (≤5 % of the maximum travel length) and a similar range for the respective altitude differences. Another quantity to assess the accuracy of the simulations is the maximum of the avalanche front velocity, which is obviously closely related to the alignment of the front positions (compare Fig. 6). For the best-fit front simulation (or lowest front position error ϵp) we obtain a maximum front velocity of 27.5 m s−1 compared to 26 m s−1 for the corresponding measurement, which is the same level of accuracy that we observe for the particle velocities. Comparing the range of result values between the different best-fit simulations it can be seen that parameter sets optimized for other result variables merely provide a slightly lower accuracy for the result variable under consideration.
5.1 Measurement data and simulation results
We were able to show that the position RMSE for the avalanche front ϵp and the velocity RMSE for particles ϵv provide valuable information about how accurately the simulations can reproduce the measured dynamic behaviour of an avalanche particle or the front. As seen in Table 2 the minimum values for the velocity error magnitude ϵv are below 10 % of the maximum velocity detected in those avalanches, which indicates a strong relation between the simulated and measured particles. The advantage of calculating ϵv in three dimensions before combining them is that one could apply weighting factors depending on the accuracy on the different axes. Since it is known and also visible in Fig. 3 that the z component in GNSS measurements is the most inaccurate one, this could be weighted less than the horizontal velocity components. Interestingly, the optimization results revealed that different observational datasets, such as the AvaNode velocities and radar front positions, lead to distinct yet relatively narrow bands of well-performing parameter combinations. As an outlook, a promising strategy would be to combine these complementary observational constraints in a weighted manner, depending on the specific modelling objective. Such a targeted combination could enable the identification of parameter sets that simultaneously provide good agreement with both particle and front observations, thereby improving the robustness and general applicability of simulation results.
Figure 6 shows the best-fit simulation for the avalanche front compared to all simulations coloured in the corresponding RMSE value. In the left panel one can see the evolution of the avalanche front and how well the model can reproduce it, while the best-fit simulation for C10 has a ϵp value of 63.57 m we reach ϵp=4.34 m for the best-fit simulation front. The right panel shows the overall altitude difference of the front compared to the maximum velocity in this simulation. As one can see the measurement of the front indicates a longer run-out length, leading to deposition in the dam, while the simulation stops earlier, although the maximum velocity of the best-fit simulation is higher. With the front best-fit we ensure that the avalanche front is reproduced accurately in the first 25 s, not covering the avalanche run-out towards the deposition zone at the upper dam.
Figure 7 shows the two best-fit simulations, based on the comparsion to the AvaNode and radar front, with the tracked particles compared to the measured ones. The left panel shows the best-fit C10 simulation, indicating that the tracked simulation particles reproduce the behaviour of the measured AvaNode C10 with highest accuracy (maximum velocity of 16.6 m s−1 for the simulated vs. 17.1 m s−1 for the measured particle, see Tables 1 and 3). It is important to note that the best-fit particle simulations are generally accompanied with lower velocities than the best-fit front ones, which is also reflected in the resulting shorter travel length along the particle trajectories and resulting runout.
Figure 8 illustrates the evolution of the two best-fit simulations in a Range-Time diagram. In the left panel, the movement of the AvaNodes is reproduced quite accurately, although the simulated and measured fronts show differing evolutions, as previously observed (Fig. 6). On the right panel the front evolution achieves a very high accuracy with a front position RSME value of ϵp=4.34 m (compare Table 2).
By considering avalanche motion on a particle level, the presented method provides a deeper understanding of how a chosen friction model performs within the considered plausible parameter space and results in a parameter set that can reproduce the measurements with the highest accuracy.
Avalanches can exhibit a multitude of flow regimes which either vary from top to bottom along the track or from front to tail (Köhler et al., 2018) yielding a potential temporal dependency of the related friction coefficients (Buser and Bartelt, 2009). For the observed avalanche and corresponding particle movement we assume the cold flow regime to be most relevant and only small parts that are slightly fluidized when reaching the maximum runout. Air intake at the flow front may cause the avalanche body to develop a fluidized layer on top of a dense-flow layer (Issler and Gauer, 2008) and therefore also explain that small parts of the avalanche traveled further than the main body. Such processes alter the volumetric mixture of snow grains with interstitial air compared to the tail of the avalanche where one expects a rather dense granular flow (Bartelt et al., 2012). Even when the analysed medium sized avalanche did not convert towards a fully developed powder snow avalanche with an intermittent flow regime (Sovilla et al., 2018), there are different frictional relations for the flow of the front compared to the tail.
Our optimizations for the avalanche front, based on radar data, and for the tail, based on AvaNode particle data, reveal that the particle and front behaviour cannot be simultaneously reproduced by the same set of flow model parameters and friction relations. This suggests that different flow regimes dominate different parts of the avalanche: the front is governed by more inertial, dynamic processes, while the tail transitions into a slower, more friction-dominated regime. This observation is consistent with the concept of frictional hysteresis and phase transitions in density, as previously reported in large-scale avalanche measurements, such as those by Sovilla et al. at Vallée de la Sionne. Our results highlight that even in smaller avalanches, these complex dynamics are present, emphasizing the need for models that can account for spatially and temporally varying flow behaviours. To further support this finding, we provide a supplementary video that visualizes both best-fit simulations–one optimized for the front and one for the tail–offering an intuitive overview of the differences in particle dynamics and flow structure across the avalanche (Neuhauser et al., 2024).
5.2 Initial and boundary conditions
The influence of boundary conditions, such as release thickness, release area or topography on simulation results is well known, considering the main avalanche features (Bühler et al., 2011, 2018). In this paper with particular focus on particle tracking we investigate the interplay between topography and initial position within the release area for isolated particles. To do so the com1DFA module of AvaFrame has been extended with the presented particle tracking. The implementation of these functionalities allows us to e.g. project simulation results along the particle trajectories or forwards and backwards in time. With this one can display and analyse how flow quantities, such as maximum velocity or travel length, develop along potential particle trajectories. In the future, the methodology could allow predictions where and how something will be transported if the starting point is known. As a first application we use this methodology to test whether the interaction of local topography and initial position in the release area determines the resulting maximum velocities. It is important to note that observational data remains sparse and that it is not possible to investigate the relative influence of the different effects, such as comparing the role of initial position of an AvaNode to its density.
Figure 9 shows the reprojection of the maximum velocity along the particle trajectories back into the release area to the respective initial particle positions for the two best-fit (C10 and front) simulations. Additionally the initial position of the Avanode sensors and their corresponding measured maximum velocities (see Table 1) are shown. When comparing the simulated to the measured velocities we observe that the C10 best fit velocities are generally lower than the ones for the best-fit front. This is in line with the previously discussed results. Furthermore the agreement of simulated and measured maximum velocity for C10 and the surrounding simulation particles (with 0.5 m s−1 difference for the best-fit) highlights the functionality of the particle tracking based optimization. Besides these expected results it is interesting to investigate the similarities between the two best fit simulations. It appears that the determining factor for maximum velocity within the simulations is the relative initial position in the main flow direction within the release area. Particles that travel at the front of the avalanche achieve higher maximum velocities than the ones that follow towards the tail of the avalanche, which may appear counterintuitive considering simple energy conservation based block model approaches (Körner, 1980), where particles starting at higher altitudes should lead to larger maximum velocities and corresponding runouts. Compared to the relative initial position, the inclination at this position plays a subordinate role, although steeper parts of the release range lead to a higher initial acceleration, which, however, does not lead to the maximum velocities (see slope map in Fig. 2 and velocity evolution in Figs. 7 and 8 or the simulation animation in the Supplement).
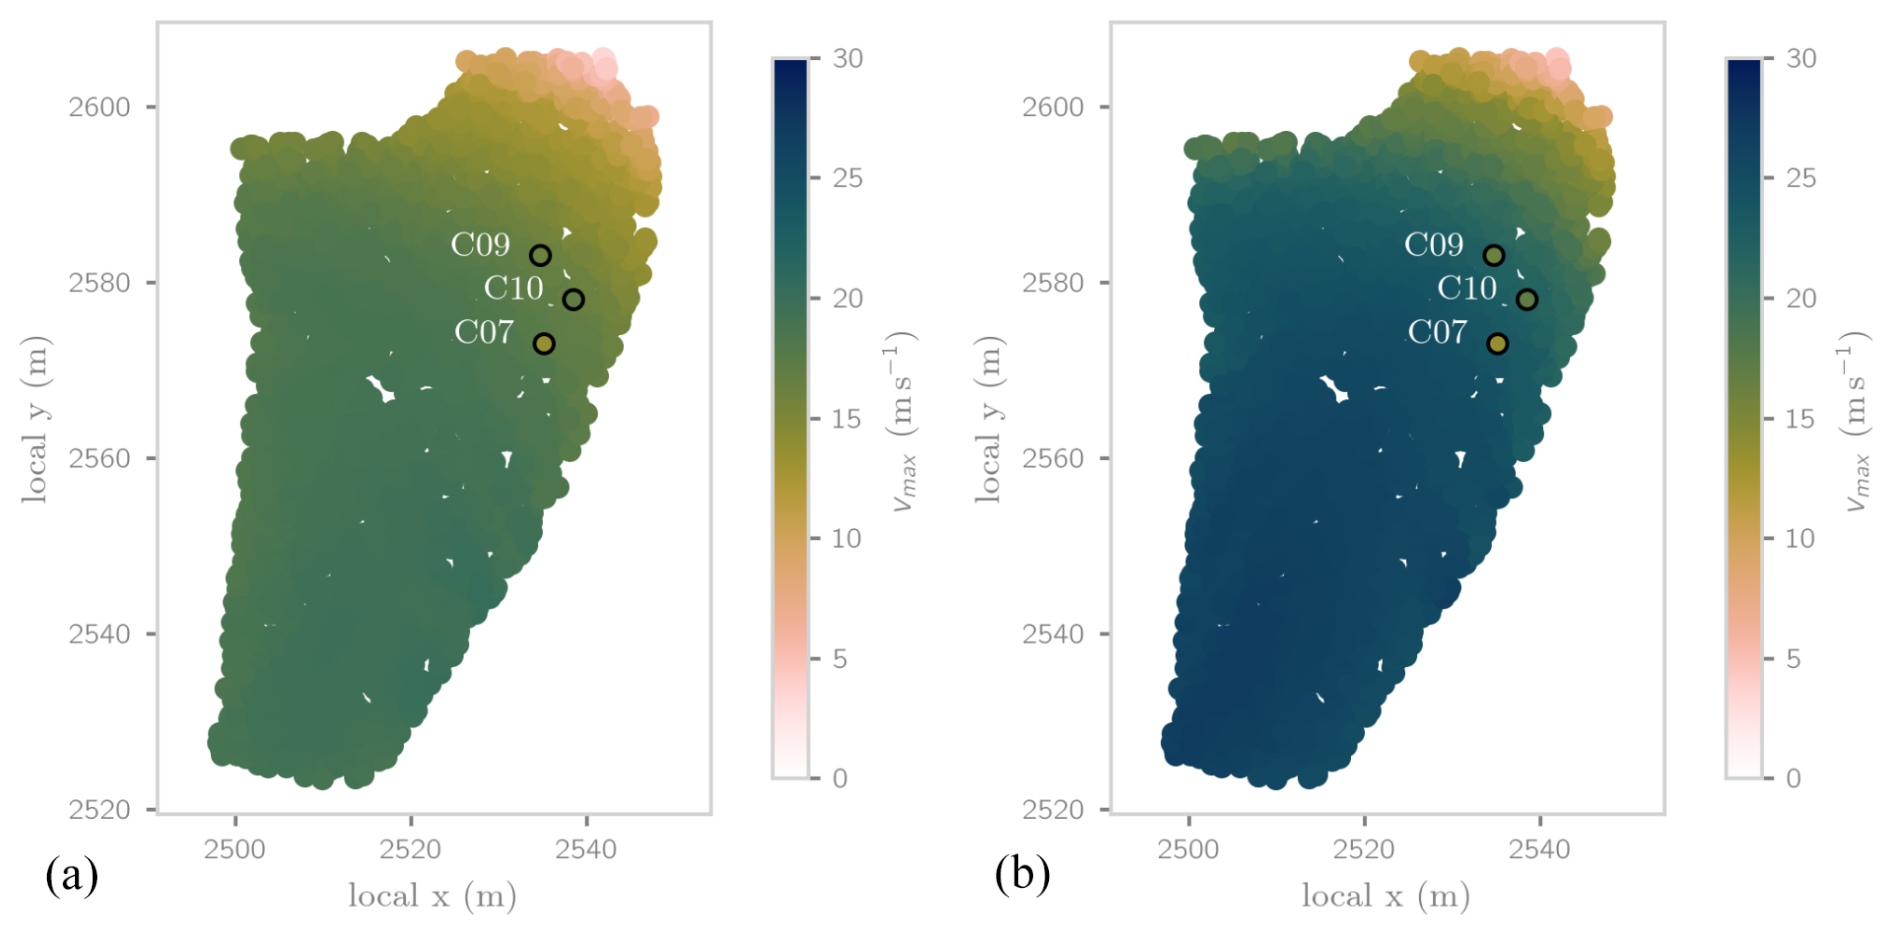
Figure 9This figure illustrates the maximum particle velocity projected to the initial simulation particle position in the release area. (a) represents the best-fit C10 simulation and (b) the best-fit front simulation. The black circles mark the starting points of the AvaNodes, colour-coded based on their corresponding maximum velocity.
This is related to the fact that neither particle overtaking nor resorting effects are observed in the simulation data. At this point, it is important to be aware of the fundamental differences between simulations and measurements. As the simulations are performed using a thickness-integrated model, numerical particles represent two-dimensional columns moving in two dimensional space along the predefined digital elevation model. This involves the effects of pressure gradients in the flow and inhibits overtaking of material at different vertical positions. Due to the thickness-integration and shallow flow assumption, processes like segregation or overtaking of particles in the vertical dimension cannot be represented in the simulations.
On the flip side, the measurement data does not confirm this initial position dependency of the maximum velocity and additionally, the AvaNode C07 (green) is overtaken by the other two AvaNodes. Here we have to remember that the AvaNodes have different particle properties while all simulation particles have the same generic properties. AvaNode C07 has a higher density and is initially positioned downhill of the other AvaNodes in the release area, but reaches lower velocities. At this stage, we cannot infer if the particle property or the initial position are the determining factors for the resulting velocity although the analysis of other experimental AvaNode data Neuhauser et al. (2023) indicates that particles with higher densities tend to be differently transported with lower velocities and a different position within the avalanche body.
The combination of AvaNode particle and corresponding radar measurements provides a holistic view on the temporal and spatial evolution of the avalanche. The measurements and simulations provide an unprecedented level of detail with respect to avalanche particle dynamics. With this study we show how particle and front tracking in experimental and computational avalanche dynamics help to get a deeper insight into the driving processes behind transport phenomena and mobility as well as how they are represented in widely applied thickness-integrated flow models.
The comparison between measurement and simulation on a particle level delivers new insights on the capabilities and limitations of the employed model approach.
The computational module AvaFrame::com1DFA of AvaFrame highlights the potential of research applications, extending an open source simulation tool for gravitational mass flows that is used for operational hazard mapping. The implemented particle tracking allows exploration of avalanche features such as maximum velocity in new and diverse ways, namely to project these results along their trajectories to an arbitrary time step, e.g. to their initial position. This approach provides new insights into the performance of the flow model, the related constraints, and how boundary conditions like particle properties, topography or initial position influence particle motion during the flow phase.
The comparison of measured particle properties, focusing on their velocity, demonstrates that the underlying model has the capability of reproducing the behaviour of single measured particles, indicating the comparability of experiment and simulation particles. Using the RMSE velocity and position method, we replicate avalanche particle and front dynamics quite accurately, although with different parameter sets. Beyond the best-fit solutions we obtain a wide range of suitable parameter sets within the equifinality. However it is out of the scope of this paper to address the resulting trade-off between single simulation accuracy and the possibility to replicate multiple measurements at the same time in more detail.
Measurements indicate a dependence of the maximum velocity of particles on their initial position or particle properties which differs from the dependence found in simulations. This reveals potential limitations of thickness-integrated approaches to reproduce differences between single particle properties like varying density or processes like overtaking that appear in natural flows through separation and segregation (Gray and Ancey, 2015). These shortcomings could potentially be resolved by implementing varying particle properties in the simulations, considering the full three dimensional velocity field (Rauter et al., 2016; Li et al., 2021) or additionally employing multi-phase flow models (Mergili et al., 2020) with variable frictional and rheological approaches (Jop et al., 2006) or different flow regimes along the path (Bartelt et al., 2012).
In this work, we have taken the first steps towards an in-depth avalanche analysis at the particle level. With more accurate datasets the level of detail could be increased further, providing more insights into avalanche dynamics and the flow regime evolution along the path. Improving the position measurement, i.e. regarding spatial accuracy of the AvaNodes would enhance the overall method. More accurate results would allow minimization of the number of tracked simulation particles, which would be particularly useful in combination with the extension of the spatial distribution and number of measurement particles in the release area.
One goal for future investigations and developments would be to get radar measurements of the whole avalanche track combined with more accurate AvaNode GNSS data sets, avalanche run-out distance and deposition area. For the AvaNodes, increasing the accuracy of position measurements, and if feasible, velocity measurements, by using more precise GNSS modules would be beneficial, particularly towards resolving movement in the vertical direction. The focus for radar measurements should be on enhancing the accuracy of the measurements themselves and, if possible, combining two radar types, namely pulse-Doppler and FMCW, to measure the same avalanche. This would provide a better understanding of velocity distribution evolution in avalanches. Additionally, new developments of the AvaNodes could lead to lower densities and a wider range of sensor shape and size, resulting in a more comprehensive analysis of how particle properties influence flow evolution in different locations or parts of the avalanche. This would allow to investigate transport phenomena, such as segregation and separation processes (Gray and Ancey, 2015) or the influence of the vertical resolution of the velocity profile (Tiefenbacher and Kern, 2004; Kern et al., 2009, 2010). Additional sensor systems, such as infrared temperature or pressure sensors in the AvaNodes could deliver new insight to the driving factors of avalanche movement, considering temperature (Vera Valero et al., 2015; Steinkogler et al., 2014; Fischer et al., 2018), related mass evolution through entrainment (Naaim et al., 2013) or to determine the vertical position withing the avalanche.
In conclusion, the advancements in measurement technology and computational modelling pave the way for a deeper and more comprehensive understanding of avalanche dynamics, ultimately enhancing our ability to predict and mitigate avalanche-related hazards, towards predicting flow intensities with respect to their initial position and along flow trajectories, that may serve useful for optimal search design for burials or terrain classification with respect to the potential destructiveness.
Neuhauser et. al (2024) provides a video animation of the corresponding comparison of best-fit simulations. Additionally to this paper we deliver all initalisation files and input data required to reproduce the best-fit simulations. With this dataset comes a readme file that describes how to setup the simulations. The files are available in the supplement.
The supplement related to this article is available online at https://doi.org/10.5194/nhess-25-4185-2025-supplement.
MN developed the original idea. J-TF, WF, and AW contributed to the paper concept. MN, AW, and AK processed and analyzed the simulation and measurement data. FO, AW, J-TF, and MN coordinated and contributed to the simulation tool extension development. JG, FD, J-TF, AK, and MN lead and contributed to the measurement device developments. MN drafted the manuscript and designed the figures with contributions from the co-authors. WF, J-TF, and FO are responsible for supervision of the work. FD, JG, and J-TF organized the project funding. All authors discussed the results and commented on the manuscript.
The contact author has declared that none of the authors has any competing interests.
Publisher's note: Copernicus Publications remains neutral with regard to jurisdictional claims made in the text, published maps, institutional affiliations, or any other geographical representation in this paper. While Copernicus Publications makes every effort to include appropriate place names, the final responsibility lies with the authors. Views expressed in the text are those of the authors and do not necessarily reflect the views of the publisher.
This article is part of the special issue “Latest developments in snow science and avalanche risk management research – merging theory and practice”. It is a result of the International snow science Workshop, Bend, Oregon, USA, 8–13 October 2023.
This work was conducted as part of the international cooperation project “AvaRange – Particle Tracking in Snow Avalanches”. Additional financial support came from the open Avalanche Framework AvaFrame (https://www.avaframe.org/, last access: 20 October 2025), a cooperation between the Austrian Research Centre for Forests (Bundesforschungszentrum für Wald; BFW) and the Austrian Avalanche and Torrent Service (Wildbach- und Lawinenverbauung; WLV). The authors would like to further acknowledge the contentual and technical support by Engelbert Gleirscher and Jannis Aust, the Nordkette ski resort for their support and indispensable avalanche control work and Lambda4 for providing their innovative, helpful avalanche recovery systems.
This research has been supported by the Austrian Science Fund (grant no. I 4274-N29) and the Deutsche Forschungsgemeinschaft (grant no. 421446512).
This paper was edited by Pascal Haegeli and reviewed by HP Marshall and one anonymous referee.
Ancey, C., Meunier, M., and Richard, D.: Inverse problem in avalanche dynamics models, Water Resour. Res., 39, 1099, https://doi.org/10.1029/2002WR001749, 2003. a
Bartelt, P. and McArdell, B.: Granulometric investigations of snow avalanches, J. Glaciol., 55, 829–833, https://doi.org/10.3189/002214309790152384, 2009. a, b
Bartelt, P., Bühler, Y., Buser, O., Christen, M., and Meier, L.: Modeling mass-dependent flow regime transitions to predict the stopping and depositional behavior of snow avalanches, J. Geophys. Res., 117, F01015, https://doi.org/10.1029/2010JF001957, 2012. a, b, c
Bühler, Y., Christen, M., Kowalski, J., and Bartelt, P.: Sensitivity of snow avalanche simulations to digital elevation model quality and resolution, Ann. Glaciol., 52, 72–80, https://doi.org/10.3189/172756411797252121, 2011. a, b
Bühler, Y., von Rickenbach, D., Stoffel, A., Margreth, S., Stoffel, L., and Christen, M.: Automated snow avalanche release area delineation – validation of existing algorithms and proposition of a new object-based approach for large-scale hazard indication mapping, Nat. Hazards Earth Syst. Sci., 18, 3235–3251, https://doi.org/10.5194/nhess-18-3235-2018, 2018. a, b
Buser, O. and Bartelt, P.: Production and decay of random kinetic energy in granular snow avalanches, J. Glaciol., 55, 3–12, https://doi.org/10.3189/002214309788608859, 2009. a
Canli, E., Mergili, M., Thiebes, B., and Glade, T.: Probabilistic landslide ensemble prediction systems: lessons to be learned from hydrology, Nat. Hazards Earth Syst. Sci., 18, 2183–2202, https://doi.org/10.5194/nhess-18-2183-2018, 2018. a
Caviezel, A., Demmel, S. E., Ringenbach, A., Bühler, Y., Lu, G., Christen, M., Dinneen, C. E., Eberhard, L. A., von Rickenbach, D., and Bartelt, P.: Reconstruction of four-dimensional rockfall trajectories using remote sensing and rock-based accelerometers and gyroscopes, Earth Surf. Dynam., 7, 199–210, https://doi.org/10.5194/esurf-7-199-2019, 2019. a
Christen, M., Bartelt, P., and Kowalski, J.: Back calculation of the In den Arelen avalanche with RAMMS: interpretation of model results, Ann. Glaciol., 51, 161–168, https://doi.org/10.3189/172756410791386553, 2010a. a
Christen, M., Kowalski, J., and Bartelt, P.: RAMMS: numerical simulation of dense snow avalanches in three-dimensional terrain, Cold Reg. Sci. Technol., 63, 1–14, https://doi.org/10.1016/j.coldregions.2010.04.005, 2010b. a, b
D'Amboise, C. J. L., Neuhauser, M., Teich, M., Huber, A., Kofler, A., Perzl, F., Fromm, R., Kleemayr, K., and Fischer, J.-T.: Flow-Py v1.0: a customizable, open-source simulation tool to estimate runout and intensity of gravitational mass flows, Geosci. Model Dev., 15, 2423–2439, https://doi.org/10.5194/gmd-15-2423-2022, 2022. a
Dent, J., Burrell, K., Schmidt, D. S., Louge, M., Adams, E., and Jazbutis, T.: Density, velocity and friction measurements in a dry-snow avalanche, Ann. Glaciol., 26, 247–252, https://doi.org/10.3189/1998AoG26-1-247-252, 1998. a
Eckert, N., Parent, E., and Richard, D.: Revisiting statistical-topographical methods for avalanche predetermination: Bayesian modelling for runout distance predictive distribution, Cold Reg. Sci. Technol., 49, 88–107, https://doi.org/10.1016/j.coldregions.2007.01.005, 2007. a
Edwards, A., Rocha, F., Kokelaar, B., Johnson, C., and Gray, J.: Particle-size segregation in self-channelized granular flows, J. Fluid Mech., https://doi.org/10.1017/jfm.2022.1089, 2022. a
Fischer, J.-T.: A novel approach to evaluate and compare computational snow avalanche simulation, Nat. Hazards Earth Syst. Sci., 13, 1655–1667, https://doi.org/10.5194/nhess-13-1655-2013, 2013. a
Fischer, J.-T., Fromm, R., Gauer, P., and Sovilla, B.: Evaluation of probabilistic snow avalanche simulation ensembles with Doppler radar observations, Cold Reg. Sci. Technol., 97, 151–158, https://doi.org/10.1016/j.coldregions.2013.09.011, 2014. a
Fischer, J.-T., Kofler, A., Fellin, W., Granig, M., and Kleemayr, K.: Multivariate parameter optimization for computational snow avalanche simulation, J. Glaciol., 61, 875–888, https://doi.org/10.3189/2015JoG14J168, 2015. a, b
Fischer, J.-T., Kaitna, R., Heil, K., and Reiweger, I.: The heat of the flow: thermal equilibrium in gravitational mass flows, Geophys. Res. Lett., 45, 11219–11226, https://doi.org/10.1029/2018GL079585, 2018. a
Gauer, P.: Comparison of avalanche front velocity measurements and implications for avalanche models, Cold Reg. Sci. Technol., 97, 132–150, https://doi.org/10.1016/j.coldregions.2013.09.010, 2014. a
Gauer, P., Kern, M., Kristensen, K., Lied, K., Rammer, L., and Schreiber, H.: On pulsed Doppler radar measurements of avalanches and their implication to avalanche dynamics, Cold Reg. Sci. Technol., 50, 55–71, https://doi.org/10.1016/j.coldregions.2007.03.009, 2007. a
Gauer, P., Medina-Cetina, Z., Lied, K., and Kristensen, K.: Optimization and probabilistic calibration of avalanche block models, Cold Reg. Sci. Technol., 59, 251–258, https://doi.org/10.1016/j.coldregions.2009.02.002, 2009. a
Gray, J. and Ancey, C.: Particle-size and-density segregation in granular free-surface flows, J. Fluid Mech., 779, 622–668, https://doi.org/10.1017/jfm.2015.438, 2015. a, b
Gruber, U. and Bartelt, P.: Snow avalanche hazard modelling of large areas using shallow water numerical methods and GIS, Environ. Modell. Softw., 22, 1472–1481, https://doi.org/10.1016/j.envsoft.2007.01.001, 2007. a
Hergarten, S. and Robl, J.: Modelling rapid mass movements using the shallow water equations in Cartesian coordinates, Nat. Hazards Earth Syst. Sci., 15, 671–685, https://doi.org/10.5194/nhess-15-671-2015, 2015. a
Issler, D. and Gauer, P.: Exploring the significance of the fluidized flow regime for avalanche hazard mapping, Ann. Glaciol., 49, 193–198, https://doi.org/10.3189/172756408787814997, 2008. a
Issler, D., Gisnås, K., Gauer, P., Glimsdal, S., Domaas, U., and Sverdrup-Thygeson, K.: NAKSIN – a new approach to snow avalanche hazard indication mapping in Norway, https://doi.org/10.2139/ssrn.4530311, 2023. a
Jop, P., Forterre, Y., and Pouliquen, O.: A constitutive law for dense granular flows, Nature, 441, 727–730, https://doi.org/10.1038/nature04801, 2006. a
Kern, M., Bartelt, P., Sovilla, B., and Buser, O.: Measured shear rates in large dry and wet snow avalanches, J. Glaciol., 55, 327–338, https://doi.org/10.3189/002214309788608714, 2009. a
Kern, M., Bartelt, P., and Sovilla, B.: Velocity profile inversion in dense avalanche flow, Ann. Glaciol., 51, 27–31, https://doi.org/10.3189/172756410791386643, 2010. a
Köhler, A., McElwaine, J. N., and Sovilla, B.: GEODAR data and the flow regimes of snow avalanches, J. Geophys. Res.-Earth, 123, 1272–1294, https://doi.org/10.1002/2017jf004375, 2018. a, b
Köhler, A., Lok, L. B., Felbermayr, S., Peters, N., Brennan, P. V., and Fischer, J.-T.: mGEODAR—a mobile radar system for detection and monitoring of gravitational mass-movements, Sensors, 20, 6373, https://doi.org/10.3390/s20216373, 2020. a
Körner, H. J.: The enegry-line method in the mechanics of avalanches, J. Glaciol., 26, 501–505, https://doi.org/10.3189/s0022143000011023, 1980. a
Li, X., Sovilla, B., Jiang, C., and Gaume, J.: Three-dimensional and real-scale modeling of flow regimes in dense snow avalanches, Landslides, 18, https://doi.org/10.1007/s10346-021-01692-8, 2021. a, b, c
Ligneau, C., Sovilla, B., and Gaume, J.: Numerical investigation of the effect of cohesion and ground friction on snow avalanches flow regimes, PLoS One, 17, 1–24, https://doi.org/10.1371/journal.pone.0264033, 2022. a
Marks, B. and Einav, I.: A mixture of crushing and segregation: the complexity of grainsize in natural granular flows, Geophys. Res. Lett., 42, 274–281, https://doi.org/10.1002/2014GL062470, 2015. a
Marks, B. and Einav, I.: A heterarchical multiscale model for granular materials with evolving grainsize distribution, Granular Matter, 19, 61, https://doi.org/10.1007/s10035-017-0741-6, 2017. a
McClung, D. M. and Schaerer, P.: The avalanche handbook, The Mountaineers Books, Seattle, WA, 3rd edn., ISBN 9780898868098, 2006. a
Mergili, M., Fischer, J.-T., Krenn, J., and Pudasaini, S. P.: r.avaflow v1, an advanced open-source computational framework for the propagation and interaction of two-phase mass flows, Geosci. Model Dev., 10, 553–569, https://doi.org/10.5194/gmd-10-553-2017, 2017. a
Mergili, M., Frank, B., Fischer, J.-T., Huggel, C., and Pudasaini, S. P.: Computational experiments on the 1962 and 1970 landslide events at Huascarán (Peru) with r.avaflow: lessons learned for predictive mass flow simulations, Geomorphology, 322, 15–28, https://doi.org/10.1016/j.geomorph.2018.08.032, 2018. a
Mergili, M., Jaboyedoff, M., Pullarello, J., and Pudasaini, S. P.: Back calculation of the 2017 Piz Cengalo–Bondo landslide cascade with r.avaflow: what we can do and what we can learn, Nat. Hazards Earth Syst. Sci., 20, 505–520, https://doi.org/10.5194/nhess-20-505-2020, 2020. a
Naaim, M., Durand, Y., Eckert, N., and Chambon, G.: Dense avalanche friction coefficients: influence of physical properties of snow, J. Glaciol., 59, 771–782, https://doi.org/10.3189/2013JoG12J205, 2013. a, b
Neuhauser, M., Köhler, A., Neurauter, R., Adams, M. S., and Fischer, J.-T.: Particle trajectories, velocities, accelerations and rotation rates in snow avalanches, Ann. Glaciol., 1–18, https://doi.org/10.1017/aog.2023.69, 2023. a, b, c, d, e, f
Neuhauser, M., Köhler, A., Wirbel, A., Oesterle, F., Fellin, W., Gerstmayr, J., Dressler, F., and Fischer, J.-T.: Particle and front tracking in experimental and computational avalanche dynamics, https://doi.org/10.5446/68602, 2024. a
Neurauter, R., Holzinger, S., Neuhauser, M., Fischer, J.-T., and Gerstmayr, J.: Motion reconstruction of fast-rotating rigid bodies, Journal of Computational and Nonlinear Dynamics, 19, 011005, https://doi.org/10.1115/1.4063952, 2023. a
Oesterle, F., Wirbel, A., Tonnel, M., and Fischer, J.-T.: avaframe/AvaFrame: latest Version, Zenodo [code], https://doi.org/10.5281/zenodo.4721446, 2022. a, b
Rastello, M., Rastello, F., Bellot, H., Ousset, F., Dufour, F., and Meier, L.: Size of snow particles in a powder-snow avalanche, J. Glaciol., 57, 151–156, https://doi.org/10.3189/002214311795306637, 2011. a
Rauter, M. and Köhler, A.: Constraints on entrainment and deposition models in avalanche simulations from high-resolution radar data, Geosciences, 10, https://doi.org/10.3390/geosciences10010009, 2019. a, b
Rauter, M., Fischer, J.-T., Fellin, W., and Kofler, A.: Snow avalanche friction relation based on extended kinetic theory, Nat. Hazards Earth Syst. Sci., 16, 2325–2345, https://doi.org/10.5194/nhess-16-2325-2016, 2016. a
Rauter, M., Kofler, A., Huber, A., and Fellin, W.: faSavageHutterFOAM 1.0: depth-integrated simulation of dense snow avalanches on natural terrain with OpenFOAM, Geosci. Model Dev., 11, 2923–2939, https://doi.org/10.5194/gmd-11-2923-2018, 2018. a, b
Sampl, P. and Zwinger, T.: Avalanche simulation with SAMOS, Ann. Glaciol., 38, 393–398, https://doi.org/10.3189/172756404781814780, 2004. a, b, c, d
Sovilla, B., McElwaine, J. N., and Köhler, A.: The intermittency regions of powder snow avalanches, J. Geophys. Res.-Earth, 123, 2525–2545, https://doi.org/10.1029/2018JF004678, 2018. a, b
Steinkogler, W., Sovilla, B., and Lehning, M.: Influence of snow cover properties on avalanche dynamics, Cold Reg. Sci. Technol., 97, 121–131, https://doi.org/10.1016/j.coldregions.2013.10.002, 2014. a
Steinkogler, W., Gaume, J., Löwe, H., Sovilla, B., and Lehning, M.: Granulation of snow: from tumbler experiments to discrete element simulations, J. Geophys. Res.-Earth, 120, 1107–1126, https://doi.org/10.1002/2014jf003294, 2015. a
Tiefenbacher, F. and Kern, M.: Experimental devices to determine snow avalanche basal friction and velocity profiles, Cold Reg. Sci. Technol., 38, 17–30, https://doi.org/10.1016/S0165-232X(03)00060-0, 2004. a
Toft, H. B., Sykes, J., Schauer, A., Hendrikx, J., and Hetland, A.: AutoATES v2.0: Automated Avalanche Terrain Exposure Scale mapping, Nat. Hazards Earth Syst. Sci., 24, 1779–1793, https://doi.org/10.5194/nhess-24-1779-2024, 2024. a
Tonnel, M., Wirbel, A., Oesterle, F., and Fischer, J.-T.: AvaFrame com1DFA (v1.3): a thickness-integrated computational avalanche module – theory, numerics, and testing, Geosci. Model Dev., 16, 7013–7035, https://doi.org/10.5194/gmd-16-7013-2023, 2023. a
u-blox: u-blox 8 / u-blox M8 Receiver description, Tech. Rep. v15-20.30,22-23.01, https://content.u-blox.com/sites/default/files/products/documents/u-blox8-M8_ReceiverDescrProtSpec_UBX-13003221.pdf (last access: 20 October 2025), 2022. a
Vera Valero, C., Wikstroem Jones, K., Bühler, Y., and Bartelt, P.: Release temperature, snow-cover entrainment and the thermal flow regime of snow avalanches, J. Glaciol., 61, 173–184, https://doi.org/10.3189/2015JoG14J117, 2015. a
Vilajosana, I., Llosa, J., Schaefer, M., Surinach, E., and Vilajosana, X.: Wireless sensors as a tool to explore avalanche internal dynamics: experiments at the Weissflühjoch Snow Chute, Cold Reg. Sci. Technol., 65, 242–250, https://doi.org/10.1016/j.coldregions.2010.09.011, 2011. a
Voellmy, A.: Über die Zerstoerungskraft von Lawinen, Bauzeitung, 73, 159–165, https://doi.org/10.5169/seals-61910, 1955. a
Winkler R., Neuhauser M., Neurauter R., Erlacher F., Steinkogler W., and Fischer J-T: Particle tracking in snow avalanches with in situ calibrated inertial measurement units, Annals of Glaciology, 65, e14, https://doi.org/10.1017/aog.2024.5, 2 a
Zugliani, D. and Rosatti, G.: TRENT2D: an accurate numerical approach to the simulation of two-dimensional dense snow avalanches in global coordinate systems, Cold Reg. Sci. Technol., 190, 103343, https://doi.org/10.1016/j.coldregions.2021.103343, 2021. a
- Abstract
- Introduction
- Objectives
- Methods for particle and front tracking and simulations
- Evaluating measurements and simulation results
- Discussion
- Conclusion and outlook
- Data availability
- Author contributions
- Competing interests
- Disclaimer
- Special issue statement
- Acknowledgements
- Financial support
- Review statement
- References
- Supplement