the Creative Commons Attribution 4.0 License.
the Creative Commons Attribution 4.0 License.
 | 07 Oct 2025
The effect of community resilience and disaster risk management cycle stages on morbi-mortality following floods: an empirical assessment
Reinhard Mechler
Stefan Velev
Dipesh Chapagain
Practice and policy have emphasized the need for building resilience to climate-related events in a further warming world. Scholarship has studied resilience largely in terms of process, latent capacity informing vulnerability, or the outcome of risk management interventions, with little work integrating these perspectives. Implementation science work by the Climate Resilience Alliance has developed the Flood Resilience Measurement for Communities (FRMC) process and tool to measure resilience as an outcome (post-flood mortality and morbidity reduction) and as capacity (pre- and post-intervention levels). This article builds on FRMC analytics to investigate the effect of resilience capacity, represented by five forms of capital (5Cs) and five stages of the disaster risk management (DRM) cycle, on injury and mortality outcomes across 66 flood-affected communities in seven Global South countries. Data were collected using household surveys, community focus groups, key informant interviews, and secondary sources. We applied a quasi-experimental regression design, controlling for demographic and flood hazard/exposure variables, to estimate the effect of 5Cs and DRM stages on health outcomes. Results show that social and human capital help reduce injuries after floods, and preparedness lowers both deaths and injuries. Some results were unexpected, such as the positive association between natural capital and delayed deaths, where limited gains in natural capital may not yield meaningful protection in communities with degraded ecosystems. This study finds that preparedness is the most consistent predictor of positive health outcomes, while forms of 5Cs may not translate into reduced mortality. By combining 5Cs, DRM stages, and health indicators, this paper contributes to bridging a gap in the literature and offers policy-relevant insights for improving community-level disaster response.
- Article
(1144 KB) - Full-text XML
- BibTeX
- EndNote


Floods are the most frequent disaster triggered by environmental extremes and account for the highest disaster-related death rate (Yari et al., 2020). Also, floods cause severe health impacts worldwide, particularly affecting lower-income, densely populated regions (Escobar Carías et al., 2022; Lynch et al., 2025). Research highlights that mortality and morbidity during and after floods are shaped by a variety of individual and community risk factors, including hazard event type, intensity, and duration (Birkmann et al., 2022) and factors associated with exposure and vulnerability including age (Petrucci, 2022; Yang et al., 2023), gender (Jerin et al., 2024; Mucherera and Mavhura, 2020), urban–rural location (Petrucci, 2022), and various other drivers, all of which significantly determine risk and actual impacts on affected populations in disaster events as well as informing interventions to build resilience (Chapagain et al., 2025).
Although the impact of demographic factors – such as age, gender, and rural or urban residence – on flood-related mortality and morbidity is well-documented, the role of five forms of capital (5Cs) and stages of the disaster risk management (DRM) cycle, when accounting for demographic factors and flood exposure/hazard, is less clear. One study has explored the role of five forms of capital (social, human, financial, physical, natural) as drivers of vulnerability in terms of total injuries and fatalities, controlling for flood exposure but with no control for demographics (Chapagain et al., 2025). Another study examined the challenges faced at stages of the DRM cycle in the context of rural flooding in Pakistan. Employing a qualitative approach with focus groups and key informant interviews in Khyber Pakhtunkhwa Province, the study identified challenges in risk reduction, preparedness, rescue and relief, and rehabilitation and recovery phases (Shah et al., 2023).
Understanding resilience has proceeded. Drawing on Alexander (2013), resilience has evolved from an outcome-oriented concept – “bouncing back” after disturbance – to one that also includes latent features such as inherent capacity and adaptive potential. Initially defined by its etymology and early scientific use in mechanics (resisting and absorbing force), resilience concepts have been advanced to reflect deeper systemic traits in ecology (absorbing shocks while maintaining function), psychology (individual adaptation to adversity), and the social sciences (community robustness and flexibility for transformation). In disaster risk reduction (and climate adaptation) research and implementation, different dimensions have seen attention and resilience has been analysed as observable outcomes after events and latent qualities before events – like adaptability, resistance, and transformative capacity – that enable systems to withstand and evolve through disruption (Alexander, 2013). Yet, there has been limited work combining outcomes and capacity.
Furthermore, understanding resilience and DRM stage effects and their interactions with demographic profiles and exposure is essential for developing effective policy interventions. Available evidence suggests that investing in building community resilience to floods reduces the negative impacts of these events on human health and well-being along a DRM cycle that aims to avoid, lessen, or transfer the adverse effects of floods, contributing to better flood outcomes by guiding integrated and proactive management strategies (Hochrainer-Stigler et al., 2020, 2021; Keating et al., 2017a; Laurien et al., 2020).
This article uses the Flood Resilience Measurement for Communities (FRMC) tool to examine the role of capacities in reducing fatalities (immediate and delayed) and injury outcomes for 66 flood-affected communities across seven countries. Recent global analysis of the FRMC's large-scale application across nearly 400 communities further validates its use, highlighting consistent patterns in how different resilience dimensions relate to recovery outcomes (Keating et al., 2025).
The analysis controls for demographic factors and flood exposure/hazard. Communities are grouped into four resilience clusters and two DRM cycle groups to reflect the tendency of similar capital levels and DRM coping capacities (Hochrainer-Stigler et al., 2021; Keating et al., 2025). A quasi-experimental research design with regression adjustment is applied to evaluate the distinct influence of resilience and DRM cycle stages on morbidity and mortality outcomes after controlling for confounders.
Our findings emphasize the critical role of resilience and DRM cycle stages in shaping health and mortality outcomes after a flood event. Social capital and natural capital were assessed to be effective in reducing injuries. DRM models demonstrated stronger predictive power, with preparedness significantly decreasing both fatalities and injuries. Meanwhile, corrective risk reduction lowered injury rates. Nevertheless, we found some unexpected results. For instance, the positive association between natural capital and delayed mortality may reflect the vulnerability of communities with degraded ecosystems, where limited improvements fail to yield meaningful health benefits. Similarly, unexpected patterns in the DRM stages, such as higher mortality associated with corrective risk reduction, may be explained by lagged effects or measurement timing relative to implementation efforts.
This section presents the independent variables, emphasizing their theoretical components and relevant literature. The sections are organized around the key explanatory variables (5Cs and the DRM cycle stages) and the control variables (demographics and hazard/exposure to floods). We hypothesize that these variables can play a crucial role in influencing mortality and morbidity outcomes after a flood event.
2.1 The FRMC capital framework (5Cs)
A central component of the framework is the 5Cs, which are broadly derived from the Sustainable Livelihoods Framework (Keating et al., 2014). They represent different types of assets and resources that contribute to a community's overall well-being and its capacity to cope with and recover from shocks, including floods. A summary of each form of capital is provided next (Campbell et al., 2019; Keating et al., 2017a):
-
Human capital refers to the education, skills, health, and well-being of household members in a community that enhance their ability to prepare for and recover from a flood. Examples include flood preparedness knowledge, personal safety skills, and education levels.
-
Social capital encompasses the social relationships, networks, and shared norms that enable communities to support each other, such as formal community emergency services and community-led flood management efforts.
-
Financial capital includes the financial resources available to households and communities, such as savings, income, access to credit, and government funding for infrastructure.
-
Physical capital consists of the built infrastructure essential for both daily life and disaster response, including roads, communication systems, and flood defences.
-
Finally, natural capital embodies the natural resources and ecosystems that provide flood protection and sustain livelihoods, such as wetlands, forests, and managed biodiversity.
The 5Cs can play a crucial role in influencing mortality and morbidity outcomes after a flood event. For example, it is expected that communities with strong levels of the 5Cs will tend to experience fewer injuries and fatalities. A previous study using FRMC data examined these effects; however, the analysis did not control for the demographic profile of the community (Chapagain et al., 2025). Physical capital was linked to fewer fatalities at the 5 % confidence level; social capital was associated with lower fatalities and injuries, with statistical significance at the 6 % level; and natural capital showed a significant negative relationship with injuries. In contrast, financial and human capital did not demonstrate statistically significant associations with flood-related fatalities or injuries in the models.
2.2 The DRM cycle stages
FRMC analysis can zoom into key phases of the DRM cycle, which is broken down into five stages (Keating et al., 2017a, b):
-
Prospective risk reduction involves taking proactive steps to prevent new risks from arising.
-
Corrective risk reduction focuses on lowering risks for people and assets already at risk.
-
Preparedness is about getting people and resources ready for possible events.
-
Response encompasses the immediate measures implemented during and right after a disaster to reduce its effects.
-
Recovery, on the other hand, includes both short- and long-term efforts aimed at supporting individuals and communities in managing the aftermath.
The DRM cycle has well-documented limitations. Scholars have criticized its continuous cyclic nature and broad phase definitions, which can hinder application across diverse urban settings and complicate its integration into climate change and resilience discourse (Rana et al., 2021). However, while acknowledging its imperfections, the DRM cycle continues to be used due to its convenience and robustness (Alexander, 2018). While debates continue on how to adapt it for more effective management – taking into account time, resources, preferences, capacities, needs, and institutional changes – its practical benefits continue to support its broad use (Baas et al., 2008). We found no study linking DRM cycle stages with mortality/morbidity outcomes.
2.3 Control variables
The following section examines the control variables used in the analysis. The prior literature identifies these factors as important in explaining variations in flood-related mortality and morbidity.
2.3.1 Gender and age composition
Research suggests that the relationship between flood-related morbidity and mortality and age and gender is relevant. For example, evidence on the gender-specific effects of floods on mortality is well-documented:
-
Globally, men generally experience higher mortality rates during flood events (Jerin et al., 2024; Petrucci, 2022). An analysis of research conducted in Europe, the United States, and Australia found that 65 % of the studies reported consistently higher fatality rates among men. The study highlights that in the United States (1996–2014), male flood fatalities consistently outnumbered female ones across all scenarios. A similar pattern was observed in parts of Europe (1980–2018), where male fatalities were generally higher, except among the elderly. The review attributes this increased male vulnerability to greater exposure to flood hazards and the higher proportion of men who operate vehicles during such events (Petrucci, 2022).
-
Morbidity effects, on the other hand, tend to stress the vulnerability of women and of specific population age groups. For instance, a study emphasizes the heightened health vulnerabilities of women during floods due to factors like polluted water and challenges in menstrual management (Jerin et al., 2024).
In contrast to gender influences, the effects of age on flood fatalities and injuries vary significantly across studies. Some research, for instance, emphasizes that older individuals are particularly prone to fatalities during and in the aftermath of floods (Ban et al., 2023; Yang et al., 2023), while there is evidence indicating that younger individuals can face a higher risk of mortality, specifically non-accidental deaths, during flood events compared to older adults (Ban et al., 2023).
In sum, the literature indicates that the relationship between flood impacts and risk, age, and gender is multifaceted and requires further attention as some studies have suggested that women's access to human, social, and financial resources can strengthen their ability to adapt to floods (Azad and Pritchard, 2023). This evidence is particularly relevant to our study, as we focus on the net effect of community 5Cs and DRM cycle stages on flood-related mortality and morbidity.
2.3.2 Urban–rural residence
Urban–rural linkages play a critical role in shaping flood-related mortality.
-
Research shows that rural areas face higher flood-related risks due to slower emergency response capabilities, lower population densities – which limit immediate assistance from bystanders – a lack of protective infrastructure such as elevated bridges, and their frequent location in headwater basins where floods develop rapidly, leaving little time for warning or evacuation. In contrast, urban areas tend to demonstrate greater resilience and a lower concentration of risk, largely due to the presence of more valuable assets, higher average incomes, and more robust housing structures (Petrucci, 2022).
-
The interdependencies between rural and urban areas are rarely considered in disaster risk frameworks. Rural areas, particularly in developing countries, depend heavily on cities for jobs, services, and information, while cities rely on rural areas for labour, food, and ecosystem services. Floods alter the flows of people, goods, finances, and information between rural and urban areas (Jamshed et al., 2019, 2020a, b, 2021).
-
In some cases, floods increase rural dependence on cities – for example, through heightened migration, financial support from urban relatives, or greater reliance on urban markets and information. In other cases, dependence may shift toward nearby rural areas when access to cities is constrained due to damaged roads or inflated prices (Jamshed et al., 2019, 2020a, b, 2021).
In summary, research suggests that while both urban and rural areas face flood risks, specific setting factors may lead to significantly differential impacts on mortality and morbidity. Further research is needed to understand the complex interplay of factors shaping flood vulnerability across different geographical contexts and population groups.
2.3.3 Flood hazard and exposure
Research indicates a strong relationship between the severity of a flood event – often measured by a flood's return period – and its health and mortality impacts. The flood return period refers to the number of years between two flood events of the same or greater magnitude (Paul and Mahmood, 2016). Studies using FRMC data show that communities hit by rare, catastrophic floods affecting large areas tend to report higher rates of injuries. There is a connection between a flood's return period and a community's preparedness; communities frequently exposed to milder recurrent floods (e.g. 1–2-year return periods) may develop adaptive behaviours and a higher preparedness level, which can reduce injuries. In contrast, infrequent but severe floods (e.g. 50- and 100+-year return periods) often overwhelm even resilient communities, leading to more serious health and mortality consequences (Campbell et al., 2019; Chapagain et al., 2025).
Also, the exposure to the flood has been found to have consequences on mortality/morbidity outcomes:
-
In Bangladesh, studies of flood-related deaths from 1972 to 2013 found that both the extent of the flooded area and the number (or proportion) of people affected had a significant impact on the death toll (Paul and Mahmood, 2016).
-
Also, population density was found to be positively correlated with the number of flood-related victims (including deaths) per unit area. This implies that in more densely populated areas, when floods occur, a higher number of people are likely to be affected and consequently face increased mortality risk (Hu et al., 2018).
In addition to flood intensity and return period, climatic variables may also act as effect modifiers that shape health outcomes following flood events. For example, certain environmental factors can significantly influence the relationship between floods and diarrheal morbidity. In an empirical study conducted in Sichuan Province, China, three effect modifiers were identified that amplify the impact of flooding on diarrheal outcomes: elevated air pressure, reduced diurnal temperature range, and higher ambient temperatures (Lan et al., 2022). Unfortunately, those variables are not available in our dataset.
The FRMC dataset offers a multifaceted view of community-level flood resilience, collected through a standardized, mixed-methods approach. Trained practitioners, often NGO staff, gather data using household surveys, community focus group discussions, key informant interviews, and secondary sources such as census data and government reports (Campbell et al., 2019; Hochrainer-Stigler et al., 2020, 2021; Keating et al., 2014, 2017a, 2025; Laurien et al., 2020).
The FRMC data capture two main phases: baseline (BL) and post-event (PE). While the framework includes an end line (EL) phase, it is not used in this study and is therefore excluded from the analysis.
-
Baseline data (BL) provide a pre-flood snapshot of a community's resilience across 5Cs (human, social, physical, financial, and natural) and its capacity across disaster risk management (DRM) cycle stages – corrective and prospective risk reduction, preparedness, response, and recovery. Variables are scored on a scale from A (best practice) to D (significantly below standard), with numerical equivalents (A = 100, B = 67, C = 33, D = 0) used for analysis.
-
Post-event data (PE) are collected after a flood and measure actual outcomes, including death counts, illness-related mortality within 3 months post-flood, and injuries. They also capture flood exposure (proportion of the community affected) and the flood return period.
This study focuses on 66 riverine flood-prone communities across seven developing countries, each of which experienced a flood event following baseline data collection. Table 1 presents these communities by country. Post-event data collection occurred between 2019 and 2023. While precise flood dates are unavailable, the PE data were gathered exclusively following confirmed flood events.
Table 1Distribution of the communities affected by floods by country.
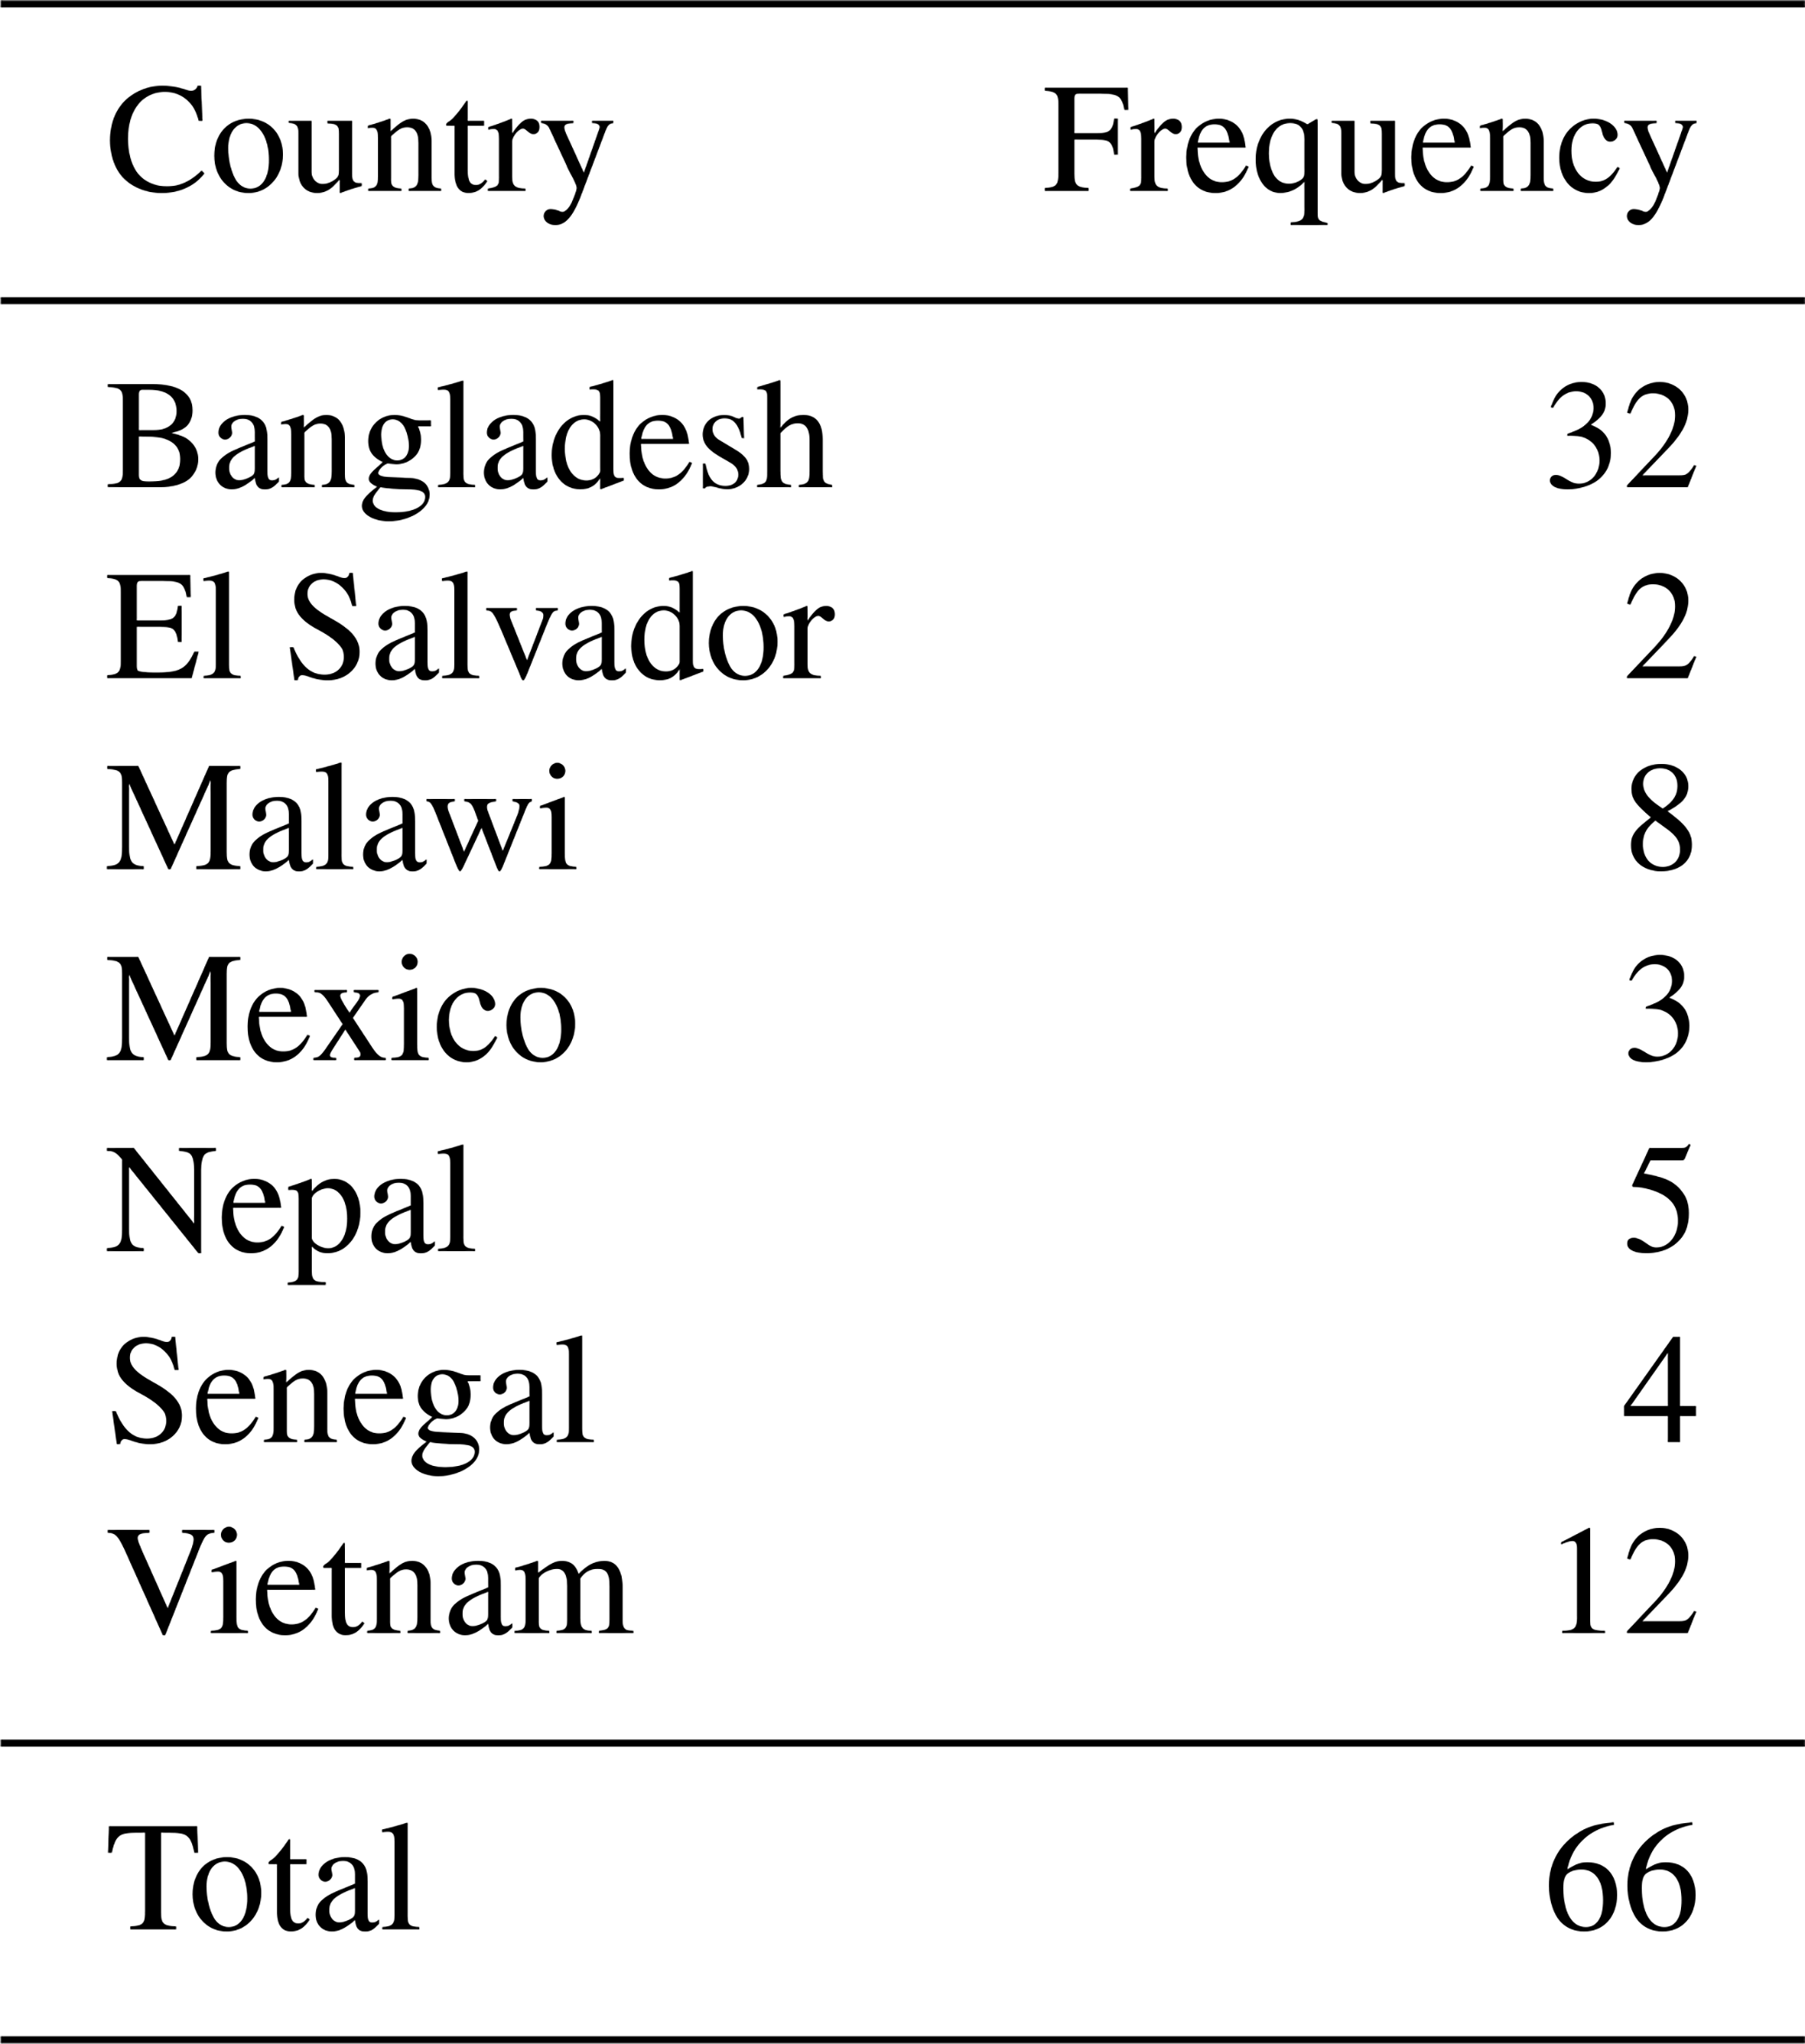
Source: FRMC.
Table 2Variables according to the FRMC five forms of capital.
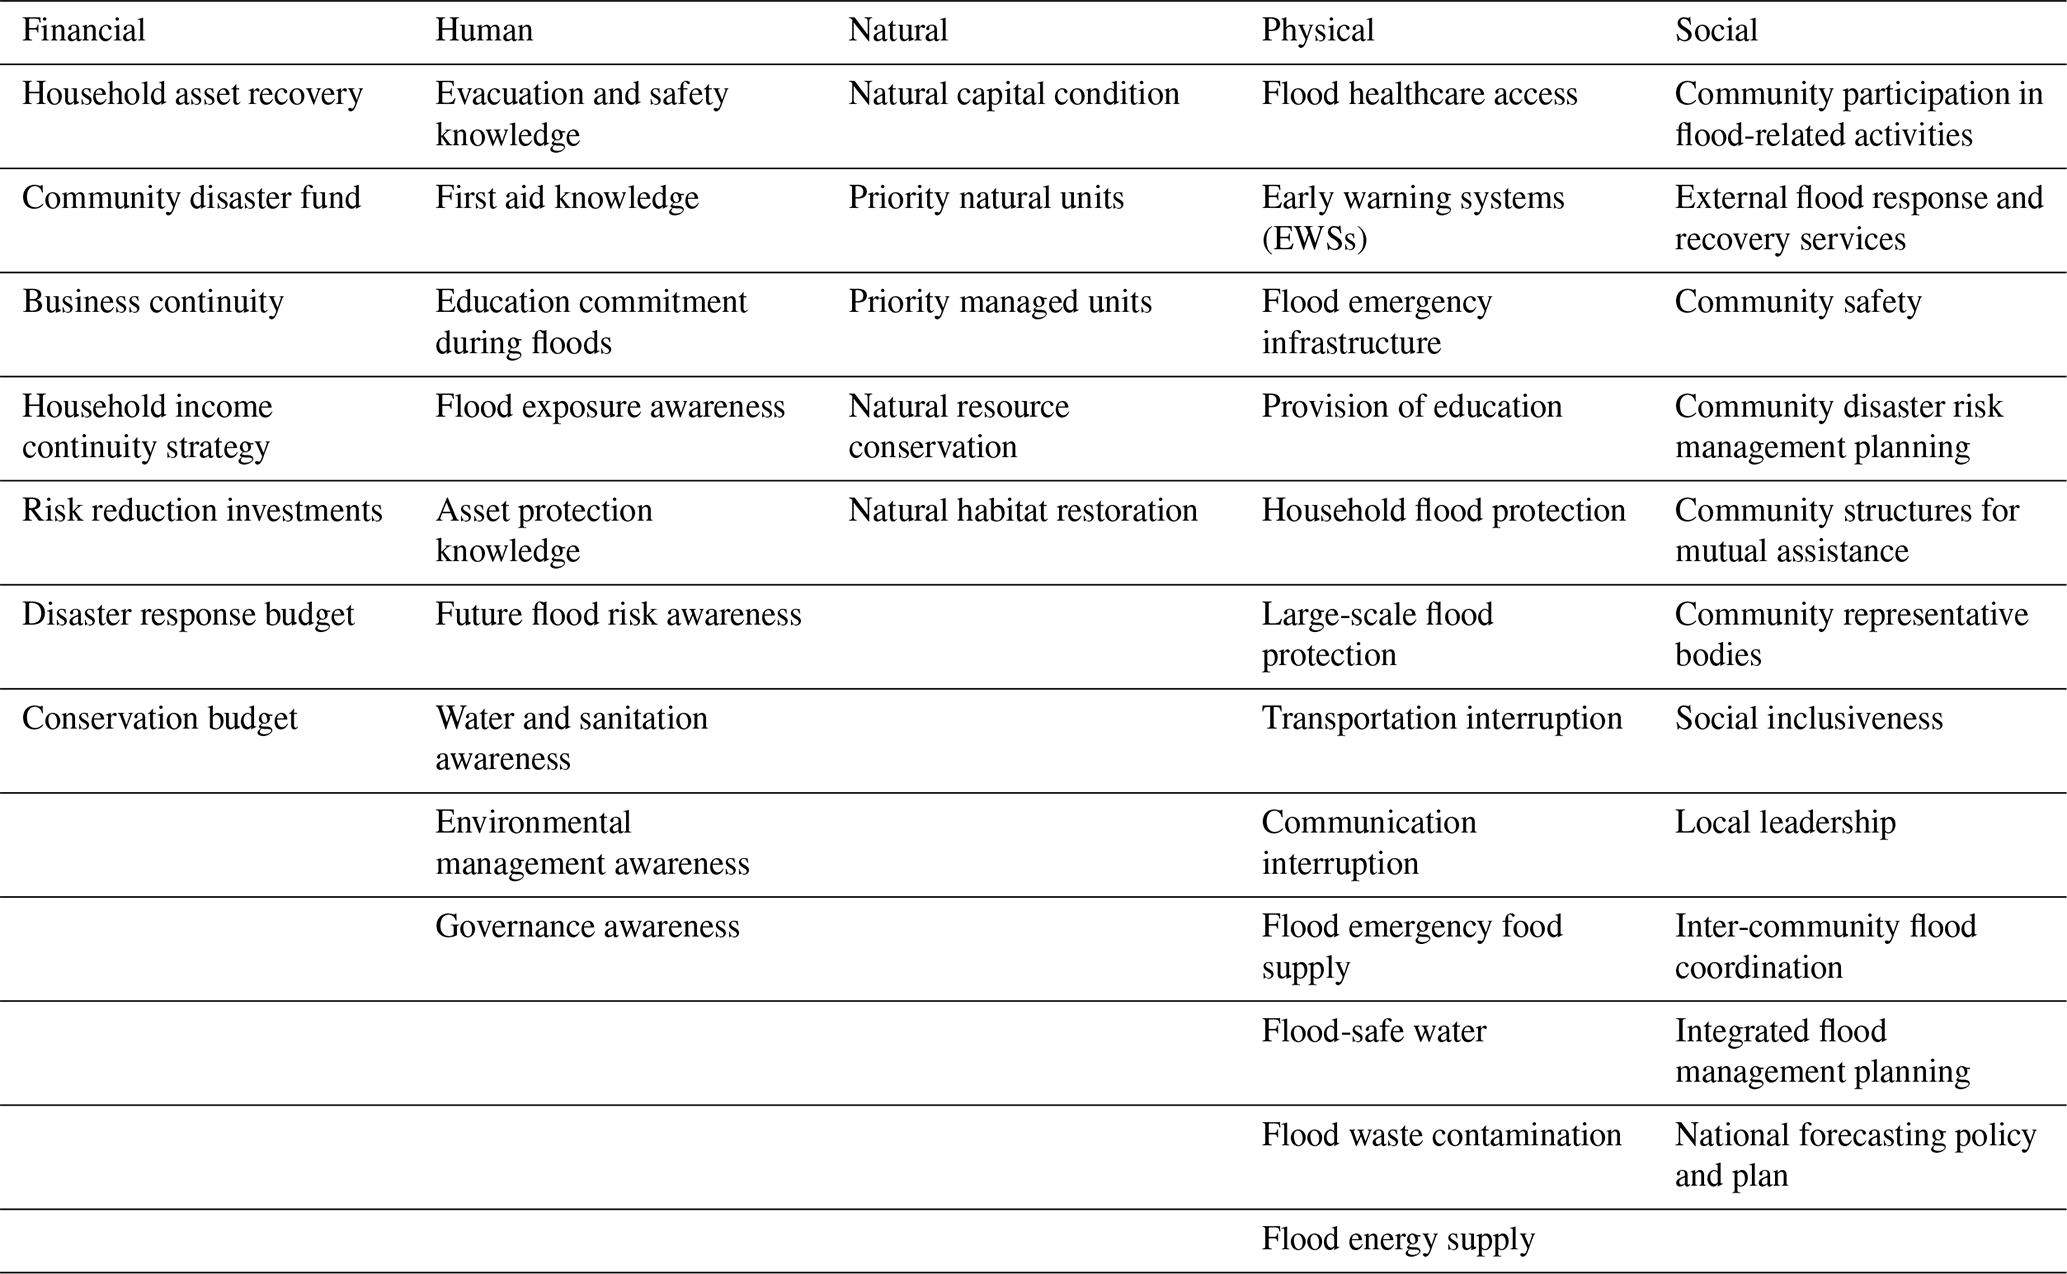
Source: FRMC.
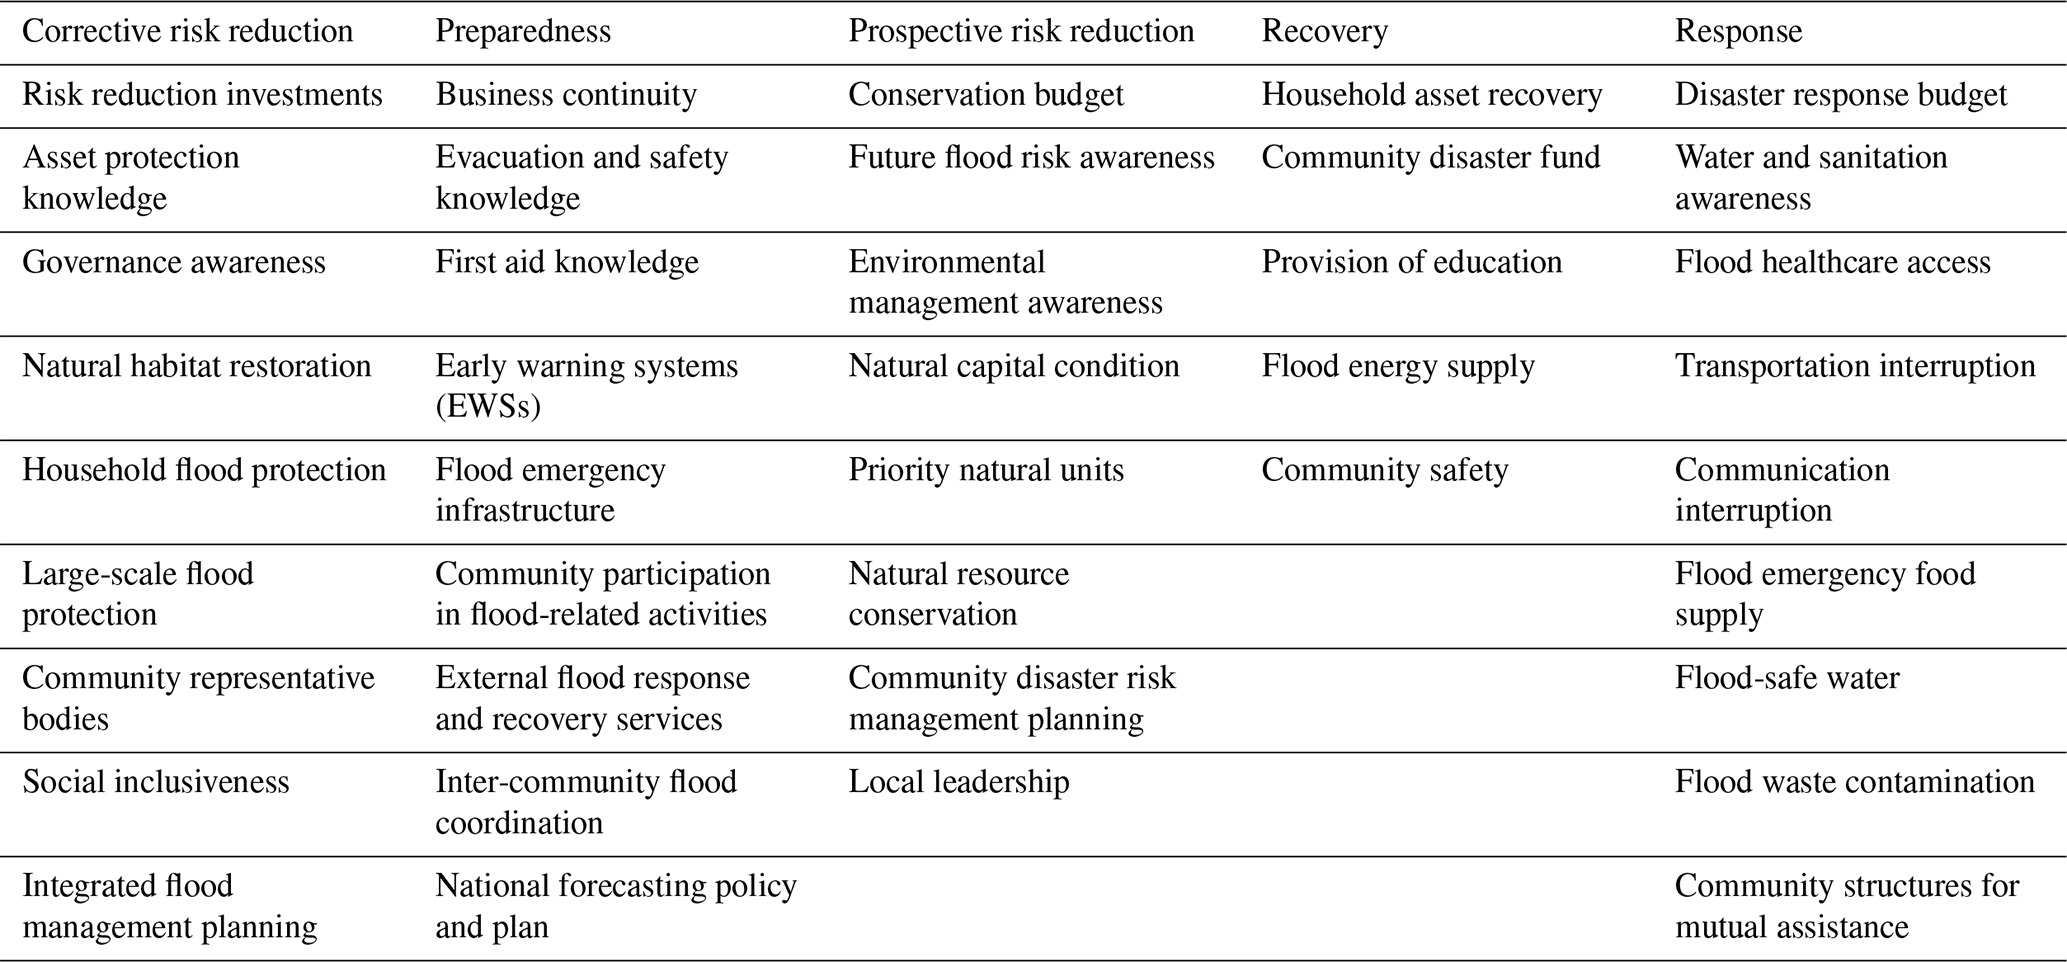
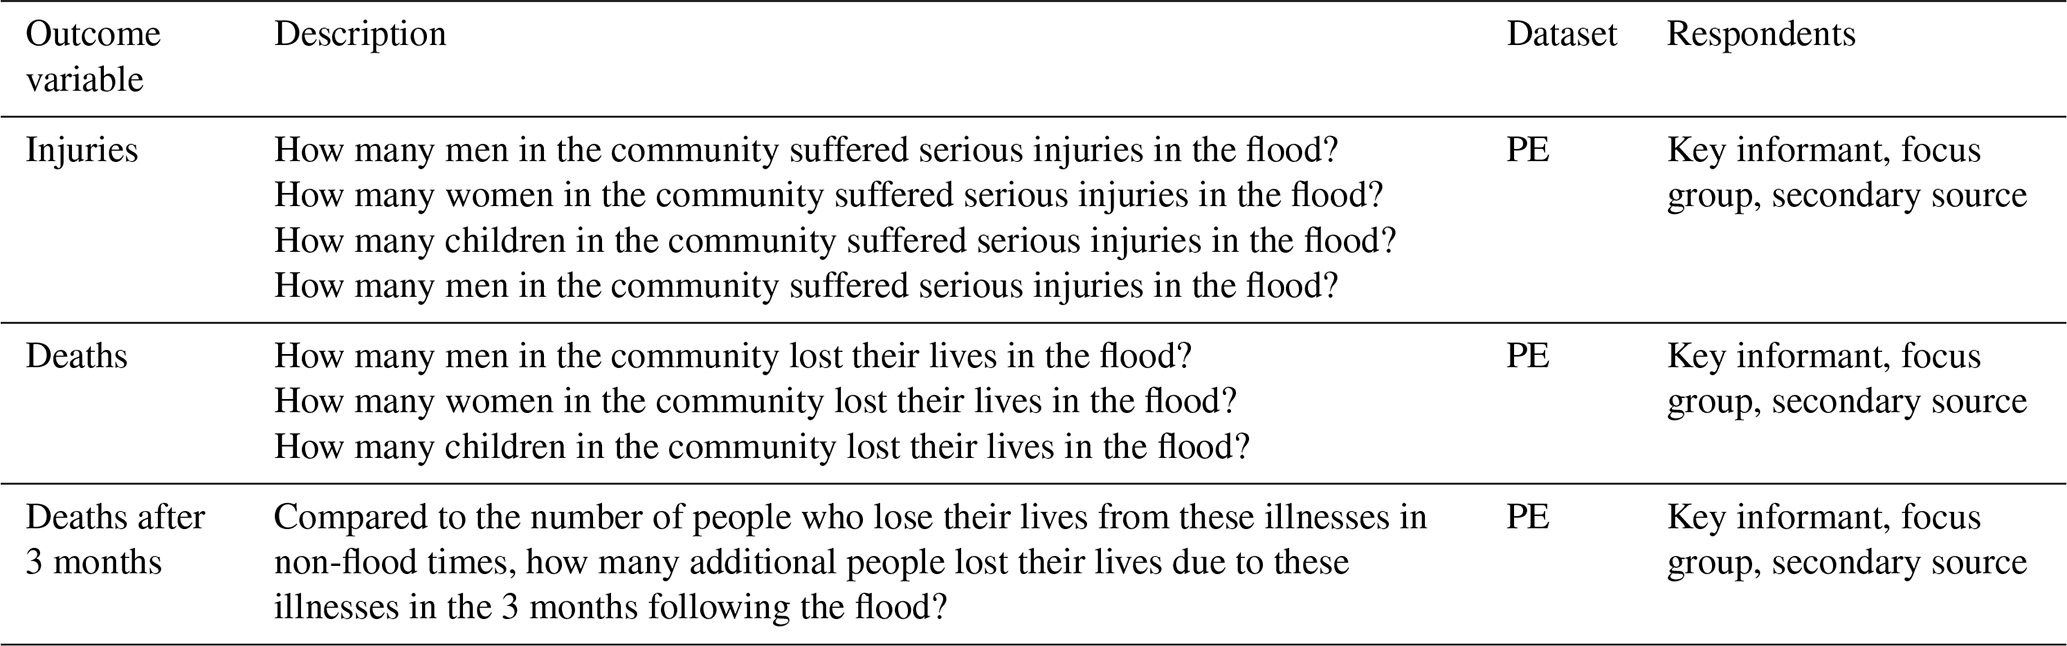
Table 5Control variables.
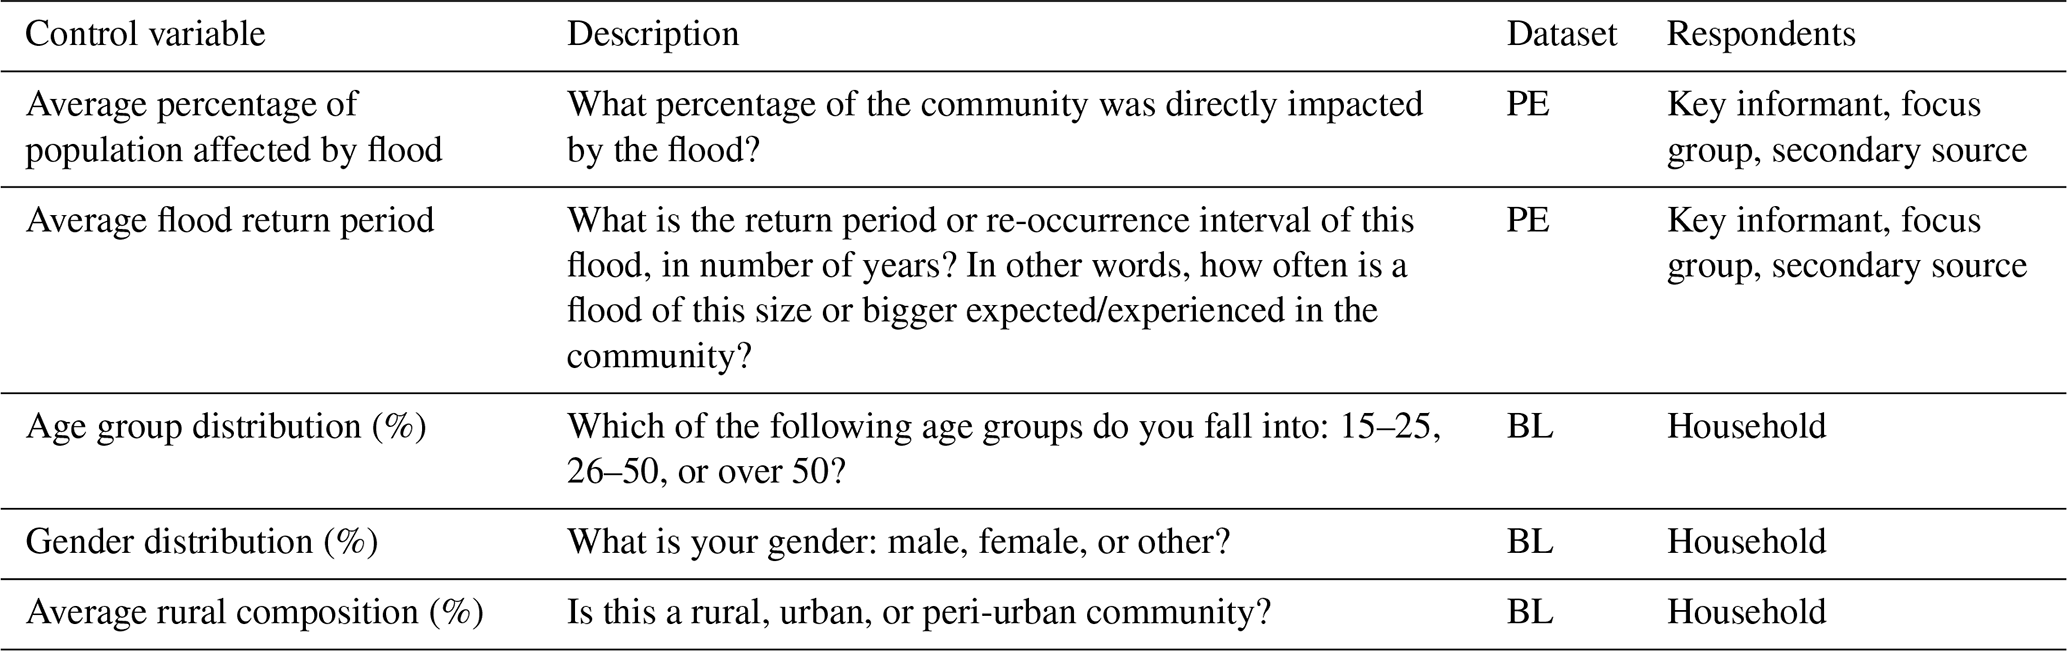
Source: FRMC. PE: post-event survey; BL: baseline survey.
We now provide a detailed list of FRMC variables included in the analysis. Indicators for each of the 5Cs are presented in Table 2, while those related to the DRM stages are shown in Table 3. Table 4 provides the outcome variables (mortality and morbidity), and Table 5 provides the control variables (demographics and flood hazard/exposure). In this analysis, variables gathered from different respondents (key informants, focus groups, and secondary sources) were averaged to produce a single response for each community. Household-level variables were also aggregated to the community level by averaging. One limitation is that demographic variables (age, gender, and urban–rural composition) reflect only the respondent's information rather than that of all household members. Consequently, our approach provides an approximate demographic profile of each community.
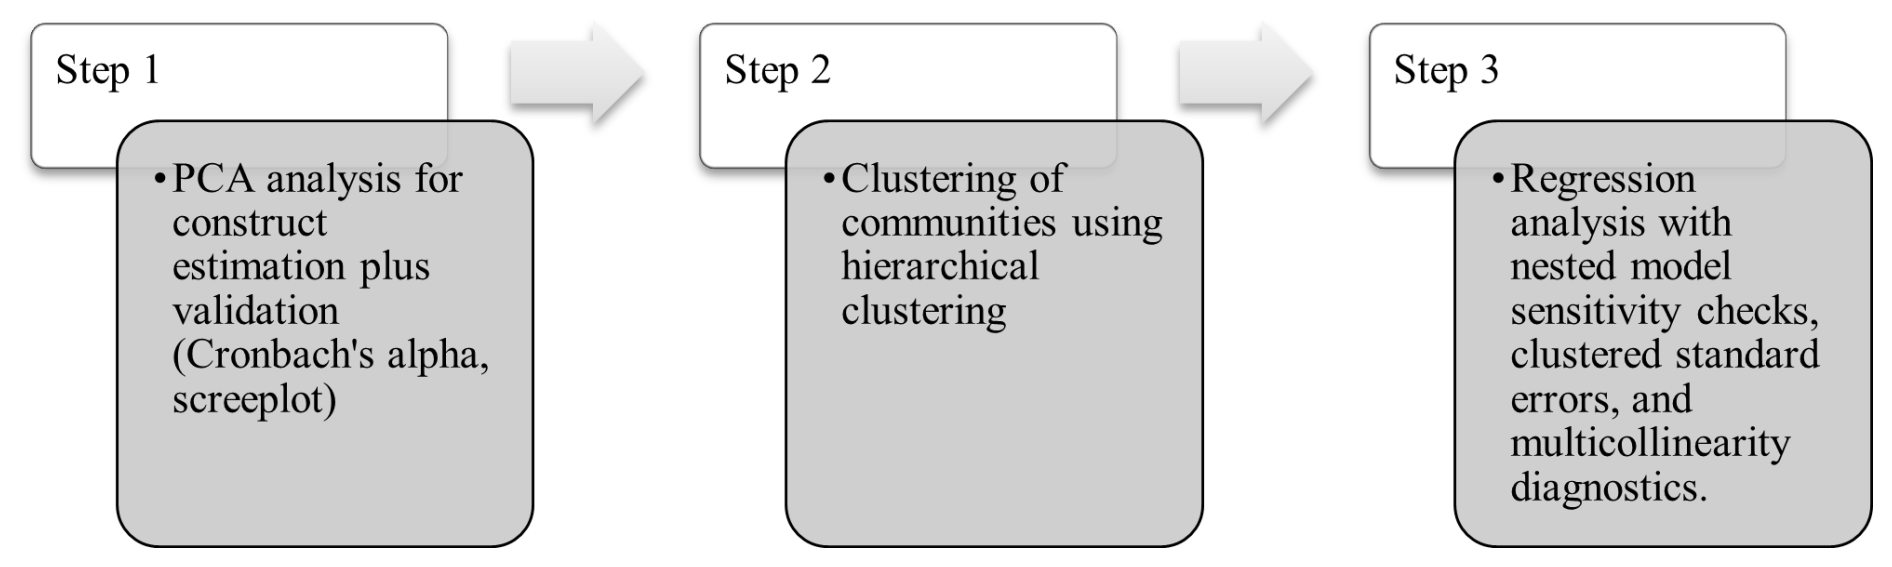
This section outlines the methods used in this study. First, we describe how the indicators for the 5Cs and the DRM cycle stages were constructed. Next, we outline the procedures used to cluster communities into distinct profiles, following approaches adopted in previous FRMC studies. Finally, we present the steps taken for the regression adjustment. A flowchart of the methodology is provided in Fig. 1.
4.1 Principal component analysis (PCA) of the 5Cs and DRM cycle stages
To estimate the 5Cs and the DRM cycle stages, we use a latent construct approach. PCA is conducted to derive a single construct for each of the 5Cs – social, physical, natural, human, and financial – as well as along each of the phases of the DRM cycle: prospective risk reduction, corrective risk reduction, crisis preparedness, response, and recovery. Components are weighted by estimated population (households multiplied by average household size) to account for varying community scales. Validation of these constructs starts with decomposing the correlation matrix into eigenvalues and eigenvectors, and a scree plot helped determine the number of factors to retain. We then calculate Cronbach's alpha coefficients (Tables A1 and A2 in the Appendix) to ensure they meet the acceptable threshold of 0.7. All DRM stages except prospective risk reduction and recovery, which were close to 0.6, met this criterion. Histograms of the constructs (5Cs and DRM cycles; Figs. A1 and A2), as well as their corresponding scree plots (Figs. A3 and A4), are included in the Appendix. Most indicators display a strong model fit, a key requirement for the validity of the analysis.
4.2 Community clusters
A study using the FRMC framework has emphasized the importance of clustering communities to better understand how resilience changes over time (Chapagain et al., 2024). Using hierarchical clustering methods, the study identifies five distinct community clusters based on the five capital scores. We now present the characteristics of the clusters calculated according to the key independent variables: 5Cs and DRM cycle stages.
4.2.1 5Cs
A summary of the characteristics of the clusters is as follows. Table 6 presents the distribution of the communities across the clusters. We group the 66 communities which experienced a flood event into five resilience clusters. No community affected by flood was found in Cluster 5. Figure A5 in the Appendix presents the average score of the 5Cs by cluster in the baseline survey.
Table 6Distribution of the 66 communities that have experienced flood according to 5Cs.
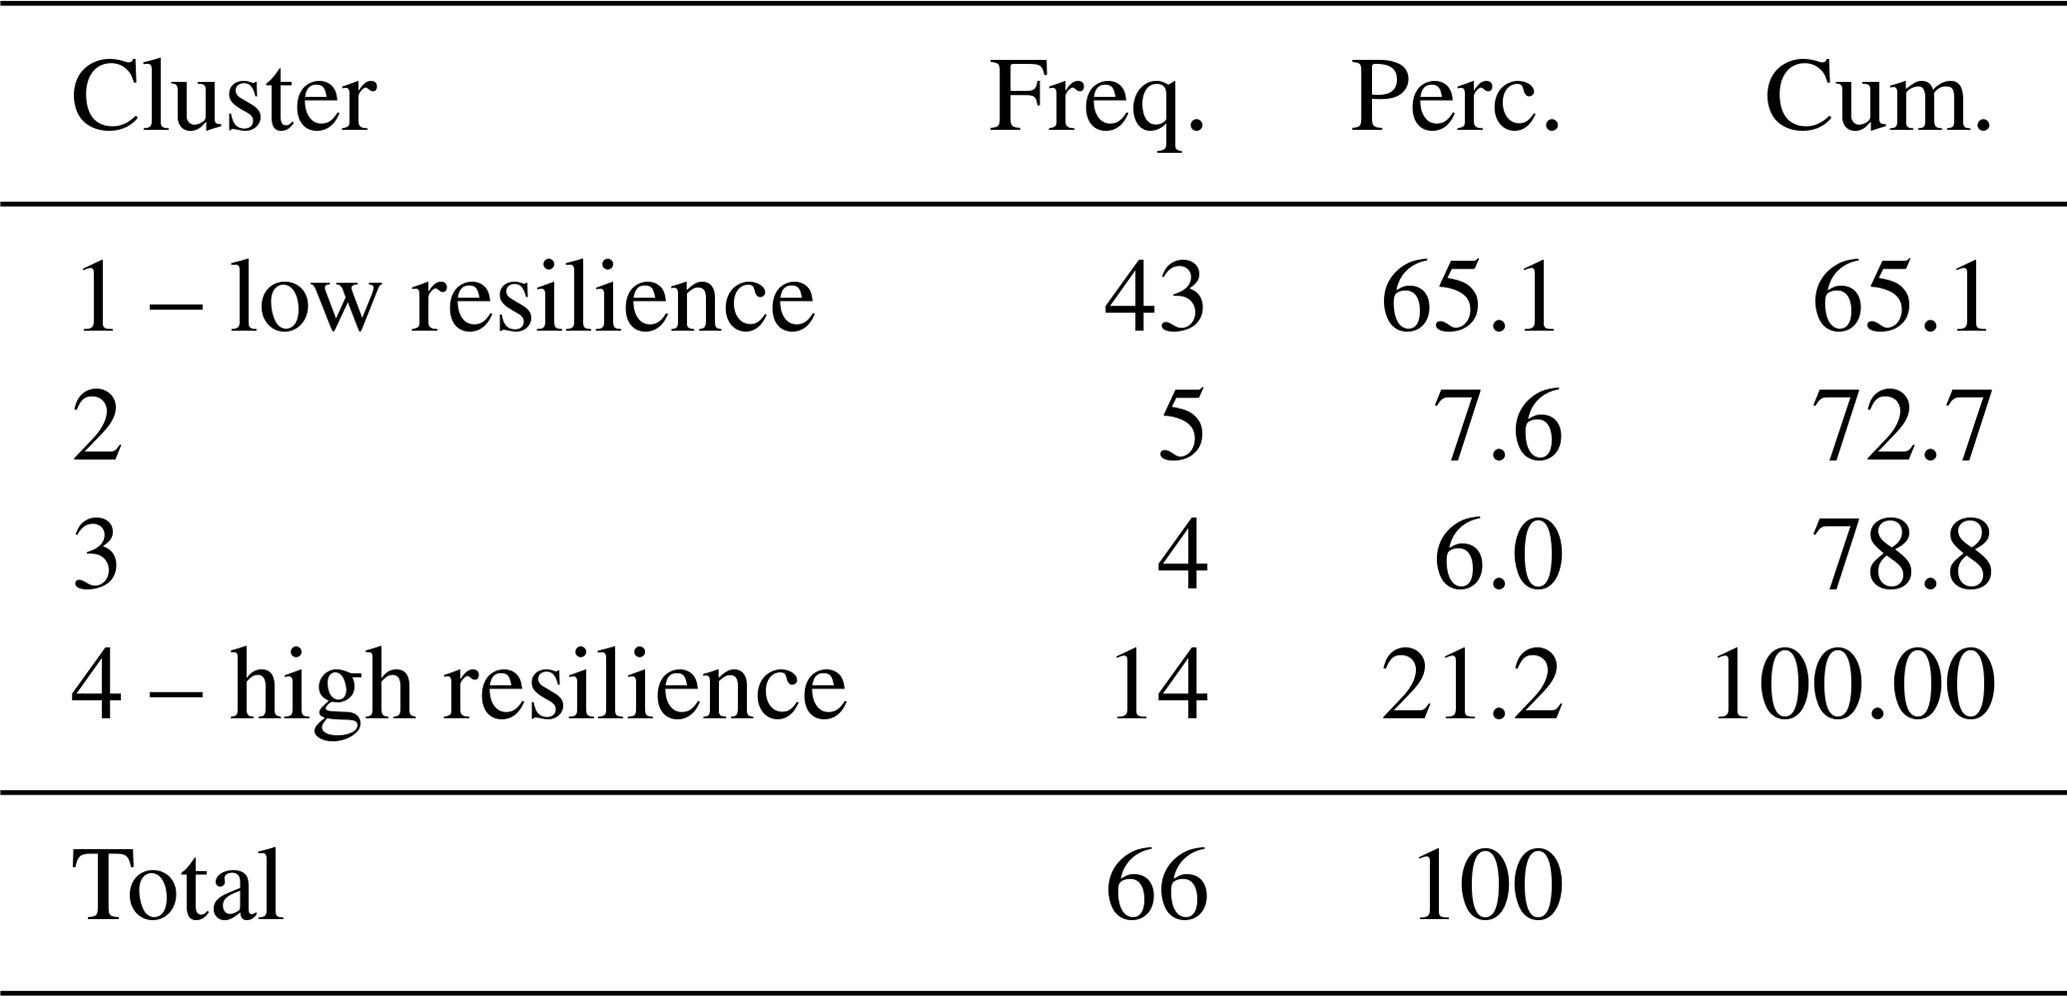
Source: FRMC.
A description of the clusters is as follows:
-
Cluster 1 features the lowest resilience across all 5Cs.
-
Cluster 2 exhibits marginally stronger performance in financial, human, and physical capital compared to natural and social capital.
-
Cluster 3 presents relatively high human, natural, and social capital scores but lower financial and physical capital scores.
-
Cluster 4 demonstrates generally higher average capital scores compared to Clusters 1–3, particularly in human, natural, and social capital.
4.2.2 DRM cycle stages
We applied the same clustering methodology approach to classify the communities based on their DRM cycle performance, maintaining consistency with our earlier analysis approach. The dendrogram reveals two distinct clusters according to DRM cycle stages. Figure A6 in the Appendix presents the average score of the five stages by cluster in the baseline survey. As done for the resilience clusters, we grouped the 66 communities which experienced a flood event into the two DRM cycle clusters. Table 7 presents the distribution of the communities across the clusters.
Table 7Distribution of the 66 communities that have experienced flood according to DRM cycle clusters.
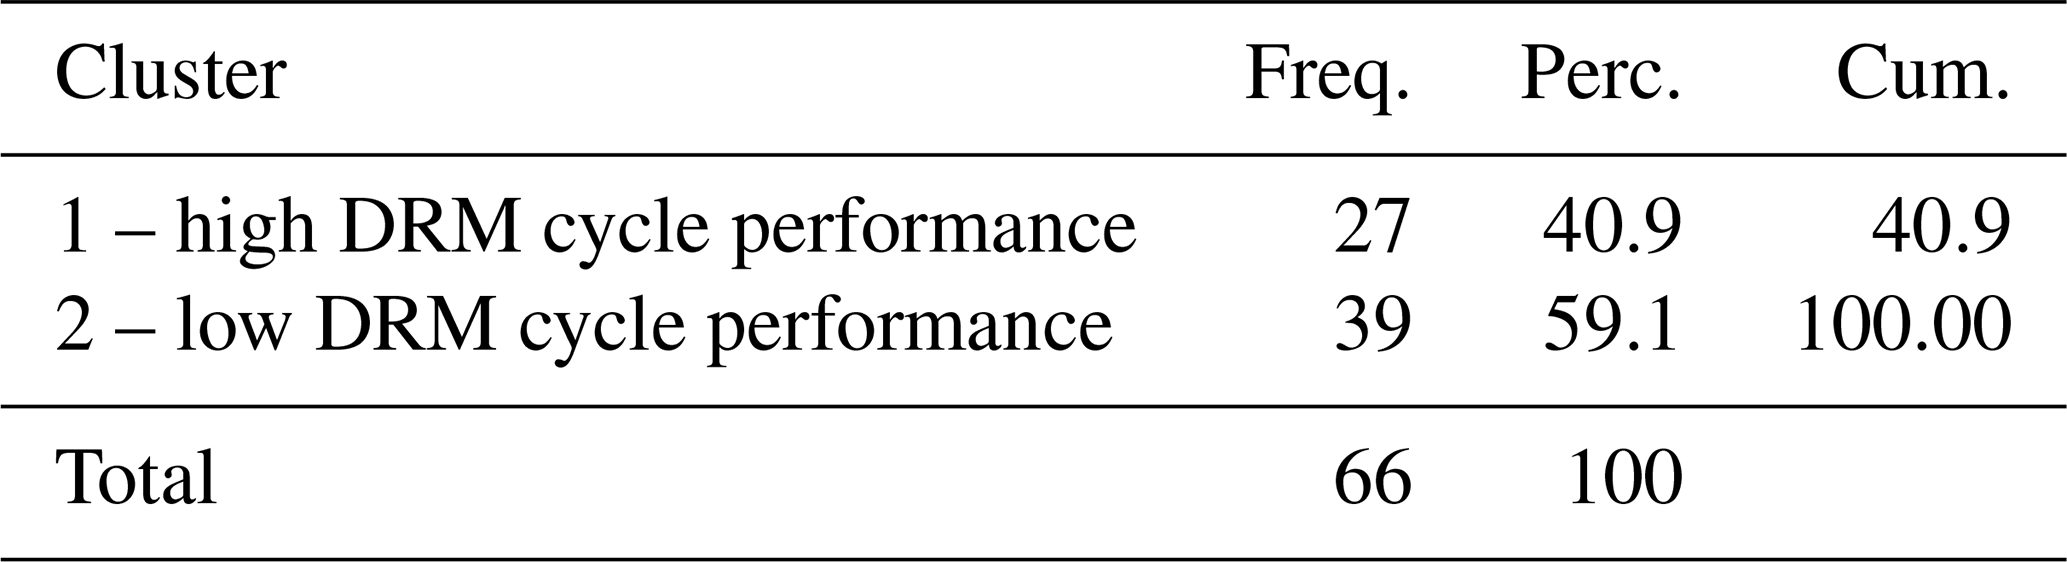
Source: FRMC.
A description of the clusters is provided:
-
Cluster 1 demonstrates strong capabilities across most dimensions of the DRM cycle. These communities exhibit above-average preparedness. Their protective risk reduction and their recovery capabilities are notably strong.
-
Cluster 2 represents significant weaknesses across all measured DRM stages. These communities show poor response and recovery capabilities. Their preparedness scores are substantially below average.
4.3 Regression adjustment
To estimate the effect of the 5Cs and DRM cycle stages on morbidity and mortality outcomes, we use a quasi-experimental research design based on regression adjustment. This method is a robust approach for identifying causal effects in observational data by addressing the challenge of confounding. While the FRMC dataset includes a longitudinal component, for the post-event (PE) data, we only have one time point available. This necessitates controlling for baseline levels of 5Cs, DRM cycle stages, demographics, and flood exposure/hazard.
Regression adjustment allows us to isolate the relationship of interest by accounting for observable characteristics that could otherwise bias the estimated treatment effects. Properly specified regression models reduce systematic differences between units, thereby approximating ceteris paribus conditions and enhancing the validity of the causal inference.
To ensure robustness, post-estimation diagnostics were conducted, including tests for overall model significance (R2) and comparison of Akaike information criterion (AIC) and Bayesian information criterion (BIC) values to evaluate model fit. Ordinary least squares (OLS) regression was used as the primary method, incorporating nested models to assess how additional predictors contributed to the model's explanatory power. Finally, given the differing scales of predictors – such as the average return period (1 to 35) and the percentage of female household respondents (0 to 1) – all predictors were standardized to enable meaningful comparison and interpretation of their relative importance.
We use clustered standard errors to address the fact that observations within the same cluster might be like each other in terms of both resilience and DRM cycle levels. As we have a small number of clusters – 5 for resilience and 2 for the DRM cycle – we employ the wild bootstrap approach. The wild bootstrap is primarily used to obtain more reliable inference – such as p values and confidence intervals – by addressing issues like heteroskedasticity or a small number of clusters.
Due to the small sample size, a significance level of 10 % was considered relevant. We tested different specifications to analyse the sensitivity of the parameters to the inclusion of control variables, but the preferred model for the analysis is the full model (with all controls). There is a vivid discussion among statisticians and econometricians on the role of control variables and whether they should be excluded if there is not statistical significance. This paper takes the stand that considering the control variables is relevant because they have theoretical meaning, and, hence, even a non-significant result is a relevant result. Besides, they help reduce omitted-variable bias and improve causal inference. Another important issue for modelling is that, if the 5Cs or if the five DRM cycle stages are highly correlated, it can cause multicollinearity, making it difficult to determine their individual effects. High variance inflation factors (VIFs) would indicate if this is an issue.
Our analysis revealed distinct patterns in the relationships between the 5Cs, DRM cycle stages, and the morbidity and mortality outcomes, controlling for demographic characteristics and flood exposure/hazard. But let's first begin with a description of the data.
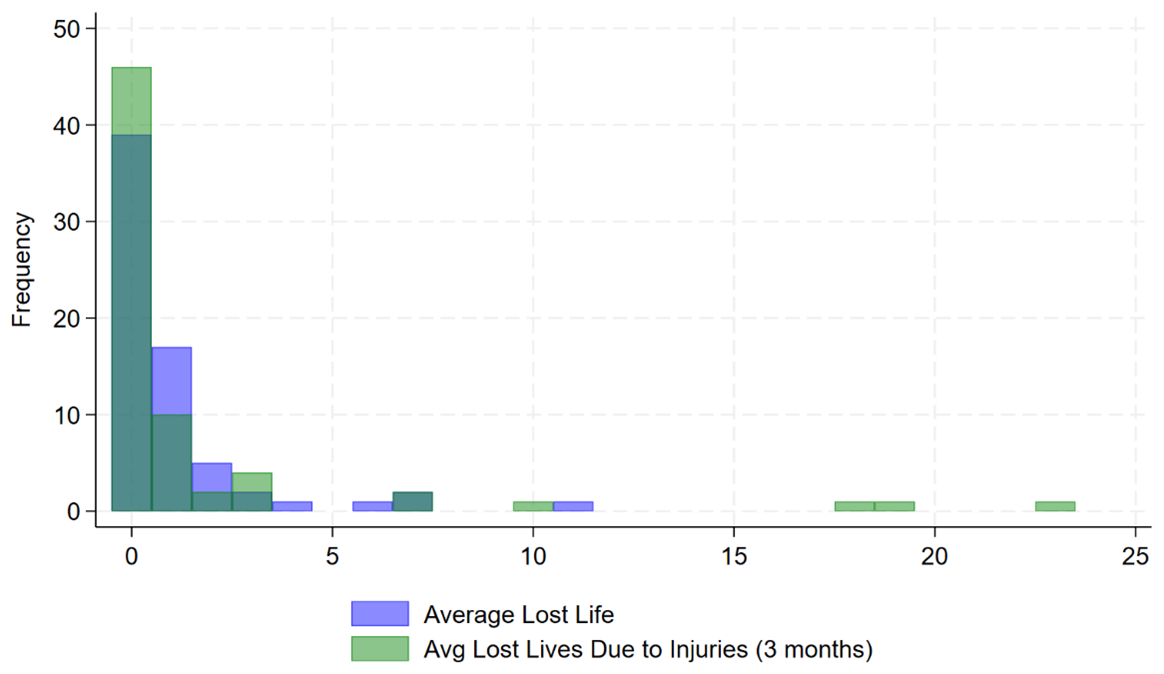
Figure 2Average number of deaths (immediate and delayed) reported in flood-affected communities.
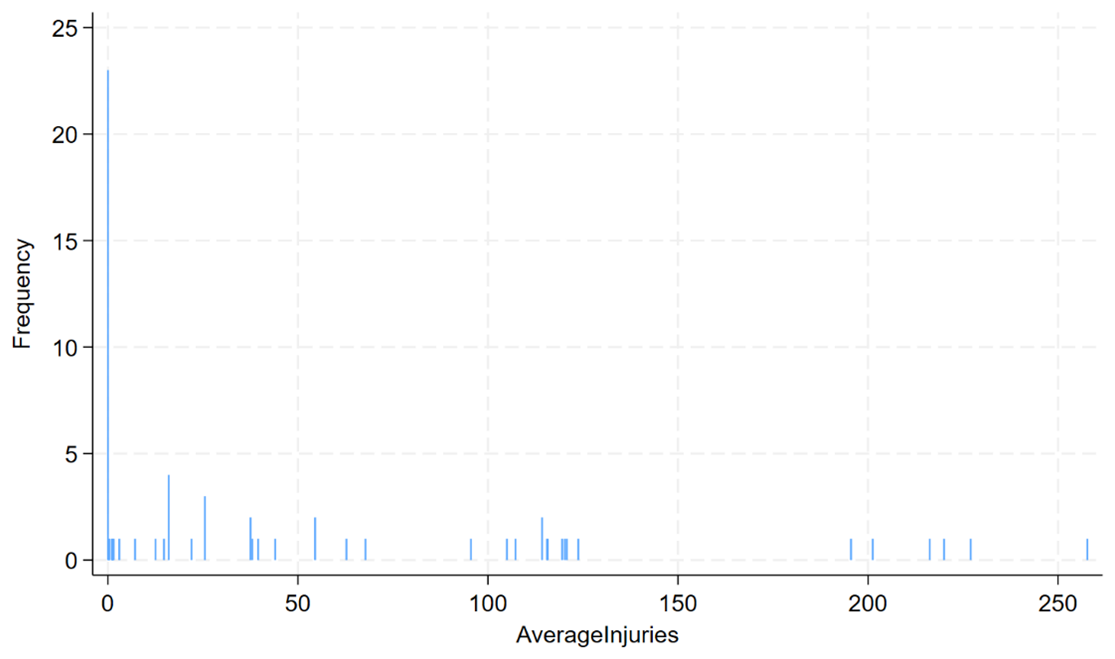
The distribution of the dependent variables – average injuries due to floods, average deaths, and average lives lost to illnesses within 3 months – is shown in histograms in Figs. 2 and 3. Notably, all three variables exhibit a high number of zeros, and the death counts are characterized by a low number of cases (maximum of 11 for immediate mortality and 23 for delayed mortality).
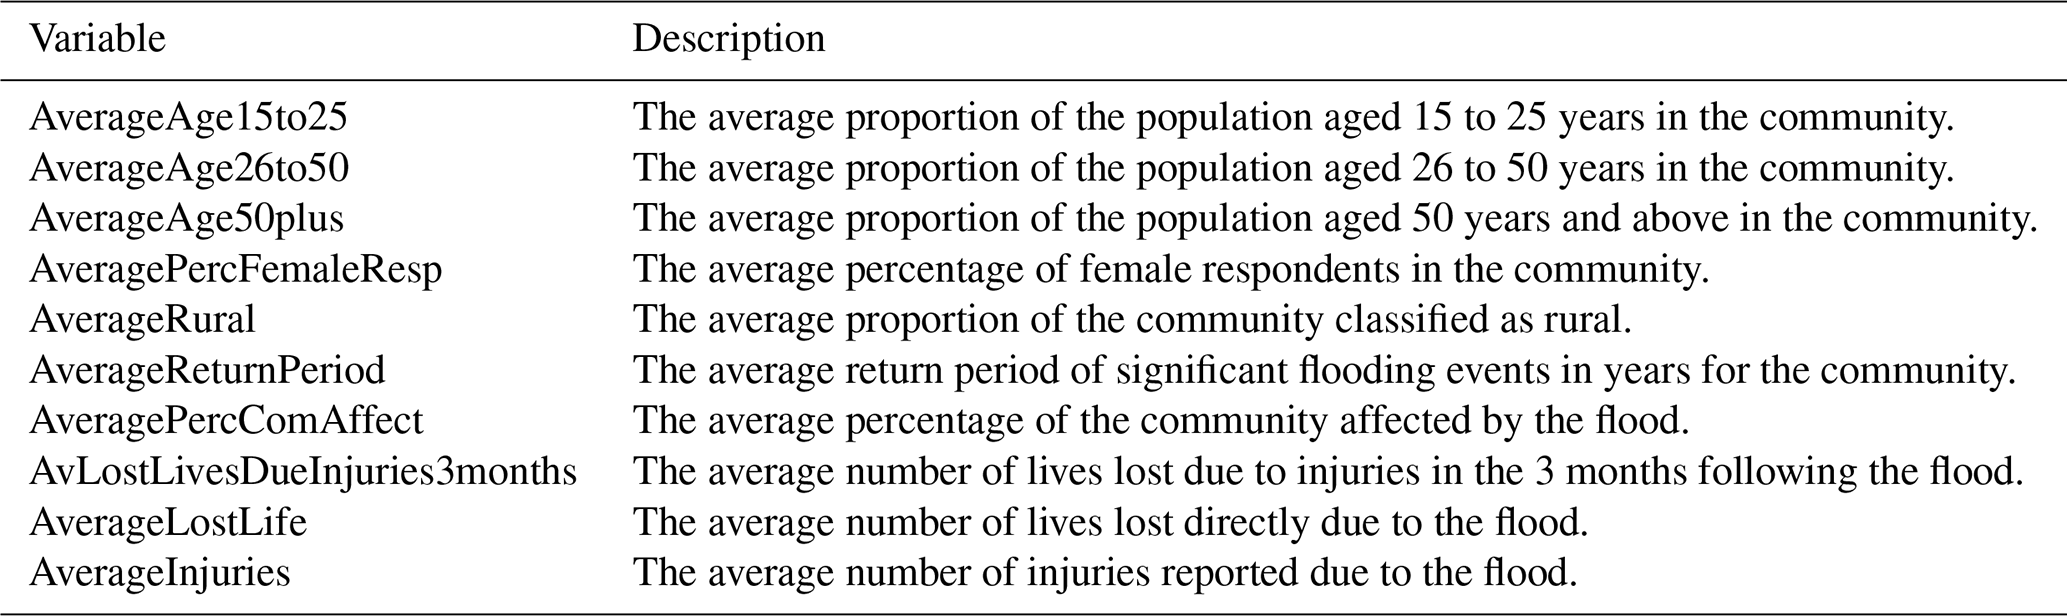
Table 9Descriptive statistics for the control and dependent variables.
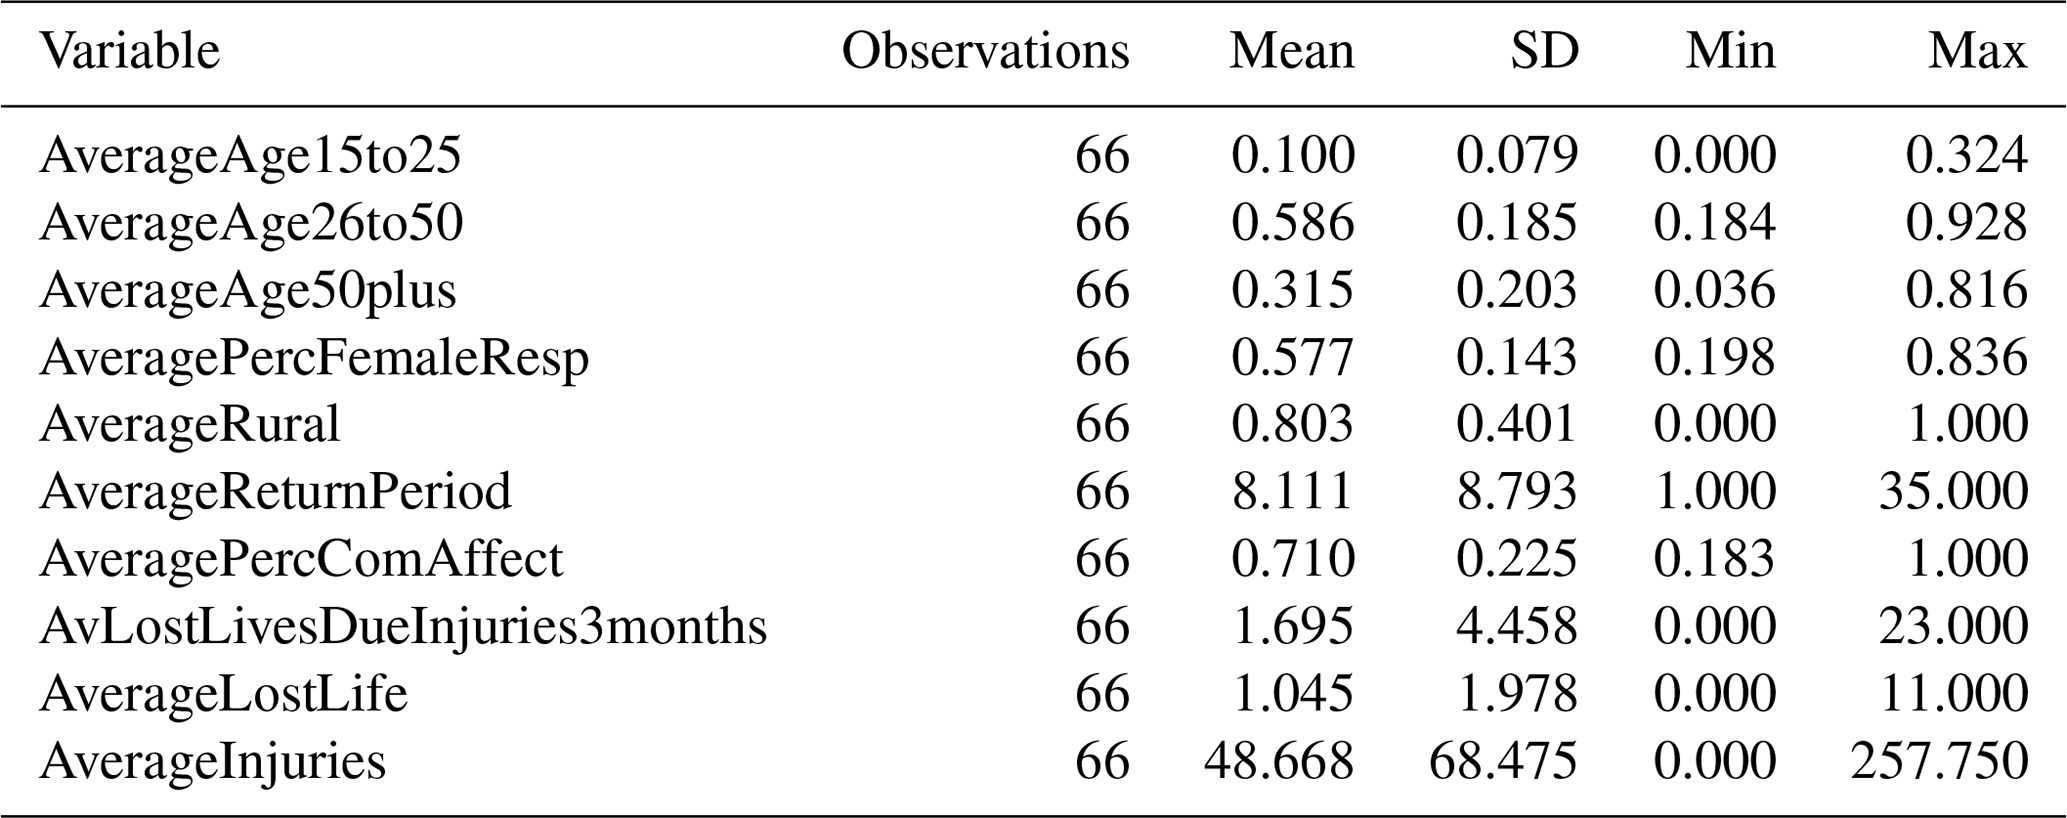
Source: FRMC.
To facilitate interpretation, we use variable labels for statistics and regression results. We provide in Table 8 a description of the variables and in Table 9 the descriptive statistics.
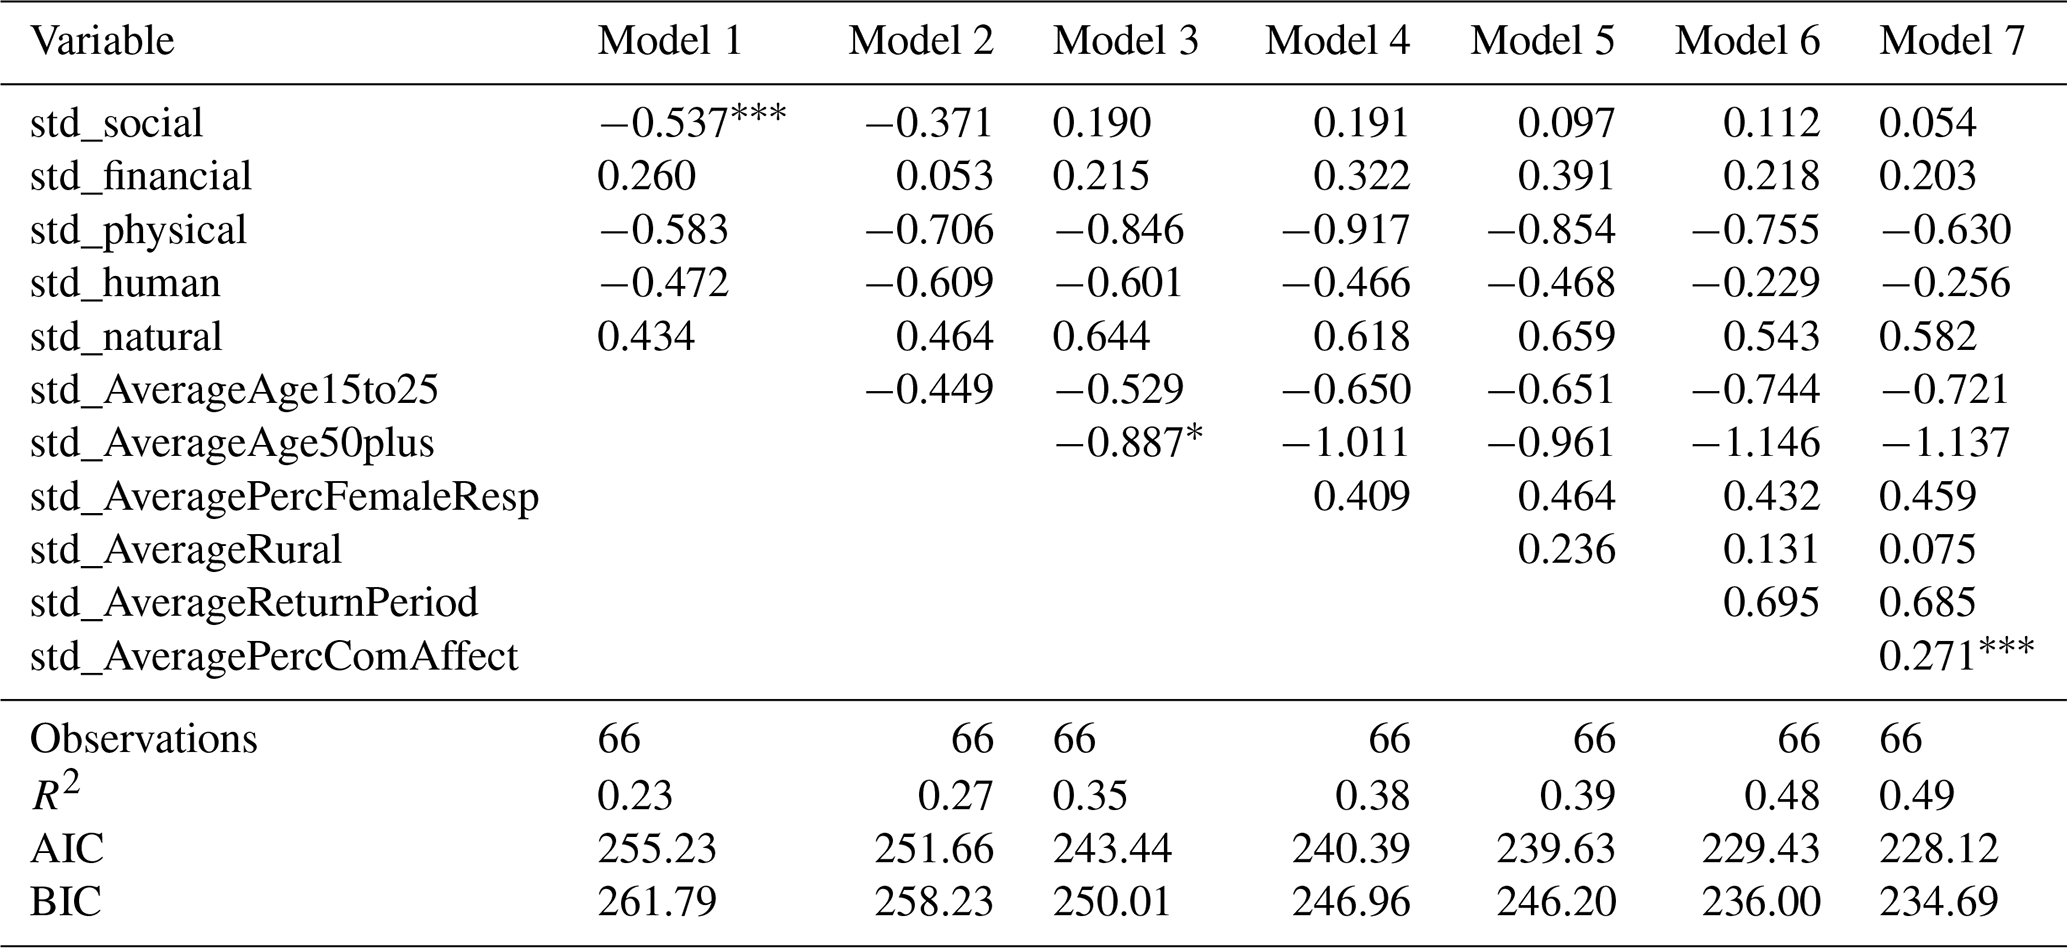
The regression results for the 66 communities that experienced a flood while controlling for demographics and flood exposure and hazard are presented next. The nested models (testing for the inclusion of each control variable) are presented in the Appendix (Tables A3–A8). Overall, the full model also displayed better fit according to all specifications (R2 and AIC/BIC). The results for the full model of the VIFs for the independent variables specified in the linear regression model show that multicollinearity is present but not extreme, with mean a VIF of 2.41. A mean VIF below 5 suggests that overall, a model is not suffering from severe multicollinearity.
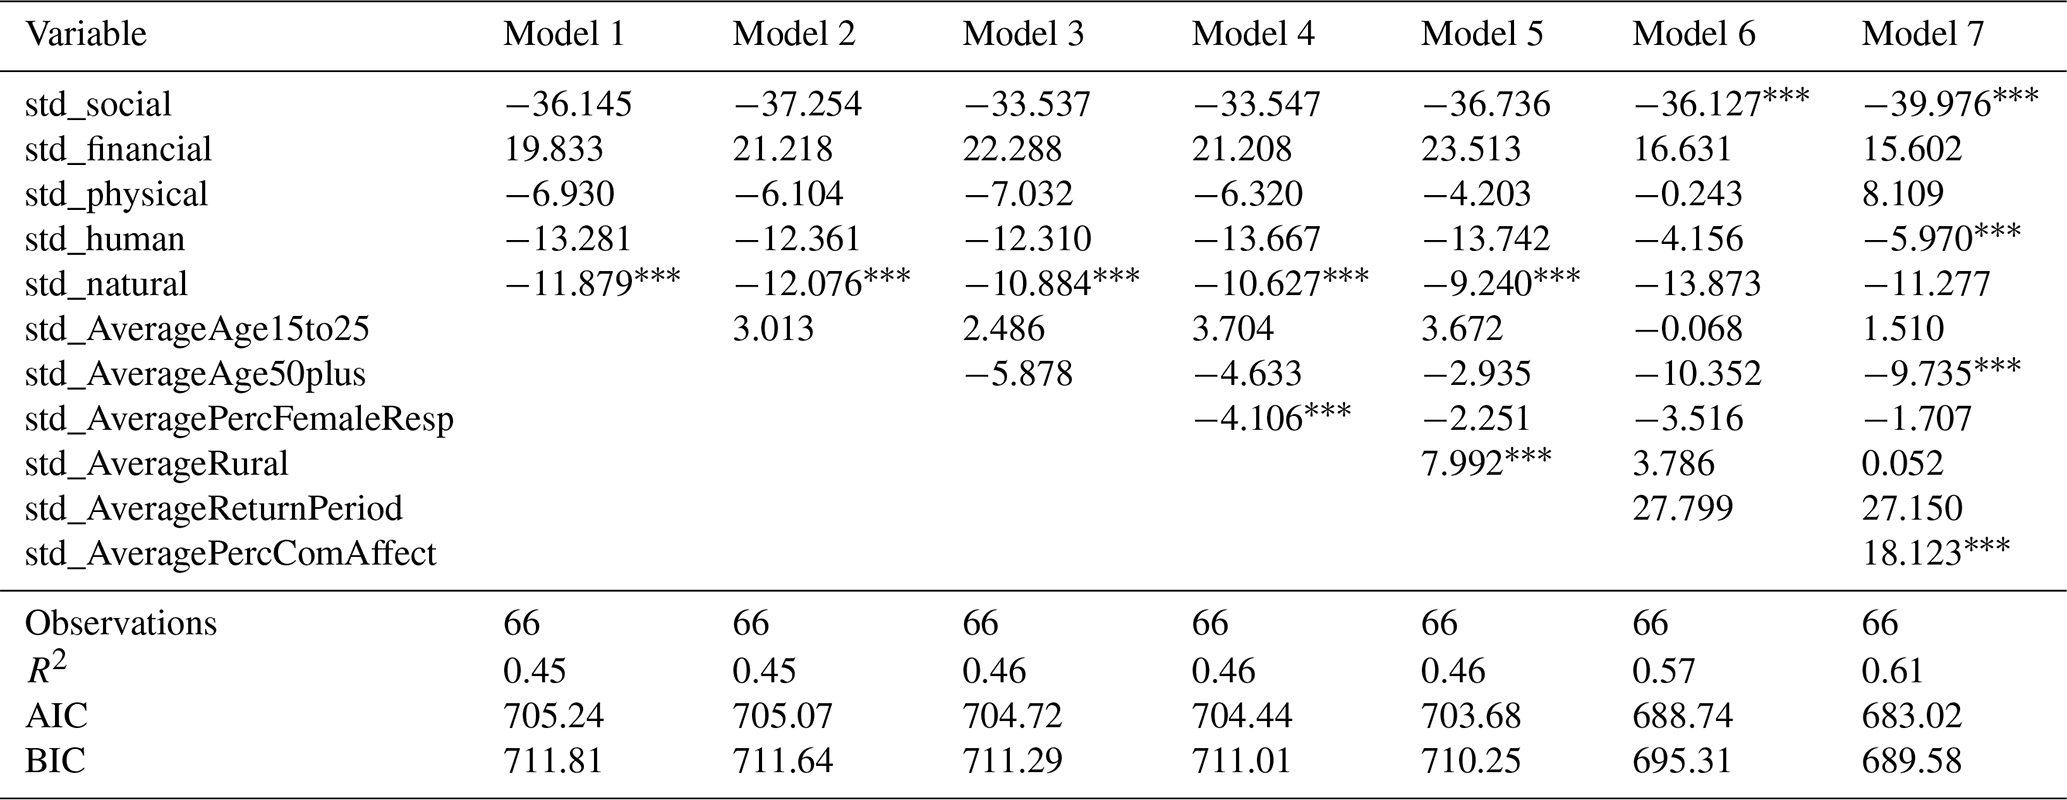
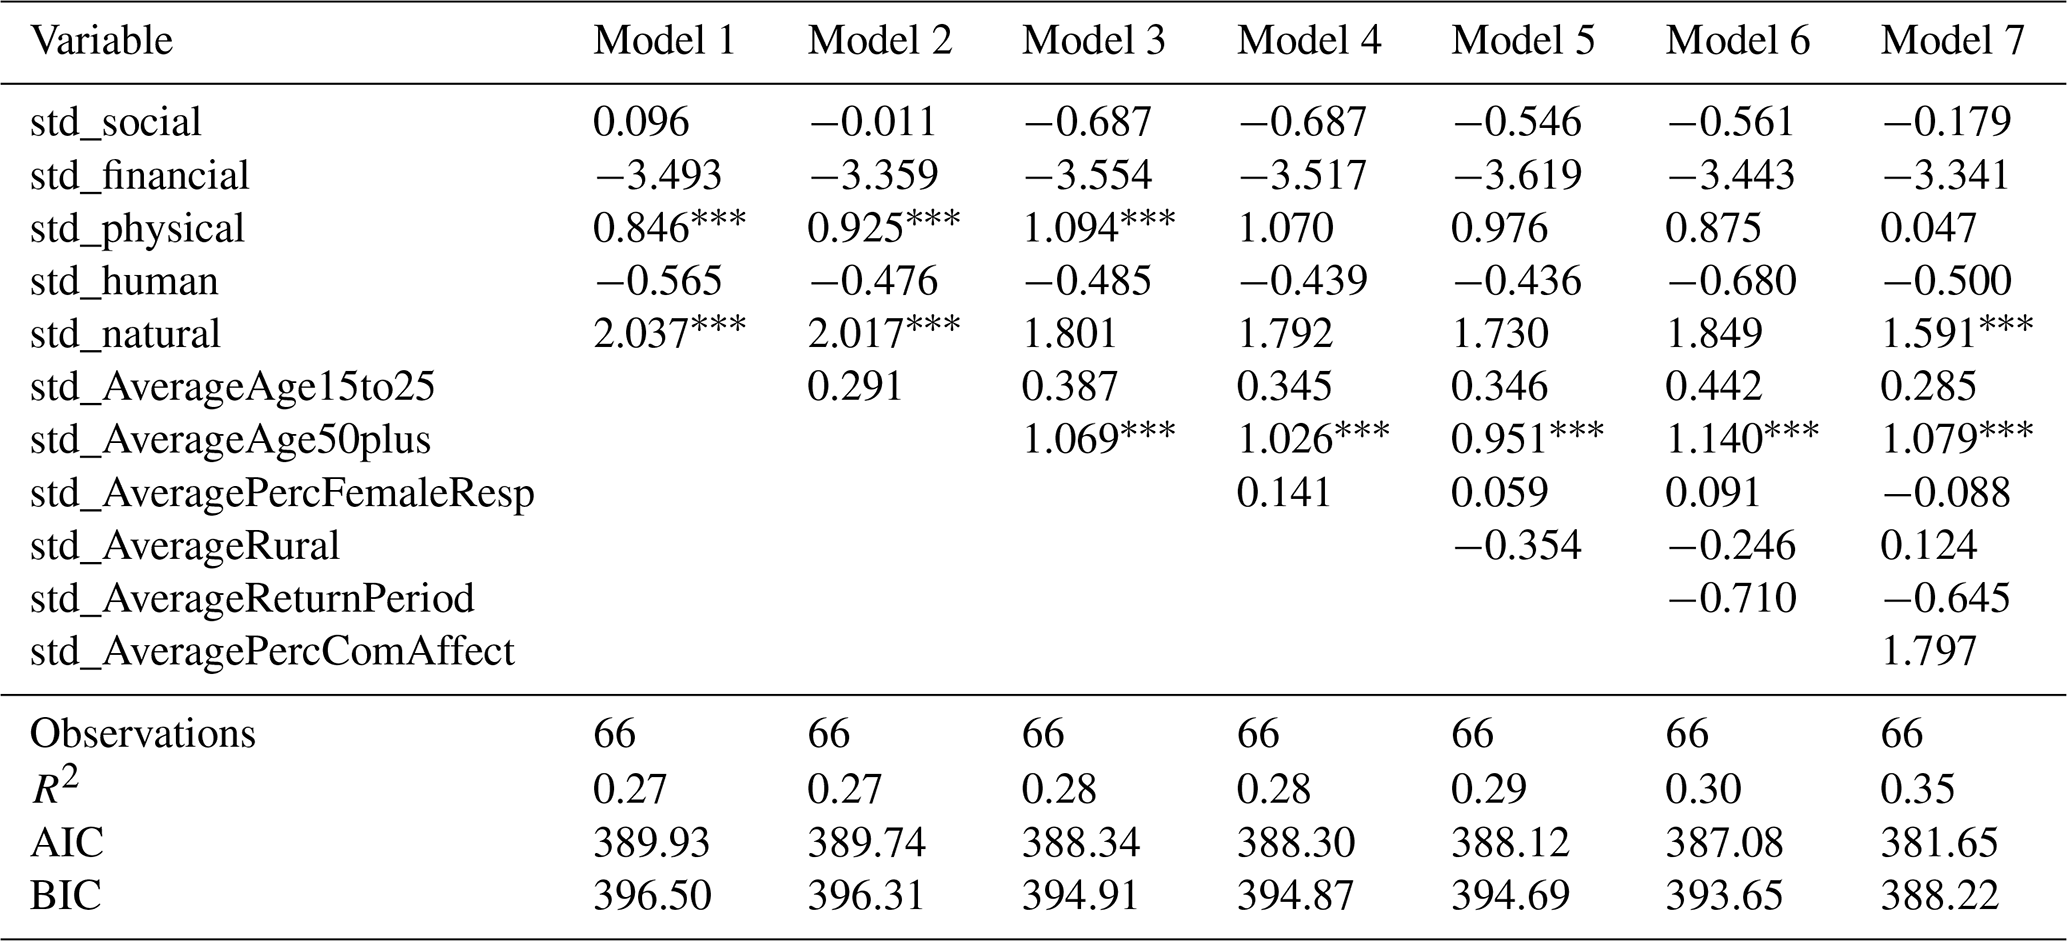
Table 10Wild bootstrap clustered regression models with the impact of 5Cs on health and mortality outcomes.
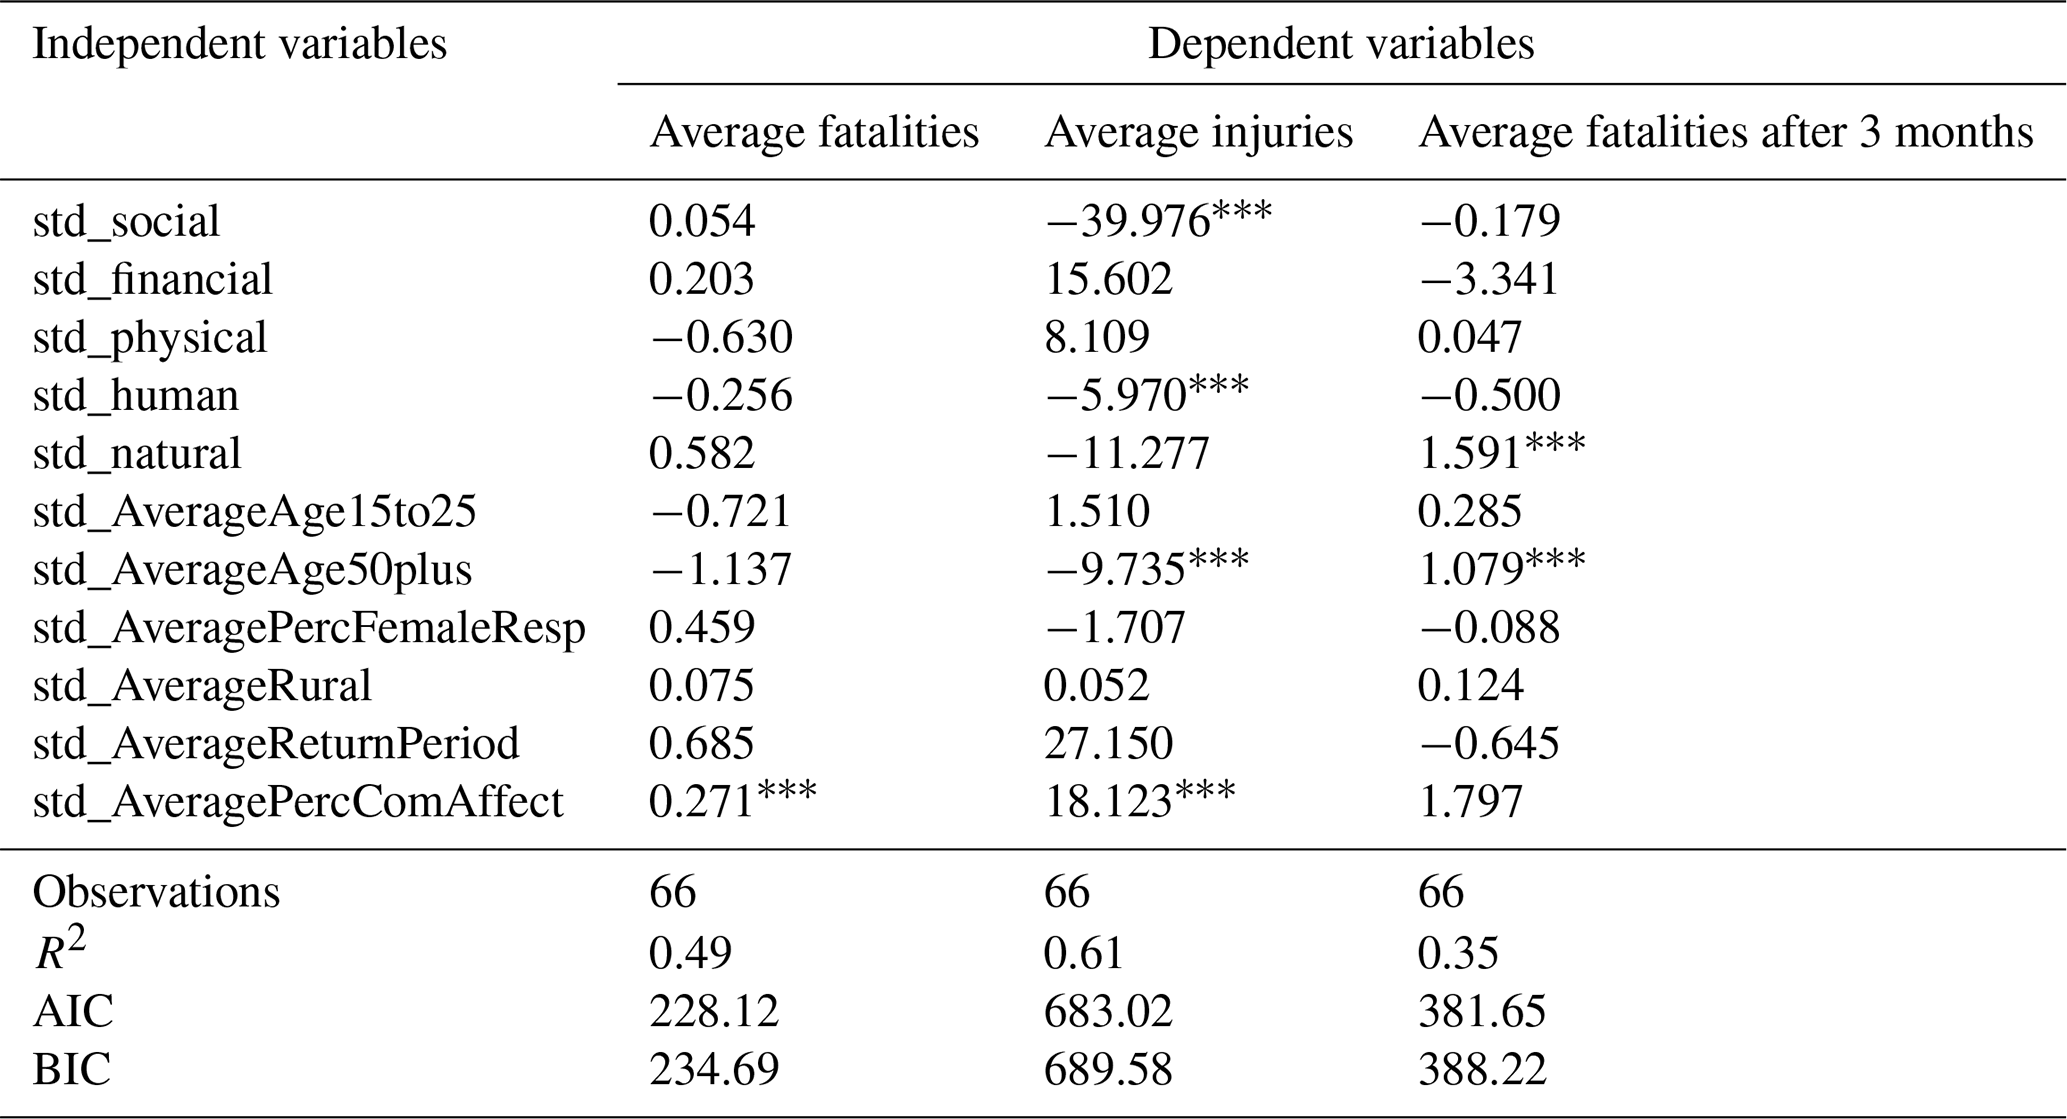
Observation: significant at 1 %; significant at 5 %; ∗ significant at 10 %. Source: FRMC.
5.1 The effect of community resilience on health outcomes
Table 10 displays the results of the effect of the 5Cs on health outcomes (average deaths, average number of injuries, average number of deaths after 3 months). For the first regression model (column 2), which analysed the effect of the 5Cs on average deaths due to floods, no form of capital was found to be statistically significant. This lack of significant association is a critical finding. It suggests that certain forms of resilience, as currently measured, may not translate directly into reductions in flood-related mortality – or may only do so above a particular threshold of capital accumulation. Reporting such null results is essential to avoid publication bias and contributes to a more realistic understanding of the limits of resilience-building initiatives in extreme events. Contrary to our study, Chapagain et al. (2025) found that physical capital and social capital did have a statistically significant negative association with total flood-related fatalities. This difference might be due to how the models are specified: our estimation includes all control variables and accounts for clustered standard errors. The only statistically significant variable in our analysis at the 1 % level was the control for the percentage of the community affected by the flood, in which a 1-standard-deviation increase in this variable was associated with an increase of 0.27 deaths, everything else held constant.
Next, Table 10 (third column) displays the results of the second regression model, which analysed the effect of the 5Cs on average injuries caused by floods. Social capital was found to be strongly associated with a decline in injuries, with a 1-standard-deviation increase in this indicator reducing the average number of injuries by 39 units (statistically significant at 1 % level). Also, human capital was found to reduce injuries, with a 1-standard-deviation increase in this indicator leading to a drop of 5.97 injuries (statistically significant at 1 % level). Regarding the controls, the average number of population aged 50 plus was found to be negatively associated with injuries, with a 1-standard-deviation increase in this variable associated with a decrease of 9.7 injuries, ceteris paribus (statistically significant at 1 % level). This might indicate that older individuals are more likely to evacuate early or take preventive measures before disasters, reducing their likelihood of flood-related injuries. Finally, the percentage of the community affected by the flood was found to increase the number of injuries, in which a 1-standard-deviation increase in this variable was associated with an increase of 18 injuries, everything else held constant.
Finally, Table 10 (fourth column) shows the results of the third regression model, which analysed the effect of the 5Cs on average fatalities after 3 months of the flood event. This model revealed an unexpected result: natural capital scores were positively associated with delayed mortality, everything held constant, with a 1-standard-deviation increase in this variable associated with an increase of 1.59 delayed deaths (significant at 1 % level). To further investigate this unexpected result, we ran a regression model with the same specification by cluster. The large coefficient for std_natural in Cluster 2 (9.387) could be driving the overall significant and positive effect. This makes theoretical sense, as natural capital in this cluster is low due to degraded natural environments and weak ecosystem services, even if some management efforts exist (Chapagain et al., 2024). Because of this, small improvements may not help much, and the positive association with delayed mortality might reflect the overall vulnerability of these communities rather than a real benefit of natural capital. Contrary to the model for injuries, the average number of population aged 50 plus was found to be positively associated with delayed mortality, with a 1-standard-deviation increase in this variable associated with an increase of 1.07 deaths after 3 months of a flood, ceteris paribus (statistically significant at 1 % level). Older individuals may have a higher likelihood of developing complications from flood-related injuries, infections, or chronic disease exacerbation. Conditions such as cardiovascular disease, respiratory illnesses, and weakened immune function could make them more vulnerable to delayed mortality rather than immediate death.
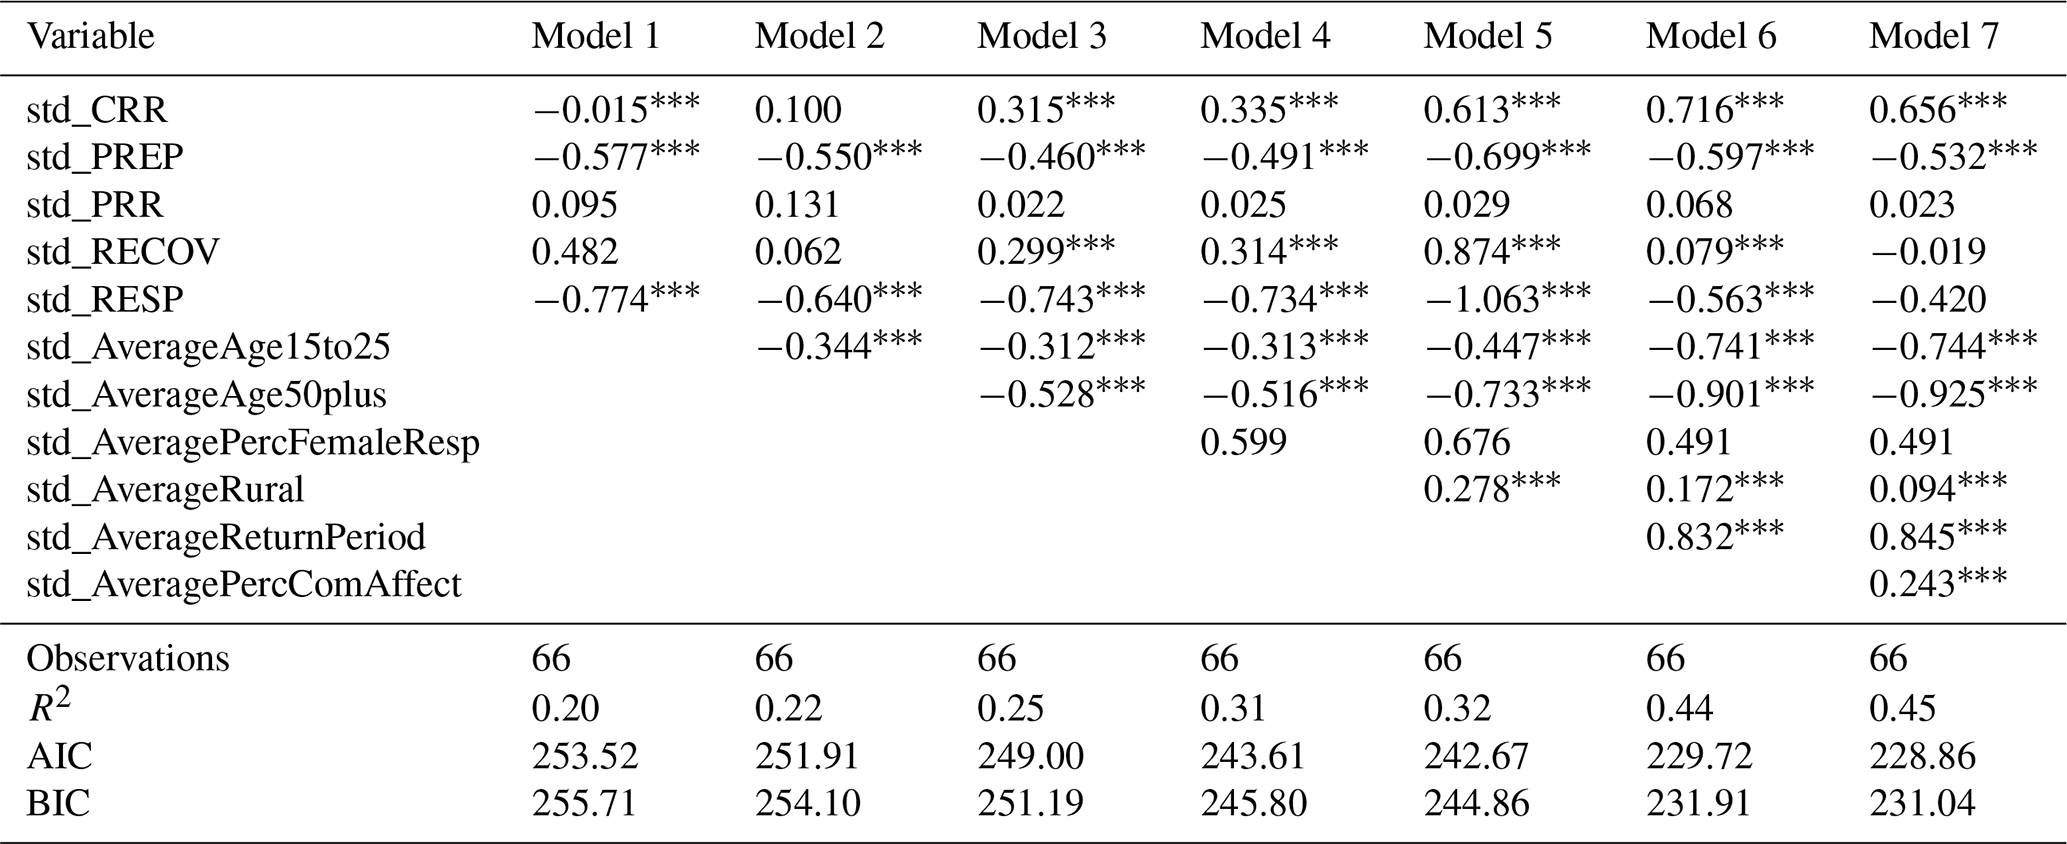
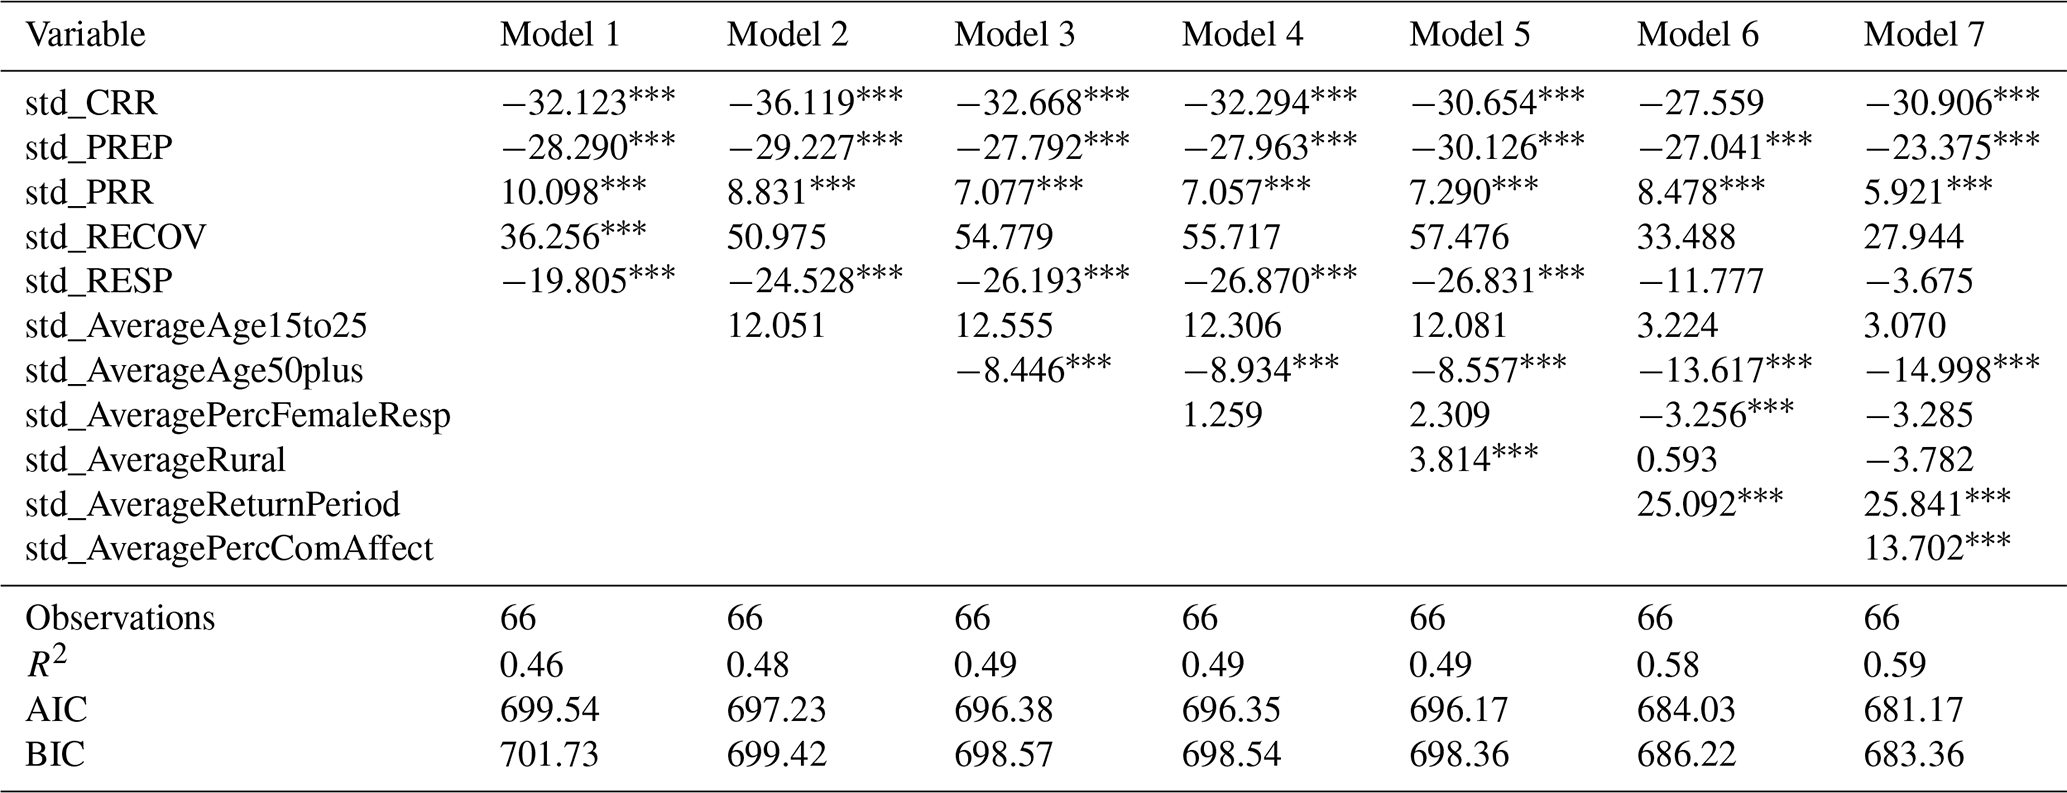
Table 11Wild bootstrap clustered regression models with the impact of DRM cycle stages on health and mortality outcomes.
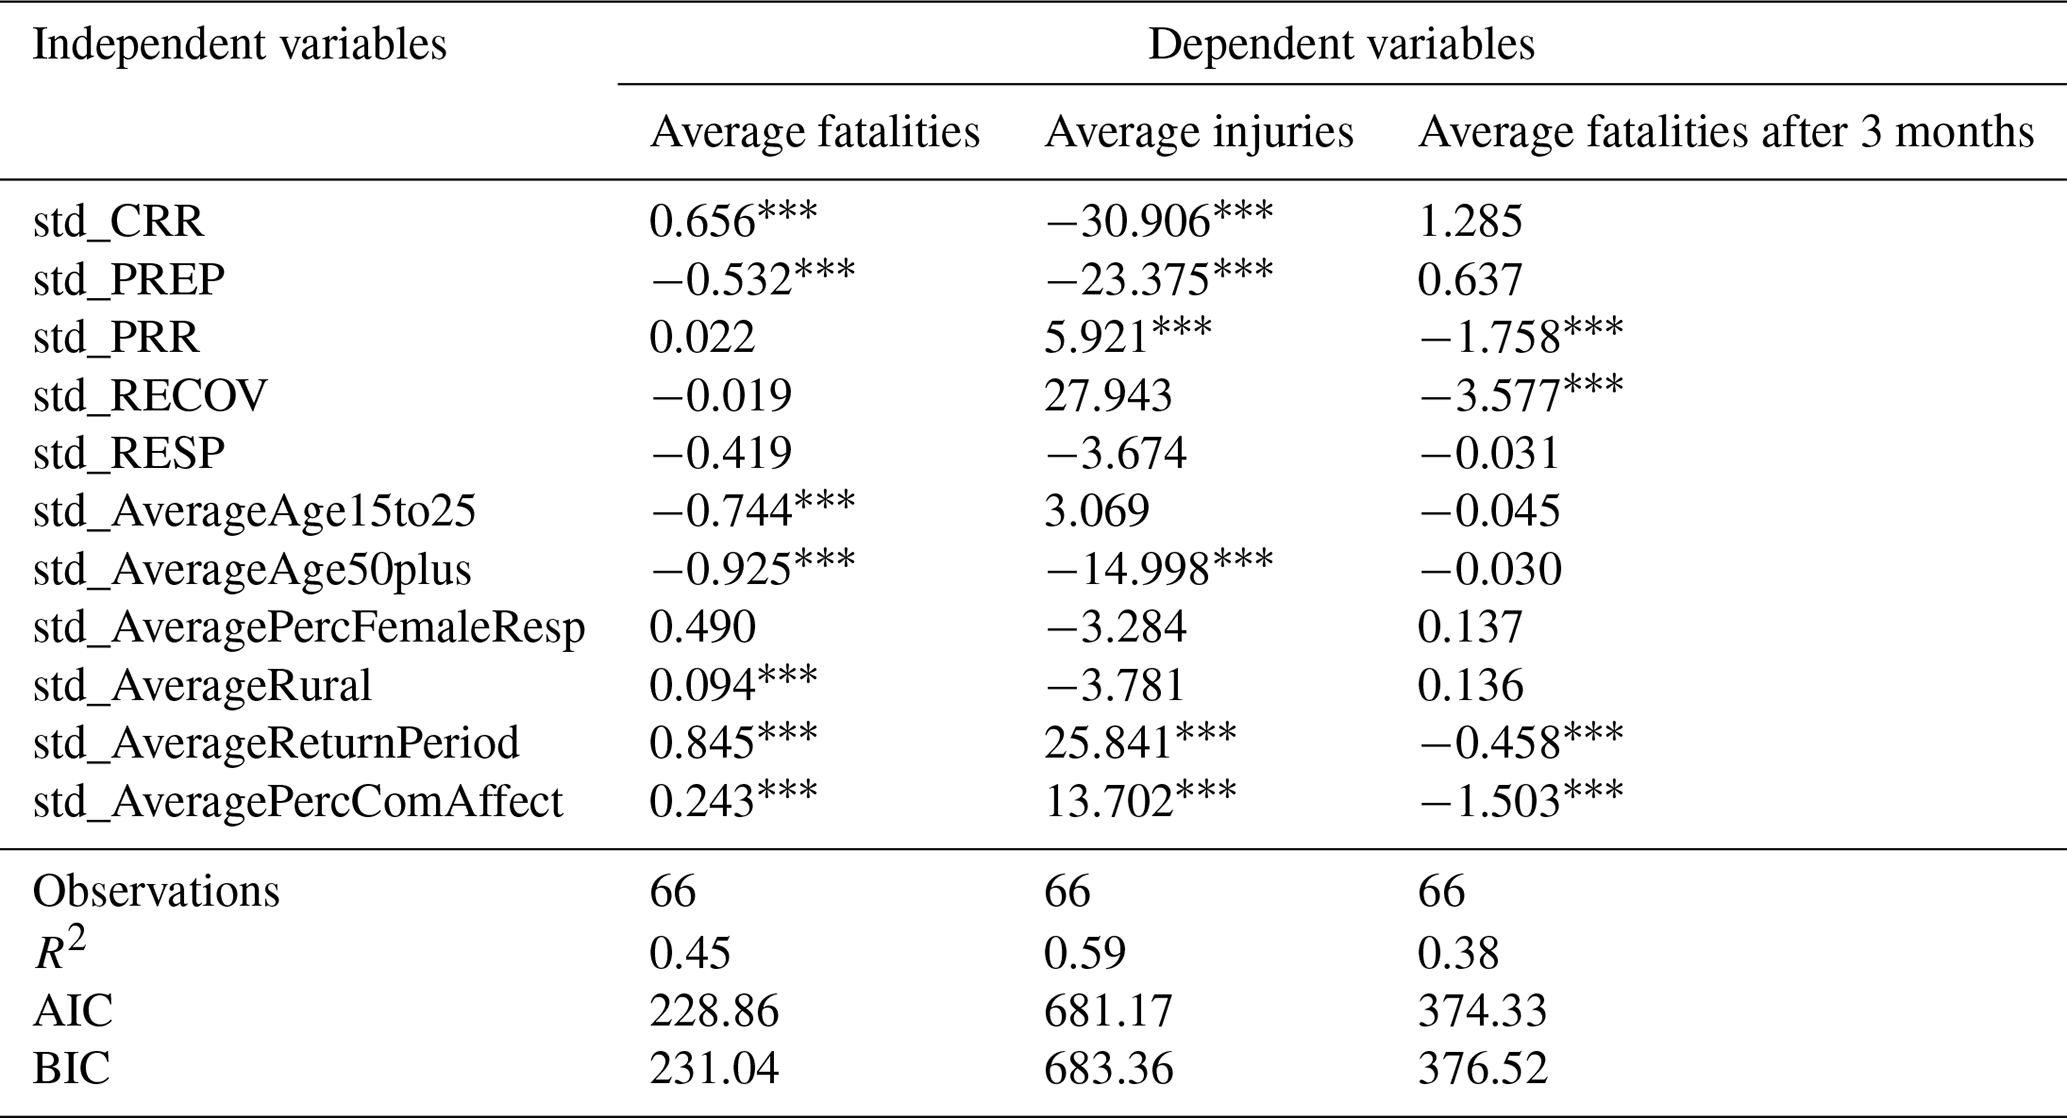
Observation: significant at 1 %; significant at 5 %; ∗ significant at 10 %. Source: FRMC.
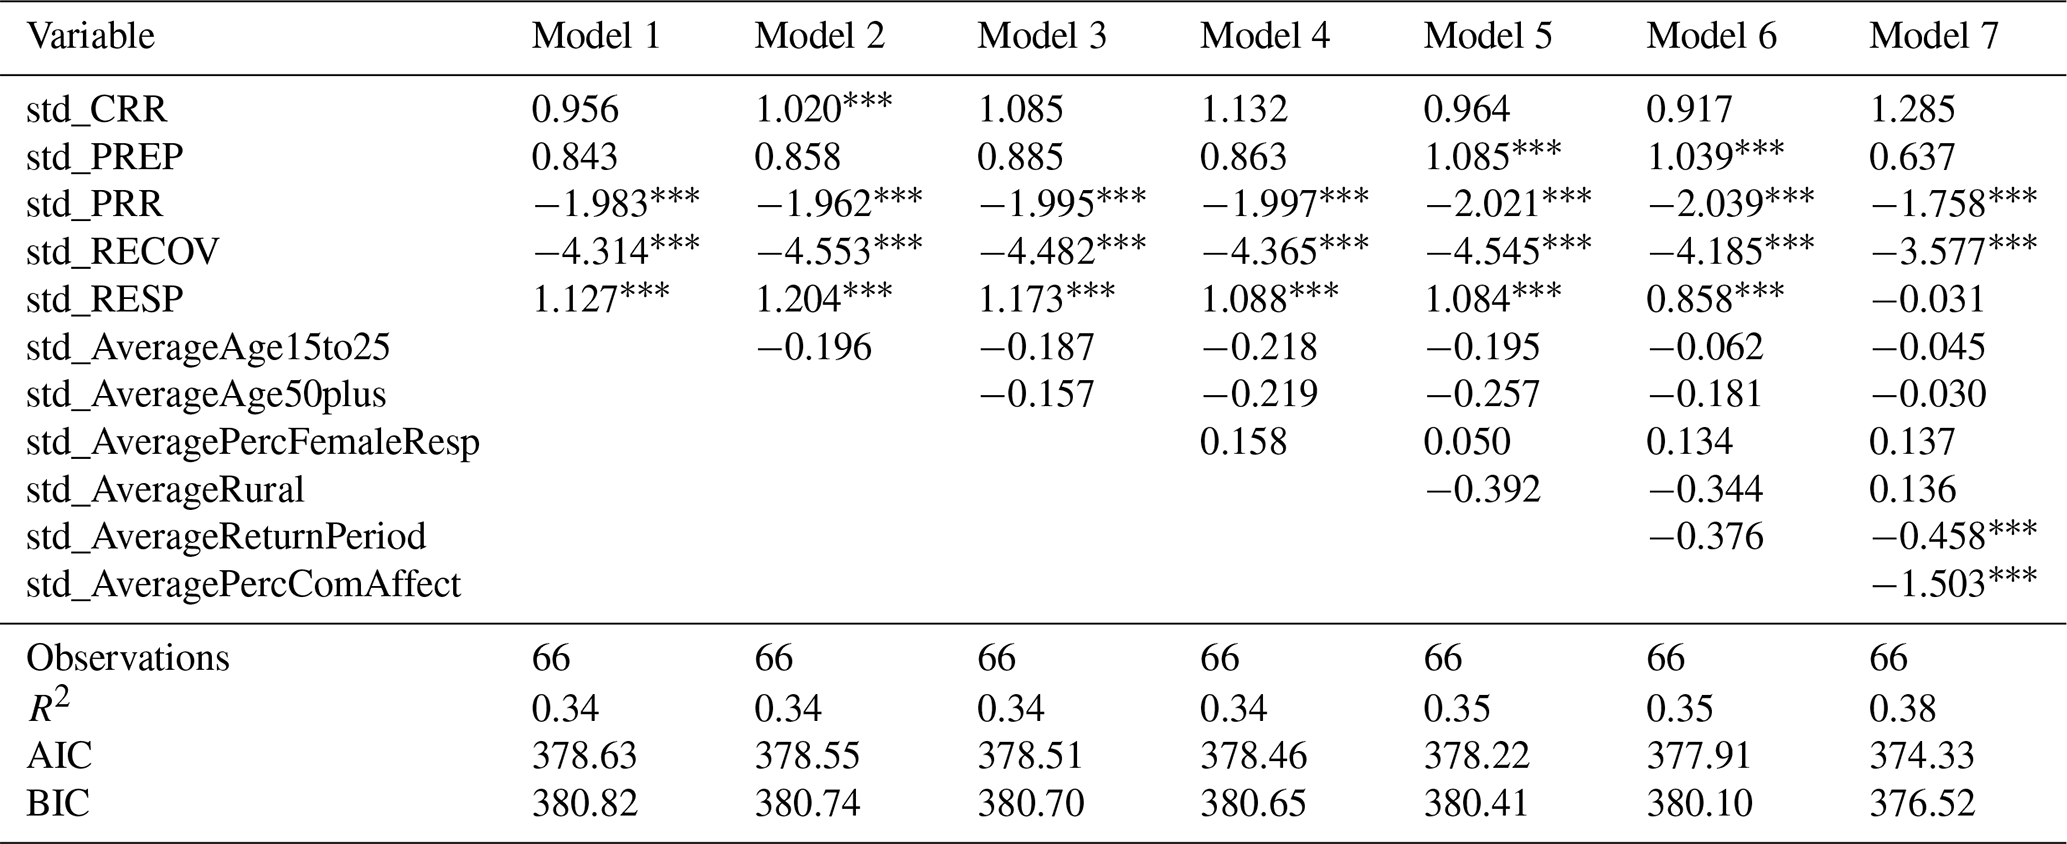
5.2 The effect of DRM cycle stages on health outcomes
The results for the regressions on the effects of the DRM cycle stages on health/mortality outcomes after a flood event portray a different scenario from the 5Cs estimates presented before. Table 11 summarizes the results. First, both corrective risk reduction and preparation scores were statistically associated with the average number of deaths (second column). Surprisingly, corrective risk reduction was positively associated with average immediate mortality, with a 1-standard-deviation increase in this score associated with an increase of 0.65 deaths, everything held constant. To further investigate this counterintuitive finding, we conducted a cluster-specific regression analysis, which revealed substantial heterogeneity across community contexts. In Cluster 1, corrective risk reduction (CRR) showed a small negative association (coefficient = −0.03, p = 0.925), while Cluster 2 exhibited a stronger positive relationship (coefficient = 0.84, p = 0.396), suggesting this larger cluster may be driving the overall significant effect. Cluster 2 has significant weaknesses across all measured DRM cycle dimensions. These communities with low CRR scores might have implemented recent improvements that had not yet translated into reduced mortality outcomes during our study period, potentially creating a lagged effect where reported improvements coexist with historically high mortality rates.
Preparation scores were negatively associated with average mortality, with a 1-standard-deviation increase in this indicator leading to a decrease of 0.53 deaths. Preparedness significantly reduces immediate flood mortality by enhancing early response. Effective warning systems and safety knowledge help individuals take timely protective actions, minimizing exposure to life-threatening conditions. Well-developed emergency infrastructure and coordinated response efforts ensure that communities can react efficiently, preventing avoidable deaths. Additionally, strong community participation and external support improve rescue operations and medical aid delivery, further reducing fatalities.
Finally, more control variables now display a significant relationship with the average number of deaths: the average percentage of the young population (15 to 25 years) and the average percentage of the elderly population (aged 50 or more) negatively associated with the number of deaths (significant at 1 % level). The explanations are quite straightforward: older individuals tend to take disasters more seriously, acting cautiously in response to early warnings and evacuation orders. Life experience and risk awareness help them recognize the severity of floods and take protective measures earlier, reducing their chances of fatal exposure. Younger individuals, in turn, tend to have better physical strength, endurance, and mobility, which increases their chances of escaping hazardous flood conditions. They typically face fewer mobility challenges or health problems that could complicate evacuation or reduce their chances of survival. Next, the average percentage of the rural population was positively associated with the number of deaths, with a 1-standard-deviation increase in this percentage related to 0.09 deaths. Health complications and mortality can be influenced by factors like socio-economic conditions, access to water and sanitation, and the state of public health infrastructure in rural areas (Jerin et al., 2024). Finally, flood hazard (return period) and exposure (percentage of community affected) are positively associated with mortality at the 1 % confidence level.
The model results for average injuries and their relationship with DRM cycle stages are also presented in Table 11 (third column). For this outcome variable, the results for corrective risk reduction (CRR) and preparedness are in line with expectations: a 1-standard-deviation increase in CRR reduces the average number of injuries by 31 units; also, a 1-standard-deviation increase in preparedness reduces the indicator by 23 units. Surprisingly, a 1-standard-deviation increase in the prospective risk reduction (PRR) increases the number of injuries by 6 units. To further investigate our counterintuitive finding regarding PRR, we again conducted a cluster-specific regression analysis, which revealed that in Cluster 1, which is characterized by high levels of overall preparedness, PRR maintained a significant positive relationship with injuries (coefficient = 4.88, p = 0.021), while in Cluster 2, the relationship was weaker and non-significant (coefficient = 2.93, p = 0.781). This pattern suggests that in communities with stronger overall disaster management systems (Cluster 1), there may be more effective injury reporting and documentation mechanisms in place, leading to higher recorded injury rates despite better prevention measures. The results for control variables show that the average number of the elderly is negatively associated with the number of injuries (significant at 1 %), whereas flood hazard and exposure are positively associated with the number of injuries.
Finally, Table 11 (fourth column) presents the results for the impact along DRM cycle stages on delayed mortality from floods (after 3 months). Results are as expected and in line with the literature regarding two DRM cycle stages: prospective risk reduction (PRR) and recovery. A 1-standard-deviation increase in the PRR score is associated with a decrease of 1.75 delayed deaths, everything held constant. Also, a 1-standard-deviation increase in the recovery indicator is associated with a decline of 3.57 deaths, ceteris paribus. Surprisingly, the only significant control variables for delayed mortality are flood exposure (percentage of the community affected) and hazard (return period), with a 1-standard-deviation increase in these indicators associated with a decrease in delayed deaths. These results appear counterintuitive, as one would expect communities with more frequent disasters (shorter return periods) and greater affected populations to experience higher delayed mortality. Cluster-specific analysis revealed distinct patterns: in Cluster 1, neither variable showed significant relationships with delayed mortality (return period: coefficient = 1.98, p = 0.523; community affected: coefficient = 0.27, p = 0.877). However, in Cluster 2, both variables showed negative associations, with the community-affected percentage approaching significance (coefficient = −1.98, p = 0.089) and return period showing a similar trend (coefficient = −1.42, p = 0.100). This may be associated with a survivorship bias or a “harvesting” effect: the most vulnerable individuals (e.g. the elderly, those with pre-existing health conditions) may succumb quickly after the flood, reducing the number of people who die in the delayed mortality window. Alternatively, this finding may reflect a reporting phenomenon where communities with more frequent disasters have better systems for attributing later deaths to the original disaster event.
Interestingly, several DRM stages – including corrective risk reduction and preparedness – did not show statistically significant associations with delayed mortality. While these might initially appear to be disappointing results, they offer crucial insights: either the health effects of floods evolve differently over time, or current DRM metrics may not fully capture interventions that affect medium-term health outcomes.
The goal of this paper was to explore the role of 5Cs and DRM cycle stages on health and mortality outcomes after flood events for 66 countries across seven countries participating in the FRMC: namely, how latent capacities determine outcomes, in terms of reduced mortality and morbidity. We advance current literature not only by incorporating a novel and rich dataset, but also by controlling in our impact analysis by relevant variables such as the demographic profile of the community and flood hazard and exposure. The literature stresses the role of these variables, and they are necessary to avoid confounding in the econometric analysis. Their significance in some models endorses their relevance for the analysis, and the quality of the adjustment in the full models (with all controls) justifies their inclusion.
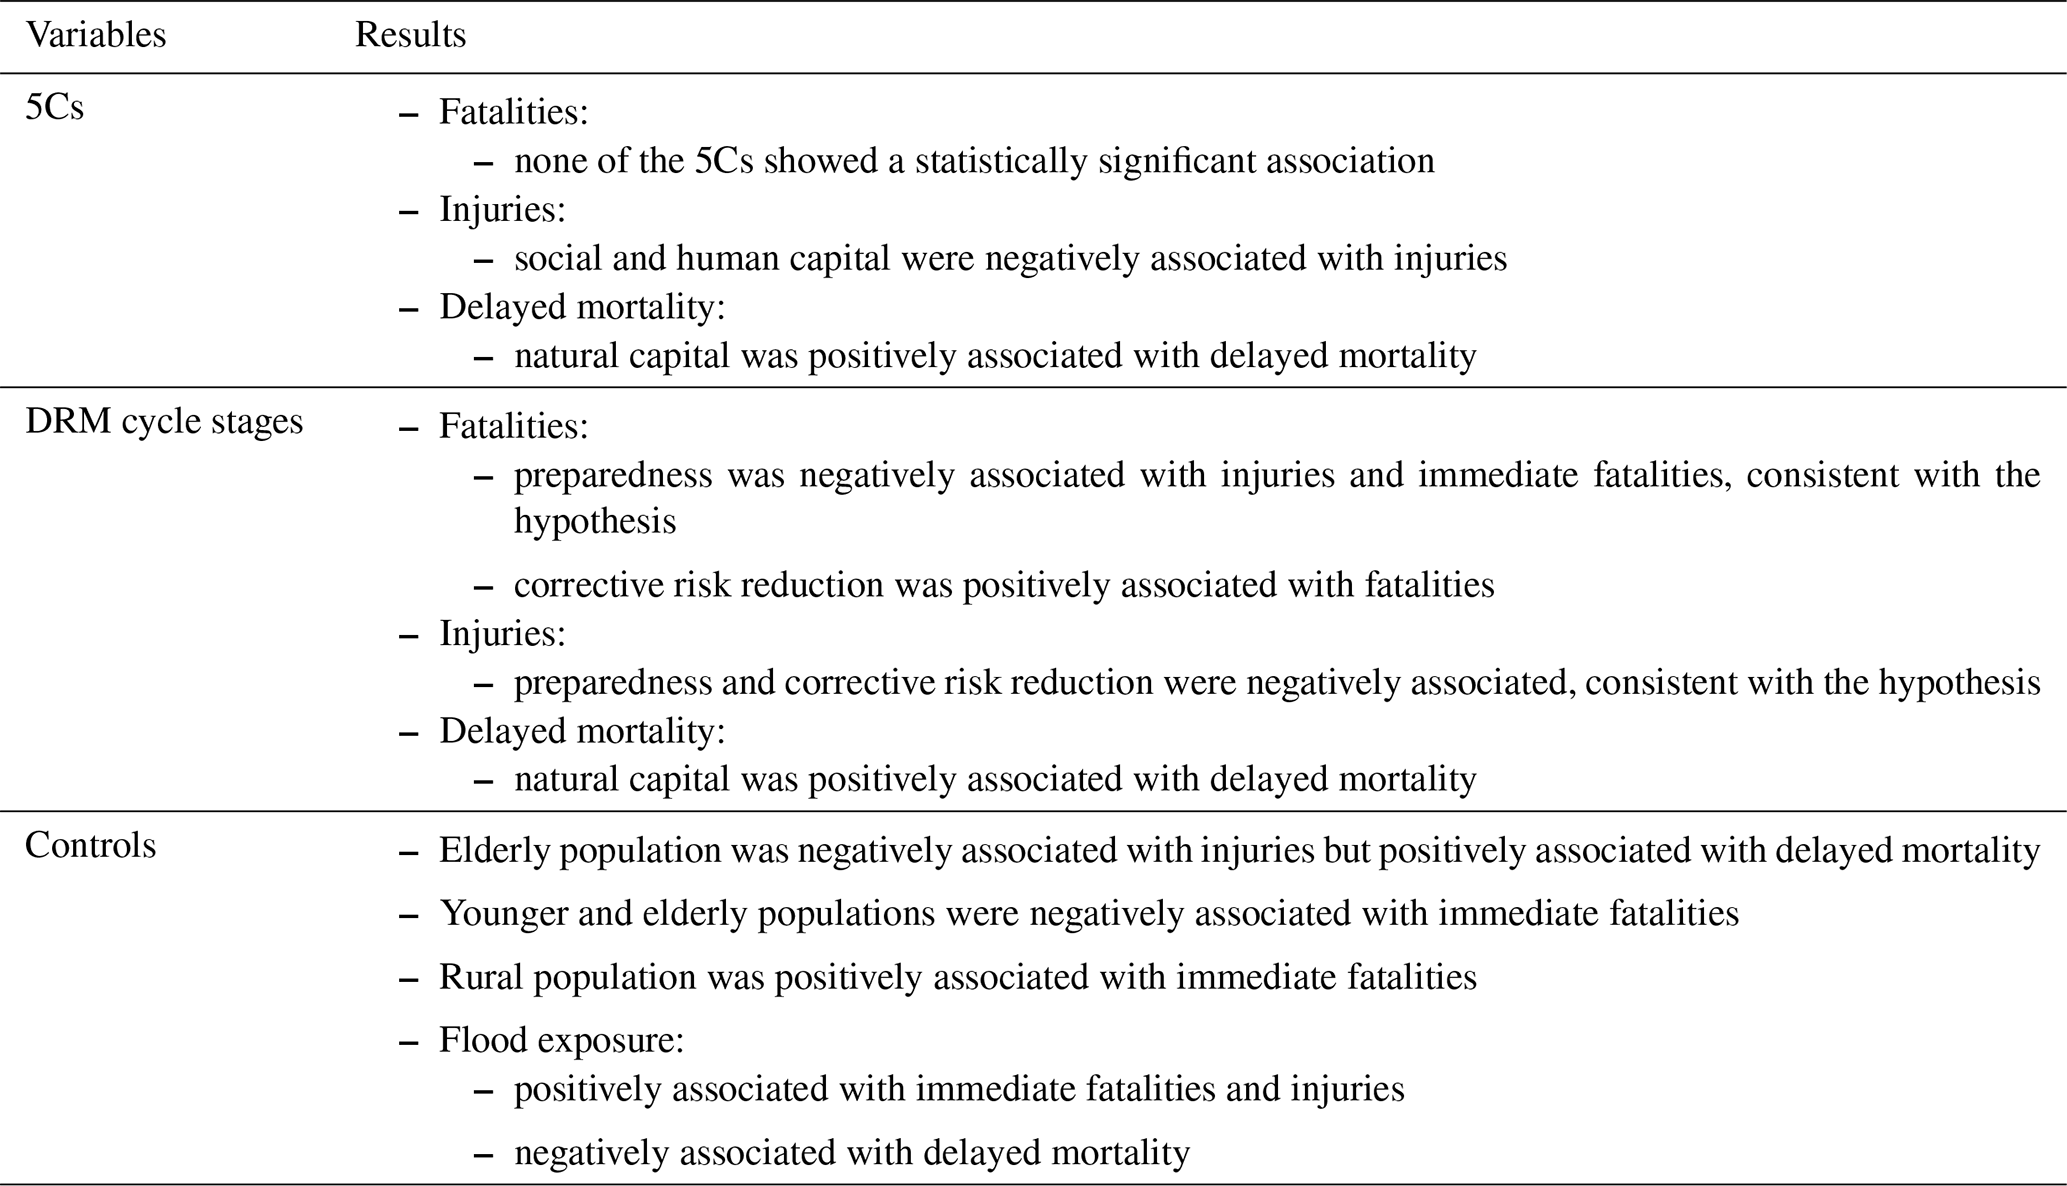
Our results demonstrate the relevance of selected 5Cs and DRM cycle stages for health and mortality outcomes, with some unexpected results as well.
-
The 5C models indicate that social and human capital are statistically, strongly, and negatively associated with the average number of injuries. However, none of the 5C indicators, except natural capital, showed a statistically significant association with either immediate fatalities or fatalities occurring within 3 months, when controlling for all other factors. This absence of consistent effects underscores the complexity of translating community forms of capital into lifesaving outcomes. Surprisingly, natural capital scores were strongly and positively associated with delayed mortality, an unexpected result that warrants further investigation.
-
In contrast, the DRM cycle models demonstrate greater predictive power in terms of significant variables for health and mortality outcomes compared to 5C models, although some variables show unexpected effects. Preparedness emerged as the most relevant DRM stage, significantly leading to reductions in both immediate fatalities and injuries. The corrective risk reduction stage was found to decrease injuries but unexpectedly increased fatalities. Recovery and response were negatively associated with delayed mortality.
Regarding control variables, the following points can be made:
-
Both elderly and young populations were associated with a reduction in immediate fatalities, while the percentage of elderly individuals specifically contributed to a decrease in injuries. The literature contradicts this claim. Instead, it consistently indicates that both older and younger populations are generally more vulnerable to flood-related mortality and various health impacts (Ban et al., 2023; Bukvic et al., 2018; Doocy et al., 2013; Lowe et al., 2013; Petrucci, 2022; Zagheni et al., 2015). However, older individuals often respond more cautiously to disasters, taking early warnings and evacuation orders seriously. Their life experience and greater risk awareness help them recognize the severity of floods and take protective action sooner, which can lower their risk of fatal exposure. In contrast, younger individuals typically have greater physical strength, stamina, and mobility, which improves their ability to escape hazardous flood conditions. They also tend to face fewer health or mobility issues that might hinder evacuation or reduce their chances of survival. Therefore, we argue that, despite contrasting findings in the literature, this evidence may be theoretically justifiable.
-
A higher percentage of the rural population was positively correlated with the number of immediate deaths. Studies generally align with this correlation (Bukvic et al., 2018; Petrucci, 2022).
-
For flood exposure and hazard indicators, these variables were strongly and positively associated with average fatalities and injuries, as confirmed by several studies (Ban et al., 2023; Paul and Mahmood, 2016; Penning-Rowsell et al., 2005), but negatively associated with delayed mortality. This last finding contradicts the claims of multiple studies that show that mortality risks can increase and persist for extended periods following a flood event (Yang et al., 2023). This is an unexpected result that warrants further investigation.
The study has limitations that should be considered when interpreting the results. One key limitation is the small sample size, which may pose statistical challenges in estimating more complex models, such as zero-inflated specifications. Additionally, the study includes a small number of clusters, which can impact the reliability of statistical inferences. To mitigate this issue, the analysis incorporates the use of wild bootstrap methods, providing a more robust approach to addressing the potential shortcomings in cluster representation. Another limitation arises from the measurement of certain constructs, as they are not always well defined by a single indicator. This could introduce measurement errors, potentially affecting the accuracy and consistency of the results. Finally, the demographic profile used in the study serves as a proxy variable for population characteristics, but it is representative only of household heads. This limitation may reduce the accuracy of the demographic analysis, as it does not fully capture the diversity and distribution of characteristics across the broader population.
Table 12 provides a summary of the statistically significant findings.
Future research should expand the sample size to improve statistical power and allow for more complex modelling approaches. It should also explore the temporal dynamics of 5Cs and DRM interventions, particularly the lag between their implementation and their impact on health outcomes. Additionally, improving demographic data availability would strengthen causal inference and help explain counterintuitive results.
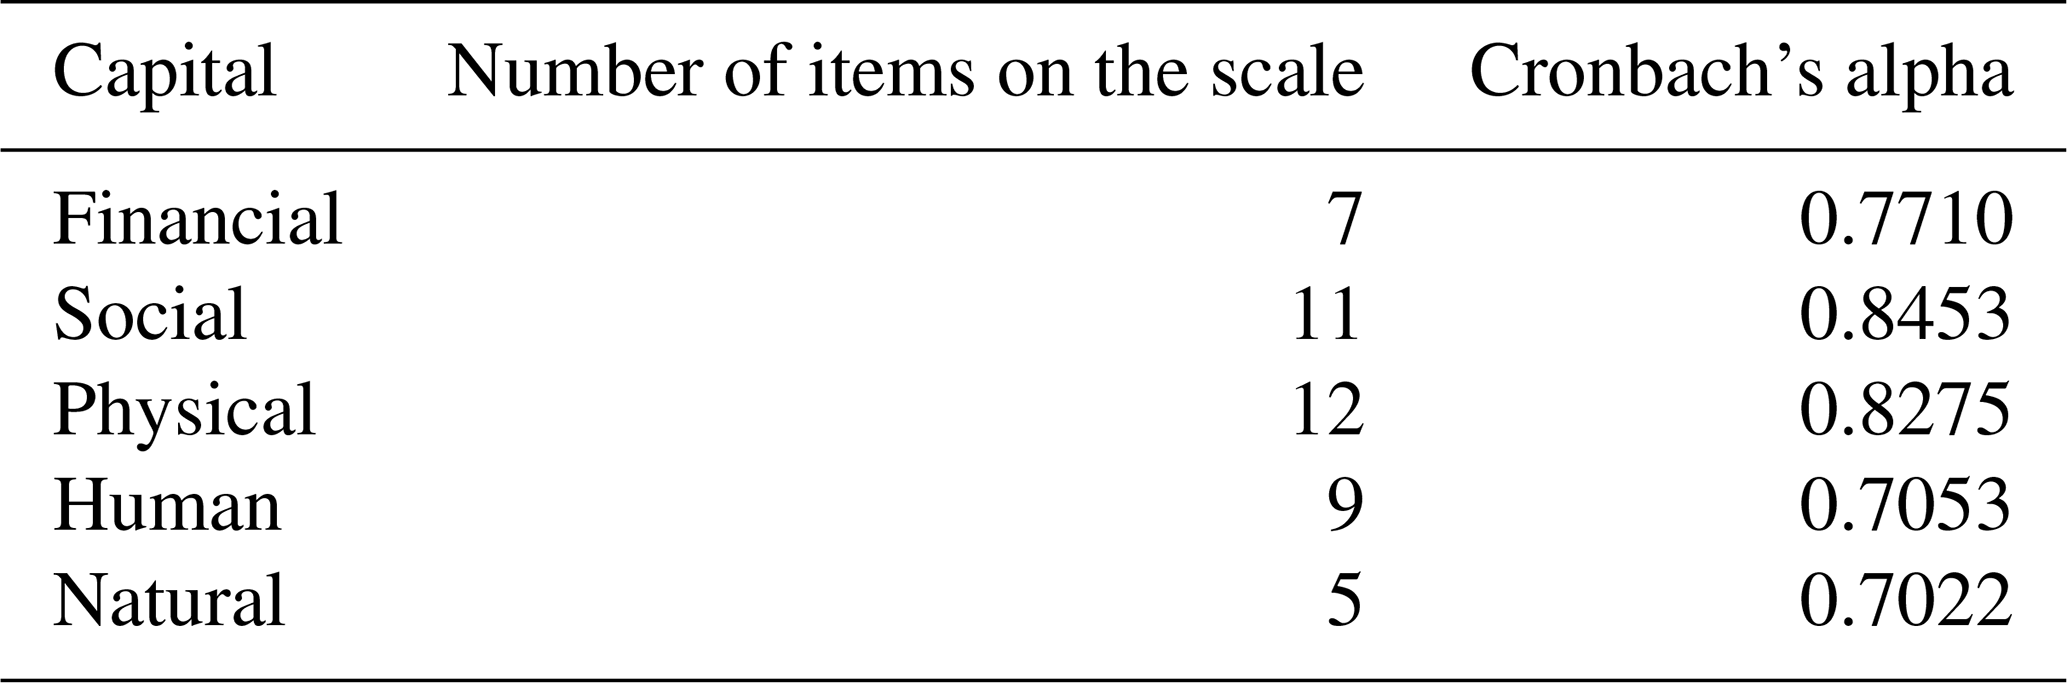
Table A2Cronbach's alpha for the DRM cycle stages.
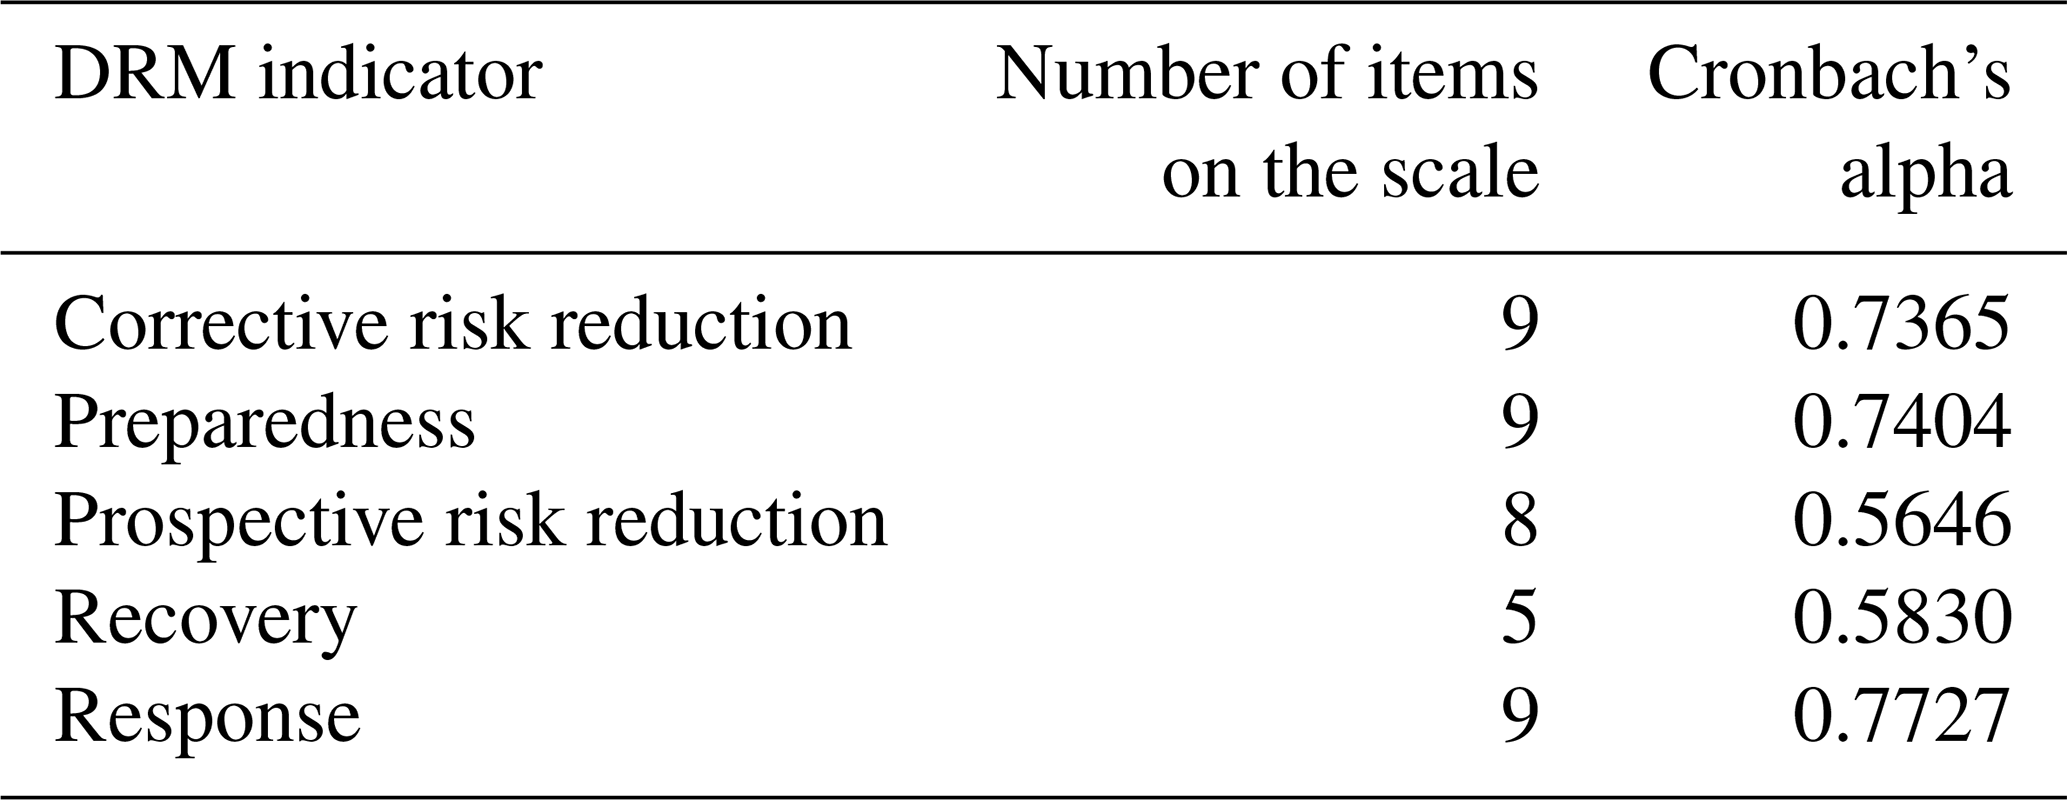
Source: FRMC.
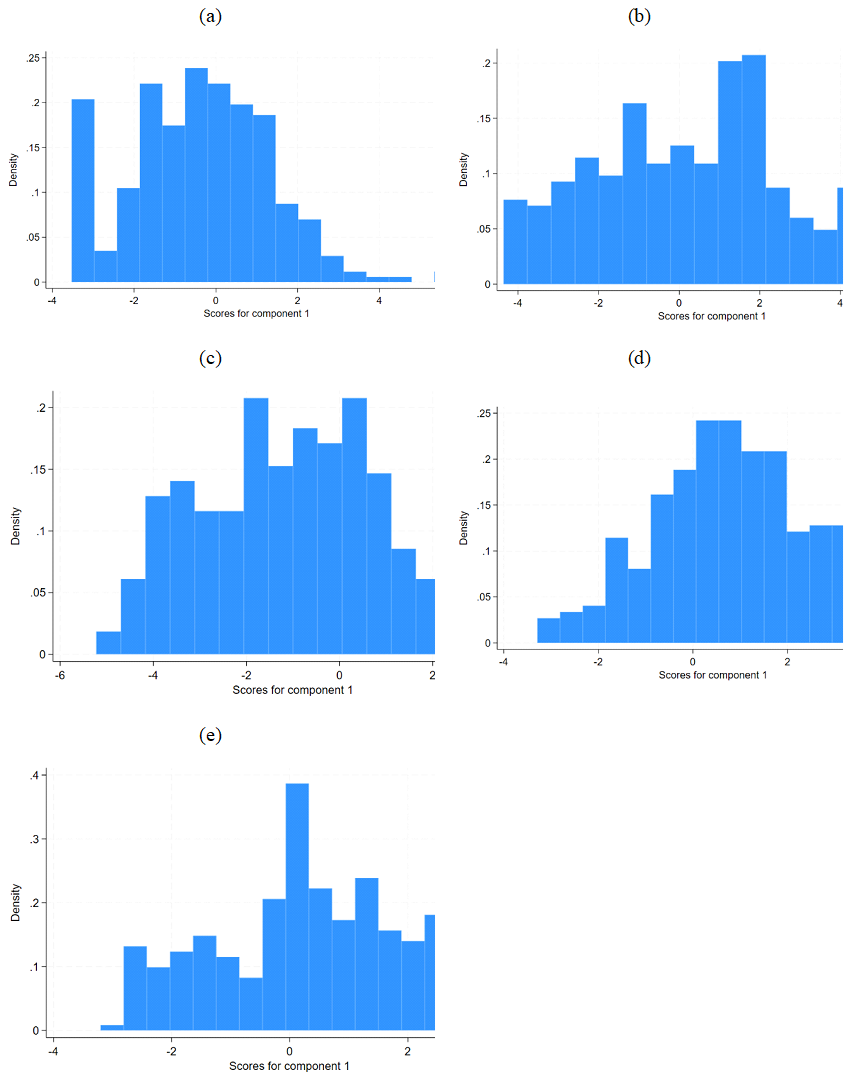
Figure A1Histograms for the 5Cs. (a) Financial capital. (b) Social capital. (c) Physical capital. (d) Human capital. (e) Natural capital.
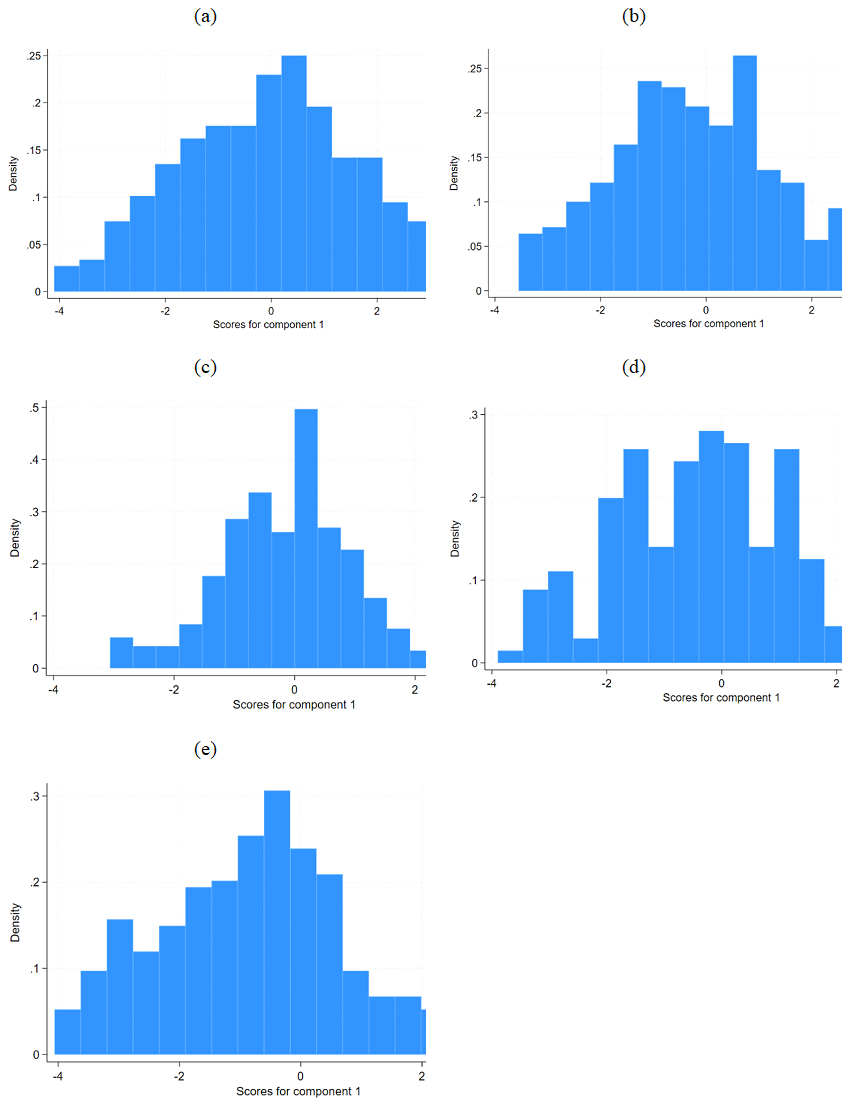
Figure A2Histograms for the DRM cycle stages. (a) Corrective risk reduction. (b) Preparedness. (c) Prospective risk reduction. (d) Recovery. (e) Response.
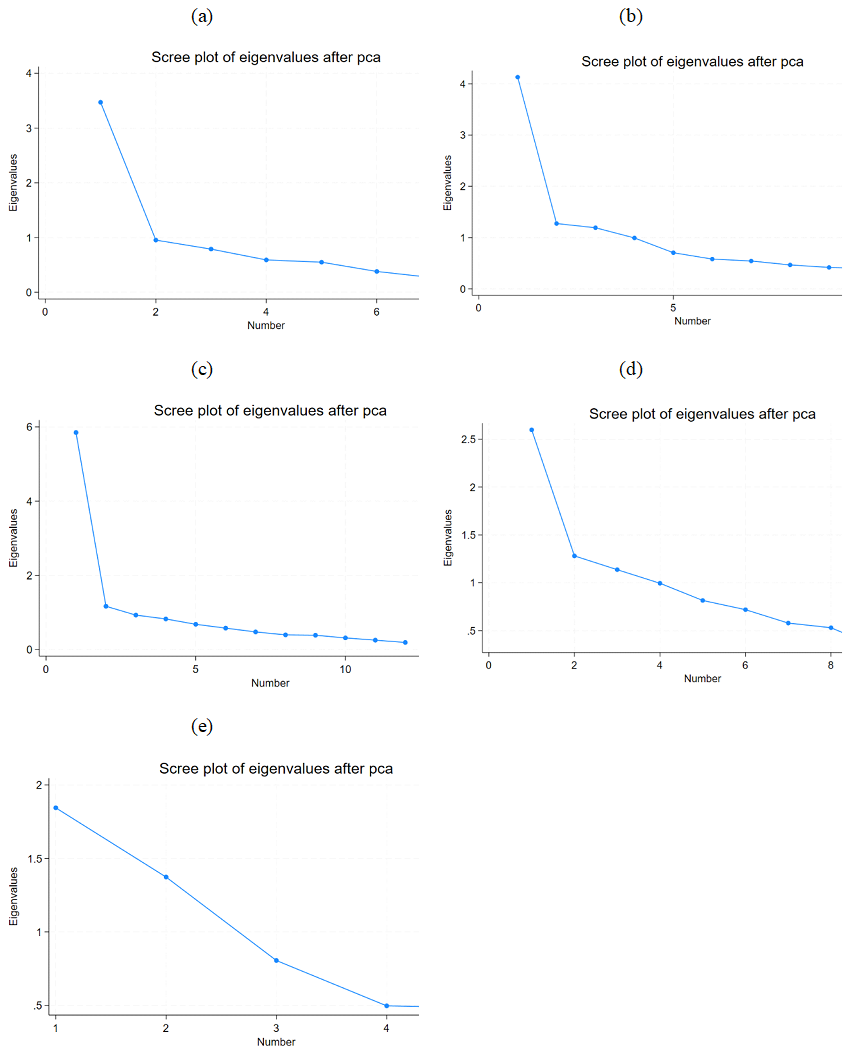
Figure A3Scree plots for 5Cs. (a) Financial capital. (b) Social capital. (c) Physical capital. (d) Human capital. (e) Natural capital.
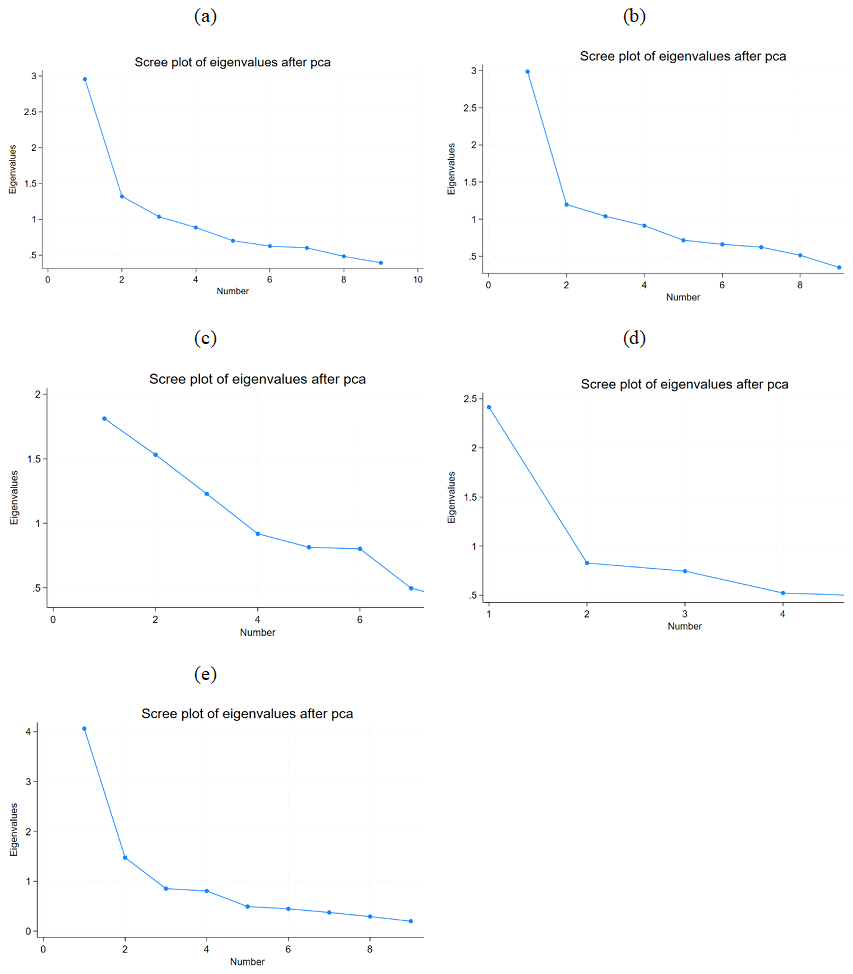
Figure A4Scree plot for the DRM cycle stages. (a) Corrective risk reduction. (b) Preparedness. (c) Prospective risk reduction. (d) Recovery. (e) Response.
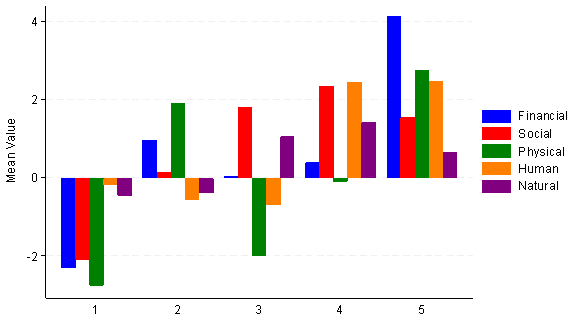
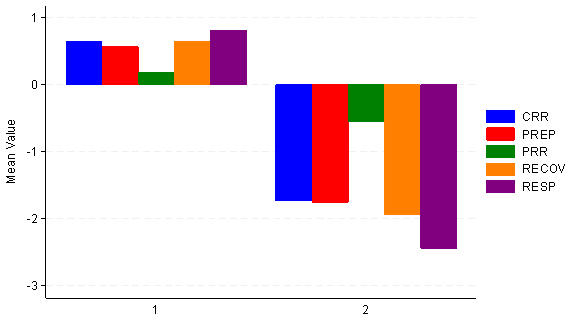
Table A3Comparison of wild bootstrap clustered regression models for assessing community resilience and its impact on average loss of life.
Observation: significant at 1 %; significant at 5 %; ∗ significant at 10 %. Source: FRMC.
Table A4Comparison of wild bootstrap clustered regression models for assessing community resilience and its impact on average injuries.
Observation: significant at 1 %; significant at 5 %; ∗ significant at 10 %. Source: FRMC.
Table A5Comparison of wild bootstrap clustered regression models for assessing community resilience and its impact on average fatalities after 3 months.
Observation: significant at 1 %; significant at 5 %; ∗ significant at 10 %. Source: FRMC.
Table A6Comparison of wild bootstrap clustered regression models for assessing DRM cycle levels and their impact on average fatalities.
Observation: significant at 1 %; significant at 5 %; ∗ significant at 10 %. Source: FRMC.
Table A7Comparison of wild bootstrap clustered regression models for assessing DRM cycle levels and their impact on average injuries.
Observation: significant at 1 %; significant at 5 %; ∗ significant at 10 %. Source: FRMC.
Table A8Comparison of wild bootstrap clustered regression models for assessing DRM cycle levels and their impact on average fatalities after 3 months.
Observation: significant at 1 %; significant at 5 %; ∗ significant at 10 %. Source: FRMC.
Code is available upon request.
The FRMC data are owned by the organizations that collected them. The authors of this paper were granted access to the data but do not have permission to share them further.
RG designed the study, wrote the manuscript, and prepared and analysed the data. RM contributed to the study design, manuscript writing, and data interpretation. SV participated in data preparation, manuscript writing, and data interpretation. DC contributed to the writing of the manuscript and to data interpretation.
The contact author has declared that none of the authors has any competing interests.
Publisher's note: Copernicus Publications remains neutral with regard to jurisdictional claims made in the text, published maps, institutional affiliations, or any other geographical representation in this paper. While Copernicus Publications makes every effort to include appropriate place names, the final responsibility lies with the authors.
The authors thank reviewers 1 and 2 and the editor for their valuable comments, which helped improve this paper. An earlier version of the manuscript was presented at the EGU 2025 conference, and the authors are grateful for the opportunity they had to share and discuss the work there.
This work was funded by the Z Zurich Foundation.
This paper was edited by Olga Petrucci and reviewed by two anonymous referees.
Alexander, D. E.: Resilience and disaster risk reduction: an etymological journey, Nat. Hazards Earth Syst. Sci., 13, 2707–2716, https://doi.org/10.5194/nhess-13-2707-2013, 2013.
Alexander, D. E.: L'Aquila, central Italy, and the “disaster cycle”, 2009–2017, Disaster Prev. Manag. Int. J., 28, 419–433, https://doi.org/10.1108/DPM-01-2018-0022, 2018.
Azad, M. J. and Pritchard, B.: The importance of women's roles in adaptive capacity and resilience to flooding in rural Bangladesh, Int. J. Disast. Risk Re., 90, 103660, https://doi.org/10.1016/j.ijdrr.2023.103660, 2023.
Baas, S., Ramasamy, S., de Pryck, J. D., and Battista, F.: Disaster risk management systems analysis: A guide book, Food and Agriculture Organization of the United Nations, Rome, 2008.
Ban, J., Sutton, C., Ma, Y., Lin, C., and Chen, K.: Association of flooding exposure with cause-specific mortality in North Carolina, United States, Nat. Water, 1, 1027–1034, https://doi.org/10.1038/s44221-023-00167-5, 2023.
Birkmann, J., Jamshed, A., McMillan, J. M., Feldmeyer, D., Totin, E., Solecki, W., Ibrahim, Z. Z., Roberts, D., Kerr, R. B., Poertner, H.-O., Pelling, M., Djalante, R., Garschagen, M., Leal Filho, W., Guha-Sapir, D., and Alegría, A.: Understanding human vulnerability to climate change: A global perspective on index validation for adaptation planning, Sci. Total Environ., 803, 150065, https://doi.org/10.1016/j.scitotenv.2021.150065, 2022.
Bukvic, A., Gohlke, J., Borate, A., and Suggs, J.: Aging in Flood-Prone Coastal Areas: Discerning the Health and Well-Being Risk for Older Residents, Int. J. Env. Res. Pub. He., 15, 2900, https://doi.org/10.3390/ijerph15122900, 2018.
Campbell, K. A., Laurien, F., Czajkowski, J., Keating, A., Hochrainer-Stigler, S., and Montgomery, M.: First insights from the Flood Resilience Measurement Tool: A large-scale community flood resilience analysis, Int. J. Disast. Risk Re., 40, 101257, https://doi.org/10.1016/j.ijdrr.2019.101257, 2019.
Chapagain, D., Hochrainer-Stigler, S., Velev, S., Keating, A., Hyun, J. H., Rubenstein, N., and Mechler, R.: A taxonomy-based understanding of community flood resilience, Ecol. Soc., 29, https://doi.org/10.5751/ES-15654-290436, 2024.
Chapagain, D., Hochrainer-Stigler, S., Velev, S., Keating, A., and Mechler, R.: Realized resilience after community flood events: A global empirical study, Int. J. Disast. Risk Re., 118, 105246, https://doi.org/10.1016/j.ijdrr.2025.105246, 2025.
Doocy, S., Daniels, A., Packer, C., Dick, A., and Kirsch, T. D.: The Human Impact of Earthquakes: a Historical Review of Events 1980–2009 and Systematic Literature Review, PLoS Curr., 16, no longer available online, 2013.
Escobar Carías, M. S., Johnston, D. W., Knott, R., and Sweeney, R.: Flood disasters and health among the urban poor, Health Econ., 31, 2072–2089, https://doi.org/10.1002/hec.4566, 2022.
Hochrainer-Stigler, S., Laurien, F., Velev, S., Keating, A., and Mechler, R.: Standardized disaster and climate resilience grading: A global scale empirical analysis of community flood resilience, J. Environ. Manage., 276, 111332, https://doi.org/10.1016/j.jenvman.2020.111332, 2020.
Hochrainer-Stigler, S., Velev, S., Laurien, F., Campbell, K., Czajkowski, J., Keating, A., and Mechler, R.: Differences in the dynamics of community disaster resilience across the globe, Sci. Rep.-UK, 11, 17625, https://doi.org/10.1038/s41598-021-96763-0, 2021.
Hu, P., Zhang, Q., Shi, P., Chen, B., and Fang, J.: Flood-induced mortality across the globe: Spatiotemporal pattern and influencing factors, Sci. Total Environ., 643, 171–182, https://doi.org/10.1016/j.scitotenv.2018.06.197, 2018.
Jamshed, A., Rana, I. A., Mirza, U. M., and Birkmann, J.: Assessing relationship between vulnerability and capacity: An empirical study on rural flooding in Pakistan, Int. J. Disast. Risk Re., 36, 101109, https://doi.org/10.1016/j.ijdrr.2019.101109, 2019.
Jamshed, A., Birkmann, J., Feldmeyer, D., and Rana, I. A.: A Conceptual Framework to Understand the Dynamics of Rural–Urban Linkages for Rural Flood Vulnerability, Sustainability, 12, 2894, https://doi.org/10.3390/su12072894, 2020a.
Jamshed, A., Birkmann, J., McMillan, J. M., Rana, I. A., and Lauer, H.: The Impact of Extreme Floods on Rural Communities: Evidence from Pakistan, in: Climate Change, Hazards and Adaptation Options: Handling the Impacts of a Changing Climate, edited by: Leal Filho, W., Nagy, G. J., Borga, M., Chávez Muñoz, P. D., and Magnuszewski, A., Springer International Publishing, Cham, https://doi.org/10.1007/978-3-030-37425-9_30, 585–613, 2020b.
Jamshed, A., Birkmann, J., McMillan, J. M., Rana, I. A., Feldmeyer, D., and Sauter, H.: How do rural-urban linkages change after an extreme flood event? Empirical evidence from rural communities in Pakistan, Sci. Total Environ., 750, 141462, https://doi.org/10.1016/j.scitotenv.2020.141462, 2021.
Jerin, T., Chowdhury, Md. A., Azad, M. A. K., Zaman, S., Mahmood, S., Islam, S. L. U., and Mohammad Jobayer, H.: Extreme weather events (EWEs)-Related health complications in Bangladesh: A gender-based analysis on the 2017 catastrophic floods, Nat. Hazards Res., 4, 434–447, https://doi.org/10.1016/j.nhres.2023.10.006, 2024.
Keating, A., Campbell, K., Mechler, R., Erwann Michel-Kerjan, Mochizuki, J., Kunreuther, H., Bayer, J., Hanger, S., McCallum, I., Keith, L. S. W., Atreya, A., Botzen, W., Collier, B., Czajkowski, J., Stefan Hochrainer, C., and Egan, C.: Operationalizing Resilience Against Natural Disaster Risk: Opportunities, Barriers and a Way Forward, Zurich Flood Resil. Alliance, https://pure.iiasa.ac.at/id/eprint/11191/ (last access: 1 October 2025), 2014.
Keating, A., Campbell, K., Szoenyi, M., McQuistan, C., Nash, D., and Burer, M.: Development and testing of a community flood resilience measurement tool, Nat. Hazards Earth Syst. Sci., 17, 77–101, https://doi.org/10.5194/nhess-17-77-2017, 2017a.
Keating, A., Campbell, K., Mechler, R., Magnuszewski, P., Mochizuki, J., Liu, W., Szoenyi, M., and McQuistan, C.: Disaster resilience: what it is and how it can engender a meaningful change in development policy, Dev. Policy Rev., 35, 65–91, https://doi.org/10.1111/dpr.12201, 2017b.
Keating, A., Hochrainer-Stigler, S., Mechler, R., Laurien, F., Rubenstein, N., Deubelli, T., Velev, S., Szoenyi, M., and Nash, D.: Reflections on the large-scale application of a community resilience measurement framework across the globe, Clim. Serv., 38, 100562, https://doi.org/10.1016/j.cliser.2025.100562, 2025.
Lan, T., Hu, Y., Cheng, L., Chen, L., Guan, X., Yang, Y., Guo, Y., and Pan, J.: Floods and diarrheal morbidity: Evidence on the relationship, effect modifiers, and attributable risk from Sichuan Province, China, J. Glob. Health, 12, 11007, https://doi.org/10.7189/jogh.12.11007, 2022.
Laurien, F., Hochrainer-Stigler, S., Keating, A., Campbell, K., Mechler, R., and Czajkowski, J.: A typology of community flood resilience, Reg. Environ. Change, 20, 24, https://doi.org/10.1007/s10113-020-01593-x, 2020.
Lowe, D., Ebi, K. L., and Forsberg, B.: Factors Increasing Vulnerability to Health Effects before, during and after Floods, Int. J. Env. Res. Pub. He., 10, 7015–7067, https://doi.org/10.3390/ijerph10127015, 2013.
Lynch, V. D., Sullivan, J. A., Flores, A. B., Xie, X., Aggarwal, S., Nethery, R. C., Kioumourtzoglou, M.-A., Nigra, A. E., and Parks, R. M.: Large floods drive changes in cause-specific mortality in the United States, Nat. Med., 1–9, https://doi.org/10.1038/s41591-024-03358-z, 2025.
Mucherera, B. and Mavhura, E.: Flood survivors' perspectives on vulnerability reduction to floods in Mbire district, Zimbabwe, Jàmbá, J. Disaster Risk Stud., 12, 1–12, https://doi.org/10.4102/jamba.v12i1.663, 2020.
Paul, B. K. and Mahmood, S.: Selected physical parameters as determinants of flood fatalities in Bangladesh, 1972–2013, Nat. Hazards, 83, 1703–1715, https://doi.org/10.1007/s11069-016-2384-z, 2016.
Penning-Rowsell, E., Floyd, P., Ramsbottom, D., and Surendran, S.: Estimating Injury and Loss of Life in Floods: A Deterministic Framework, Nat. Hazards, 36, 43–64, https://doi.org/10.1007/s11069-004-4538-7, 2005.
Petrucci, O.: Review article: Factors leading to the occurrence of flood fatalities: a systematic review of research papers published between 2010 and 2020, Nat. Hazards Earth Syst. Sci., 22, 71–83, https://doi.org/10.5194/nhess-22-71-2022, 2022.
Rana, I. A., Asim, M., Aslam, A. B., and Jamshed, A.: Disaster management cycle and its application for flood risk reduction in urban areas of Pakistan, Urban Clim., 38, 100893, https://doi.org/10.1016/j.uclim.2021.100893, 2021.
Shah, A. A., Ullah, A., Khan, N. A., Shah, M. H., Ahmed, R., Hassan, S. T., Tariq, M. A. U. R., and Xu, C.: Identifying obstacles encountered at different stages of the disaster management cycle (DMC) and its implications for rural flooding in Pakistan, Front. Environ. Sci., 11, https://doi.org/10.3389/fenvs.2023.1088126, 2023.
Yang, Z., Huang, W., McKenzie, J. E., Xu, R., Yu, P., Ye, T., Wen, B., Gasparrini, A., Armstrong, B., Tong, S., Lavigne, E., Madureira, J., Kyselý, J., Guo, Y., and Li, S.: Mortality risks associated with floods in 761 communities worldwide: time series study, BMJ, 383, e075081, https://doi.org/10.1136/bmj-2023-075081, 2023.
Yari, A., Ostadtaghizadeh, A., Ardalan, A., Zarezadeh, Y., Rahimiforoushani, A., and Bidarpoor, F.: Risk factors of death from flood: Findings of a systematic review, J. Environ. Health Sci. Eng., 18, 1643–1653, https://doi.org/10.1007/s40201-020-00511-x, 2020.
Zagheni, E., Muttarak, R., and Striessnig, E.: Differential mortality patterns from hydro-meteorological disasters: Evidence from cause-of-death data by age and sex, Vienna Yearb. Popul. Res., 13, 47–70, 2015.