the Creative Commons Attribution 4.0 License.
the Creative Commons Attribution 4.0 License.
 | 01 Oct 2025
Insights from hailstorm track analysis in European climate change simulations
Killian P. Brennan
Iris Thurnherr
Michael Sprenger
Heini Wernli
Hailstorms are among the most destructive weather events, posing significant threats to infrastructure, agriculture, and human life. This study applies hailstorm-tracking diagnostics to kilometer-scale, decade-long climate simulations over Europe using the COSMO v6 model driven by ERA5 reanalyses. Convection is treated explicitly, and hail is modeled online with the HAILCAST parameterization. Simulations represent current and future climate simulations, the latter corresponding to a +3 K global temperature increase implemented via a pseudo-global warming approach.
We analyze high-frequency hail output at 5 min intervals, which enables tracking ∼40 000 hailstorms in Europe in current and future climate simulations separately. Storm track properties include length, duration, hail size, and spatial distribution, while three-dimensional environmental variables along these tracks yield storm-centered composites of hailstorm structure and allow for the examination of storm inflow environments. Our analysis reveals significant shifts in the characteristics of hailstorms under the future climate scenario. Notably, hail frequency trends vary across Europe, but the trends in hailstorm environments are comparatively uniform. The most striking results are as follows: (i) hail swath areas are projected to change in terms of both frequency and spatial extent, with a 2-fold increased frequency of storms producing ∼50 mm and larger hail diameters. Per-storm hail swath areas generally expand by 15 %–30 %, with swath area increases being more important for smaller hail, while frequency changes dominate for larger hail. (ii) The effect of increased hail melting due to the higher elevation of the 0 °C level on the storm maximum hail diameters is found to be minor. (iii) Precipitation and wind hazards accompanying hailstorms are expected to increase on average by 20 % and 5 %, respectively, whereas extreme hail–precipitation compound events, i.e., hail with a diameter of at least 30 mm followed by 50 mm h−1 of rainfall, are projected to be twice as frequent in the future.
- Article
(9589 KB) - Full-text XML
-
Supplement
(23352 KB) - BibTeX
- EndNote


As one of the most destructive natural hazards, hailstorms lead to considerable economic losses and pose serious risks to public safety. In Europe, hail can cause extensive damage to crops, vehicles, buildings, and critical infrastructure, with annual losses estimated at several billion euros (Punge and Kunz, 2016; Schmid et al., 2024). Hail can devastate entire harvests, impacting food supply and local economies (Portmann et al., 2024). Additionally, hailstorms can result in injuries or fatalities due to large hailstones and associated severe weather phenomena (Martín et al., 2024). Several atmospheric factors contribute to hail formation by promoting the development of strong convective storms. Weak static stability allows for vigorous upward motion in the atmosphere, which is essential for thunderstorm development (Markowski and Richardson, 2010). High low-level humidity provides ample moisture for condensation, enhancing the energy of the storm through latent heat release and supporting stronger updrafts that can sustain hail growth (Wallace and Hobbs, 2006). Additionally, vertical wind shear organizes storms into longer-lived convective cells like supercells, which are more likely to produce hail due to their intense and sustained updrafts (Doswell, 2001).
In the context of climate change, three competing processes governing hail growth are most relevant to consider. First, a warmer atmosphere can hold more moisture in accordance with Clausius–Clapeyron scaling (Trenberth et al., 2003; Held and Soden, 2006; Seneviratne et al., 2021), which can lead to more intense convection with stronger updrafts and ultimately larger hailstones (Raupach et al., 2021). Second, assuming unaltered lapse rates, the 0 °C level is higher in a warmer climate, which would give the hailstones more time to melt as they fall and result in smaller hailstones at the surface (e.g., Prein and Heymsfield, 2020; Gensini et al., 2024). This effect is expected to be larger for smaller hailstones, as they have a lower terminal velocity compared to large hailstones (Pruppacher and Klett, 2010; Raupach et al., 2021). Third, regional climate simulations over Europe indicate that the future summer warming pattern under climate change is affected by spatially differing lapse-rate changes, where steeper lapse rates would reduce stability, promoting deep convection and shallower lapse rates increasing stability and suppressing convection (Brogli et al., 2021). Lastly, thunderstorm initiation is also highly sensitive to small changes in low-level temperature and moisture; however, the effect of climate change on the frequency of convective initiation is less clear (Raupach et al., 2021).
Raupach et al. (2021) provided a comprehensive summary of the impact of climate change on hailstorms globally, predicting an increased frequency of hailstorms in Australia and Europe while expecting a decrease in East Asia and North America. The study also anticipated an increase in hailstorm severity worldwide (i.e., larger hailstones) due to rising low-level moisture and convective available potential energy. Elevated 0 °C level height and the associated increase in hail melt are expected to enlarge the average hailstone size, while the effect of decreased vertical wind shear on hailstorm activity was estimated to be limited. However, this review also highlighted significant uncertainties due to limited long-term data and the need for high-resolution, convection-permitting numerical modeling to better understand current hailstorm climatologies and future hailstorm changes.
Climatological trend information about hail and/or the environment of hailstorms can be obtained through various means:1 (i) one option is trend analysis with radar-based hail climatologies, which provides observational data but lacks information about the hail environment (e.g., humidity and temperature profiles). (ii) Another option involves hail proxies derived from reanalysis data, considering only hail precursors but not actual hail formation. Early studies used environmental proxies to estimate hail occurrence also from coarse-resolution climate simulations (e.g., Kapsch et al., 2012; Sanderson et al., 2015; Rädler et al., 2019). (iii) Convection-permitting simulations of hail with explicit hail microphysics (e.g., Gensini et al., 2024) can be carried out. (iv) Online hail parameterization in climate simulations can be conducted, which is the approach we use in this study. Diagnostic, physics-based models such as HAILCAST (Brimelow et al., 2002; Adams-Selin and Ziegler, 2016) have been employed either offline (Brimelow et al., 2017) or online (Cui et al., 2024, 2023) to quantify hail diameters expected at the ground. Similarly, hail occurrence has also been inferred from vertically integrated graupel (e.g., Trapp et al., 2019).
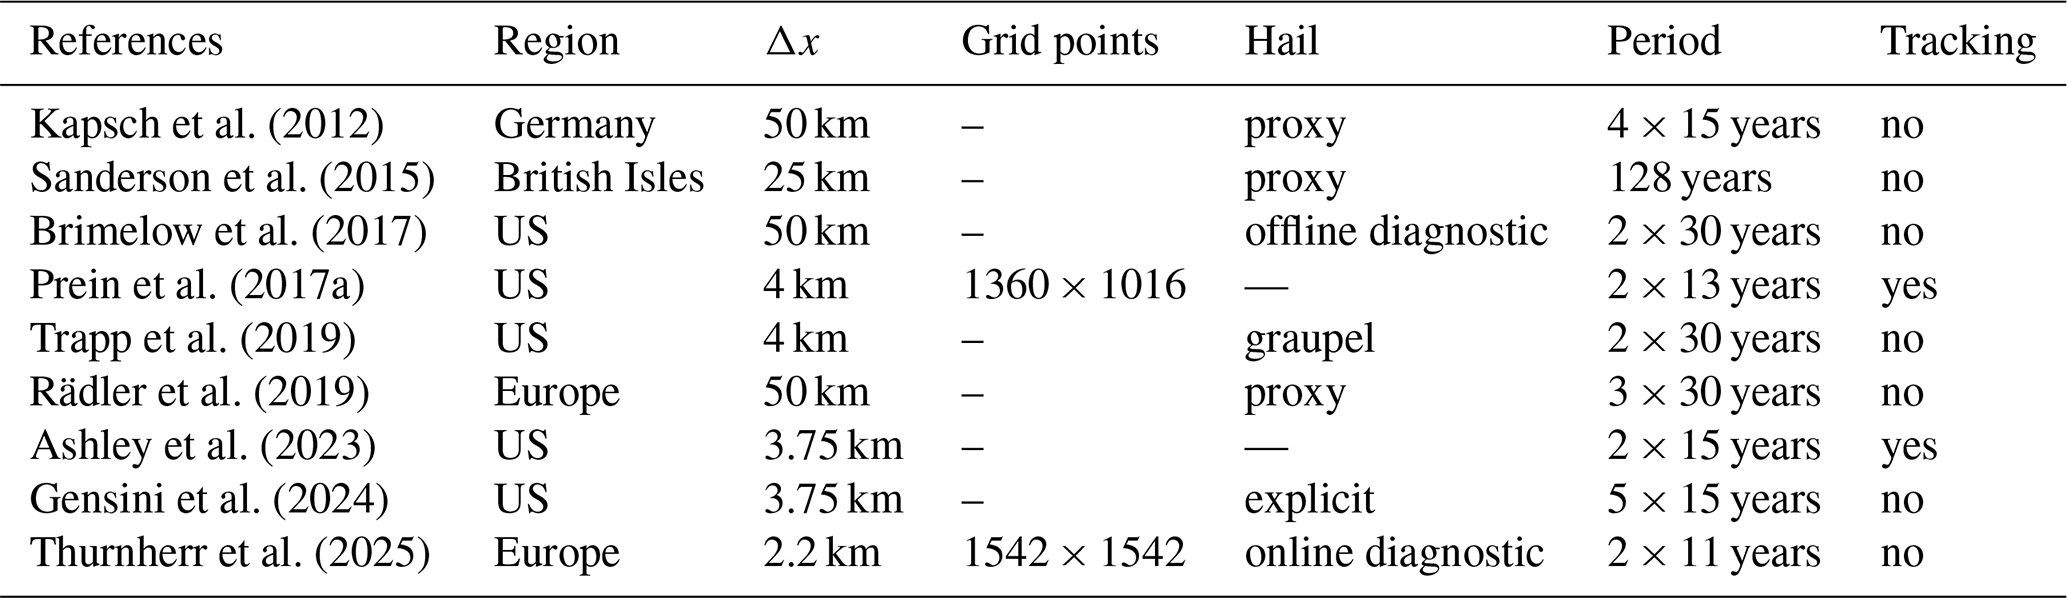
Several methods to quantify hail occurrence in climate model simulations have been explored in the past. Studies that investigated future trends in hail occurrence in the US and Europe are summarized in Table 1. Object-based analysis involves identifying and tracking individual weather phenomena as coherent, typically two-dimensional, entities, offering quantitative information about their life cycle and structural evolution, which is not available from standard Eulerian analysis. This approach is well-established in cyclone tracking studies (Hodges, 1999; Neu et al., 2013) and has been applied to convective storms without a specific focus on hail (Davis et al., 2006). As demonstrated by Prein et al. (2017b), Ashley et al. (2023), and Brennan et al. (2025a), applying object-based analysis to convective storms provides valuable insights into the characteristics of mesoscale convective systems, enhancing our understanding of their dynamics and environmental conditions. So far, not many climate simulation studies focusing on convection have made use of object-based analysis, and currently none have investigated hailstorms in climate simulations through this approach (Table 1). One reason for this might be that this type of analysis requires very high-frequency output from climate simulations. In this study, we make use of high-frequency hail diameter outputs (every 5 min) from high-resolution, convection-permitting simulations (Cui et al., 2024; Thurnherr et al., 2025; see also Sect. 2), which allows for detailed tracking of individual hailstorms and an object-based analysis of current and future climate hailstorms in Europe.
The simulations in Thurnherr et al. (2025) apply a pseudo-global warming (PGW) approach (Brogli et al., 2023) to simulate the effect of a 3 K global warming level on convective systems over Europe, including the online hail diagnostic HAILCAST to simulate hail diameter. According to these simulations, the 3 K global warming level leads to an increase in the number of hail days over northeastern Europe and a decrease over southwestern Europe during summer due to an increase and a decrease, respectively, in convective available potential energy and low-level moisture content (Thurnherr et al., 2025).
Kapsch et al. (2012)Sanderson et al. (2015)Brimelow et al. (2017)Prein et al. (2017a)Trapp et al. (2019)Rädler et al. (2019)Ashley et al. (2023)Gensini et al. (2024)Thurnherr et al. (2025)Table 1Overview of previous numerical modeling studies on climate change effects on hail that feature periods of more than 10 years. The entries provide, from left to right, information about the simulated region, the horizontal grid spacing, the number of horizontal grid points, the type of method used to infer hail information, the simulated period, and a flag related to hailstorm tracking.
Building on these results and using the same simulations, our study aims to assess the impact of global warming on hailstorm dynamics by integrating advanced numerical climate modeling with object-based analysis. We use a recently introduced hailstorm-tracking algorithm (Brennan et al., 2025a) to study the effect of anthropogenic climate change on hailstorm environmental conditions. We quantify how environmental conditions surrounding hailstorms differ under future climate conditions. Specifically, we aim to answer the following questions:
-
How do the lifetime and area of hailstorm tracks change with 3 K global warming?
-
How does the propagation speed of hailstorms change?
-
Does the hail swath area change, and how does the answer to this question depend on hail size?
-
Are there changes in the magnitude and structure of convective available potential energy (CAPE), convective inhibition (CIN), vertical wind shear, specific humidity, and potential temperature in the environment of the hailstorms?
-
Do the effects of climate change on hailstorm characteristics and environments geographically vary across Europe?
-
How do the storm-associated hazards precipitation and wind change along the hailstorm tracks?
To this end, the spatial distribution of storms and their characteristics are investigated (Sect. 3) using an object-based approach (Sect. 2.3). Additionally, environmental conditions surrounding hailstorms are analyzed through storm-centered composites (Sects. 4 and 5). Finally, the findings are summarized and conclusions are drawn in Sect. 6.
In this section, an overview of the methods and data utilized in this study is provided. The numerical climate simulations using COSMO v6 are detailed in Sect. 2.1, along with specifications on the hail parameterization HAILCAST in Sect. 2.2. This is followed by a description of the storm-tracking algorithm in Sect. 2.3.
2.1 COSMO climate simulations
This study builds on the COSMO model simulations discussed in Thurnherr et al. (2025). The COSMO model, a non-hydrostatic, limited-area numerical weather prediction (NWP) model, solves the equations governing compressible flow in a moist atmosphere on a rotated-pole grid with hybrid terrain-following height coordinates (Steppeler et al., 2003). Originally developed for operational NWP, the COSMO model has been widely used in scientific research at meso-β and meso-γ scales, particularly for convection-permitting weather forecasts (Baldauf et al., 2011; Klasa et al., 2018) and regional climate simulations (e.g., Ban, 2015). The simulations used in this study operate at a high resolution with a horizontal grid spacing of 2.2 km, enabling a fairly detailed representation of severe convective weather phenomena over the Alpine region on climatological timescales (Prein et al., 2013; Ban et al., 2014). This convection-permitting resolution is crucial for accurately capturing small-scale processes, such as organized, rotating thunderstorms, which are essential for understanding hailstorm dynamics. The two-dimensional fields of precipitation and hail (Sect. 2.2) were saved every 5 min, while other two- and three-dimensional fields (at eight pressure levels) were output hourly.
For the current climate, simulated precipitation and hail were rigorously validated against different types of observations, as documented in Cui et al. (2024). Despite limitations associated with the native grid resolution, this validation indicates that the overall spatial and seasonal patterns of hail activity are reasonably well captured. COSMO v6 is a limited-area numerical climate model, driven in this study at the lateral boundaries by ERA5 reanalysis data (Hersbach et al., 2020) for the current climate scenario. To project future climate conditions, a PGW approach was employed, incorporating a 3 K increase in global mean temperature (Schär et al., 1996; Hara et al., 2008; Leutwyler et al., 2016; Brogli et al., 2023). The specifics of the PGW simulation were described in Thurnherr et al. (2025). Both simulations were run for 11 years, covering the period 2011–2021. This method allows for a systematic comparison of hailstorm characteristics under current and projected future climate simulations, providing insights into the potential impact of global warming on hailstorm characteristics and environments. The control and PGW simulations are referred to as current climate and future climate simulations hereafter.
2.2 HAILCAST
CAM-HAILCAST (referred to as HAILCAST in this study) is a diagnostic hail growth parameterization that predicts maximum hailstone diameters reaching the ground and is designed for embedding in convection-permitting atmospheric models (Adams-Selin and Ziegler, 2016). It employs a one-dimensional cloud model coupled with a hail growth model, simulating processes such as liquid water accretion, ice particle collection, and sublimation while differentiating between wet and dry growth regimes. Notably, the horizontal advection of hailstones is neglected. This study focuses on the hail size as estimated from inserting a 10 mm embryo. For further details on how HAILCAST is implemented in the model, we refer to Cui et al. (2024).
2.3 Hailstorm-tracking algorithm
Hailstorms are comparatively small-scale weather systems that can propagate at high speeds. This makes it challenging for tracking tools to maintain continuity, as these features may not spatially overlap between consecutive model output time steps. This study's storm-tracking algorithm, introduced by Brennan et al. (2025a), first detects hailstorms as two-dimensional objects, defined by grid points where the hail diameter surpasses a threshold of 10 mm, and then tracks these objects in time, using various thresholds and parameters.
The algorithm begins by identifying features as local maxima in simulated hail diameter. These features are then grown in two dimensions until the threshold diameter is reached and subsequently segmented using a watershed algorithm. Objects with dhail>10 mm were tracked, and those with a prominence greater than 10 mm or maxima separated by more than six grid points were divided using a watershed algorithm. The area threshold was set to nine grid points, and finally the storm mask was expanded by one grid point through binary dilation to enhance tracking robustness. The algorithm anticipates forward movement by shifting labeled areas based on a weighted mean of previous movement vectors. Correspondence between features across time steps is determined by calculating tracking probability scores, with mechanisms to handle complex feature interactions such as splitting and merging. Features must exist for at least 15 min in order to be included in the tracks.
Further, the tracks help mitigate the “fishbone effect”, which arises from the discontinuous hail swaths caused by low temporal sampling of fast-moving storms. To this end, a gap-filling method interpolates storm footprints between time steps, translating them along the storm's movement vector to reconstruct a continuous swath while preserving small-scale details. More details about the gap filling and the tracking algorithm can be found in Brennan et al. (2025a).
Appendix A explains how the bootstrapping methodology was employed to grid the hail tracks.
2.4 Storm-centered composites
For all tracked cells (Sect. 3) with lifetimes ≥1 h, atmospheric fields within a radius of r=60 km of the storm center were extracted at every full hour of storm evolution (Fig. 1). These extracted footprints were then rotated so that their respective storm-mean propagation vectors aligned with the abscissa. The atmospheric fields of the extracted footprints are later used to construct storm-centered composites (Sect. 4) and assess the response of the hailstorms to the inflow environment (Sect. 5).
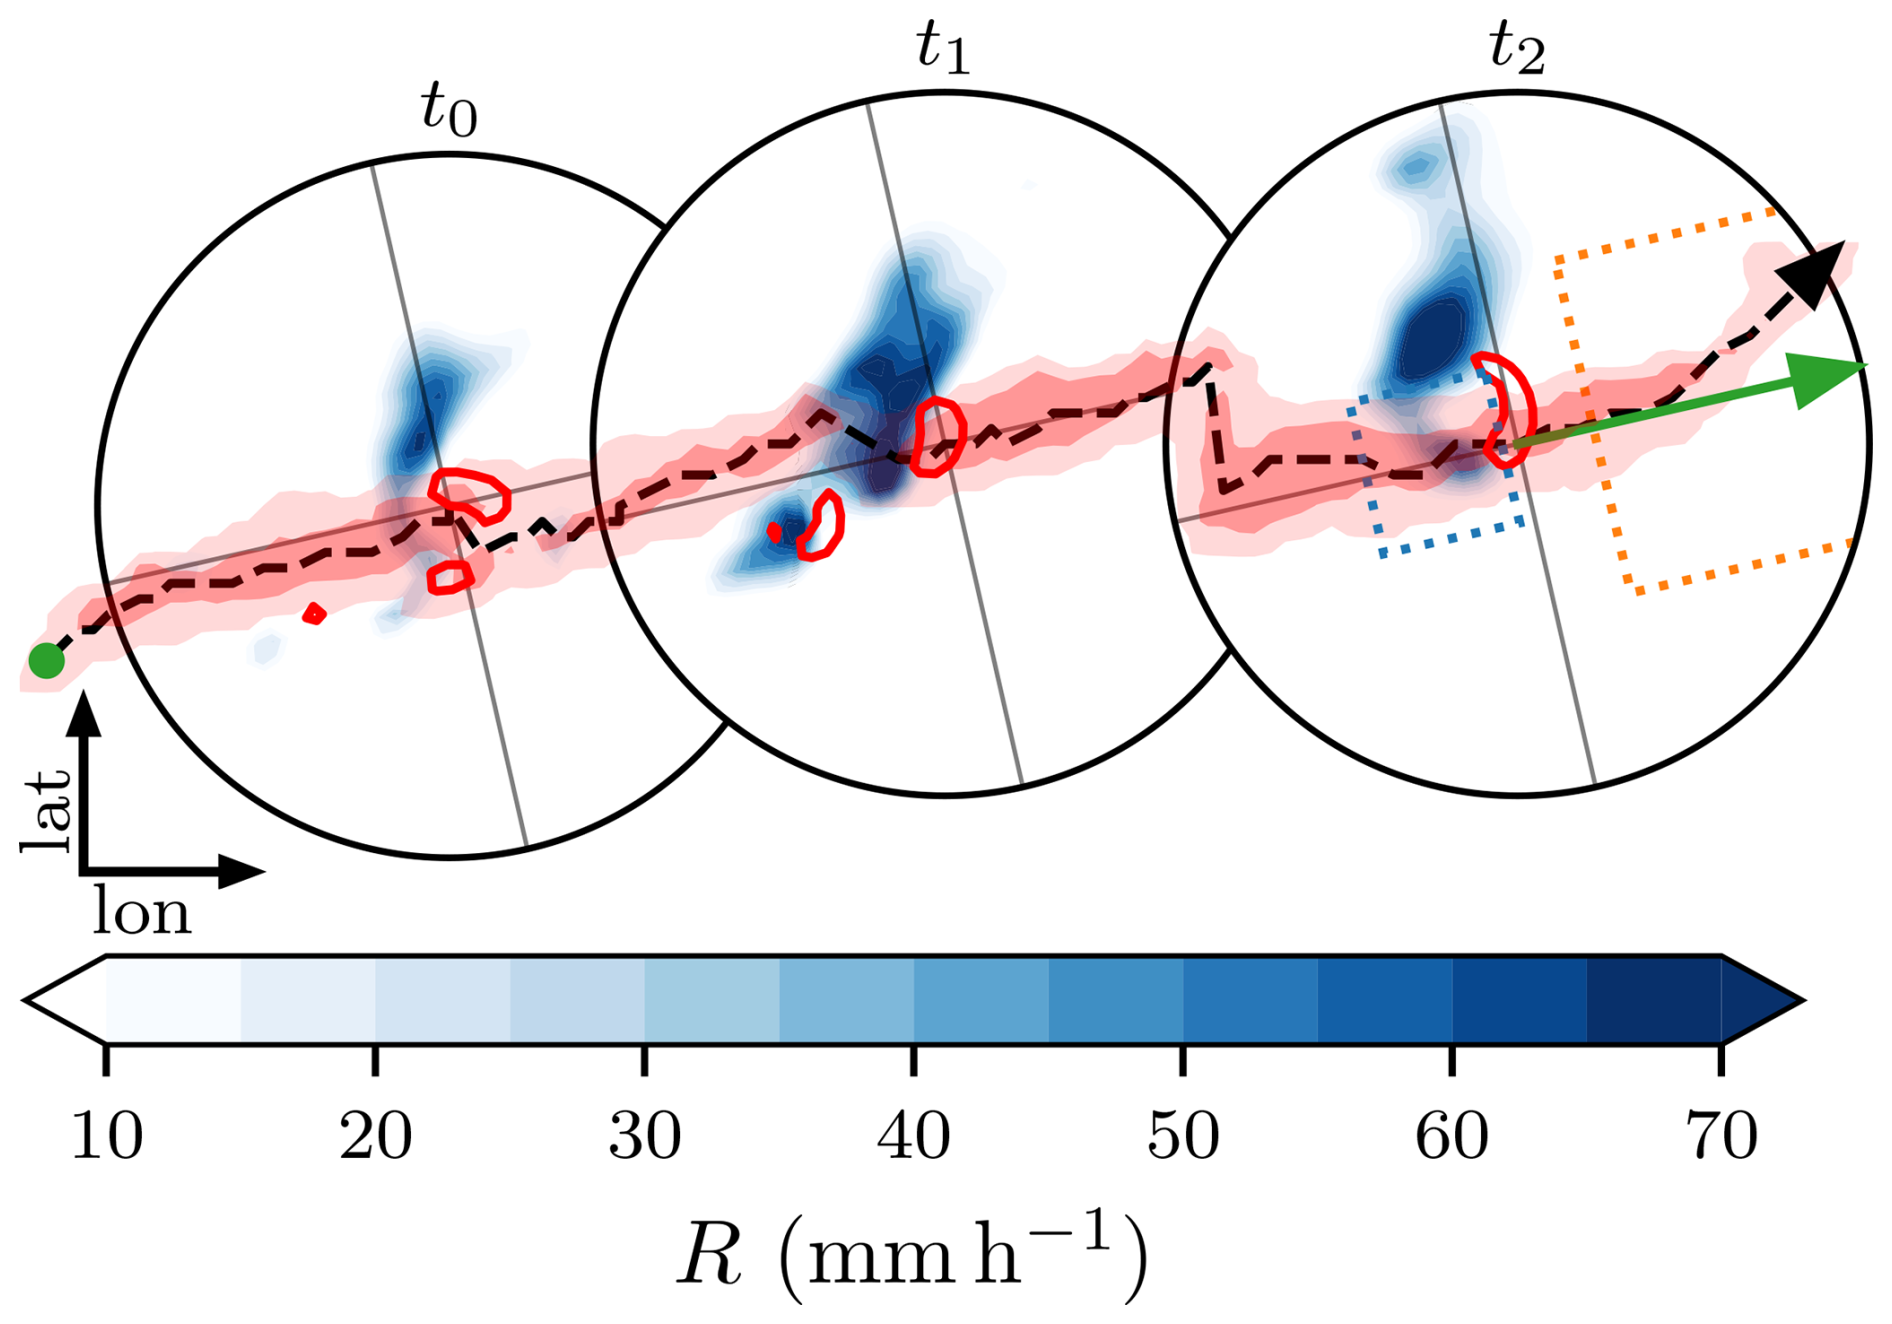
Figure 1Schematic view of three footprints (black circles) extracted along an example storm track at intervals of 1 h. Blue shading shows the 5 min rain rate, red shading shows the extent of the dhail>10 and 20 mm hail swath, red contours indicate 10 m s−1 updraft at 400 hPa, and the black dashed line and arrow reveal the storm track and direction of movement, respectively. The green arrow indicates the mean propagation vector (over the entire storm lifetime), and the crosshairs reveal the orientation of the footprints relative to their propagation and the footprint centers. This crosshair is also featured in the composite plots. The start of the storm track is indicated with a green circular marker. The orange dotted line indicates the extent of the inflow sector of the storm, which is a 50×50 km2 box, 10 km ahead of the storm center, while the blue dotted box, which is a 20×20 km2 box, 2 km behind the storm center is used for rain-after-hail assessment.
In this section, we discuss the results of tracking hailstorms in the climate simulations using the algorithm introduced in Sect. 2.3. We analyze the spatial distribution of hailstorm tracks, as well as the characteristics of these storms, including maximum hail diameter, mean storm area, lifetime, and propagation velocity. In the 11 simulated years, 39 594 and 37 746 (−4.7 %) hailstorms with lifetimes ≥1 h were tracked within the model domain for current and future scenarios, respectively (see Table S1 in the Supplement), of which 671 and 711 occur in DJF, 4425 and 4439 in MAM, 25 289 and 22 393 in JJA, and 9209 and 10 203 in SON for current and future climate simulations, respectively. In the next paragraphs, we explore the characteristics of these tracked storms.
Generally, in line with the Eulerian analysis in Thurnherr et al. (2025), the storm tracks in both the current and future simulations in summer (JJA) are mostly constrained to land, with only a few tracks over the ocean (Fig. 2a, b). In the current climate simulation, the maximum density of tracks is located just south of the main Alpine crest in the Po Valley (Fig. 2a). A distinct minimum of fewer than five storms per summer follows the main Alpine crest from southeastern France to Austria. The maximum in the future simulation is shifted to the east, towards northeastern Italy, southern Austria, and Slovenia (Fig. 2b). This shift is also evident in the difference field, with a positive significant change in hail track density along the eastern Alps, with the bulk in Austria (Fig. 2c). The hail track density is significantly reduced in the band spreading from the Iberian Peninsula, through France, northwestern Italy, northern Germany, and northern Poland. In spring (MAM), only very few hailstorm tracks were found in both the current and future climate simulations. These tracks mainly occur in eastern Europe (Fig. S1a, b in the Supplement), but due to the low numbers, trends are difficult to investigate (Fig. S1c). In autumn (SON), the hailstorm tracks are predominantly located over the Mediterranean Sea (Fig. S1g, h), and trends in the number of storm tracks are mostly positive (Fig. S1i). Our analysis reveals that the spatial distribution of hail tracks in the COSMO v6 current-climate simulation aligns well with the observed climatology in the Alpine region, as reported by Nisi et al. (2018). The spatial distribution of the hailstorm tracks with lifetimes of 1 h or more are similar to that of supercells in the same simulations (Feldmann et al., 2025), with some exceptions. In current climate simulations, the supercell distribution features a less pronounced hot spot in the Po Valley accompanied by a less distinct inner-Alpine minimum compared to the hailstorm density (Fig. 2a). In future climate simulations, there are again more supercells in the inner-Alpine region, whereas the hail cells retain a minimum along the main Alpine crest (Fig. 2b).
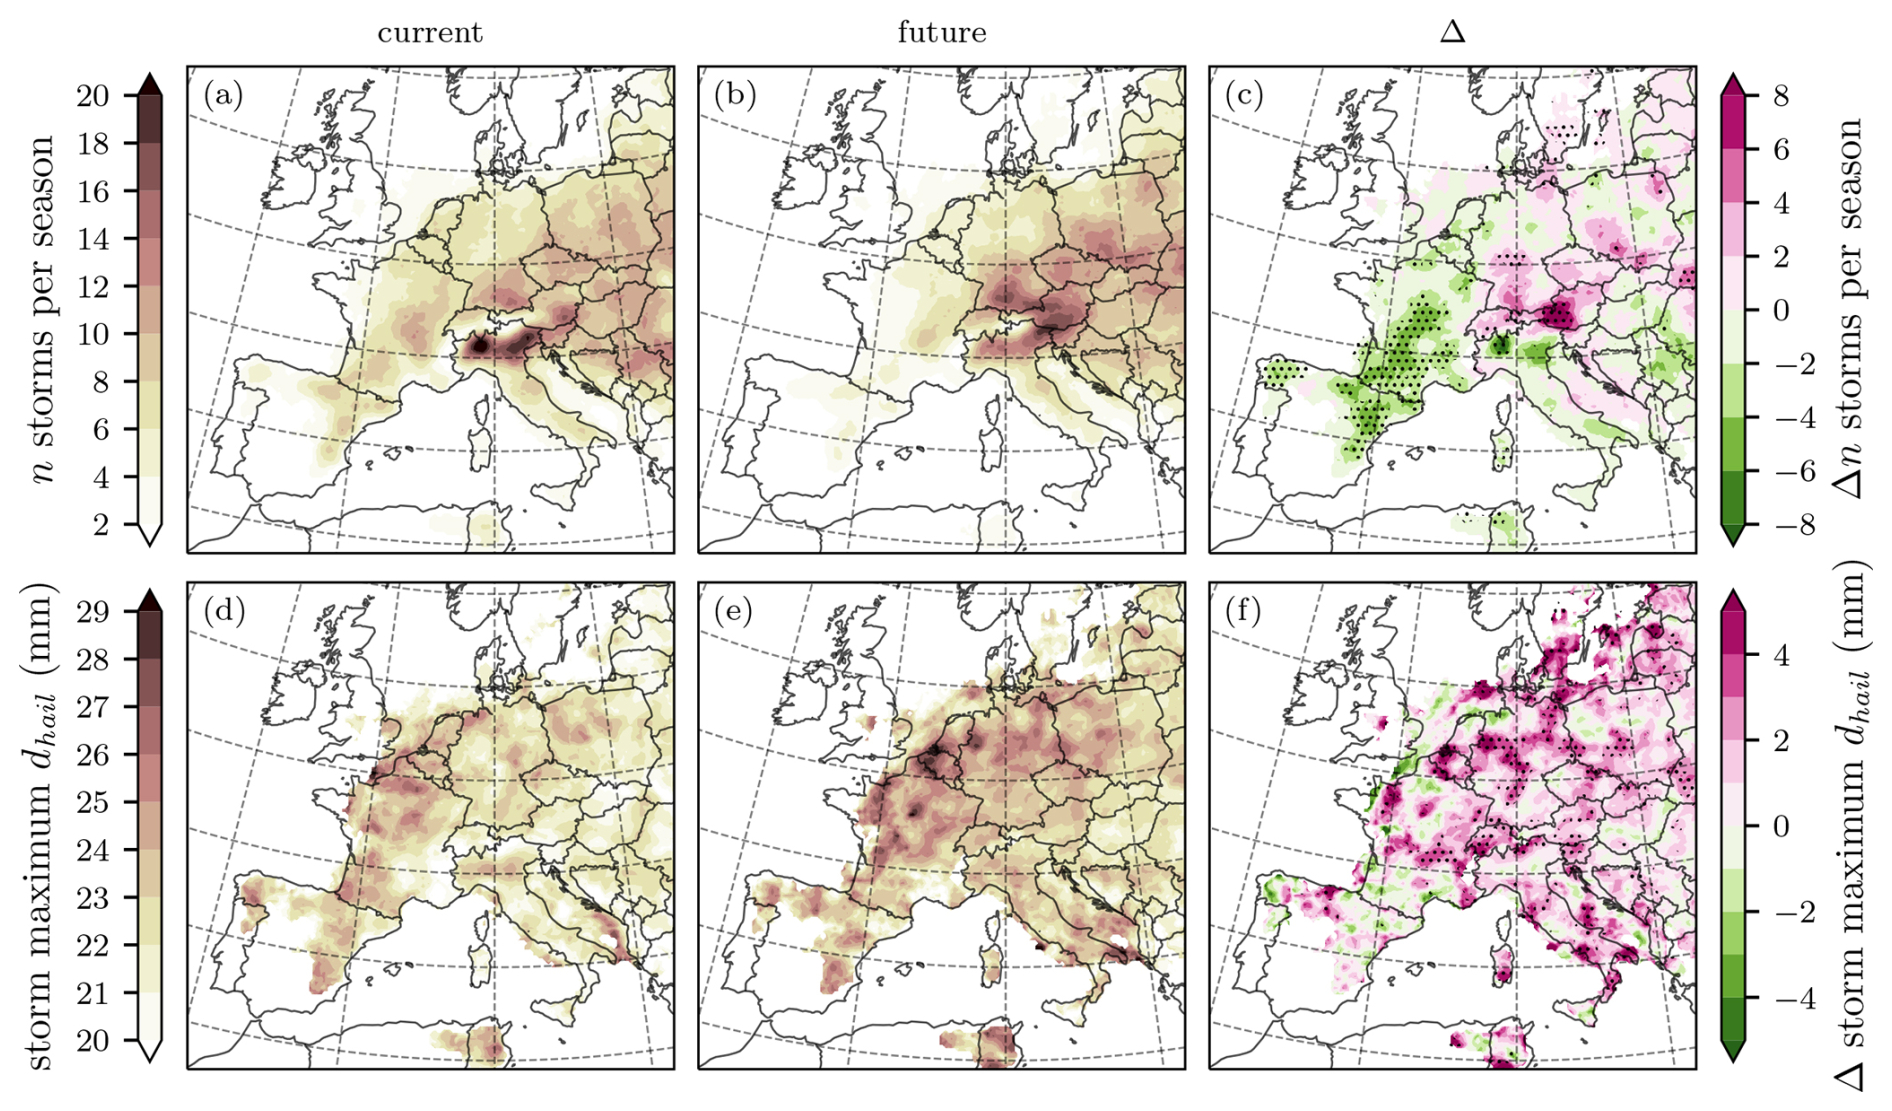
Figure 2Number of tracked storms per season with lifetimes ≥1 h in JJA in the (a) current and (b) future climate (n=25 289 and 22 393 respectively). Values correspond to the number of storms within a circle with radius r=50 km. (c) shows the difference between (b) and (a), i.e., between future and current climate simulations (filled contours); dots indicate regions where the difference is significant (>2σ according to n=1000 bootstrap samples; see Appendix A). Panels in the second row (d–f) are organized identically to the ones in the first row but for maximum hail diameter (averaged over storms within a circle of radius r). In all panels, values are shown only at grid points with more than three storms per season. The latitude and longitude grid lines have spacings of 5 and 10°, respectively.
Storm maximum hail diameters are, on average, in the range of 18 to 25 mm throughout Europe. The geographical distribution of mean storm maximum hail diameters lacks any prominent features, with the exception of some local maxima along the North Sea coast in the future simulation (Fig. 2d, e). However, the mean of storm maximum diameters is projected to increase significantly in most of Europe by +1 to +4 mm, with only a few areas showing weak negative trends (along the Pyrenees, the English Channel, and the North Sea coast; Fig. 2f). Across the domain, the climate signal for the mean storm maximum hail diameter is +3.6 % (Fig. S3c).
Furthermore, mean instantaneous storm areas (as defined by the area that exceeds 10 mm hail diameter; see Sect. 2.3 for details) have values ranging from 100 to 280 km2, and they exhibit no distinctive features in the overall spatial distribution, with the exception of a local maximum in central Germany in the future climate (Fig. 3a, b). By contrast, significant positive differences of +40 km2 prevail across most of Europe (Fig. 3c). Averaged across the domain, the climate signal for the mean storm area amounts to +10.3 % (Fig. S3b).
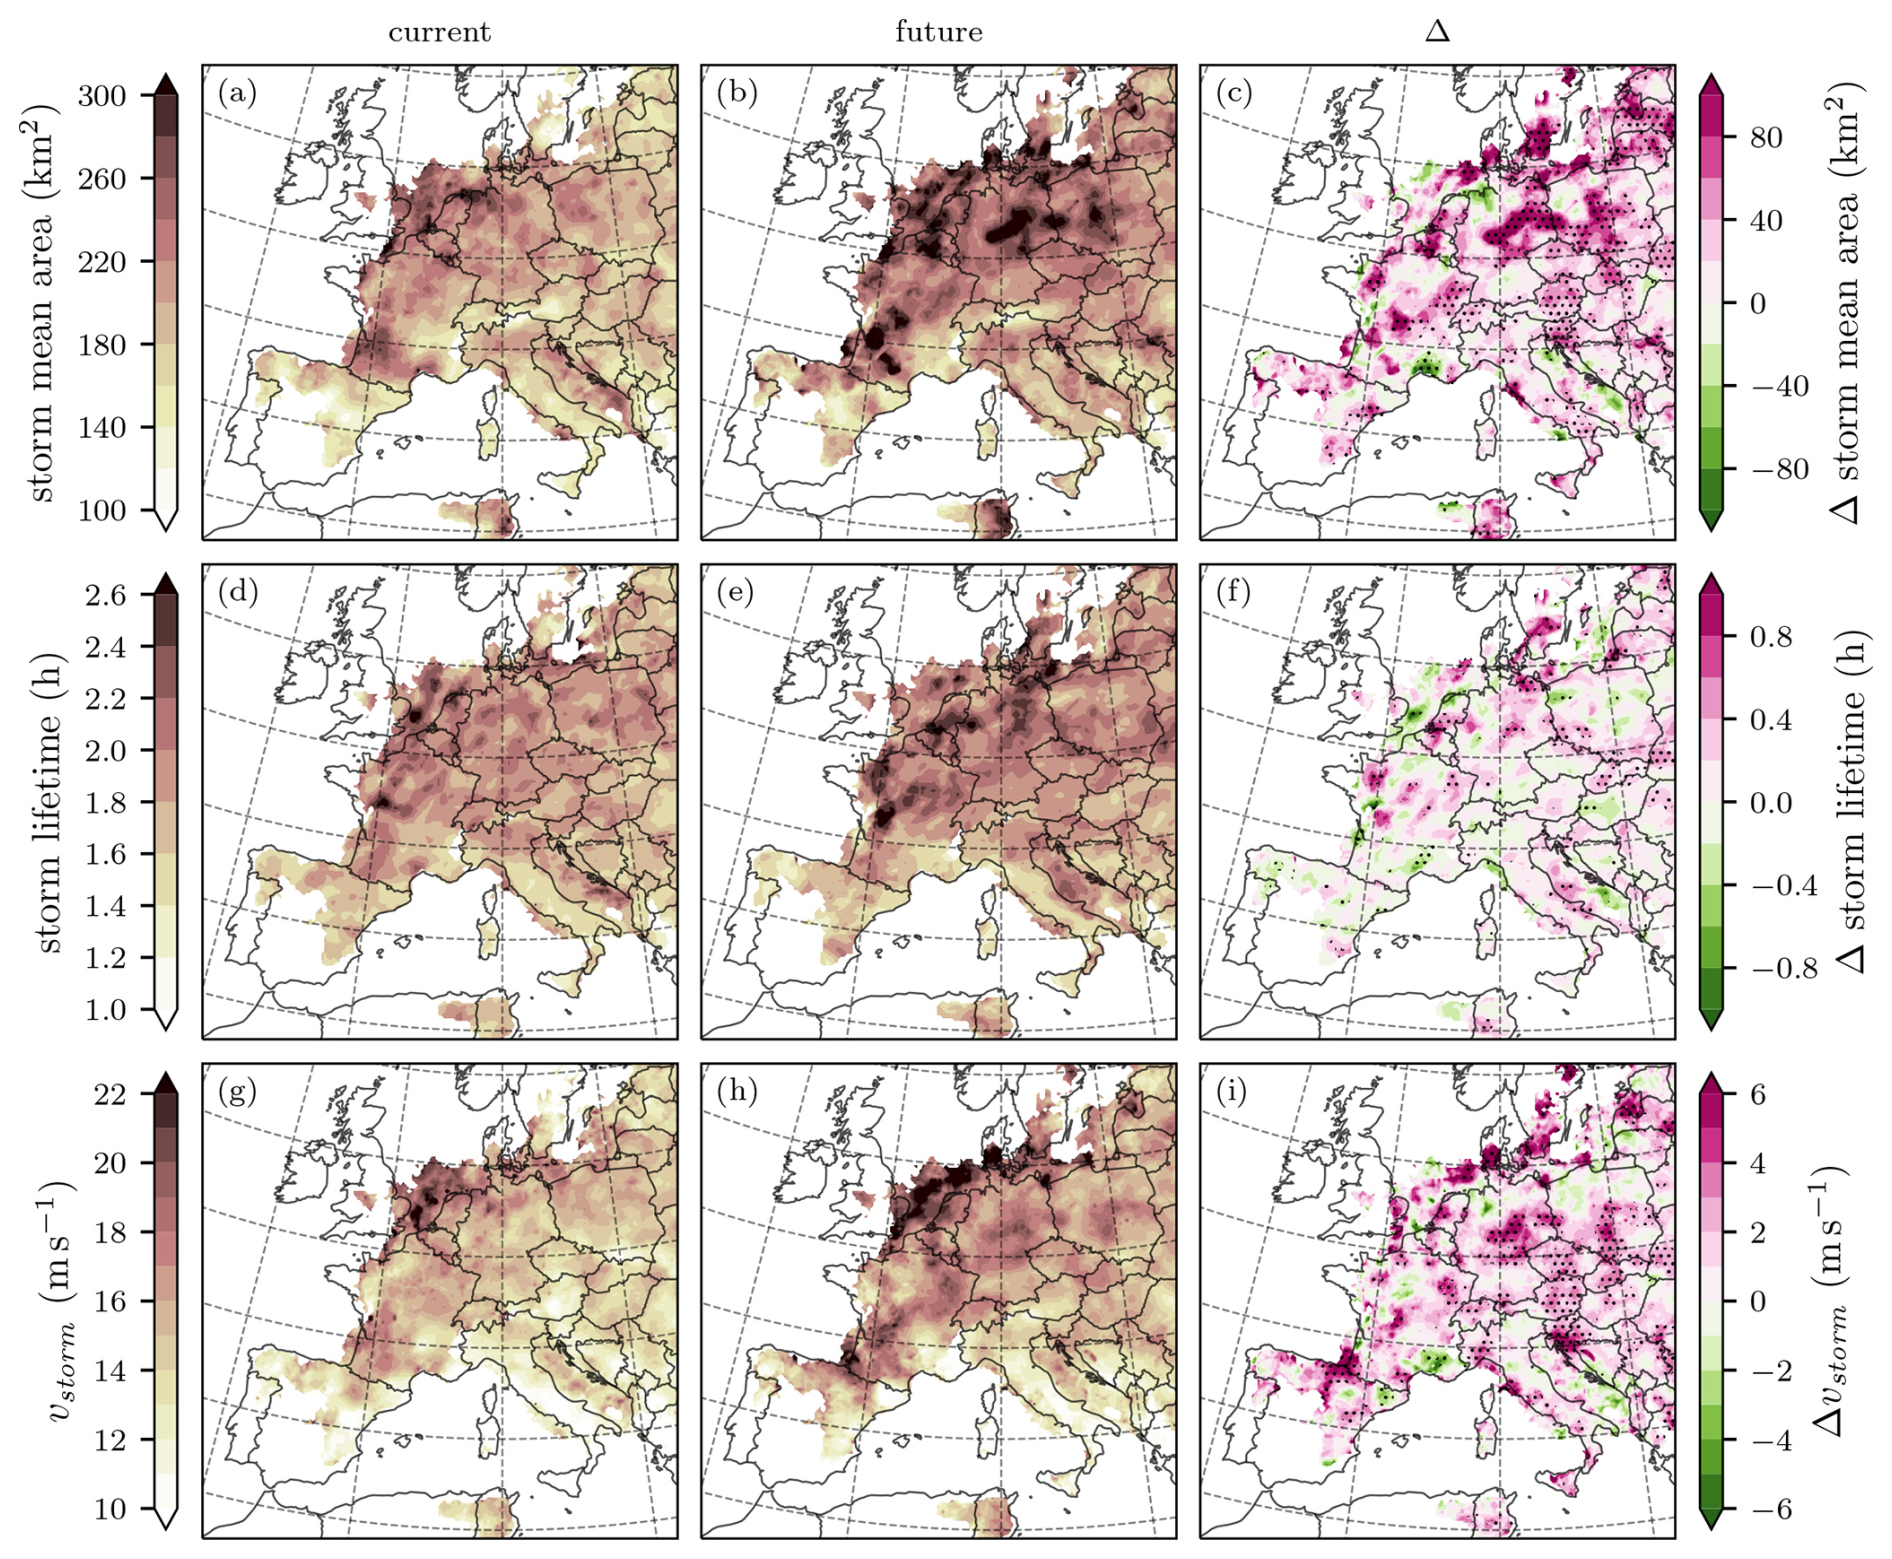
Figure 3Same as Fig. 2 but for (a–c) mean storm area, (d–f) mean storm lifetime, and (g–i) mean storm propagation velocity.
The distribution of mean storm lifetimes exhibits only weak spatial features across the domain (Fig. 3d, e). Additionally, changes in storm lifetime have opposite signs in close proximity, indicating high variability and most likely no robust signals in the relatively short simulations. Only some larger areas in eastern France, Germany, and parts of eastern Europe show coherent positive, significant signals (Fig. 3f). Within the whole domain, the climate signal for the mean storm lifetime is +1.7 % (Fig. S3a) and therefore comparatively weak.
Further, mean storm propagation velocity exhibits a weak south-to-north gradient, with higher velocities further north (Fig. 3g, h). Changes in storm propagation velocity are overwhelmingly positive, with values in the range of +1 to +3 m s−1. These positive changes are significant in regions throughout the domain (Fig. 3i). Spatially averaged, the climate signal for the mean storm propagation velocity is +7.3 % (Fig. S3d). Because storm lifetimes remain largely unchanged, the increase in propagation velocity implies that storms cover larger areas throughout their existence.
These gridded visualizations of storm track density illustrate the spatial variability in storm activity and the effects of climate change, with notable increases in track density in northeastern Italy, southern Austria, and Slovenia under future conditions. These results are largely consistent with the tracking-independent Eulerian hailstorm frequency analysis in Thurnherr et al. (2025). By employing tracking methods, the analysis of storm characteristics, including maximum hail diameter, mean storm area, lifetime, and propagation velocity, provides insights that go beyond traditional Eulerian analysis and allow for a more nuanced understanding of storm evolution and variability under future climatic conditions. The observed trends, such as the increase in mean maximum hail diameter and storm area, and the predominantly positive changes in storm propagation velocity, underscore the importance of understanding the behavior of individual storms under changing climatic conditions. The changes in these properties are spatially relatively uniform. The tracking-based analysis highlights that, while the change in hailstorm frequency varies regionally, the hailstorm property changes are surprisingly consistent across regions. Such findings are less apparent in Eulerian approaches, emphasizing the added value of storm tracking for dissecting storm behavior. These results hint towards a spatially heterogeneous effect of climate change on storm initiation but homogeneous effects on storm evolution. In regions where hailstorm frequency decreases – such as central France – CAPE is reduced and CIN increases in the seasonal Eulerian mean, consistent with less frequent convective initiation (Thurnherr et al., 2025).
A critical aspect of hailstorm impacts is the spatial extent of hailfall, which determines the overall affected area. In the following, we investigate how climate change influences the per-storm hail swath area and relate this to hailstorm frequency changes. To this end, we investigate how the hail swaths (i.e., per-storm time-integrated area affected by a certain hail diameter threshold; see Fig. 1) change between hailstorms in current and future climate simulations. Specifically, we compare the gap-filled (see Sect. 2.3) hail swath area as a function of hail diameter and the corresponding frequency distributions between the two simulations. This analysis reveals a slight decrease in the frequency of storms with a maximum hail diameter of ≤30 mm and a more increased frequency above that, while a 2-fold increase of hailstorms with maximum diameters above ∼50 mm is simulated (Fig. 4a).
Per-storm hail swath areas increase for all but the smallest hail diameters (≤11 mm), while the largest positive change in hail swath area is simulated for the 15 mm diameters (+38 %, Fig. 4b). Swath areas for hail diameters between 20 and 40 mm increase by 16 %–21 %. For hail diameters beyond 50 mm, the increase in swath area is again substantial but also more uncertain due to the smaller sample size (>30 %, Fig. 4b). When considering the combined impact resulting from changes in frequency and swath area, the changes due to increasing swath area are more important for hail diameters below 40 mm, while for larger diameters, changes in storm frequency dominate (Fig. 4a, b).
This analysis was repeated for adapted PRUDENCE regions, as documented in the Supplement (Christensen and Christensen, 2007; see Figs. S2, S17–S28). Most regions follow the behavior of the entire simulation domain with respect to hail swath frequencies and areas (Fig. 4a, b), with some distinct exceptions. Notably, the Baltic region features a projected increase in frequency and area of more than 30 % across all but the smallest hail diameters (Fig. S18b). Further, swath frequencies and areas in the British Isles remain mostly unchanged under climate change (Fig. S19a, b). France and the Iberian Peninsula exhibit reduced frequencies for most hail diameters accompanied by a lack of increased area for large hail diameters (Fig. S22a, b). Projections for the Mediterranean region reflect a slightly reduced hail swath area for larger hail diameters (Fig. S25a, b).
The hail swath area analysis reveals changes in the combination of area and hail diameter that are not directly evident from Eulerian methods. The multi-fold increase in hail-affected areas of hailstorms in the future climate simulations – particularly evident for the large hail diameters – is most important to keep in mind when assessing future hail risk. This increase suggests that hail-producing storms in the future will not only be more intense but also impact a significantly larger area, which could exacerbate damage to infrastructure, agriculture, and insurance costs. Understanding these spatial changes is critical for improving risk assessment models and developing adaptation strategies to mitigate the effects of more widespread hailstorms. To this end, we present an extensive dataset of hail swaths compiled within this study, which is well-suited for stochastic resampling techniques (e.g., Schröer et al., 2023) and can be effectively utilized as a hazard component in hail damage modeling (e.g., Schmid et al., 2024). By leveraging this dataset, researchers and policymakers can gain deeper insights into the evolving risk landscape of hailstorms and refine mitigation strategies. It includes 39 594 and 37 746 hail swaths for current and future climates, respectively. The dataset is available as explained in the “Code and data availability” section.
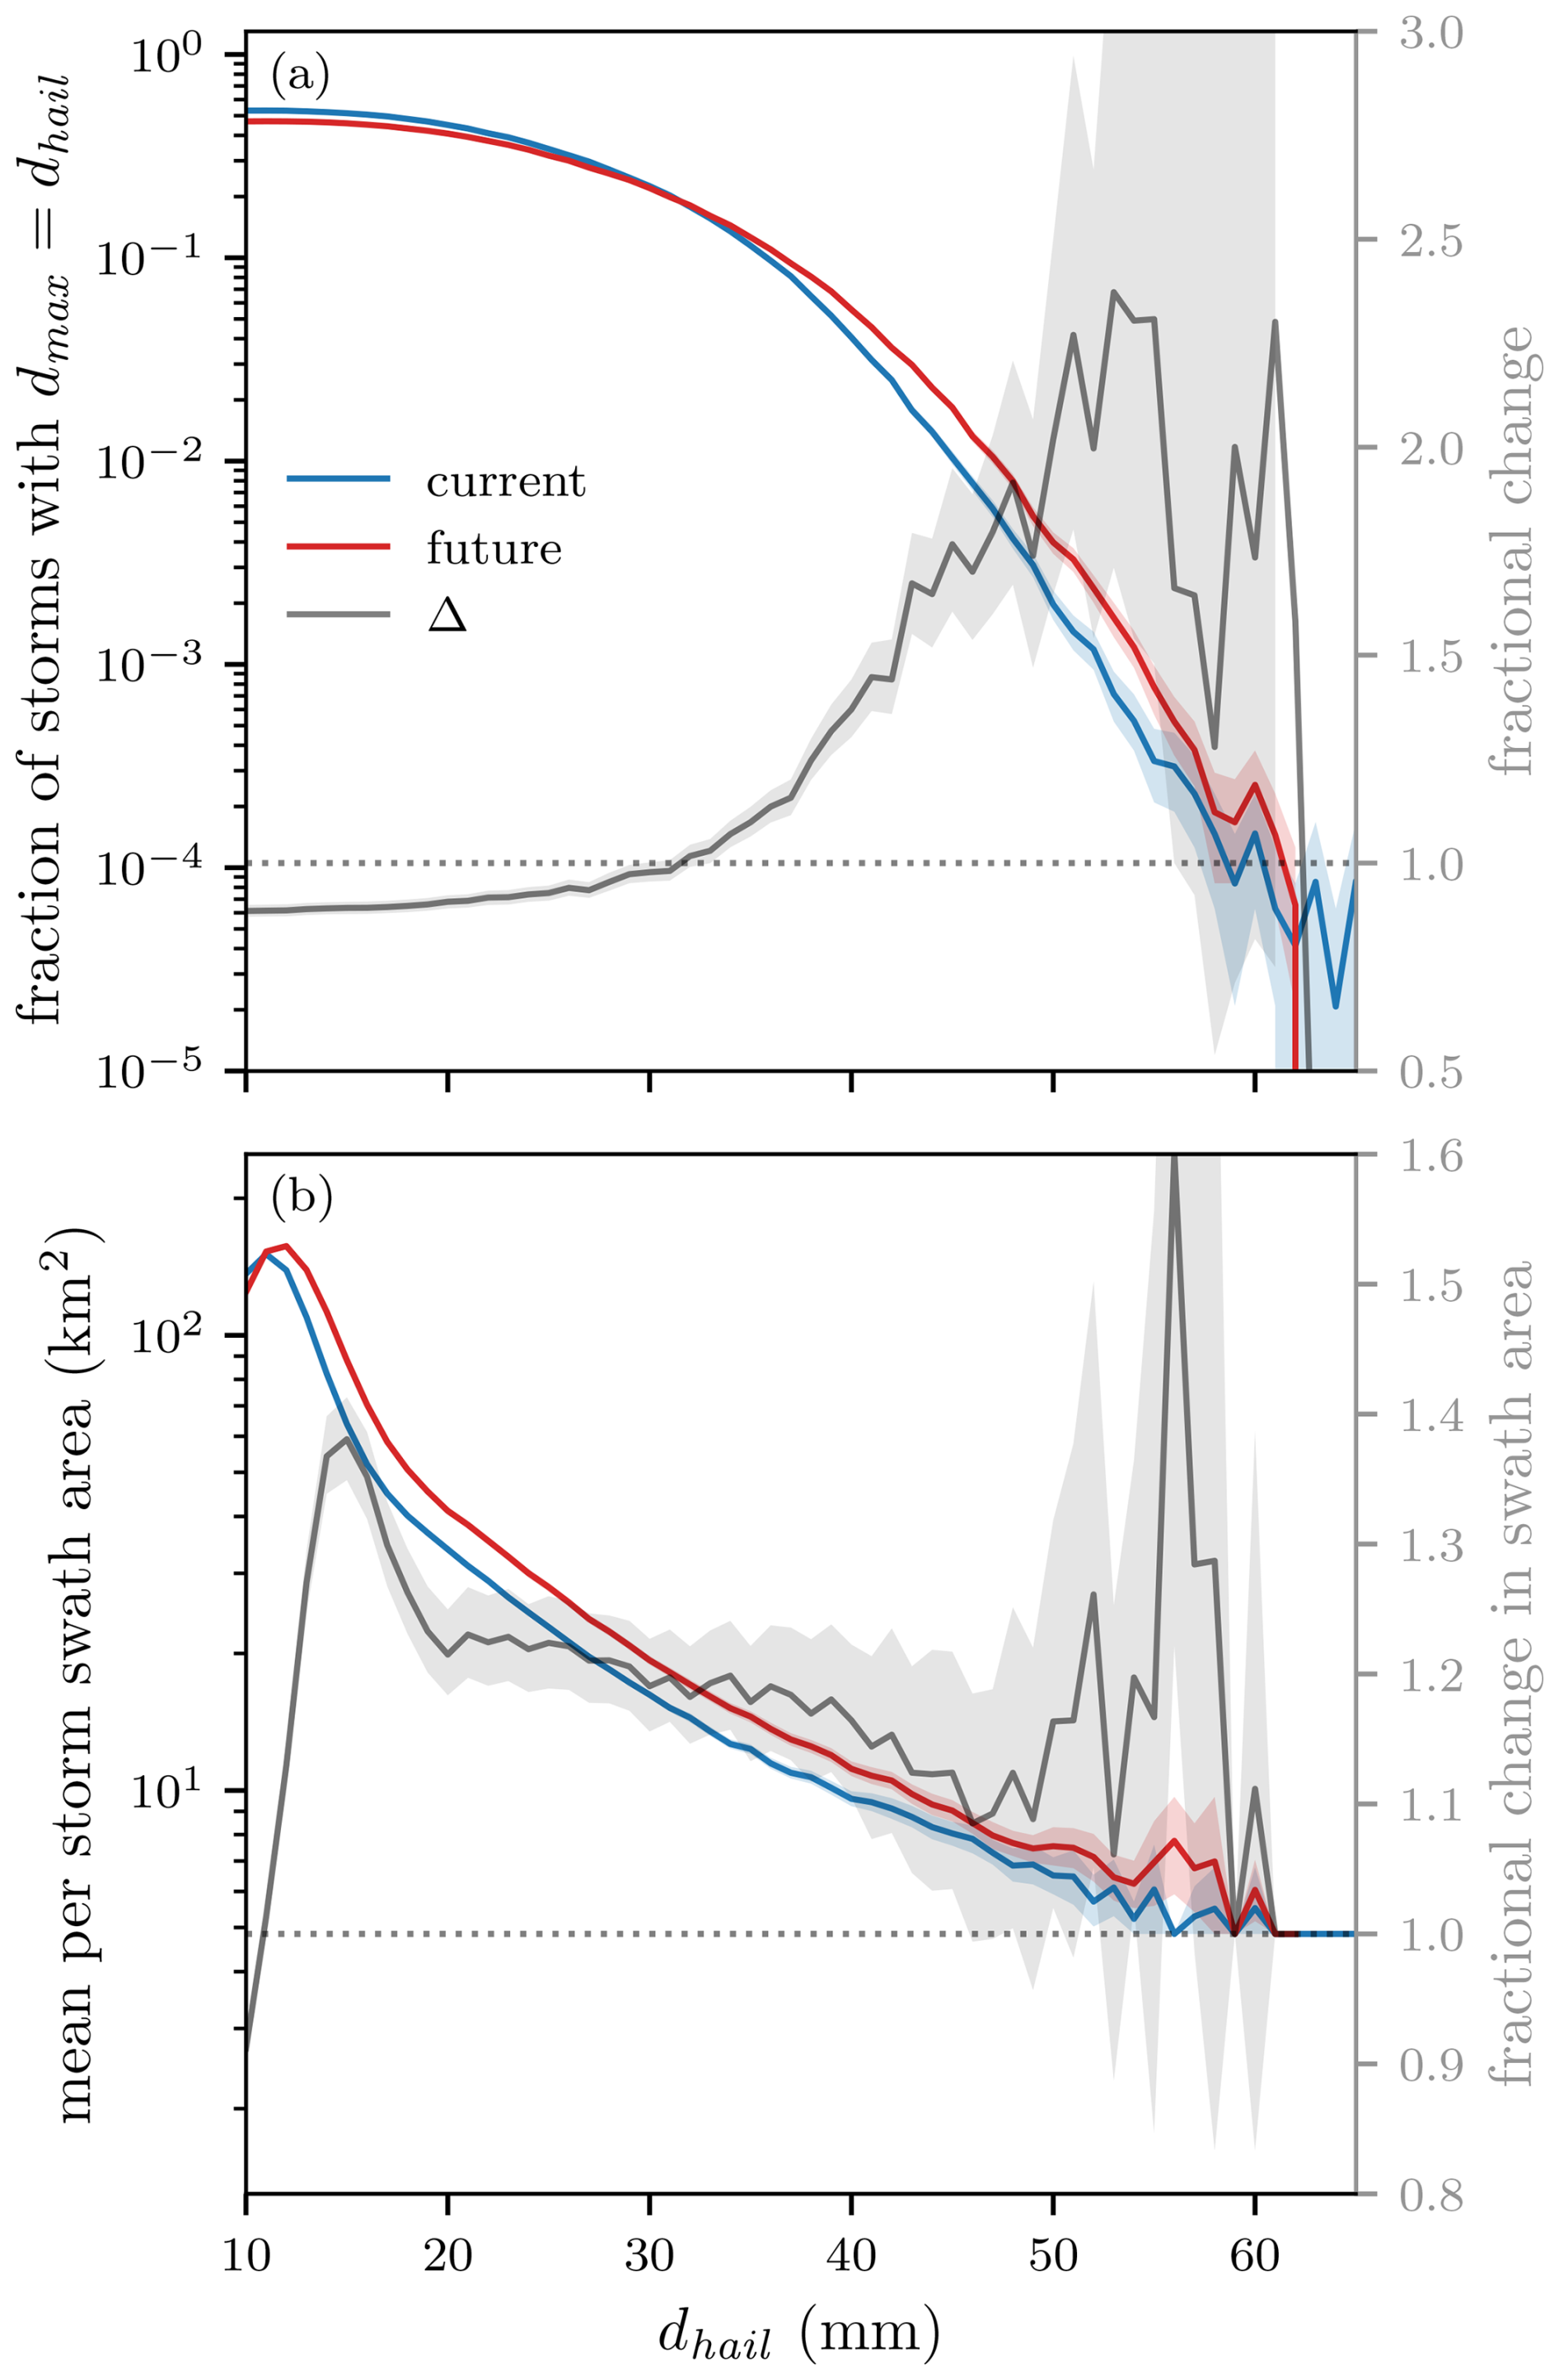
Figure 4Hail swath statistics as a function of maximum hail diameter for all >1 h hailstorms simulated in JJA: (a) fraction of storms that exhibit a particular maximum hail diameter in current (blue) and future (red) climate simulations (n=25 289 and 22 393 storms, respectively) and the fractional change between the two periods (gray). (b) Mean per-storm swath area for a given maximum hail diameter in current (blue) and future (red) periods. The gray lines show relative changes in the swath area impacted by respective hail diameters. Computations for both panels are performed for 1 mm wide bins, and shaded areas show the 5th–95th percentile range of n=1000 bootstrapped samples of the gap-filled hail swaths (see Sect. 2.3). The mean total swath area is 1416 and 1635 km2 for current and future hailstorms, respectively. Equivalent figures for the different subdomains are included in the Supplement (Figs. S17–S28).
In order to examine the potential factors that influence shifts in hailstorm characteristics under a warming climate, we focus on storm-centered composites of the most intense events (Sect. 4).
We now investigate storm-centered composites, which focus on the central point in space of each storm footprint and aggregate various meteorological variables around these points, providing a detailed spatial and temporal view of the storms' immediate vicinity, for both the current and future climate scenario. By centering the analysis on the storms themselves, we can accurately capture the atmospheric conditions associated with hailstorm genesis, evolution, and dissipation, as well as the spatiotemporal structure of the storms. To characterize the environment of the storms, we consider in particular temperature, specific humidity, winds, and CAPE.2 The storm-centered composites thus provide a complementary perspective to the track-based analysis, enabling precise identification of the environmental signatures that accompany hail-producing storms.
A total of n=31 899 and 28 259 footprints were extracted for current and future scenarios in JJA, respectively (see Sect. 2.4 for details). These footprints were further filtered to consider only footprints of the most intense storms during their most intense period.3 To this end, the 10 % of all-season storm-centered footprints yielding the largest hail diameters were chosen for constructing the composite (n=3641 and 3284 footprints for current and future climate simulations, respectively, in the entire simulation domain in JJA; see Table S1 and Fig. S4). Our approach is similar to previous studies that presented composites of convective storms (e.g., Prein et al., 2017a; Brennan et al., 2025a; Arnould et al., 2025).
4.1 Current climate
From the storm-centered composites of the current-day simulations, the archetypal hailstorm structure emerges (Fig. 5). At ground level, the potential temperature field exhibits a pronounced gradient of 4 K over 25 km, oriented 45° from the direction of storm movement, with a minimum situated just behind the hail shaft (Fig. 5f). This temperature minimum aligns with a pressure maximum, both resulting from downdraft air generated by intense precipitation and evaporative cooling. The wind vector field reveals near-ground divergence at this point, where the downdraft transitions into horizontal wind at the surface (Fig. 5c). Approximately 20 km ahead of the storm, a convergence area is noticeable in the 10 m wind field, indicating the onset of the updraft column.
At the inflow level, around 850 hPa,4 there is a maximum of specific humidity where air converges with a cyclonic component in the absolute horizontal wind field, reaching a value of 12.8 g kg−1 (Fig. 5e). Higher up, at 400 hPa, where the updraft core is situated (Fig. 5e), the horizontal winds near the storm are influenced by the synoptic situation, primarily determined by the horizontal pressure gradient and largely unaffected by the storm. On average, the storm's updraft core at this altitude spans no more than 10 km. Because storm tracking is conducted on the hail field, which is highly congruous to the vertical wind maxima, the vertical wind signatures align well, resulting in a well-defined composite structure. The co-location of hail and updraft maxima is expected, as HAILCAST does not consider the horizontal advection of hailstones.
Approximately 5 km behind the storm center, a peak in rainfall occurs, with mean rates reaching 35 mm h−1 (Fig. 5b). The precipitation footprint is asymmetric, extending further to the left relative to the storm's motion. Conversely, the outline of cloud water slightly leads the storm center due to the vertical shear (Fig. 5b). Graupel is explicitly included in the COSMO microphysics and is subject to horizontal advection, which, however, results in only a slight offset of the graupel maximum from the storm center to the left relative to cell movement (Fig. 5a). The location of the graupel maximum provides an upper limit on potential hail advection, as graupel has a lower terminal velocity than the smallest hailstones, allowing more time for horizontal advection.
Finally, we consider CAPE values, which decrease rapidly as the storm approaches. CAPE values reach 1600 J kg−1 on average 25 km ahead of the storm, but they drop below 400 J kg−1 just as the storm passes (Fig. 5d). The CAPE field exhibits an asymmetry, and the largest values are located to the right (relative to the movement direction of the storm), in front of the updraft. The thunderstorm anvil cloud extends beyond the 40 km window size ahead of the storm (Fig. 5d).
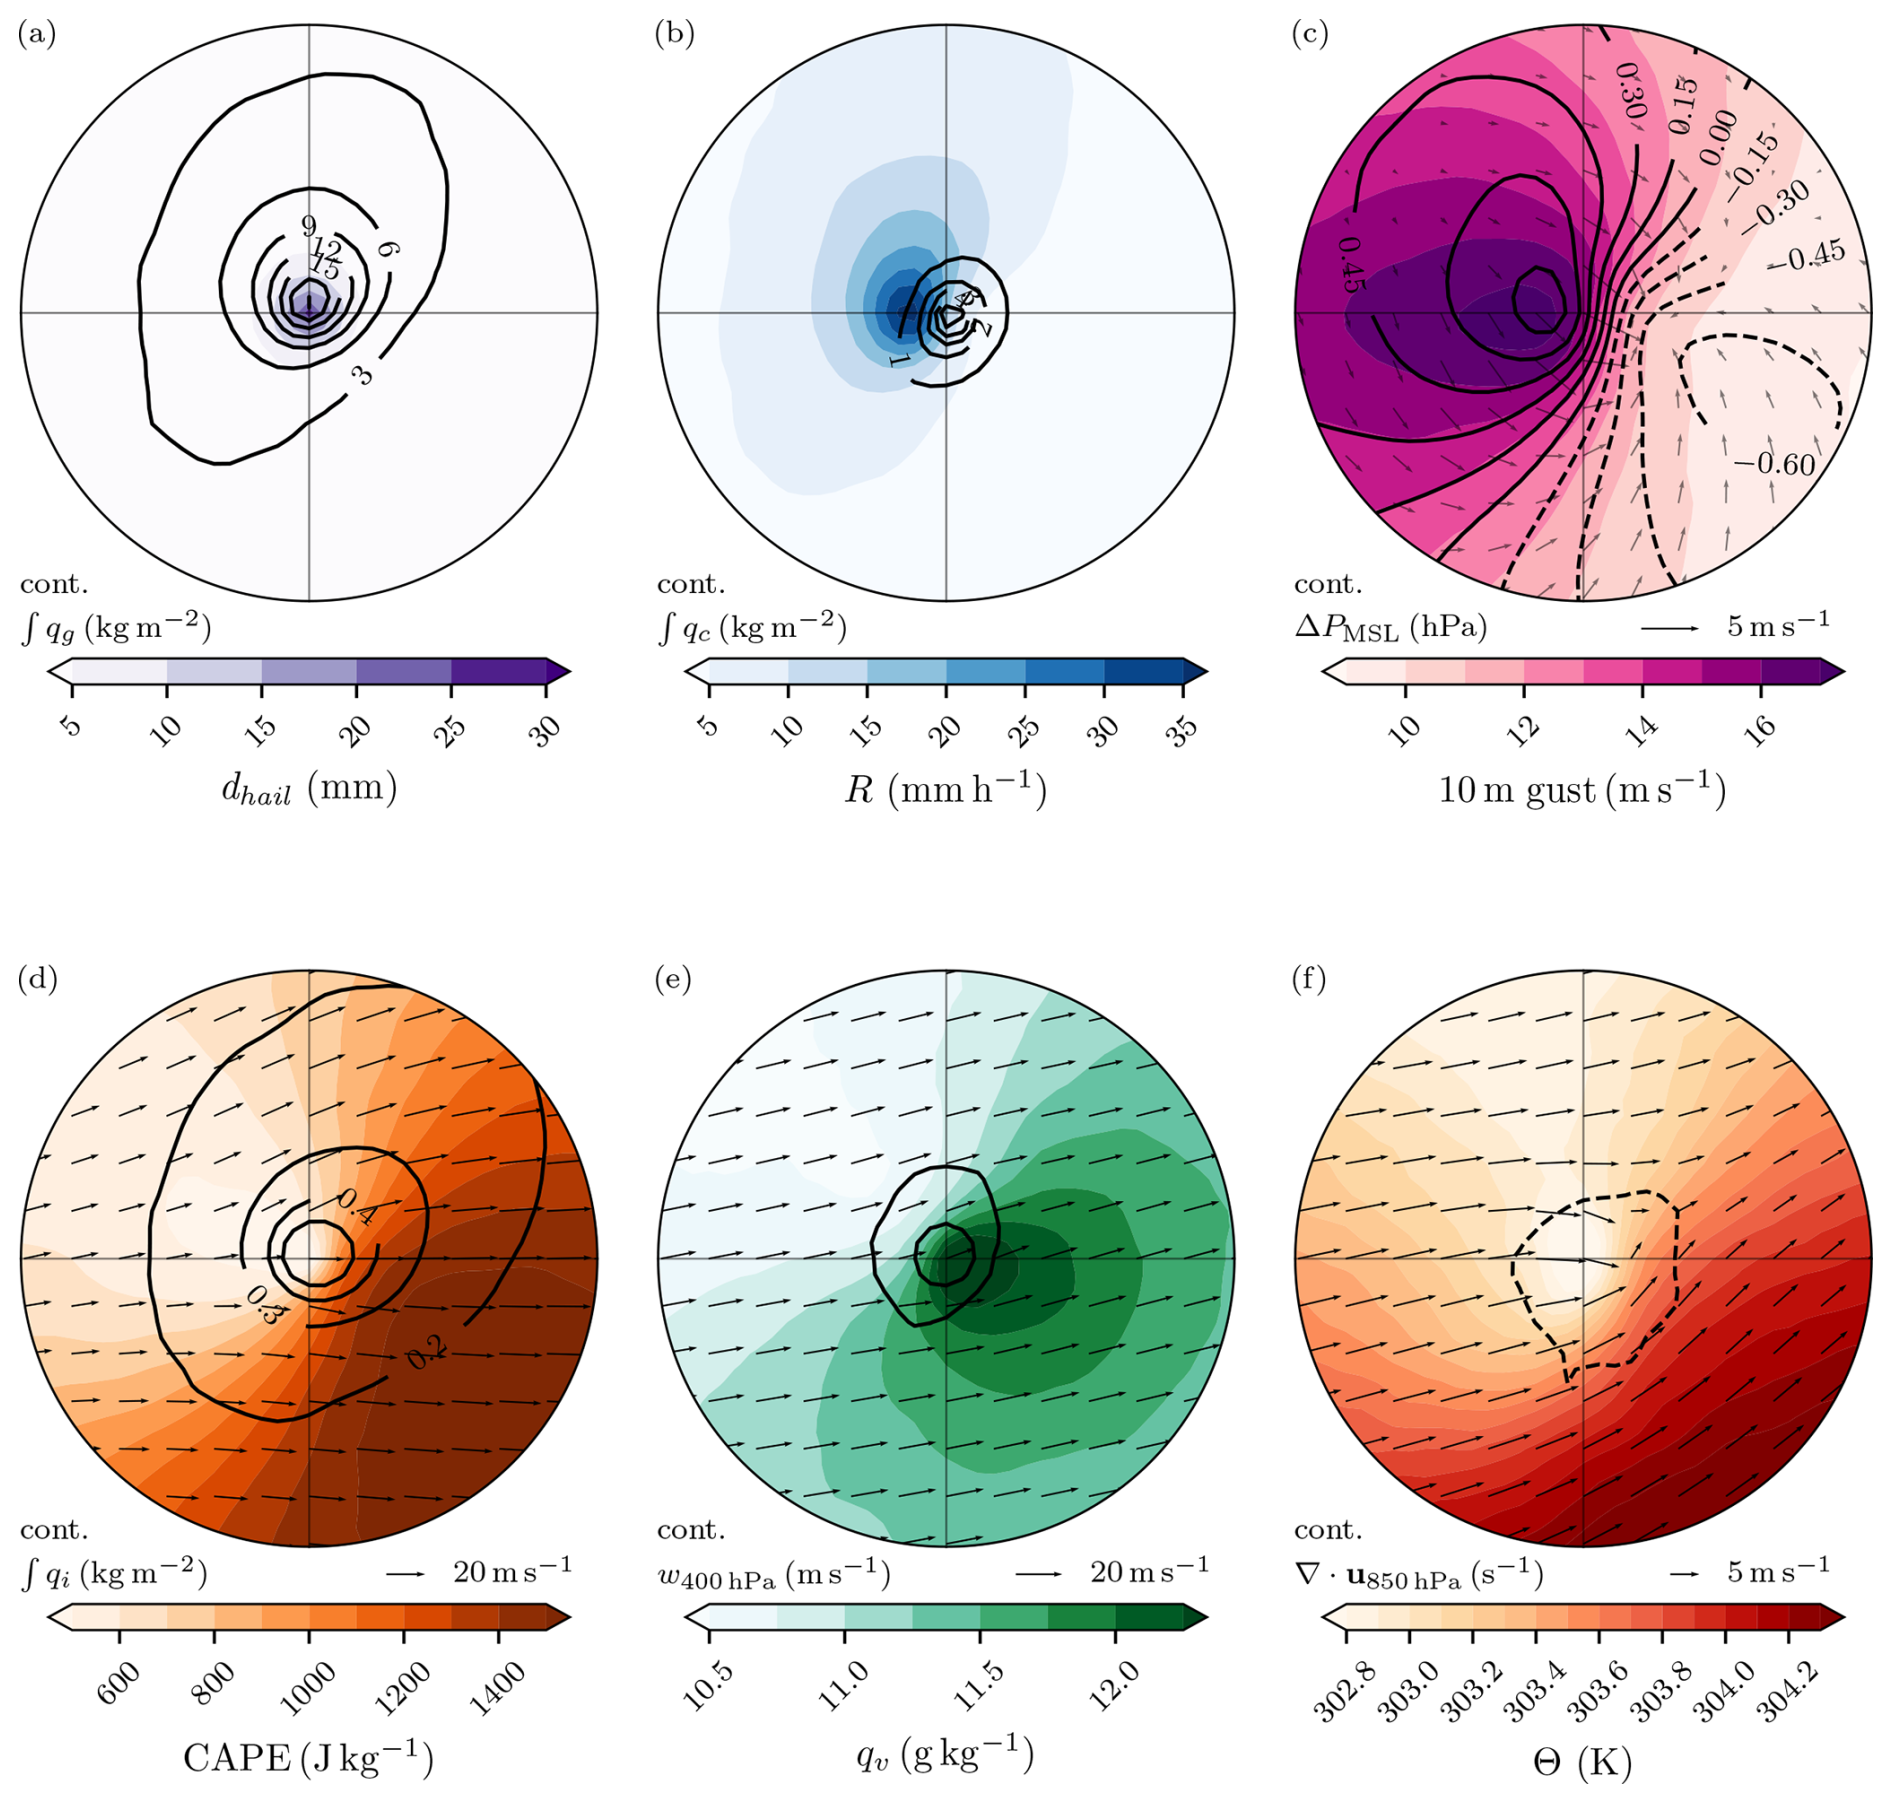
Figure 5Composite analysis of the most intense storm footprints (90th percentile of hail diameter, n=3641) in the current climate in JJA, centered on their footprint center and rotated so that their respective movement vector aligns with the x axis (with the storm moving to the right). The radius of the panel outline is 40 km. Shown are (a) HAILCAST maximum hail diameter (filled contours) and column-integrated graupel (black contours); (b) hourly rain rate (filled contours) and column-integrated cloud water (black contours); (c) 10 m wind gusts (filled contours), mean sea level pressure anomaly (black contours), and 10 m absolute wind field (quivers); (d) CAPE (filled contours), column-integrated cloud ice (black contours), and 200 hPa absolute wind field (quivers); (e) specific humidity at 850 hPa (filled contours), vertical wind at 400 hPa (1 and 5 m s−1, black contours), and horizontal absolute wind field (quivers) at 400 hPa; and (f) potential temperature at 850 hPa (filled contours), horizontal divergence at 850 hPa (−0.1 s−1, black contour), and horizontal absolute wind field (quivers) at 850 hPa. The same plot for the most intense storm footprints in the future climate can be found in the Supplement (Fig. S5).
4.2 Climate change signal
To investigate the mechanisms driving the intensification of hailstorms in the future simulations during JJA, we examine differences in hailstorm environments and dynamics between the two climate simulations.
Based on the results presented in Sect. 3, a consistent increase in composite mean hail diameter is expected, with the largest changes (+1.2 mm) close to the storm center (Fig. 6a). The increases in rain rates (+19.5 %, Fig. 6b) and 10 m wind gusts (+5.2 %, Fig. 6c) around the storm center indicate a substantial change, with future storms potentially characterized by more intense rainfall and stronger winds, enhancing both the hydrological impact and wind damage potential of these events.
The increase in CAPE across the storm's environment (Fig. 6d) is particularly noteworthy, as it implies a significant boost in the energy available for storm intensification, likely leading to more severe convective phenomena. This observation is consistent with the Eulerian analyses of the same simulations by Thurnherr et al. (2025). Interestingly, they noted a decrease in mean seasonal CAPE in regions of southwestern Europe experiencing a decline in hail frequency. However, even with a mean decrease in CAPE, exceptionally high CAPE values can still occur in the specific situations when the environment favors hail formation. This is corroborated by the uniform increase in specific humidity at 850 hPa in the storm-centered composites (Fig. 6e), which supports enhanced moisture availability – a key factor in storm development and intensity. The consistent rise in potential temperature at 850 hPa (Fig. 6f) across the entire storm-influenced area further suggests a warmer and potentially less stable lower atmosphere conducive to storm formation and persistence. Future climate simulations produce hailstorms with inflow areas (see Fig. 1) that are 1.83 K warmer (at 850 hPa) than in current climate simulations. These changes, distinguished by their statistical significance, underscore the anticipated shift towards more hazardous storm conditions in the future climate simulation.
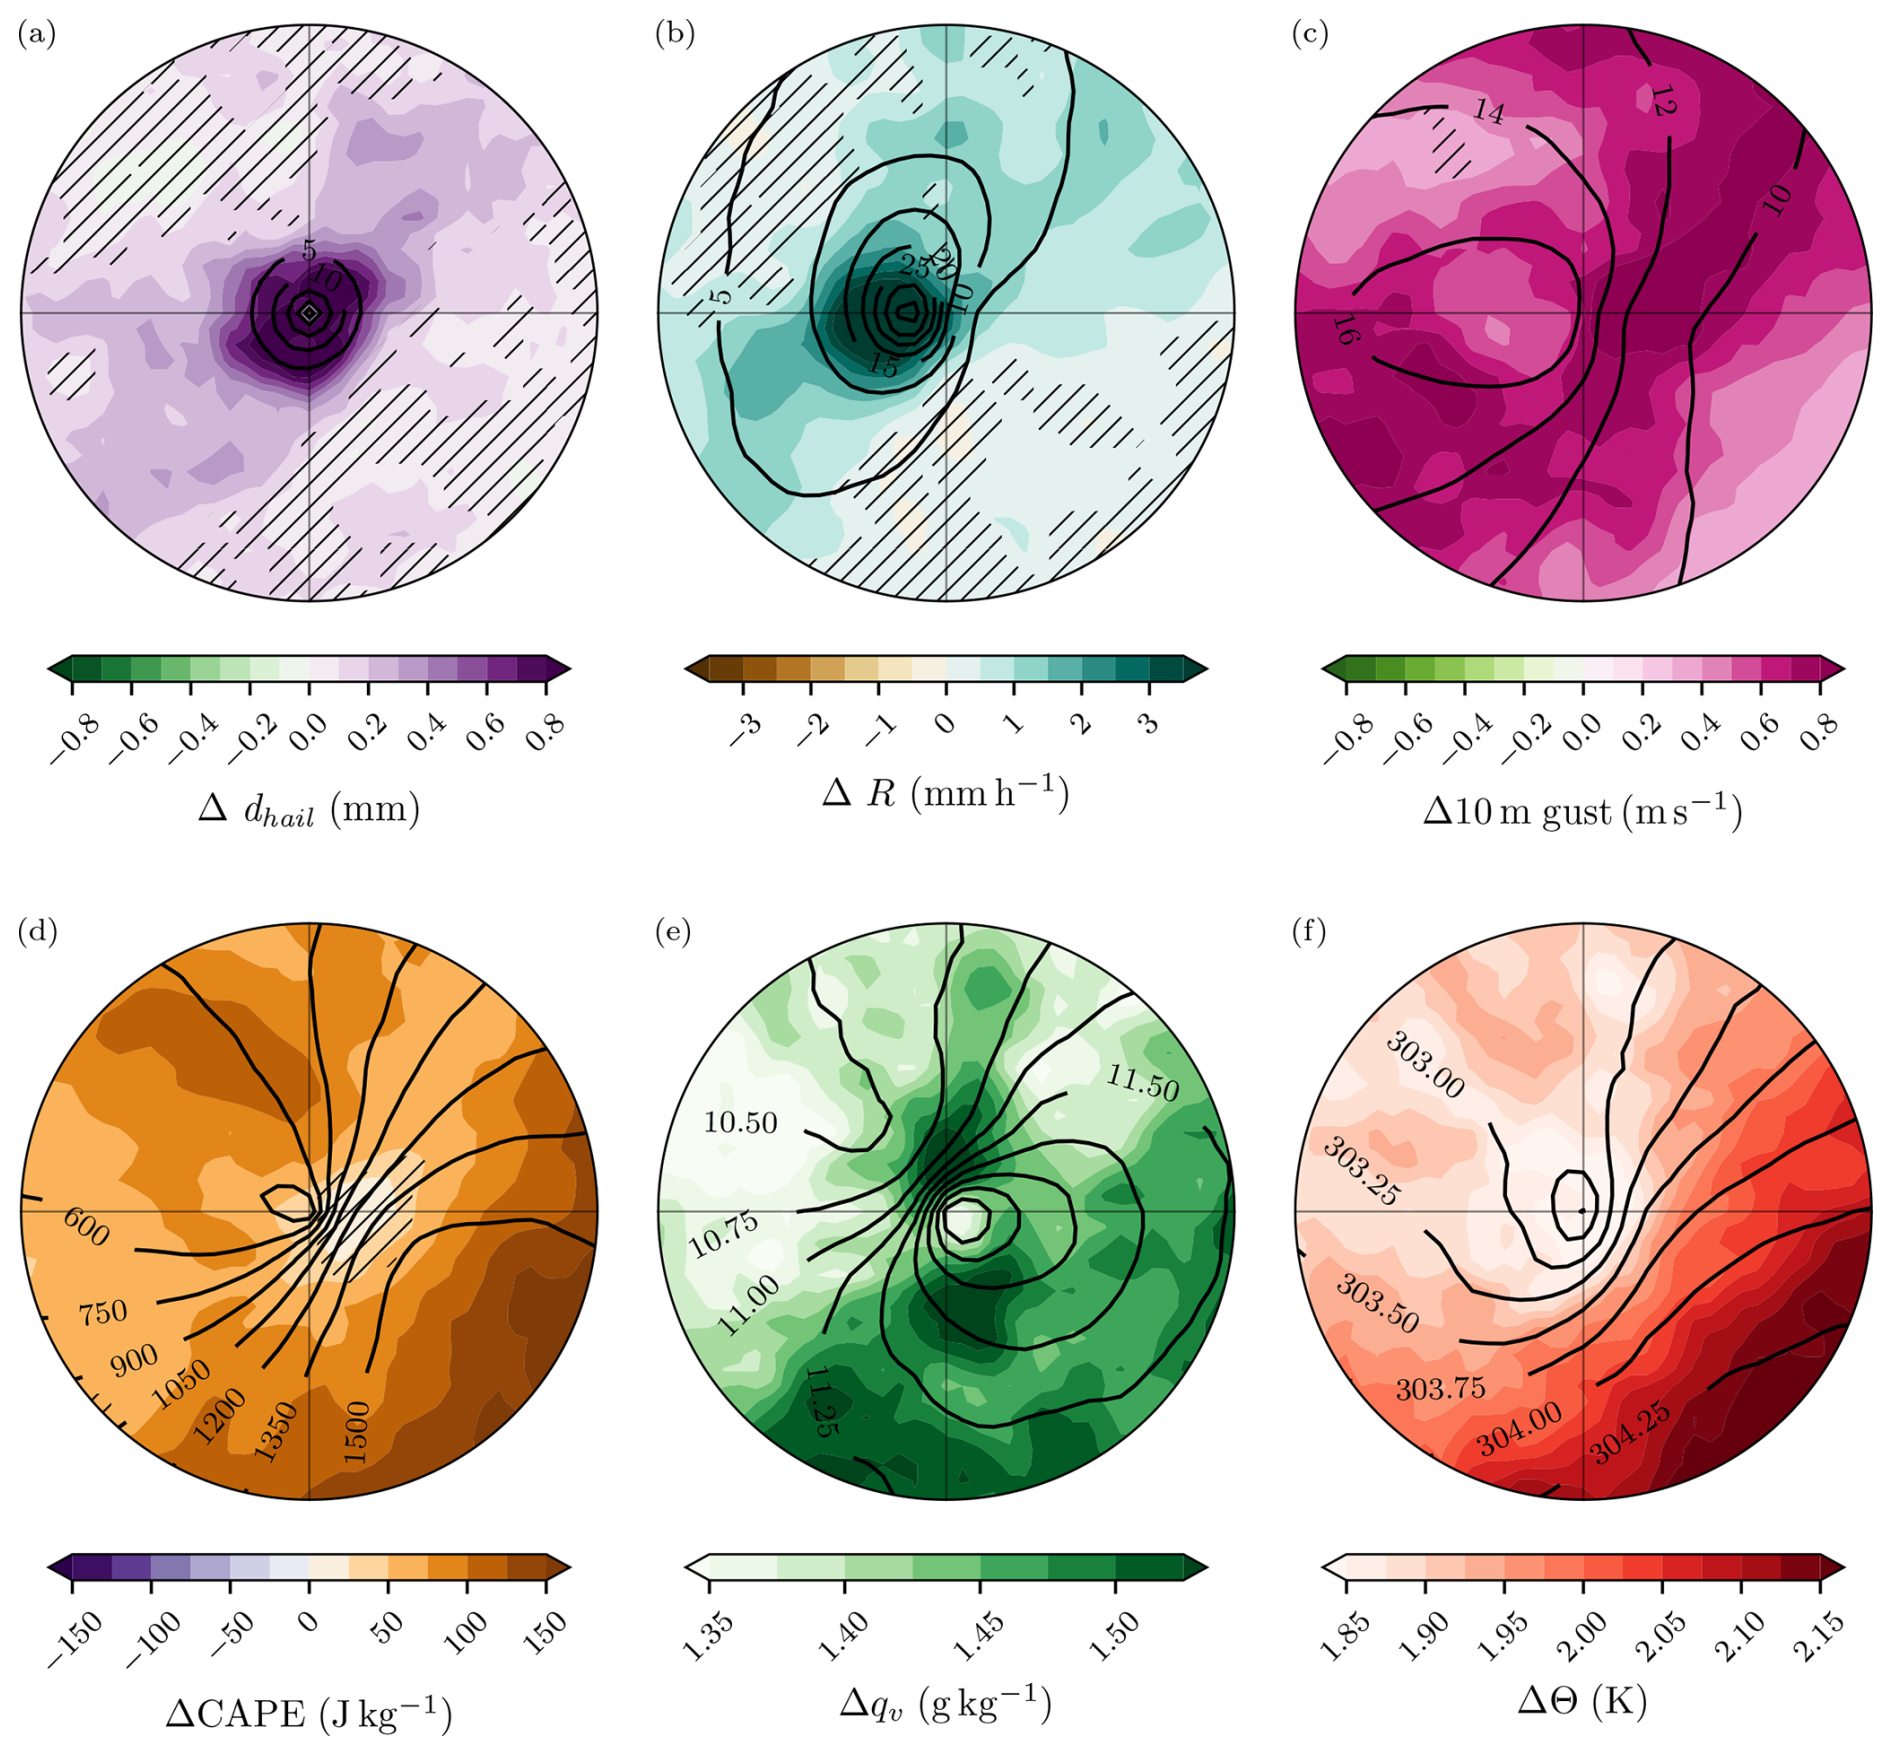
Figure 6Changes (filled contours) in composite mean horizontal fields between current (solid contours) and future climate simulations for the most intense storms in JJA (n=3641 and 3284, respectively), centered on their track center and rotated so that their respective movement vectors align with the x axis (with the storm moving to the right). The radius of the figure outline is 40 km. Shown are climate change signals in (a) hail diameter, (b) rain rate, (c) 10 m wind gust, (d) CAPE, (e) specific humidity at 850 hPa, and (f) potential temperature at 850 hPa. Hatching indicates areas with insignificant changes (<2σ, determined through bootstrapping with n=1000 resamples; see Appendix A). Versions of this figure for the PRUDENCE domains can be found in the Supplement (Figs. S6–S16).
Liquid precipitation following hail can be crucial for assessing storm damage, as rain can penetrate buildings through hail-damaged skylights, windows, and roofs, causing additional damage via water ingress (Ridder et al., 2020). Our analysis indicates that liquid precipitation typically follows hail immediately after the passage of the storm center, with high intensities exceeding 20 mm h−1 (Fig. 5a,b). In fact, the fraction of storms with potentially damaging >20 mm hail that feature a mean precipitation rate of >20 mm h−1 in a 20×20 km2 box behind the hail shaft (rain after hail; see Fig. 1) is projected to increase from 13.4 % to 18.5 % (relative change of +36.1 %). This increase is even greater for higher precipitation rates (i.e., almost +80 % for intensities >50 mm h−1; Fig. 7). Additionally, the change in the fraction of storms featuring rain-after-hail conditions is larger for larger hail diameter thresholds. Therefore, for hailstorms with ≥30 mm hail diameter, the frequency of very intense rain after hail is projected to increase 2-fold (dotted line in Fig. 7).
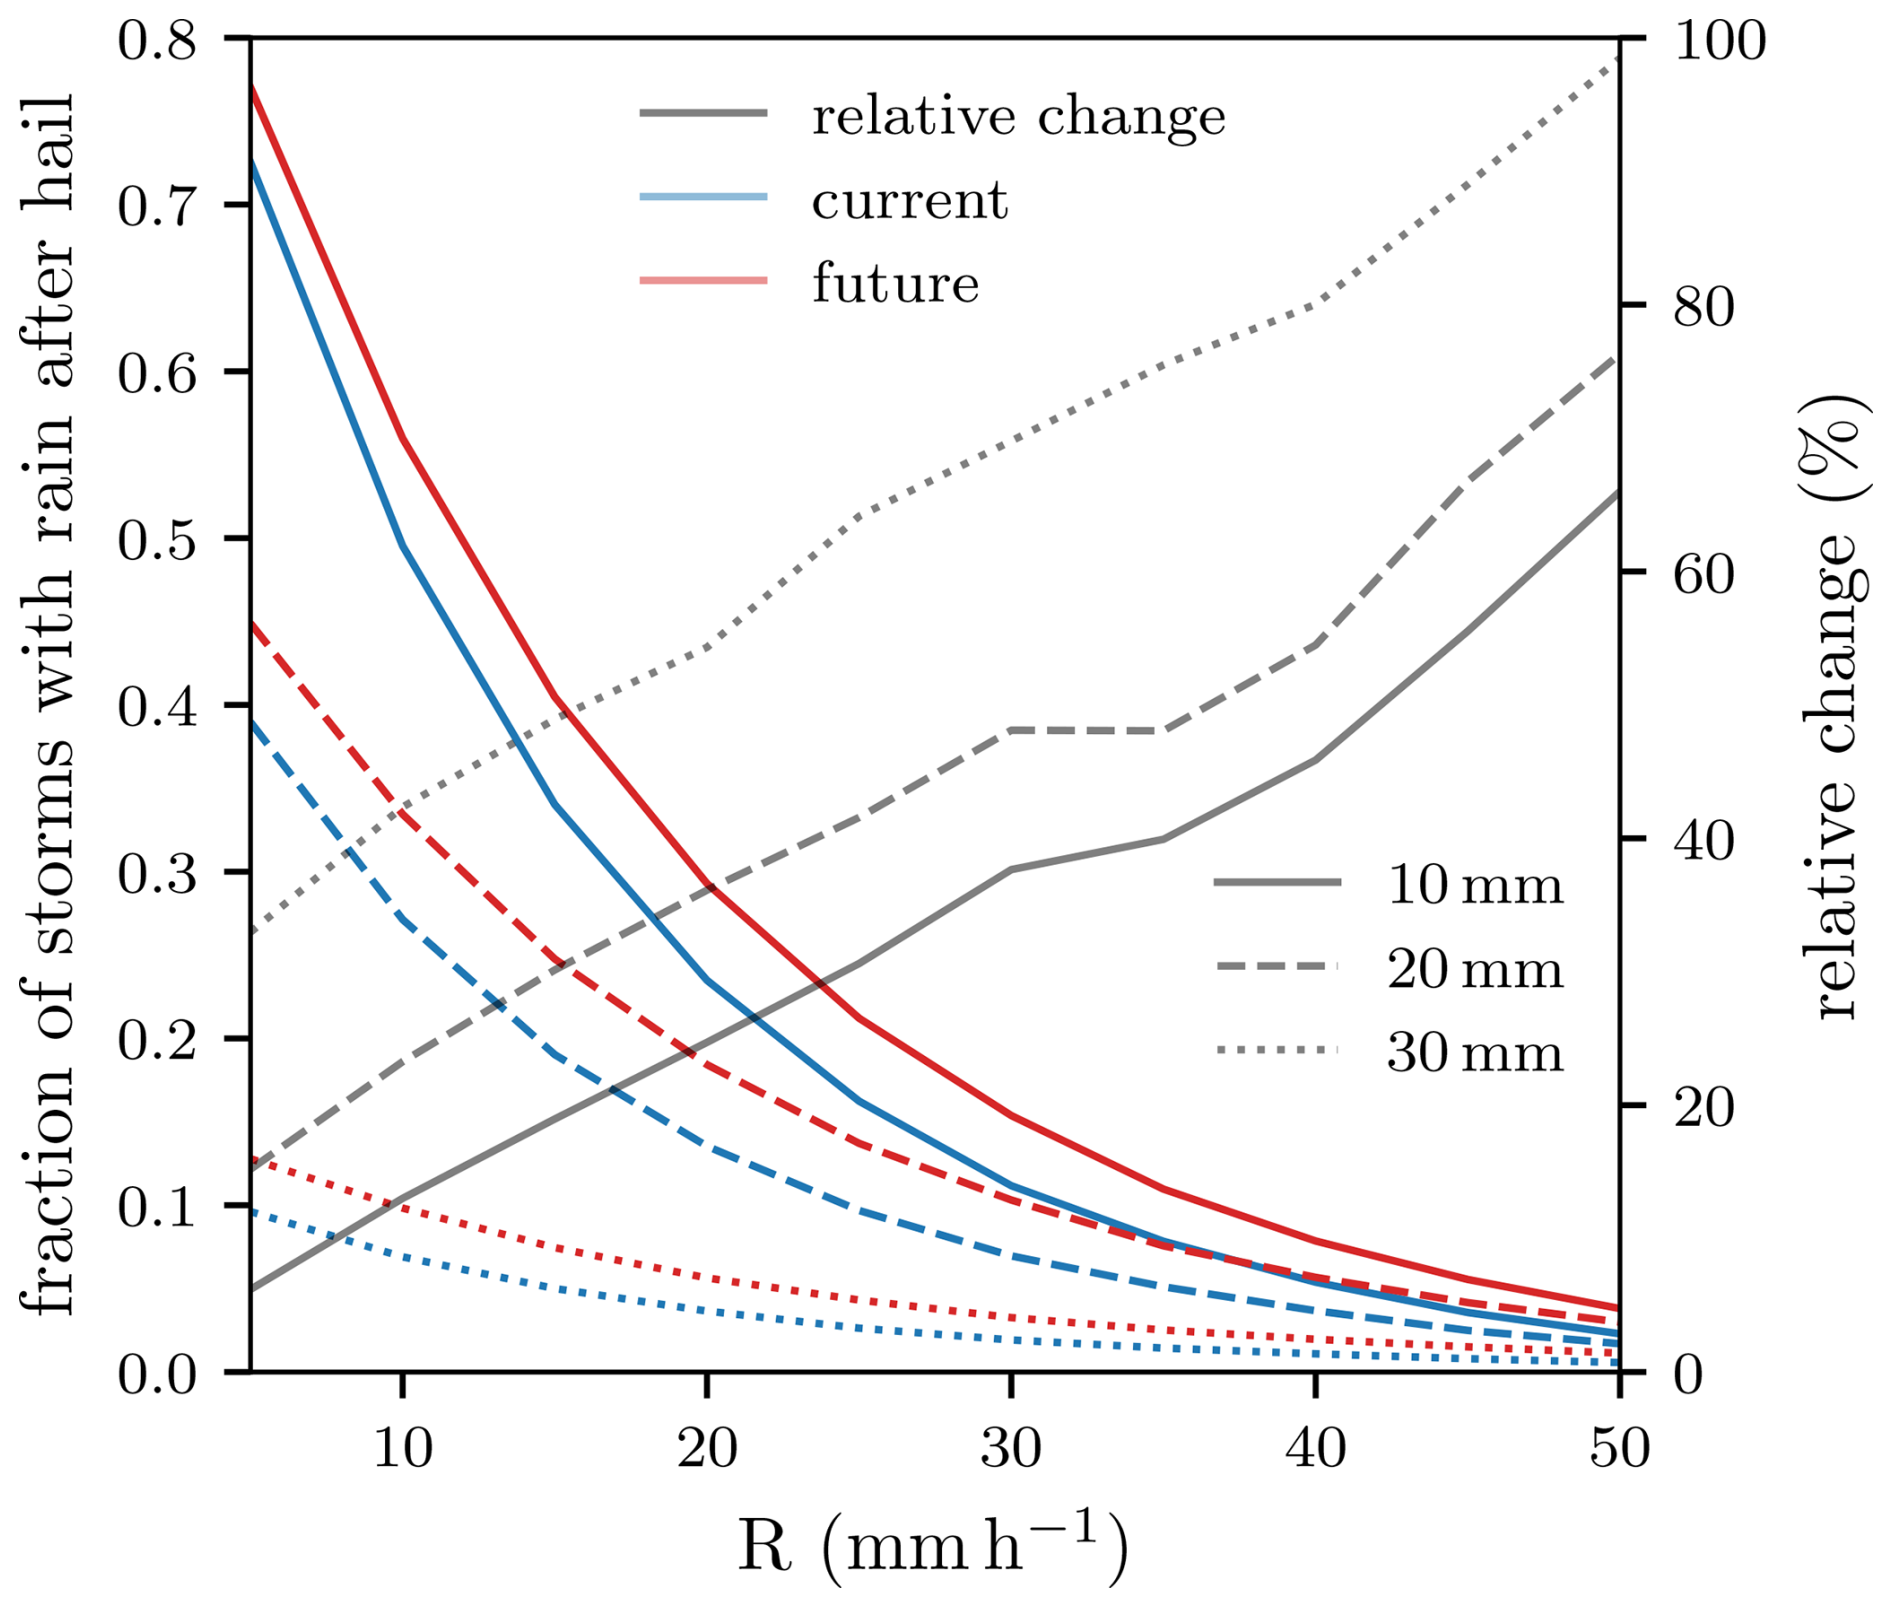
Figure 7Rain after hail: fraction of storm-centered footprints in JJA of the current (blue) and future (red) climate simulations as a function of mean rain rates (x axis) in a 20×20 km2 box behind the storm center. Gray lines indicate the relative change from current to future climate simulations. Three different storm maximum hail diameter thresholds (10, 20, 30 mm) are shown. The statistics include ∼30 000, ∼17 000, and ∼4000 storm-centered footprints for dhail≥10 (solid), 20 (dashed), and 30 mm (dotted), respectively.
While Fig. 6 shows the climate change signals to the environmental conditions of hailstorms averaged across Europe, similar analyses were performed separately for 11 European sub-regions. The results are shown in Figs. S6–S16, and they indicate that regional composites reveal significant differences between the sub-regions for some variables, such as CAPE, while others, like dhail, show more homogeneous signals across Europe. It is noteworthy that some regions exhibit low statistical significance, which suggests that the overall signals are not uniformly applicable across the entire simulation domain.
A similar composite analysis of thermodynamic profiles associated with storms in the current and future climate simulations reveals changes in the relevant vertical profiles (Fig. 8). The lifting condensation level (LCL) and the level of free convection (LFC) are relatively low in both climate simulations (below 1 and 2 km, respectively), facilitating cloud formation and precipitation. The slight increase in the LCL and LFC heights may slightly hinder convection initiation, as parcels need to be lifted further (during initiation) before condensation sets in (LCL) and before they reach positive buoyancy (LFC). However, this could lead to more intense and energetic storm conditions, as the stronger inhibition allows for additional buildup of CAPE.
The future scenario reveals significant changes in the profiles of equivalent potential temperature, Θe. As expected due to the warming and associated increase in specific humidity, Θe values are markedly higher, potentially leading to more vigorous storm dynamics (Fig. 8b). On average, Θe at 2 m in the inflow sector is projected to be 6.6 K higher in future hailstorms (Fig. 8c). Generally, the change in Θe is greatest below 600 hPa, while the core of the storm composite also exhibits increased changes in Θe of about 6 K, as opposed to ∼4 K in the storm-unaffected free mid-troposphere (Fig. 8c).
Furthermore, the magnitude of the composite mean vertical wind maxima remains unchanged; however, it extends to higher altitudes (Fig. 8c). In the composite mean, the vertical wind does not scale with , as the composite mean maximum vertical wind changes from 18.8 to 18.3 m s−1, whereas the composite mean maximum CAPE increases from 1587 to 1741 J kg−1 from the current to the future climate. This underestimation is a known feature of kilometer-scale models and has been documented in several studies (e.g., Adlerman and Droegemeier, 2002; Peters et al., 2020a). It results from coarse-resolution entrainment, insufficient core thermal contrast, and smoothing of updrafts. While HAILCAST attempts to account for subgrid updraft structure (Adams-Selin and Ziegler, 2016), the magnitude of this compensation at 2.2 km grid spacing remains uncertain and is an important limitation when interpreting simulated absolute hail sizes. Furthermore, the sampling bias arising from the coarse vertical resolution available might lead to an underestimation of the vertical wind magnitude, partly explaining the discrepancy. As the height of the maxima changes between current and future climate simulations, this bias between vertical wind and CAPE might differ between the two.5 The alignment of vertical wind contours with respect to ambient temperature, however, remains unchanged.
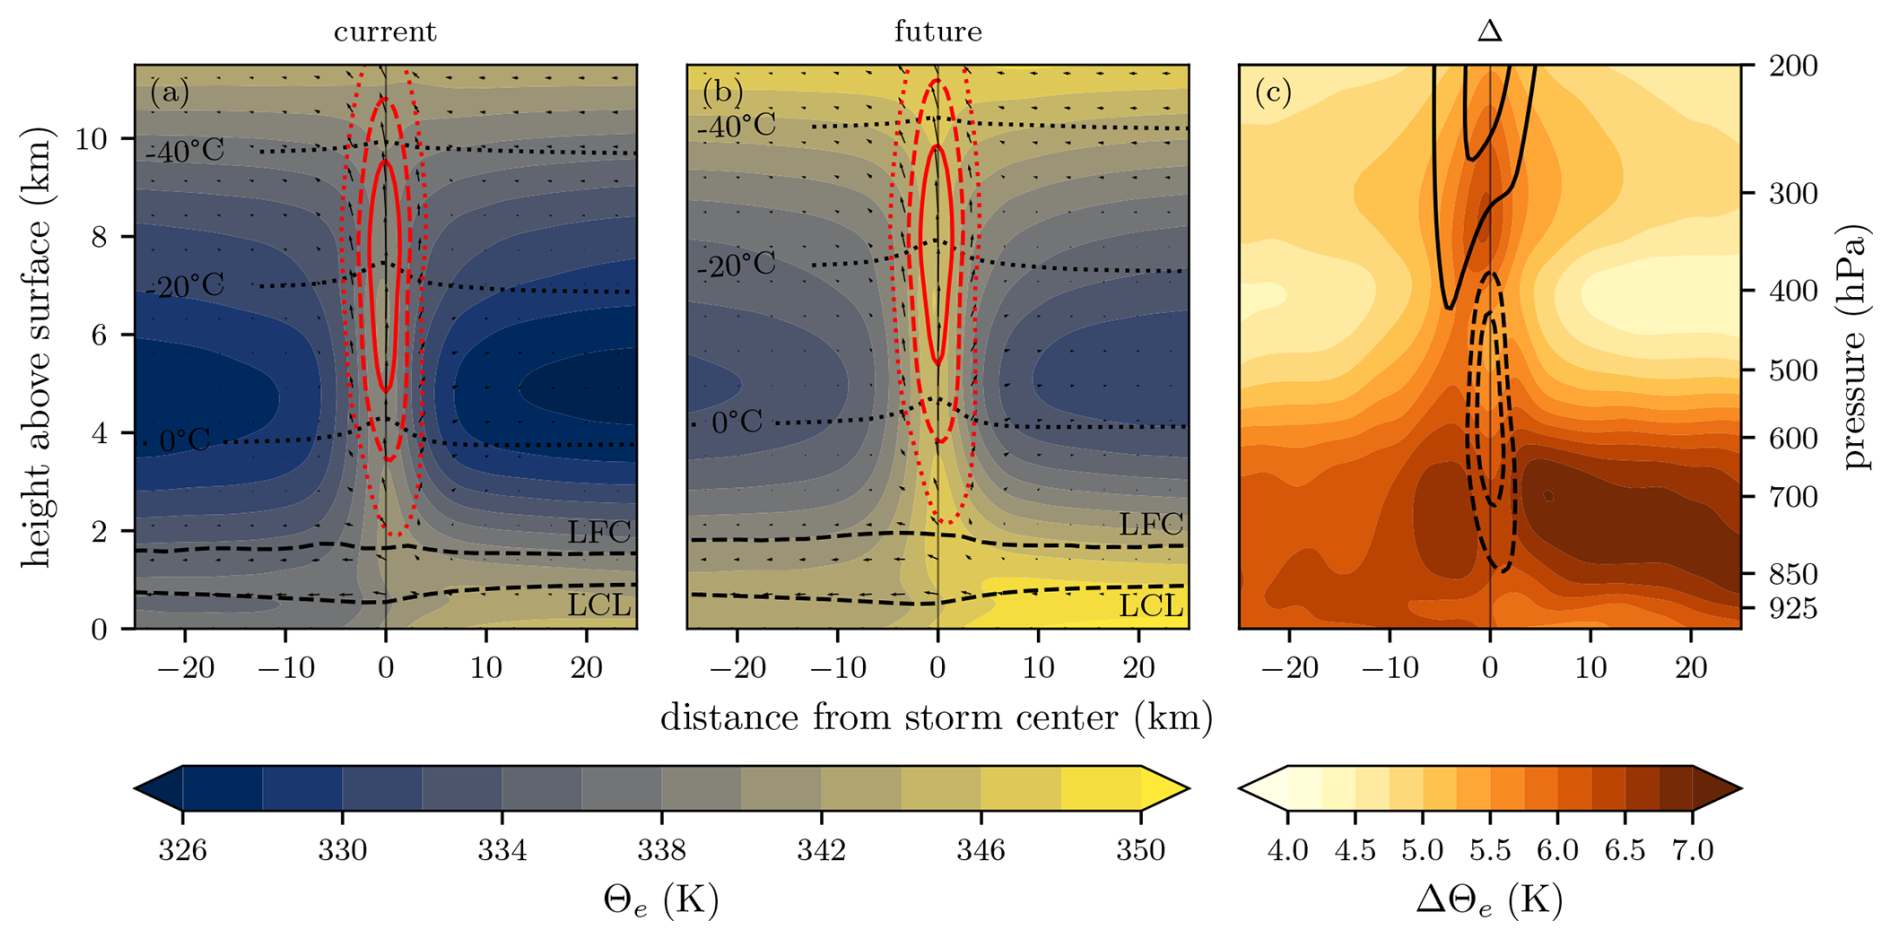
Figure 8Vertical cross-section of storm-centered composites in JJA along the storms' propagation vector (storm movement to the right) in the current (a) and future (b) climate simulations, with n=3641 and 3284, respectively. Filled contours show Θe, black dotted contours show the temperatures 0, −20, and −40 °C, black dashed contours show the lifting condensation level and level of free convection, and red contours show vertical wind (5, 10, and 15 m s−1; dotted, dashed, and solid, respectively). (c) Differences (filled contours) in composite mean fields between future minus current climate simulations; dashed and solid black contours indicate negative and positive changes in vertical wind speeds (−1, −0.5, 0.5, and 1 m s−1).
The storm-centered composites allow investigation of the atmospheric environment of the most intense hailstorms, revealing substantial changes for the considered future climate scenario. Key findings include increased hail diameter, intensified rainfall and wind gusts, elevated CAPE, and higher specific humidity and potential temperature (particularly in the lower troposphere). These changes suggest a warmer, moister low-level environment with enhanced energy availability, favoring more intense and hazardous storms. To further explore the response of all tracked hailstorms to changing environmental conditions, we turn to the analysis of the storms' inflow environment.
In this section, we first specifically investigate how CAPE, CIN, vertical wind shear, and column water vapor in the inflow sector of all tracked hailstorms change in the future climate simulation (Sect. 5.1). Secondly, in Sect. 5.2, we discuss the impact of the heightened 0 °C level on the maximum hail size diagnosed with HAILCAST. Unlike in Sect. 4, where we analyzed the most intense hailstorms, we now include all footprints of all JJA storms in the analysis in order to investigate the effect of the inflow environment on the response of hailstorms of different intensities.
To this end, similar to the inflow environment analysis conducted in Prein et al. (2017a), key thermodynamic variables in the storms' inflow sector (50×50 km2 box, 10 km ahead of the storm center; see Fig. 1) are diagnosed in the current and future climate simulations and compared to the maximum hail diameter produced by the hailstorm at a given time.
5.1 Change in hailstorm inflow environments
First, we consider CAPE in the inflow environment of the simulated hailstorms. In the inflow environment of hailstorms in the current climate simulations, CAPE exhibits strong variability, with noticeably higher values for storms with larger hail diameters (Fig. 9a). In the future climate simulations, the bulk of the CAPE distribution slightly shifts towards larger values, with similar changes for storms yielding small and large hailstones. The starkest change in CAPE in the inflow environment between hailstorms in the current and future climate simulations is present in the extreme CAPE values. There, the CAPE distribution is shifted such that high-CAPE inflow environments are more frequent in future climate hailstorms. While the mean value increases from 1814 to 1913 J kg−1, i.e., +5.5 % (Fig. 9a), the 90th percentile of the CAPE distribution increases from 2912 to 3211 J kg−1, i.e., +10.3 %.
Inflow maximum CIN follows a similar shift towards higher values (mean increases from 220 to 254 J kg−1, i.e., +15.7 %), while high-CIN environments are more prevalent in environments of ≥30 mm hailstorms compared to ≥10 mm hailstorm environments (Fig. 9b). We do not find a significant reduction in relative humidity of the mean low-level inflow (850 hPa, not shown) as was observed in previous studies (e.g., Chen et al., 2020; Rasmussen et al., 2020). However, an increase in the moist lapse rate (see Fig. 8c) is a possible explanation for the higher CIN values in the inflow regions of hailstorms in future climate simulations.
Further, vertical wind shear (10 m to 500 hPa) in the inflow region increases, in the mean, from 14.6 to 15.5 m s−1, i.e., +6.0 % (Fig. 9c). Hailstorms yielding large hail (≥30 mm) feature a distribution of vertical wind shear shifted to slightly higher values (Fig. 9c). It should be noted here that some of the increase in vertical wind shear in inflow regions of hailstorms in current to future simulations might not only characterize the pre-storm conditions but also be driven by the storm itself. This is because more vigorous updrafts in future climate simulations necessitate stronger low-level inflows and anvil outflows, which in turn leads to increased vertical wind shear in the inflow sector. Further evidence of this can be found in the overlap of the inflow sampling area (see Fig. 1) with the anvil (Fig. 5c).
As previously mentioned in Sect. 4, increased values of CAPE are accompanied by higher amounts of water vapor in future storm environments and for storms yielding larger hail diameters (Fig. 9d). The mean total column water vapor in the hailstorm inflow environments rises from 38.5 to 44.1 g m−2 (+14.5 %), which is slightly higher than the theoretical 12.8 % that would be expected from a 1.83 K warmer 850 hPa inflow environment according to the ∼7 % K−1 Clausius–Clapeyron relationship. The trend is analogous for hailstorms with >30 mm hailstones (Fig. 9d).
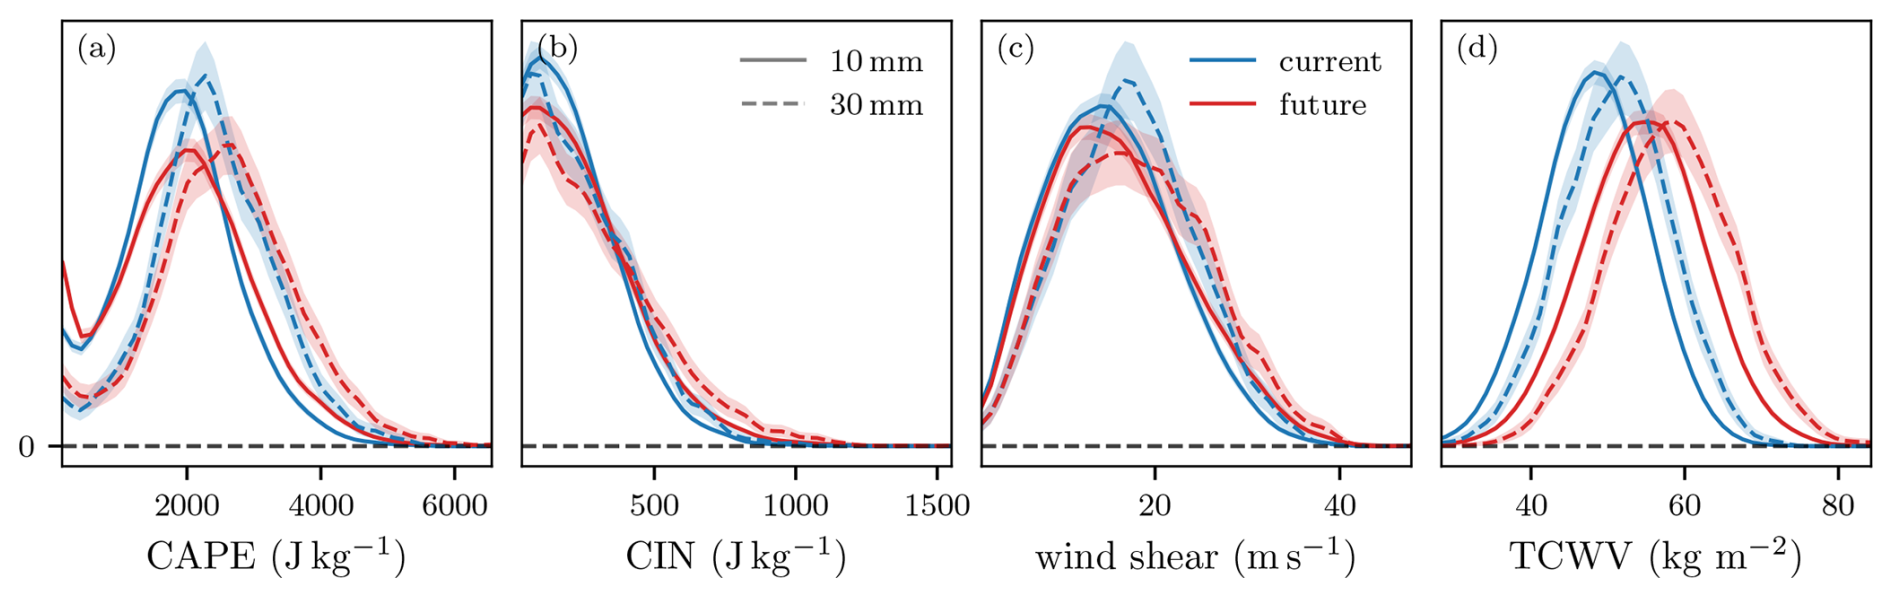
Figure 9Probability density functions (scaled such that they integrate to 1) of (a) maximum CAPE in the inflow region, (b) maximum CIN in the inflow region, (c) mean 10 m to 500 hPa vertical wind shear in the inflow region, and (d) maximum total column water vapor in the inflow region (Fig. 1) of hailstorms in current and future climate simulations. The distribution is determined based on ∼30 000 and ∼4000 storm-centered footprints for dhail≥10 (solid) and 30 mm (dotted), respectively. Lines show the mean, while the shaded area denotes the 5th–95th percentile range of n=1000 bootstrapped samples.
Storm footprints that produce larger maximum hail diameters are, on average, associated with larger values of inflow CAPE. This relation is consistent between the current and the future simulation periods (Fig. 10a). Contrary to this linear relationship, using the hail trajectory growth model outlined in Kumjian and Lombardo (2020), Lin and Kumjian (2022) found that the largest hail diameters tend to originate from environments with intermediate CAPE values. Notably, for any given hail diameter larger than 20 mm, inflow maximum CAPE is significantly higher in the future climate simulations than in the current, where the opposite is true for <15 mm hail (Fig. 10a).
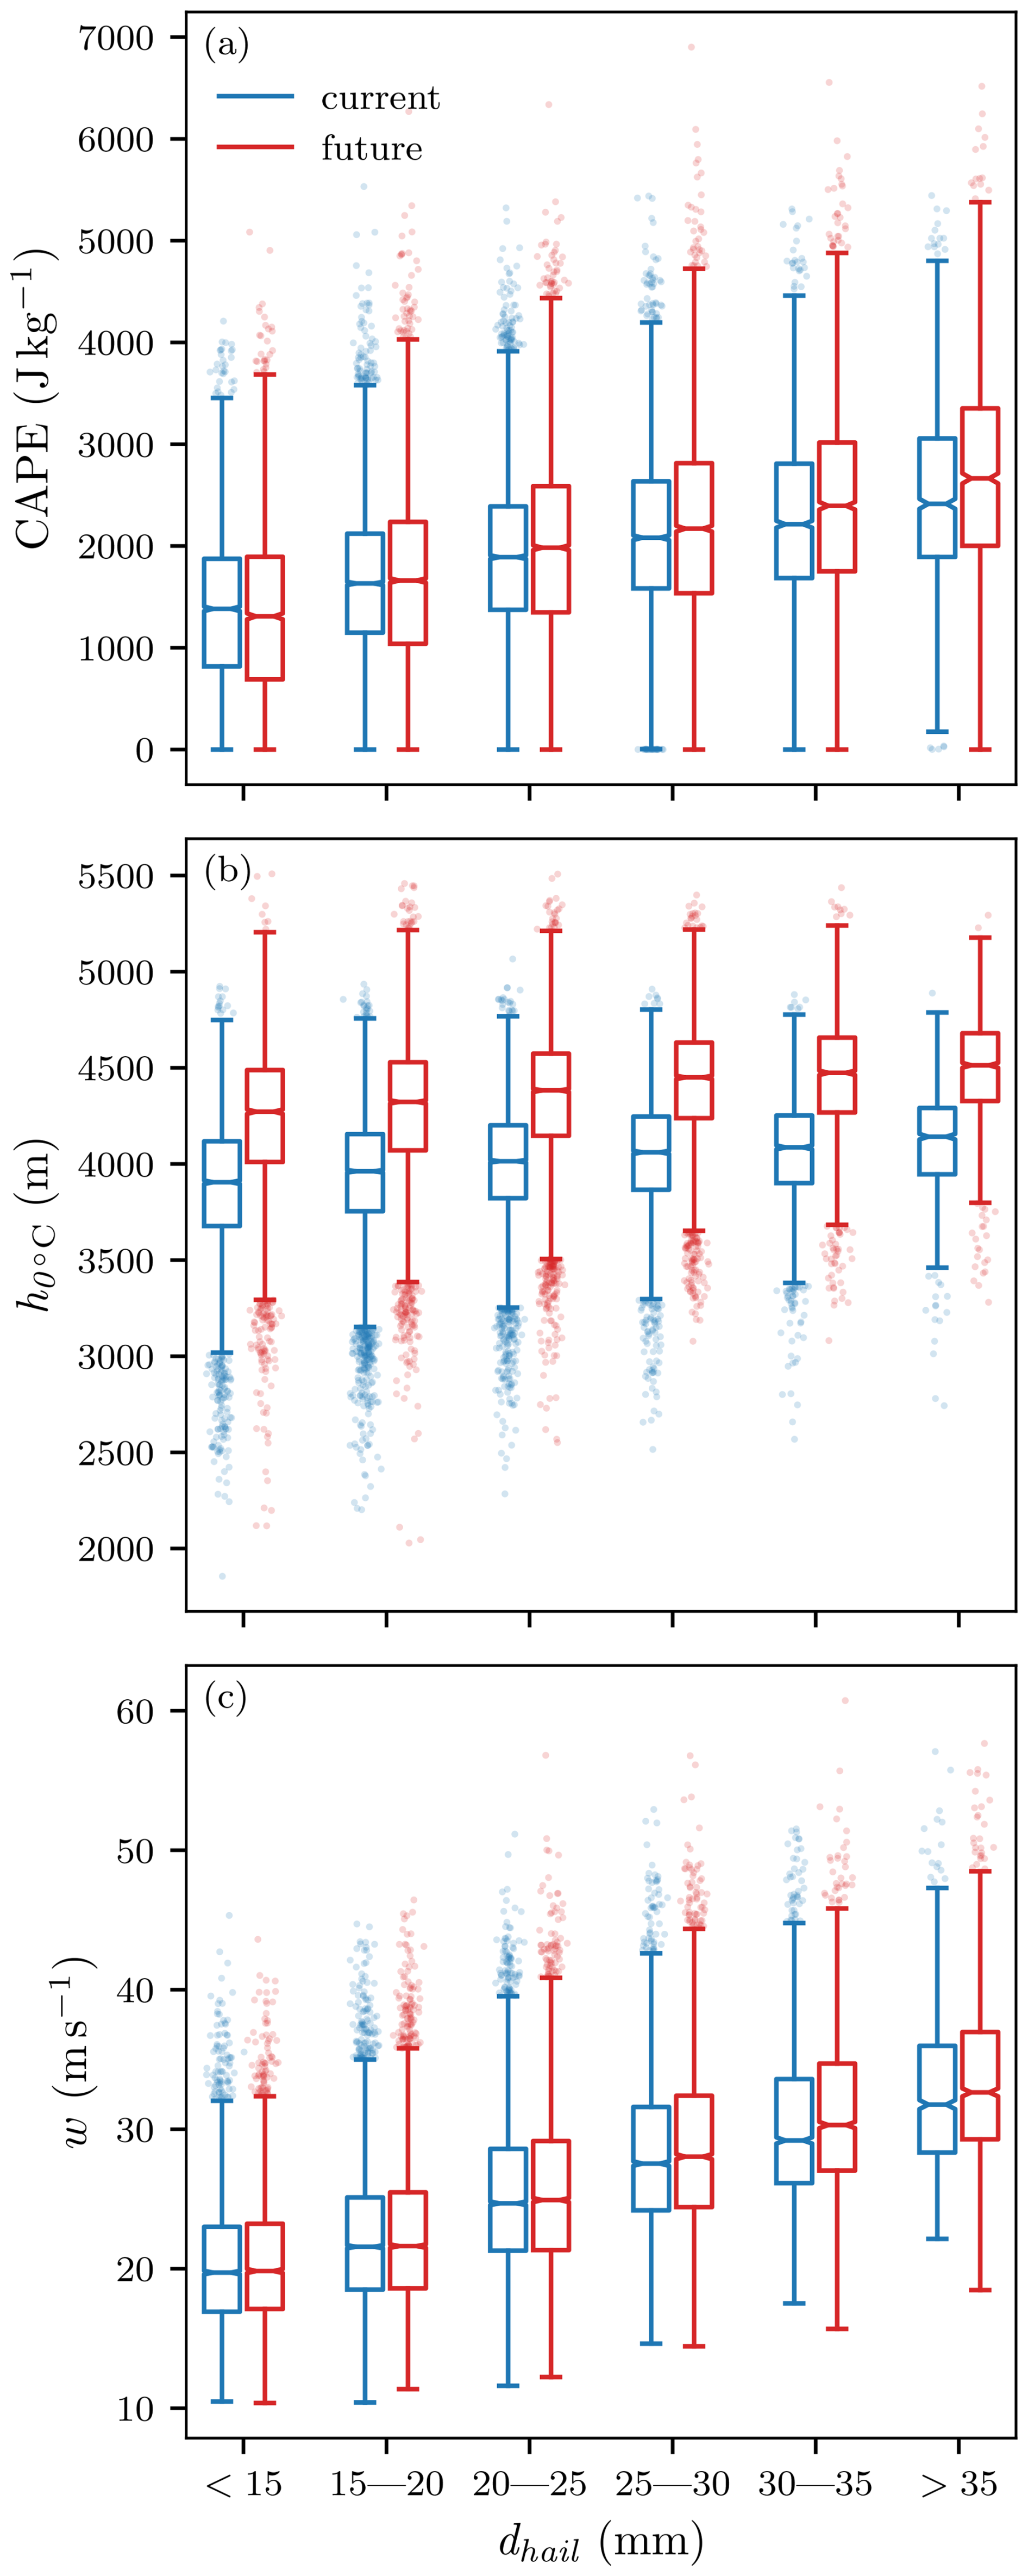
Figure 10Statistics of storm characteristics for different bins of momentary storm maximum hail diameters (5 mm wide bins) in current and future simulations (n=31 899 and 28 259 storm-centered footprints, respectively). Characteristics shown are (a) inflow maximum CAPE, (b) mean 0 °C level height calculated in the inflow region, and (c) column maximum vertical wind within the storm during the last hour (sampled at the 60 model vertical levels and 20 s model time step). The horizontal line with notches shows the mean and confidence interval, respectively, while the box covers the interquartile range (IQR), and the whiskers extend to the farthest data point lying within 1.5× the IQR from the box. Outliers (points) are jittered horizontally to increase legibility.
5.2 Effect of changing environments on hail size distribution
Our analysis showed that the frequency of large hail is increasing in the hail swaths in a warmer climate (Fig. 4). Changes in hail size distributions due to a warmer climate have previously been attributed to increased updraft speed leading to larger hail sizes aloft and a higher 0 °C level height, particularly affecting smaller-diameter hailstones (e.g., <40 mm, Gensini et al., 2024), which are expected to experience the strongest melting due to their slower fall velocity and small mass (Brimelow et al., 2017). To examine these effects in our simulations, we first analyze the relationship between hailstorm-environmental freezing level heights, resulting hail diameters, and the vertical wind speeds required to support hailstones of different maximum hail sizes across the current and future climate simulations.
Storm footprints associated with larger storm maximum hail diameters are generally linked to higher mean 0 °C level heights in the inflow. This relationship remains consistent across both the current and future simulation periods (Fig. 10b). In inflow environments of hailstorms in the future climate simulation, the 0 °C level rises by 362 m compared to current climate storms (+9 %, Fig. 10b). Results show that the 0 °C level height is consistently higher in future hailstorms, regardless of the maximum hail diameter (Fig. 10b). This change in the 0 °C level is accompanied by an increase in the level of homogeneous freezing (i.e., isotherm of −38 °C of 481 m (+5 %)), which leads to a 2.3 % increase in hail growth layer thickness. This increase allows hailstones slightly more time in the updraft to grow to larger diameters. However, a higher 0 °C level also extends the time hailstones spend in above-freezing air during their descent, enhancing melting and potentially reducing their final diameters.
Increased melting of hailstones in a future climate (through an increased 0 °C level height) could be compensated for by stronger updrafts, leading to increased hail growth. To address this compensating effect, we analyze the relationship between hail diameters and vertical wind speeds. As expected, in both current and future climate simulations, we observe a positive relationship between storm maximum vertical winds and storm maximum hail (Fig. 10c). Storms with hail diameters exceeding 25 mm exhibit a slight (+3 %) significant increase in the maximum vertical wind in future climate simulations compared to current climate simulations (Fig. 10c), but no such trend is present for storms yielding only small hailstones. This further reinforces the conclusion that stronger updrafts mitigate melting effects, as represented by HAILCAST for large hailstones (>15 mm), while melting might exert some influence on storm maximum hail diameters in the smallest-size bin (<15 mm), especially for hail swath maximum diameters smaller than 11 mm, as discussed in Sect. 3 (Fig. 4b). The local maximum in the fractional change in the swath area curve at 15 mm is a probable consequence of a crossover from increased melting being relevant at smaller diameters and less so at larger diameters (Fig. 4b).
It should be noted here that the results concerning melting are subject to uncertainty due to the simplified representation of melting processes in HAILCAST, which likely lacks the complexity required to, for example, accurately capture hailstone ablation during descent. Furthermore, HAILCAST predominantly estimates the maximum hail size and does not resolve the full size spectrum; potential melting effects on smaller hailstones may be underestimated, limiting the model's sensitivity to variations in melting level height. This provides a possible explanation for the discrepancy between results based on Thurnherr et al. (2025) and those presented in Gensini et al. (2024). Thurnherr et al. (2025) see an effect similar to that in Gensini et al. (2024), but the transition from decreasing to increasing hail occurrence occurs at 12.5 mm in the former analysis, similar to our object-based analysis, while the latter threshold lies around 40 mm. This difference likely arises from methodological differences – these studies use different hail parameterizations, which result in distinct hail size distributions, and may also be influenced by model resolution and storm dynamics in the respective simulations. For further discussion, see Thurnherr et al. (2025). Further, our object-based approach focuses on long-lived storms, which tend to produce larger hail, potentially excluding the smaller sizes most affected by melting. Moreover, if future storms yield more large hailstones due to stronger updrafts, increases in melting level height may become less relevant for the largest hailstones.
In summary, the projected increases in CAPE and specific humidity due to a warming climate emerge as key drivers of enhanced hailstorm intensity in future scenarios. In contrast, the anticipated increase in hailstone melting due to elevated 0 °C level heights likely affects only the smallest hail diameters. These findings underscore the dominant role of thermodynamic intensification in shaping future hailstorm environments.
This study highlights the significant impacts of global warming on hailstorm tracks and dynamics across Europe, demonstrating that future climatic conditions are likely to result in more intense, larger, and regionally more frequent hailstorms. Using the output from the COSMO v6 model simulations (Cui et al., 2024) with a +3 K PGW approach performed by Thurnherr et al. (2025), we conducted additional hailstorm-tracking and object-based analyses. They allowed us to capture projected changes in hailstorm structure and environment, providing valuable information for understanding regional hazards.
We can now address the questions posed in the introduction:
-
Storm area and lifetimes are projected to increase by +10.3 % and +1.7 %, respectively, across the simulation domain. The change in storm area features extended areas of positive (and significant) change, while the lifetime shows a strong spatial variability, with only some extended areas in eastern France, Germany, and eastern Europe exhibiting coherent positive trends (Fig. 3c, f).
-
Further, the mean storm propagation velocity increases by +7.3 %. Most regions show significant positive changes of +1 % to +3 m s−1, suggesting faster-moving hailstorms under future warming (Fig. 3i).
-
Our analysis shows a decrease in the frequency of storms producing hail smaller than ≤25 mm, while larger hail events (≥45 mm) become more frequent, with a 2-fold increase expected for hail above ∼45 mm. Per-storm hail swath areas increase for most hail sizes, with the most significant increase observed for 15 mm hail (+33 %), and when considering both frequency and swath area changes, swath area expansion dominates for hail below 40 mm, whereas frequency changes are more influential for larger hail (Fig. 4a, b).
-
The intensification of hailstorm activity is closely associated with enhanced potential for larger updrafts, as evidenced by elevated CAPE values and increased specific humidity levels, both of which are driven by the higher moisture content associated with rising temperatures. These increases in specific humidity and CAPE values are consistent with the mechanisms discussed by Prein et al. (2017a) and Trapp et al. (2019), who emphasized the role of CAPE in the development of convective storms and hail formation under future climate scenarios. The higher 0 °C level heights resulting from climate change did not significantly impact storm maximum hailstone diameters >15 mm, suggesting that factors such as more volatile convective environments and resulting increased updraft strength may mitigate potential melting effects. In our analysis, the effect of increased melting as represented by HAILCAST is constrained to the smallest hail diameters (≤11 mm). This analysis contributes additional nuance to prior studies (e.g., Battaglioli et al., 2023), aligning with the uncertainties originating from how microphysical processes are represented in numerical models highlighted by Mallinson et al. (2023).
-
As discussed in the introduction, previous studies have suggested an increase in hailstorm frequency and intensity under warmer conditions. Our results corroborate these trends, demonstrating regionally diverse trends in hailstorm frequency and an increase in the storm maximum hail diameter across Europe. The findings in this study align with past trend analyses in the northern Alpine domain (1959–2022, Wilhelm et al., 2024), which reported similar regional signals. South of the Alps, Wilhelm et al. (2024) also identified a positive past trend in yearly hail days. In our projections, both positive and negative changes in hailstorm frequency occur in close spatial proximity within the southern Alpine domain, with increases along the southern fringes of the main Alpine crest and a pronounced localized decrease in the Po Valley (Fig. 2c). Observational studies such as Manzato et al. (2022) support this signal, showing a slight negative past trend in northeastern Italy, which is consistent with our projected localized decrease in hailstorm frequency in that area. These findings are further consistent with projections from studies such as Raupach et al. (2021), Thurnherr et al. (2025), and Feldmann et al. (2025), which report comparable regional trends throughout the remaining simulation domain. An important result of this study is that the hail environments of the most intense hailstorms change similarly in all sub-regions – regardless of the local hailstorm frequency trend signal (see Figs. S6–S16). Notably, CAPE in the inflow increases in all sub-regions, even in regions where the Eulerian summer mean CAPE decreases (Thurnherr et al., 2025). This distinction highlights that it is not primarily the hail events themselves that are changing, but rather the frequency of favorable environmental conditions for the initiation of severe convective storms.
-
Hailstorms under future climate conditions remain potent threats due to accompanying changes in both precipitation intensity and near-surface wind. A comprehensive analysis of storm parameters reveals that rain rates around the storm center increase by +20.0 %, whereas 10 m wind gusts intensify by +5.1 % (Fig. 6b, c). Concurrently, CAPE and CIN shift toward higher values (+5.5 % and +15.7 %, respectively, Fig. 9a, b), and vertical wind shear strengthens (+6.0 %, Fig. 9c). Collectively, these factors point to more pronounced localized rainfall, stronger near-surface winds, and a more unstable convective environment – conditions that could foster not only larger hail but also compound hazards such as wind-driven hail or intense rainfall immediately following hail, where the latter is projected to increase by more than 50 % (Fig. 7).
Despite the robust insights provided by this study, several limitations merit consideration. The resolution of the COSMO v6 model (2.2 km), being convection-permitting, not convection-resolving, although suitable for regional climate simulations, may not fully capture the fine-scale processes influencing hailstorm development (Bryan et al., 2003; Adams-Selin, 2025; Fischer et al., 2025). The simulation of convective storms at 2.2 km grid spacing inherently limits the representation of fine-scale processes critical for hail formation, such as peak updraft speed, entrainment, and hydrometeor interactions within the convective core. As discussed in Prein et al. (2021), even though kilometer-scale models significantly improve upon coarser-grid simulations and reproduce robust climate signals in convective systems, they operate in the “gray zone”, where vertical mass fluxes and core dynamics are underrepresented. This likely contributes to underestimated vertical velocities (see also Fig. 10), as compared to theoretical expectations or observations in supercells (Peters et al., 2020b, a). Consequently, hail growth potential may be suppressed in the model compared to reality, particularly for severe events. While HAILCAST includes parameterizations to adjust for updraft strength (Adams-Selin and Ziegler, 2016), uncertainties remain regarding its performance at this specific resolution and for this model setup. Acknowledging this, we caution that the absolute hail sizes should be interpreted in a relative sense, with a focus on comparative patterns rather than absolute magnitudes.
Furthermore, the HAILCAST model relies on simplified parameterizations that may not fully represent the complex interactions between microphysical processes and storm dynamics. Two-moment microphysics schemes, which predict both the mass and number concentration of hydrometeors, could offer a more accurate depiction of hail formation and evolution and would also allow for moisture tagging experiments. Additionally, a full 3D hail trajectory analysis could further refine the model's ability to simulate hailstorms by explicitly tracking hailstones' paths through a storm. However, these advanced approaches are computationally intensive and are currently impractical for long-term climate simulations.
The results presented in this study are based on simulations assuming a global mean temperature increase of 3 K, representing a plausible high-end warming scenario (for more detail, see Thurnherr et al., 2025). It is important to note that projected changes in hail frequency, size, and intensity are contingent on the level of warming realized, which in turn depends on future greenhouse gas emissions and socio-economic developments (see, e.g., Seneviratne et al., 2021). Thus, our findings should be interpreted within the context of this single 3 K warming scenario. In addition, the analysis is based on two 11-year periods, which may be insufficient to robustly capture changes in rare, high-end hail events, particularly at regional scales.
As hailstorms locally become more common and intense, the demands on insurance systems to manage the financial risks associated with hail-related damages will escalate. Developing comprehensive risk assessment frameworks that incorporate climate projections and socioeconomic factors will be essential for informed decision-making and effective resource allocation. To this end, the comprehensive dataset of hail swaths in current and future climate simulations () provided in the “Code and data availability” section is well-suited for a stochastic resampling approach and application as a hazard in a hail damage model.
In order to visualize the object-based characteristics resulting from the storm tracking on a map (Fig. 2 and 3), the track data were gridded using a circular disk kernel with r=50 km (7854 km2). For the evaluation of statistical significance, block bootstrapping was utilized. To this end, the simulated years were randomly pooled with replacement from the original sample until the same number of years as in the original dataset was obtained. This resampling was repeated n=1000 times for both the current and future climate periods. Statistical significance (2σ) was determined by taking the difference between each resampled mean pair and determining whether 0 lies outside of the 5 % to 95 % interval of the distribution of differences. The same approach was applied to the composite differences (Fig. 6).
The tracking algorithm (Brennan et al., 2025a) used in this study is available at https://doi.org/10.5281/zenodo.12685276 (Brennan, 2024). The script used to extract the storm environment and construct composites is available at https://doi.org/10.5281/zenodo.14631622 (Brennan, 2025). Storm track data, storm-centered footprints, and the hail swath dataset are available at https://doi.org/10.3929/ethz-b-000745185 (Brennan et al., 2025b). The comprehensive dataset of hail swaths is well-suited for a stochastic resampling approach and application as a hazard in a hail damage model. It includes per-storm areas with corresponding HAILCAST maximum hail diameters and is available for the current and future simulations with 39 594 and 37 746 swaths, respectively. The compressed dataset amounts to a total of ∼0.7 GB. As outlined by Brennan et al. (2025a), gap-filling techniques were employed to mitigate the “fishbone effect”, a term introduced by Lukach et al. (2017). This phenomenon refers to the fragmented hail swaths resulting from the limited temporal resolution when capturing fast-moving storms with short paths along their direction of motion. The effect poses a particular challenge for damage models, as it leads to an underestimation of the hail-affected area, especially for larger hail diameters.
The supplement related to this article is available online at https://doi.org/10.5194/nhess-25-3693-2025-supplement.
During the extensive development of this study, all co-authors contributed valuable comments and suggestions through in-depth discussions. Furthermore, specific contributions include the following: KB – conceptualization of the study, development of the methodology and data analysis, visualizations and paper writing, review, and editing. IT – computation of the simulations, review, and editing. MS – methodology, review, and editing. HW – conceptualization, review, and editing.
The contact author has declared that none of the authors has any competing interests.
Publisher's note: Copernicus Publications remains neutral with regard to jurisdictional claims made in the text, published maps, institutional affiliations, or any other geographical representation in this paper. While Copernicus Publications makes every effort to include appropriate place names, the final responsibility lies with the authors.
We extend our gratitude to our colleagues from ETH and the entire scClim team (https://scclim.ethz.ch/, last access: 14 July 2025) for their valuable contributions and discussions. This study was funded by the Swiss National Science Foundation (SNSF) Sinergia grant CRSII5_201792. We acknowledge the use of OpenAI’s ChatGPT in assisting with language refinement in the preparation of an earlier draft of this paper.
This research has been supported by the Schweizerischer Nationalfonds zur Förderung der Wissenschaftlichen Forschung (grant no. CRSII5_201792).
This paper was edited by Joaquim G. Pinto and reviewed by two anonymous referees.
Adams-Selin, R.: The Quasi-Stochastic Nature of Hail Growth: Hail Trajectory Clusters in Simulations of the Kingfisher, Oklahoma, Hailstorm, Mon. Weather Rev., 153, 67–87, https://doi.org/10.1175/MWR-D-23-0233.1, 2025. a
Adams-Selin, R. D. and Ziegler, C. L.: Forecasting hail using a one-dimensional hail growth model within WRF, Mon. Weather Rev., 144, 4919–4939, https://doi.org/10.1175/MWR-D-16-0027.1, 2016. a, b, c, d
Adlerman, E. J. and Droegemeier, K. K.: The sensitivity of numerically simulated cyclic mesocyclogenesis to variations in model physical and computational parameters, Mon. Weather Rev., 130, 2671–2691, https://doi.org/10.1175/1520-0493(2002)130<2671:TSONSC>2.0.CO;2, 2002. a
Arnould, G., Montmerle, T., Rottner, L., and Moisselin, J.-M.: An object-based method to study the life cycle of mesoscale convective systems and their environment from cloud-resolving AROME-France simulations, Q. J. Roy. Meteor. Soc., 1–19, https://doi.org/10.1002/qj.4919, 2025. a
Ashley, W. S., Haberlie, A. M., and Gensini, V. A.: The future of supercells in the United States, B. Am. Meteor. Soc., 104, E1–E21, https://doi.org/10.1175/BAMS-D-22-0027.1, 2023. a, b
Baldauf, M., Seifert, A., Förstner, J., Majewski, D., Raschendorfer, M., and Reinhardt, T.: Operational convective-scale numerical weather prediction with the COSMO model: description and sensitivities, Mon. Weather Rev., 139, 3887–3905, https://doi.org/10.1175/MWR-D-10-05013.1, 2011. a
Ban, N.: Convection-resolving climate simulations for the greater Alpine region: development, evaluation and climate projections, Doctoral Thesis, ETH Zurich, https://doi.org/10.3929/ETHZ-A-010510915, 2015. a
Ban, N., Schmidli, J., and Schär, C.: Evaluation of the convection-resolving regional climate modeling approach in decade-long simulations, J. Geophys. Res.-Atmos., 119, 7889–7907, https://doi.org/10.1002/2014JD021478, 2014. a
Battaglioli, F., Groenemeijer, P., Púčik, T., Taszarek, M., Ulbrich, U., and Rust, H.: Modeled multidecadal trends of lightning and (very) large hail in Europe and North America (1950–2021), J. Appl. Meteorol. Clim., 62, 1627–1653, https://doi.org/10.1175/JAMC-D-22-0195.1, 2023. a
Brennan, K.: KillianBrennan/cell_tracker: Cell tracker as used for analysis in the WCD case study paper (WCD_case_paper), Zenodo [code], https://doi.org/10.5281/zenodo.12685276, 2024. a
Brennan, K.: KillianBrennan/cookie_cutter: climate release (climate_release), Zenodo [code], https://doi.org/10.5281/zenodo.14631622, 2025. a
Brennan, K. P., Sprenger, M., Walser, A., Arpagaus, M., and Wernli, H.: An object-based and Lagrangian view on an intense hailstorm day in Switzerland as represented in COSMO-1E ensemble hindcast simulations, Weather Clim. Dynam., 6, 645–668, https://doi.org/10.5194/wcd-6-645-2025, 2025a. a, b, c, d, e, f, g, h
Brennan, K., Thurnherr, I., Sprenger, M, and Wernli, H.: Supplement data to: Insights from hailstorm track analysis in European climate change simulations, ETH Zurich [data set], https://doi.org/10.3929/ethz-b-000745185, 2025b. a
Brimelow, J. C., Reuter, G. W., and Poolman, E. R.: Modeling maximum hail size in Alberta thunderstorms, Weather Forecast., 17, 1048–1062, https://doi.org/10.1175/1520-0434(2002)017<1048:MMHSIA>2.0.CO;2, 2002. a
Brimelow, J. C., Burrows, W. R., and Hanesiak, J. M.: The changing hail threat over North America in response to anthropogenic climate change, Nat. Clim. Change, 7, 516–522, https://doi.org/10.1038/nclimate3321, 2017. a, b, c
Brogli, R., Lund Sørland, S., Kröner, N., and Schär, C.: Future summer warming pattern under climate change is affected by lapse-rate changes, Weather Clim. Dynam., 2, 1093–1110, https://doi.org/10.5194/wcd-2-1093-2021, 2021. a
Brogli, R., Heim, C., Mensch, J., Sørland, S. L., and Schär, C.: The pseudo-global-warming (PGW) approach: methodology, software package PGW4ERA5 v1.1, validation, and sensitivity analyses, Geosci. Model Dev., 16, 907–926, https://doi.org/10.5194/gmd-16-907-2023, 2023. a, b
Bryan, G. H., Wyngaard, J. C., and Fritsch, J. M.: Resolution requirements for the simulation of deep moist convection, Mon. Weather Rev., 131, 2394–2416, https://doi.org/10.1175/1520-0493(2003)131<2394:rrftso>2.0.co;2, 2003. a
Chen, J., Dai, A., Zhang, Y., and Rasmussen, K. L.: Changes in convective available potential energy and convective inhibition under global warming, J. Climate, 33, 2025–2050, https://doi.org/10.1175/JCLI-D-19-0461.1, 2020. a
Christensen, J. H. and Christensen, O. B.: A summary of the PRUDENCE model projections of changes in European climate by the end of this century, Climatic Change, 81, 7–30, https://doi.org/10.1007/s10584-006-9210-7, 2007. a
Cui, R., Ban, N., Demory, M.-E., Aellig, R., Fuhrer, O., Jucker, J., Lapillonne, X., and Schär, C.: Exploring hail and lightning diagnostics over the Alpine-Adriatic region in a km-scale climate model, Weather Clim. Dynam., 4, 905–926, https://doi.org/10.5194/wcd-4-905-2023, 2023. a
Cui, R., Thurnherr, I., Velasquez, P., Brennan, K., Leclair, M., Mazzoleni, A., Schmid, T., Wernli, H., and Schär, C.: A european hail and lightning climatology from an 11-year kilometer-scale regional climate simulation, J. Geophys. Res.-Atmos., 130, e2024JD042828, https://doi.org/10.1029/2024JD042828, 2024. a, b, c, d, e
Davis, C., Brown, B., and Bullock, R.: Object-based verification of precipitation forecasts. Part I: methodology and application to mesoscale rain areas, Mon. Weather Rev., 134, 1772–1784, https://doi.org/10.1175/MWR3145.1, 2006. a
Doswell, C. A. (Ed.): Severe Convective Storms, American Meteorological Society, Boston, MA, ISBN 978-1-935704-06-5, https://doi.org/10.1007/978-1-935704-06-5, 2001. a
Feldmann, M., Blanc, M., Brennan, K. P., Thurnherr, I., Velasquez, P., Martius, O., and Schär, C. European supercell thunderstorms – An underestimated current threat and an increasing future hazard, Science Advances, https://doi.org/10.1126/sciadv.adx0513, 2025. a, b
Fischer, J., Kunz, M., Lombardo, K., and Kumjian, M. R.: Hail Trajectories in a Wide Spectrum of Supercell-Like Updrafts, J. Atmos. Sci., 82, 1403–1422, https://doi.org/10.1175/JAS-D-24-0222.1, 2025. a
Gensini, V. A., Ashley, W. S., Michaelis, A. C., Haberlie, A. M., Goodin, J., and Wallace, B. C.: Hailstone size dichotomy in a warming climate, npj Clim. Atmos. Sci., 7, 1–10, https://doi.org/10.1038/s41612-024-00728-9, 2024. a, b, c, d, e, f
Hara, M., Yoshikane, T., Kawase, H., and Kimura, F.: Estimation of the impact of global warming on snow depth in japan by the pseudo-global-warming method, Hydrol. Res., 2, 61–64, https://doi.org/10.3178/hrl.2.61, 2008. a
Held, I. M. and Soden, B. J.: Robust responses of the hydrological cycle to global warming, J. Climate, 19, 5686–5699, https://doi.org/10.1175/JCLI3990.1, 2006. a
Hersbach, H., Bell, B., Berrisford, P., Hirahara, S., Horányi, A., Muñoz-Sabater, J., Nicolas, J., Peubey, C., Radu, R., Schepers, D., Simmons, A., Soci, C., Abdalla, S., Abellan, X., Balsamo, G., Bechtold, P., Biavati, G., Bidlot, J., Bonavita, M., De Chiara, G., Dahlgren, P., Dee, D., Diamantakis, M., Dragani, R., Flemming, J., Forbes, R., Fuentes, M., Geer, A., Haimberger, L., Healy, S., Hogan, R. J., Hólm, E., Janisková, M., Keeley, S., Laloyaux, P., Lopez, P., Lupu, C., Radnoti, G., de Rosnay, P., Rozum, I., Vamborg, F., Villaume, S., and Thépaut, J.-N.: The ERA5 global reanalysis, Q. J. Roy. Meteor. Soc., 146, 1999–2049, https://doi.org/10.1002/qj.3803, 2020. a
Hodges, K. I.: Adaptive constraints for feature tracking, Mon. Weather Rev., 127, 1362–1373, https://doi.org/10.1175/1520-0493(1999)127<1362:ACFFT>2.0.CO;2, 1999. a
Kapsch, M.-L., Kunz, M., Vitolo, R., and Economou, T.: Long-term trends of hail-related weather types in an ensemble of regional climate models using a Bayesian approach, J. Geophys. Res. Atmos., 117, https://doi.org/10.1029/2011JD017185, 2012. a, b
Klasa, C., Arpagaus, M., Walser, A., and Wernli, H.: An evaluation of the convection-permitting ensemble COSMO-E for three contrasting precipitation events in Switzerland, Q. J. Roy. Meteor. Soc., 144, 744–764, https://doi.org/10.1002/qj.3245, 2018. a
Kumjian, M. R. and Lombardo, K.: A hail growth trajectory model for exploring the environmental controls on hail size: model physics and idealized tests, J. Atmos. Sci., 77, 2765–2791, https://doi.org/10.1175/JAS-D-20-0016.1, 2020. a
Leutwyler, D., Fuhrer, O., Lapillonne, X., Lüthi, D., and Schär, C.: Towards European-scale convection-resolving climate simulations with GPUs: a study with COSMO 4.19, Geosci. Model Dev., 9, 3393–3412, https://doi.org/10.5194/gmd-9-3393-2016, 2016. a
Lin, Y. and Kumjian, M. R.: Influences of CAPE on hail production in simulated supercell storms, J. Atmos. Sci., 79, 179–204, https://doi.org/10.1175/JAS-D-21-0054.1, 2022. a
Lukach, M., Foresti, L., Giot, O., and Delobbe, L.: Estimating the occurrence and severity of hail based on 10 years of observations from weather radar in Belgium: Estimating radar-based occurrence and severity of hail in Belgium, Meteorol. Appl., 24, 250–259, https://doi.org/10.1002/met.1623, 2017. a
Mallinson, H., Lasher-Trapp, S., Trapp, J., Woods, M., and Orendorf, S.: Hailfall in a possible future climate using a pseudo-global warming approach: Hail characteristics and mesoscale influences, J. Climate, 37, 527–549, https://doi.org/10.1175/JCLI-D-23-0181.1, 2023. a
Manzato, A., Cicogna, A., Centore, M., Battistutta, P., and Trevisan, M.: Hailstone characteristics in northeast Italy from 29 years of hailpad data, J. Appl. Meteorol. Clim., 61, 1779–1795, https://doi.org/10.1175/JAMC-D-21-0251.1, 2022. a
Markowski, P. and Richardson, Y.: Mesoscale meteorology in midlatitudes, Wiley, 1 edn., ISBN 978-0-470-74213-6, 2010. a
Martín, M. L., Calvo-Sancho, C., Taszarek, M., González-Alemán, J. J., Montoro-Mendoza, A., Díaz-Fernández, J., Bolgiani, P., Sastre, M., and Martín, Y.: Major role of marine heatwave and anthropogenic climate change on a giant hail event in spain, Geophys. Res. Lett., 51, e2023GL107632, https://doi.org/10.1029/2023GL107632, 2024. a
Neu, U., Akperov, M. G., Bellenbaum, N., Benestad, R., Blender, R., Caballero, R., Cocozza, A., Dacre, H. F., Feng, Y., Fraedrich, K., Grieger, J., Gulev, S., Hanley, J., Hewson, T., Inatsu, M., Keay, K., Kew, S. F., Kindem, I., Leckebusch, G. C., Liberato, M. L. R., Lionello, P., Mokhov, I. I., Pinto, J. G., Raible, C. C., Reale, M., Rudeva, I., Schuster, M., Simmonds, I., Sinclair, M., Sprenger, M., Tilinina, N. D., Trigo, I. F., Ulbrich, S., Ulbrich, U., Wang, X. L., and Wernli, H.: IMILAST: A community effort to intercompare extratropical cyclone detection and tracking algorithms, B. Am. Meteor. Soc., 94, 529–547, https://doi.org/10.1175/BAMS-D-11-00154.1, 2013. a
Nisi, L., Hering, A., Germann, U., and Martius, O.: A 15-year hail streak climatology for the Alpine region, Q. J. Roy. Meteor. Soc., 144, 1429–1449, https://doi.org/10.1002/qj.3286, 2018. a
Nowotarski, C. J., Peters, J. M., and Mulholland, J. P.: Evaluating the effective inflow layer of simulated supercell updrafts, Mon. Weather Rev., 148, 3507–3532, https://doi.org/10.1175/MWR-D-20-0013.1, 2020. a
Peters, J. M., Morrison, H., Nowotarski, C. J., Mulholland, J. P., and Thompson, R. L.: A formula for the maximum vertical velocity in supercell updrafts, J. Atmos. Sci., 77, 3747–3757, https://doi.org/10.1175/JAS-D-20-0103.1, 2020a. a, b
Peters, J. M., Nowotarski, C. J., and Mullendore, G. L.: Are supercells resistant to entrainment because of their rotation?, J. Atmos. Sci., 77, 1475–1495, https://doi.org/10.1175/JAS-D-19-0316.1, 2020b. a
Portmann, R., Schmid, T., Villiger, L., Bresch, D. N., and Calanca, P.: Modelling crop hail damage footprints with single-polarization radar: the roles of spatial resolution, hail intensity, and cropland density, Nat. Hazards Earth Syst. Sci., 24, 2541–2558, https://doi.org/10.5194/nhess-24-2541-2024, 2024. a
Prein, A. F. and Heymsfield, A. J.: Increased melting level height impacts surface precipitation phase and intensity, Nat. Clim. Change, 10, 771–776, https://doi.org/10.1038/s41558-020-0825-x, 2020. a
Prein, A. F., Gobiet, A., Suklitsch, M., Truhetz, H., Awan, N. K., Keuler, K., and Georgievski, G.: Added value of convection permitting seasonal simulations, Clim. Dynam., 41, 2655–2677, https://doi.org/10.1007/s00382-013-1744-6, 2013. a
Prein, A. F., Liu, C., Ikeda, K., Trier, S. B., Rasmussen, R. M., Holland, G. J., and Clark, M. P.: Increased rainfall volume from future convective storms in the US, Nat. Clim. Change, 7, 880–884, https://doi.org/10.1038/s41558-017-0007-7, 2017a. a, b, c, d
Prein, A. F., Rasmussen, R. M., Ikeda, K., Liu, C., Clark, M. P., and Holland, G. J.: The future intensification of hourly precipitation extremes, Nat. Clim. Change, 7, 48–52, https://doi.org/10.1038/nclimate3168, 2017b. a
Prein, A. F., Rasmussen, R. M., Wang, D., and Giangrande, S. E.: Sensitivity of organized convective storms to model grid spacing in current and future climates, Phil. Trans. R. Soc., 379, 20190546, https://doi.org/10.1098/rsta.2019.0546, 2021. a
Pruppacher, H. R. and Klett, J. D.: Microphysics of clouds and precipitation, Atmospheric and Oceanographic Sciences Library, Springer Netherlands, 2 edn., ISBN 978-0-7923-4211-3, 2010. a
Punge, H. J. and Kunz, M.: Hail observations and hailstorm characteristics in Europe: A review, Atmos. Res., 176–177, 159–184, https://doi.org/10.1016/j.atmosres.2016.02.012, 2016. a
Rädler, A. T., Groenemeijer, P. H., Faust, E., Sausen, R., and Púčik, T.: Frequency of severe thunderstorms across Europe expected to increase in the 21st century due to rising instability, npj Clim. Atmos. Sci., 2, 1–5, https://doi.org/10.1038/s41612-019-0083-7, 2019. a, b
Rasmussen, K. L., Prein, A. F., Rasmussen, R. M., Ikeda, K., and Liu, C.: Changes in the convective population and thermodynamic environments in convection-permitting regional climate simulations over the United States, Clim. Dynam., 55, 383–408, https://doi.org/10.1007/s00382-017-4000-7, 2020. a
Raupach, T. H., Martius, O., Allen, J. T., Kunz, M., Lasher-Trapp, S., Mohr, S., Rasmussen, K. L., Trapp, R. J., and Zhang, Q.: The effects of climate change on hailstorms, Nat. Rev. Earth Environ., 2, 213–226, https://doi.org/10.1038/s43017-020-00133-9, 2021. a, b, c, d, e
Ridder, N. N., Pitman, A. J., Westra, S., Ukkola, A., Do, H. X., Bador, M., Hirsch, A. L., Evans, J. P., Di Luca, A., and Zscheischler, J.: Global hotspots for the occurrence of compound events, Nat. Commun., 11, 5956, https://doi.org/10.1038/s41467-020-19639-3, 2020. a
Sanderson, M. G., Hand, W. H., Groenemeijer, P., Boorman, P. M., Webb, J. D. C., and McColl, L. J.: Projected changes in hailstorms during the 21st century over the UK, Int. J. Climatol., 35, 15–24, https://doi.org/10.1002/joc.3958, 2015. a, b
Schär, C., Frei, C., Lüthi, D., and Davies, H. C.: Surrogate climate-change scenarios for regional climate models, Geophys. Res. Lett., 23, 669–672, https://doi.org/10.1029/96GL00265, 1996. a
Schmid, T., Portmann, R., Villiger, L., Schröer, K., and Bresch, D. N.: An open-source radar-based hail damage model for buildings and cars, Nat. Hazards Earth Syst. Sci., 24, 847–872, https://doi.org/10.5194/nhess-24-847-2024, 2024. a, b
Schröer, K., Trefalt, S., Hering, A., Germann, U., and Schwierz, C.: Hagelklima Schweiz: Daten, Ergebnisse und Dokumentation: Fachbericht MeteoSchweiz No. 283, Tech. rep., MeteoSchweiz, https://doi.org/10.18751/PMCH/TR/283.HAGELKLIMASCHWEIZ/1.0, 2023. a
Seneviratne, S. I., Zhang, X., Adnan, M., Badi, W., Dereczynski, C., Luca, A. D., Ghosh, S., Iskandar, I., Kossin, J., Lewis, S., Otto, F., Pinto, P., Satoh, M., Vicente-Serrano, S. M., Wehner, M., and Zhou, B.: Weather and climate extreme events in a changing climate. In climate change 2021: The physical science basis. Contribution of working group I to the sixth assessment report of the intergovernmental panel on climate change, Cambridge University Press, Cambridge, United Kingdom and New York, NY, USA, 1513–1766, https://doi.org/10.1017/9781009157896.013, 2021. a, b
Steppeler, J., Doms, G., Schättler, U., Bitzer, H. W., Gassmann, A., Damrath, U., and Gregoric, G.: Meso-gamma scale forecasts using the nonhydrostatic model LM, Meteorol. Atmos. Phys., 82, 75–96, https://doi.org/10.1007/s00703-001-0592-9, 2003. a
Thurnherr, I., Cui, R., Velasquez, P., Wernli, H., and Schär, C.: The effect of 3 °C global warming on hail over Europe, Geophysical Research Letters, 52, e2025GL114811, https://doi.org/10.1029/2025GL114811, 2025. a, b, c, d, e, f, g, h, i, j, k, l, m, n, o, p, q
Trapp, R. J., Hoogewind, K. A., and Lasher-Trapp, S.: Future changes in hail occurrence in the United States determined through convection-permitting dynamical downscaling, J. Climate, 32, 5493–5509, https://doi.org/10.1175/JCLI-D-18-0740.1, 2019. a, b, c
Trenberth, K. E., Dai, A., Rasmussen, R. M., and Parsons, D. B.: The changing character of precipitation, B. Am. Meteor. Soc., 84, 1205–1218, https://doi.org/10.1175/BAMS-84-9-1205, 2003. a
Wallace, J. M. and Hobbs, P. V.: Cloud Microphysics, in: Atmospheric Science, Elsevier, 209–269, ISBN 978-0-12-732951-2, https://doi.org/10.1016/B978-0-12-732951-2.50011-9, 2006. a
Wilhelm, L., Schwierz, C., Schröer, K., Taszarek, M., and Martius, O.: Reconstructing hail days in Switzerland with statistical models (1959–2022), Nat. Hazards Earth Syst. Sci., 24, 3869–3894, https://doi.org/10.5194/nhess-24-3869-2024, 2024. a, b
Please note that this list is non-exhaustive.
As the inflow maximum mixed-layer CAPE and most unstable CAPE correlate well (c=0.94), we would expect the analysis involving inflow CAPE to hold true for both choices of CAPE (on average, most unstable CAPE is 1.25× larger than mixed-layer CAPE). We use mixed-layer CAPE and CIN exclusively in this study.
A note on filtering the composite constituents: filtering footprints every hour by the n largest hail diameters is not equivalent to filtering by the n storms that yield the largest hail diameters. The second approach is arguably the better approach, as the hourly sampling might miss the most intense part of the storms yielding the largest diameters. The representation of the n footprints with the largest hail diameters essentially gives the storm structure during the most intense phases of the storms, as seen by the hourly sampling.
Although the inflow level can vary substantially (e.g., Nowotarski et al., 2020), due to limited data availability (the simulation output for 3D variables was available only on eight vertical pressure levels) and prior knowledge of inflow characteristics of hailstorms in the alpine domain (Brennan et al., 2025a), 850 hPa was selected as the inflow level.
Looking at the hourly column maximum vertical wind, which is sampled at the model time step (20 s) and includes all 60 model levels, these results remain unchanged, yielding 23.0 and 23.3 m s−1 for current and future simulations, respectively.
- Abstract
- Introduction
- Methods and data
- Hailstorm tracks
- Storm-centered composites
- Climate change effects on hailstorms' inflow environment
- Summary and conclusions
- Appendix A: Bootstrapping
- Code and data availability
- Author contributions
- Competing interests
- Disclaimer
- Acknowledgements
- Financial support
- Review statement
- References
- Supplement