the Creative Commons Attribution 4.0 License.
the Creative Commons Attribution 4.0 License.
 | 15 Sep 2025
Sectoral vulnerability to drought: exploring the role of blue and green water dependency in mid- and high-latitude regions
Malgorzata Blicharska
Thomas Grabs
Claudia Teutschbein
The European continent has experienced several large-scale drought events in recent years, and climate projections suggest an increasing drought risk in many parts of the world. As droughts can have large impacts on socio-hydrological systems, analyzing drought risk is an important part of proactive drought risk management and disaster risk reduction. Drought risk can be expressed as a product of hazard, exposure, and vulnerability, where vulnerability is highly contextual and complex. As droughts can affect all parts of the hydrological system, from precipitation and soil moisture to groundwater and surface water reservoirs, drought vulnerability differs depending on what part of the system is studied. Building on previous results from a survey analyzing drought vulnerability across seven water-dependent sectors, this paper explores how vulnerability factors vary based on sectors' dependency on blue water (surface and subsurface freshwater) or green water (soil moisture) in mid- and high-latitude regions. The findings reveal that drought vulnerability differs based on water type dependency, especially concerning water supply and species characteristics. Perceptions of vulnerability factors vary in number, category, and overall ranking, highlighting the importance of considering water dependency when choosing vulnerability factors for drought risk assessments and to clearly define the drought hazard types involved.
- Article
(4495 KB) - Full-text XML
-
Supplement
(1225 KB) - BibTeX
- EndNote


Climate projections suggest that drought risk is increasing, with some regions likely to experience more frequent and severe drought events in future climates (UNDRR, 2021). Some areas are already seeing more intense drought events, especially West Africa and southern Europe (UNDRR, 2021). The European continent has experienced several large-scale drought events in recent years, with the most recent being the extraordinary drought conditions in 2022 (Faranda et al., 2023). Droughts can have severe and far-reaching impacts on societies, where impacts can be both direct and indirect (Blauhut et al., 2016); these can develop slowly over time, affecting many parts of society (Mishra and Singh, 2010). Among natural hazards, drought events can cause some of the greatest economic losses (Kim et al., 2015), while their (often substantial) impacts on human health and the environment are more difficult to assess (UNDRR, 2019).
Modern approaches to drought risk management follow the Sendai Framework for Disaster Risk Reduction 2015–2030. The Sendai framework emphasizes the need for disaster risk management and aims to further the understanding of complex disaster risk. The framework divides risk into three dimensions: hazard, exposure, and vulnerability (UNDRR, 2015). A disaster occurs when a hazardous event takes place in a vulnerable area with exposed entities, creating a serious disruption of the functions of a community or society (UNDRR, 2019). Hence, in order to understand and manage drought risk, an understanding of all three dimensions is needed.
As a hazard, droughts are referred to as creeping phenomena, with a slow onset and with impacts that can appear after the drought event itself has ended. As a result, determining its onset and termination can be difficult. Droughts are generally distinguished as four different types: metrological droughts that represent a lack of precipitation, sometimes combined with an increase in evapotranspiration compared to normal conditions (Van Loon, 2015); agricultural droughts, depicting a soil moisture deficit that affects soil vegetation and crops (Van Loon, 2015); hydrological droughts, which are characterized by deficits in surface- and/or subsurface water resources (Mishra and Singh, 2010); and socioeconomic droughts, which represent an impact-oriented deficit of water as a good in the supply and demand network of the human–water nexus (Mishra and Singh, 2010). The different drought types have different propagation times, where meteorological and soil moisture droughts typically develop faster than hydrological and socioeconomic droughts, as reservoirs can offset and smooth out the effects of a drought over time (Mishra and Singh, 2010; Van Loon, 2015).
The second risk dimension, drought exposure, encompasses the entities exposed during a drought event, such as buildings, inhabitants, or crops (Ciurean et al., 2013). The exposure component is often expressed as a sub-dimension of vulnerability, as the term was originally included in the definition of vulnerability in the (older) Intergovernmental Panel on Climate Change (IPCC) Assessment Report 4 (AR 4) (IPCC, 2007). However, since then, the exposure term has been omitted from the vulnerability definitions used in AR5 and AR6 (IPCC, 2023; IPCC et al., 2014) and is now considered a standalone dimension of drought risk. Instead, the third risk dimension, drought vulnerability, can generally be expressed as the predisposition of a system to be negatively affected by a drought (Füssel, 2007) Yet, vulnerability is a complex concept, which can be described, defined, and conceptualized in a number of ways (Adger, 2006; Ciurean et al., 2013; Sebesvari et al., 2016; Turner et al., 2003). According to IPCC AR6, vulnerability is defined as encompassing “a variety of concepts and elements including sensitivity or susceptibility to harm and lack of capacity to cope and adapt” (IPCC, 2023). Adaptive capacity can be seen as the ability to anticipate and learn from droughts in the long term, whereas coping capacity refers to the ability to react and cope in the short term. Susceptibility, meanwhile, relates to the predisposition to be negatively impacted by a drought event. Using the definition proposed by IPCC AR6 (IPCC, 2023), Stenfors et al. (2024) conceptualized drought vulnerability of a socio-hydrological system as comprising three dimensions: (1) governance processes and the available policies and plans (i.e., governance), (2) the indirect water consumers of the system (i.e., society), and (3) its direct water consumers (i.e., particular sectors) (Fig. 1a). Factors of vulnerability connected to governance processes, policies, and plans can affect both drought vulnerability in individual sectors and society as a whole. They relate to aspects such as drought awareness of authorities, the presence of drought plans and risk assessments, or the financial capacity of the government to offer support during a drought event. Meanwhile, vulnerability factors connected to indirect water consumers relate to the population consuming water indirectly, through goods such as food, energy, or public water supply. For indirect water consumers, vulnerability can be expressed through demographic aspects that may affect drought vulnerability, such as different aspects of socioeconomic susceptibility (e.g., level of income or integration). Lastly, direct water consumers refer to socio-hydrological sectors that consume water directly for the production of goods or for sustaining ecosystem services.
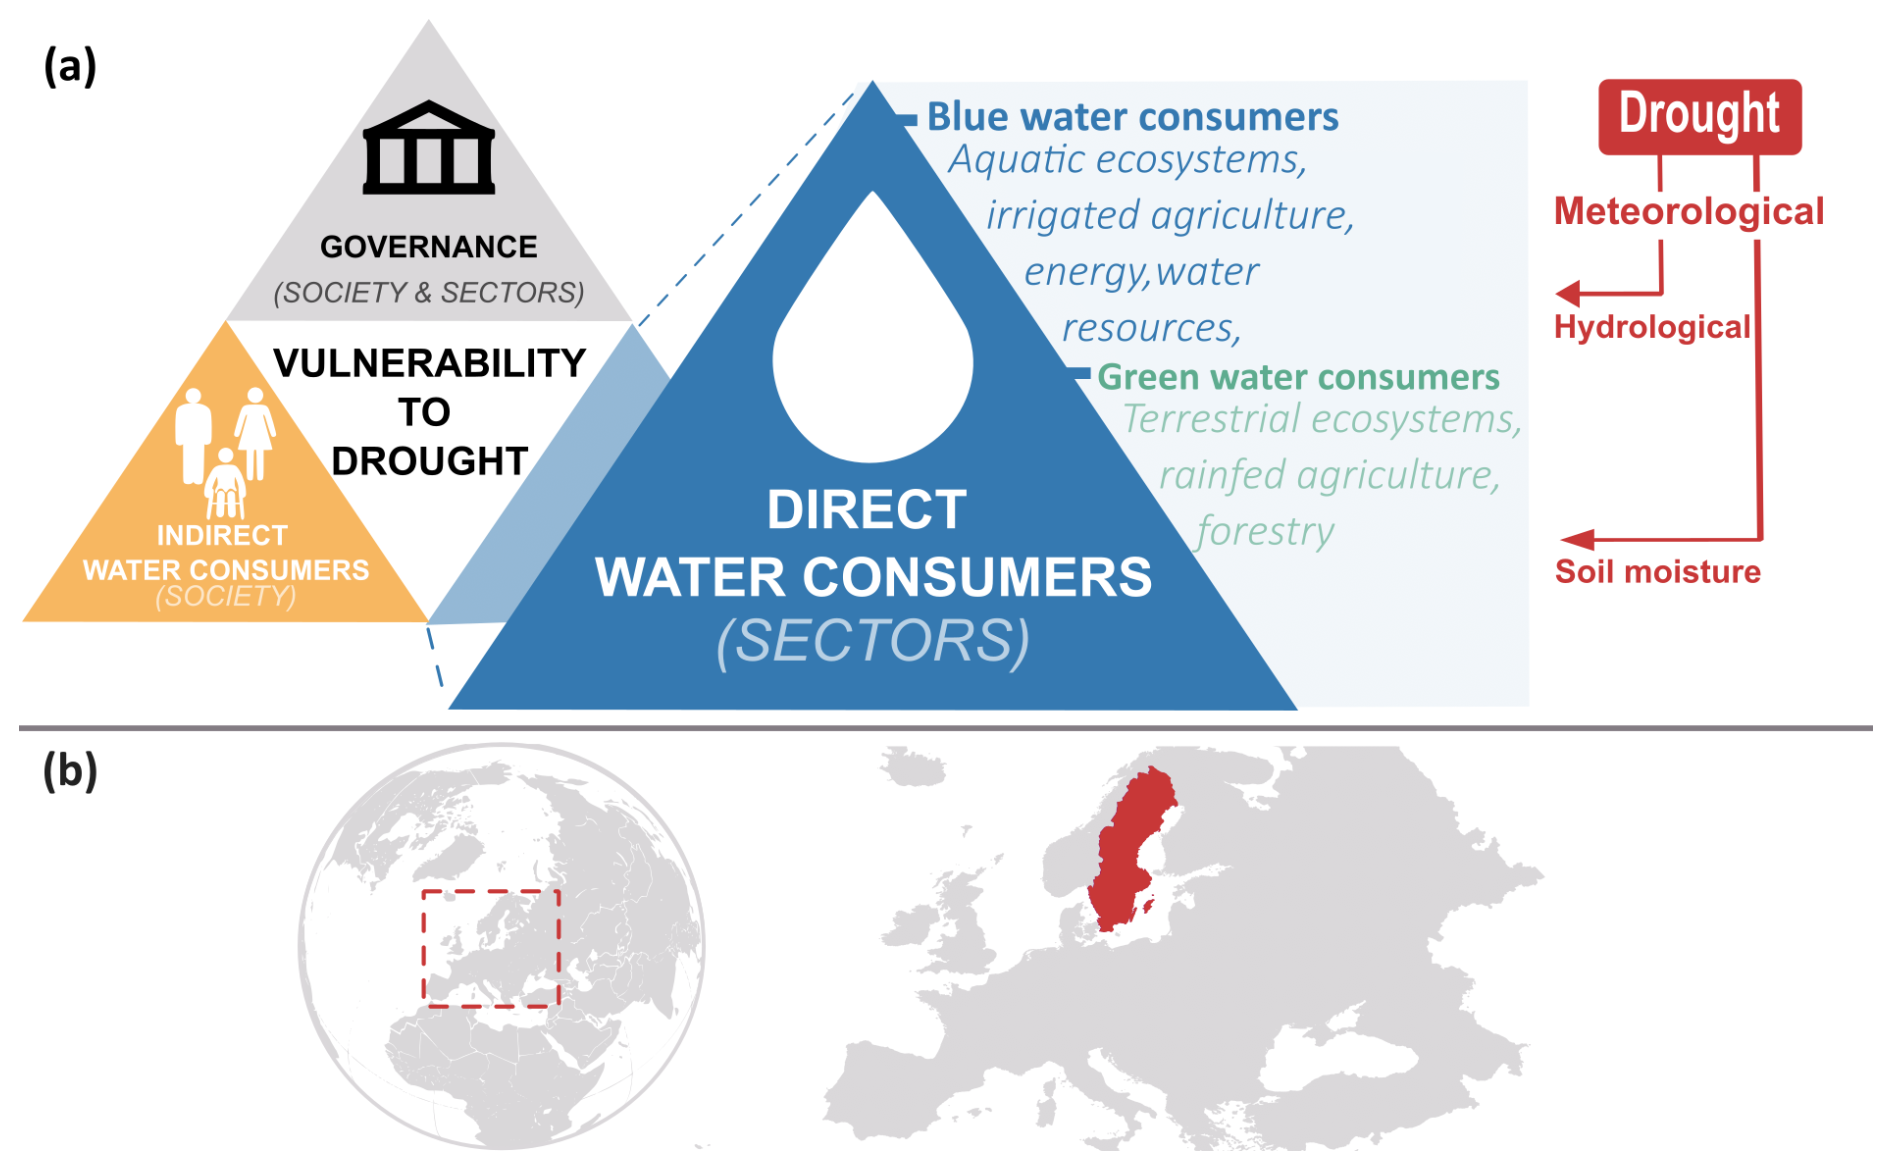
Figure 1(a) The conceptual framework developed by Stenfors et al. (2024). In the framework, drought vulnerability is represented by factors relating to governance, indirect water consumers, and direct water consumers. The latter is further divided into factors relating to sectors dependent on blue or green water. The framework has been modified from Stenfors et al. (2024) to visualize how different drought types (i.e., hydrological and soil moisture droughts) are linked to different direct water consumers. (b) Geographic extent of survey participants representing water-dependent sectors in Sweden.
These direct water consumers can be further categorized based on their dependency on different types of water resources, i.e., whether they depend predominantly on green or blue sources of water. Falkenmark and Rockström (2006) described green water as water stored in the unsaturated zone as soil moisture, whereas blue water is stored as subsurface water in the saturated zone or as surface water. Examples of direct water consumers relying on surface or subsurface water (i.e., blue water resources) include energy producers, drinking water suppliers, irrigated agriculture, and aquatic ecosystems. In contrast, sectors like forestry, rain-fed agriculture, and terrestrial ecosystems primarily depend on water stored in the unsaturated zone as soil moisture (i.e., green water).
The distinction between blue and green water resources is crucial as they are affected differently by various types of drought. Agricultural drought represents deficits in green water supplies, whereas hydrological drought refers to water deficits in blue water. Hence, the conceptual framework of Stenfors et al. (2024) suggests that different drought types could affect various consumers or sectors differently, each with their own specific vulnerabilities to that drought type. To explore these consumer- or sector-specific vulnerabilities, Stenfors et al. (2025) conducted an online survey targeting stakeholders from seven water-dependent sectors in Sweden, northern Europe (Fig. 1b). Stretching from 55°2′ to 69°3′ N, Sweden comprises three climate zones according to the Köppen–Geiger classification, namely warm-summer hemiboreal (Dfb) in the south, subarctic boreal (Dfc) in central and northern Sweden, and tundra (ET) in the northwest, where many areas currently classified as Dfb and Dfc are projected to transition to Cfb (temperate oceanic climate) and Dfb by the end of the century (Beck et al., 2018). Sweden has historically been considered to be water abundant; however, the 2018 drought affected large parts of the country (Teutschbein et al., 2022).
The survey results enabled the identification of stakeholder-informed drought vulnerability factors that are particularly relevant to water-dependent sectors and societies in mid- and high-latitude regions (located above 50° N). The diverse perceptions of drought vulnerability of different consumers or sectors further indicate that variations in the relevance of vulnerability factors may stem from the specific type of water dependency (blue versus green) of each consumer or sector.
Building on the notion of an inherent relationship between sectoral drought vulnerability and the type of water dependency in mid- and high-latitude regions (Stenfors et al., 2025), this paper provides a comprehensive analysis of how sectoral drought vulnerability differs according to water type dependency and discusses the implication for drought risk assessments, as well as policy design. Utilizing the conceptual framework described by Stenfors et al. (2024) and the survey data presented by Stenfors et al. (2025) in this issue, we aim to address the following research questions for drought vulnerability in mid- and high-latitude regions:
- 1.
What are the relevant vulnerability factors for blue-water-dependent sectors compared to green-water-dependent sectors?
- 2.
How do the vulnerability factors for blue- and green-water-dependent sectors rank in terms of impact scores?
- 3.
Which vulnerability factors are rated the highest for each type of water dependency?
- 4.
Do the impact ratings of vulnerability factors vary among respondents based on the type of water dependency?
2.1 Data collection
The starting point for the analysis was a list of 74 vulnerability factors connected to direct water consumers, compiled from existing literature by Stenfors et al. (2024) for forested cold-climate regions. These factors related broadly to nine categories of vulnerability (Fig. 2) and referred to adaptive capacity, coping capacity, or susceptibility, following the IPCC AR6 definition of vulnerability.
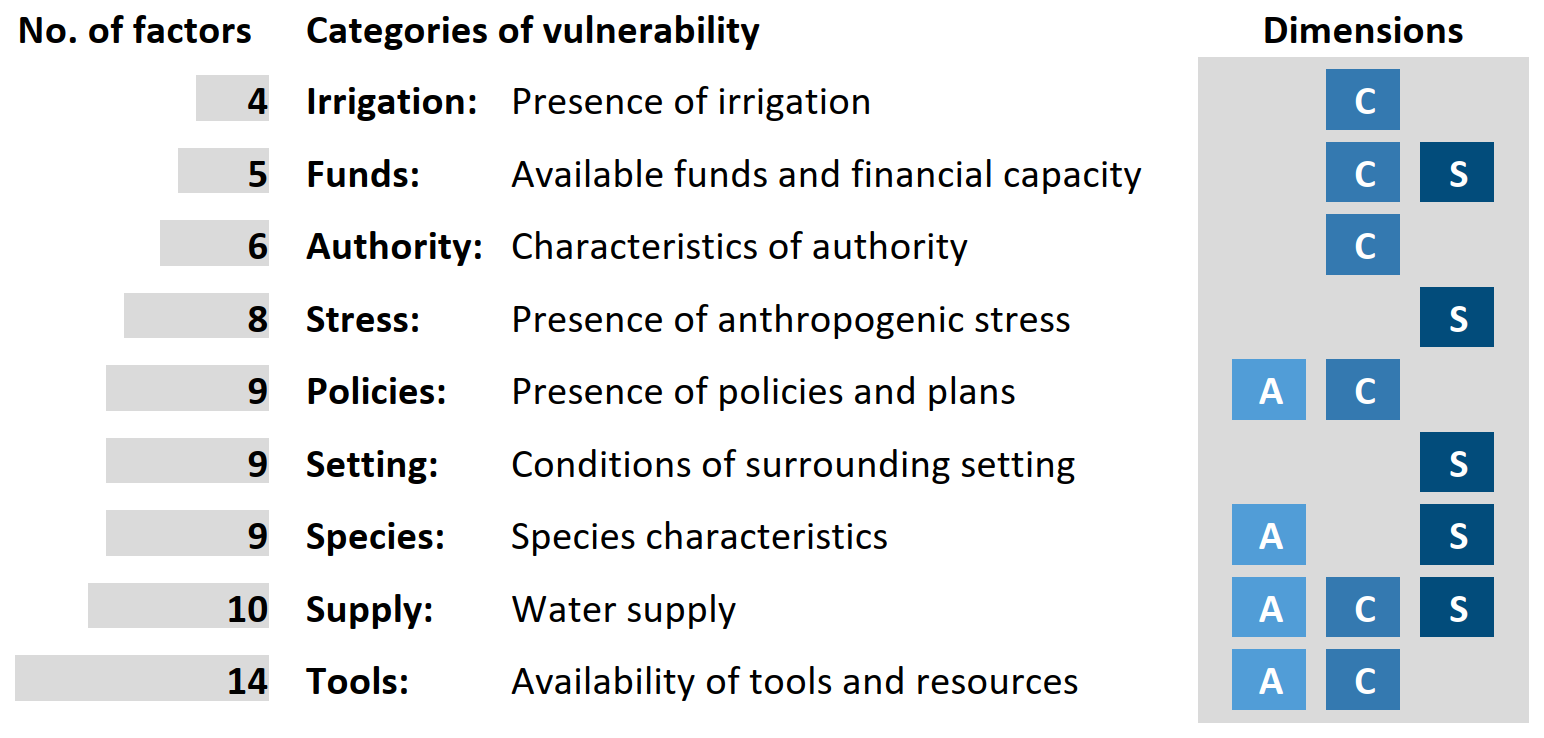
Figure 2Overview of the number of vulnerability factors for direct water consumers, compiled by Stenfors at al. (2024). The factors are divided into nine subcategories (short names in bold) relating to the general attributes of the factors. Information about whether each category includes factors connected to adaptive capacity (A), coping capacity (C), and/or susceptibility (S) is also displayed.
To investigate and refine the assembled vulnerability factors, an online survey was developed, targeting seven water-dependent sectors in Sweden (Fig. 1): energy production, including for example hydropower or nuclear production (i.e., energy); agricultural crop production or livestock (agriculture); aquatic and terrestrial ecosystems (environment); drinking water production and distribution (water supply); water resource management (water resources); forest conservation and production (forestry); and water-intensive industries such as paper and pulp, chemical production, or steel and metal works (water-intensive industry). The survey included three sections:
- I.
Background information. This section collected data on the respondents, including their primary sector, years of experience, type of organization, and Swedish region in which they work.
- II.
Sector-specific vulnerability factors. Respondents were asked to rate the importance of various vulnerability factors for drought risk in their primary sector, using a 5-point scale (0 = no impact to 4 = high impact).
- III.
Societal vulnerability factors. Respondents rated the importance of vulnerability factors for drought risk across Swedish society, again using the 5-point rating scale.
For a more detailed description of the survey, we refer the reader to Stenfors et al. (2025) and the Supplement (Sect. S1.1).
The survey was sent to 561 recipients in spring 2023, including governmental or local authorities (354 recipients); private, municipal, or state-owned enterprises (81); academia or research institutes (46); national or regional trade associations (45); and NGOs (35). Receiving 108 responses in total, the response rate was 19.3 %. Initial data cleaning identified six respondents answering exclusively “I don't know”, and their responses were excluded from all subsequent analysis. Furthermore, one respondent did not specify a sectoral focus and could therefore not be included in the analysis. A more detailed description of the recipient selection process can be found in the Supplement (Sect. S1.2).
2.2 Data analysis
Survey responses were analyzed in Microsoft Excel and RStudio (Kassambara, 2023; Pedersen, 2025; R Core Team, 2024; van den Brand, 2024; Wickham, 2016; Wickham et al., 2023) using a four-step approach involving data preparation, relevant factor identification, vulnerability factor ranking, and hypothesis testing.
As a first step, based on the primary sector, survey responses were categorized into three groups: blue water dependent, green water dependent, or universal water consumers (i.e., relying on both blue and green water) (Fig. 3). Respondents from the energy, drinking water, and water resource sectors were categorized as primarily blue water dependent. The respondent working in a water-intensive industry was also classified as primarily blue water dependent. Those in the forestry sector were categorized as mainly green water dependent. In the environmental sector, respondents were further divided into three groups: those working with aquatic ecosystems were classified as blue water dependent, while those focused on terrestrial ecosystems were considered green water dependent. The third group, referred to as universal water consumers, included respondents working with both aquatic and terrestrial ecosystems and respondents from the agricultural sector, as their reliance on either blue or green water could not be distinctly categorized.
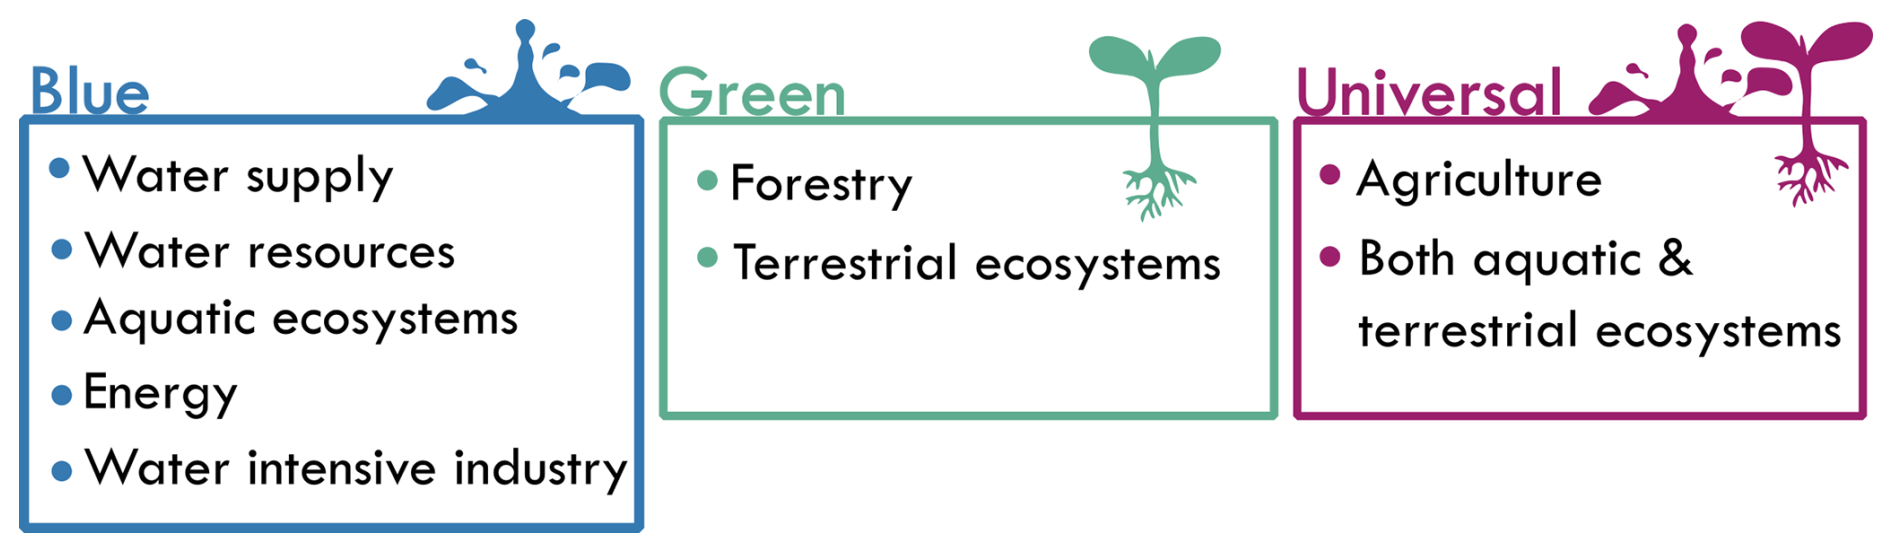
Figure 3The sector or primary focus of respondents included in the three groups, depending on water dependency on blue water sources (blue), green water sources (green), and respondents whose primary focus could be dependent on both blue and green water sources (universal, purple).
Second, relevant vulnerability factors for the three groups were identified following Meza et al. (2019) and Stenfors et al. (2025). A vulnerability factor was considered relevant for the water-dependent groups if 50 % or more of survey respondents rated it as having a medium-high or high impact (i.e., a median score of 3 or higher) on drought risk in their sector. Hence, drought vulnerability factors relevant for blue, green, and universal water consumers were identified by calculating the median rating, grouped by water type consumption (blue, green, or universal water consumption).
After identifying relevant factors, factor impact scores were calculated in the third step. This allowed for the analysis of the relative importance of vulnerability factors depending on water type dependency. The respondent ratings, originally ranging from 0 to 4, were rescaled to a scale of 0–1, with 0.25-step increments. The impact score was then attained by calculating the mean rescaled rating for each factor, grouped by water consumption type. Highly impactful vulnerability factors have impact scores closer to 1, whereas less impactful factors have impact scores close to 0. The calculated impact score is not an indication of whether the factor has a positive or negative impact on drought risk, only that the factor is perceived as impactful.
Lastly, pairwise Wilcoxon rank sum tests with corrections for multiple testing were used for analyzing significant differences in ratings between the three water consumer groups, using pairwise comparisons between the three groups (i.e., blue, green, and universal water consumption).
3.1 Respondent characteristics
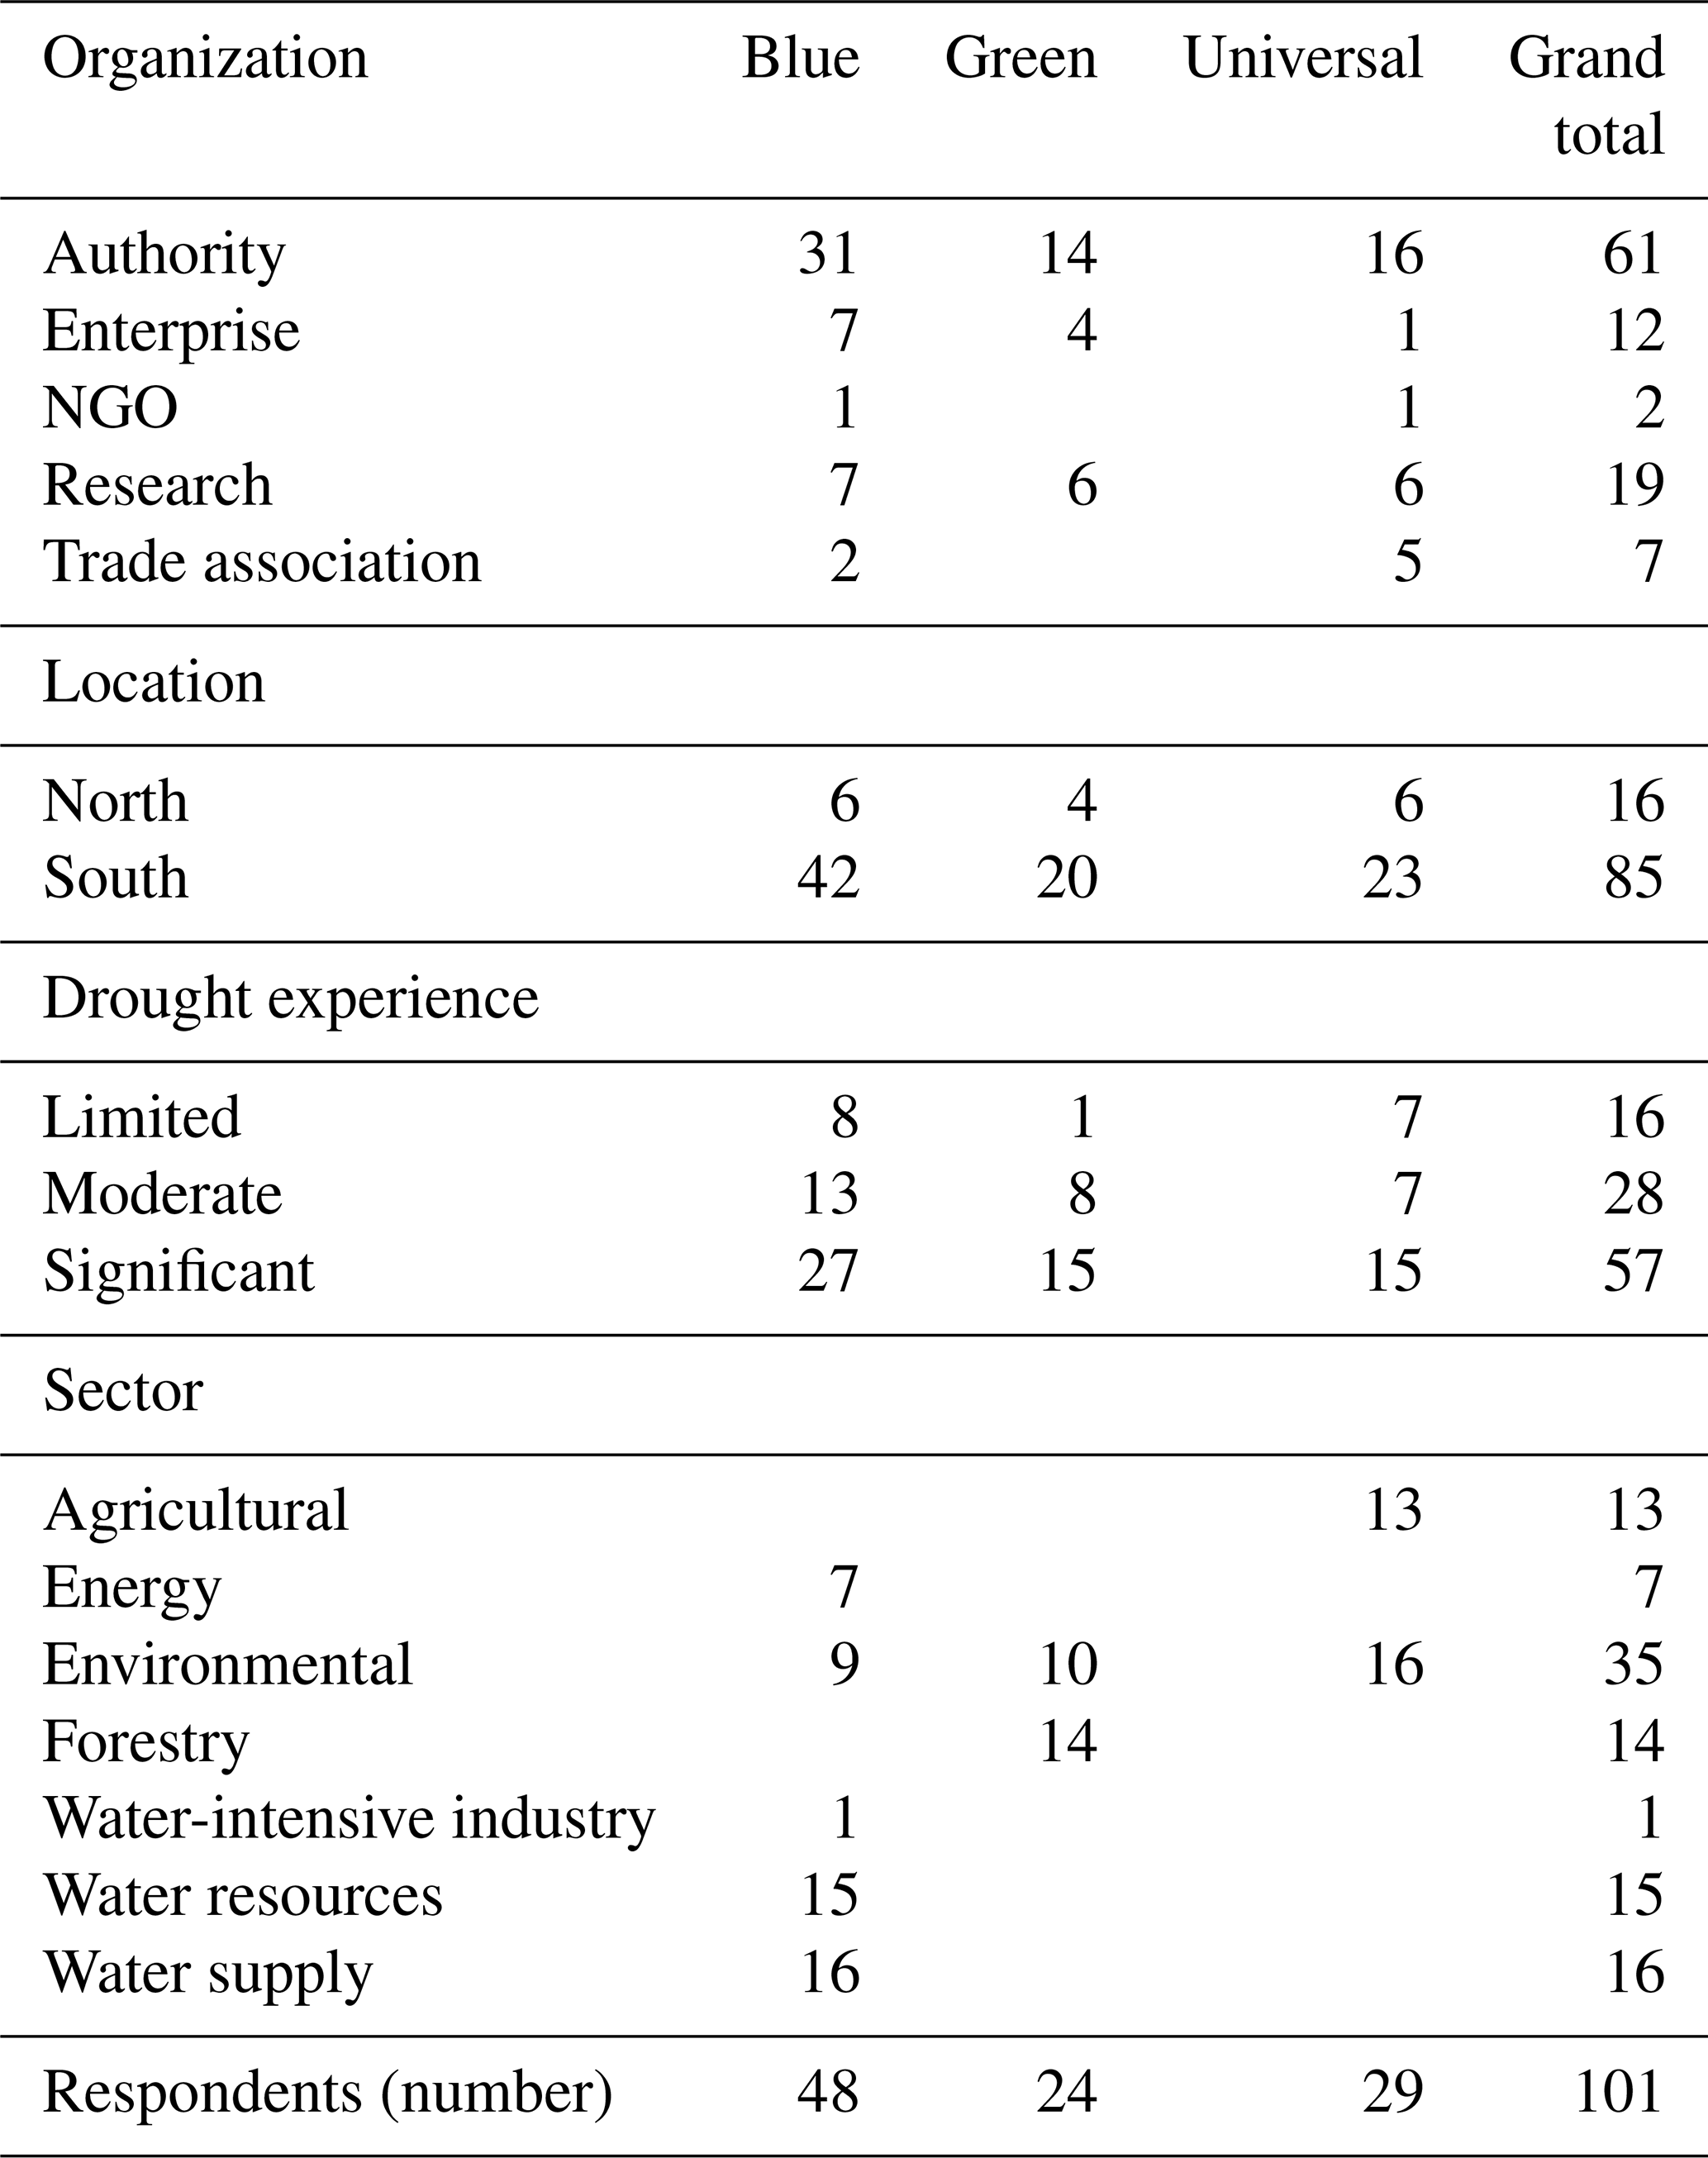
Grouping the respondents based on sectoral water type dependency resulted in three groups, where blue water consumers had the largest number of respondents (48 respondents), followed by universal water consumers (29) and green water consumers (24) (Table 1). In all three groups, the majority of the respondents were working in authorities (60 % across all three groups), followed by respondents working in research (19 % in total) and private, municipal, or authority-owned enterprises (12 %). The blue water consumers, as well as universal consumers, had respondents working for an NGO and trade associations, whereas the universal water consumers had five respondents working for agricultural trade associations. Most respondents were located in southern Sweden (84 %) and indicated that they have significant experience working with drought in their primary sector (56 %). More information on respondents' characteristics is presented in Table S1 in the Supplement.
Table 1Overview of respondents' characteristics, divided by water consumption type (blue, green, universal), place of employment, geographical location in Sweden, their reported experience with drought, and their primary sectoral focus.
3.2 Relevance of vulnerability factors for blue, green, and universal water consumers
In total, 63 vulnerability factors were considered relevant by at least one of the three water consumer groups (Fig. 4a). Universal water consumers, reliant on both blue and green water, found the largest number of factors to be relevant (60 factors), followed by blue water consumers (43) and green water consumers (18). Universal water consumers found vulnerability factors relating to all nine categories relevant for their sector. This can be compared to green water consumers, who found factors relating to only five categories to be relevant. The factors relevant for green water consumers were mainly related to species characteristics, the conditions of the surrounding settings, and available tools and resources. The respondents in this group also found one factor related to policies and one related to anthropogenic stress to be relevant. On the other hand, blue water consumers found at least one factor to be relevant in all factor categories except one. No factors related to species characteristics were considered relevant for blue water consumers. In contrast, blue water consumers found all factors related to policies and plans relevant, as well as the majority of the factors relating to the conditions of the surrounding settings, available water supply, and available tools and resources.
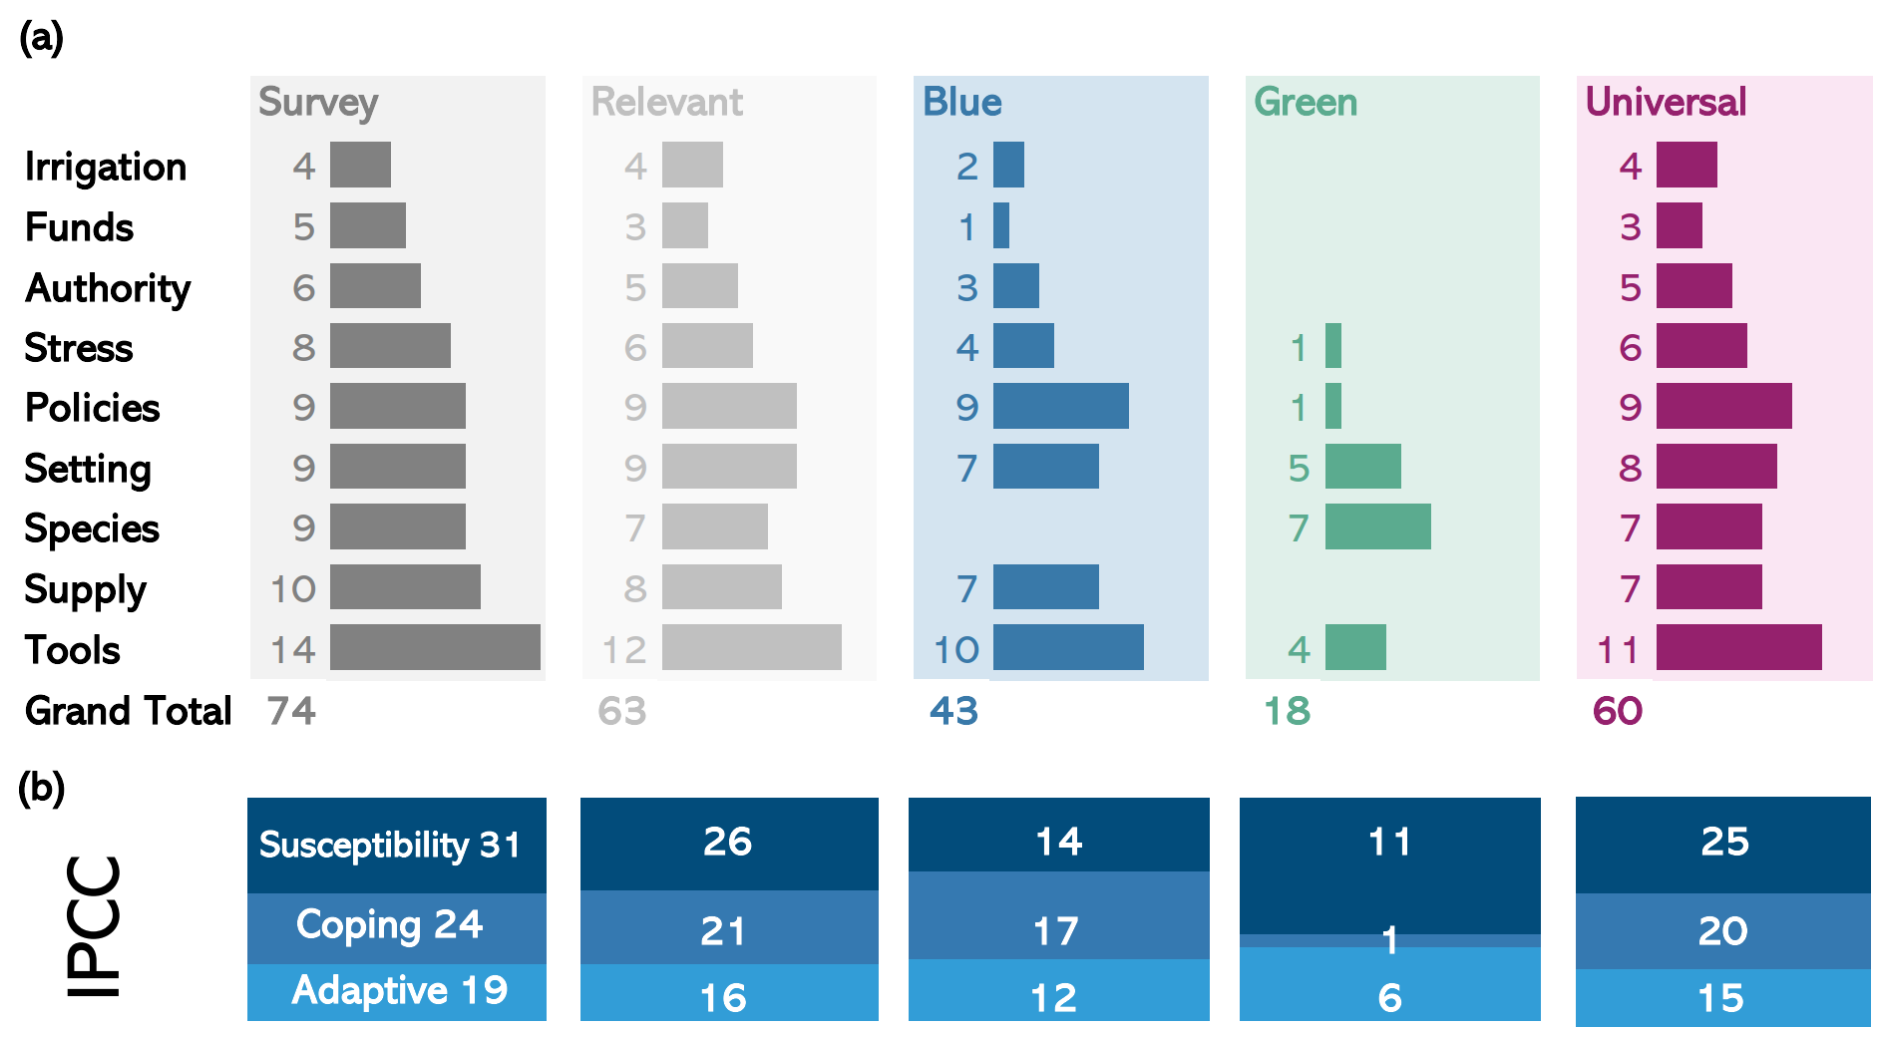
Figure 4(a) Number of vulnerability factors included in the survey for direct water consumers (survey), the number of factors relevant by at least one water consumer group (relevant), and the number of factors identified as relevant for each water consumer group. Each factor is categorized as belonging to one out of nine categories. (b) Ratio and number of factors belonging to adaptive capacity (dark blue), coping capacity (blue), or susceptibility (light blue), out of the total number of factors relevant for all respondents, as well as for blue, green, and universal water consumers, respectively.
Universal water consumers found factors related to all three dimensions of vulnerability to be relevant (Fig. 4b), where the ratio of factors belonging to adaptive capacity, coping capacity, or susceptibility was approximately the same as what was included in the survey. Blue water consumers, whilst also finding factors connected to all three dimensions, found a large share of factors relating to coping capacity as relevant for the group. This can be compared to green water consumers, who only found one factor relating to coping capacity to be relevant, as most relevant factors for green water consumers related to either susceptibility or adaptive capacity.
3.3 Impact scores for vulnerability factors for blue, green, and universal water consumers
The highest impact scores for several factors were given by universal water consumers (Fig. 5). This group gave high impact scores for factors relating to adaptive capacity, coping capacity, and susceptibility; however, the highest impact scores were given to factors connected to susceptibility. Blue and green water consumers also gave factors relating to susceptibility the highest impact scores. Green water consumers, primarily finding factors relating to susceptibility and adaptive capacity relevant, seemed to find factors relating to susceptibility slightly more impactful than factors concerning adaptive capacity, especially the ones relating to species characteristics or the conditions of the surrounding settings. The conditions of the surrounding settings, policies, and available tools and resources were the three categories of factors that included factors found relevant for all three water consumer groups. Examples of factors found relevant for all three consumer groups were the soil water-holding capacity; the presence of wetlands, lakes, and ponds; and the availability of drought risk assessments. In general, blue water consumers gave high impact scores to factors relating to water supply, policies and plans, or the conditions of the surrounding settings. Similarly, universal water consumers gave many of their high impact scores to factors relating to water supply and the conditions of the surrounding settings, followed by anthropogenic stress. Whilst also giving high impact scores to factors concerning the conditions of the surrounding settings, green water consumers also gave factors relating to species characteristics and available tools and resources some of their highest impact scores. Relevant vulnerability factors and their corresponding impact scores for the three consumers groups are available in Table S2.
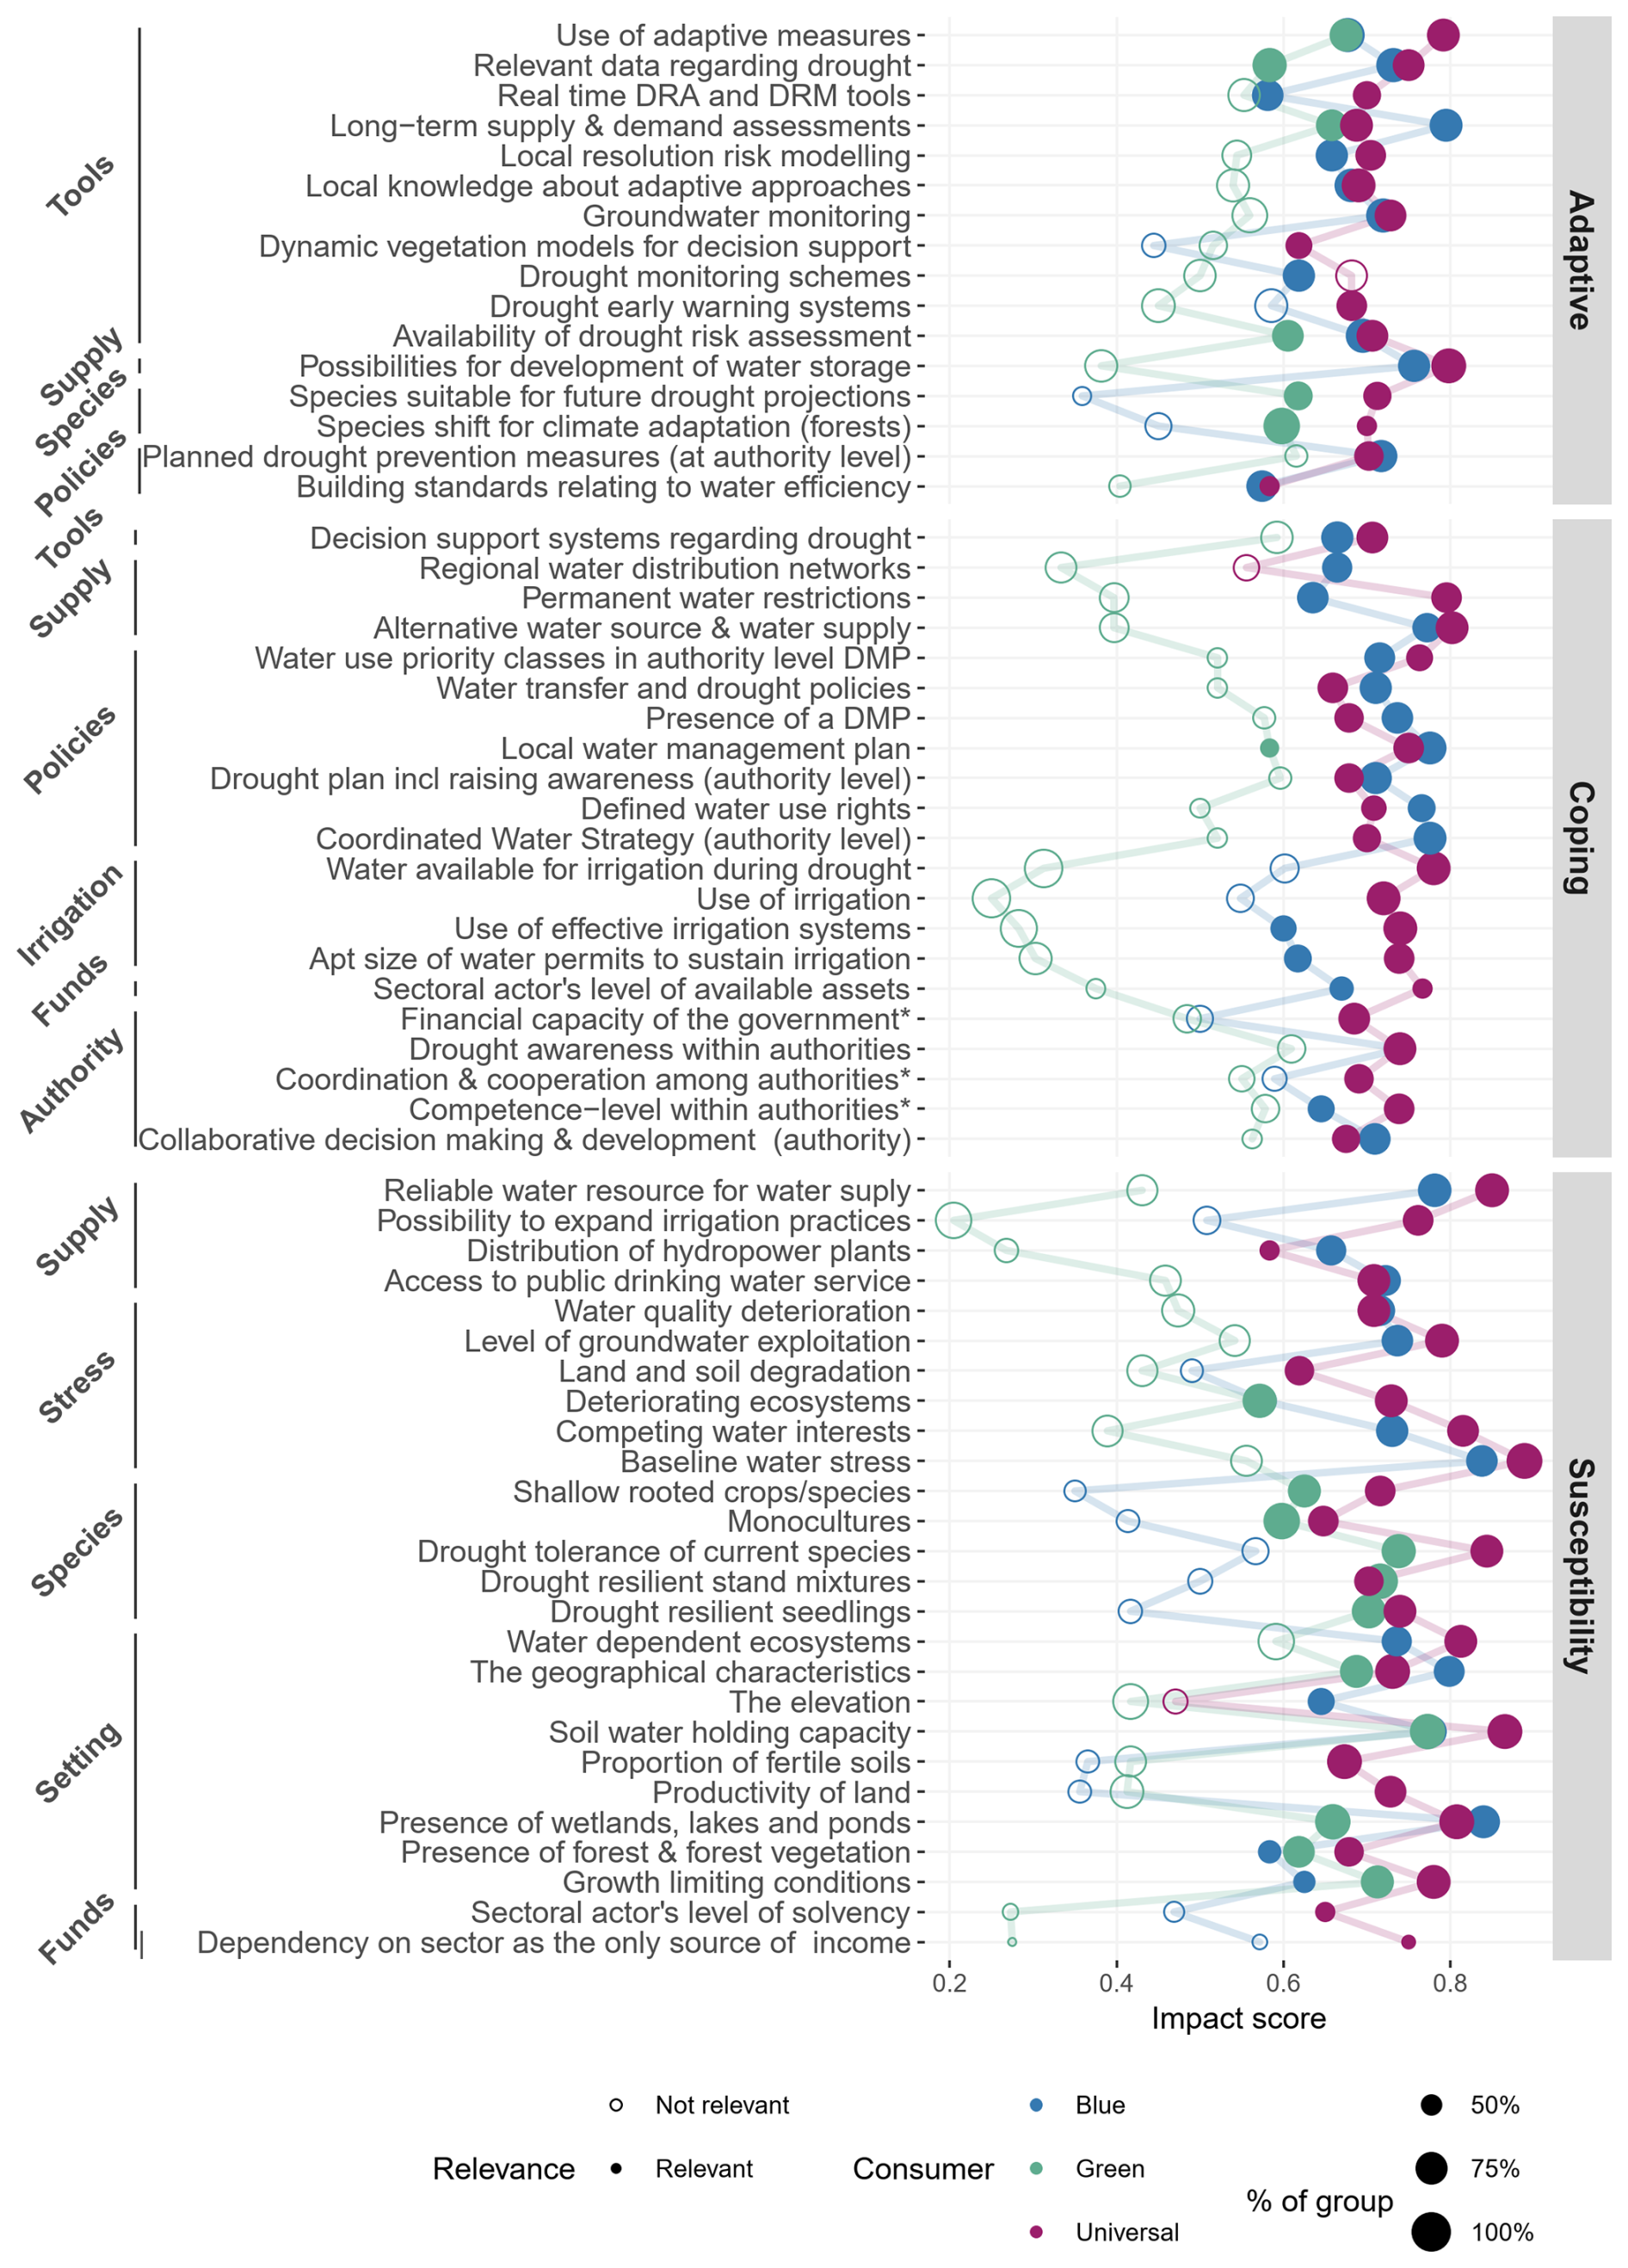
Figure 5Impact scores for vulnerability factors concerning adaptive capacity (adaptive), coping capacity (coping), and susceptibility rated their impact on drought risk in blue, green, and universal water-dependent sectors. Filled dots indicate that the factor is considered relevant for the consumers (i.e., with a median score of 3 or higher), whereas open circles indicate that the factor is not considered relevant. The point size signifies the percentage of respondents within a consumer group that provided an impact rating for the factor.
3.4 Highest-rated vulnerability factors for blue, green, and universal water consumers
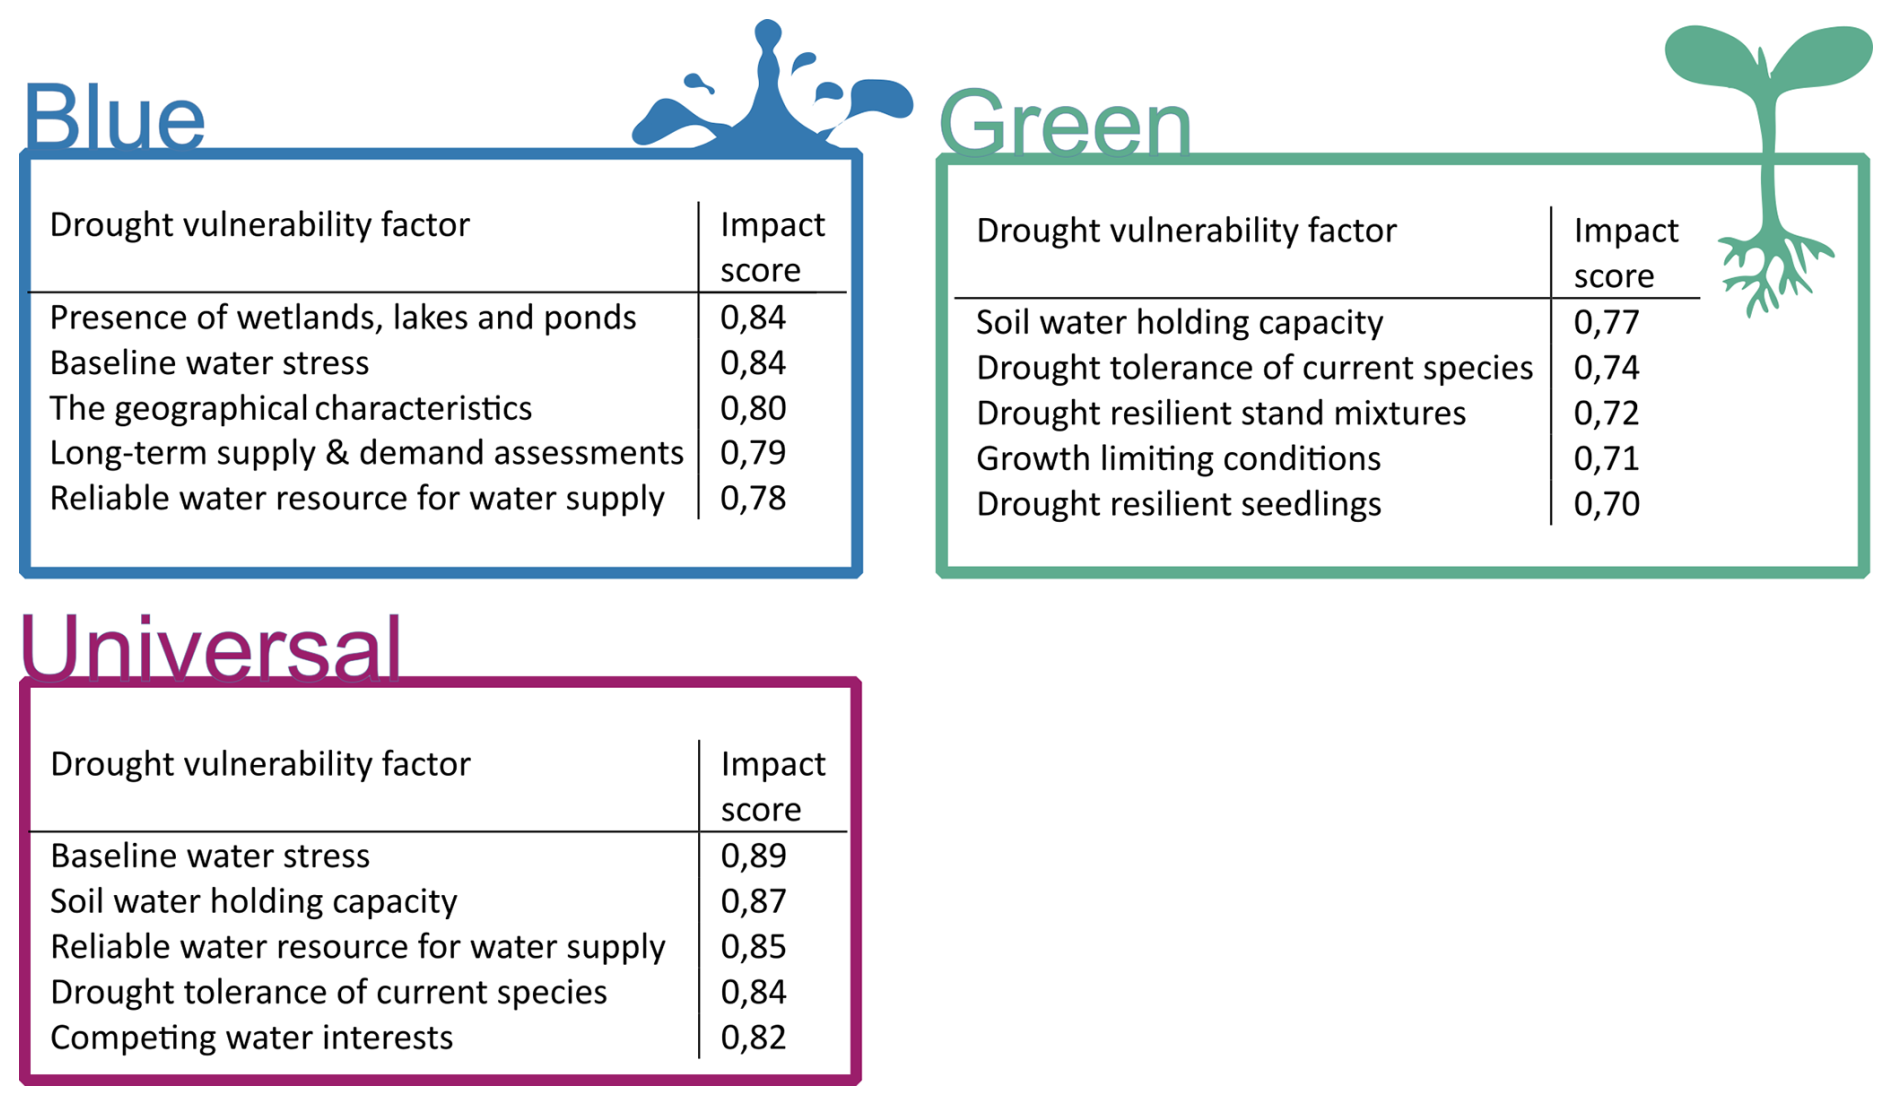
The top highest-rated vulnerability factors for green water consumers was related to species characteristics or the conditions of the surrounding settings (Fig. 6). Their highest-rated factors were soil water-holding capacity, followed by the drought tolerance of current species. For blue water consumers, two of the three highest-rated factors related to the conditions of the surrounding settings, such as the presence of wetlands, lakes, and ponds, and the geographical characteristics of the area. The second-highest-rated factor for blue water consumers was baseline water stress. When comparing the highest-rated vulnerability factors for universal water consumers with the other two groups, it can be seen that universal water consumers shared several factors with either blue or green water consumers. For example, their top-rated factor, baseline water stress, was the second-highest-rated factor for blue water consumers. The second-highest vulnerability factor for universal consumers, the soil water-holding capacity, was the highest-rated factor among green water consumers.
3.5 Differences in impact scores depending on blue, green, and universal water dependency
The three groups of water consumers showed different patterns in their ratings of the nine categories of factors (Fig. 7). For example, blue water consumers showed a relatively large spread in their ratings for factors concerning, for example, the conditions of the surrounding settings and anthropogenic stress. On the other hand, blue water consumers consistently rated factors concerning species characteristics low and policies and plans high. Contrarily, universal consumers tended to rate most factors highly, where the largest spread in ratings was seen for factors relating to water supply and anthropogenic stress. The universal water consumer group included agriculture, which was reflected in the results, as factors relating to irrigation received higher impact scores by the group compared to blue and green water consumers. Green water consumers generally rated most categories of factors lower than the other consumer groups, where the largest spread in impact scores was for factors concerning the conditions of the surrounding settings. The group consistently gave low impact scores for factors concerning water supply, irrigation, and available funds and financial capacity.
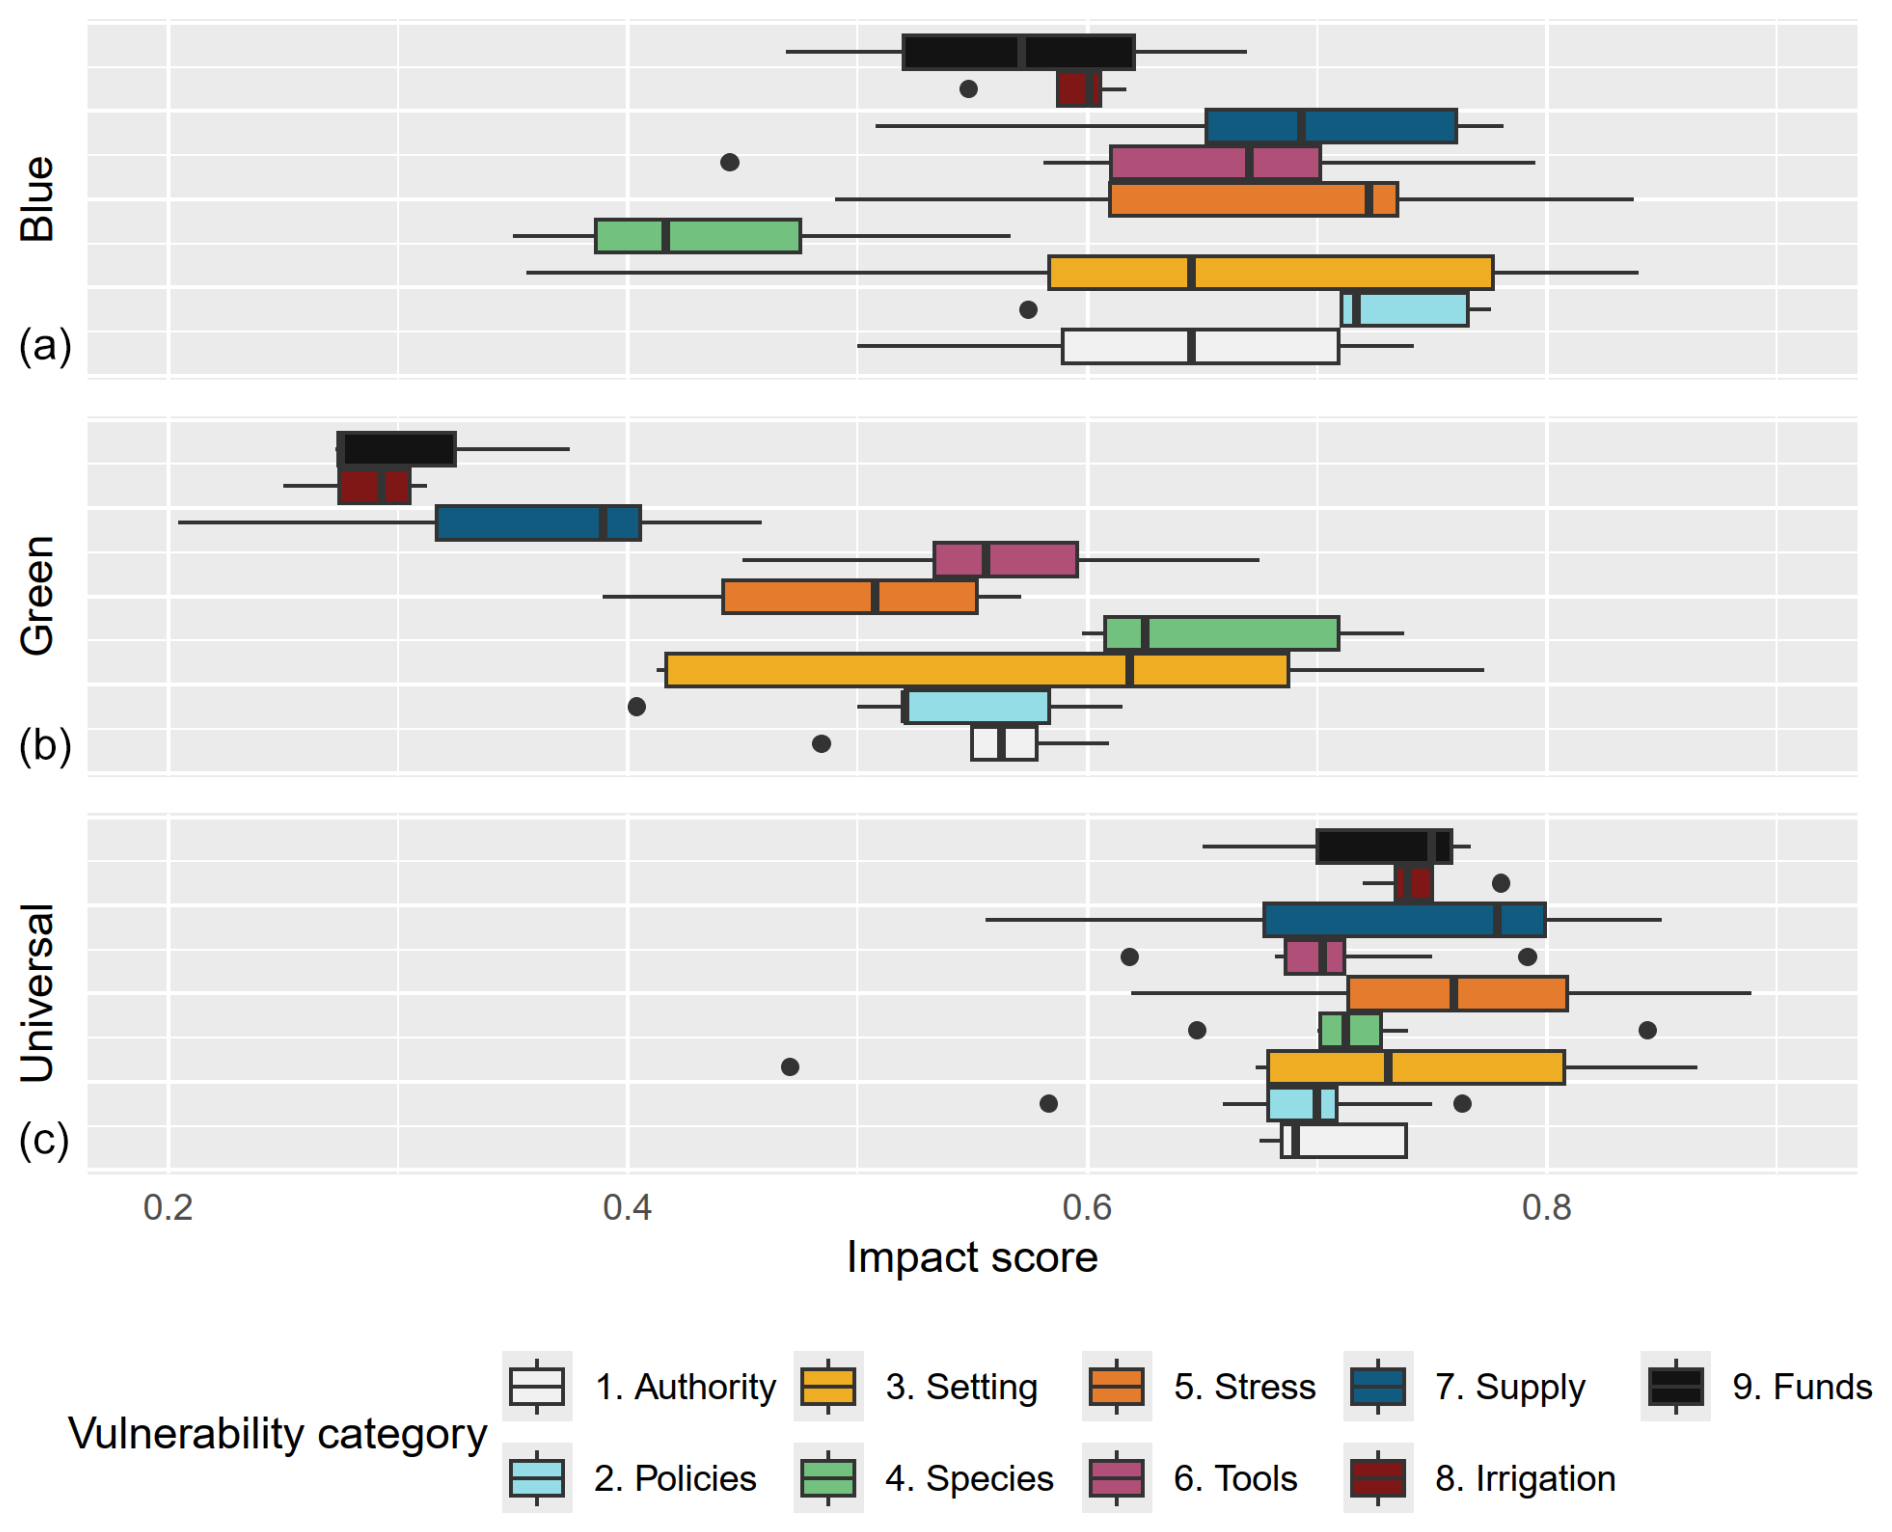
Figure 7Distributions of impact scores for the nine categories of vulnerability factors for blue water consumers (a), green water consumers (b), and universal water consumers (c).
Universal water consumers shared several factors with high impact scores with both blue and green water consumers (Fig. 8). Both blue and universal water consumers highly rated several factors connected to water supply, policies and plans, anthropogenic stress, available tools and resources, and characteristics of authorities. In comparison, green and universal water consumers shared fewer highly rated factors. Green and universal water consumers mainly shared high impact scores for factors relating to species characteristics, the conditions of the surrounding settings, and available tools and resources. Furthermore, the two groups rated a few factors relating to the characteristics of authority and policies and plans highly.
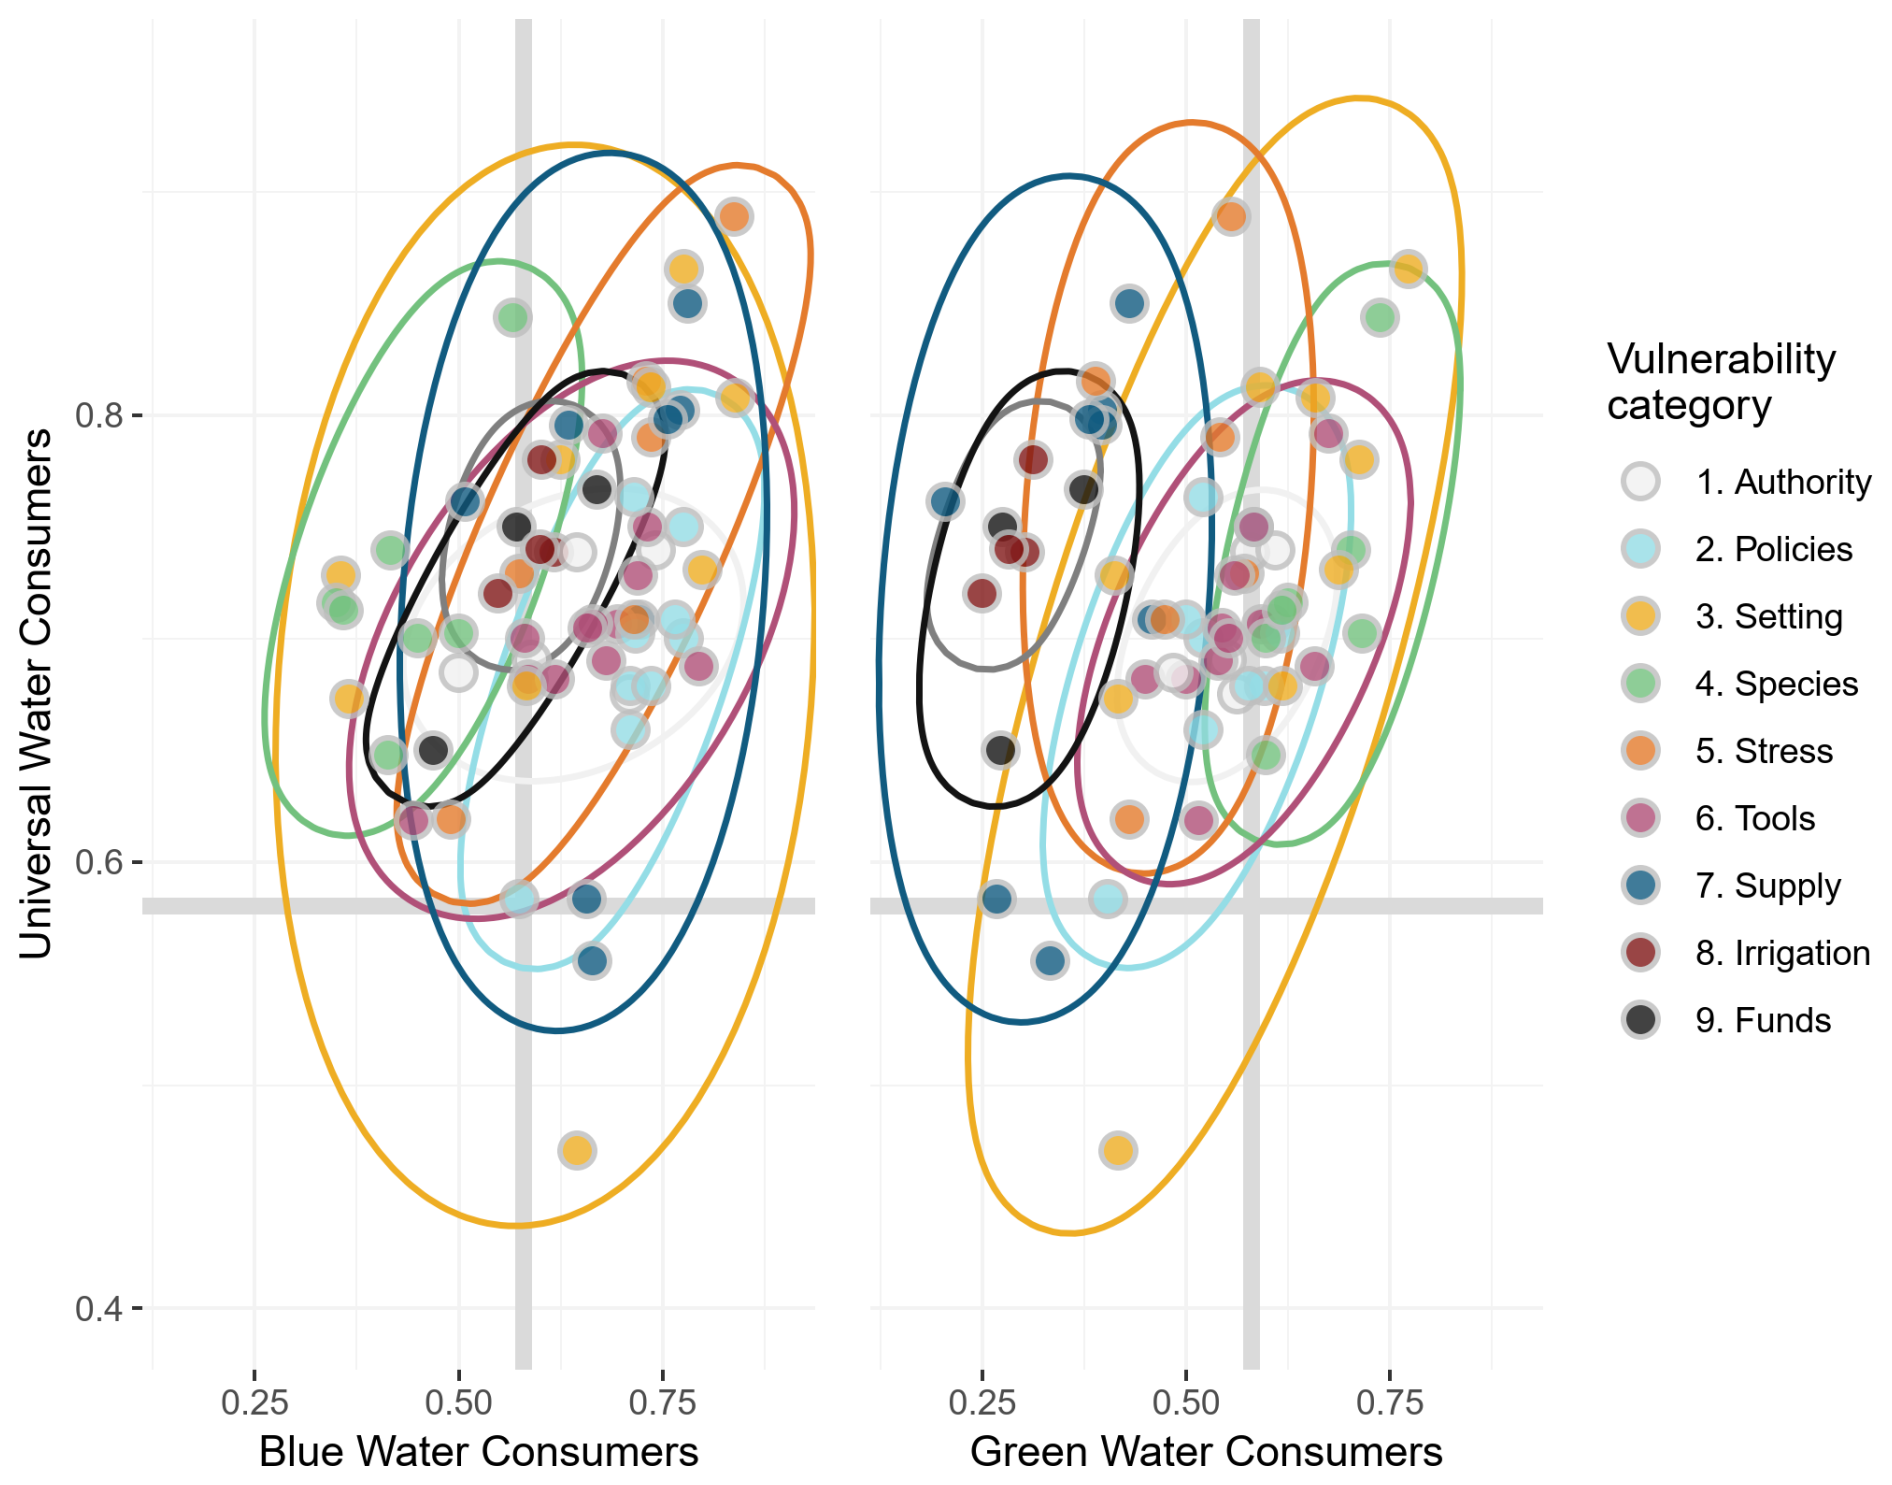
Figure 8Impact scores for 63 drought vulnerability factors rated by universal water consumers (y axis), blue water consumers (x axis, left), and green water consumers (x axis, right). Colors indicate that the factors belong to one out of the nine factor categories. Observe that the x and y axes have been adjusted for better data visualization and do not start at zero. The thicker gray lines mark the threshold above which vulnerability factors have a medium-high to high impact score. This plot, with accompanying text labels for the individual factors, can be found in Figs. S1 and S2 in the Supplement.
In general, blue water consumers rated the majority of factors slightly higher than green water consumers (Fig. 9). However, green water consumers rated factors concerning species characteristics highly, as well as most factors relating to the conditions of surrounding settings. In contrast, all factors concerning water supply received low impact ratings by the group, as well as factors relating to irrigation and available funds. Conversely, blue water consumers rated factors relating to water supply and policies highly, whilst all factors relating to species characteristics received low impact scores. Several factors relating to available tools and the conditions of the surrounding settings received high impact scores from both blue and green water dependent sectors. Looking at the highest-rated factors, common for the two groups, factors were mainly related to available tools, the conditions of the surrounding settings, and policies and plans.
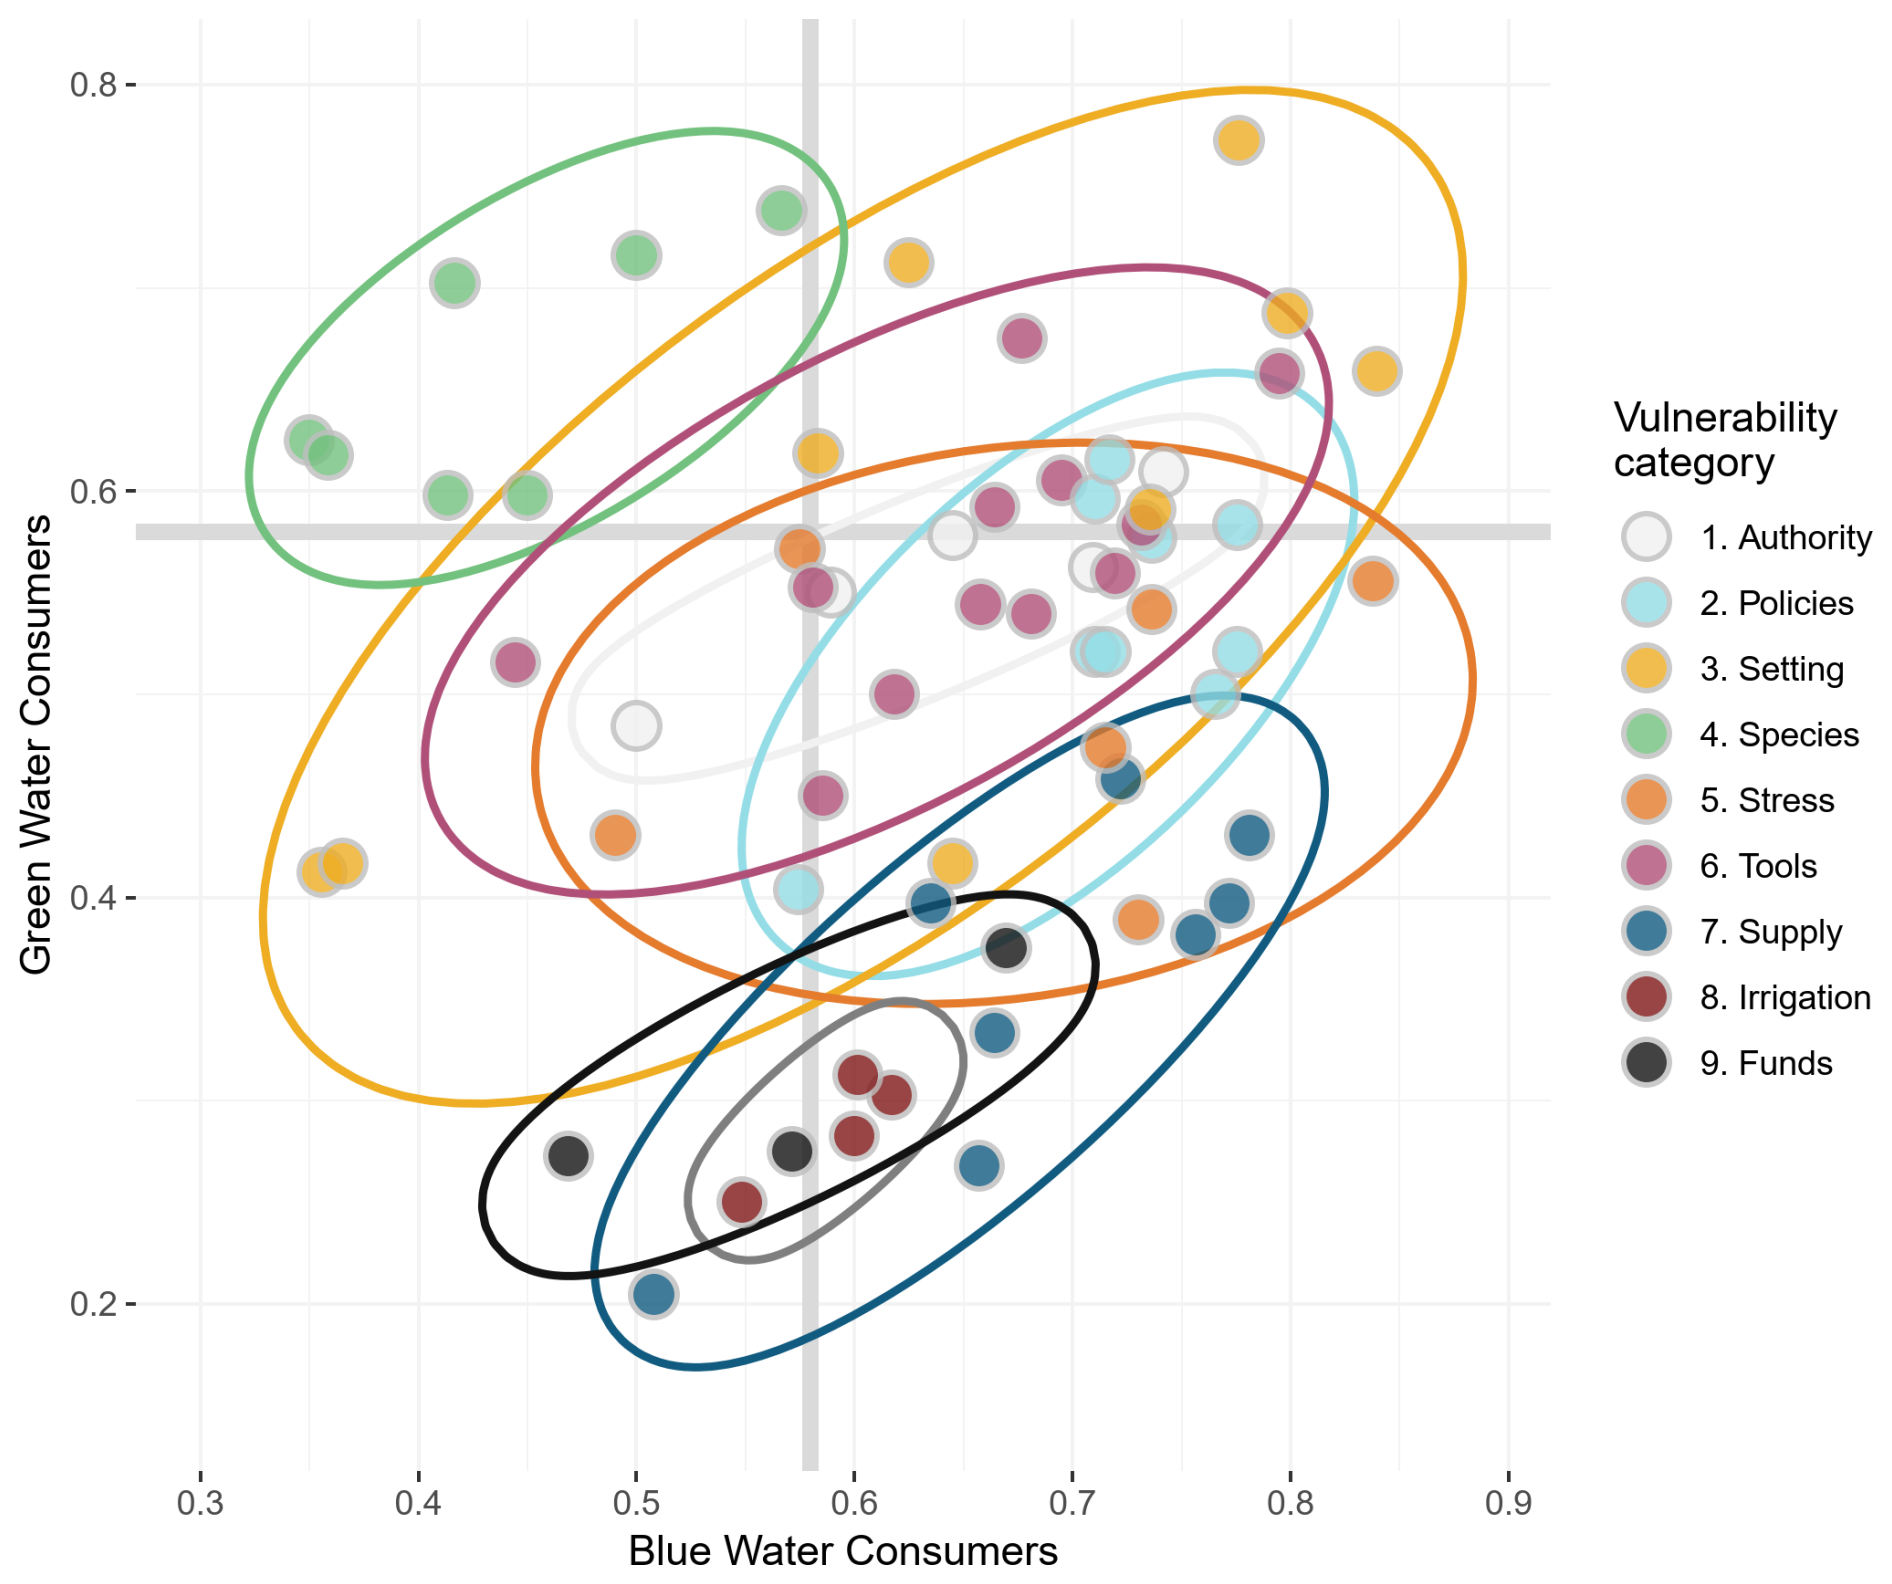
Figure 9Impact scores for 63 drought vulnerability factors rated by blue water consumers (x axis) and green water consumers (y axis). Colors indicate that the factors belong to one out of the nine factor categories. Observe that the x and y axes have been adjusted for better data visualization and do not start at zero. The thicker gray lines mark the threshold above which vulnerability factors have a medium-high to high impact score. This plot, with accompanying text labels for the individual factors, can be found in Fig. S3.
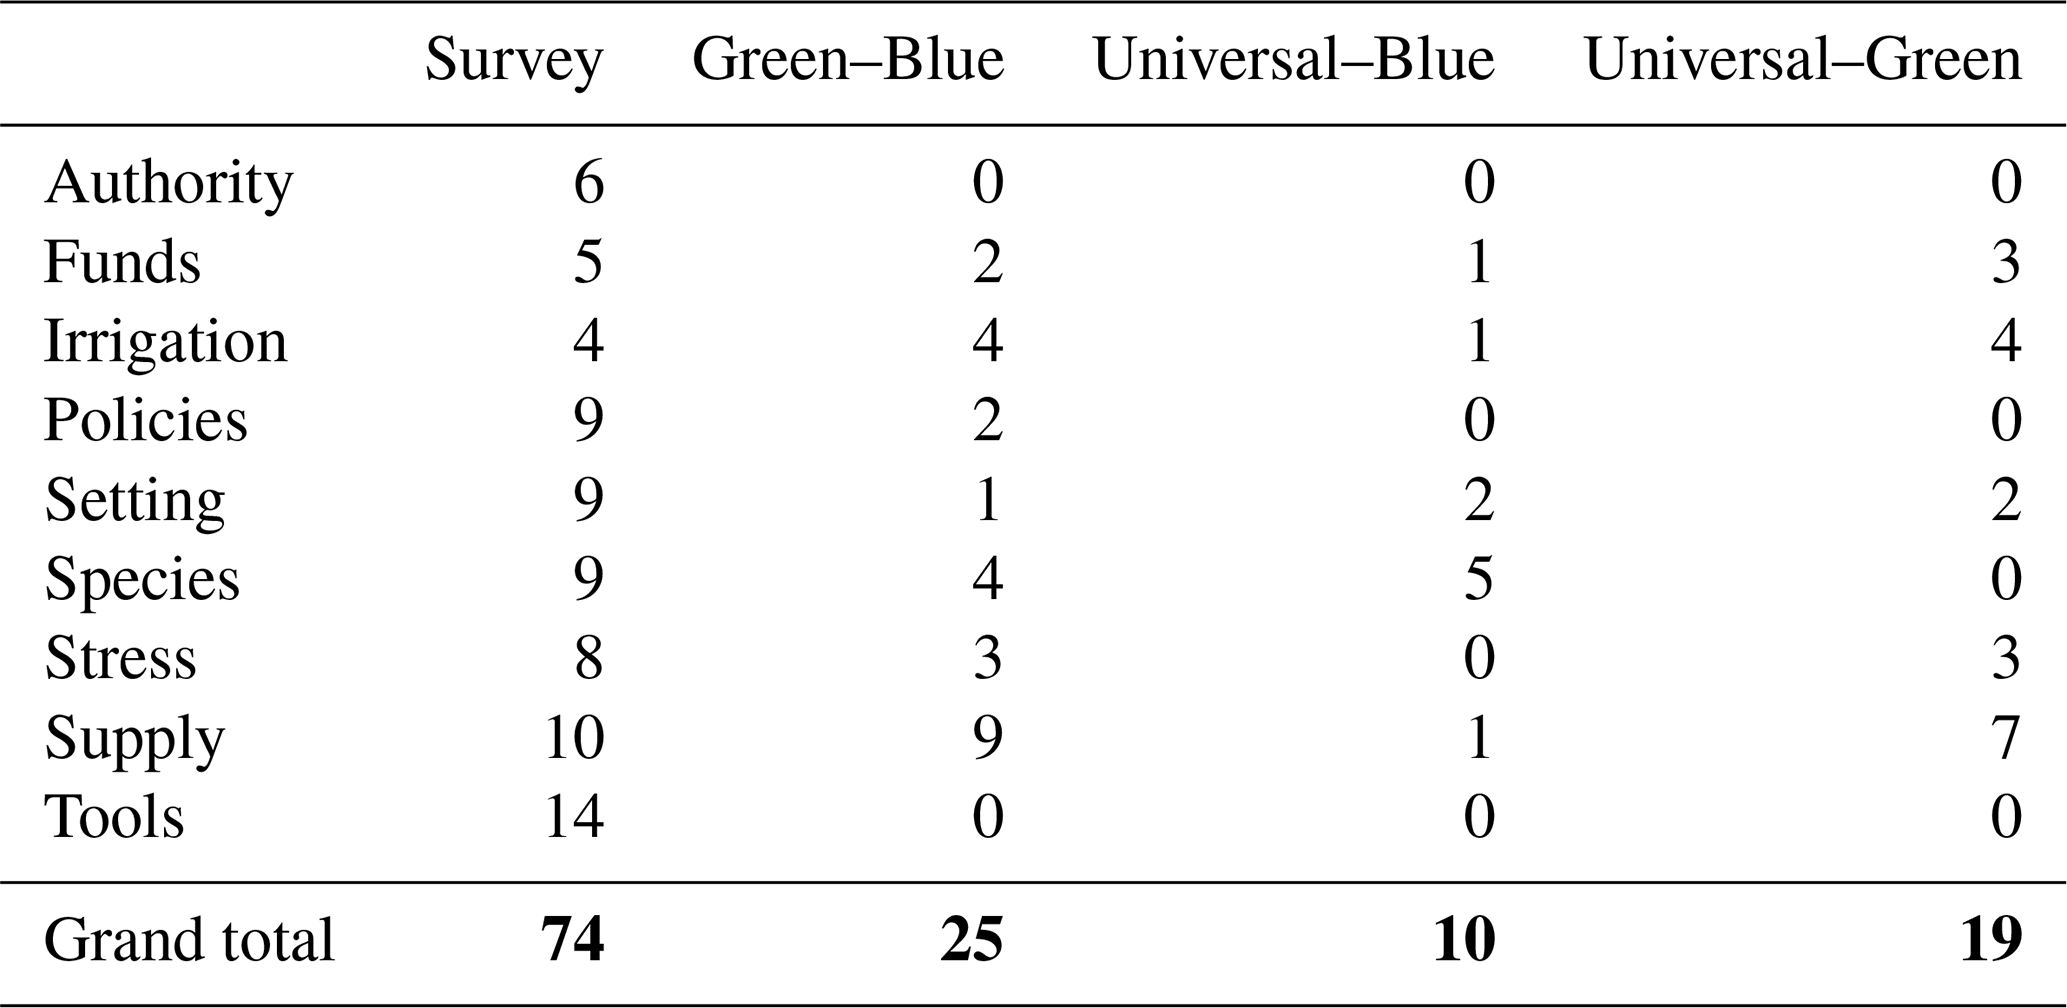
When comparing ratings between blue and green water consumers, significant differences were seen for factor ratings for one or more factors in seven out of nine factor categories (Table 2). No significant differences between ratings made by blue and green water consumers were seen for factors relating to authority and tools. However, significant differences were seen for nine out of 10 factors relating to water supply. When comparing factor ratings for blue and universal water consumer groups, significant differences were seen for several factors relating to species characteristics, whereas no significant differences were seen for factor ratings relating to authorities, policies and plans, anthropogenic stress, and available tools and resources. Three factor categories stood out as having significant differences when comparing factor ratings made by green water consumers and universal consumers, namely funds, irrigation, and water supply. For example, significant differences were seen for factor ratings for all four factors relating to irrigation and seven out of 10 factors relating to water supply for these two groups. All factors exhibiting significant differences in rating between the consumer groups and their corresponding p values are presented in Table S3.
Table 2Number of factors per factor category with significant differences in ratings between respondents from the three water consumer groups, together with the number of factors included in each of the nine categories. Significant differences identified using pairwise Wilcoxon rank sum tests are shown for the water consumer pairs; green and blue water consumers (Green–Blue), blue and universal water consumers (Universal–Blue), and green and universal water consumers (Universal–Green).
Our study explored the role of water dependency for drought vulnerability in a socio-hydrological system. Proactive drought risk management requires an integrated analysis of drought hazard, exposure, and vulnerability. Using stakeholder perceptions to analyze drought vulnerability across sectors, categorized by their dependency on blue and/or green water sources, provided a unique opportunity to deepen our understanding of drought vulnerability with respect to drought type and water dependency. This approach also enhances the quality of future drought risk assessments. We found notable differences in the perceived relevance, impact scores, and overall ratings of various drought vulnerability factors among blue, green, and universal water consumers.
Universal water consumers found the largest number of relevant factors. This outcome aligns with the distinction between blue and green water dependency, as universal consumers are likely to consider factors related to both types of water sources as relevant. In fact, all factors that were considered to be relevant by either blue or green water consumers were also relevant for universal consumers, with the exception of three vulnerability factors that were only considered relevant by blue water consumers. Notably, blue water consumers identified more than twice as many relevant factors as green water consumers, many of which concern water supply or the availability of tools and resources for managing drought and water availability. This could potentially be due to many factors found in the literature review being more geared toward the vulnerability of blue water consumers. In fact, in the survey, 17 factors were directly related to blue water, its governance, related policies, or monitoring tools, while only 12 factors were related to species characteristics, forest management practices, or vegetation modeling. Although this unequal focus in the survey might partially contribute to the difference in the total number of relevant factors between the two groups, it cannot fully explain the wide gap and indicates that there are indeed underlying differences in how drought vulnerability is perceived between blue and green water consumers.
Our results highlight the fact that blue and universal water consumers found several factors related to policies and plans – such as having authority-level drought management plans, local water management plans, and planned drought-prevention measures – as relevant for drought risk. Furthermore, the two groups found the existence of water use priority classes and defined water use rights to be relevant. This indicates the importance of incorporating drought and water management plans as tools for increasing adaptive and coping capacity for blue water consumers in socio-hydrological systems, as has been described and promoted in literature and international declarations (Sivakumar et al., 2014; UNDRR, 2021; Wilhite et al., 2014). However, further research is needed to better understand the role of drought management plans for green water consumers, as only one vulnerability factor connected to policies and plans was deemed relevant for the group, namely the presence of a local water management plan. Notably, less than half of the respondents in this group provided a rating for this factor. Other policy-related factors, such as the existence of an authority-level drought management plan or planned drought-prevention measures at the authority level, were not considered relevant by green water consumers. The reasons for this lack of relevance are unclear and warrant further investigation to better understand how drought-related policies can be adapted to be more applicable to green water consumers. Nevertheless, this may imply that there is a gap between policy tools and this consumer group, which needs to be better analyzed for improved policy support for green water consumers.
Instead, green water consumers found seven out of nine factors relating to species characteristics to be relevant. This category included factors such as drought tolerance of species and root depths, which considerably influence the effects of green water deficits. Only green and universal water consumers considered this category relevant, likely due to the minimal impact these factors have on blue water consumers, such as energy production and water supply during a hydrological drought, apart from the competing water needs arising from potentially irrigating the species. Factors such as competing water needs and other factors concerning anthropogenic stress on water resources were instead considered relevant for blue and universal water consumers.
Both species characteristics and anthropogenic stress are categories of factors relating to susceptibility. Whilst the three water consumer groups considered different factors concerning susceptibility to be relevant, this dimension of vulnerability was generally relevant for all three groups. The same can be said for adaptive capacity, where all three consumer groups found several relevant factors. Factors relating to coping capacity saw varying relevance among the consumer groups, where the largest number of relevant factors for blue water consumers belong to this dimension. In contrast, green water consumers found only one factor relating to coping capacity to be relevant, which might indicate that this group has limited tools for coping with drought events. As a result, they may place greater emphasis on anticipatory approaches that focus on increasing adaptive capacity and decreasing susceptibility. However, this could also be a result of the specific vulnerability factors that were categorized as coping capacity in the survey, as many focused on financial capacity, policies, and characteristics of governance, rather than reactionary management measures that can be employed in the case of drought. For example, measures for mitigating drought effects on forests, such as thinning, can be both anticipatory and reactionary. In the survey, such factors were not included as standalone factors but were incorporated in the factor “Use of adaptive measures”. Similarly, specific management measures for forestry and agriculture were subject to the same aggregation.
In total, 10 vulnerability factors were considered relevant for all three water consumer groups. The factors primarily related to two categories of vulnerability, i.e., the conditions of the surrounding settings and the available tools and resources. The list includes factors such as the availability of a drought risk assessment and having access to relevant data on drought, as well as aspects such as the soil water-holding capacity and the presence of wetlands, lakes, and ponds. Hence, these factors could potentially be viewed as universal vulnerability factors, relevant regardless of water type dependency or drought type exposure, suggesting that certain baseline conditions and resources are critical for managing drought risks, irrespective of the specific type of water dependency or drought exposure. This universality implies that these factors are foundational to overall resilience against drought, serving as key elements that all sectors should address to reduce vulnerability. This further supports the argument for cross-sectoral collaboration in drought preparedness and response strategies (e.g., Bretan and Engle, 2017; Medel et al., 2020), ensuring that all sectors can benefit from shared tools and data.
Across all three water consumer groups, the factors with the highest impact scores primarily concerned susceptibility, suggesting that minimizing susceptibility is a main priority for all water consumer groups. For example, the high impact scores for soil water-holding capacity from all consumer groups indicates the importance of this factor for assessing drought vulnerability. This supports recent drought vulnerability studies, where the factor has been used in connection with drought vulnerability in sectors such as agriculture (Stephan et al., 2023) or vulnerability assessments at the basin (Thomas et al., 2022) or national scale (Beyene et al., 2025). The factor is also incorporated in the drought vulnerability index (DVI) used by Pandey et al. (2010), together with factors relating to baseline water stress, such as groundwater and surface water availability and water demand. In our study, baseline water stress received some of the highest impact scores from blue and universal consumers.
It is worth noting that some factors connected to irrigation, such as the amount of water available for irrigation and the use of effective irrigation systems, received higher impact scores from blue water consumers compared to green water consumers. While the exact reason for this is unknown, we can speculate that irrigation can put additional pressure on water resources, leading to competing water interests among blue water consumers. Such competition can exacerbate water stress during drought events in areas where total consumption needs exceed water supply (Famiglietti, 2014; Rossi et al., 2023). For example, in their drought vulnerability analysis for Finland, Ahopelto et al. (2019) found that some areas in southern Finland would have difficulties in supplying water for the calculated consumptive water needs during a simulated severe drought. Universal water consumers also found factors concerning irrigation as impactful. This may partly result from the inclusion of respondents from the agricultural sector, as Stenfors et al. (2025) noted that this sector rated such factors particularly high.
Significant differences in the ratings of vulnerability factors based on water dependency were apparent for factors relating to species characteristics, irrigation, and water availability and supply. This implies that different water-consuming sectors exhibit different vulnerabilities. Green water consumers tend to focus primarily on vulnerability factors that affect or are affected by soil moisture deficits, such as drought-tolerant species and soil water-holding capacity. Meanwhile, blue water consumers are more concerned with aspects related to the availability, regulation, and use of blue water resources, including the reliability of water resources for water supply, authority-level water strategies, and the presence of water stress. Consequently, as anticipated, blue water consumers mainly focus on vulnerability to blue water deficits and green water consumers on vulnerability to green water deficits. These distinctions have implications for drought risk assessments, underscoring the need to consider the specific type of drought hazard when designing drought vulnerability and risk assessments. Notably, Hagenlocher et al. (2019) found that 60 % of the risk assessments included in their literature review did not specify the drought hazard type used in the assessment. Based on our findings, failing to define the drought hazard type could compromise the quality of the risk assessment, as the use of unsuited vulnerability factors may cause an under- or overestimation of drought risk, depending on the exposed entities involved. Building on the results found by Stenfors et al. (2025), future vulnerability and risk assessments should be designed with caution to ensure that the selected vulnerability factors accurately reflect both the sectors included in the analysis and their specific water dependencies. This consideration will be particularly crucial for holistic approaches that incorporate multiple socio-hydrological sectors in their analysis, each of which may be vulnerable to different drought types, as well as anthropogenic pressures.
However, it is important to acknowledge certain limitations in our study. For instance, respondents from the agricultural sector could not be distinguished from those engaged in rain-fed versus irrigated agriculture, which limits insight into potential differences in agricultural drought vulnerability based on water dependency. Furthermore, with only one response from water-intensive industries, their input on drought vulnerability among blue water consumers was minimal. Despite this, the blue-water-consuming group included respondents from various sectors – working with energy, water resources management, aquatic ecosystems, and drinking water supply – providing a broad perspective on drought vulnerability. Finally, our analysis was based on the perceived impact of vulnerability factors on drought risk in respondents' individual sectors. The survey did not collect data on whether impacts are perceived as positive or negative, a gap that future research should address to further investigate the factors for future vulnerability assessments.
Using survey data on drought vulnerability in seven water-dependent sectors, differences in drought vulnerability in relation to water dependency could be explored. The results showed that drought vulnerability differs depending on water type dependency, especially for vulnerability relating to water supply and species characteristics. Differences in the perception of vulnerability factors between the groups were seen, regarding both the number of relevant vulnerability factors and the category of factors found to be relevant. Furthermore, differences in the impact scores given to vulnerability factors depending on water type dependency were seen. The results reaffirm the division suggested by Stenfors et al. (2024), where the drought vulnerability of direct water consumers depends on the water type dependency of the exposed consumer. The results also highlighted factors that seem to be generally impactful for all consumer groups, offering insights into potential universal vulnerability factors, relevant for all water type dependency. The impact of policies and plans on drought vulnerability of blue and universal water consumers confirms their importance for tackling drought risk in socio-hydrological systems. However, further research is needed to better understand their impact on green water consumers.
Drought risk is expected to increase in many areas, and drought risk assessments are important tools for producing effective drought risk management strategies to minimize the impacts of droughts. Consequently, future drought vulnerability and risk assessments should put emphasis on clearly establishing the framework for the analysis, focusing on careful selection and consideration of vulnerability factors based on the studied drought type, the exposed entities, and their specific drought vulnerabilities to that drought type.
The data used in this study were collected from respondents under a confidentiality agreement. The confidentially agreement assured respondents that data would be anonymized and only be used within the framework of the PhD project conducted by the corresponding author. Hence, with respect to this agreement, data cannot be publicly shared. However, an overview of the survey design and recipient selection procedures are available as the Supplement. Please contact the corresponding author for any questions regarding the data.
The supplement related to this article is available online at https://doi.org/10.5194/nhess-25-3381-2025-supplement.
ES was the lead in conceptualization, data collection and curation, formal analysis, validation, visualization, and writing. She was supported by MB and TG in visualization, methodology development, and writing. CT was the lead in funding acquisition and supervision and supported the corresponding author in all project parts, from conceptualization to writing.
The contact author has declared that none of the authors has any competing interests.
Publisher's note: Copernicus Publications remains neutral with regard to jurisdictional claims made in the text, published maps, institutional affiliations, or any other geographical representation in this paper. While Copernicus Publications makes every effort to include appropriate place names, the final responsibility lies with the authors.
This article is part of the special issue “Drought, society, and ecosystems (NHESS/BG/GC/HESS inter-journal SI)”. It is not associated with a conference.
This research has been supported by the Svenska Forskningsrådet Formas (grant nos. 2015-01123 and 2023-00515) and the Royal Swedish Academy of Sciences (grant no. LN2016-0101).
The publication of this article was funded by the Swedish Research Council, Forte, Formas, and Vinnova. This work was supported by the Interdisciplinary Grant from the Centre of Natural Hazards and Disaster Science (CNDS), which provided funding for access to an online survey platform and training in survey analysis.
This paper was edited by Khalid Hassaballah and reviewed by Mirela-Adriana Anghelache and Jürgen Mey.
Adger, W. N.: Vulnerability, Global Environ. Chang., 16, 268–281, https://doi.org/10.1016/j.gloenvcha.2006.02.006, 2006.
Ahopelto, L., Veijalainen, N., Guillaume, J. H. A., Keskinen, M., Marttunen, M., and Varis, O.: Can there be water scarcity with abundance of water? Analyzing water stress during a severe drought in Finland, Sustainability, 11, 1548, https://doi.org/10.3390/su11061548, 2019.
Beck, H. E., Zimmermann, N. E., McVicar, T. R., Vergopolan, N., Berg, A., and Wood, E. F.: Present and future Köppen-Geiger climate classification maps at 1-km resolution, Sci, Data, 5, 180214, https://doi.org/10.1038/sdata.2018.214, 2018.
Beyene, T. K., Agarwal, A., Jain, M. K., and Yadav, B. K.: Hydrological drought vulnerability assessment in Ethiopia using multi-criteria decision-making, AQUA – Water Infrastructure, Ecosystems and Society, 74, 36–53, https://doi.org/10.2166/aqua.2024.146, 2025.
Blauhut, V., Stahl, K., Stagge, J. H., Tallaksen, L. M., De Stefano, L., and Vogt, J.: Estimating drought risk across Europe from reported drought impacts, drought indices, and vulnerability factors, Hydrol. Earth Syst. Sci., 20, 2779–2800,https://doi.org/10.5194/hess-20-2779-2016, 2016.
Bretan, E. and Engle, N. L.: Drought Preparedness Policies and Climate Change Adaptation and Resilience Measures in Brazil: An Institutional Change Assessment, in: Evaluating Climate Change Action for Sustainable Development, edited by: Uitto, J. I., Puri, J., and Van Den Berg, R. D., Springer International Publishing, Cham, 305–326, https://doi.org/10.1007/978-3-319-43702-6_17, 2017.
Ciurean, R., Schröter, D., and Glade, T.: Conceptual Frameworks of Vulnerability Assessments for Natural Disasters Reduction, in: Approaches to Disaster Management – Examining the Implications of Hazards, Emergencies and Disasters, edited by: Tiefenbacher, J., InTech, https://doi.org/10.5772/55538, 2013.
Falkenmark, M. and Rockström, J.: The New Blue and Green Water Paradigm: Breaking New Ground for Water Resources Planning and Management, J. Water Res. Plan. Man., 132, 129–132, https://doi.org/10.1061/(ASCE)0733-9496(2006)132:3(129), 2006.
Famiglietti, J. S.: The global groundwater crisis, Nat. Clim. Change, 4, 945–948, https://doi.org/10.1038/nclimate2425, 2014.
Faranda, D., Pascale, S., and Bulut, B.: Persistent anticyclonic conditions and climate change exacerbated the exceptional 2022 European-Mediterranean drought, Environ. Res. Lett., 18, 034030, https://doi.org/10.1088/1748-9326/acbc37, 2023.
Füssel, H.-M.: Vulnerability: A generally applicable conceptual framework for climate change research, Global Environ. Chang., 17, 155–167, https://doi.org/10.1016/j.gloenvcha.2006.05.002, 2007.
Hagenlocher, M., Meza, I., Anderson, C. C., Min, A., Renaud, F. G., Walz, Y., Siebert, S., and Sebesvari, Z.: Drought vulnerability and risk assessments: state of the art, persistent gaps, and research agenda, Environ. Res. Lett., 14, 083002, https://doi.org/10.1088/1748-9326/ab225d, 2019.
IPCC: Climate change 2007: impacts, adaptation and vulnerability: contribution of Working Group II to the fourth assessment report of the Intergovernmental Panel on Climate Change, edited by: Parry, M. L., Cambridge University Press, Cambridge, U.K., New York, 976 pp., ISBN 9780521705974, 2007.
IPCC: Climate Change 2022: Impacts, Adaptation, and Vulnerability. Contribution of Working Group II to the Sixth Assessment Report of the Intergovernmental Panel on Climate Change, 1st Edn., Cambridge University Press, https://doi.org/10.1017/9781009325844, 2023.
IPCC, Field, C. B., Barros, V. R., Dokken, D. J., Mach, K. J., Mastrandrea, M. D., Bilir, T. E., Chatterjee, M., Ebi, K. L., Estrada, Y. O., Genova, R. C., Girma, B., Kissel, E. S., Levy, A. N., MacCracken, S., Mastrandrea, P. R., and White, L. L. (Eds.): Climate change 2014: impacts, adaptation, and vulnerability: Part A: Global and Sectoral Aspects: Working Group II contribution to the fifth assessment report of the Intergovernmental Panel on Climate Change, Cambridge University Press, New York, NY, 1132 pp., 2014.
Kassambara A.: rstatix: Pipe-Friendly Framework for Basic Statistical Tests, R package version 0.7.2, CRAN [code], https://doi.org/10.32614/CRAN.package.rstatix, 2023.
Kim, H., Park, J., Yoo, J., and Kim, T.-W.: Assessment of drought hazard, vulnerability, and risk: A case study for administrative districts in South Korea, J. Hydro-Environ. Res., 9, 28–35, https://doi.org/10.1016/j.jher.2013.07.003, 2015.
Medel, K., Kousar, R., and Masood, T.: A collaboration–resilience framework for disaster management supply networks: a case study of the Philippines, Journal of Humanitarian Logistics and Supply Chain Management, 10, 509–553, https://doi.org/10.1108/JHLSCM-09-2019-0066, 2020.
Meza, I., Hagenlocher, M., Naumann, G., Vogt, J., and Frischen, J.: Drought vulnerability indicators for global-scale drought risk assessments: global expert survey results report, Publications Office of the European Union, Luxembourg, https://doi.org/10.2760/73844, Report number EUR 29824 EN, 56 pages, 2019.
Mishra, A. K. and Singh, V. P.: A review of drought concepts, J. Hydrol., 391, 202–216, https://doi.org/10.1016/j.jhydrol.2010.07.012, 2010.
Pandey, R. P., Pandey, A., Galkate, R. V., Byun, H.-R., and Mal, B. C.: Integrating Hydro-Meteorological and Physiographic Factors for Assessment of Vulnerability to Drought, Water Resour. Manage., 24, 4199–4217, https://doi.org/10.1007/s11269-010-9653-5, 2010.
Pedersen, T.: ggforce: Accelerating 'ggplot2', R package version 0.5.0, CRAN [code], https://doi.org/10.32614/CRAN.package.ggforce, 2025.
R Core Team: R: A Language and Environment for Statistical computing, R Foundation for Statistical Computing [code], https://www.R-project.org/, (last access: 10 April 2024).
Rossi, L., Wens, M., De Moel, H., Cotti, D., Sabino Siemons, A., Toreti, A., Maetens, W., Masante, D., Van Loon, A., Hagenlocher, M., Rudari, R., Naumann, G., Meroni, M., Avanzi, F., Isabellon, M., and Barbosa, P.,: European drought risk atlas, Publications Office of the European Union, Luxemburg, 108, JRC135215, https://doi.org/10.2760/608737, 2023.
Sebesvari, Z., Renaud, F. G., Haas, S., Tessler, Z., Hagenlocher, M., Kloos, J., Szabo, S., Tejedor, A., and Kuenzer, C.: A review of vulnerability indicators for deltaic social–ecological systems, Sustain. Sci., 11, 575–590, https://doi.org/10.1007/s11625-016-0366-4, 2016.
Sivakumar, M. V. K., Stefanski, R., Bazza, M., Zelaya, S., Wilhite, D., and Magalhaes, A. R.: High Level meeting on national drought policy: Summary and major outcomes, Weather and Climate Extremes, 3, 126–132, https://doi.org/10.1016/j.wace.2014.03.007, 2014.
Stenfors, E., Blicharska, M., Grabs, T., and Teutschbein, C.: Droughts in forested ecoregions in cold and continental climates: A review of vulnerability concepts and factors in socio-hydrological systems, WIREs Water, 11, e1692, https://doi.org/10.1002/wat2.1692, 2024.
Stenfors, E., Blicharska, M., Grabs, T., and Teutschbein, C.: Multi-sectoral and systemic drought risk in forested cold climates: stakeholder-informed vulnerability factors from Sweden, Hydrol. Earth Syst. Sci., 29, 3809–3832, https://doi.org/10.5194/hess-29-3809-2025, 2025.
Stephan, R., Terzi, S., Erfurt, M., Cocuccioni, S., Stahl, K., and Zebisch, M.: Assessing agriculture's vulnerability to drought in European pre-Alpine regions, Nat. Hazards Earth Syst. Sci., 23, 45–64, https://doi.org/10.5194/nhess-23-45-2023, 2023.
Teutschbein, C., Quesada Montano, B., Todorović, A., and Grabs, T.: Streamflow droughts in Sweden: Spatiotemporal patterns emerging from six decades of observations, Journal of Hydrology: Regional Studies, 42, 101171, https://doi.org/10.1016/j.ejrh.2022.101171, 2022.
Thomas, T., Nayak, P. C., and Ventakesh, B.: Integrated assessment of drought vulnerability for water resources management of Bina basin in Central India, Environ. Monit. Assess., 194, 621, https://doi.org/10.1007/s10661-022-10300-8, 2022.
Turner II, B. L., Kasperson, R. E., Matson, P. A., McCarthy, J. J., Corell, R. W., Christensen, L., Eckley, N., Kasperson, J. X., Luers, A., Martello, M. L., Polsky, C., Pulsipher, A., and Schiller, A.: A framework for vulnerability analysis in sustainability science, P. Natl. Acad. Sci. USA, 100, 8074–8079, https://doi.org/10.1073/pnas.1231335100, 2003.
UNDRR: Sendai Framework for Disaster Risk Reduction 2015–2030, Proceedings of the 3rd United Nations World Conference on DRR, Sendai, Japan., Vol. 1, https://www.undrr.org/publication/sendai-framework-disaster-risk-reduction-2015-2030 (last access: 10 June 2025), 2015.
UNDRR: Global Assessment Report on Disaster Risk Reduction 2019, United Nations, eISBN 978-92-1-004180-5, 2019.
UNDRR: Special report on drought 2021, United Nations Office for Disaster Risk Reduction, Geneva, 173 pp., ISBN 9789212320274, 2021.
van den Brand, T.: ggh4x: Hacks for ’ggplot2’, R package version 0.3.0, CRAN [code], https://CRAN.R-project.org/package=ggh4x (last access: 7 January 2025), 2024.
Van Loon, A. F.: Hydrological drought explained, WIREs Water, 2, 359–392, https://doi.org/10.1002/wat2.1085, 2015.
Wickham, H.: ggplot2: Elegant Graphics for Data Analysis, Springer-Verlag, New York, USA, ISBN 978-3-319-24277-4, 2016.
Wickham, H., François, R., Henry, L., Müller, K., Vaughan D.: dplyr: A Grammar of Data Manipulation, R package version 1.1.4, CRAN [code], https://doi.org/10.32614/CRAN.package.dplyr, 2023.
Wilhite, D. A., Sivakumar, M. V. K., and Pulwarty, R.: Managing drought risk in a changing climate: The role of national drought policy, Weather and Climate Extremes, 3, 4–13, https://doi.org/10.1016/j.wace.2014.01.002, 2014.