the Creative Commons Attribution 4.0 License.
the Creative Commons Attribution 4.0 License.
 | 01 Sep 2025
Historical changes in drought characteristics and their impact on vegetation cover over Madagascar
Herijaona Hani-Roge Hundilida Randriatsara
Eva Holtanova
Karim Rizwan
Hassen Babaousmail
Mirindra Finaritra Tanteliniaina Rabezanahary
Kokou Romaric Posset
Donnata Alupot
Brian Odhiambo Ayugi
Drought has become one of the most devastating natural hazards in recent decades, causing severe vegetation degradation. This study aims to analyze the spatiotemporal characteristics of drought (duration, frequency, severity, intensity) over Madagascar during 1981–2022. In addition, it evaluates the relationship between the Standardized Precipitation Index (SPI) and the Normalized Difference Vegetation Index (NDVI) during 2000–2022, representing the impact of drought on vegetation over the studied area. Drought assessment was conducted on SPI-3, SPI-6, and SPI-12 timescales, accompanied by seasonal and annual analyses, while the NDVI–SPI relationship was examined through the analysis of vegetation changes based on specific selected SPI time periods and the correlation analysis. The findings reveal that drought events have become more consecutive during the most recent past (2017 to 2022) and have intensified over the southern part of the country. Links between drought occurrences and vegetation changes have been confirmed: monthly vegetation losses are severe and noticeable when prominent negative SPI values occur simultaneously across SPI-3, SPI-6, and SPI-12 over a region, and the impact of drought on seasonal and annual vegetation is detected when prominent negative SPI values occur from seasonal and annual SPI analyses over a region. The correlation between the NDVI anomaly and the SPI emphasizes the NDVI–SPI relationship found with statistical significance, especially over southern Madagascar. These findings are crucial for complementing other climatic factors that influence Madagascar's vegetation besides drought.
- Article
(12335 KB) - Full-text XML
-
Supplement
(1330 KB) - BibTeX
- EndNote


Drought has been identified as one of the gravest natural disasters experienced across the planet (Wilhite, 2000; Kalisa et al., 2020). Research has shown that droughts are some of the most damaging natural hazards, deteriorating means of living, including vegetation, due to its significant impacts on diverse sectors (Gouveia et al., 2017; Mbatha and Sifiso, 2018; Kannenberg et al., 2020; Lawal et al., 2021). Droughts are present across various climatic regions, including those with high and low precipitation levels, and are primarily linked to a prolonged decrease in rainfall over a specific period, such as a season or a year (Mishra and Singh, 2010). Drought events can be categorized as meteorological drought, caused by insufficient rainfall during a specific time frame; hydrological drought, linked to inadequate surface and groundwater availability; agricultural drought, resulting from a scarcity of water for plant growth; and socio-economic drought, which pertains to an inadequate supply to meet the demand for various economic commodities, encompassing the aforementioned three types of droughts (Heim, 2002; Udmale et al., 2014). According to the Intergovernmental Panel on Climate Change (IPCC), global droughts are projected to intensify and occur more frequently worldwide due to climate change (IPCC, 2021).
For the case of Madagascar, fewer studies have assessed drought events. Desbureaux and Damania (2018) assessed the impact of drought on inducing deforestation and degradation of biodiversity conservation over the country using the Standardized Precipitation Index (SPI) method. However, the study lacks in-depth analysis of drought characteristics, such as its frequency, duration, intensity, and spatial patterns. Randriamarolaza et al. (2021) studied spatiotemporal drought characteristics in terms of their magnitude and duration using only the Standardised Precipitation Evapotranspiration Index method. Moreover, their study presents some limitations, such as the use of fewer station data, which results in numerous missing values, and the dependency on data quality control and homogenization methods to complement these missing values. All of these factors might, to some extent, lead to uncertainties in the outputs. However, the Intergovernmental Panel on Climate Change's Sixth Assessment Report (IPCC, 2021) reported that a medium level of confidence in drought changes over Madagascar has been projected, mainly attributed to the lack of sufficient evidence. This calls for an urgent need to conduct more in-depth studies over the country to identify the regions most affected by drought in terms of its full characteristics (duration, frequency, severity, and intensity).
Vegetation plays a vital role in natural ecosystems by managing the flow of water, carbon, and energy; offering habitats for various organisms; and ensuring global food and water security (Konduri et al., 2023). Droughts are widely recognized as causing a decrease in the primary and secondary productivity of vegetation and forests, triggering, among other negative influences, the occurrence of tree mortality and the loss of pastures (Smit et al., 2008; Bennett et al., 2015). Southern Madagascar is currently facing severe food insecurity due to a significant drop in rice, maize, and cassava yields, caused by the most severe drought in 4 decades, along with sandstorms and pest invasions (Narvaez and Eberle, 2022). Studies have indicated that during drought, there is an observed rise in deforestation rates over Madagascar as farmers resort to clearing more forests to counter the adverse effects on agricultural productivity (Desbureaux and Damania, 2018). Assessing how Madagascar's vegetation reacts to drought is crucial for understanding the susceptibility of the ecosystem on the island to extreme climatic events. Analyzing the historical patterns of drought and its effects on vegetation can offer valuable insights for planning environmental, natural resource, and developmental strategies, pinpointing vulnerable ecosystems and livelihoods at risk of degradation or loss due to heightened drought conditions in the future. Thus, a comprehensive evaluation of the impact of drought events on natural ecosystems will offer insights into recent changes in vegetation resilience to water scarcity (Chaves et al., 2003; Kannenberg et al., 2020) and the complex interplay between the severity and duration of droughts in relation to their effects on vegetation (Vicente-Serrano et al., 201; Gouveia et al., 2017).
Choosing the right drought index is fundamental for identifying and defining droughts (Yao et al., 2018). The present study employs the Standardized Precipitation Index (SPI) (McKee et al., 1993), not only because it is recommended by the World Meteorological Organization (WMO) to be used for drought analysis (Svoboda and Fuchs, 2017) but also for its simplicity and because many studies have successfully employed it in various regions (Elkollaly et al., 2018; Nkunzimana et al., 2021; Lawal et al., 2021; Thi et al., 2023). To the best of our knowledge, it has not been employed over Madagascar so far. Even though incorporating an index based on soil moisture would be beneficial for analyzing drought impacts on vegetation, the SPI is frequently used for studying agricultural droughts since it requires only precipitation data, which have better availability. Moreover, an appropriate index describing vegetation cover must be used to investigate the impact of drought on vegetation. The Normalized Difference Vegetation Index (NDVI) is reported to be the most extensively used vegetation index for investigating climate impacts on vegetation (Tian et al., 2015; Huang et al., 2021). This index has been successfully used and demonstrated to be a good indicator of vegetation greenness, biomass, leaf area index, and primary production (Huete et al., 2002; Sun et al., 2011; Mbatha and Sifiso, 2018; Sharma et al., 2022). Out of the numerous vegetation indices, the NDVI is also a reliable measure for tracking vegetation status, commonly employed in monitoring land degradation and desertification and often utilized for detecting and evaluating drought conditions (Zhao et al., 2018; Nanzad et al., 2019; Lawal et al., 2021). As an illustration, relationships between drought and vegetation indices have been successfully evaluated over Africa by using the SPI and NDVI methods (Vicente-Serrano et al., 2013; Lawal et al., 2021). However, so far, any similar assessment of drought and its impacts on vegetation has not been performed over Madagascar.
Therefore, the aim of the present study is to evaluate the features of drought over Madagascar in recent decades from 1981 to 2022 and to assess the potential impact of selected drought episodes on vegetation. For the characterization of historical drought patterns and their effects on vegetation across Madagascar, this study employs the SPI as the drought index and the NDVI as the vegetation index. The drought assessment is conducted on multiple SPI timescales accompanied by seasonal and annual analyses. Furthermore, it provides a detailed examination of drought duration, frequency, severity, and intensity. By connecting SPI and NDVI changes, the relationships between precipitation deficits and vegetation response can be explored.
2.1 Study area
Madagascar is situated in the Indian Ocean, near the southeastern coast of Africa, within the coordinates of 12–25° S and 43–51° E, which covers an area of approximately 592 040 km2 (Fig. 1). The country experiences two primary seasons: a hot–wet season from November to April and a cool–dry season from May to October (Jury et al., 1995; Randriamarolaza et al., 2021; Randriatsara et al., 2022a). These seasonal variations are primarily influenced by Madagascar's topography and geographical location (Jury et al., 1995; Macron et al., 2016; Randriatsara et al., 2022a; Barimalala et al., 2018). The elevation of the island reaches up to 2300 m in the central highland above sea level (Fig. 1a). Annual rainfall across the country varies from 350 to 4000 mm yr−1 (≃ 30 to 300 mm month−1; Fig. 1c), with a decreasing gradient from the eastern coast to the southwestern coast (Randriatsara et al., 2022a, b, 2023). Daily mean air temperature varies throughout the year from 23 to 27 °C (≃ 296 to 303 K) in coastal regions and from 14 to 22 °C (≃ 287 to 295 K) in the central highlands (Fig. 1d). During the hot–wet season, the Inter-Tropical Convergence Zone (ITCZ) covers the northern part of the country as the northwestern monsoon wind and the trade winds converge over this area (Randriamarolaza et al., 2021). This convergence leads to rainfall across the whole of Madagascar, except in the southern parts. In contrast, these semi-arid southern regions receive precipitation when the tropical temperate trough develops between November and February, extending from southern Africa to the Mozambique Channel (Macron et al., 2016; Barimalala et al., 2018). The southern region has low vegetation cover and a dry steppe climate (Belda et al., 2014). In this study, we divided Madagascar into three regions (Fig. 1), in accordance with the general land characteristics, the amount of rainfall (Fig. 1c), the mean temperature (Fig. 1d), and the vegetation types. Region 1 (R1) is the southern part of the country, a semi-arid area where spiny forests reside. Region 2 (R2) is the western part covered by dry forests (i.e., forests that can survive under a low amount of rain), while Region 3 (R3) is the eastern coast and represents the tropical rainforest (Burgess et al., 2004; Desbureaux and Damania, 2018). Moreover, it is worth mentioning that in this study, the borders of the regions are merely simple, straight lines based on the distribution of annual mean precipitation and temperature over Madagascar. This is done for the sake of simplicity, but the regions are coherent mainly in terms of precipitation, which is the only input for the SPI calculation. Moreover, prevailing vegetation types are consistent within the three studied regions.
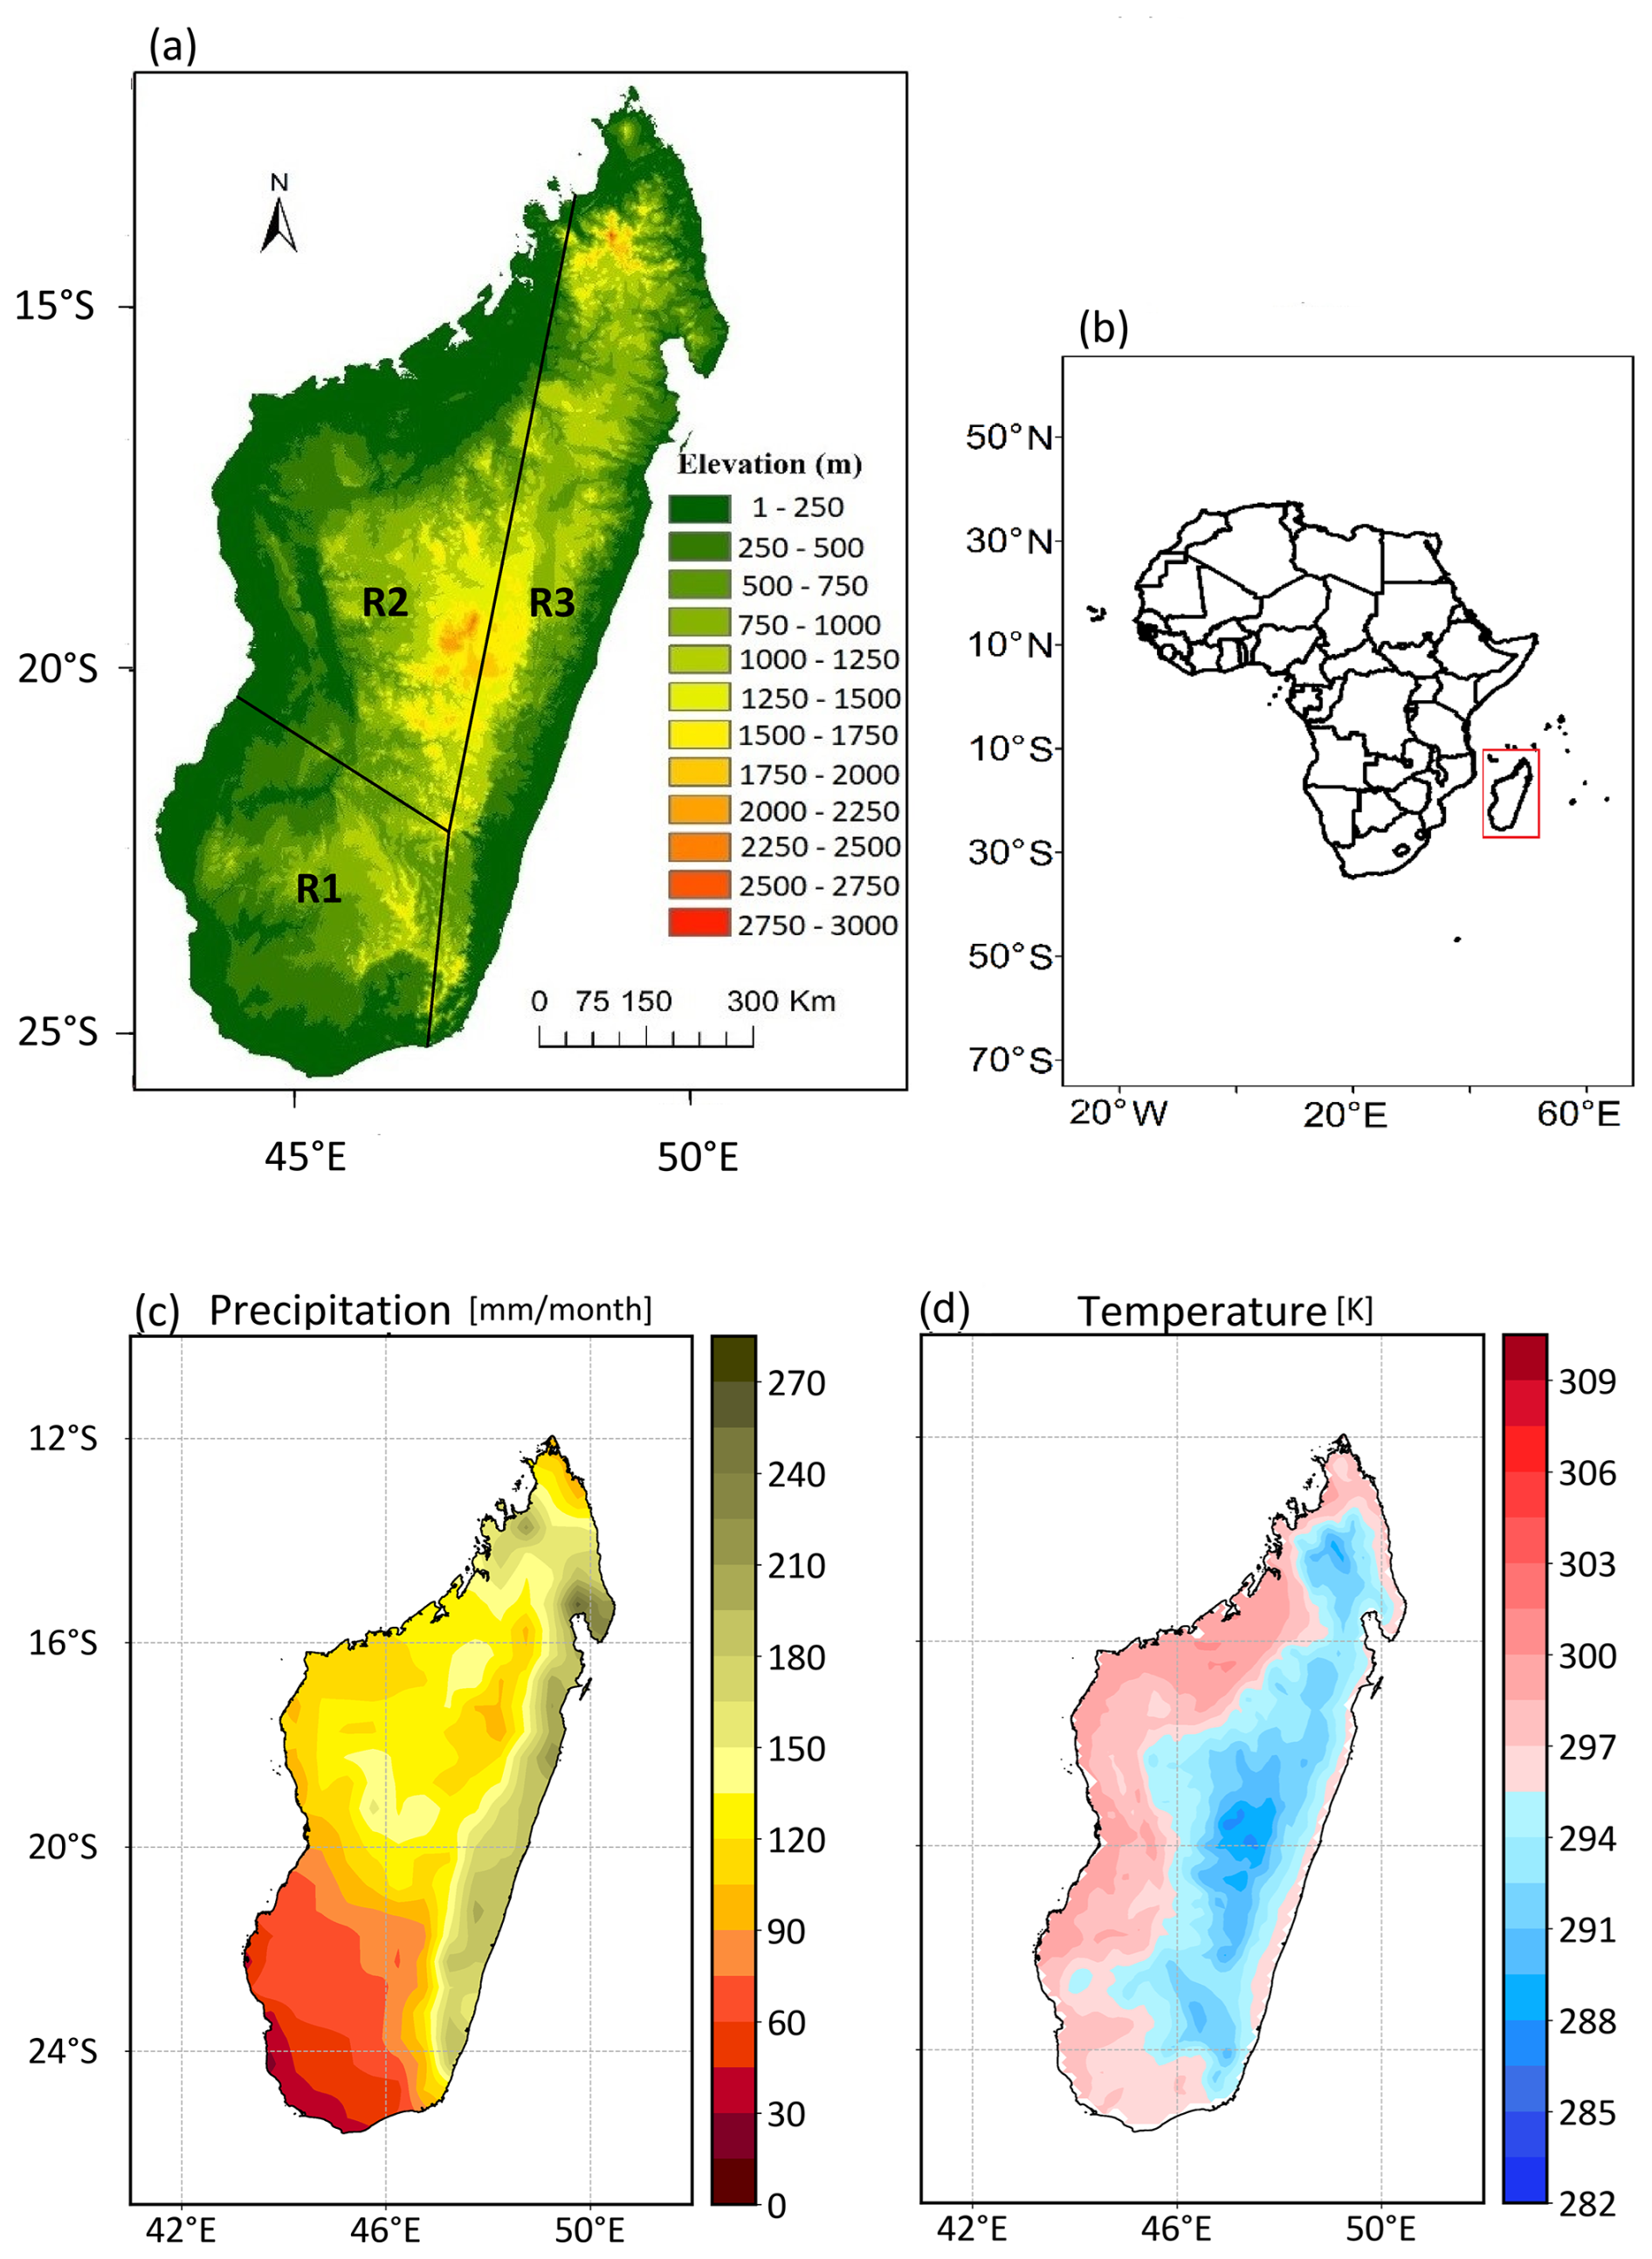
Figure 1(a) Topographic map of the study area. (b) Geographical location of Madagascar (depicted within the red rectangle) on the map of Africa. Annual mean (c) precipitation and (d) temperature in Madagascar from 1981–2022. R1 represents the southern region, R2 the western region, and R3 the eastern region. Publisher's remark: please note that the above figure contains disputed territories.
2.2 Data
2.2.1 Precipitation data
The choice of the datasets for this study is based on the findings from our previous research (Randriatsara et al., 2022b), which evaluated the performance of different gridded (gauge-based, reanalysis, and satellite) precipitation datasets over Madagascar during 1983–2015. Among all the examined datasets, the Climate Hazards Group InfraRed Precipitation with Station data version 2.0 (CHIRPS v2.0) and the ECMWF Reanalysis v5 (ERA5) were found to best represent Madagascar's rainfall. Moreover, these two datasets have been chosen and successfully used as reference data for evaluating the performance of CMIP6 HighResMIP over Madagascar during 1981–2014 (Randriatsara et al., 2023).
The CHIRPS dataset is a satellite-based product derived from infrared cold-cloud duration, combined with a smart interpolation technique. It covers a wide geographical range from 50° S to 50° N with a spatial resolution of 0.05 × 0.05 (5.3 km) and spans the period from 1981 to the near present (Funk et al., 2015). Among all the research, it has been successfully used to assess drought characteristics in the Gamo Zone, Ethiopia, and has been found to perform well (Shalishe et al., 2022). Similarly, Li et al. (2023) demonstrated that CHIRPS effectively reproduced the spatial distribution of drought characteristics in China's first-level water resource basins based on the Standardized Precipitation Index (SPI). It is available at https://iridl.ldeo.columbia.edu/SOURCES/.UCSB/.CHIRPS/.v2p0/.daily-improved/.global/.0p05/.prcp (last access: 2 November 2023). Moreover, the ERA5 data are the fifth-generation atmospheric reanalysis developed by ECMWF, integrating data from over 200 satellite instruments, as well as ground-based radar–gauge data for rainfall (Hersbach et al., 2020). This dataset covers a spatial resolution of about 0.1 × 0.1 over several decades and spans January 1959 to the near present. Moreover, it has proven to be valuable in the field of drought analysis (Rakhmatova et al., 2021; Vicente-Serrano et al., 2022) and outperforms other products in monitoring drought characteristics in some parts of South Africa (Tladi et al., 2022). The ERA5 dataset is available at https://cds.climate.copernicus.eu/datasets (last access: 2 November 2023).
The current study proposes combining CHIRPS v2.0 and ERA5 data to create a robust and enhanced dataset for a comprehensive analysis of drought characteristics over the study area. Both the CHIRPS v2.0 dataset and the ERA5 dataset are selected from the period 1981–2022, and all the results described below are based on the ensemble mean of these two datasets.
2.2.2 Normalized Difference Vegetation Index (NDVI) data
The NDVI represents the density of greenness over an area by referring to the reflectance in the near-infrared (NIR) band in relation to the reflectance in the red band, which is a part of visible shortwave radiation (Rouse et al., 1974).
The red band is strongly absorbed by vegetation due to chlorophyll, while vegetation reflects a significant portion of NIR radiation. More NIR radiation is reflected than radiation in the red band in dense vegetation, resulting in higher NDVI values. However, the difference between reflected NIR and absorbed red light is smaller in sparse vegetation, leading to lower NDVI values. The NDVI is defined as
Theoretically, the NDVI ranges from −1.0 to 1.0, although the realistic range is from 0.1 to 1.0 because, in the absence of vegetation, the NDVI is close to zero (Martinez and Labib, 2023). Slightly negative NDVI values have been shown to depict differences in albedo (Martinez and Labib, 2023); however, these are mostly ignored. In the present study, the NDVI is derived from Terra's Moderate Resolution Imaging Spectroradiometer (MODIS) and is represented by the monthly vegetation index MOD13C2 version 6.1 with a spatial resolution of 0.05°. It covers the 2000–present period. More information about the data can be found in Didan (2021). The data are freely available at https://doi.org/10.5067/MODIS/MOD13C2.061. The NDVI time series with a monthly time step for the period 2000–2022 were retrieved from the Earthdata website using the AppEEARS tool (https://appeears.earthdatacloud.nasa.gov/, last access: 9 October 2023).
2.3 Methods
2.3.1 Computation of the Standardized Precipitation Index (SPI)
The SPI is used to assess the duration, frequency, severity, and intensity of drought and to identify anomalously dry periods. It is calculated as a standardized departure of observed precipitation from a theoretical probability distribution of the precipitation and can be calculated for different timescales. A two-parameter gamma distribution fit for the SPI calculations (The NCAR Command Language, 2019) was applied in the present study. The gamma distribution parameters were estimated using the maximum likelihood method, as described in Thom (1958). The distribution was assessed grid pointwise.
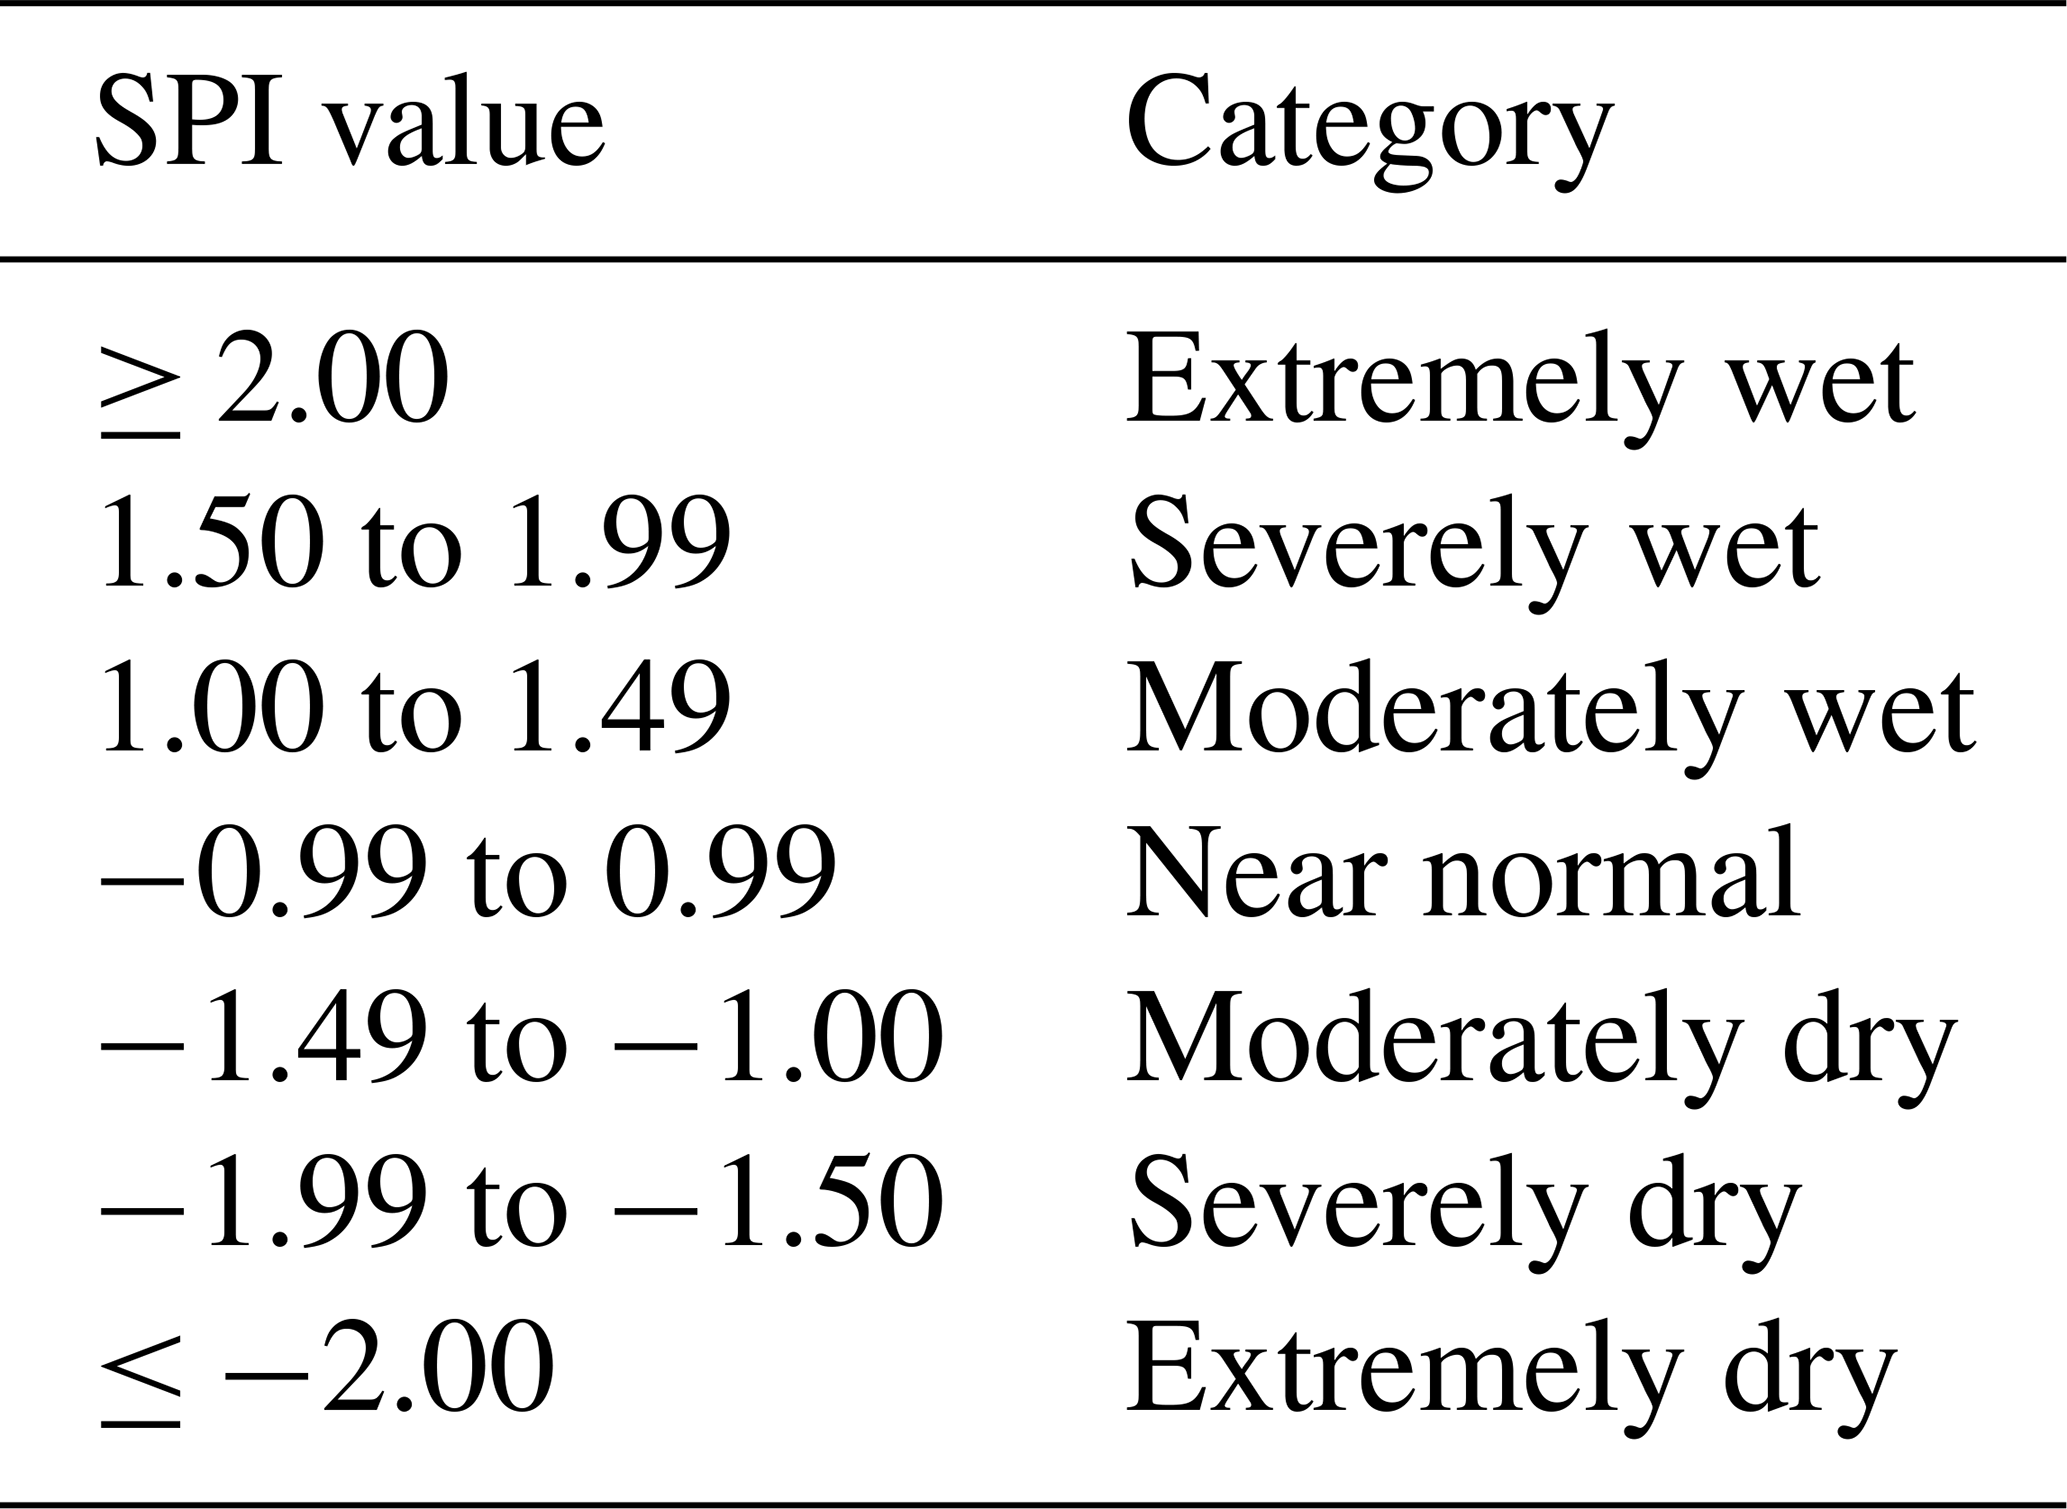
In the present study, we focus on the timescales of 3 (SPI-3), 6 (SPI-6), and 12 (SPI-12) months. Following McKee et al. (1993), the SPI is calculated as the difference in the observed precipitation from the mean value divided by the standard deviation. Therefore, the value of the SPI gives an estimate of how many standard deviations the actual precipitation deviates from the theoretical mean value. For SPI-3, SPI-6, and SPI-12, running precipitation averages over 3, 6, and 12 months are assessed, respectively. Previous studies indicate that SPI-3 and SPI-6 are normally used to assess agricultural and hydrological droughts, respectively, while SPI-12 is important for studying groundwater droughts (Elkollaly et al., 2018; Nkunzimana et al., 2021). The classification of wet and dry conditions based on the SPI values is shown in Table 1.
Table 1Categories of dry and wet conditions based on SPI values following McKee et al. (1993).
2.3.2 Computation of the SPI on the seasonal and annual scales
To evaluate drought on a seasonal scale, SPI-6 for April of each year is used to represent the wet season (November–April), and SPI-6 for October represents the dry season (May–October). This method has previously been used by Elkollaly et al. (2018). Similarly, the same concept was applied to the annual scale by selecting SPI-12 for December. In the following text, we use the terms “seasonal SPI” and “annual SPI”.
2.3.3 Drought characteristics – duration, frequency, severity, and intensity
The drought characteristics are calculated as follows.
-
Drought duration means the number of months with an SPI of less than −1 (denoted as SPI) divided by the number of events, i.e., continuous occurrences of SPI values less than −1:
-
Drought frequency is the percentage of the occurrence of SPI values less than −1 throughout the study period:
where NumberTime steps is 504 months (the number of months in the study period).
-
Drought severity refers to the sum of SPI values less than −1 over all time steps:
-
Drought intensity refers to the average of SPI values less than −1:
These drought characteristics are calculated for the three considered timescales (SPI-3, SPI-6, SPI-12) and for the seasonal and annual timescales. These written equations are based on the SPI-3, SPI-6, and SPI-12 timescales; however, for the case of seasonal and annual scales, the number of months with SPI values less than −1 (SPI ≤ −1) is replaced by the number of seasons or years with an SPI of less than −1. Moreover, the number of time steps (504 months) is replaced by 42 time steps for seasonal and annual scales.
2.3.4 Assessment of the impact of drought on vegetation
To assess the impacts of drought on vegetation, we calculated monthly NDVI anomalies relative to the long-term mean annual cycle (the monthly mean values averaged over the whole study period of 2000–2022). For the analyses on seasonal and yearly timescales, seasonal and annual NDVI anomalies were calculated. We concentrate on the period 2000–2022, for which the NDVI data are available.
The three most severe drought episodes were selected to calculate these NDVI anomalies. The selection was taken from the monthly SPI values (i.e., SPI-3, SPI-6, and SPI-12) of the three regions depicted in Figs. 2–4 (as marked with green rectangles in Fig. 2) and from the monthly SPI values averaged over the whole island (Fig. S1 in the Supplement) to calculate the monthly NDVI anomalies. The selection of drought episodes is based on the simultaneous and continuous occurrences of the most prominent negative SPI values (Figs. 2–4 and S1). These prominent drought episodes are hereafter denoted as “Event I” (spanning October 2005–October 2006), “Event II” (January 2016–April 2017), and “Event III” (September 2020–December 2022). To calculate the seasonal and annual NDVI anomalies, the selection was taken from the seasonal and annual SPI (Fig. S2), in which there are no simultaneous and continuous occurrences of prominent negative SPI values during Event II (Fig. S2). Therefore, for the seasonal and annual timescales, only Event I and Event III are examined (marked with green rectangles in Fig. S2).
The purpose of the analyses is to find out whether the analysis of NDVI anomalies during the selected events based on the SPI values (SPI-3, SPI-6, and SPI-12 and seasonal and annual timescales) can show the impacts of drought on vegetation.
The monthly NDVI anomalies are examined in Sect. 3.4.1, the annual NDVI anomalies in Sect. 3.4.2, and the seasonal NDVI anomalies in Sect. 3.4.3.
2.3.5 Computation of correlation
In this study, Pearson and Spearman correlation coefficients were used to quantitatively assess the statistical relationship between the SPIs and NDVI anomaly. The Pearson correlation measures the strength of the linear relationship between two variables (Wilks, 2006). On the other hand, the Spearman correlation assesses the strength and direction of the monotonic association between two variables. In other words, it is a calculation of the Pearson correlation based on the ranked values of the data (Wilks, 2006). For the calculation of the correlation coefficients, the NDVI time series were linearly detrended, and its mean seasonal cycle was removed in order to eliminate any trends which may be caused by seasonal regeneration of vegetation.
3.1 Temporal evolution of the SPI
3.1.1 Regional values of monthly SPI-3, SPI-6, and SPI-12
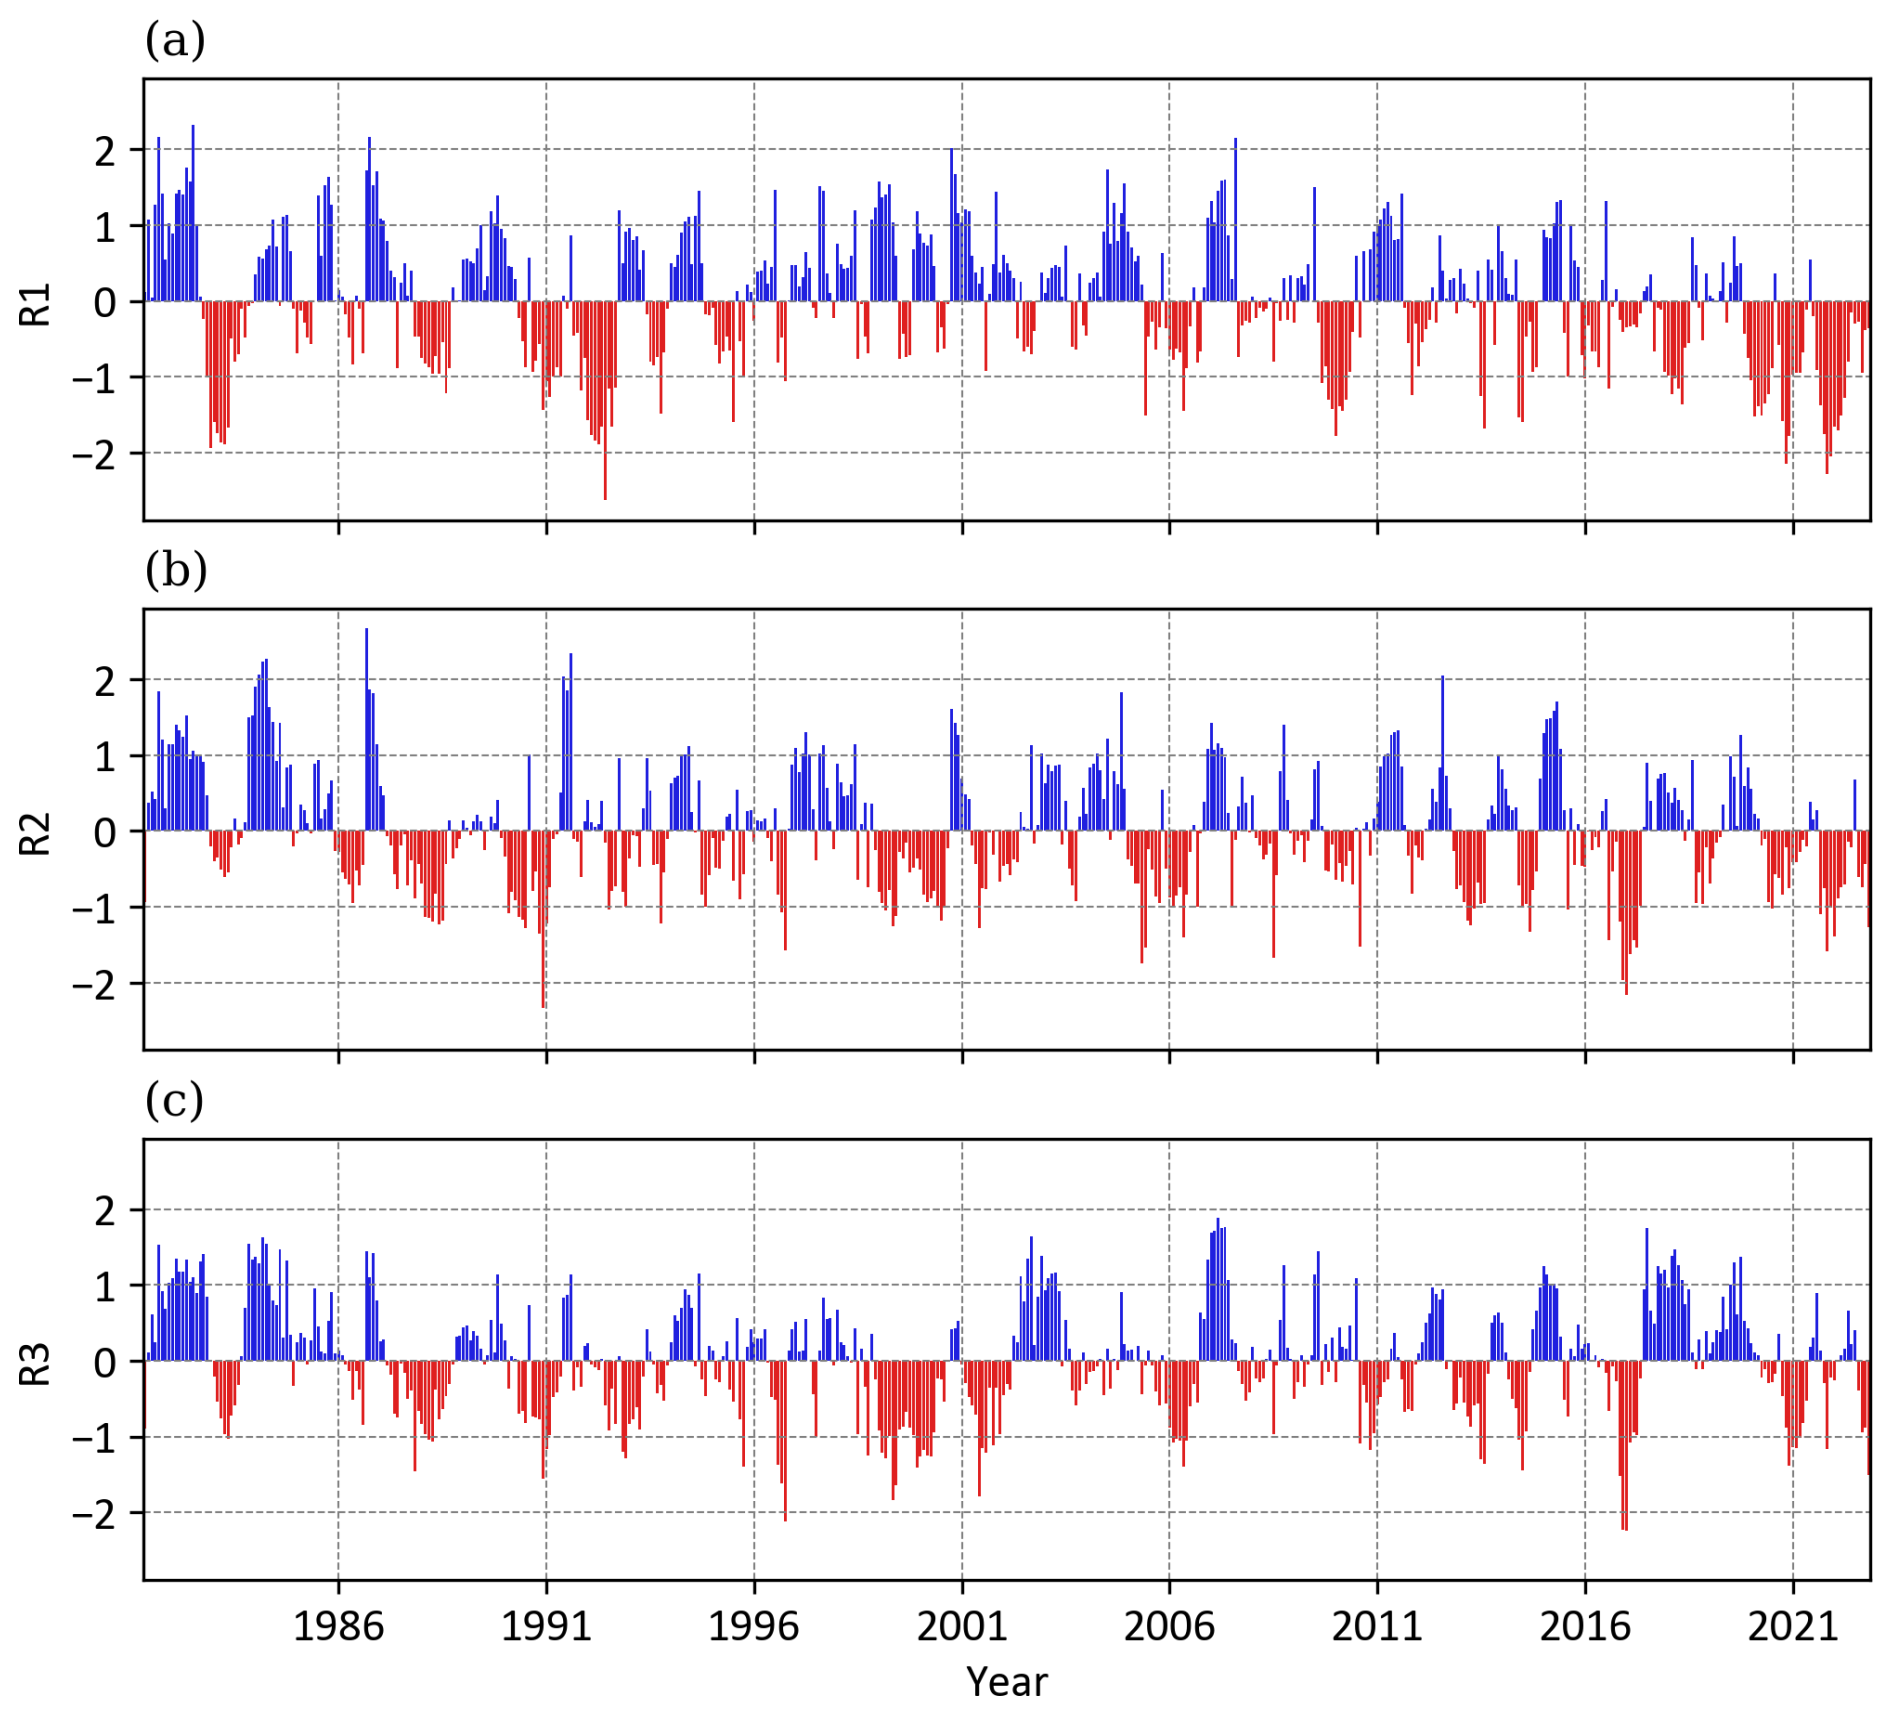
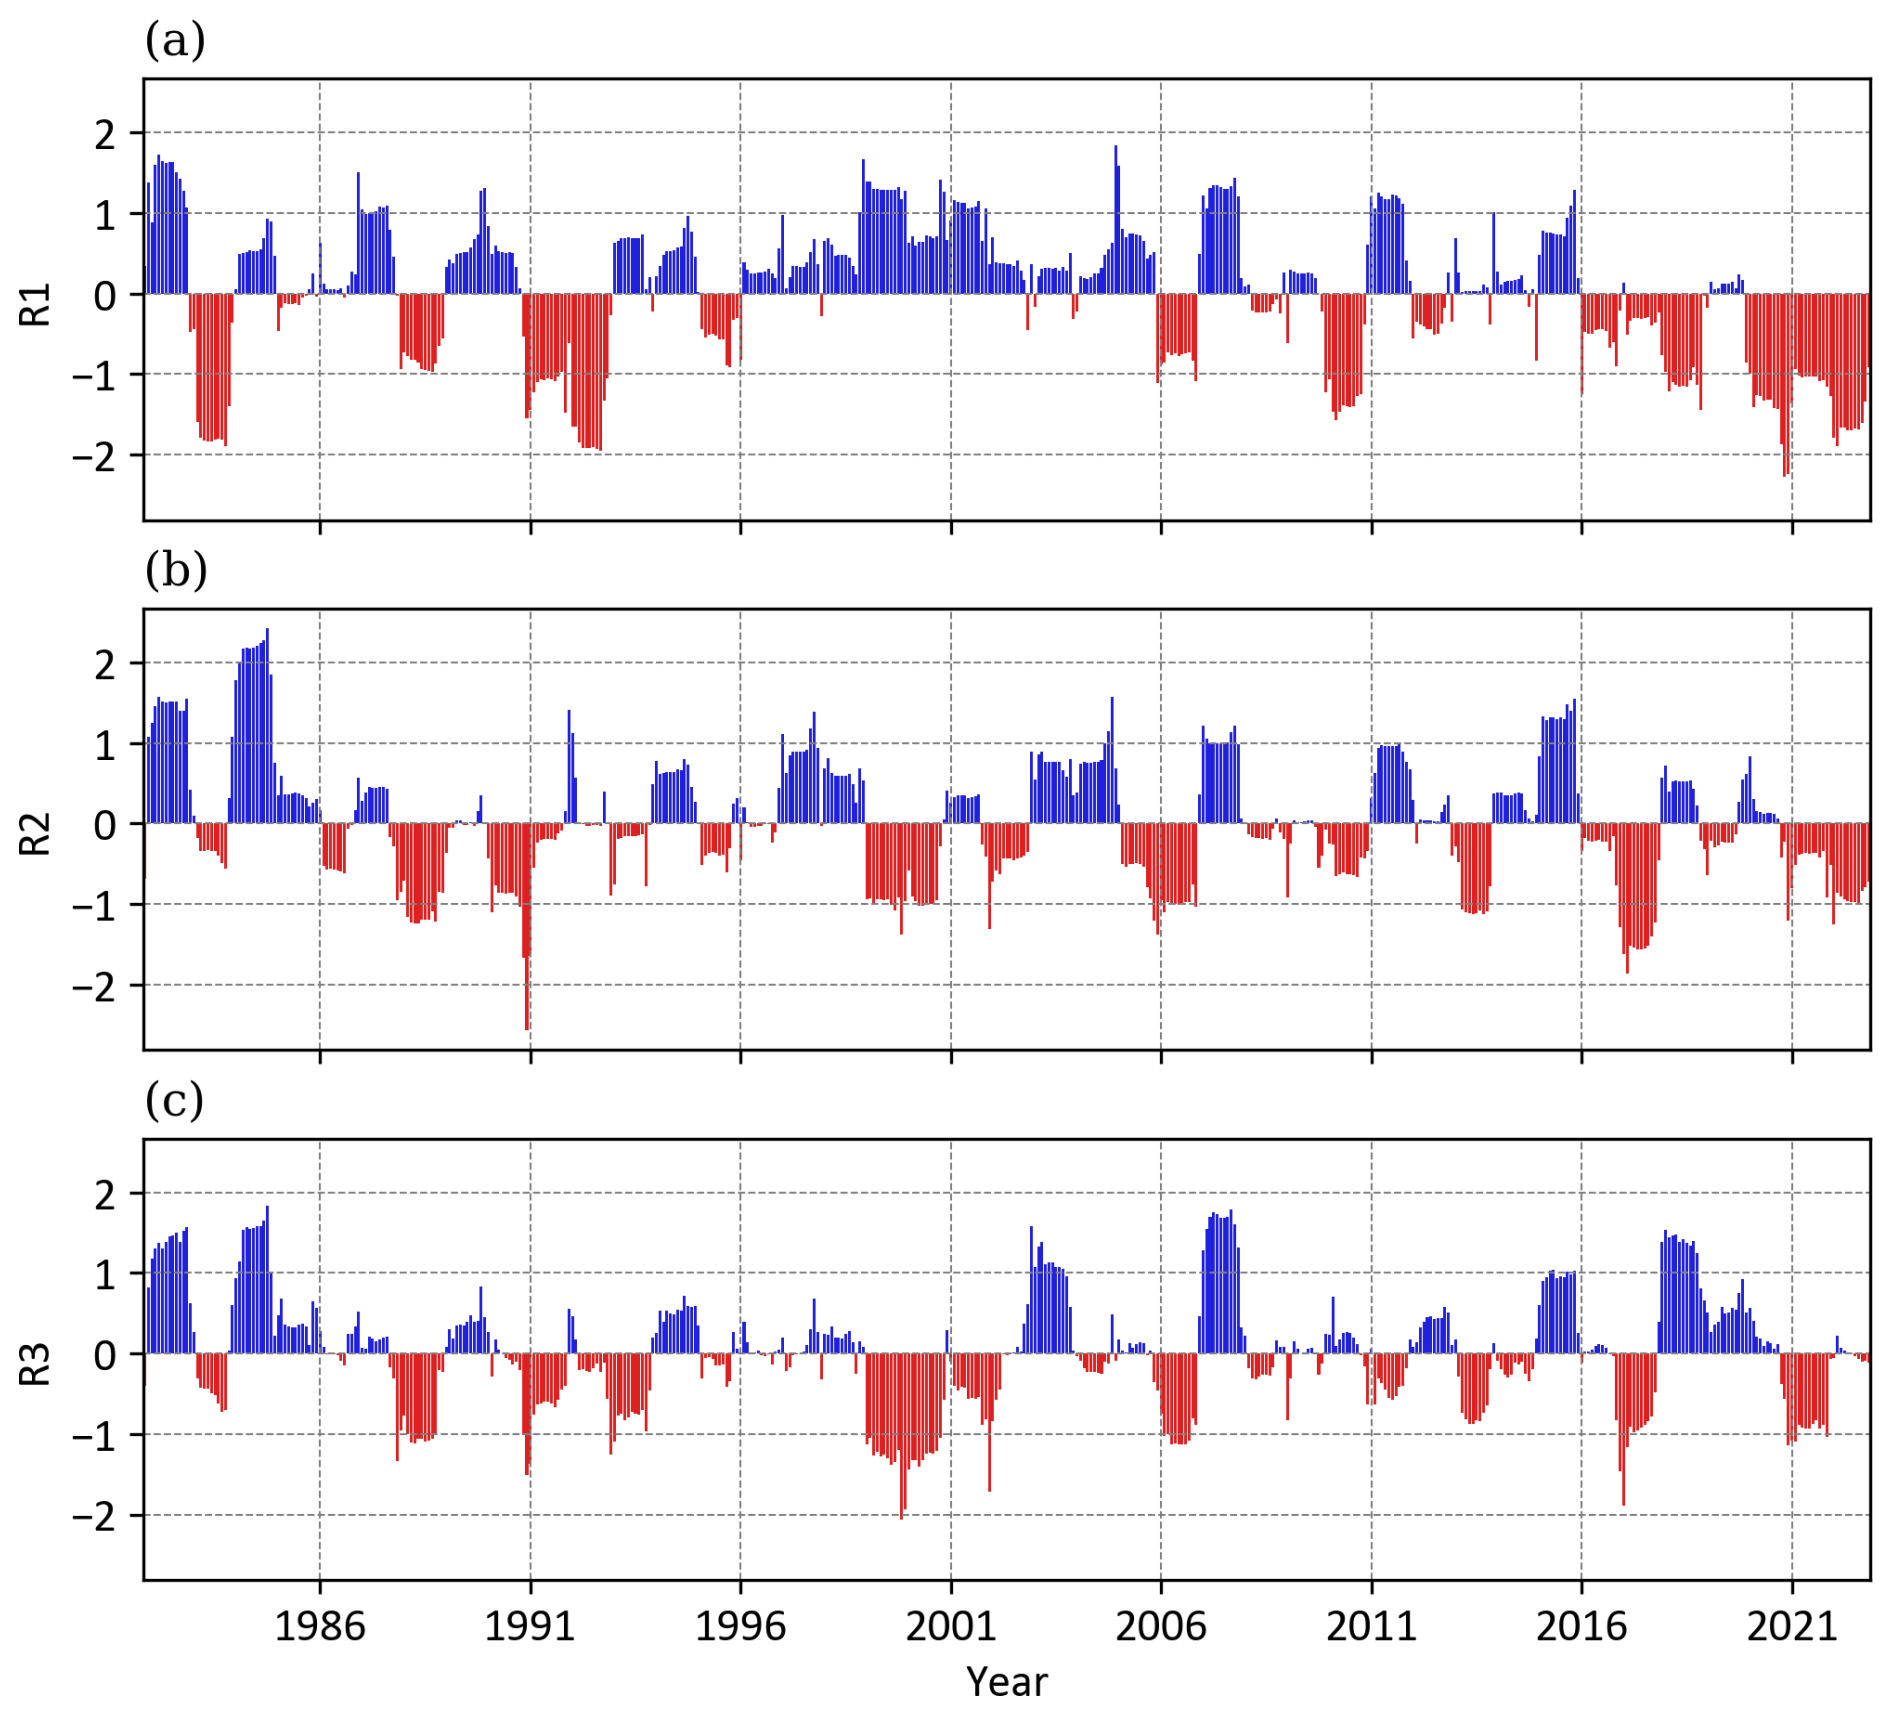
All three SPI indices shown in Figs. 2–4 exhibit large interannual variability. Dry and wet periods were identified as persisting for several years but also short episodes spanning only a couple of months. Regarding the comparison of the three studied regions of Madagascar, the SPI evolution for all three timescales was in accordance over all three regions between 1981 and 1986. Since then, some events have also occurred simultaneously over all three regions (for example, the events highlighted by shading; see Sect. 3.4), but many dry or wet episodes exhibit disagreement between them. The occurrences of moderate (i.e., SPI values between −1.49 and −1.0) to severe drought events (i.e., SPI values between −1.99 and −1.5) in the recent decade are more severe over the southern region (R1) than over the western (R2) and eastern (R3) regions. However, between the years 1995 and 2005, drought persisted more over R2 and R3, while R1 experienced rather wetter conditions. The occurrence of extreme drought events (SPI values less than −2) is rarely recorded in all regions. For SPI-3 and SPI-6, extremely dry years were experienced during 1983, 1992, 2021, and 2022 over R1, during 1991 and 2017 over R2, and during 1997 and 2017 over R3. Based on SPI-12, all regions experienced simultaneous drought in the years 1991, 2006, 2017, and 2021.
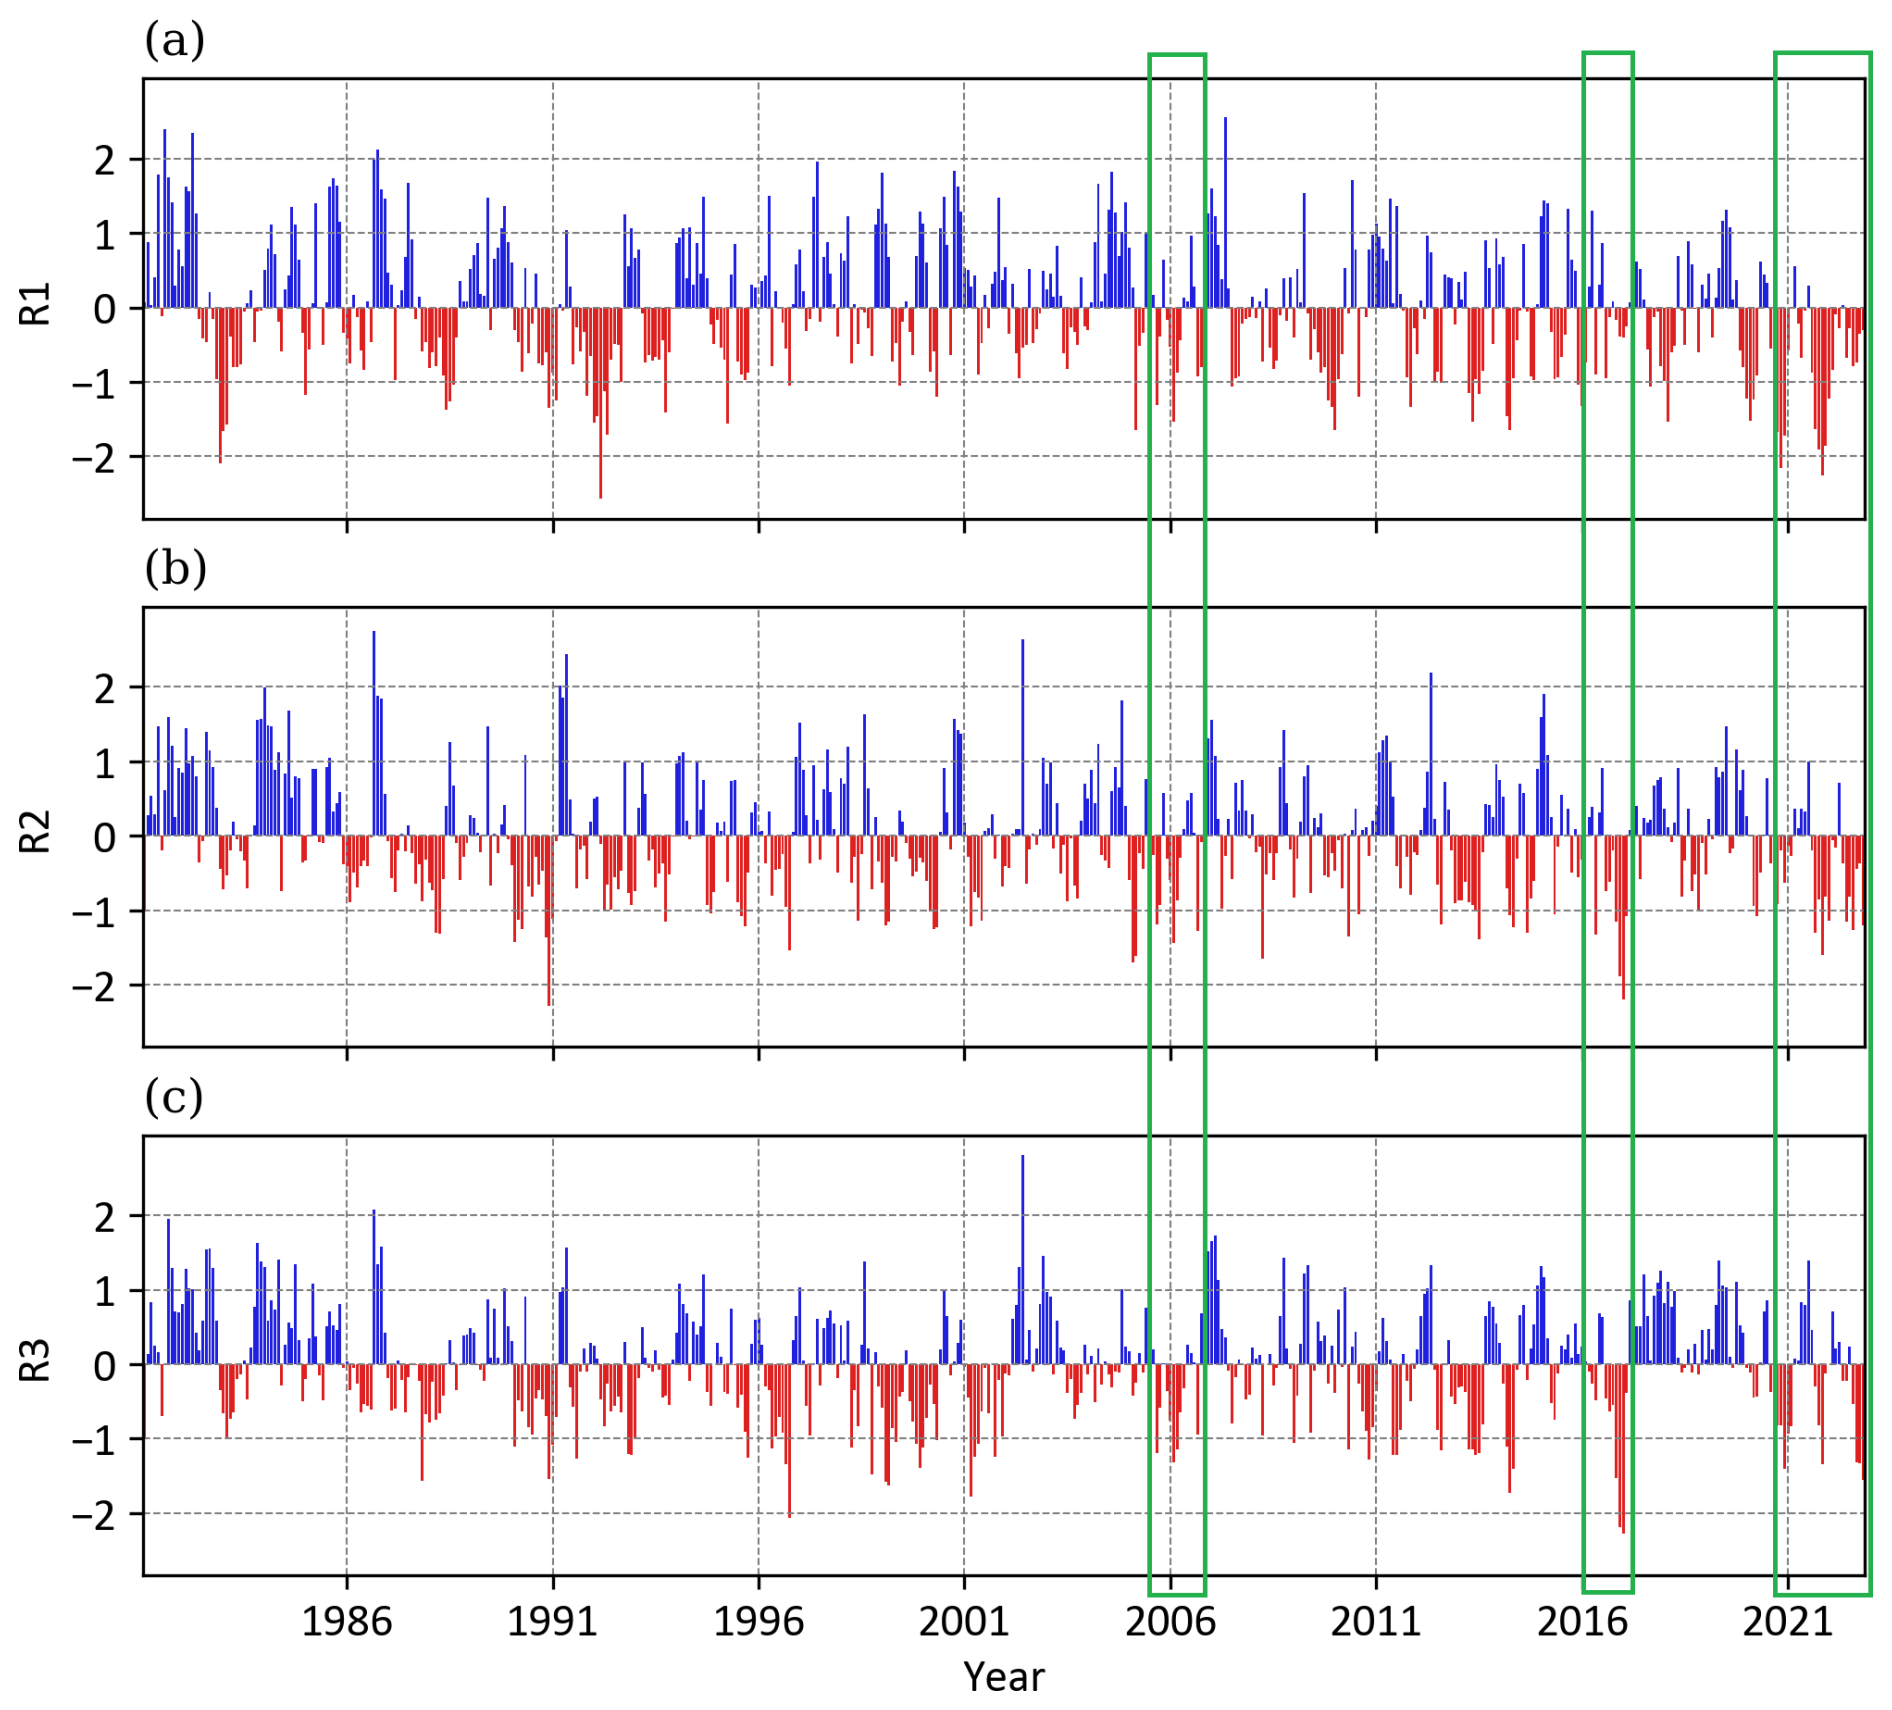
Figure 2SPI-3 values from the ensemble mean of CHIRPS and ERA5 over Madagascar during the period 1981–2022 over different regions of Madagascar. R1, south; R2, west; and R3, east. The green rectangles represent selected periods which are used for the analysis of the connection between drought and vegetation. They are named drought episodes.
3.1.2 Regional values of seasonal and annual SPI
Regarding the SPI for the wet season (SPI-6 for April, Fig. 5i), the results are very similar in R2 and R3, where moderate drought events are recorded during 1988, 1999, 2000, 2006, and 2017. In the southern region (R1), the years 1983 and 1992 experienced severe drought events, followed by a continuous wetter period until the occurrence of moderate drought in 2010. By the end of the study period, between 2016 and 2022, this region experienced consecutive drought, unlike the other two regions. The temporal development of the dry-season SPI (Fig. 5ii) reveals almost the same pattern in all three regions until 2007. The main features are the occurrences of moderately to extremely wet years at the beginning of the study period from 1981 to 1986, followed by more frequent dry periods with a rather lower magnitude of the SPI (values mostly between −0.5 and −1). The wet events are less frequent after 1986 in the dry season, but the magnitude of the SPI is often higher than 1 (Fig. 5ii). After 2007, the regions exhibit some dissimilarities to each other, with more occurrences of dry periods over the western and southern regions (R2 and R1). The annual SPI (Fig. 5iii) shows different years of moderate to extreme drought events over the three regions, with a higher resemblance between R2 and R3. For example, as seen in Fig. 4, between 1995 and 2005 R1 experienced a relatively wetter period, while in the other two regions, the years 1998–2000 were dry with a high magnitude of the SPI. It is also worth mentioning that R1 experienced the most severe drought event in the year 2020, while the other two regions experienced more severe drought before the year 2000.
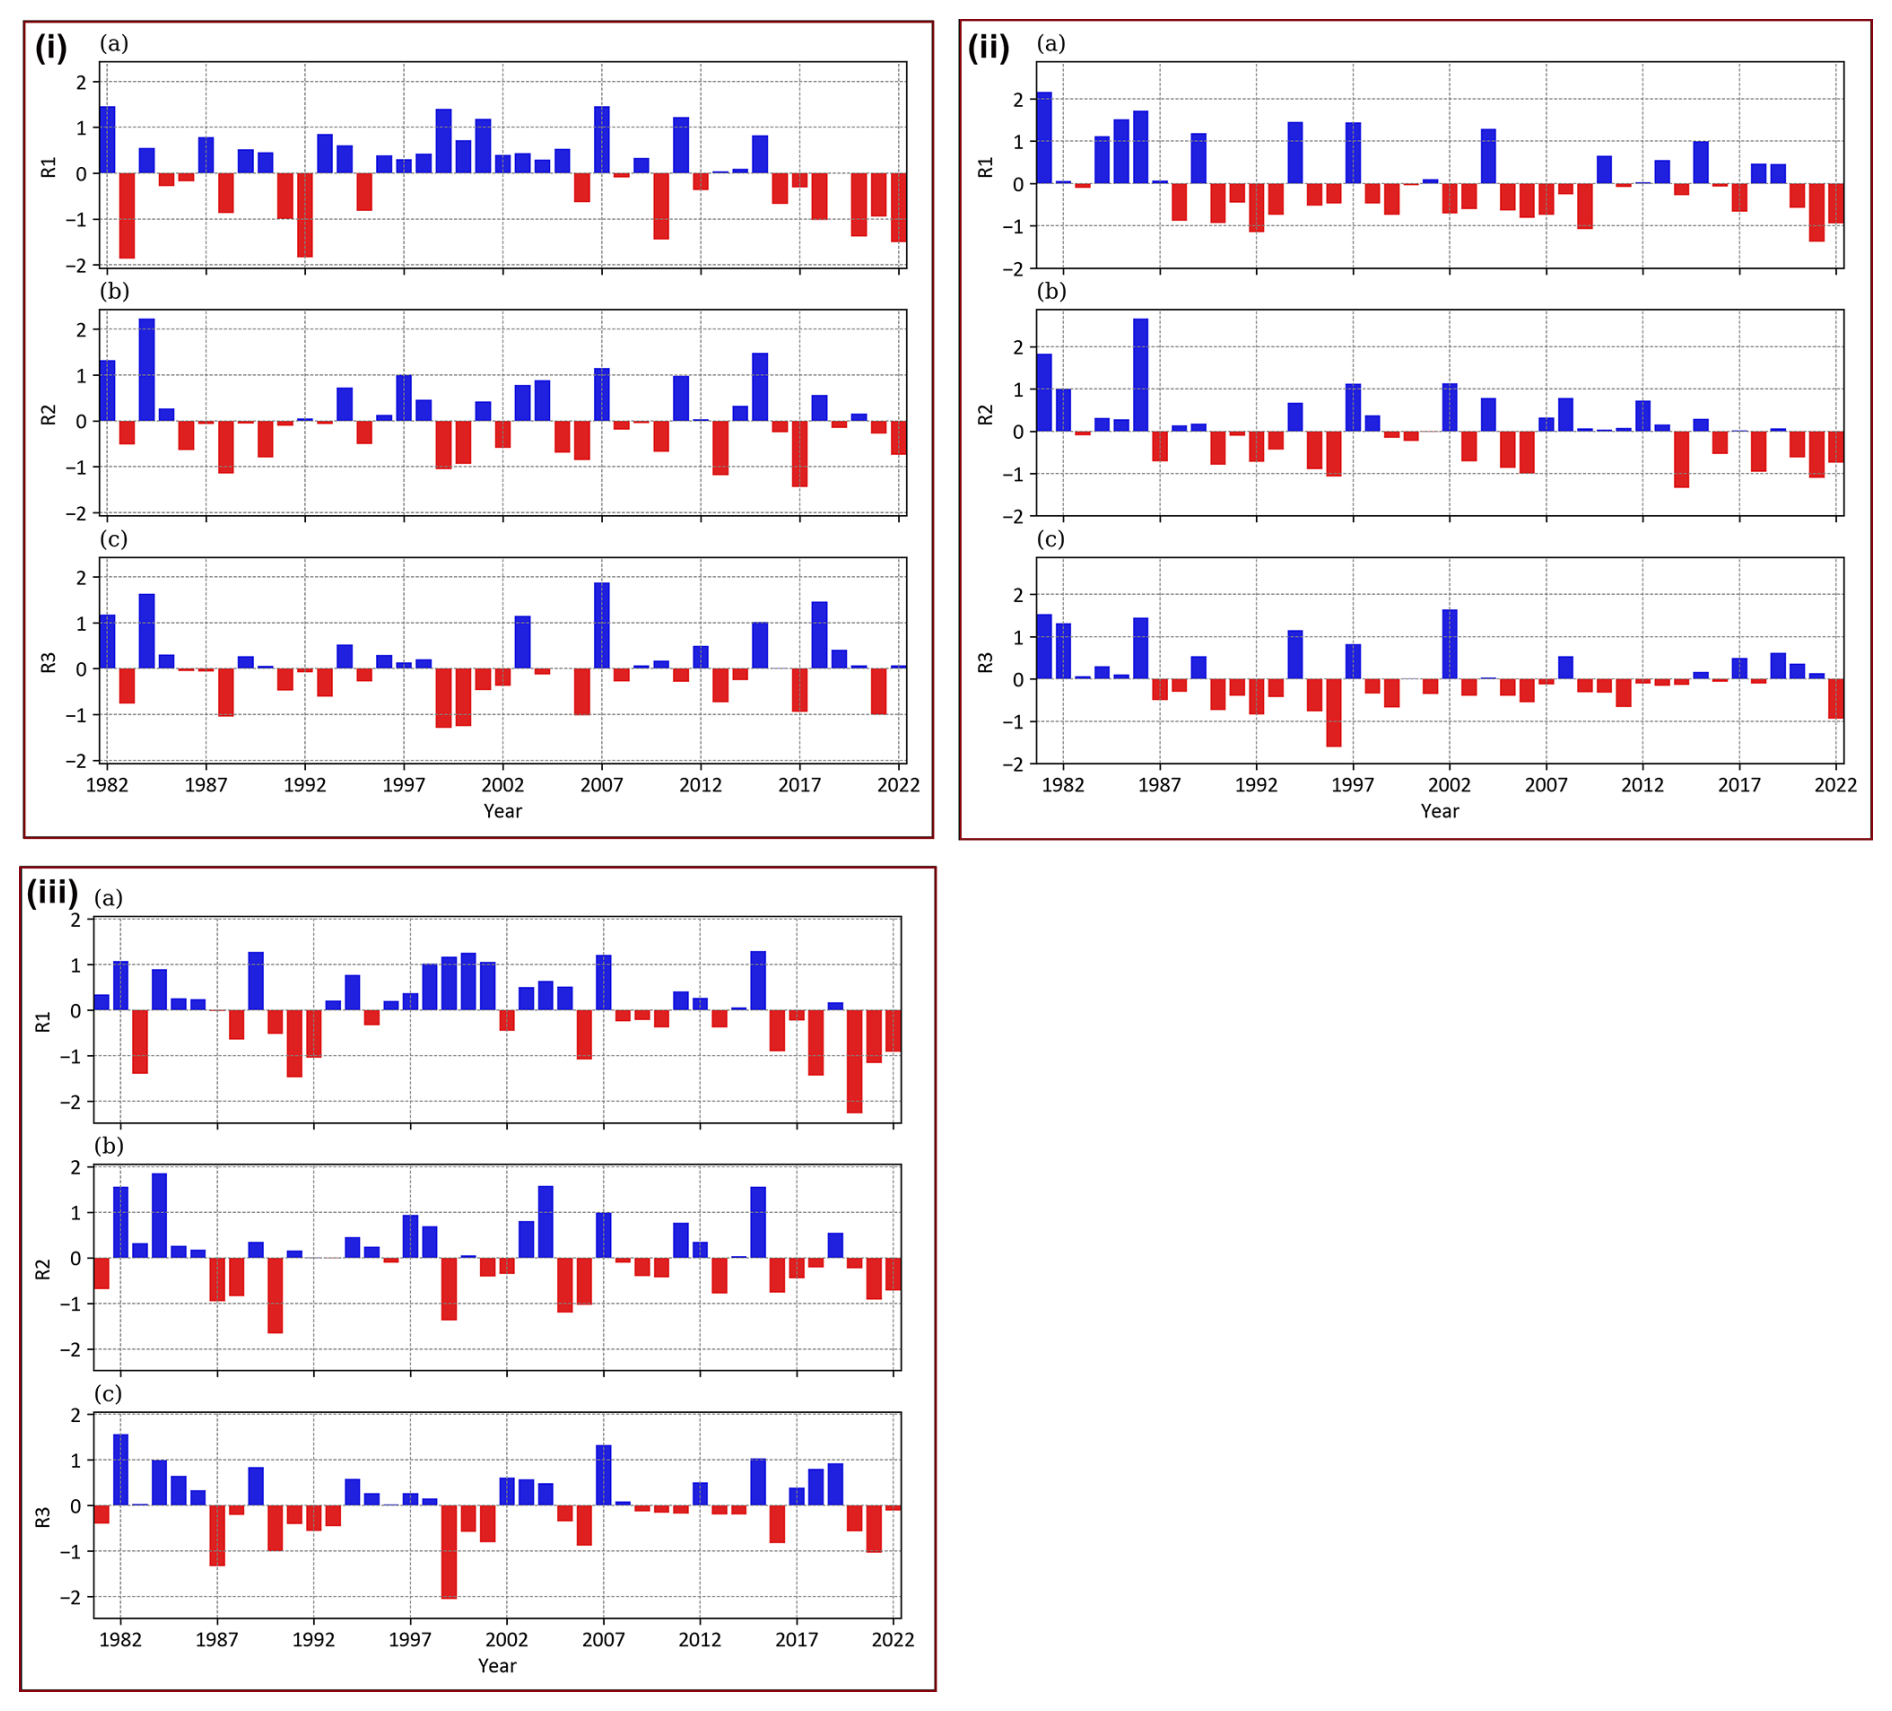
Figure 5Same as Fig. 2 but for (i) seasonal SPI representing the wet season (NDJFMA), (ii) seasonal SPI representing the dry season (MJJASO), and (iii) annual SPI.
3.2 Spatial analysis of drought characteristics (duration, frequency, intensity, and severity)
Figure 6 presents the spatial patterns of drought duration, frequency, intensity, and severity for SPI-3, SPI-6, and SPI-12 (Fig. 6i) and seasonal and annual (Fig. 6ii) timescales. The longest drought duration is observed for SPI-12 (up to more than 10 months in the southern region (R1), Fig. 6i.c), while the shortest drought events are recorded for SPI-3 (less than 2 months, Fig. 6i.a). As explained in McKee et al. (1993), this can be expected due to the fact that the shorter the timescale, the higher the variability in SPI values, resulting in shorter periods of consecutive negative/positive values. Additionally, a higher drought frequency is detected over southern Madagascar for the longer timescale of SPI-12 (22 %) compared to SPI-3 (between 10 % and 17 %, Fig. 6i.f and d, respectively). While SPI-6 displays the same frequency range as SPI-3, the areas with higher frequencies are extended. For the case of drought severity, it also increases with increasing timescale, from the least severe over western parts with values of about 75 for SPI-3 to the most severe over the southern parts with values of more than 155 for SPI-12 (Fig. 6i.g, i). Less severe drought records are found over the western and some of the central parts of the country for all three SPI indices. Spatial patterns of drought intensity show homogeneous distribution for all three timescales (3, 6, and 12 months, Fig. 6i.j, k, l), ranging from 1.1 to 2, but the records gradually increase from SPI-3 to SPI-12. The distribution displays higher values over the southern and northern regions, while the central western areas witness lower values. It is worth mentioning that, overall, for all three timescales (Fig. 6i), the drought characteristics' magnitudes are higher over the eastern and southern regions, especially with prominent values for SPI-12 over the southern part, while some of the western and the central parts display lower values.
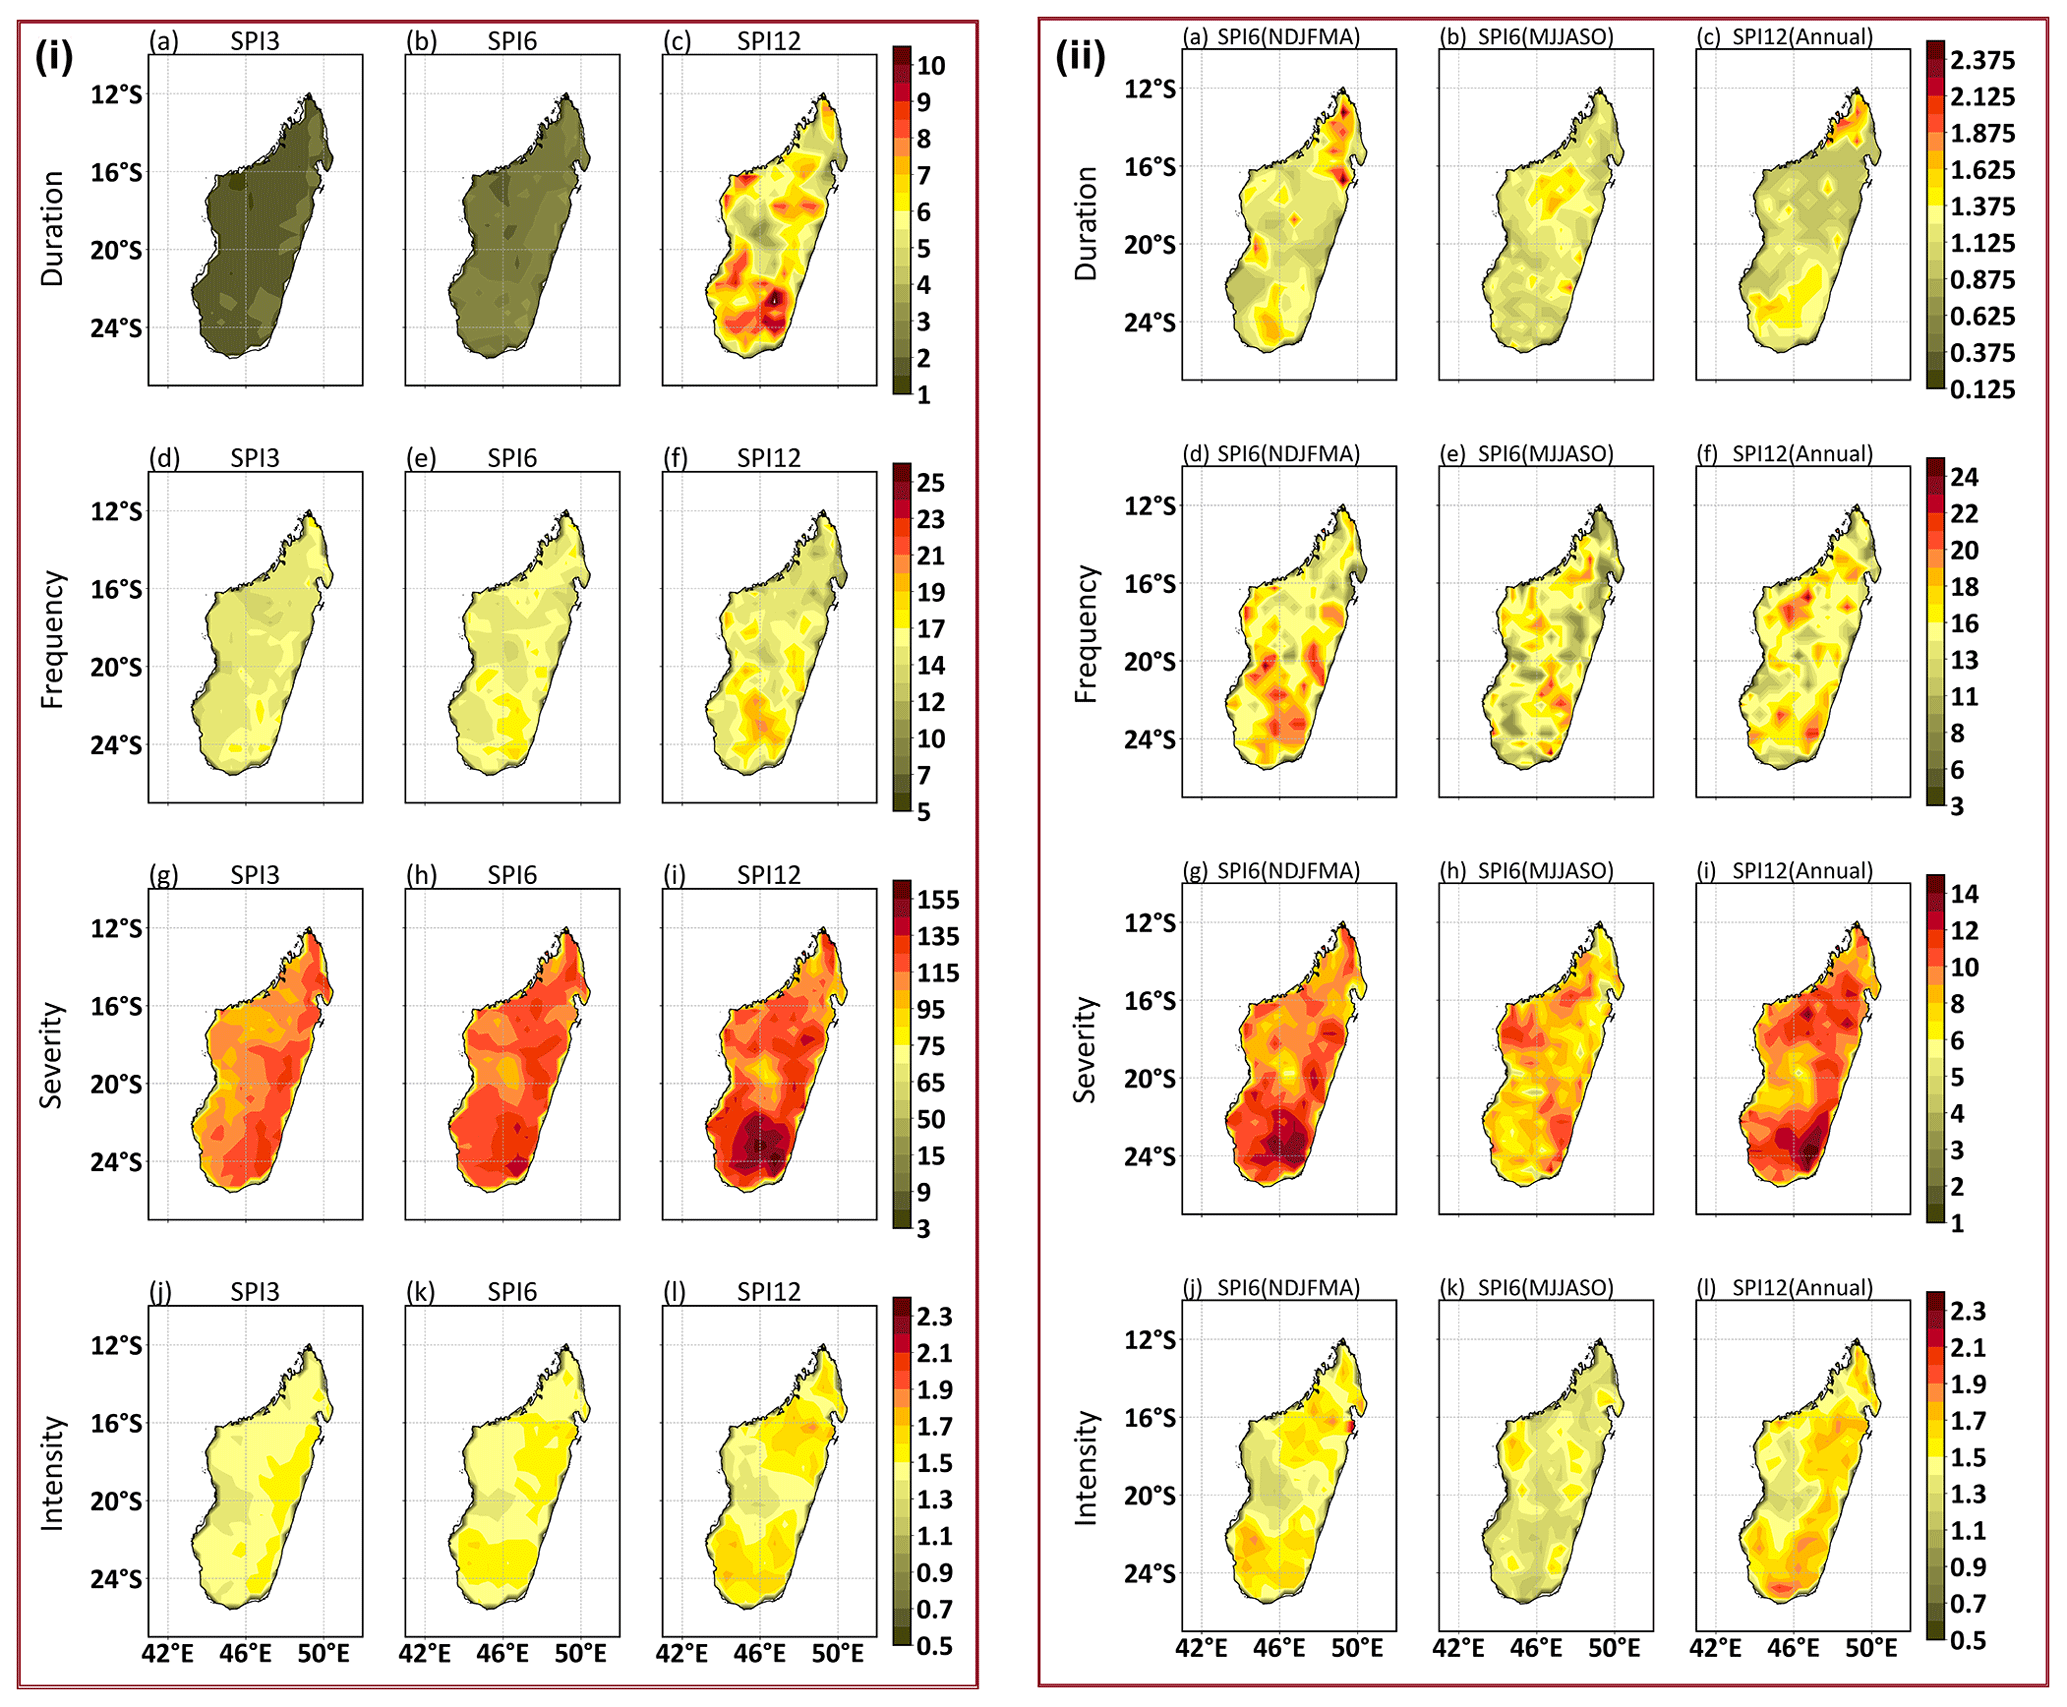
Figure 6Spatial patterns of drought characteristics described in Sect. 2.3.3 (i) for the SPI-3, SPI-6, and SPI-12 timescales and (ii) for seasonal and annual scales. For panel (i), duration is measured in units of months, frequency is given in percent (representing the percentage of months with SPI ≤ −1 relative to the number of all time steps), severity is the sum of SPI ≤ −1, and intensity is the average of the severity during the months with SPI ≤ −1. For seasonal and annual scales (panel ii), duration is expressed in seasons for the seasonal scale and years for the annual scale. Frequency, severity, and intensity in panel (ii) have the same units as in (i), only that the time steps are seasons and years instead of months. The figure shows the averaged values of duration, frequency, and intensity, but for severity, it represents the accumulation of all values ≤ −1.
Regarding the seasonal values (Fig. 6ii), the wet season, NDJFMA (Fig. 6ii.a), displays drought duration values from 0.375 over the southwestern coast to 2.375 seasons over the northern parts. On the other hand, the dry season, MJJASO (Fig. 6ii.c), shows a shorter drought duration compared to the wet season, with the highest record of 1.875 seasons found over the central northern parts. For the annual timescale (Fig. 6ii.c), drought duration is less than a year over most parts of the country, except over the extreme southern and northern parts, in which the records range between 1.125 and 1.125 years. Interestingly, the drought duration during the wet season and at annual scales lasts longer over some parts of the northern area. Drought occurrence is more frequent during the wet season (Fig. 6ii.d, frequency of up to 23 %), specifically over southern Madagascar, than during the dry season (Fig. 6ii.e). The seasonal frequency has the same range of values between 5 % and 24 % for the two seasons; however, larger areas experience more frequent occurrences of drought during the wet season than during the dry season. The annual frequency (Fig. 6ii.f) shows drought frequency between 11 % and 18 % of the study period over most parts of the country. However, some of the northwestern and southern parts witness a drought frequency of up to 23 %. Drought severity is larger during the wet season (with values of up to more than 14, especially over southern Madagascar, Fig. 6ii.g) than during the dry season (with maximum severity of up to 11, Fig. 6ii.h), which is partly due to the frequent occurrence of drought during the wet season (Fig. 6ii.d, e). The annual severity reveals that the southern parts of the country record the most severe annual drought, with values of more than 14 compared to the rest of the areas (Fig. 6ii.1). Regarding the drought intensity, most parts of the country exhibit values between 1.4 and 1.9, except over the central western region, with lower values of 1.3 during the wet season (Fig. 6ii.j). In contrast, moderate drought (i.e., −1.49 ≥ SPI ≥ −1.0) dominates during the dry season (Fig. 6ii.k), with values between 1.1 and 1.5. In the case of the annual intensity, severe drought (−1.99 ≥ SPI ≥ −1.5 or intensity values between 1.5 and 2) is observed over almost the whole country, except the central western part (Fig. 6ii.l), where the intensity is less than 1.5. Overall, based on the seasonal- and annual-scale analyses, the southern part of Madagascar witnesses higher magnitudes of drought characteristics compared to the rest of the regions, accompanied by an exception of a longer drought duration over some parts of the northern areas.
3.3 Potential causes of regional differences in drought characteristics and evolution
Overall, the findings show that the whole country of Madagascar has witnessed drought throughout the past years' records (1891–2022). However, the duration, frequency, severity, and intensity of drought vary from one area to another. The analysis shows that the southern part of the country (R1) is more severely affected by drought events than the rest of the country, mainly for SPI-12 (Figs. 2, 3, 4, 5, 6). This region (R1) is characterized by a semi-arid climate with annual rainfall of less than 800 mm yr−1 and high annual mean air temperatures ranging between 23 and 27 °C (Randriatsara et al., 2022a). Regarding potential causes of the above-described drought features, Huang et al. (2017) stated that global warming was observed over the dry land, and the interdecadal variability in aridity changes is regulated by ocean oscillations, which alter the changes in air temperature and rainfall. The impact of a lack of rainfall in 2019 to 2021 resulted in a severe food security crisis over southern Madagascar, compounded by the already straining impacts of COVID-19 and pest infestation (Harrington et al., 2022). According to Harrington et al. (2022), based on a combination of observations and climate modeling, the increase in poor rainfall experienced over the southern part of Madagascar is not significantly linked to anthropogenic climate change because of the overwhelming amount of natural variability. However, if anthropogenic activities increase global mean temperatures by more than 2 °C above preindustrial levels, the changes in drought will be amplified (IPCC, 2021; Harrington et al., 2022). This confirms that even though anthropogenic activities have not been identified in a significant way as the main cause of changes in drought due to the domination of natural variability, the increase in such activities will clearly expose the amplification of drought events. Other studies on the underlying processes responsible for the strong impact of drought duration and frequency over the southern parts of Madagascar reported an influence of the El Niño–Southern Oscillation (ENSO), the Indian Ocean Dipole (IOD), and the sub-tropical IOD (SIOD) (Hoell et al., 2015; Hart et al., 2018; Barimalala et al., 2018; Randriatsara et al., 2022a). To illustrate, Randriatsara et al. (2022a) remarked that the enhanced (decreased) precipitation during wet (dry) years of the wet and dry seasons in Madagascar is mainly linked to a strong moisture convergence (divergence) accompanied by strong easterlies (anticyclonic circulations) over the northwestern (southern) Indian Ocean. The recent study by Barimalala et al. (2024) emphasized that the severe drought over southern Madagascar in 2019–2021 was linked to cold sea surface temperature (SST) anomalies (specifically the negative SIOD mode), which were the most negative anomalies in the past 4 decades during the rainy season of 2019 and 2020. All these factors mean that both anthropogenic activities and natural variability could have contributed to the drought severity increase over the southern part of the island.
Generally, drought characteristics across different regions of Africa reveal that Madagascar experiences the shortest drought duration for moderate, severe, and extreme drought categories compared to other climatic zones of Africa (Lim Kam Sian et al., 2023). However, the observed changes in drought characteristics during the recent past (1998–2017) are stronger over Madagascar than those in the distant past (1928–1957) (Tall et al., 2023). Moreover, this indicates that drought events have become more severe in recent years compared to earlier years in Madagascar. In support of this, the present study reveals that drought occurrences have become more consecutive over the country, specifically from 2017 to 2022, and have intensified over the southern part of the country. This finding aligns with the studies of Harrington et al. (2022) and Rigden et al. (2024), which emphasized the increases in drought characteristics over southern Madagascar. Overall, the changes in drought events have been noted over different regions of the world (e.g., Sheffield et al., 2012; Cook et al., 2020) and the African continent, with numerous studies (e.g., Masih et al., 2014; Nooni et al., 2021; Ayugi et al., 2022; Lim Kam Sian et al., 2023) reporting the heterogeneous patterns of severity, intensity, duration of occurrence, and frequency.
3.4 Impact of drought on vegetation
3.4.1 Monthly vegetation responses during the selected drought episodes
The analyses of the spatial distribution of the monthly NDVI anomalies within the three selected drought episodes are shown in Figs. 7, 8, and 9. During Event I (as shown in Fig. S3), droughts are less intense (i.e., most of the SPI ≥ −1). Moreover, the occurrences of simultaneous SPI values less than −1 across SPI-3, SPI-6, and SPI-12 over each region are infrequent (Fig. S3), which makes the connection between the first drought episode (or Event I) and vegetation losses (as represented by the NDVI anomalies in Fig. 7) difficult to detect. However, during Event II (as shown in Fig. S4), the connection between drought intensities and vegetation losses is well perceived. For instance, in February 2016 over the southern region (R1) (Fig. S3d–f), simultaneous occurrences of moderate drought (−1.49 ≥ SPI ≥ −1.0) across the three SPI timescales (SPI-3, SPI-6, and SPI-12) are detected, which led to severe vegetation losses (less than −0.21 of the NDVI) over the southern region, as displayed in Fig. 8b. Moreover, from January to February 2017 over the western (R2) and the eastern (R3) regions (Fig. S4g–i and S4j–l, respectively), simultaneous occurrences of severe to extreme droughts (SPI value between less than −2 and −1.5) across the SPI-3, SPI-6, and SPI-12 timescales are found. This led to severe vegetation losses of up to less than −0.18 of the NDVI over some parts of the western and eastern regions during these 2 months, as displayed in Fig. 8m and n. The southern region (R1), on the other hand, shows minimal vegetation losses (Fig. 8m and n) since almost no drought was detected during these 2 months over that region (Fig. S4d–f). Another case is seen in March 2017 over the western region (R2) (Fig. S4g–j); simultaneous moderate and severe drought occurs across the SPI-3, SPI-6, and SPI-12 timescales. This has impacted vegetation over the western part of the country in that month, as shown in Fig. 8o, with NDVI anomalies between −0.12 and −0.03. It is worth mentioning that other vegetation losses appear over different locations but with smaller magnitudes and cannot be well connected with SPI values compared to those previously mentioned. This could be due to the averaging of the SPI over each region, while the NDVI anomalies were computed spatially. Thus, only prominent negative SPI values show a significant connection with vegetation losses. Similarly, Event III (as shown in Fig. S5) shows perceivable connections between drought and vegetation losses in relation to prominent negative SPI values. Severe and extreme droughts are detected simultaneously across the SPI-3, SPI-6, and SPI-12 timescales over southern Madagascar (R1) (Fig. S5d–f) from November 2020 to February 2021, which led to severe vegetation losses of less than −0.24 of the NDVI (Fig. 9c, d, e, and f). Other severe and extreme droughts are found simultaneously across the SPI-3, SPI-6, and SPI-12 timescales from November 2021 to March 2022 over the southern region (R1), which triggered vegetation losses during these months (Fig. 9o–s). It is noticeable that the western region, R2, is affected by the losses during some of these months (such as in December 2021 and February 2022, Fig. 9p and r, respectively), as it relates to the prominent SPI values that occurred simultaneously during these 2 months across the SPI-3, SPI-6, and SPI-12 timescales, as shown in Fig. S5g–i. However, during December 2021 (Fig. 9p), almost the whole country is covered by the negative NDVI anomalies (less than −0.21), which are connected to the occurrence of drought, with simultaneous SPI values of less than −1 over the three regions and the whole Madagascar in that month, as shown in Fig. S5.
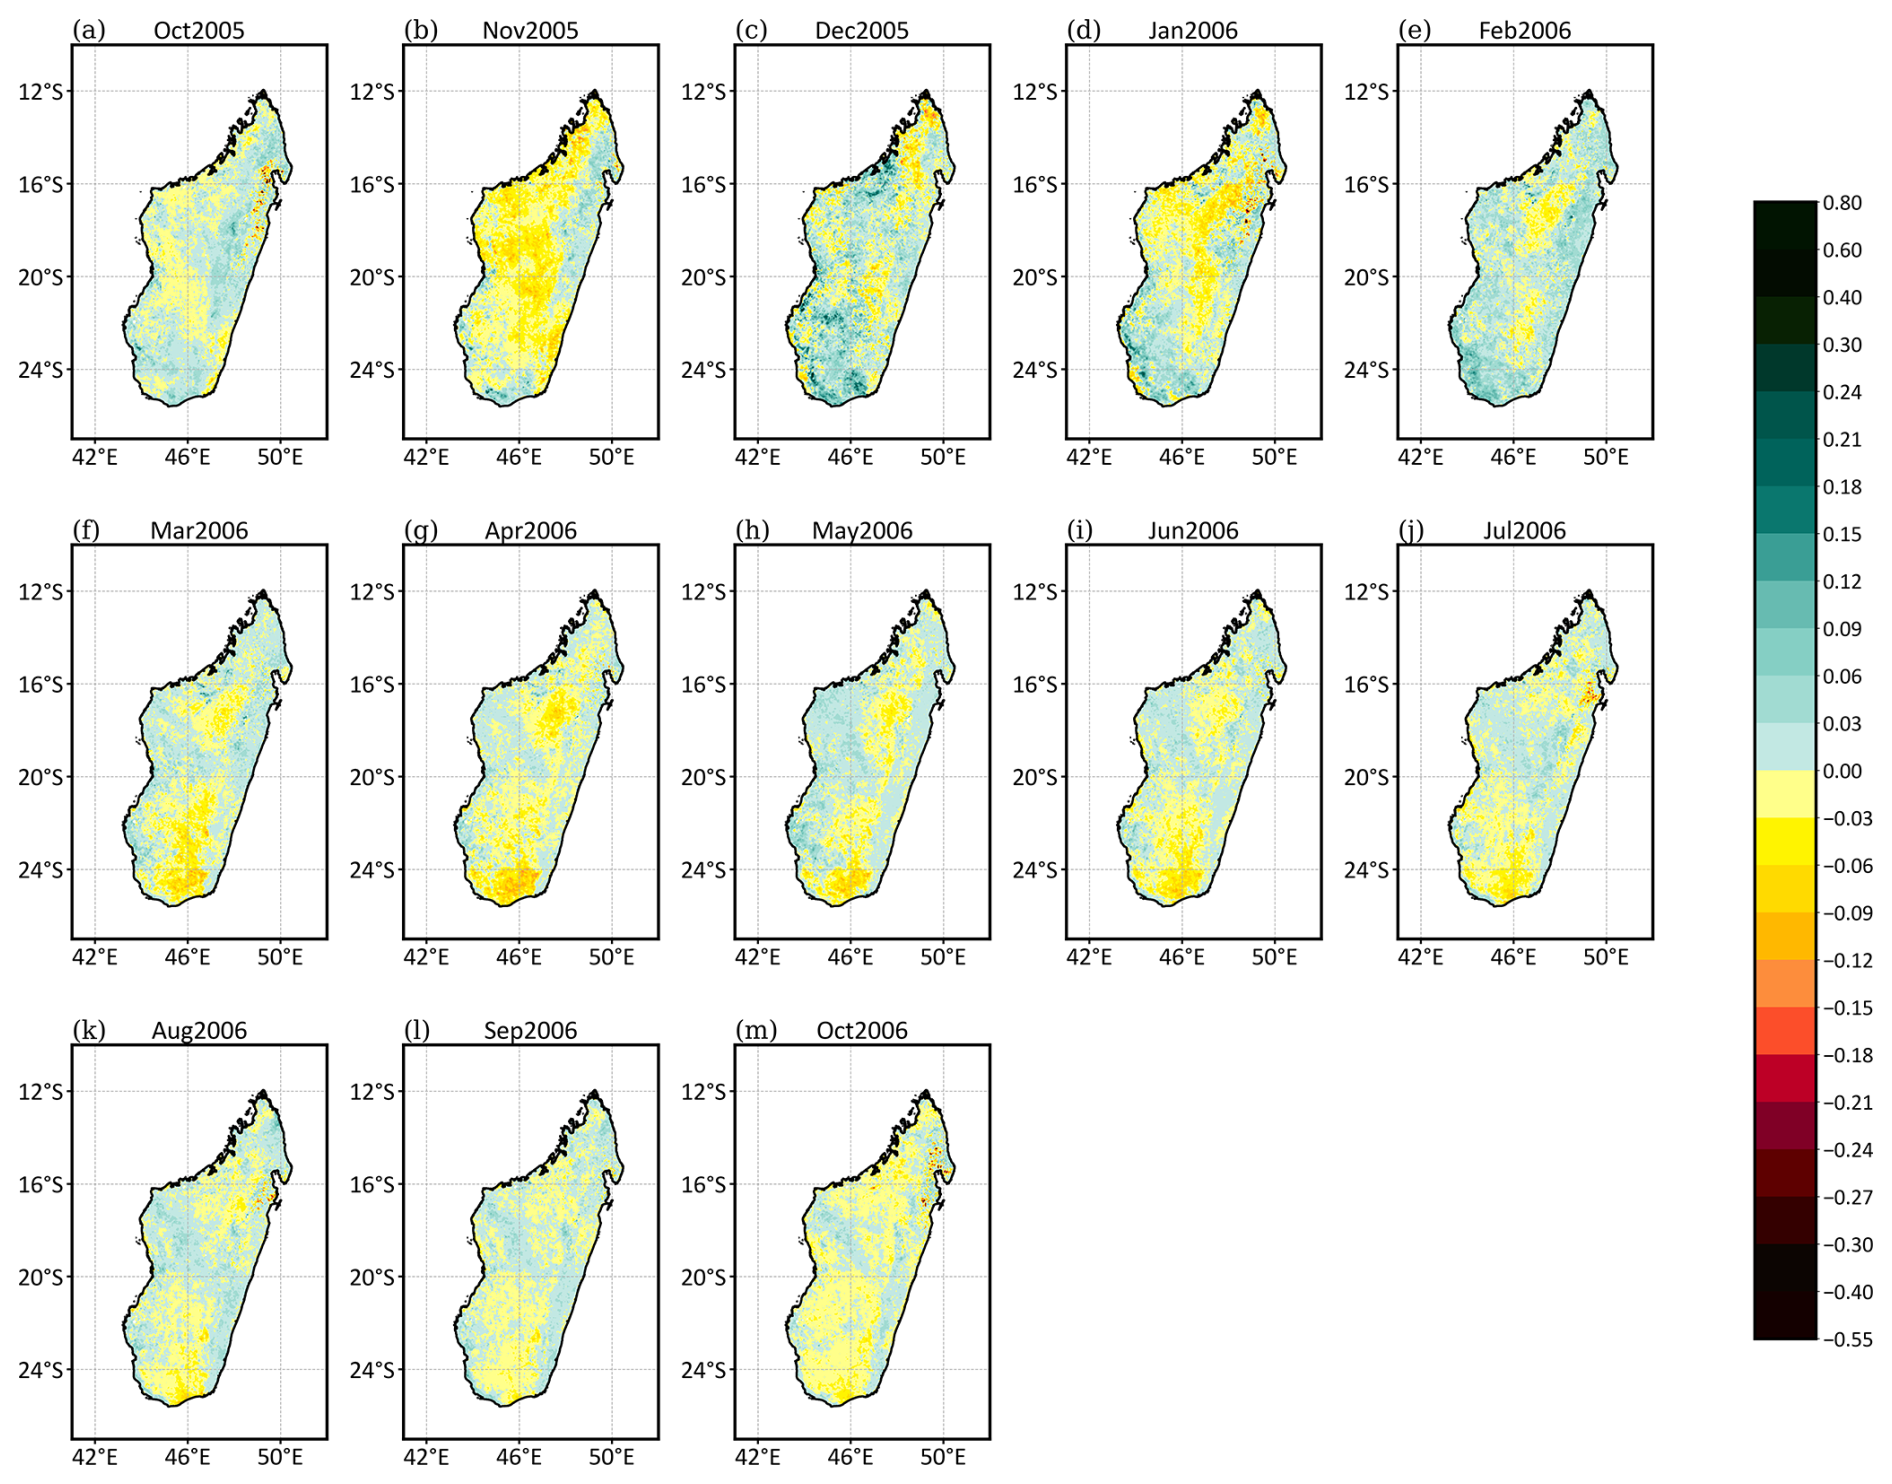
Figure 7NDVI difference between the selected month and the corresponding monthly mean over the study period 2000–2022 during Event I or the first drought episode. These months are taken from the SPI-3, SPI-6, and SPI-12 analyses and are marked within the green rectangles in Figs. 2 and S1.
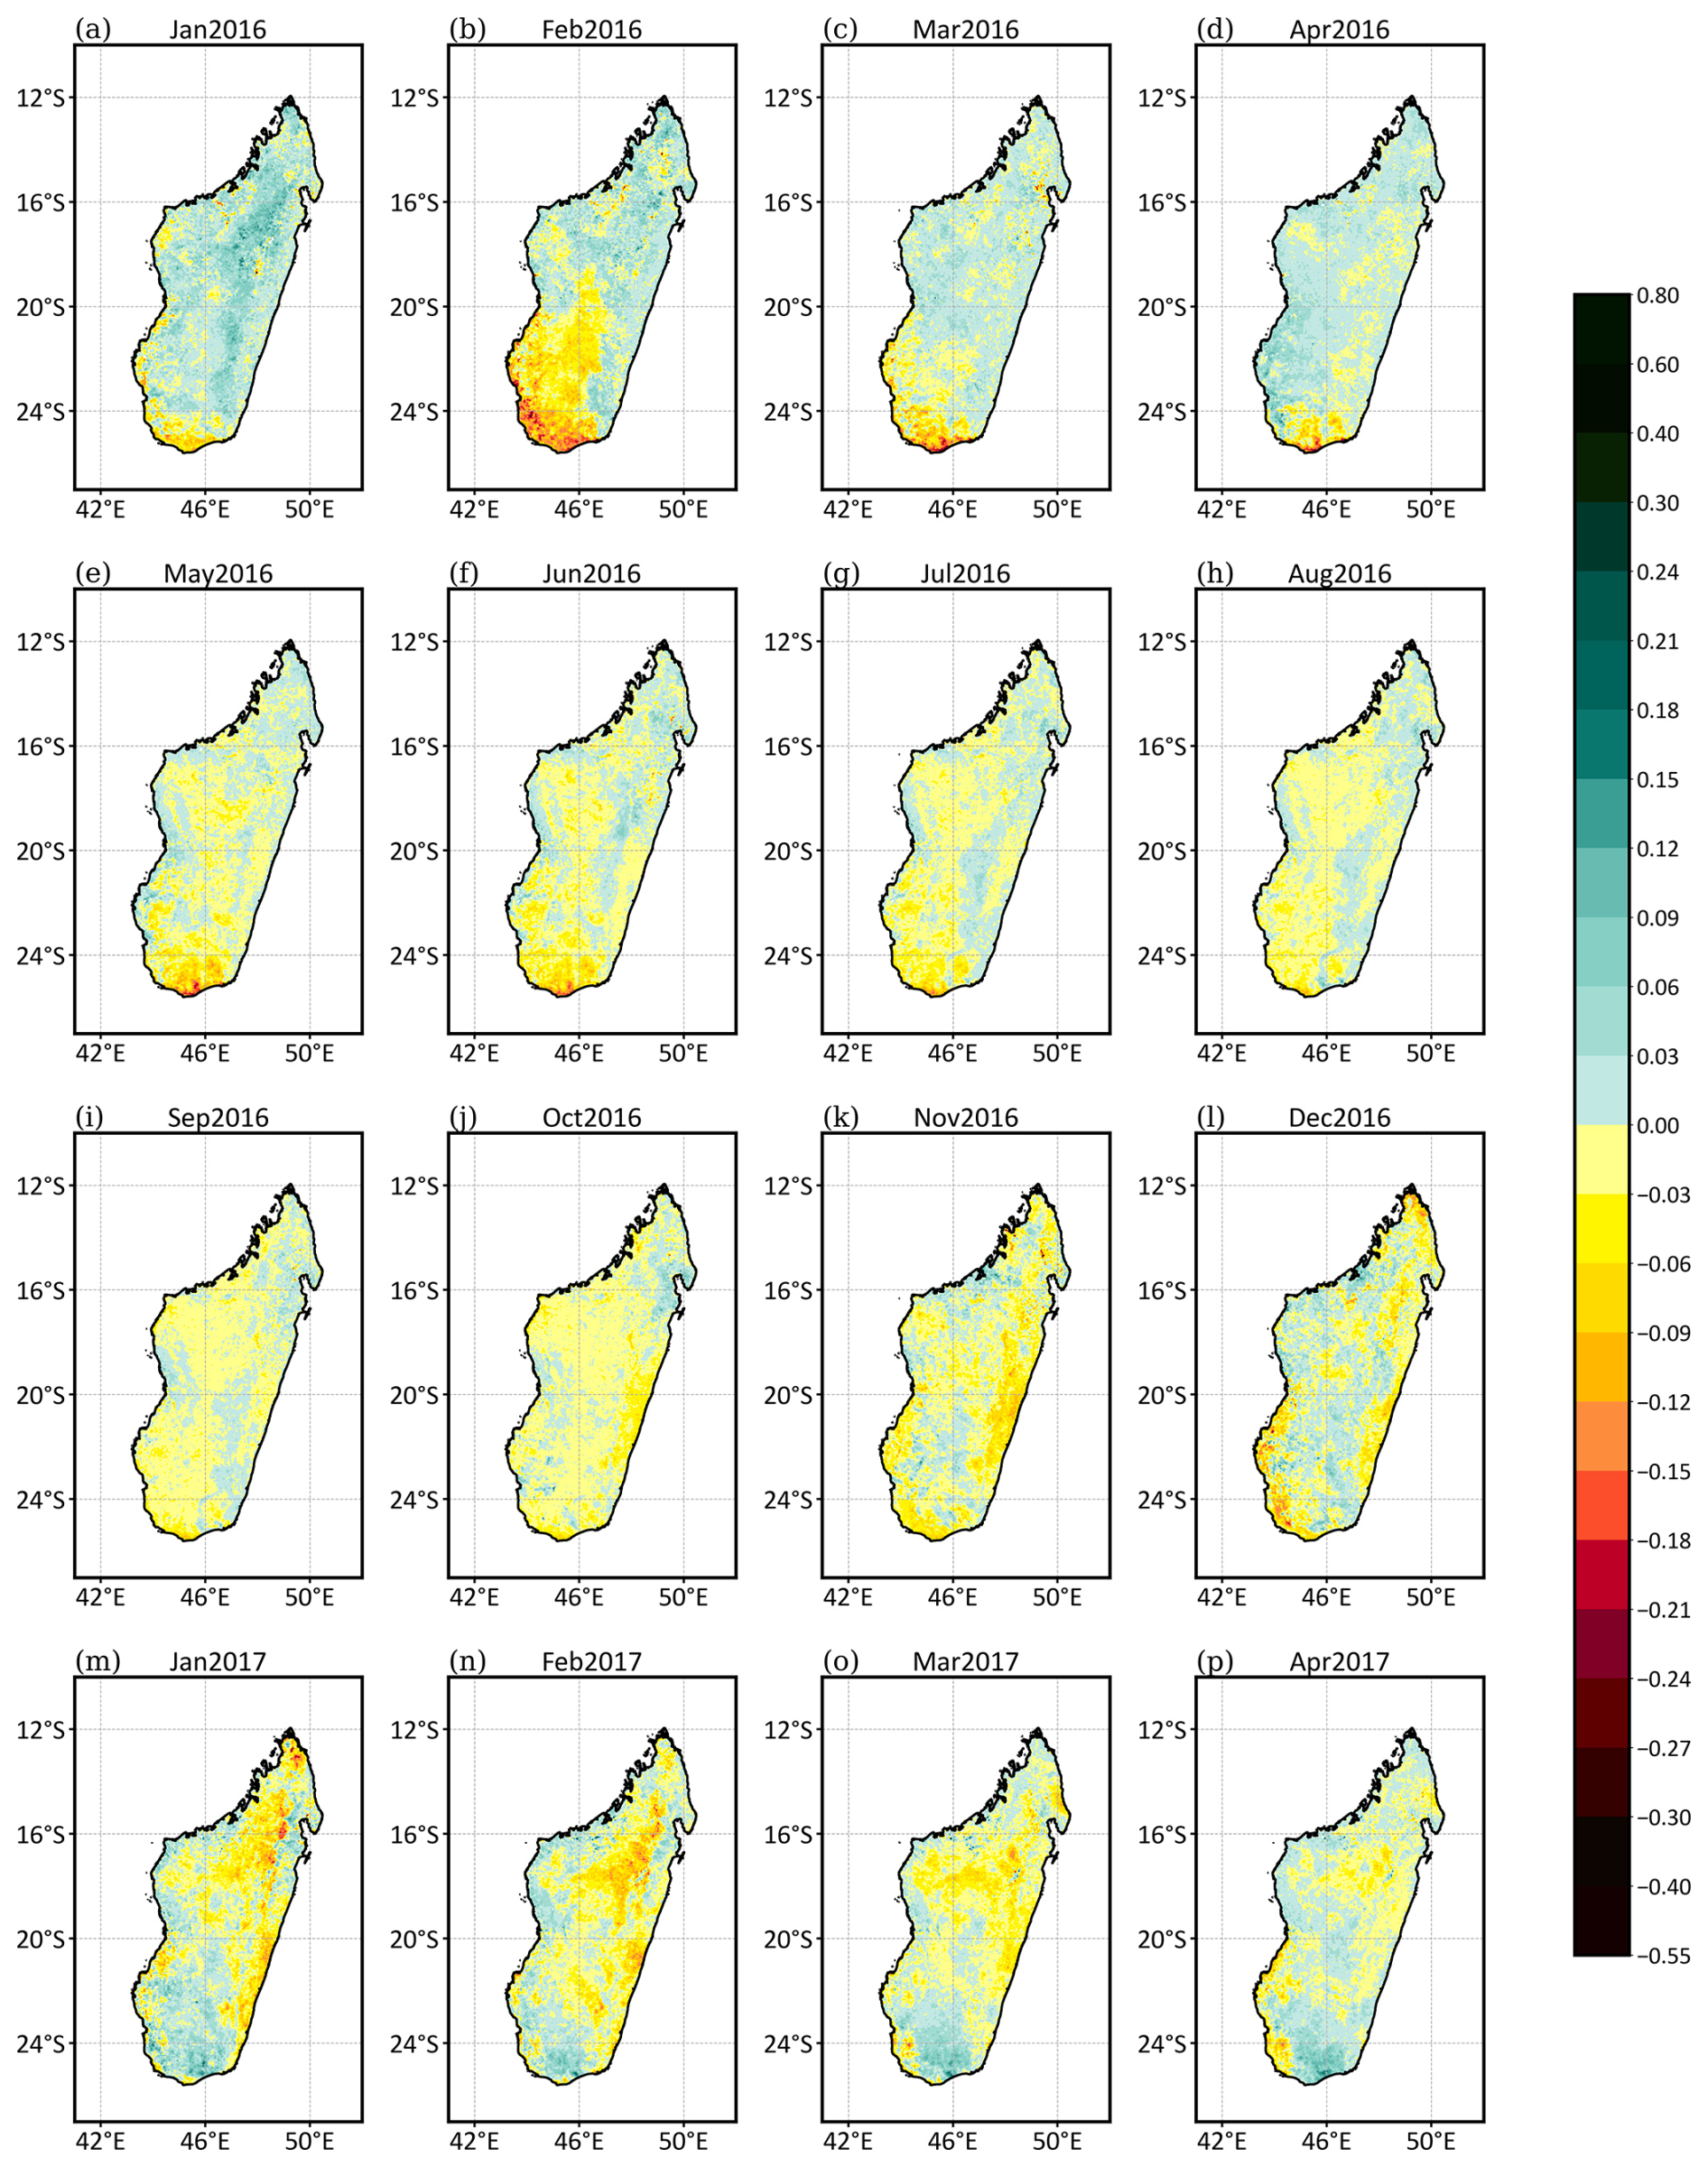
Figure 8Same as Fig. 7 but for Event II.
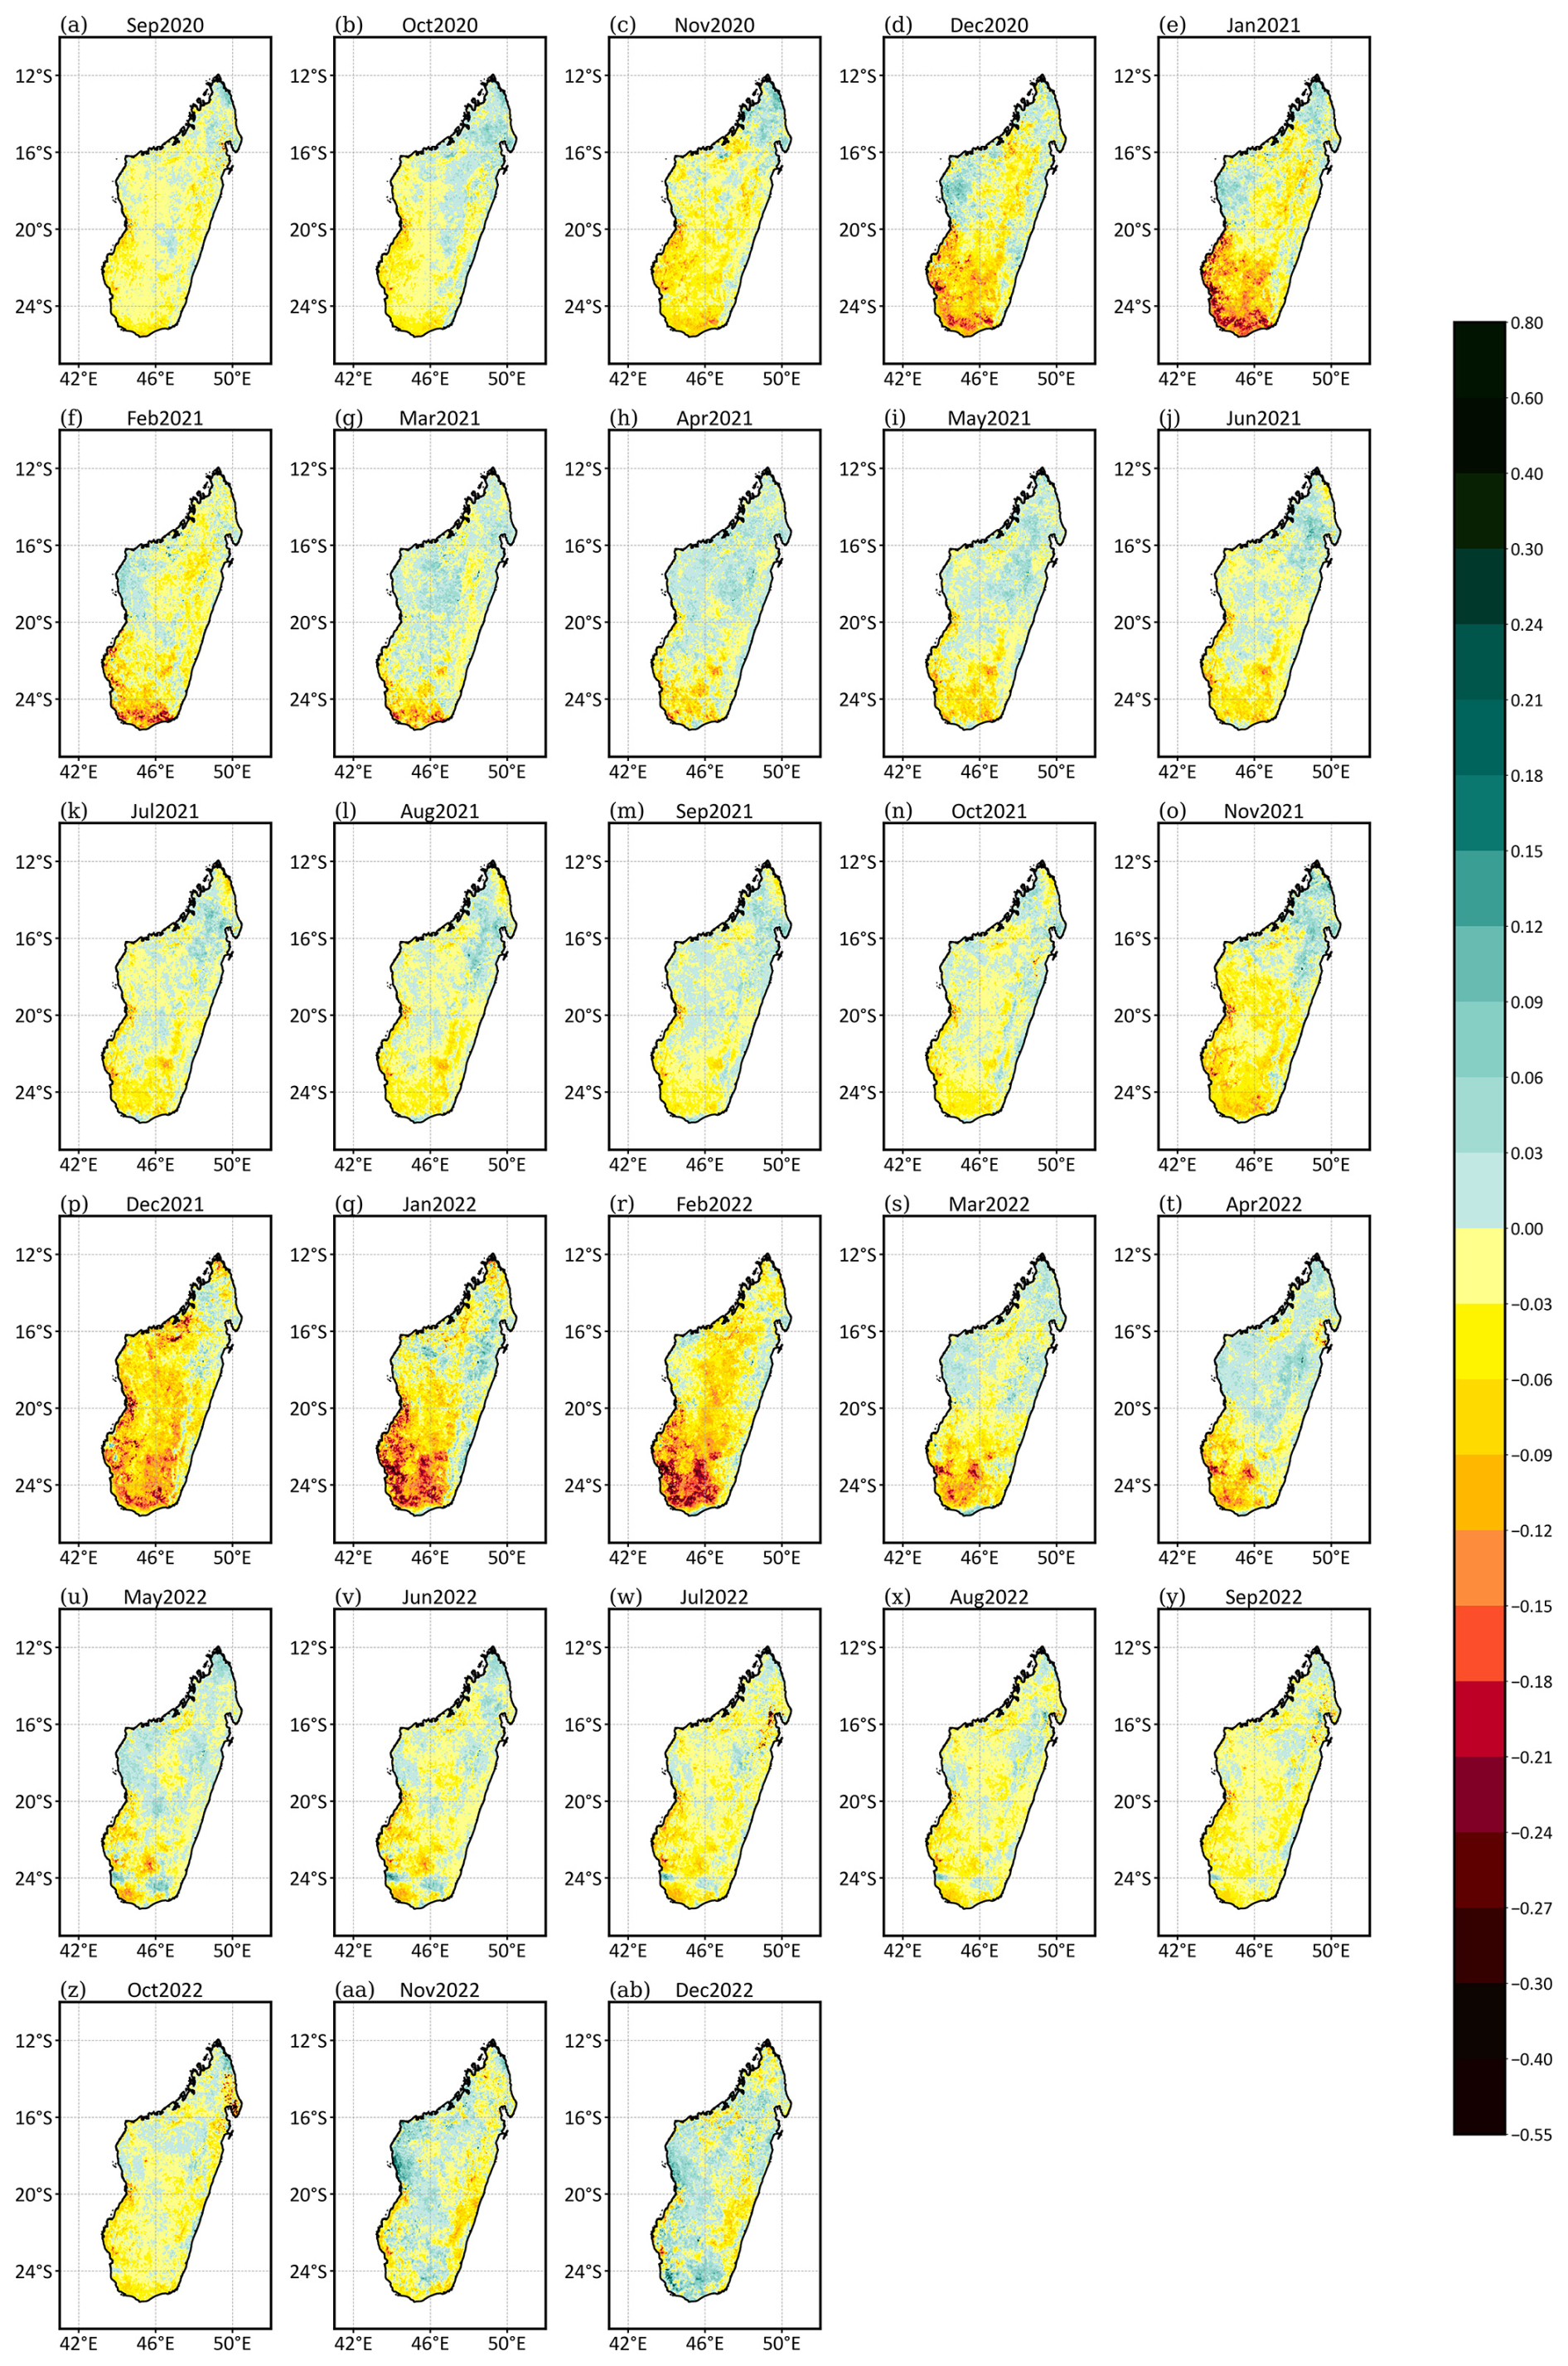
Figure 9Same as Fig. 7 but for Event III.
Overall, the analyses of monthly NDVI anomalies based on selected episodes from the SPI-3, SPI-6, and SPI-12 analyses display connections between vegetation changes and the prominent SPI values. Vegetation losses are severe and noticeable when prominent negative SPI values occur simultaneously across SPI-3, SPI-6, and SPI-12 over a region. It is also seen that vegetation losses intensify gradually from Event I to Event III (Figs. 7 to 9), and the most severe losses occur between December and February, especially over the southern region (R1), as shown during Event III (Fig. 9). These significant vegetation losses during December, January, and February (which are in the middle of the wet season: November–April) are apparently related to the changes in seasonal rainfall over Madagascar, specifically the delaying and shortening of the rainy season in recent years over the region (Harrington et al., 2022). It has been found that the delayed and shortened rain during the wet season influences vegetation decline over the southern region (Rigden et al., 2024). This is obvious since the dry season of the country lasts from May to October; however, the onset of the rainy season has been delayed until December and January, especially over the southern region, due to not only natural variability such as poleward migration of the mid-latitude jet (Rigden et al., 2024) but also anthropogenic climate change (Dunning et al., 2018; Rigden et al., 2024). Therefore, it is unsurprising that the southern region experiences more severe vegetation losses during these months compared to other regions. In addition to this analysis, spatial correlations between monthly NDVI anomalies and SPI values are performed in the last section of this study to quantitatively evaluate the connection between the SPI and NDVI over each grid point.
3.4.2 Yearly vegetation responses during the selected drought episodes
As mentioned in the methodology section, Event I and Event III are analyzed here. Figure 10 presents yearly NDVI anomalies of the selected years within Event I (Fig. 10i) and Event III (Fig. 10ii). Event I (starting in 2005 and ending in 2006, Fig. 10i) exhibits connections between the SPI values and the decrease in vegetation. As the SPI values for both the seasonal timescale and the annual timescale of 2006 are smaller than the ones of 2005 (Fig. S2), implying intensified drought, vegetation losses increased in 2006 compared to 2005 (Fig. 10i). For further illustration, in 2005 the western part (between 16 and 20° S) and some of the central parts of the country displayed negative NDVI anomalies of about −0.03, while the rest of the country recorded positive values between 0.03 and 0.21 (Fig. 10i.a). By 2006, the decrease in vegetation extended to larger areas over the southern region, with an increased intensity of NDVI anomalies of up to −0.09 (Fig. 10i.b). This is connected with the annual SPI analysis in Fig. 5iii.a, which shows that in 2005 over the southern region (R1), the SPI value is positive, implying an increase in vegetation, as shown in Fig. 10i.a. On the other hand, a negative SPI value of less than −1 is found in 2006 over the southern region (Fig. 5iii.a), resulting in vegetation losses (Fig. 10i.b). During Event III (Fig. S2), the SPI values for each year do not decrease or increase simultaneously across the seasonal and annual timescales as during Event I, but continuous and simultaneous prominent negative SPIs do occur. Thus, vegetation losses cannot be seen to clearly intensify from the starting year (2020) to the ending year (2022) of Event III (Fig. 10ii). However, it is well perceived that during Event III, a larger part of the country shows a decrease in vegetation, in which the southern region (R1) is affected by higher losses of up to −0.21 of the NDVI (Fig. 10ii). This is confirmed through the annual SPI analysis over each region in Fig. 5iii, in which the southern region (R1) exhibits smaller SPI values than the other regions. In 2020 (Fig. 10ii.c), the southern region exhibits negative NDVI anomalies between −0.12 and −0.03, with some areas over the southwestern part showing values of −0.15, while the northern part is sparsely mixed, with negative and positive anomalies ranging from −0.12 to 0.18. In 2021 (Fig. 10ii.d), the areas with negative anomalies expanded to the eastern and western parts. However, by 2022 (Fig. 10ii.e), the area with negative NDVI anomalies reduced but with increased values of up to −0.18 over the southern region.
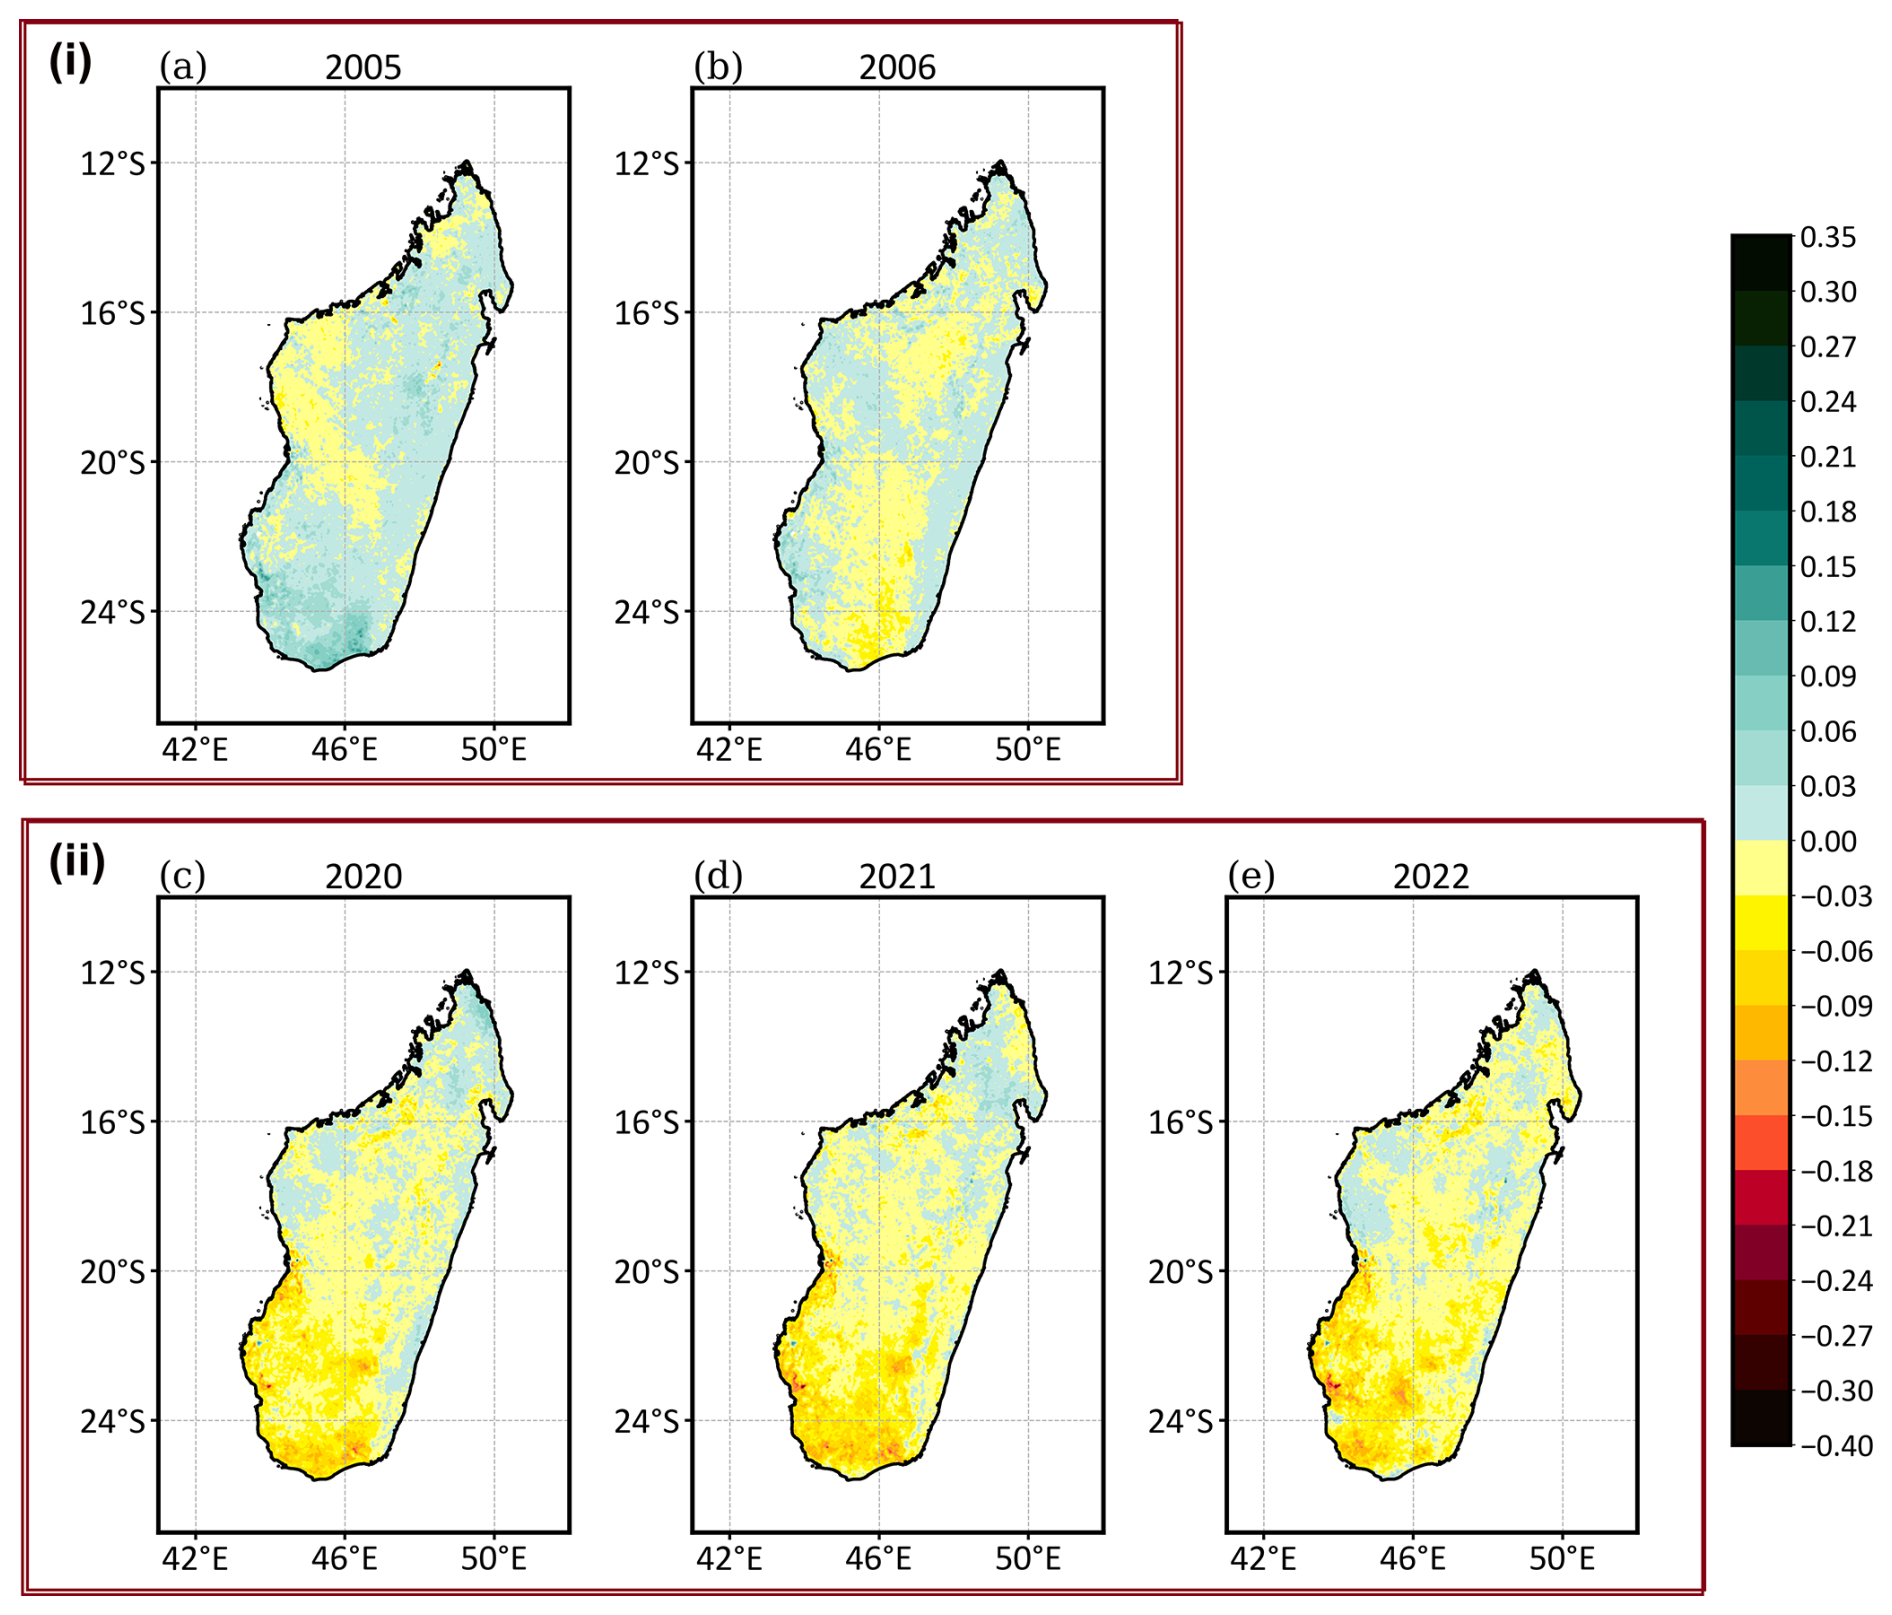
Figure 10Annual NDVI differences (anomalies) between the selected years and the yearly mean NDVI throughout the whole study period during (i) Event I and (ii) Event III. The years are selected based on the continuous and simultaneous negative SPI values found during the seasonal and annual analyses from Fig. S2, as marked with green rectangles.
These results suggest that the annual NDVI anomalies are closely connected to annual SPI analyses when the occurrences of droughts are prominent (SPI values of less than −1) over a region. In other words, the findings indicate that occurrences of prominent negative values during annual SPI can be used to examine annual vegetation changes over Madagascar. This agrees with other studies (Nicholson et al., 1990; Camberlin et al., 2007; Zhang et al., 2023), which demonstrated that the interannual variations in vegetation cover are correlated with annual and seasonal rainfall fluctuations.
3.4.3 Seasonal vegetation responses during the selected drought events
Another perspective on the impact of drought on vegetation is presented in Fig. 11, which shows seasonal NDVI anomalies during Event I and Event III. During Event I (Fig. 11i), the wet-season NDVI anomalies (Fig. 11i.a and b) show smaller areas with negative anomalies between −0.06 and −0.03 in 2005, which expanded to larger areas in 2006. A similar result has been found during the yearly NDVI anomalies of Event I due to the intensified drought in 2006 compared to 2005 during the seasonal and annual SPI (Fig. S2). The dry season of Event I (Fig. 11i.f and g) confirms the same finding, since in 2006, the areas affected by drought became larger than in 2005. It is also seen that during Event I, the areas affected by vegetation losses during the wet season (Fig. 11i.a and b) are smaller than during the dry season (Fig. 11i.f and g). During Event III, the intensities of vegetation loss during the wet seasons (Fig. 11ii.c, d, and e) are higher by up to −0.24 of the NDVI, specifically over the southern part of the country (R1), compared to during the dry seasons (Fig. 11ii.h, i, and j). This is connected with seasonal SPI values, which display smaller negative SPI values over R1 during the wet season (Fig. 5i.a) than during the dry season (Fig. 5ii.a) (refer to Event III: years 2020, 2021, and 2022). Moreover, by considering the spatial spread of vegetation losses, larger areas are affected during the dry season (Fig. 11ii.h, i, and j), though the losses are not severe, than during the wet season (Fig. 11ii.c, d, and e). This is the same as during Event I and could be related to the fact that when rainfall is minimal during the dry season, vegetation losses expand to larger areas but with a non-severe impact since the dry season's vegetation is more resilient to drought than the wet season's vegetation. In addition, it is evident that the wet season's vegetation over the southern region (R1) (Fig. 11ii.c, d, and e) is highly vulnerable to droughts since this is the season when vegetation should grow abundantly, though the region is affected by severe droughts during Event III (Fig. 5i.a, refer to years 2020, 2021, and 2022). Overall, the results suggest that the seasonal NDVI anomalies are closely connected to seasonal SPI analyses, when the occurrences of droughts are prominent (SPI values less than −1) over a region. This is perceived over the southern region (R1) during the wet season of Event III (Fig. 5i.a). On the other hand, when the SPI values are larger than −1 or even positive over a region, an increase in vegetation is seen. This can be seen, for example, during the wet season of Event I over the southern region (R1) in 2005 (Fig. 11i.a), where vegetation gains are observed. These gains are connected with a positive SPI value during the wet-season SPI analysis in 2005 over R1 (Fig. 5i.a).
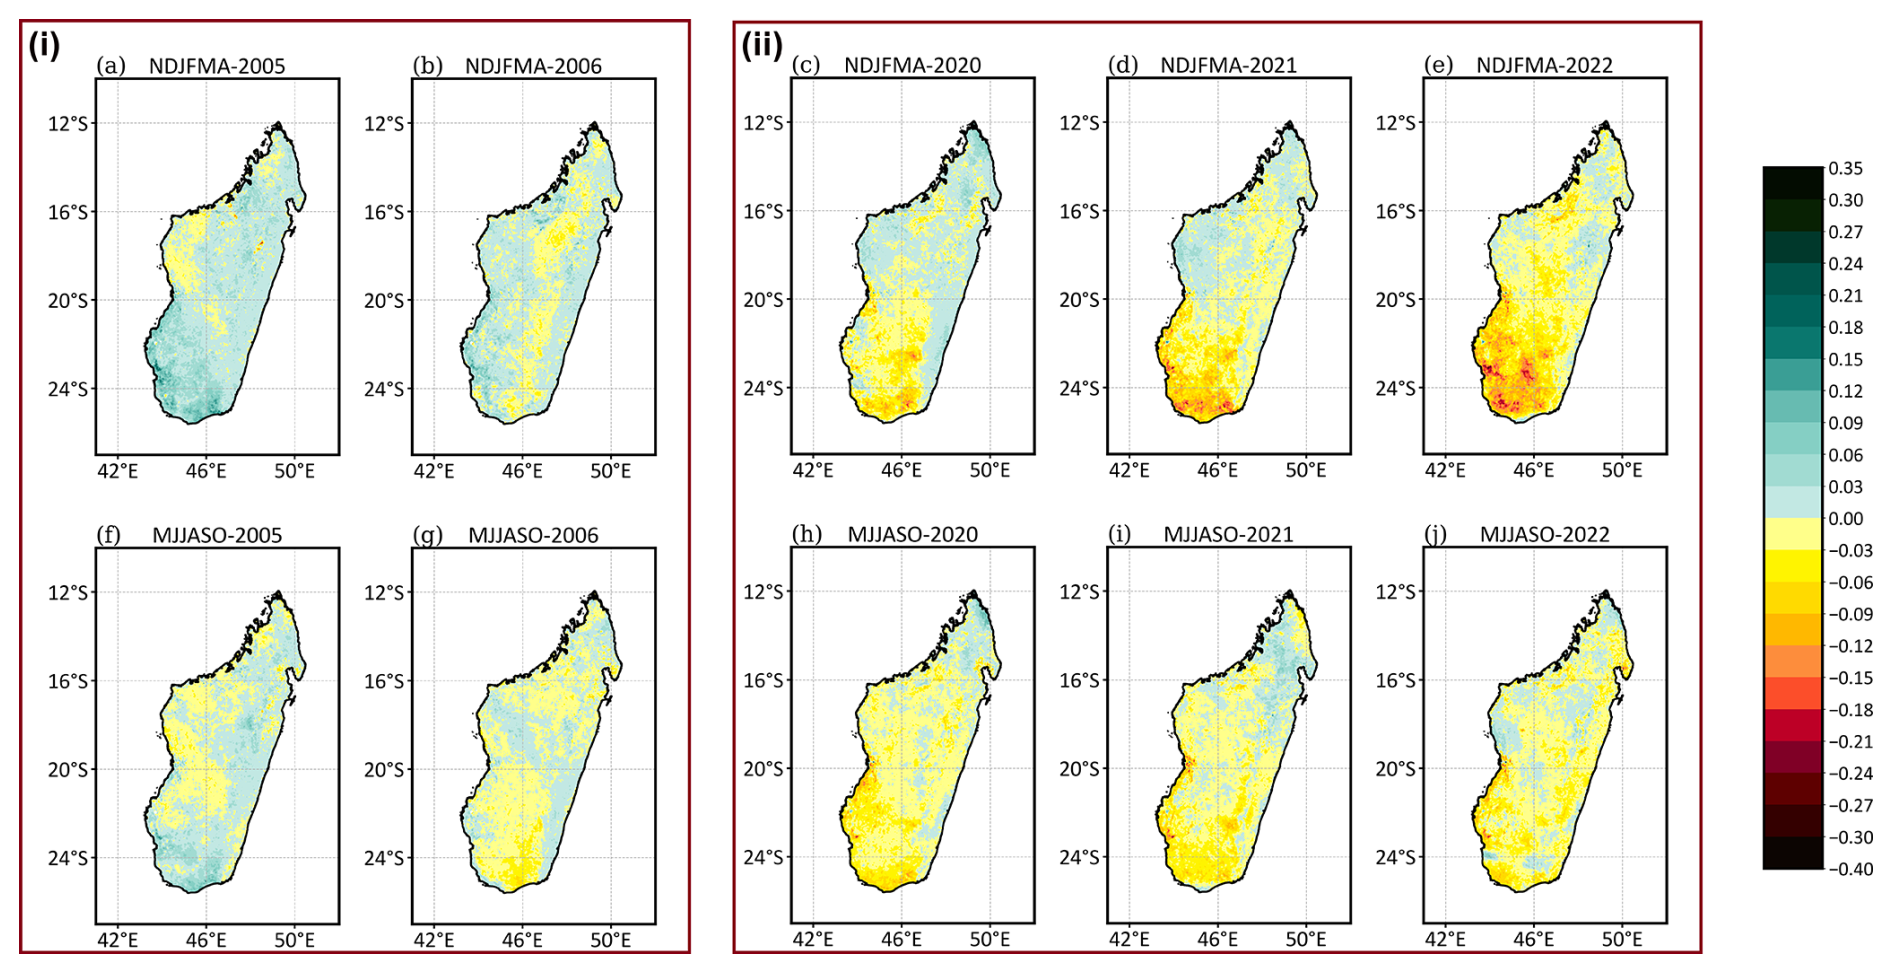
Figure 11Seasonal NDVI differences (anomalies) between the seasons of the selected years and seasonal NDVI mean throughout the study period during (i) Event I and (ii) Event III. The years are selected based on the continuous and simultaneous negative SPI values found during the seasonal and annual analyses from Fig. S2, as marked with green rectangles. The first row represents anomalies during the wet season, and the second row represents anomalies during the dry season.
The severe vegetation decrease found over southern Madagascar necessitated further analysis of the temporal development of annual mean NDVI in Fig. 12. Obviously, the highest NDVI values are seen for the eastern region (R3), which is the rainy forest region, followed by the western region (R2) and the southern region (R1), with the lowest NDVI amounts. This clearly corresponds to the ecoregions and climatic types over Madagascar (Burgess et al., 2004; Desbureaux and Damania, 2018). Regarding the interannual variability, rather stable annual mean values of the NDVI, ranging from 0.62 to 0.66 (0.46–0.48), are seen over R3 (R2) (Fig. 12). However, a considerable decline in the NDVI has occurred over R1, with decreasing values from 0.44 to 0.35 by the end of the study period (Fig. 12). The linear trend for R1 is statistically significant at the 95 % confidence level, with a p value of about 0.00006877. To better detect this interannual NDVI decline over southern Madagascar, temporal development of monthly NDVI values is performed in Fig. S6. It shows that the variability over R2 and R3 is rather low, even for the monthly values. However, R1 exhibits a noticeable vegetation decrease from November to March (Fig. S6). The peak of the decline is captured in January, in which an NDVI of about 0.55 is recorded in 2000, which reduces to about 0.32 in 2022. This severe decline found in January and February in the most recent years over southern Madagascar could be due to the delayed onset of the wet-season rainfall over the region, as explained previously, which is caused by natural variability (Harrington et al., 2022; Rigden et al., 2024) and anthropogenic climate change (Dunning et al., 2018; Rigden et al., 2024). Moreover, these latter analyses (Fig. 12 and Fig. S6) show that the vegetation decline over the southern region intensifies in the most recent years (2019–2022). It has already been noted from SPI analysis (Figs. 2–5) that the latest years are characterized by severe droughts, which influenced the NDVI trend analysis, specifically over the southern region. This could be among the reasons for the severe vegetation decline over the southern region in the most recent years of the study period (see also Sect. 3.1).
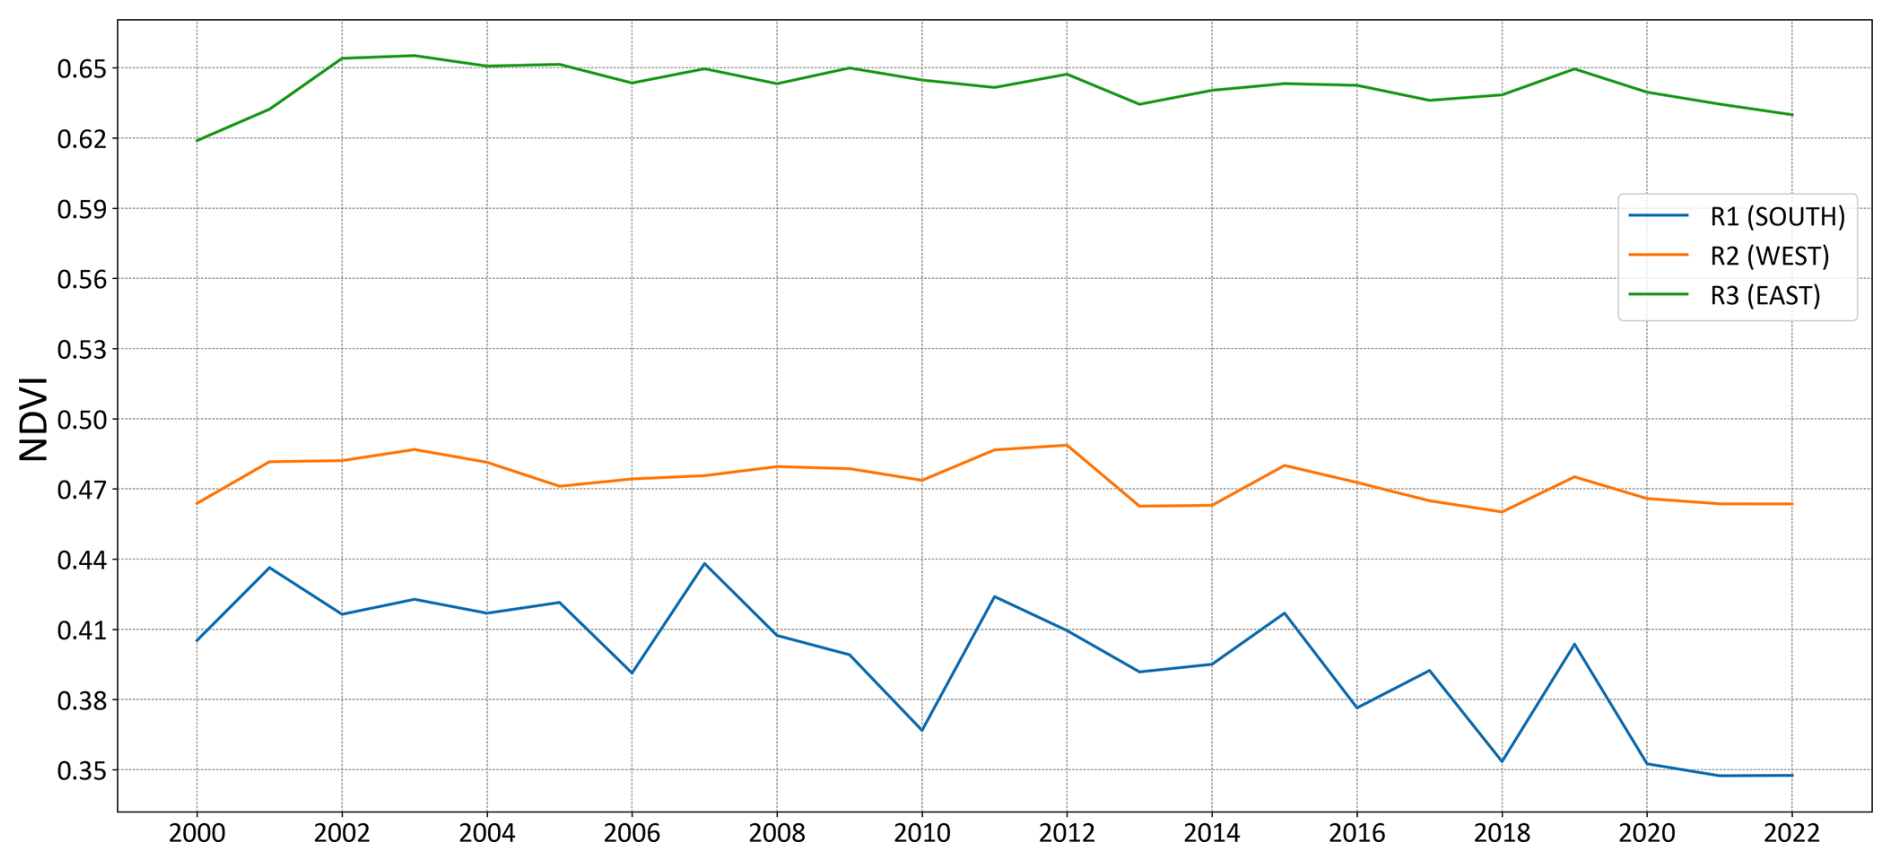
Figure 12Interannual variability in the NDVI over different regions of Madagascar: R1, south; R2, west; and R3, east.
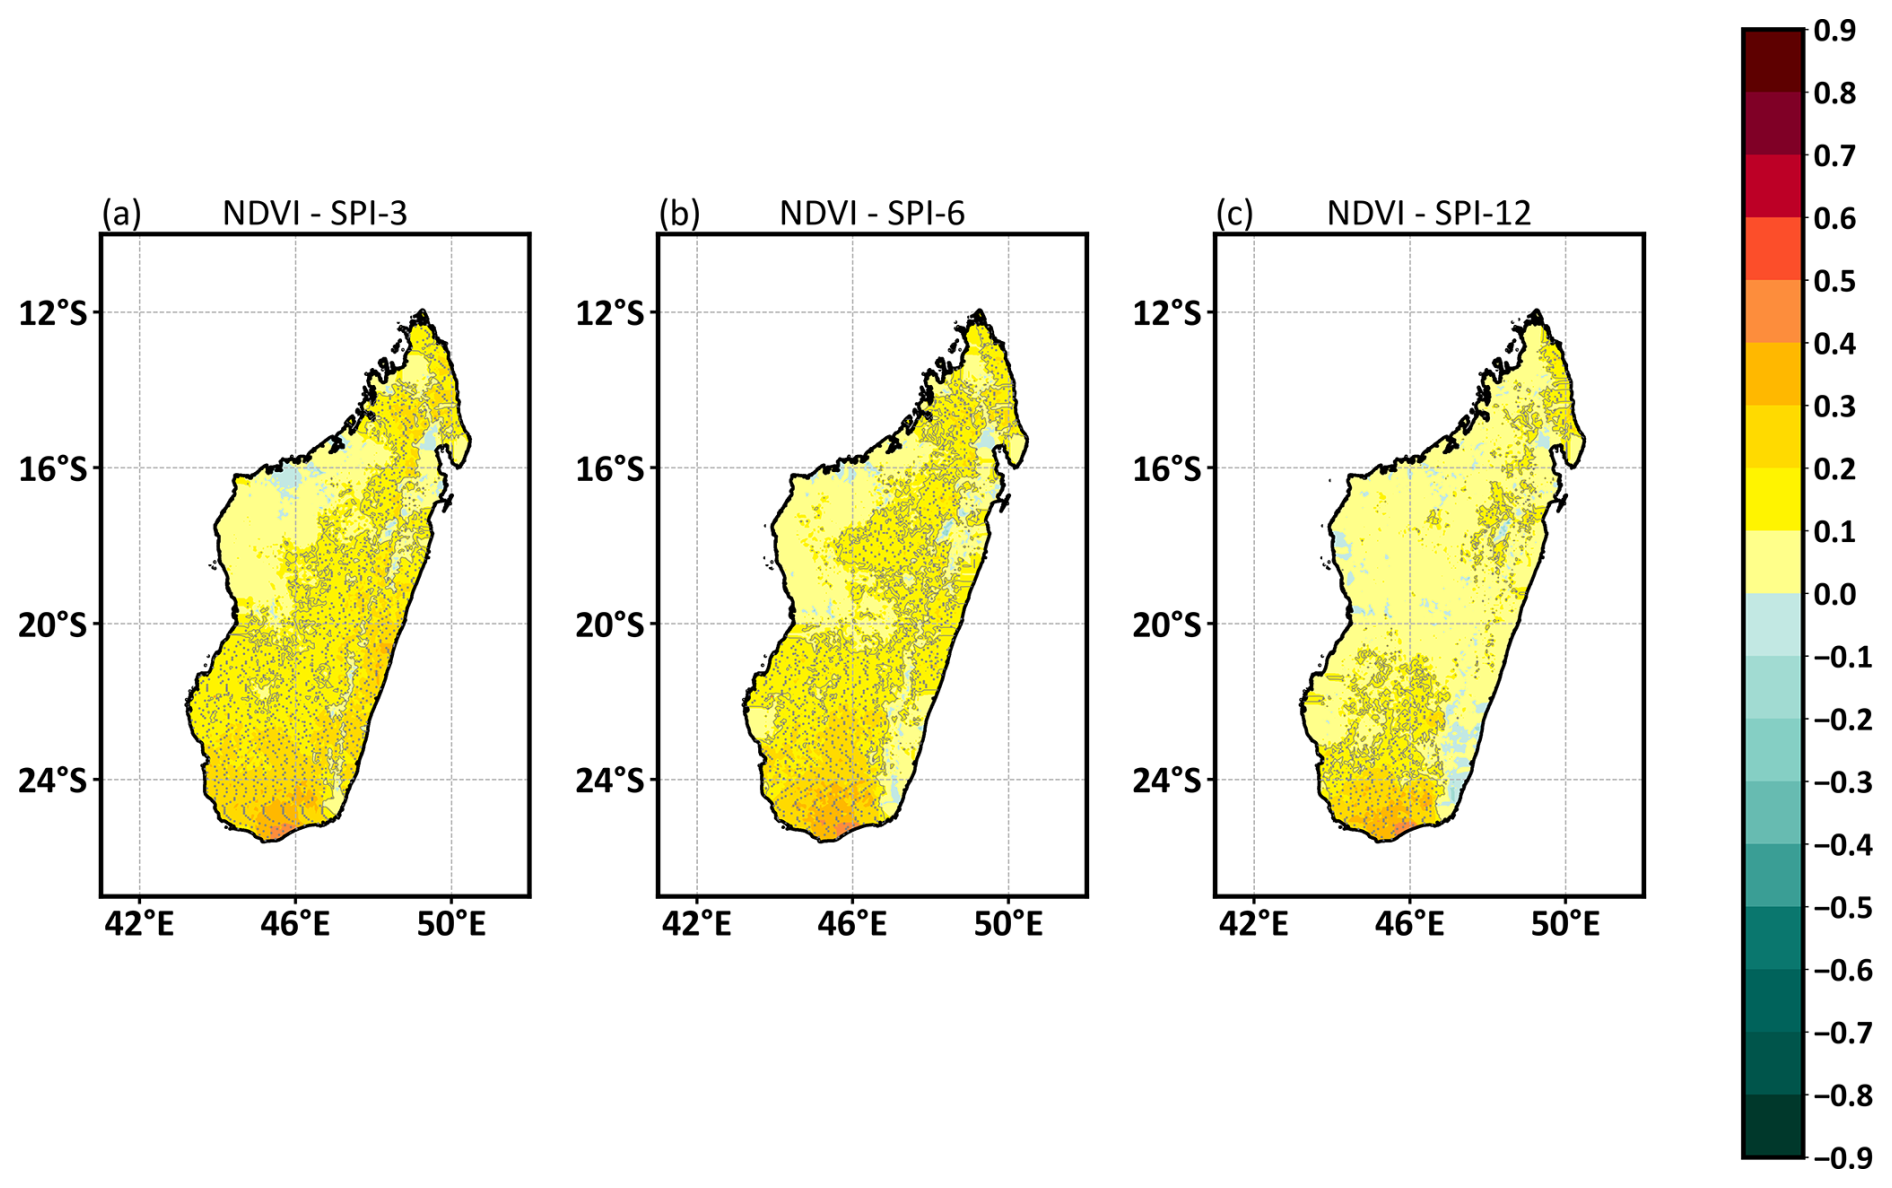
Figure 13Spatial distribution of the Pearson correlation between the detrended NDVI anomaly and the drought index for all three timescales (SPI-3, SPI-6, and SPI-12). Dotted areas are statistically significant at the 95 % confidence level using Student's t test.
3.4.4 Correlation between the SPI and NDVI
To assess the NDVI–SPI relationship in a quantitative way, we calculated correlations between the two variables over the period 2000–2022 (see Sect. 2.3.4). Temporal correlation analyses based on Pearson and Spearman coefficients (Fig. S7) were performed between the NDVI anomaly and each SPI timescale (SPI-3, SPI-6, and SPI-12) over each region. The results show a positive correlation over all regions. However, it is worth mentioning that the southern region (R1) exhibits higher correlation coefficient values of about 0.12 to 0.21 compared to R2 and R3 (between 0.04 and 0.19). This suggests that, even though low correlation coefficients are found, there is a connection between vegetation changes and the occurrence of drought events, although the connection is more emphasized over the southern region (R1) than over the other two regions. To better identify the connection between the NDVI anomaly and each SPI, spatial distributions of Pearson correlation are performed in Fig. 13. For the case of SPI-3 and SPI-6 (Fig. 13a, b), more than half of the country exhibits a statistically significant correlation at the 95 % confidence level, with values of correlation between 0.1 and 0.5. However, for SPI-12, the correlation is only significant over the southern region and some parts of the northern region (Fig. 13c). This suggests that drought occurrences impact vegetation cover, especially over the southern region. It is worth mentioning that, even though the correlation coefficient values are generally low (i.e., less than 0.5), they are statistically significant at the 95 % confidence level. This indicates that drought occurrences are indeed among the factors contributing to Madagascar's vegetation changes; i.e., the below-average NDVI is, to a certain extent, connected to lower precipitation amounts and drought occurrence (evaluated using the SPI). However, changes in vegetation are caused not only by drought but also by other factors, such as human-induced deforestation, as the population relies heavily on fuelwood. Moreover, drought also leads to deforestation as farmers clear local forests due to the adverse effects of drought on agricultural productivity (Desbureaux and Damania, 2018). The latter could be among the reasons for the higher positive correlation coefficients found between the vegetation index and drought index over southern Madagascar (Fig. 13) due to the occurrence of more frequent and intense drought over that region. Moreover, Duku and Hein (2021) reported that significant human-induced deforestation over local and non-local areas is among the factors that lead to a shortening of the wet-season rainfall over southern Madagascar. This is obvious since deforestation has an indirect effect on trends in water availability by interacting with the atmosphere, as warming and drying tend to be caused by deforestation, resulting in precipitation decreases (Butt et al., 2011; Wright et al., 2017). Additionally, according to the reviews by Staten et al. (2020) and Xian et al. (2021), the expansion of the Hadley cell in response to anthropogenic climate change leads to the drying condition of southern Madagascar. All of these factors, which trigger precipitation reductions, worsen vegetation losses over the southern region compared to other regions of the country. On the other hand, the vegetation of western Madagascar shows a weaker correlation with the drought index for all three SPI timescales. This could be due to the vegetation characteristics of the region, which is a dry forest that is able to survive even under dry conditions (Desbureaux and Damania, 2018; Lawal et al., 2021).
In summary, the aim of this study was twofold. Firstly, we analyzed the temporal development of the SPI over Madagascar during 1981–2022 and the spatial distribution of drought characteristics (duration, frequency, severity, intensity). Secondly, we assessed the relationship between the SPI and NDVI during 2000–2022, representing the impact of drought on vegetation over the studied area.
- i.
This study reveals that drought occurrences have become more severe over the entire country, specifically during the most recent past (2017 to 2022), and have intensified over the southern part of the country. This finding aligns with what has been found by Harrington et al. (2022), Tall et al. (2023), Rigden et al. (2024), and Barimalala et al. (2024).
- ii.
The study also confirms that the analysis of monthly NDVI anomalies based on selected episodes from SPI-3, SPI-6, and SPI-12 analyses displays connections between vegetation changes and prominent SPI values. Vegetation losses are severe and noticeable when prominent negative SPI values occur simultaneously across SPI-3, SPI-6, and SPI-12 over a region. This can be used to examine monthly vegetation changes over Madagascar. Moreover, the impact of drought on seasonal and annual vegetation can be detected by computing seasonal and NDVI anomalies based on prominent negative SPI values from seasonal and annual SPI analyses over a region. In other words, the findings indicate that occurrences of prominent negative values during seasonal and annual SPI analyses can be used to examine seasonal and annual vegetation changes over Madagascar.
- iii.
The relationship (quantified by the correlation) between vegetation and the drought index is the strongest over the southern region, whereas in the western region the correlation is lower. Among other reasons, we hypothesize that this could be due to different vegetation types. The dry forest over the western part of Madagascar is less vulnerable to drought than the forests in the southern and eastern regions. Moreover, the link found between more severe drought and vegetation losses over southern Madagascar (R1) compared to the western (R2) and eastern (R3) regions could be due to diverse factors that contribute to a rainfall deficit over the region. These factors delay and shorten seasonal rainfall and are caused by both natural variability (Harrington et al., 2022; Rigden et al., 2024) and anthropogenic climate changes (Dunning et al., 2018; Rigden et al., 2024).
There are potentially other climatic factors influencing vegetation besides drought, e.g., changes in air temperature distribution and humidity, possibly connected to some large-scale circulation changes. Furthermore, there are probably non-climatic anthropogenic factors that influence vegetation, mainly deforestation and agricultural activities in the area. However, the analysis of these factors is beyond the scope of the present study and will be considered in future research.
Drought characteristic computation codes are available upon request from the main author, Herijaona Hani-Roge Hundilida Randriatsara. The SPI calculation is available on the NCL website at https://doi.org/10.5065/D6WD3XH5 (The NCAR Command Language, 2019).
The ERA5 dataset is available on the Copernicus Climate Change Service (C3S) website at https://doi.org/10.24381/cds.68d2bb30 (Copernicus Climate Change Service, 2022). The CHIRPS v2.0 data are available at https://data.chc.ucsb.edu/products/CHIRPS-2.0/global_monthly/netcdf/chirps-v2.0.monthly.nc (Funk et al., 2015). The NDVI time series with monthly time steps were retrieved from the Earthdata website using the AppEEARS tool (https://appeears.earthdatacloud.nasa.gov/ (last access: 9 October 2023) and are freely available at https://doi.org/10.5067/MODIS/MOD13C2.061 (Didan, 2021). The output datasets can be accessed at https://doi.org/10.5281/zenodo.15584300 (Randriatsara et al., 2025).
The supplement related to this article is available online at https://doi.org/10.5194/nhess-25-2939-2025-supplement.
HHRHR: conceptualization, data curation, formal analysis, methodology, writing (original draft). EH: conceptualization, project administration, review and editing, supervision, funding acquisition, validation. KR: data analysis, software and scripts. HB: data analysis, software and scripts. MFTR: software and scripts. KRP: writing (review and editing). DA: writing (review and editing). BOA: conceptualization, writing (original draft and review and editing).
The contact author has declared that none of the authors has any competing interests.
Publisher's note: Copernicus Publications remains neutral with regard to jurisdictional claims made in the text, published maps, institutional affiliations, or any other geographical representation in this paper. While Copernicus Publications makes every effort to include appropriate place names, the final responsibility lies with the authors.
The authors are grateful to OP Johannes Amos Comenius (OP JAC), which supports this research, and to the data centers for providing the datasets that were so instrumental in accomplishing this work.
This research has been supported by the Ministry of Education, Youth and Sports (MEYS, MŠMT in Czech) through OP Johannes Amos Comenius (OP JAC), natural and anthropogenic georisks (grant no. CZ.02.01.01/00/22_008/0004605).
This paper was edited by Anne Van Loon and reviewed by two anonymous referees.
Ayugi, B. O., Eresanya, E. O., Onyango, A. O., Ogou, F. K., Okoro, E. C., Okoye, C. O., Okenwa, E. O., Siyanbola, W. A., Maduako, R. E., and Akintoye, S. A.: Review of meteorological drought in Africa: historical trends, impacts, mitigation measures, and prospects, Pure Appl. Geophys., 179, 1365–1386, https://doi.org/10.1007/s00024-022-02988-z, 2022.
Barimalala, R., Desbiolles, F., Blamey, R. C., and Reason, C.: Madagascar influence on the South Indian Ocean convergence zone, the Mozambique Channel trough and Southern African rainfall, Geophys. Res. Lett., 45, 11380–11389, https://doi.org/10.1029/2018GL079964, 2018.
Barimalala, R., Wainwright, C., Kolstad, E. W., and Demissie, T. D.: The 2019–21 drought in southern Madagascar, Weather and Climate Extremes, 46, 100723, https://doi.org/10.1016/j.wace.2024.100723, 2024.
Belda, M., Holtanová, E., Halenka, T., and Kalvová, J.: Climate classification revisited: from Köppen to Trewartha, Clim. Res., 59, 1–13, https://doi.org/10.3354/cr01204, 2014.
Bennett, A. C., McDowell, N. G., Allen, C. D., and Anderson-Teixeira, K. J.: Larger trees suffer most during drought in forests worldwide, Nat. Plants, 1, 15139, https://doi.org/10.1038/nplants.2015.139, 2015.
Burgess, N., Hales, J., Underwood, E., Dinerstein, E., Olson, D., Itoua, I., Schipper, J., Ricketts, T., and Newman, K.: Terrestrial eco-regions of Africa and Madagascar: A conservation assessment, World Wildlife Fund, ISBN: 1-55963-364-6, https://www.researchgate.net/publication/292588815 (last access: 17 April 2024), 2004.
Butt, N., de Oliveira, P. A., and Costa, M. H.: Evidence that deforestation affects the onset of the rainy season in Rondonia, Brazil, J. Geophys. Res.-Atmos., 116, D11120, https://doi.org/10.1029/2010JD015174, 2011.
Camberlin, P., Martiny, N., Philippon, N., and Richard, Y.: Determinants of the interannual relationships between remote-sensed photosynthetic activity and rainfall in tropical Africa, Remote Sens. Environ., 106, 199–216, https://doi.org/10.1016/j.rse.2006.08.009, 2007.
Chaves, M. M., Maroco, J. P., and Pereira, J. S.: Understanding plant responses to drought from genes to the whole plant, Funct. Plant Biol., 30, 239–264, https://doi.org/10.1071/FP02076, 2003.
Cook, B. I., Mankin, J. S., Marvel, K., Williams, A. P., Smerdon, J. E., and Anchukaitis, K. J.: Twenty–first Century Drought Projections in the CMIP6 Forcing Scenarios, Earth's Future, 8, e2019EF001461, https://doi.org/10.1029/2019EF001461, 2020.
Copernicus Climate Change Service: ERA5-Land monthly averaged data from 1950 to present, Copernicus Climate Change Service (C3S) Climate Data Store (CDS) [data set], https://doi.org/10.24381/cds.68d2bb30, 2022.
Desbureaux, S. and Damania, R.: Rain, forests and farmers: Evidence of drought-induced deforestation in Madagascar and its consequences for biodiversity conservation, Biol. Conserv., 217, 337–347, https://doi.org/10.1016/j.biocon.2018.03.005, 2018.
Didan, K.: MODIS/Terra Vegetation Indices Monthly L3 Global 0.05Deg CMG V061, NASA Land Processes Distributed Active Archive Center [data set], Sioux Falls, South Dakota, USA, https://doi.org/10.5067/MODIS/MOD13C2.061, 2021.
Duku, C. and Hein, L.: The impact of deforestation on rainfall in Africa: a data-driven assessment, Environ. Res. Lett., 16, 064044, https://doi.org/10.1088/1748-9326/abfcfb, 2021.
Dunning, C. M., Black, E., and Allan, R. P.: Later wet seasons with more intense rainfall over Africa under future climate change, J. Climate, 31, 9719–9738, https://doi.org/10.1175/JCLI-D-18-0102.1, 2018.
Elkollaly, M., Khadr, M., and Zeidan, B.: Drought analysis in the Eastern Nile basin using the standardized precipitation index, Environ. Sci. Pollut. R., 25, 10265–10278, https://doi.org/10.1007/s11356-016-8347-9, 2018.
Funk, C., Peterson, P., Landsfeld, M., Pedreros, D., Verdin, J., Shukla, S., Husak, G., Rowland, J., Harrison, L., Hoell, L., and Michaelsen, J.: The climate hazards infrared precipitation with stations – A new environmental record for monitoring extremes, Sci. Data, 2, 150066, https://doi.org/10.1038/sdata.2015.66, 2015 (data available at: https://data.chc.ucsb.edu/products/CHIRPS-2.0/global_monthly/netcdf/chirps-v2.0.monthly.nc, last access: 19 August 2025).
Gouveia, C. M., Trigo, R. M., Beguería, S., and Vicente-Serrano, S. M.: Drought impacts on vegetation activity in the Mediterranean region: An assessment using remote sensing data and multi-scale drought indicators, Global Planet. Change, 151, 15–27, https://doi.org/10.1016/j.gloplacha.2016.06.011, 2017.
Harrington, L. J., Wolski, P., Pinto, I., Ramarosandratana, A. M., Barimalala, R., Vautard, R., Philip, S., Kew, S., Singh, R., Heinrich, D., Arrighi, J., Raju, E., Thalheimer, L., Razanakoto, T., Aalst, M., Li, S., Bonnet, R., Yang, W., Otto, F., and Oldenborgh, G.: Limited role of climate change in extreme low rainfall associated with southern Madagascar food insecurity, 2019–21, Environmental Research: Climate, 1, 021003, https://doi.org/10.1088/2752-5295/aca695, 2022.
Hart, N. C. G., Washington, R., and Reason, C. J. C.: On the likelihood of tropical–extratropical cloud bands in the South Indian convergence zone during ENSO events, J. Climate, 31, 2797–2817, https://doi.org/10.1175/JCLI-D-17-0221.1, 2018.
Heim Jr., R. R.: A review of twentieth-century drought indices used in the United States, B. Am. Meteorol. Soc., 83, 1149–1166, https://doi.org/10.1175/1520-0477-83.8.1149, 2002.
Hersbach, H., Bell, B., Berrisford, P., Hirahara, S., Horányi, A., Muñoz-Sabater, J., Nicolas, J., Peubey, C., Radu, R., Schepers, D., Simmons, A., Soci, C., Abdalla, S., Abellan, X., Balsamo, G., Bechtold, P., Biavati, G., Bidlot, J., Bonavita, M., Chiara, G. D., Dahlgren, P., Dee, D., Diamantakis, M., Dragani, R., Flemming, J., Forbes, R., Fuentes, M., Geer, A., Haimberger, L., Healy, S., Hogan, R. J., Hólm, E., Janisková, M., Keeley, S., Laloyaux, P., Lopez, P., Lupu, C., Radnoti, G., De Rosnay, P., Rozum, I., Vamborg, F., Villaume, S., and Thépaut, J.: The ERA5 global reanalysis, Q. J. Roy. Meteor. Soc., 146, 1999–2049, https://doi.org/10.1002/qj.3803, 2020.
Hoell, A., Funk, C., Magadzire, T., Zinke, J., and Husak, G.: El Niño–Southern Oscillation diversity and Southern Africa teleconnections during Austral Summer, Clim. Dynam., 45, 1583–1599, https://doi.org/10.1007/s00382-014-2414-z, 2015.
Huang, J., Li, Y., Fu, C., Chen, F., Fu, Q., Dai, A., Shinoda, M., Ma, Z., Guo, W., Li, Z., Zhang, L., Liu, Y., Yu, H., He, Y., Xie, Y., Guan, X., Ji, M., Lin, L., Wang, S., Yan, H., and Wang, G.: Dryland climate change: Recent progress and challenges, Rev. Geophys., 55, 719–778, https://doi.org/10.1002/2016RG000550, 2017.
Huang, S., Tang, L., Hupy, J. P., Wang, Y., and Shao, G.: A commentary review on the use of normalized difference vegetation index (NDVI) in the era of popular remote sensing, J. Forestry Res., 32, 1–6, https://doi.org/10.1007/s11676-020-01155-1, 2021.
Huete, A., Didan, K., Miura, T., Rodriguez, E. P., Gao, X., and Ferreira, L. G.: Overview of the radiometric and biophysical performance of the MODIS vegetation indices, Remote Sens. Environ., 83, 195–213, https://doi.org/10.1016/S0034-4257(02)00096-2, 2002.
IPCC: Summary for policymakers, in: Climate Change 2021 – The physical science basis: Working Group I contribution to the sixth assessment report of the Intergovernmental Panel on Climate Change, Cambridge University Press, 3–32, https://doi.org/10.1017/9781009157896.001, 2021.
Jury, M., Parker, B. A., Raholijao, N., and Nassor, A.: Variability of summer rainfall over Madagascar: Climatic determinants at interannual scales, Mon. Weather Rev., 15, 1323–1332, https://doi.org/10.1175/MWR-D-15-0077.1, 1995.
Kalisa, W., Zhang, J., Igbawua, T., Ujoh, F., Ebohon, O. J., and Namugiza, J.: Spatio-temporal analysis of drought and return periods over the East African region using Standardized Precipitation Index from 1920 to 2016, Agr. Water Manage., 237, 106195, https://doi.org/10.1016/j.agwat.2020.106195, 2020.
Kannenberg, S. A., Schwalm, C. R., and Anderegg, W. R. L.: Ghosts of the past: How drought legacy effects shape forest functioning and carbon cycling, Ecol. Lett., 23, 891–901, https://doi.org/10.1111/ele.13485, 2020.
Konduri, V. S., Morton, D. C., and Andela, N.: Tracking changes in vegetation structure following fire in the Cerrado biome using ICESat-2, J. Geophys. Res.-Biogeosci., 128, e2022JG007046, https://doi.org/10.1029/2022JG007046, 2023.
Lawal, S., Hewitson, B., Egbebiyi, T. S., and Adesuyi, A.: On the suitability of using vegetation indices to monitor the response of Africa's terrestrial ecoregions to drought, Sci. Total Environ., 792, 148282, https://doi.org/10.1016/j.scitotenv.2021.148282, 2021.
Li, Y., Zhuang, J., Bai, P., Yu, W., Zhao, L., Huang, M., and Xing, Y.: Evaluation of three long-term remotely sensed precipitation estimates for meteorological drought monitoring over China, Remote Sens., 15, 86, https://doi.org/10.3390/rs15010086, 2023.
Lim Kam Sian, K. T. C., Zhi, X., Ayugi, B. O., Onyutha, C., Shilenje, Z. W., and Ongoma, V.: Meteorological drought variability over Africa from multisource datasets, Atmosphere, 14, 1052, https://doi.org/10.3390/atmos14061052, 2023.
Macron, C., Richard, Y., Garot, T., Bessafi, M., Pohl, B., Ratiarison, A., and Razafindrabe, A.: Intraseasonal rainfall variability over Madagascar, Mon. Weather Rev., 144, 1877–1885, https://doi.org/10.1175/MWR-D-15-0077.1, 2016.
Martinez, A. d. l. I. and Labib, S. M.: Demystifying normalized difference vegetation index (NDVI) for greenness exposure assessments and policy interventions in urban greening, Environ. Res., 220, 115155, https://doi.org/10.1016/j.envres.2022.115155, 2023.
Masih, I., Maskey, S., Mussá, F. E. F., and Trambauer, P.: A review of droughts on the African continent: a geospatial and long-term perspective, Hydrol. Earth Syst. Sci., 18, 3635–3649, https://doi.org/10.5194/hess-18-3635-2014, 2014.
Mbatha, N. and Sifiso, X.: Time series analysis of MODIS-derived NDVI for the Hluhluwe-Imfolozi Park, South Africa: Impact of recent intense drought, Climate, 6, 95, https://doi.org/10.3390/cli6040095, 2018.
McKee, T. B., Doesken, N. J., and Kleist, J.: The relationship of drought frequency and duration to time scales, in: Proceedings of the 8th Conference on Applied Climatology, Anaheim, Canada, 17–23 January 1993, 179–184, 1993.
Mishra, A. K. and Singh, V. P.: A review of drought concepts, J. Hydrol., 391, 202–216, https://doi.org/10.1016/j.jhydrol.2010.07.012, 2010.
Nanzad, L., Zhang, J., Tuvdendorj, B., Nabil, M., Zhang, S., and Bai, Y.: NDVI anomaly for drought monitoring and its correlation with climate factors over Mongolia from 2000 to 2016, J. Arid Environ., 164, 69–77, https://doi.org/10.1016/j.jaridenv.2019.01.019, 2019.
Narvaez, L. and Eberle, C.: Technical Report: Southern Madagascar food insecurity, Interconnected Disaster Risks 2021/2022, United Nations University - Institute for Environment and Human Security (UNU-EHS), https://doi.org/10.53324/JVWR3574, 2022.
Nicholson, S. E., Davenport, M. L., and Malo, A. R.: A comparison of the vegetation response to rainfall in the Sahel and East Africa, using normalized difference vegetation index from NOAA AVHRR, Climatic Change, 17, 209–241, https://doi.org/10.1007/BF00138369, 1990.
Nkunzimana, A., Shuoben, B., Guojie, W., Alriah, M. A. A., Sarfo, I., Zhihui, X., Vuguziga, F., and Ayugi, B. O.: Assessment of drought events, their trend and teleconnection factors over Burundi, East Africa, Theor. Appl. Climatol., 145, 1293–1316, https://doi.org/10.1007/s00704-021-03680-3, 2021.
Nooni, I. K., Hagan, D. F. T., Wang, G., Ullah, W., Li, S., Lu, J., and Zhu, C.: Spatiotemporal characteristics and trend analysis of two evapotranspiration-based drought products and their mechanisms in sub-Saharan Africa, Remote Sens., 13, 533, https://doi.org/10.3390/rs13030533, 2021.
Rakhmatova, N., Arushanov, M., Shardakova, L., Nishonov, B., Taryannikova, R., Rakhmatova, V., and Belikov, D. A.: Evaluation of the perspective of ERA-Interim and ERA5 reanalyses for calculation of drought indicators for Uzbekistan, Atmosphere, 12, 527, https://doi.org/10.3390/atmos12050527, 2021.
Randriamarolaza, L. Y. A., Aguilar, E., Skrynyk, O., Vicente-Serrano, S. M., and Domínguez-Castro, F.: Indices for daily temperature and precipitation in Madagascar, based on quality-controlled and homogenized data, 1950–2018, Int. J. Climatol., 42, 265–288, https://doi.org/10.1002/joc.7243, 2021.
Randriatsara, H. H.-R. H., Hu, Z., Ayugi, B., Makula, E. K., Vuguziga, F., and Nkunzimana, A.: Interannual characteristics of rainfall over Madagascar and its relationship with the Indian Ocean sea surface temperature variation, Theor. Appl. Climatol., 148, 349–362, https://doi.org/10.1007/s00704-022-03950-8, 2022a.
Randriatsara, H. H.-R. H., Hu, Z., Xu, X., Ayugi, B., Sian, K. T. C. L. K., Mumo, R., and Ongoma, V.: Evaluation of gridded precipitation datasets over Madagascar, Int. J. Climatol., 42, 7028–7046, https://doi.org/10.1002/joc.7628, 2022b.
Randriatsara, H. H.-R. H., Hu, Z., Xu, X., Ayugi, B., Sian, K. T. C. L. K., Mumo, R., Ongoma, V., and Holtanova, E.: Performance evaluation of CMIP6 HighResMIP models in simulating precipitation over Madagascar, Int. J. Climatol., 43, 5401–5421, https://doi.org/10.1002/joc.8153, 2023.
Randriatsara, H. H.-R. H., Holtanová, E., Rizwan, K., Babaousmail, H., Rabezanahary, M. F. T., Posset, K. R., Alupot, D., and Brian Odhiambo, A.: Historical changes in drought characteristics and its impact on vegetation cover over Madagascar, Version v3, Zenodo [data set], https://doi.org/10.5281/zenodo.15584300, 2025.
Rigden, A., Golden, C., Chan, D., and Huybers, P.: Climate change linked to drought in Southern Madagascar, npj Climate and Atmospheric Science, 7, 41, https://doi.org/10.1038/s41612-024-00583-8, 2024.
Rouse Jr., J. W., Haas, R. H., Schell, J. A., and Deering, D. W.; Monitoring Vegetation Systems in the Great Plains with ERTS, in: Proceedings of the Third Earth Resources Technology Satellite-1 Symposium, NASA, Goddard Space Flight Center, 1, 309–317, https://ntrs.nasa.gov/citations/19740022614 (last access: 8 January 2024), 1974.
Shalishe, A., Bhowmick, A., and Elias, K.: Meteorological drought monitoring based on satellite CHIRPS product over Gamo Zone, Southern Ethiopia, Adv. Meteorol., 2022, 1–13, https://doi.org/10.1155/2022/9323263, 2022.
Sharma, M., Bangotra, P., Gautam, A. S., and Gautam, S.: Sensitivity of normalized difference vegetation index (NDVI) to land surface temperature, soil moisture and precipitation over district Gautam Buddh Nagar, UP, India, Stoch. Env. Res. Risk A., 36, 1779–1789, https://doi.org/10.1007/s00477-021-02066-1, 2022.
Sheffield, J., Wood, E. F., and Roderick, M. L.: Little change in global drought over the past 60 years, Nature, 491, 435–438, https://doi.org/10.1038/nature11575, 2012.
Smit, H. J., Metzger, M. J., and Ewert, F.: Spatial distribution of grassland productivity and land use in Europe, Agr. Syst., 98, 208–219, https://doi.org/10.1016/j.agsy.2008.07.004, 2008.
Staten, P. W., Grise, K. M., Davis, S. M., Karnauskas, K. B., Waugh, D. W., Maycock, A. C., Fu, Q., Cook, K., Adam, O., Simpson, I. R., Allen, R. J., Rosenlof, K., Chen, G., Ummenhofer, C. C., Quan, X.-W., Kossin, J. P., Davis, N. A., and Son, Seok-W.: Tropical widening: From global variations to regional impacts, B. Am. Meteorol. Soc., 101, E897–E904, https://doi.org/10.1175/BAMS-D-19-0047.1, 2020.
Sun, J., Wang, X., Chen, A., Ma, Y., Cui, M., and Shilong, P.: NDVI indicated characteristics of vegetation cover change in China's metropolises over the last three decades, Environ. Monit. Assess., 179, 1–14, https://doi.org/10.1007/s10661-010-1715-x, 2011.
Svoboda, M. D. and Fuchs, B. A.: Handbook of drought indicators and indices, Drought Water Crises: Integrating Science, Management, and Policy, 1st edn., edited by: Wilhite, D. and Pulwarty, R. S., CRC Press, 155–208, https://doi.org/10.1201/b22009, 2017.
Tall, M., Sylla, M. B., Dajuma, A., Almazroui, M., Houteta, D. N. K., Klutse, N. A. B., Dosio, A., Lennard, C., Driouech, F., Diedhiou, A., and Giorgi, F.: Drought variability, changes and hot spots across the African continent during the historical period (1928–2017), Int. J. Climatol., 43, 7795–7818, https://doi.org/10.1002/joc.8293, 2023.
Thi, N. Q., Govind, A., Le, M.-H., Linh, N. T., Anh, T. T. M., Hai, N. K., and Ha, T. V.: Spatiotemporal characterization of droughts and vegetation response in Northwest Africa from 1981 to 2020, The Egyptian Journal of Remote Sensing and Space Sciences, 26, 393–401, https://doi.org/10.1016/j.ejrs.2023.05.006, 2023.
Tian, F., Fensholt, R., Verbesselt, J., Grogan, K., Horion, S., and Wang, Y.: Evaluating temporal consistency of long-term global NDVI datasets for trend analysis, Remote Sens. Environ., 163, 326–340, https://doi.org/10.1016/j.rse.2015.03.014, 2015.
Tladi, T. M., Ndambuki, J. M., and Salim, R. W.: Meteorological drought monitoring in the Upper Olifants sub-basin, South Africa, Phys. Chem. Earth, 128, 103273, https://doi.org/10.1016/j.pce.2022.103273, 2022.
The NCAR Command Language, Version 6.6.2, UCAR/NCAR/CISL/TDD [software], Boulder, Colorado, https://doi.org/10.5065/D6WD3XH5, 2019.
Thom, H. C. S.: A note on the gamma distribution, Mon. Weather Rev., 86, 117–122, https://doi.org/10.1175/1520-0493(1958)086<0117:ANOTGD>2.0.CO;2, 1958.
Udmale, P., Ichikawa, Y., Manandhar, S., Ishidaira, H., and Kiem, A.: Farmers' perception of drought impacts, local adaptation and administrative mitigation measures in Maharashtra State, India, Int. J. Disast. Risk Re., 10, 250–269, https://doi.org/10.1016/j.ijdrr.2014.09.011, 2014.
Vicente-Serrano, S. M., Gouveia, C., Camarero, J. J., Beguería, S., Trigo, R., López-Moreno, J. I., Azorín-Molina, C., Pasho, E., Lorenzo-Lacruz, J., Revuelto, J., Sanchez-Lorenzo, A., Garcia-Cediel, E., Ramos, P., and Lamela, M.: Response of vegetation to drought time-scales across global land biomes, P. Natl. Acad. Sci. USA, 110, 52–57, https://doi.org/10.1073/pnas.1207068110, 2013.
Vicente-Serrano, S. M., Domínguez-Castro, F., Reig, F., Tomas-Burguera, M., Peña-Angulo, D., Latorre, B., Beguería, S., Rabanaque, I., Noguera, I., Lorenzo-Lacruz, J., and El Kenawy, A.: A global drought monitoring system and dataset based on ERA5 reanalysis: A focus on crop-growing regions, Geosci. Data J., 10, 505–518, https://doi.org/10.1002/gdj3.178, 2022.
Wilhite, D. A. (Ed.): Drought as a natural hazard: Concepts and definitions, in: Drought, A Global Assessment, Routledge, London, UK, I, 3–18, https://doi.org/10.4324/9781315830896, 2000.
Wilks, D. S.: Statistical Methods in the Atmospheric Sciences, Vol. 91 of International Geophysics Series, Academic Press, Burlington, USA, 627 pp., ISBN: 0127519661, 2006.
Wright, J. S., Fu, R., Worden, J. R., Chakraborty, S., Clinton, N. E., Risi, C., Sun, Y., and Yin, L.: Rainforest-initiated wet season onset over the southern Amazon, P. Natl. Acad. Sci. USA, 114, 8481–8486, https://doi.org/10.1073/pnas.1621516114, 2017.
Xian, T., Xia, J., Wei, W., Zhang, Z., Wang, R., Wang, L. P., and Ma, Y. F.: Is Hadley Cell expanding?, Atmosphere, 12, 1699, https://doi.org/10.3390/atmos12121699, 2021.
Yao, N., Li, Y., Lei, T., and Peng, L.: Drought evolution, severity and trends in mainland China over 1961–2013, Sci. Total Environ., 616–617, 73–89, https://doi.org/10.1016/j.scitotenv.2017.10.327, 2018.
Zhang, M., Wang, K., Liu, H., Yue, Y., Ren, Y., Chen, Y., Zhang, C., and Deng, Z.: Vegetation inter-annual variation responses to climate variation in different geomorphic zones of the Yangtze River Basin, China, Ecol. Indic., 152, 110357, https://doi.org/10.1016/j.ecolind.2023.110357, 2023.
Zhao, Z., Zhang, Y., Liu, L. S., and Hu, Z.: The impact of drought on vegetation conditions within the Damqu River Basin, Yangtze River Source Region, China, PLoS One, 13, e0202966, https://doi.org/10.1371/journal.pone.0202966, 2018.