the Creative Commons Attribution 4.0 License.
the Creative Commons Attribution 4.0 License.
 | 18 Aug 2025
What can we learn about multi-hazard impacts from global disaster records?
Marleen C. de Ruiter
Timothy Tiggeloven
Philip J. Ward
Recent studies have reported more extreme, compounding impacts from multi-hazards than from single hazards owing to complex interrelationships of hazard, exposure, and vulnerability. However, our current understanding of multi-hazard impacts is primarily based on case studies of individual events. To complement this, we examine disaster records of the global emergency events database EM-DAT for the period 2000–2018. We develop an algorithm to identify multi-hazard events using information on associated hazards as well as spatiotemporal relationships between disaster records. We find that 35 % of events are multi-hazard events and 61 % of hazards are associated with them, based on a spatial overlap of at least 50 % and a time lag of at most 3 months. The hazards associated with multi-hazard events account for 78 % of total damages, 83 % of total people affected, and 69 % of total deaths. We also statistically compare the impacts of hazard pairs, single hazards, and combinations of two single hazards. The analysis suggests distinct patterns of compounding impacts, which vary depending on hazard and impact type. We conceptualise four archetypes (“the whole is greater than the sum of its parts”, “the whole equals the sum of its parts”, “one part determines the whole”, and “the whole and the parts are limited by total impact”) to describe these patterns and to guide the integration of multi-hazard interrelationships into risk assessments. Across all archetypes, hazard pairs have at least as much impact as single hazards, but their impact can be higher than, comparable to, or lower than the combined impact of two single hazards. The uncertainties and limitations encountered in our study highlight the need for future research to improve data on multi-hazards and their impacts.
- Article
(1951 KB) - Full-text XML
- BibTeX
- EndNote


In the past decade, multiple studies have reported disproportionate impact amplifications during multi-hazard or compound events (Gill and Malamud, 2016; de Ruiter et al., 2020; Zscheischler et al., 2018). Such events are characterised by hazardous conditions overlapping in space or time or both. Examples are the 2018 Osaka earthquake followed by flooding and landslides (de Ruiter et al., 2020); concurrent heatwaves in major breadbasket regions (Kornhuber et al., 2020); and floods from spatially and temporally coinciding pluvial, fluvial, and coastal drivers (Eilander et al., 2023).
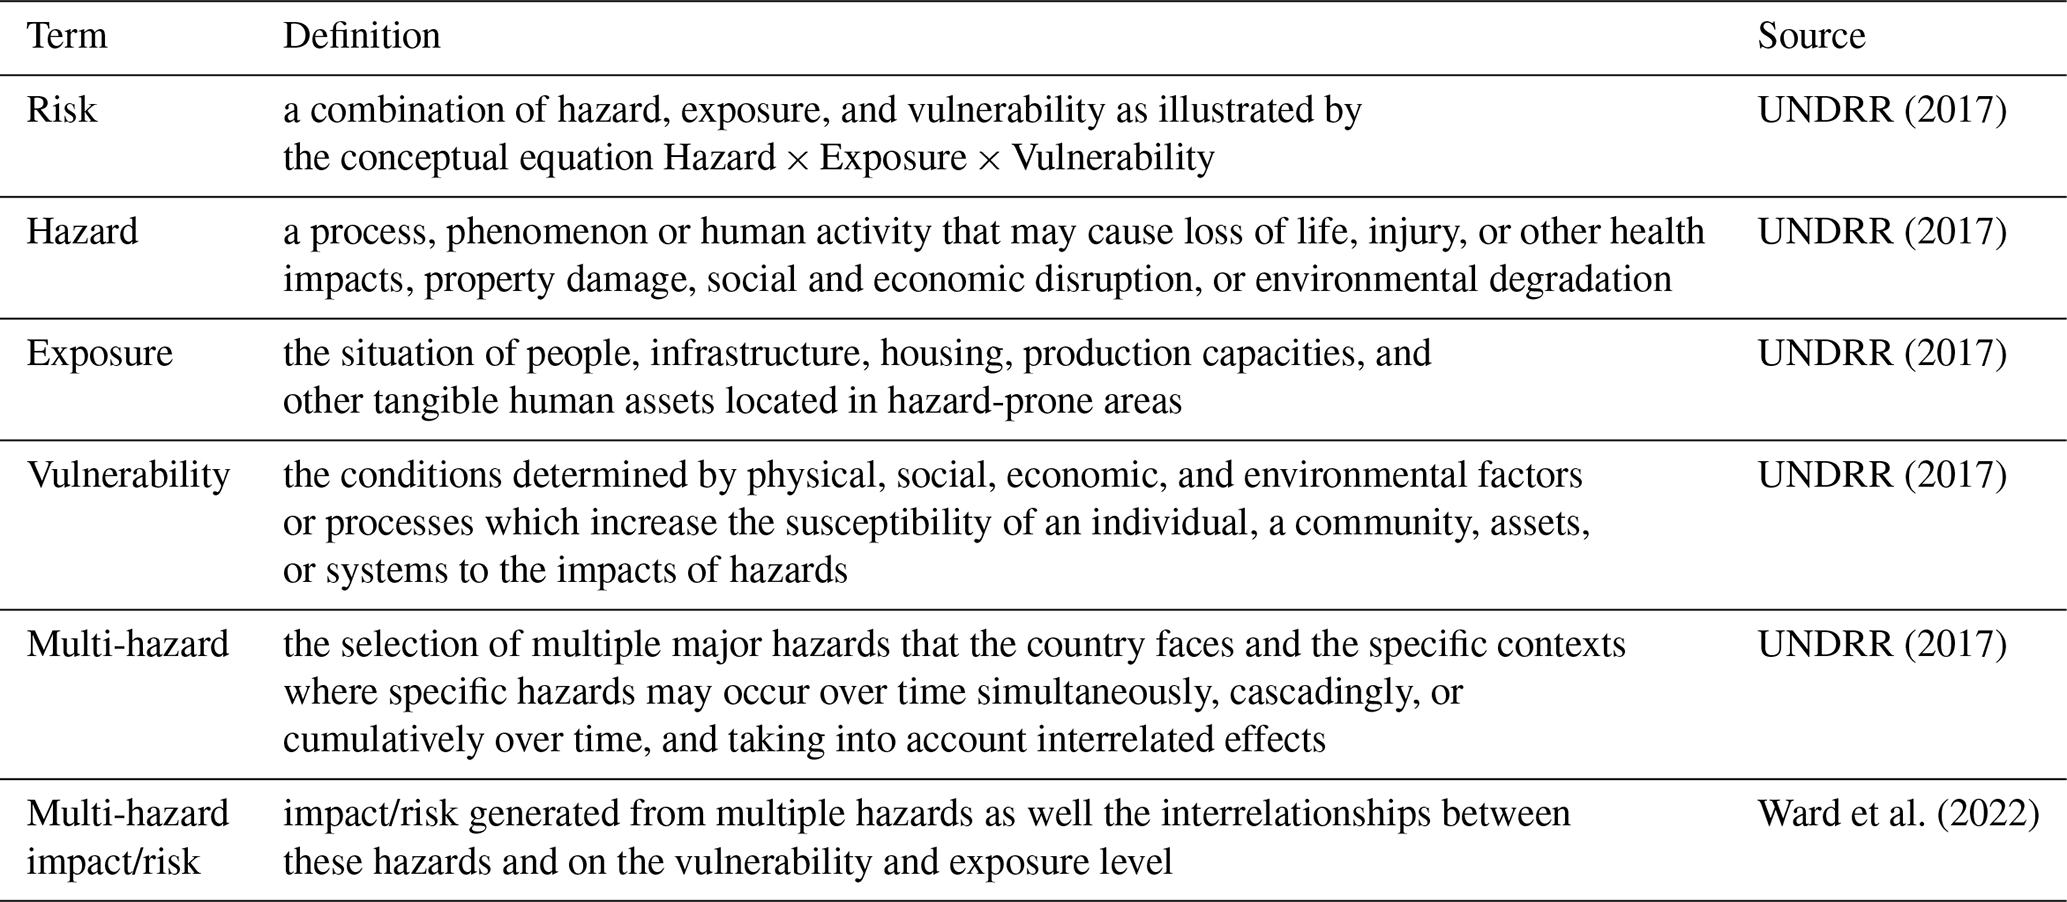
Impact amplifications during multi-hazard events can arise from several different elements of disaster risk that interrelate with each other (De Angeli et al., 2022). These interrelationships can be on the hazard, exposure, and vulnerability level and include feedback and dynamic processes. Throughout the article, we follow the United Nations Office for Disaster Risk Reduction (UNDRR) (2017) definitions for risk, hazard, exposure, and vulnerability. Moreover, we use the term “multi-hazard impact” for impact generated from multiple hazards and accounting for all interrelationships on any level following Ward et al. (2022). Table 1 provides an overview of the key definitions used in this article.
It is widely recognised that disregarding such interrelationships can lead to an over- or underestimation of risk (De Angeli et al., 2022; Hillier et al., 2020; Kappes et al., 2012; Leonard et al., 2014; de Ruiter and van Loon, 2022; Terzi et al., 2019; Ward et al., 2022; Zscheischler and Seneviratne, 2017). It can also lead to ineffective or even harmful risk reduction strategies as measures to decrease the risk of one hazard may lead to an increase in risk of another hazard (van den Hurk et al., 2023; de Ruiter et al., 2020; Ward et al., 2022). This means that multi-hazard impact cannot simply be modelled by adding up the impacts from single hazard models, which is known as the multilayer single-hazard approach (Zschau, 2017). Instead, interrelationships of the risk elements should be considered in risk modelling, as highlighted in the UN's Sendai Framework (UNDRR, 2017) and reflected in the IPCC's AR6 cycle (IPCC, 2023).
So far, most multi-hazard research has focused on hazard–hazard interrelationships, and several classification systems have been proposed (De Angeli et al., 2022; Gill and Malamud, 2014; Liu et al., 2016; Tilloy et al., 2019; van Westen and Greiving, 2017; Zscheischler et al., 2020). Though the terms used in these classifications differ, they describe similar and overlapping concepts including statistical (in)dependence between hazards, spatiotemporal relationships, amplifications of magnitude, and triggering relationships. Methodological reviews and guidelines for quantifying interrelationships have also been published (Bevacqua et al., 2021; Tilloy et al., 2019). Hazard–exposure and hazard–vulnerability interrelationships have been researched less extensively, but a number of types have already been identified. For instance, changes in exposure can arise due to migration and evacuation (Tierolf et al., 2023) or due to losses and damages from a previous hazard that have not yet been recovered from (De Angeli et al., 2022). Furthermore, de Ruiter and van Loon (2022) identified and discuss key types of dynamics of vulnerability, such as the effects of an earlier hazard on the vulnerability at the time of a second hazard. It has also been identified that a combined load from multiple hazards can cause higher damages than the summed damages of the separate hazards (Li et al., 2012; Zuccaro et al., 2008).
To our knowledge, few studies exist that consider the interrelationships on all levels together to investigate their overall effect on impact. One example is the comprehensive modelling framework developed by De Angeli et al. (2022), which integrates interrelationships on all levels to assess multi-hazard impact on the built environment and illustrates this by a case study with a hypothetical combined seismic and flood scenario. Another example is the multivariate linear regression analysis by Budimir et al. (2014), which shows that past earthquake-and-landslide events were associated with more fatalities than earthquakes alone when considering several independent covariates representing hazard, exposure, and vulnerability elements. However, data limitations prevented the authors from assessing whether the hazard pair is associated with more fatalities than the sum of the constituent hazards or, in other words, whether impact amplifications arise.
In general, the way in which impact data are currently collected and stored makes it difficult to study and understand compounding impacts in a multi-hazard or compound event context. Issues range from missing data and biases, which affect the reliability of the data (e.g. Gall et al., 2009), to the single-hazard focus and limited spatiotemporal information of many well-known impact databases, such as HANZE for floods (Paprotny et al., 2018); the NOAA natural hazards data for tsunamis, earthquakes, and volcanic eruptions (NOAA, 2025); and DesInventar (DesInventar, 2025) for various types of hazards. The single-hazard focus necessitates the investigation and linkage of possible multi-hazard conditions, but this is hindered by limited spatiotemporal information. Finally, impacts are being observed and stored on an event level and additional (statistical) methods are needed to attribute them to individual hazard components (Budimir et al., 2014).
Recently, Lee et al. (2024) have shown that the information on main and associated disasters in the emergency events database EM-DAT (Delforge et al., 2023) can be used to classify the disaster records into different types of multi-hazard events. However, hazards occurring simultaneously or in close succession at the same location have been reported in separate disaster records in multiple instances. The Guatemala 2010 volcanic eruption and tropical cyclone (Gill and Malamud, 2014) and the tropical cyclones Idai and Kenneth hitting Mozambique in 2019 (de Ruiter and van Loon, 2022) are two examples of hazards that are recognised as multi-hazard events in the scientific literature but reported as separate records in EM-DAT.
New possibilities for leveraging EM-DAT for multi-hazard analyses arise from the recently developed GDIS dataset of geocoded disaster locations (Rosvold and Buhaug, 2021) and MYRIAD-HESA, an algorithm for identifying multi-hazard events on the basis of spatiotemporal overlaps (Claassen et al., 2023). In this article, we make use of these possibilities in order to re-examine the disaster records in EM-DAT. Our aim is to gain a better understanding of compounding impacts of multi-hazards for different types of hazards and impacts.
We identify multi-hazard events following the approach by Lee et al. (2024) in combination with the GDIS dataset and a MYRIAD-HESA-inspired algorithm to account for spatiotemporal overlaps of disaster records. We focus on events with a (partial) spatial overlap and their immediate impacts rather than so-called systemic or complex impacts which can also arise from spatially distinct but temporally coinciding events due to global and sectoral interconnectedness (Hochrainer-Stigler et al., 2020; Simpson et al., 2021). We extract and derive impacts of hazard pairs and impacts of single hazards for different hazard types and perform a statistical analysis to compare impacts of hazard pairs, single hazards, and combinations of two single hazards. Based on the identified differences and similarities, we distinguish four “archetypes” of compounding impacts, which can guide the integration of multi-hazard interrelationships into risk assessments.
This study uses the international disaster database EM-DAT (Delforge et al., 2023), which contains information on natural hazards and their impacts, together with the global dataset of geocoded disaster locations GDIS (Rosvold and Buhaug, 2021), which contains geospatial footprints of the impact areas.
2.1 EM-DAT
EM-DAT is, to our knowledge, the only publicly available data source with global coverage of disaster events that includes multiple hazard types and quantitative information on socio-economic impacts. The database records events with substantial impact that are related to natural and technological hazards from 1900–present. Substantial impact is defined as an event that resulted in at least one of the following: at least 10 deaths, at least 100 people affected, a call for international assistance, or an emergency declaration. Each entry corresponds to a disaster event at country level. Events that span multiple countries are reported separately for each country, as opposed to being recorded as a single physical disaster event. For example, the 2004 Indian Ocean earthquake and tsunami is reported in 12 individual disaster records, including records in several Asian and African countries.
Each disaster record in EM-DAT contains mandatory and optional fields. The mandatory fields relevant to this study are the unique event identifier, the country, the continent, the start year, and the disaster type. We also use the optional fields, although data are frequently missing. Relevant optional fields are the disaster subtype; a first and second associated disaster, which represent subsequent or co-occurring hazards that may have contributed to the disaster impact; the start date and end date; and several human and economic impact variables.
In terms of impact, we consider the number of people affected, number of deaths, and damages. Throughout the following sections we will use the term “impact” to refer to these three quantities. Their definitions are as follows.
-
Number of people affected: number injured, number affected, and number homeless, where number affected are the people needing immediate assistance due to the disaster. If only the number of families affected or houses damaged are reported, the figure is multiplied by the average family size for the affected area.
-
Number of deaths: confirmed fatalities directly imputed to the disaster plus missing people whose whereabouts since the disaster have been unknown and so they are presumed dead based on official figures.
-
Damages: total economic damages in US dollars adjusted for inflation.
While EM-DAT is widely used in disaster risk science (Jones et al., 2022), it has well-known issues related to reporting biases (Gall et al., 2009) and regarding the general reliability and accuracy of the impact data (Guha-Sapir and Below, 2002; Moriyama et al., 2018; Panwar and Sen, 2020). The biases are due to having entire records missing rather than fields missing within records (Gall et al., 2009). These include time bias, hazard-related bias, threshold bias, accounting bias, geographic bias, and systemic bias. We exclude data from before the year 2000 to minimise time bias as recommended by the maintainers of EM-DAT (Delforge et al., 2023). However, the other bias types remain, posing a limitation to this study. For example, heatwaves are known to be underreported in EM-DAT (Brimicombe et al., 2021; Harrington and Otto, 2020).
Guidelines for handling biases and missingness are still lacking in disaster risk science. Approaches for missingness differ across studies. Deletion, augmentation, and imputation, or a combination of these, are most common for studies using EM-DAT as a primary or secondary data source (Jones et al., 2023). Deletion is simpler but deemed inferior to augmentation and imputation because it poses a higher risk of introducing bias especially when data are missing not at random1 (Nakagawa and Freckleton, 2008). However, bias can be introduced by augmentation and imputation as well if the dataset used to develop those methods is already biased due to the missing cases.
We use two approaches for dealing with missing data. First, we use a deletion approach for distributions or statistics of hazard impacts. The approach, called “available case analysis”, utilises only the observed data points for each variable. Because variables with few observations are less likely to be representative of the various possible underlying conditions in terms of hazard intensity, vulnerability, and exposure than variables with many observations, we only conduct in-depth analyses for variables with at least 50 observations. Second, we use an imputation approach for total aggregate results that involve sums. Here, we assume missing values to be zeros. This is currently the standard approach in the literature though it inevitably leads to an underestimation of total impacts (Jones et al., 2023; Lee et al., 2024). After preprocessing to handle biases and missingness, we obtained a data subset containing 5868 disaster records of which 74 % have one hazard, 22 % have two hazards, and 4 % have three hazards. This corresponds to a total of 7605 hazards (5868 × 74 % × 1 + 5868 × 22 % × 2 + 5868 × 4 % × 3 = 7605).
2.2 GDIS
GDIS is an open-source extension to EM-DAT and provides geographical approximations for main geophysical, meteorological, hydrological, and climatological disaster types from 1960–2018 (Rosvold and Buhaug, 2021). It includes spatial geometries for floods, storms, earthquakes, volcanic activity, extreme temperatures, landslides, and droughts, but not for wildfires. Overall, GDIS provides impact zones for almost 90 % of these types of records.
The spatial geometries in GDIS correspond to administrative areas, as contained in the Global Administrative Areas database (GADM). The geometries are derived from EM-DAT's country field or optional “Location” field, which lists the name(s) of the affected administrative area(s), or “Latitude” and “Longitude” fields, which provide coordinates for the location. Most locations can be described on the spatial resolution of administrative level 1 (typical state/province/region). The highest resolution corresponds to level 3 (district/commune/village) and the lowest resolution corresponds to level 0 (country). However, as hazards are unlikely to affect the precise area of an administrative region, the spatial geometries have to be regarded as crude approximates of the impact zones.
Our method has two main parts and is outlined in Fig. 1. In the first part we re-classify the disaster records into single-hazard and multi-hazard events. In the second part we analyse the impacts. The corresponding python code can be found on GitHub.
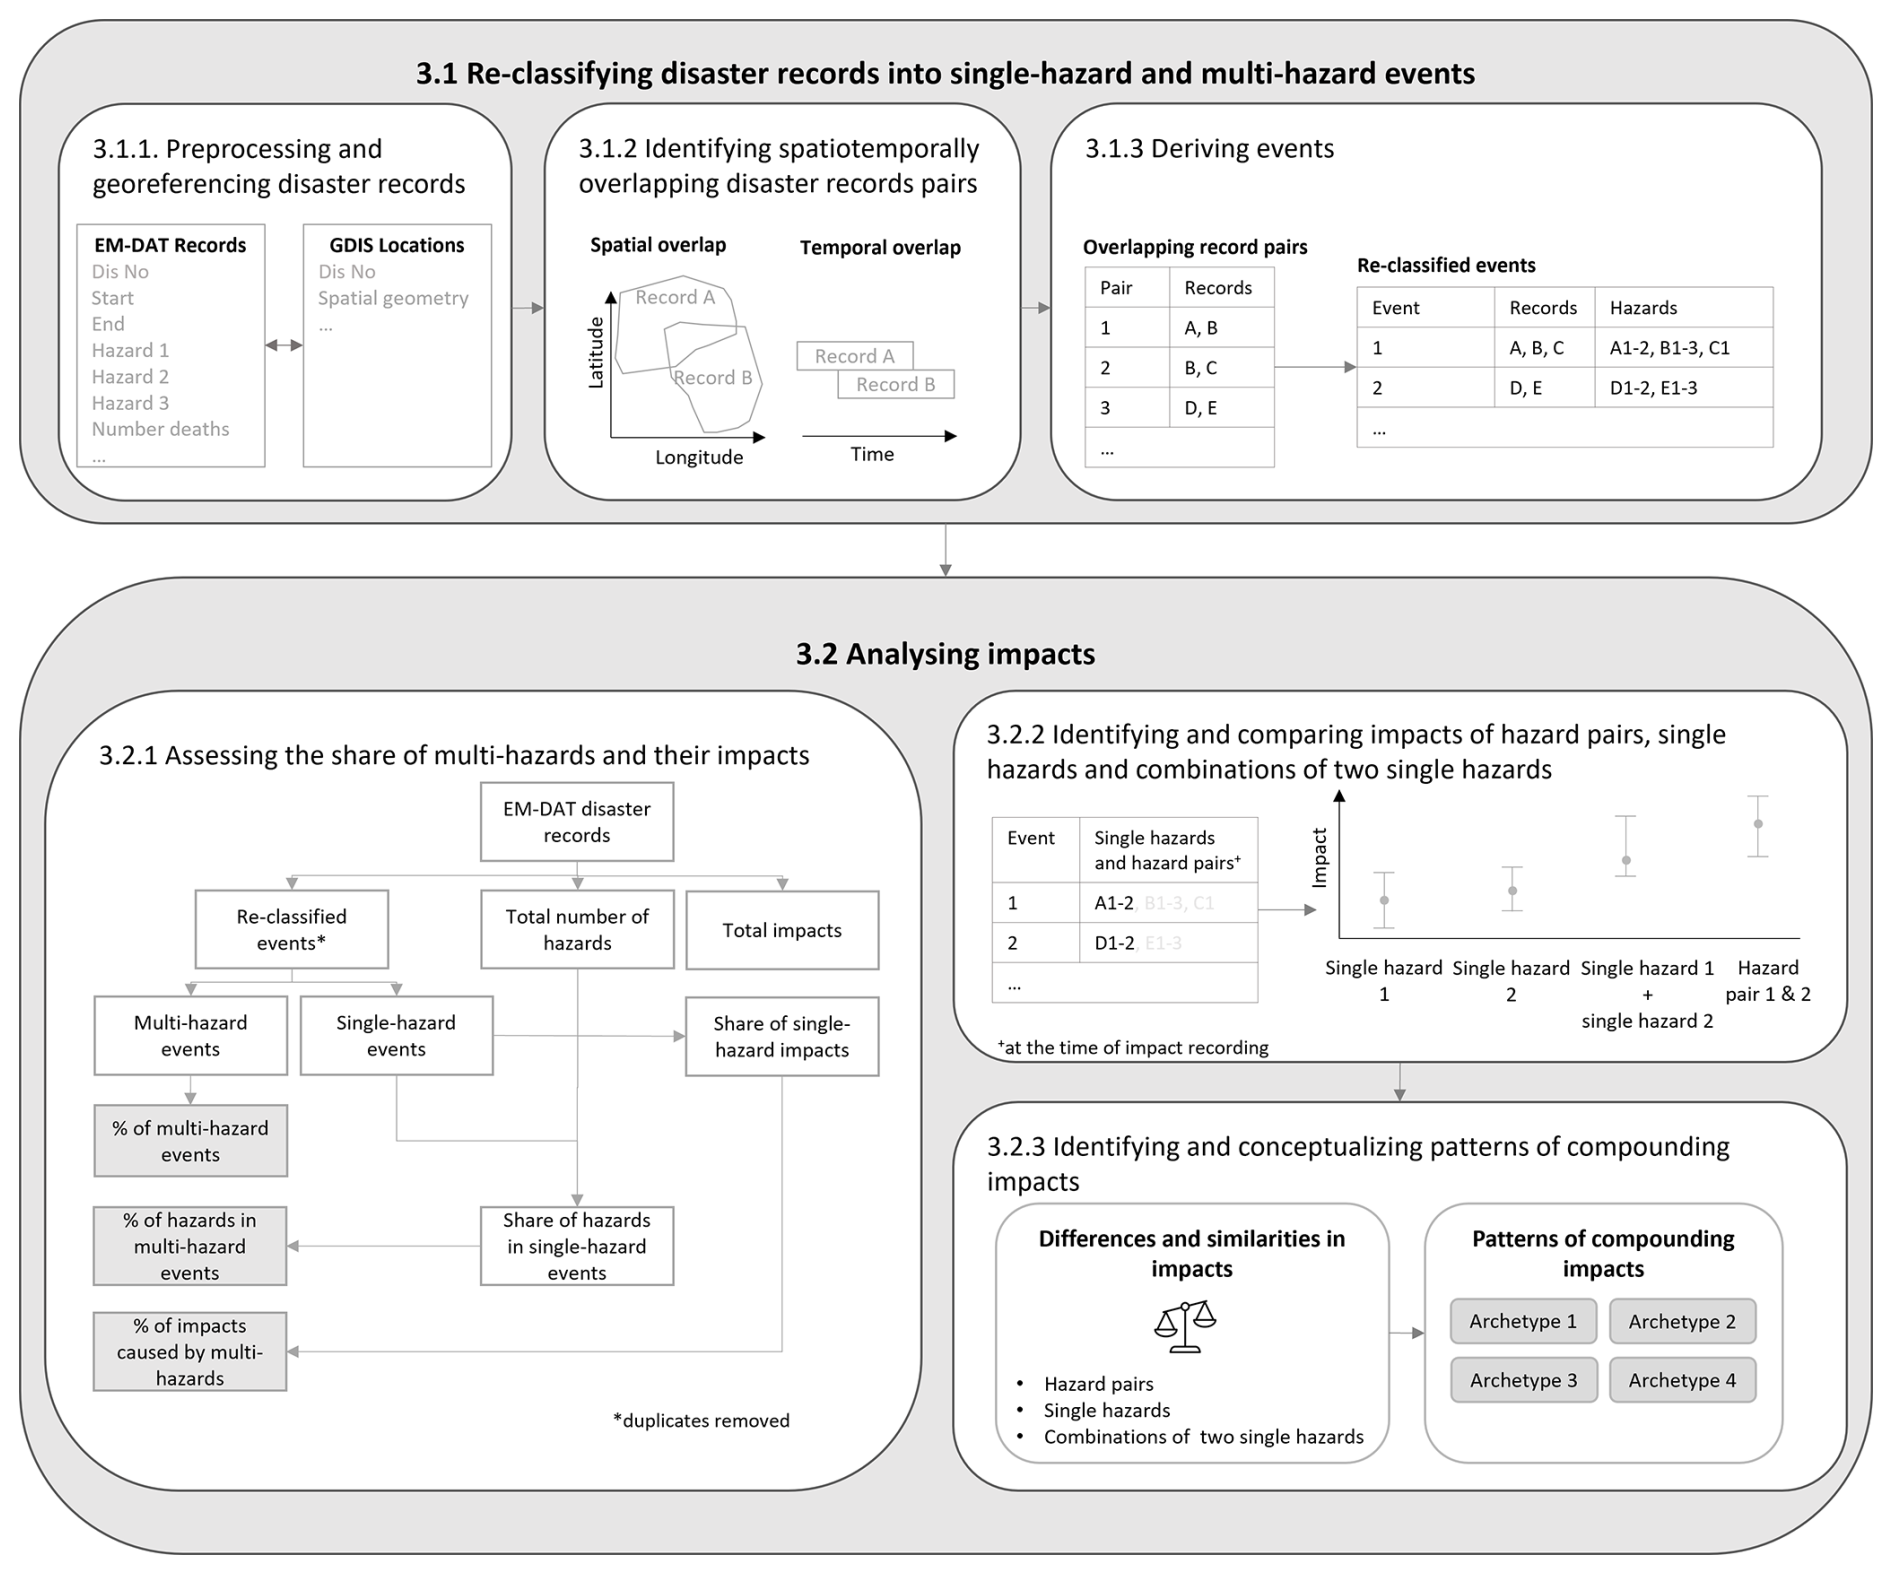
The first part involves three steps. First, we preprocess the EM-DAT disaster records by geo-referencing them using GDIS (Sect. 3.1.1). Second, we identify spatiotemporally overlapping disaster record pairs (Sect. 3.1.2). Third, we derive the single-hazard and multi-hazard events (Sect. 3.1.3).
The second part also involves three steps. First, we assess the share of multi-hazards and their impacts in global disasters (Sect. 3.2.1). Second, we identify and statistically compare impacts of hazard pairs, single hazards, and combinations of two single hazards (Sect. 3.2.2). Third, we identify and conceptualise patterns of compounding impacts from multi-hazards in four distinct archetypes (Sect. 3.2.3).
3.1 Re-classifying disaster records into single-hazard and multi-hazard events
In this section, we describe the three steps to identify single-hazard and multi-hazard events based on the EM-DAT disaster records and their GDIS locations.
3.1.1 Preprocessing and georeferencing disaster records
We preprocess and geo-reference disaster records using EM-DAT and GDIS data. Given the properties of, and guidelines for, the datasets, we only include disaster records that fall within the period 2000–2018 and belong to one of the seven disaster types listed in the second column of Table 2.
Table 2Hazard types used in this article versus terms used in EM-DAT.
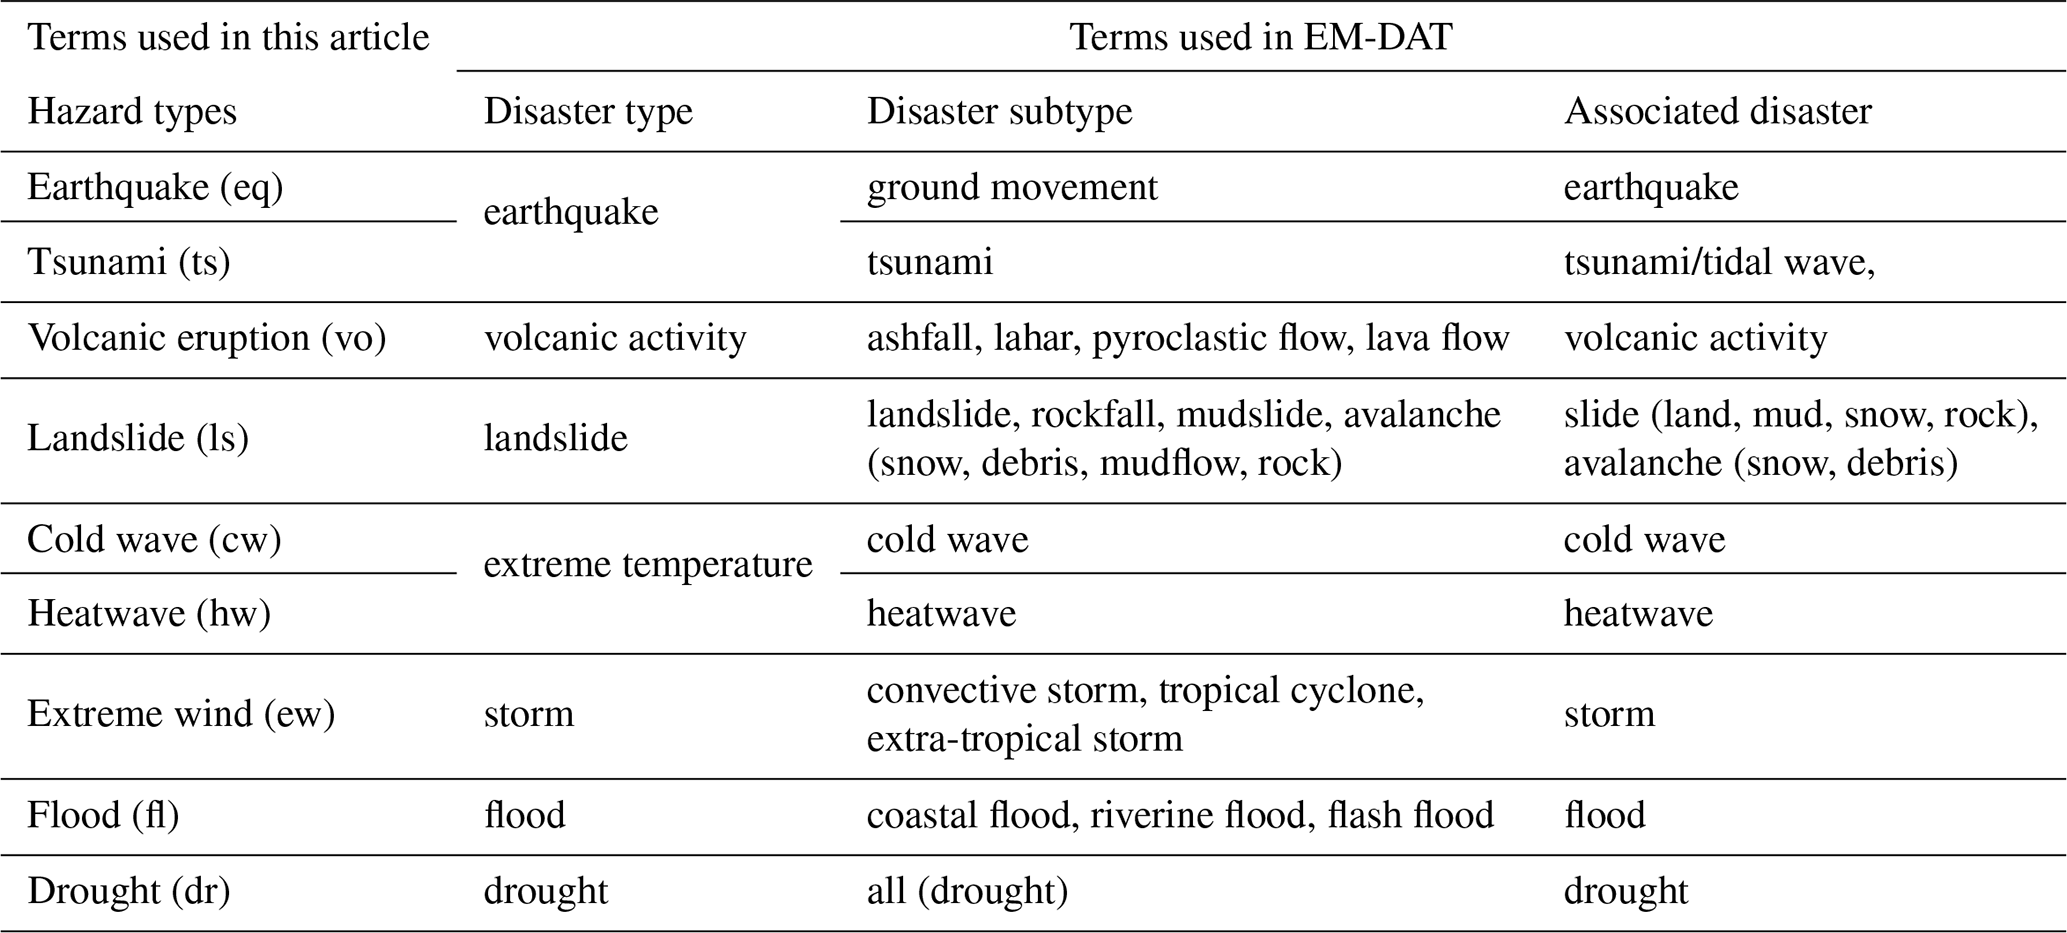
EM-DAT uses a hierarchical classification system with types and subtypes for the main disasters. The associated disasters do not follow the main classification system of EM-DAT but appear to correspond to either the disaster type or the disaster subtype. For consistency we map them to a disaster type. If the associated disasters cannot be mapped to one of the seven disaster types, we exclude the record from the analysis.
In the remainder of the paper we use the term hazard types instead of disaster type to be in line with terminology of the disaster risk field (Murray et al., 2021). We use nine different hazard types that capture different combinations of disaster type and subtype, as well as the associated disasters. EM-DAT records that contain other hazard types are excluded for this analysis. We use the same terms for the hazard types as Claassen et al. (2023); they are given in the first column of Table 2.
Finally, we link the GDIS geometries to the EM-DAT dataset via the unique disaster event identifier that is present in both datasets.
3.1.2 Identifying spatiotemporally overlapping disaster record pairs
We identify spatiotemporal overlaps between pairs of disaster records using their spatial geometries and dates. We explain the algorithm with the illustration in Fig. 2. This example has five disaster records A–E. Figure 2a shows the relevant information for the algorithm as obtained from EM-DAT. Each disaster record has a start date and a main hazard type, as well as optionally one or two associated hazard types. End dates are often missing. The algorithm works as follows.
- 1.
We create a list of all possible pairwise combinations of disaster records per country. We focus on pairs within a single country because this is how disasters are recorded in EM-DAT. Alternatively, we could have merged the records of different countries when they correspond to the same physical disaster event. This would give a better estimation of the number of events from a physical perspective. However, our main goal is to assess and compare differences in impact from single-hazards and multi-hazards, focussing on spatiotemporal overlaps. We reason that considering the records of different countries individually enables us to better separate areas that are affected by multiple hazards from areas that are affected by a single hazard. Supposing disaster records A–E are in one country, then all possible pairs would be “A, B”, “A, C”, “A, D”, “A, E”, “B, C”, “B, D”, “B, E”, and “D, E”.
- 2.
We assess the spatial overlap for each of the pairs from step (1). We calculate the intersecting area between the records as well as the fractions of the intersecting areas compared to the areas of the individual events. We refer to the higher value of the two fractions as the intersection percentage and use a minimum value as criterion to define spatially overlapping disaster records. We reason that the greater the intersecting area of two footprints, the more likely it is that the actual disaster impact zones overlap. We use a threshold of 50 % and perform a sensitivity analysis (0 %, 25 %, 50 %, 75 %, 100 %)2 on this choice. Given the spatial geometries in Fig. 2b, the spatially overlapping pairs would be “A, B”, “A, C”, and “B, D”.
- 3.
We assess the temporal overlap for each of the pairs from step (1). We calculate the time difference between the start dates of the pair. We use a maximum time lag as a criterion to define temporally overlapping disaster records. We use a time lag of 3 months and perform a sensitivity analysis on this choice (0, 1, 3, 6, and 12 months).3 Figure 2c depicts the time lags. Supposing all the times between disasters (Δt21, Δt32, Δt43, and Δt54) are 1 month, the temporally overlapping pairs using a 3-month time lag would be “A, B”, “A, C”, “A, D”, “B, C”, “B, D”, “B, E”, and “D, E”.
- 4.
We identify all spatiotemporally overlapping disaster record pairs based on the previous assessments of spatial and temporal overlap. In the example, these are “A, B”, “A, C”, and “B, D”.
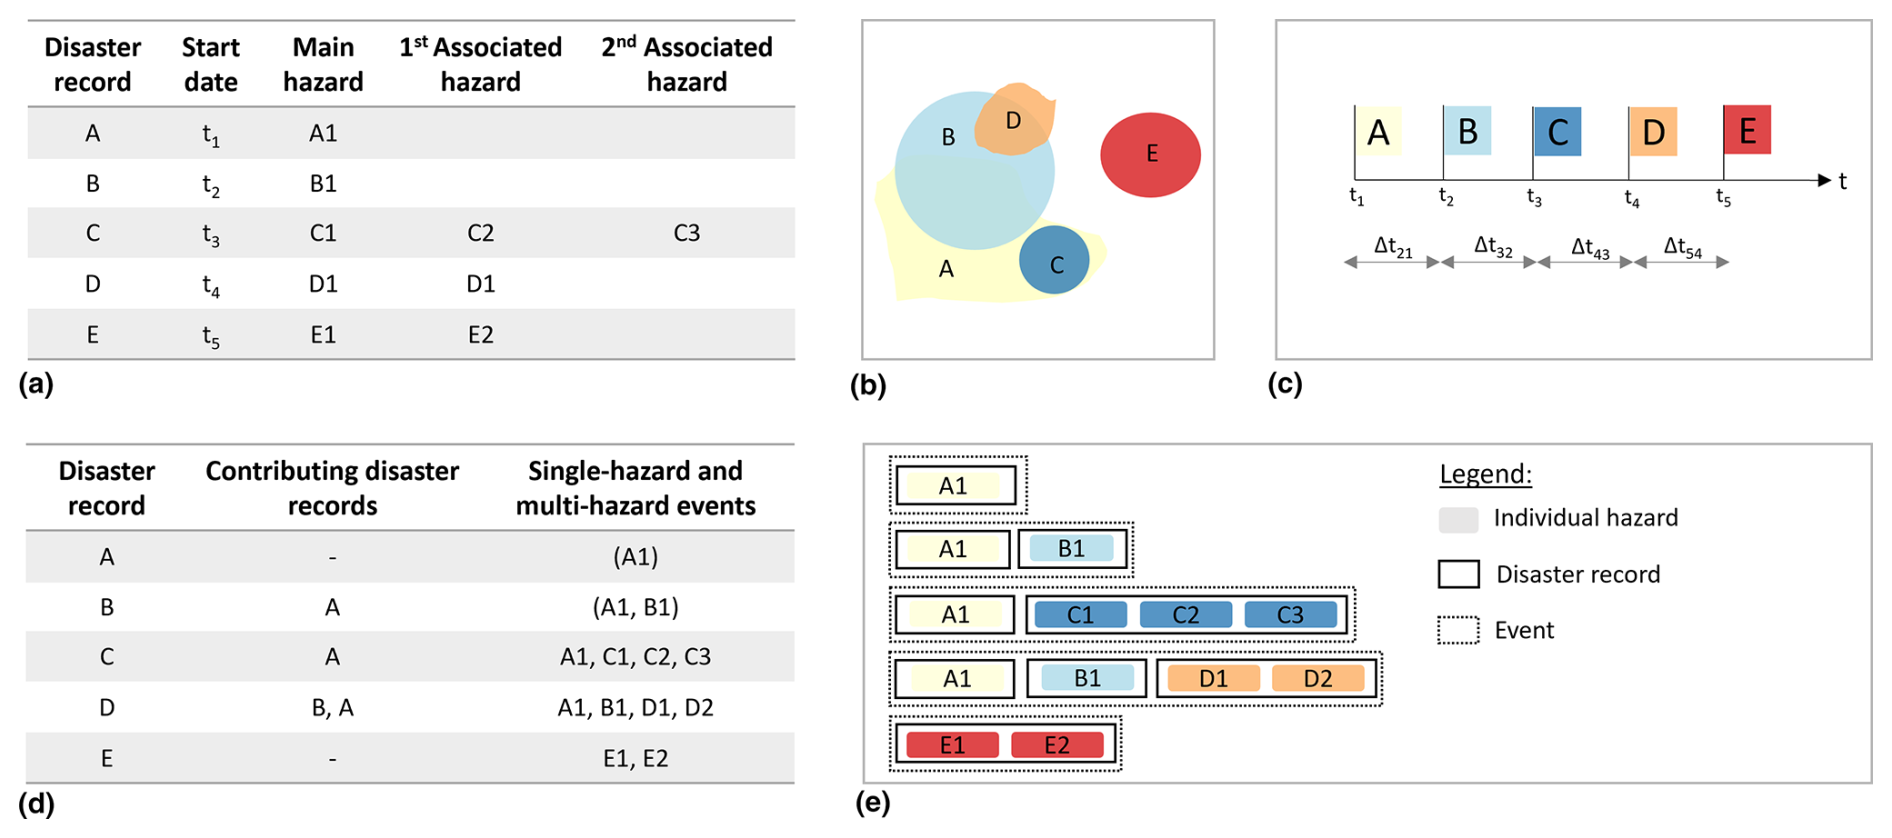
Figure 2Example with the five disaster records A, B, C, D, and E. (a) Relevant fields obtained from EM-DAT. (b) Spatial geometries of disaster records. (c) Start dates of disaster records. (d) Disaster records, their contributing disaster records, and corresponding events. Parentheses indicate events which are fully included in another event. (e) Illustration of how the terms hazard, disaster record, and event relate to each other.
3.1.3 Deriving events
We derive single-hazard events and multi-hazard events by identifying all disaster records that have potentially contributed to the reported impact through direct or indirect spatiotemporal overlaps. We use an iterative algorithm on the previously identified overlapping disaster record pairs. We explain the algorithm expanding upon the previous example in Fig. 2d.
-
For each disaster record, we find all pairs of spatiotemporally overlapping disaster records that include this disaster record. The other record in the pair is considered to be a contributing disaster record if it precedes this record in time. For example, if D is the disaster record of interest, then B is a contributing disaster record.
-
If the contributing disaster record has in turn another contributing disaster record, we add that one as well, thus considering indirect contributions. Here, A is contributing disaster record to B. Hence, we add A as contributing disaster record to D as well. Adding indirectly contributing disaster records is a recursive process. For the example the recursive process stops here, because A has no further contributing disaster records.
-
An event consists of the disaster record of interest and all contributing disaster records ordered in time (A, B, D) as well as the hazards included in those disaster records (A1, B1, D1, D2). Events which are fully included in another event are marked as duplicates and not used in part of the analysis. They have been events at the time their impact was recorded but evolved to include additional hazards later on. For example, “A1, B1” is fully included in “A1, B1, D1, D2”, which is marked by parentheses in Fig. 2d. Note that the same hazard can be part of multiple events. For example, hazard “A1” is part of event “A1, C1, C2, C3” as well as “A1, B1, D1, D2”
Figure 2e illustrates how the terms hazard, disaster record, and event relate to each other.
3.2 Analysing impacts
In this section, we describe the three steps for analysing and comparing impacts of single-hazards and impacts of multi-hazards.
3.2.1 Assessing the share of multi-hazards and their impacts
We follow a number of steps to assess the share of multi-hazards and their impacts in global disasters, as illustrated by the flowchart in the box of step 3.2.1 in Fig. 1. The starting point is the derived single- and multi-hazards events with duplicates removed. First, we determine the total number of events. The ones that contain one hazard are single-hazard events. The ones that contain more than one hazard are multi-hazard events. Then, we determine the share of multi-hazard events in the total number of events. We also determine the share of hazards that occur in multi-hazard events. We determine this by subtracting the share of single-hazards from 100 % to avoid double counting due to hazards being part of more than one multi-hazard event. The share of single hazards is given by the number of single-hazard events divided by the total number of hazards in the disaster records and converted to a percentage. Similarly, we determine the share of impacts caused by multi-hazards: we subtract the share of impacts caused by single hazards from 100 %, where the share of impacts caused by single hazards is the sum of impacts caused by single hazards divided by the total impacts of all disaster records and converted to a percentage.
3.2.2 Identifying and comparing impacts of hazard pairs, single hazards, and combinations of two single hazards
We create a dataset of the human and socioeconomic impacts of single hazards and of hazard pairs. We focus on damages, number of people affected, and number of deaths. We create the dataset by selecting all events (including the duplicates) consisting of one or two hazards. These would be “A1”, “A1, B1” and “E1, E2” in the example of Fig. 2d. If the event consists of one hazard, we record a single hazard impact. If an event consists of two hazards, we record a hazard pair impact. Note that the hazards of a hazard pair can belong to one disaster record or two disaster records. If they belong to two disaster records, we sum their impacts to obtain the total of both hazards.
If an event consists of more than two hazards, we exclude it from this part of the analysis. Such events are either partial duplicates – where the first one or two hazards are already represented by another event – or they correspond to a disaster record with three hazards. For example, we exclude the event “A1, C1, C2, C3”. While “A1” is included as single hazard, we cannot include “A1, C1” as a hazard pair because EM-DAT only reports the joint impact of “C1, C2, C3” rather than the individual impacts of “C1”, “C2” and “C3” separately. As a result, the disaster record “C1, C2, C3” is not included in the analysis. In total, we had to exclude 1079 (18 %) of the EM-DAT disaster records from this part of the analysis due to the aggregated reporting of impacts for all hazards within a record.
We examine distributions and compare means to analyse impacts of hazard pairs, single hazards, and combinations of two single hazards for different hazard and impact types. We have the distribution of impacts for hazard pairs and for single hazards from the previous step but not for the combinations of two single hazards. For the latter, we can only derive the mean by summing the mean impacts of the underlying single hazards. To compare the means, we construct confidence intervals (CIs) with a percentile bootstrap (N = 10 000). If the CIs do not overlap, we conclude that the difference in impacts is statistically significant. Otherwise, we conclude that the difference is statistically not significant.
3.2.3 Identifying and conceptualising patterns of compounding impacts
We identify different patterns of compounding impacts based on the detected differences and similarities in impacts of hazard pairs, single hazards, and combinations of two single hazards. We conceptualise these patterns and call them archetypes, inspired by the field of system dynamics, which uses the term to describe common dynamics that recur in many different settings (Senge, 1990).
We first show the share of events that are multi-hazard events and their impacts (step 3.2.1). Then, we show the results of the statistical comparison of impacts of hazard pairs, single hazards, and combinations of two single hazards (step 3.2.2). Finally, we describe distinct patterns of compounding impacts (step 3.2.3). Additional results on intermediate outputs of steps 3.1.1 and 3.1.2 can be found in Appendix A and B.
4.1 Share of multi-hazards events and their impacts
The datasets of identified single-hazard and multi-hazard events for different criteria can be found on Zenodo. We find that a higher share of events and higher share of hazards are multi-hazard than Lee et al. (2024). According to their approach, there are 5868 events of which 26 % are multi-hazard events and include 43 % of the hazards. The multi-hazard events caused 57 % of the total damages, 40 % of the total people affected, and 49 % of the total deaths globally.
The higher shares that we find are due to spatiotemporal overlaps of the disaster records in EM-DAT. Figure 3a–f show the results for different assumptions of spatiotemporal overlap. Figure 3a shows the total number of identified events, Fig. 3b shows the share of events that are multi-hazard events, Fig. 3c shows the share of hazards that are associated with multi-hazard events, and Fig. 3d–f show the shares of total damages, number of people affected, and number of deaths caused by the share of hazards associated with multi-hazard events.
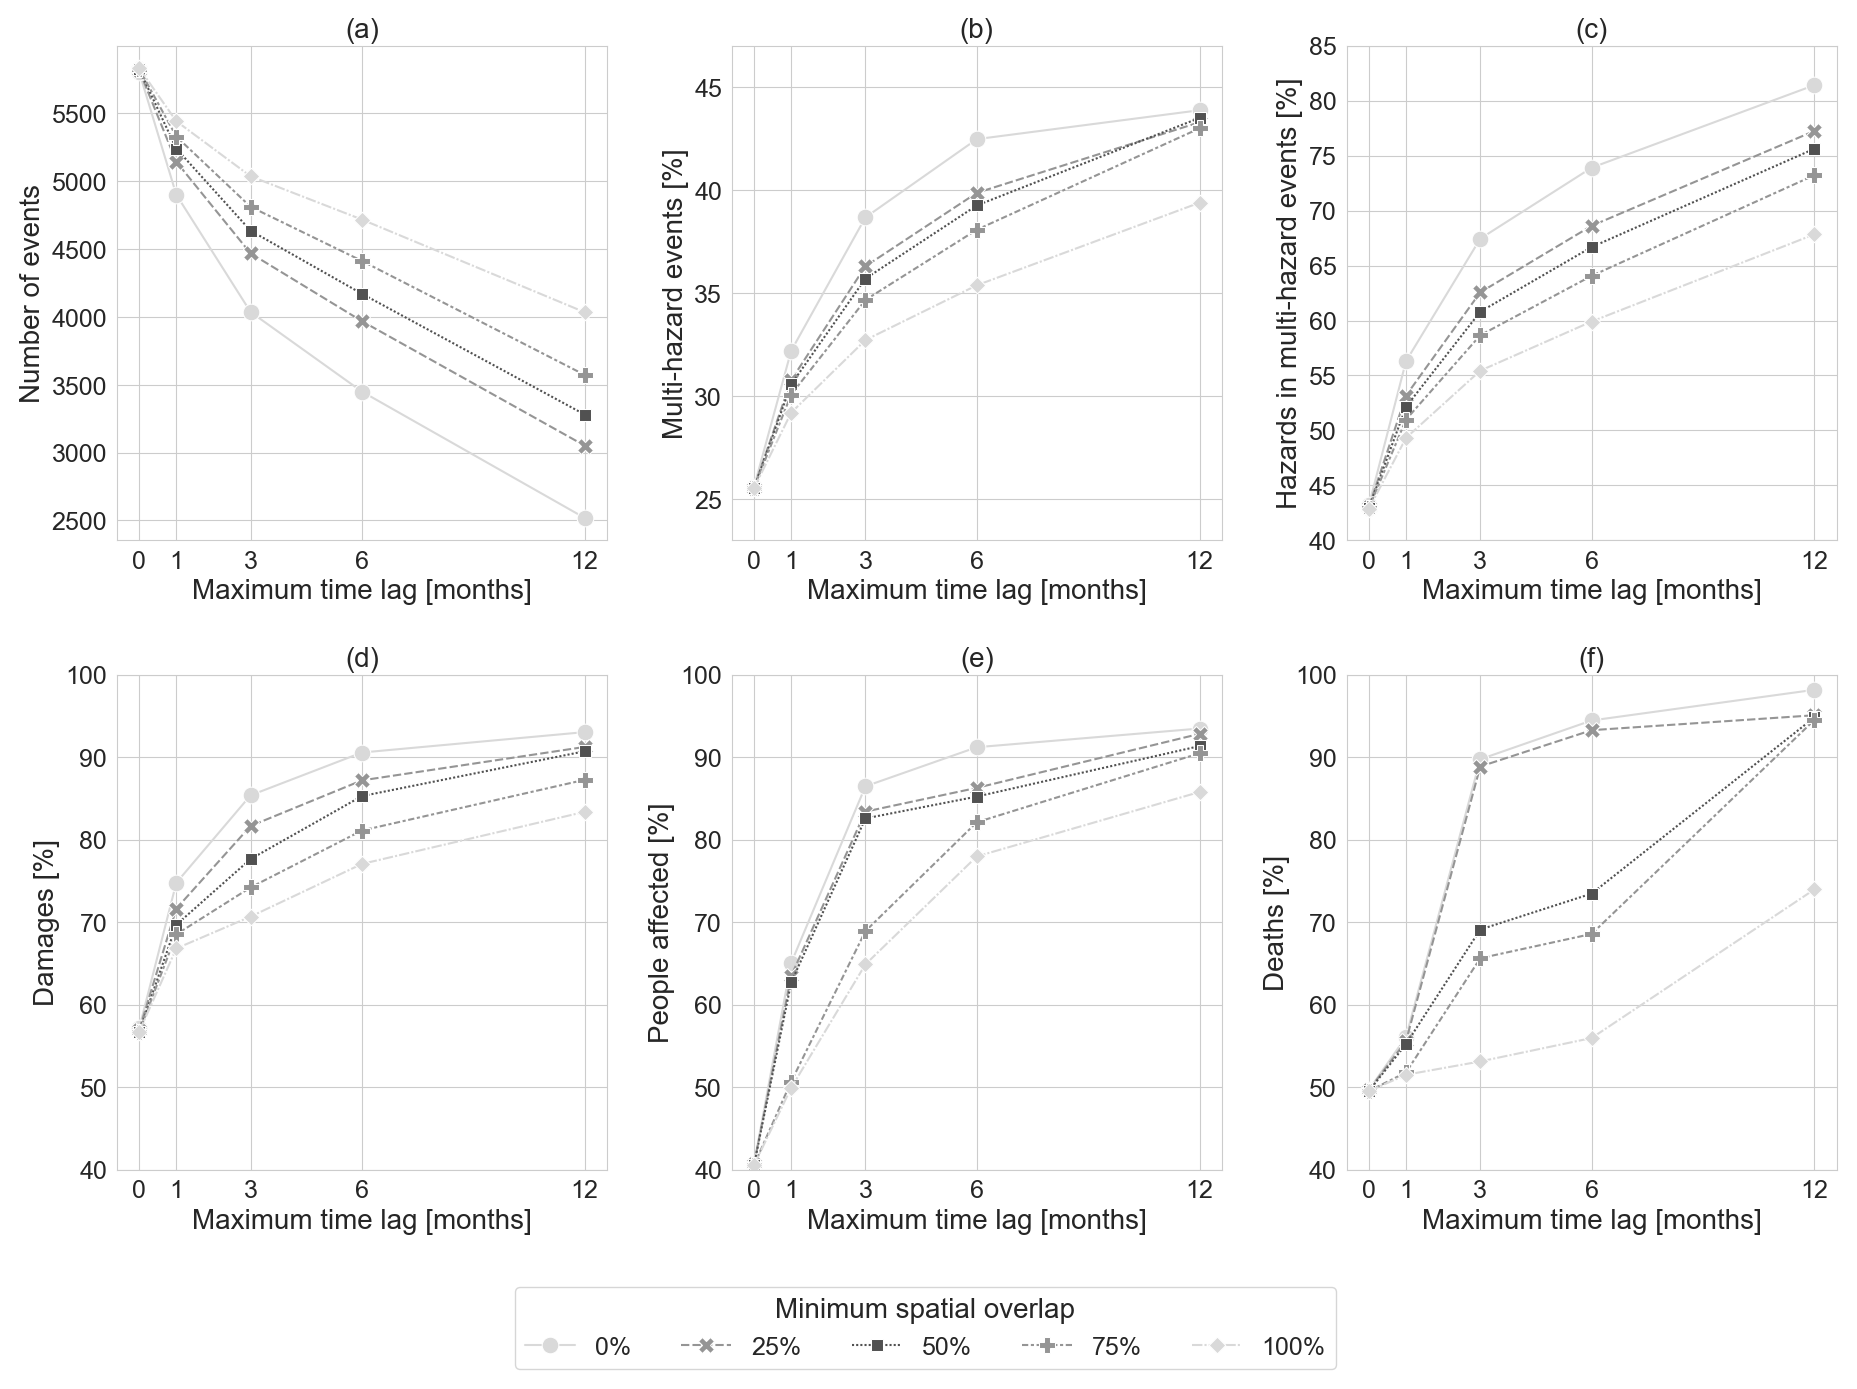
Figure 3(a) Number of events, (b) share of multi-hazard events, and (c) share of hazards associated with multi-hazard events, as well as their share in (d) total damages, (e) total people affected, and (f) total deaths when accounting for spatiotemporal overlaps between the disaster records in EM-DAT.
The lower the criterion for minimum spatial overlap and the higher the criterion for maximum time lag, the lower the number of events and the higher the share of multi-hazards and their impacts. For example, compared to Lee et al. (2024), the number of events decreases to 4636 and the share of multi-hazard events increases to 35 % when assuming a spatial overlap of at least 50 % and a time lag of at most 3 months. The identified multi-hazard events include 218 different hazard combinations and consist of up to 32 individual hazards from 5 different hazard types rather than at most 3 different hazards and hazard types in the disaster records. Furthermore, the share of hazards associated with multi-hazard events increases by almost 50 % to 61 %. Together these hazards caused 78 % of the total damages, 83 % of the total people affected, and 69 % of the total deaths globally.
4.2 Comparison of impacts of hazard pairs, single hazards, and combinations of two single hazards
We present the results for a spatial overlap of at least 50 % and a time lag of at most 90 d. Figure 4 shows the boxplots of the distributions of impacts of hazard pairs and single hazards as well as the mean values with 95 % confidence interval (CI) for hazard pairs, single hazards, and combinations of two single hazards. We only show impact types and hazard types with sample sizes N ≥ 50 in an attempt to capture the broad range of underlying hazard intensity, exposure, and vulnerability conditions from which the impacts arise. There are eight cases in terms of combination of impact and hazard types that fulfil this criterion. For extreme winds and floods, sufficient data are available for damages, number of deaths, and number of people affected (first column of Fig. 4). For consecutive floods, as well as floods and landslides, sufficient data are available for number of deaths and number of people affected (second and third column of Fig. 4). For earthquake and landslides, sufficient data are available for people affected (fourth column of Fig. 4). Sample sizes are reported in Tables C1 and C2 in the Appendix.
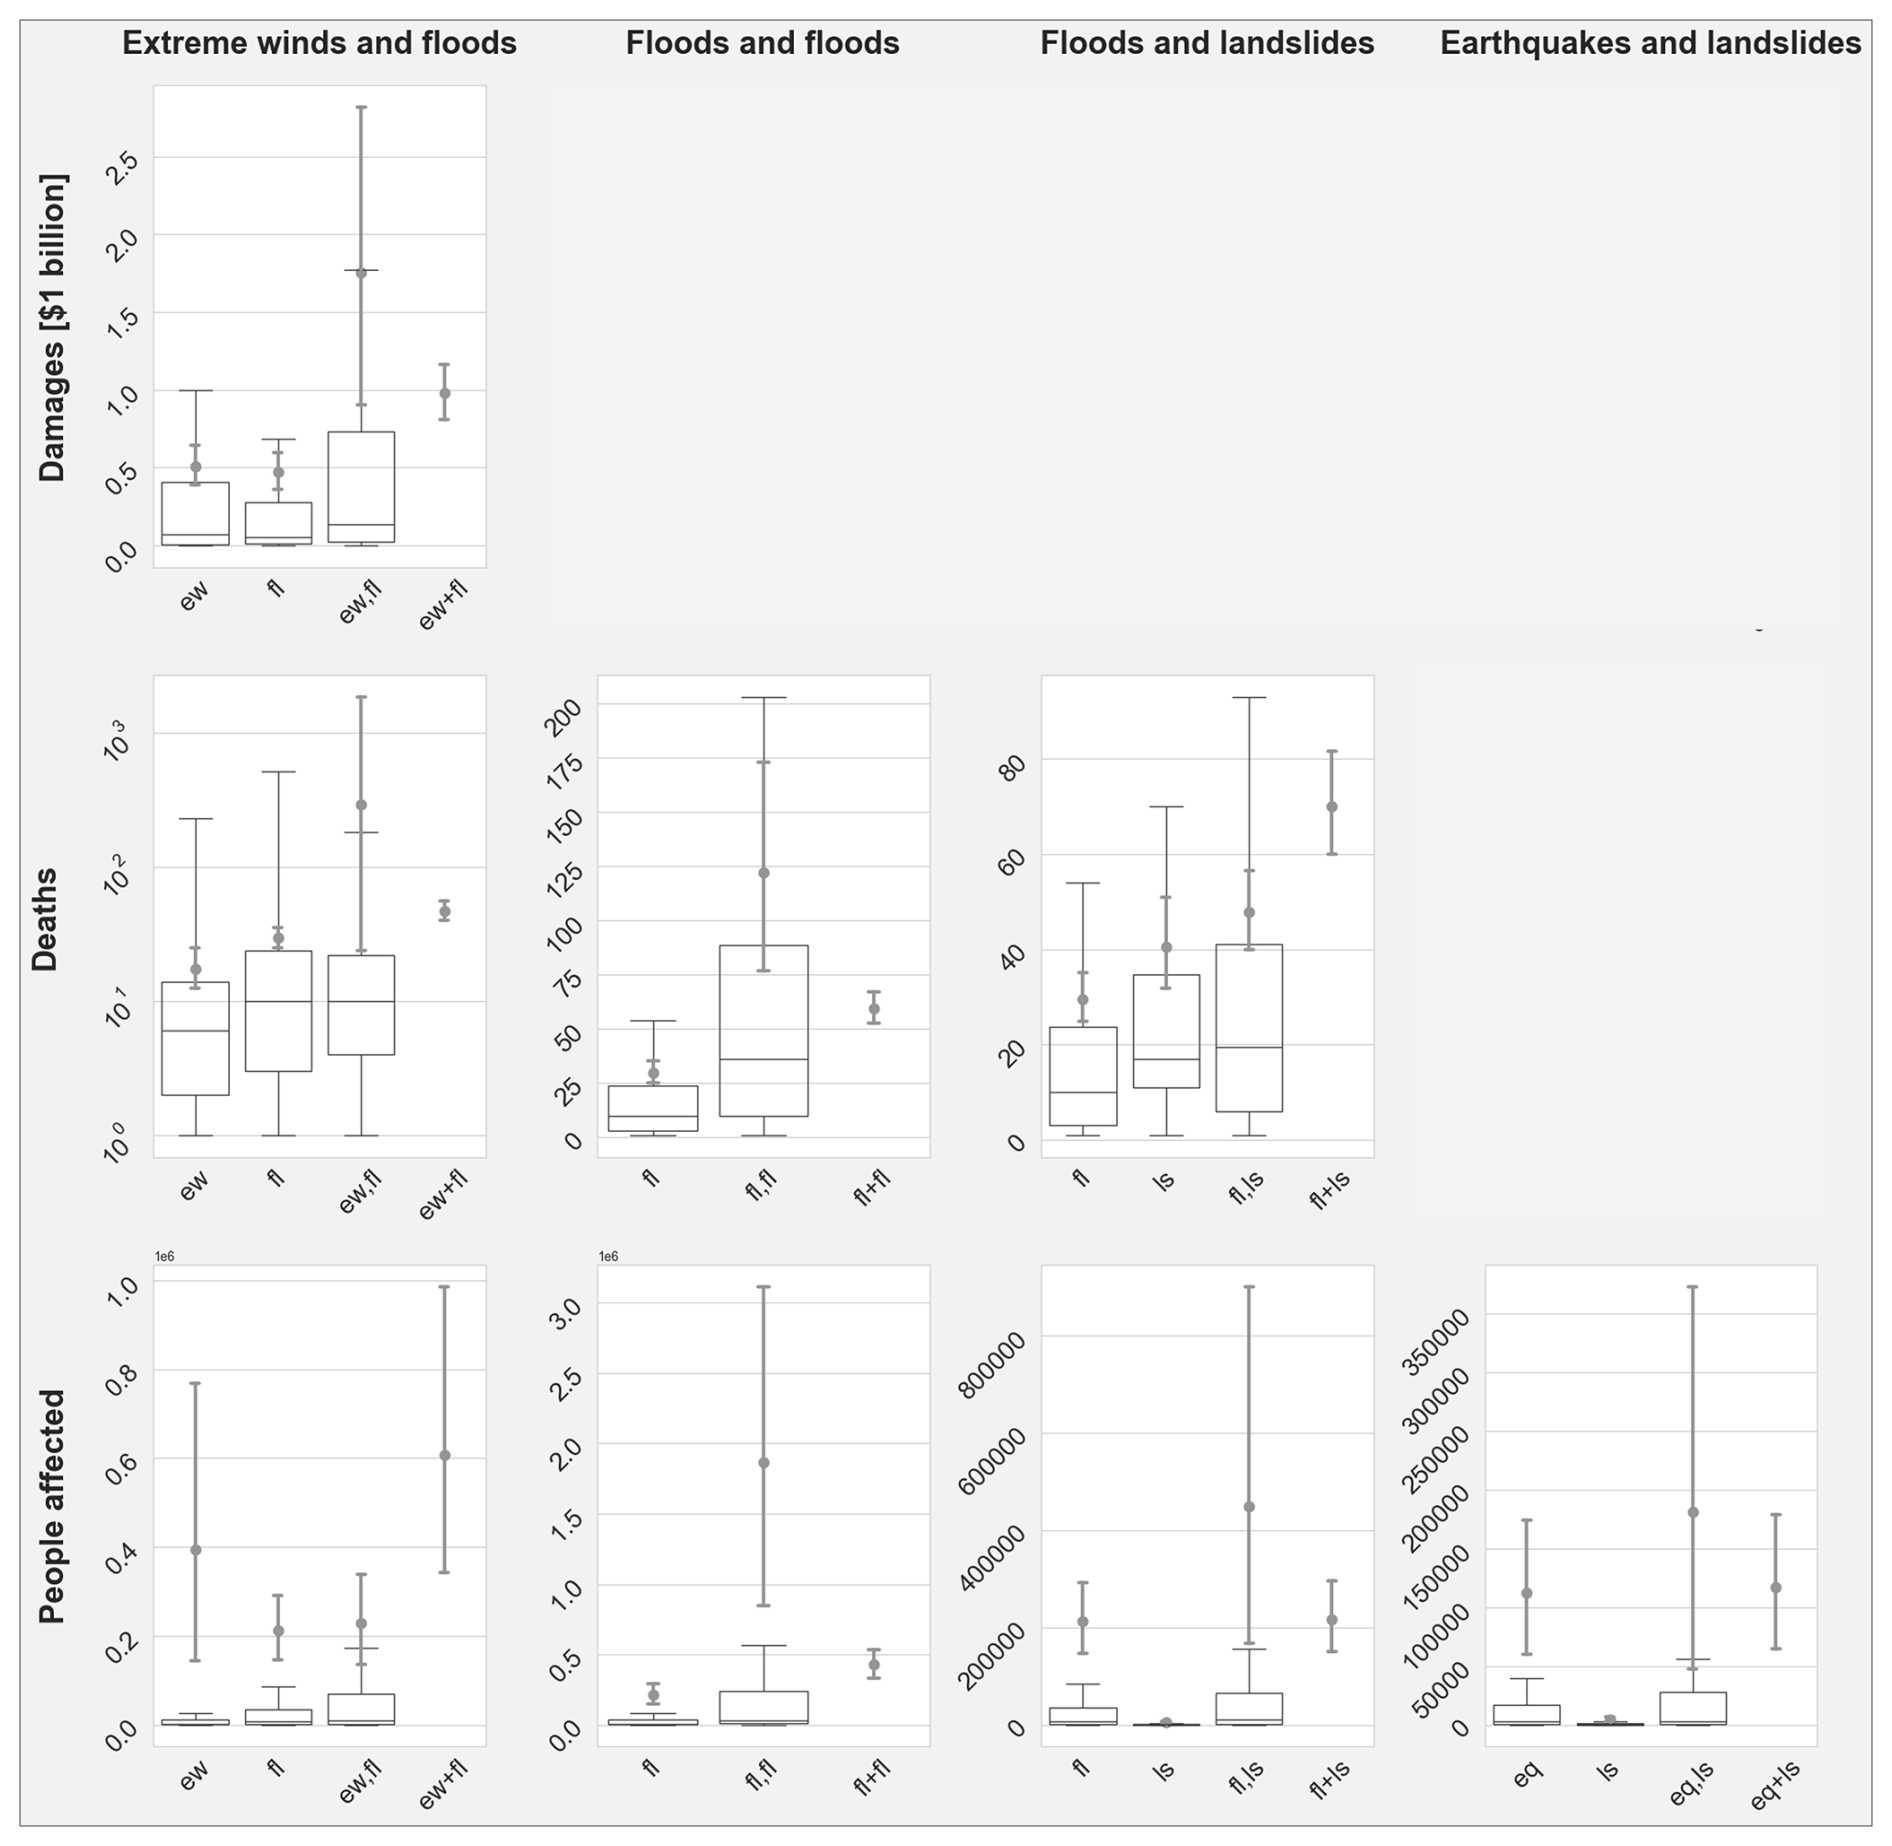
Figure 4Boxplots of impact data for single hazards and hazard pairs (,) for different impact types and hazard types as well as mean values and their bootstrap 95 % CI for single hazards, hazard pairs (,), and the combined impact of two single hazards (+). The rows show different impact metrics. The columns show different hazard types (ew – extreme wind, fl – flood, ls – landslide, eq – earthquake). Only combinations of impact and hazard type with N > 50 are shown. Note that the number of deaths for extreme winds and floods (second row, first column) is shown on a logarithmic scale.
For all variables (impacts of single hazards and of hazard pairs), the mean value is higher than the 75th percentile; for 9 of the 16 variables the mean value is higher than the 95th percentile. Thus, the majority of impacts are clustered towards the lower end of the impact range while a few very high data points pull the mean upwards. Consequently, the uncertainties about the mean are large compared to the spread of the distributions: for 10 of the 16 variables, the uncertainty about the mean is larger than the 75 % interpercentile range.
The first four columns of the matrix in Table 3 list the results of the comparison of the mean impacts of hazard pairs and single hazards. In three cases, the impacts of the hazard pair are significantly higher than those of both single hazards (damages for extreme winds and floods, number of deaths for consecutive floods, and number of people affected for consecutive floods). Also, in three cases, the impacts of the hazard pair are significantly higher than those of one but not the other of the single hazards (number of deaths for floods and landslides, number of people affected for floods and landslides, and number of people affected for earthquakes and landslides). Finally, in two cases, the average impacts of the hazard pair are not significantly different than those of either of the single hazards (number of deaths for extreme winds and floods and number of people affected for extreme winds and floods). In no case is the average impact of a hazard pair significantly lower than those of either or both single hazards.
Table 3Statistically significant differences in mean impacts of hazard pairs, single hazards, and two single hazard combined (ew – extreme wind, fl – flood, ls – landslide, eq – earthquake). Pairs are denoted by a “,” and combinations of two single hazards are denoted by a “+”. A “>” indicates that the impact of the variable in the row is higher than that of the variable in the column and a “=” denotes no difference.
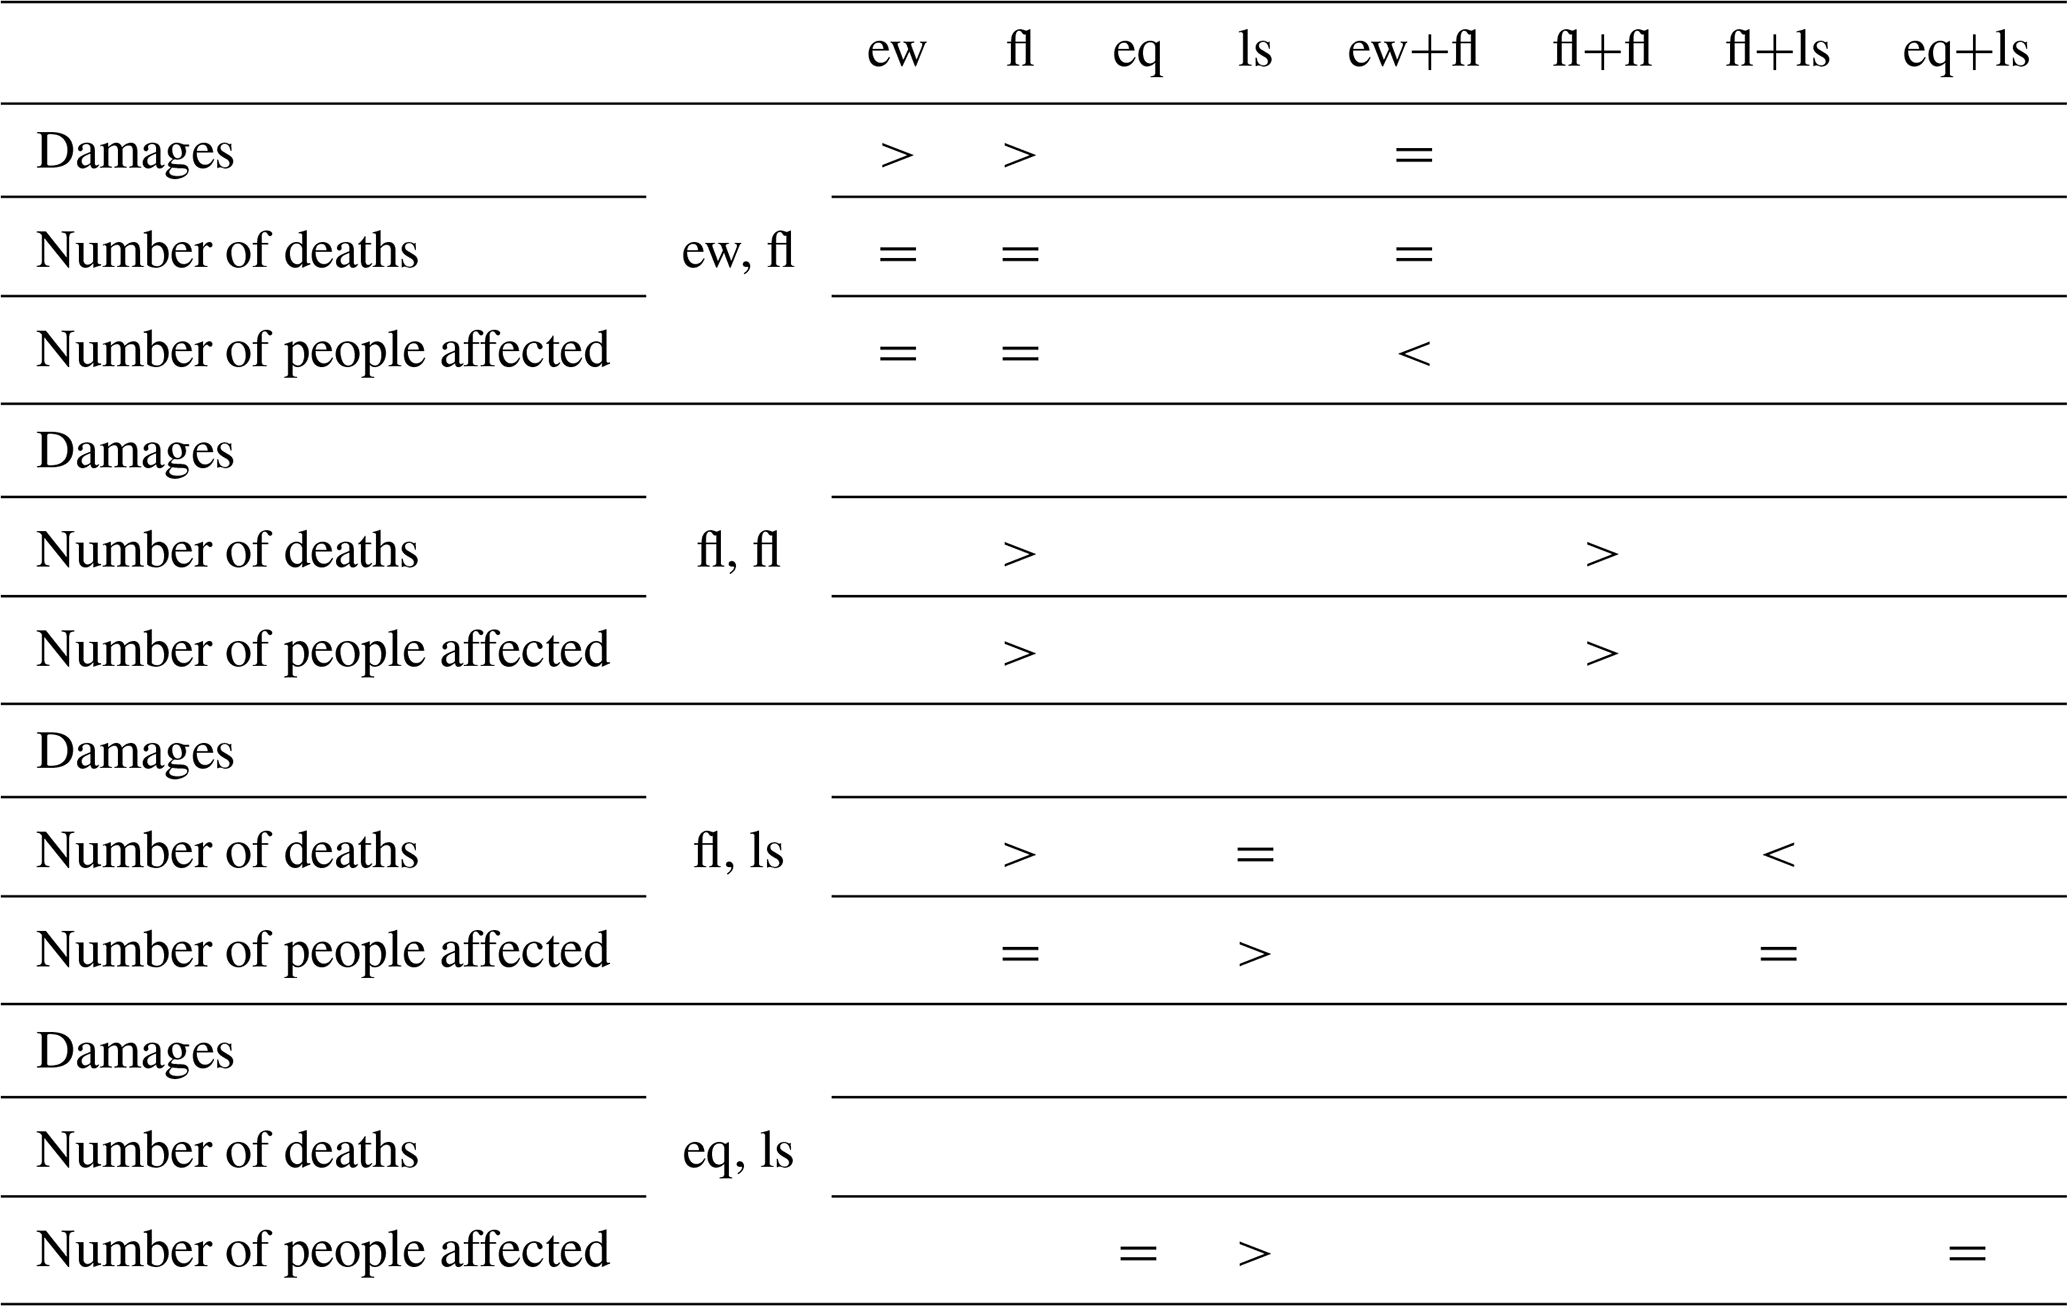
The last four columns of the matrix in Table 3 list the results of the comparison of mean impacts of hazard pairs and combinations of two single hazards. In two cases, the impacts of the hazard pair are significantly higher than the combined impacts of two single hazards (number of deaths of consecutive floods and number of people affected of consecutive floods). Also, in two cases, the average impact of a hazard pair is significantly lower than those of the combined impacts of the two single hazards (number of deaths for floods and landslides and number of people affected for extreme winds and floods). In all other cases, no statistical difference is detected.
4.3 Archetypes of compounding impacts
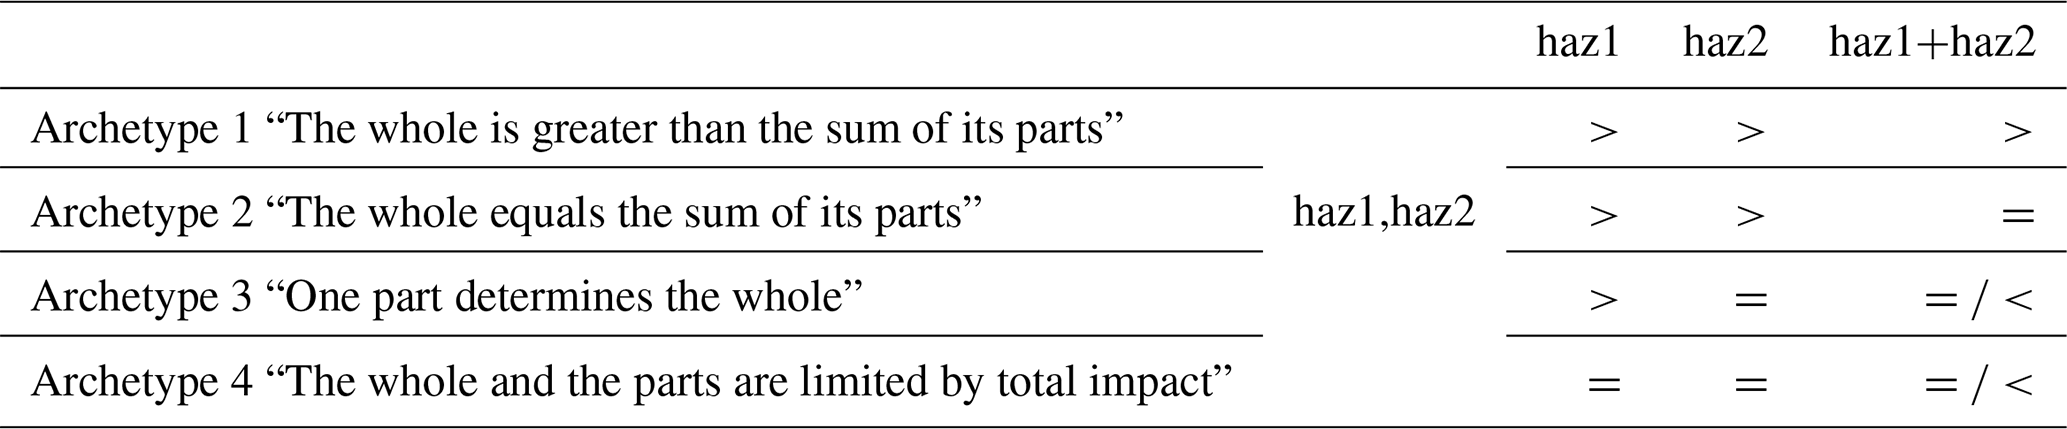
We identify four distinct patterns of compounding impacts based on the differences and similarities in mean impacts of hazard pairs, single hazards, and combinations of two single hazards (Table 4). In the first archetype, the impact of a hazard pair is higher than the impacts of both underlying single hazards and their combined impact. We see this pattern in number of deaths and number of people affected of flood–flood pairs. In the second archetype, the impact of a hazard pair is higher than the impacts of both underlying single hazards but not different from their combined impact. We see this pattern in damages of extreme wind–flood pairs. In the third archetype, the impact of a hazard pair is higher than that of one underlying hazard but comparable to that of the other and is either lower than or similar to their combined impact. We see this pattern in the number of deaths and the number of people affected of flood–landslide pairs as well as the number of people affected in earthquake–landslide pairs. In the fourth archetype, the impact of a hazard pair is similar to that of each underlying hazard and is either comparable to or lower than their combined impact. We see this pattern for number of deaths and number of people affected for extreme wind–flood pairs.
Table 4Four archetypes describing distinct patterns of compounding impacts of hazard pairs. “haz1,haz2” denotes a hazard pair; “haz1” and “haz2” denote the underlying single hazards; and “haz1+haz2” denotes the underlying single hazards combined. A “>” indicates that the impact of the variable in the row is higher than of the variable in the column and a “=” denotes no difference.
The aim of this study was to gain an understanding of multi-hazards and their compounding impacts by analysing the emergency events database EM-DAT.
We found that the number of events and number of hazards that are considered multi-hazard are likely higher than recorded in EM-DAT and identified by Lee et al. (2024). This is due to spatiotemporal overlaps between the disaster records as multi-hazard events may involve multiple disaster records. However, there remains substantial uncertainty in the identification of multi-hazard events in EM-DAT.
On one hand, the uncertainty is due to the limited spatiotemporal information in the data. The resolution of spatial footprints in GDIS varies from local administrative units to country level and varies in size, introducing uncertainty regarding the actual overlap of hazard-exposed areas (see Appendix B for examples and a discussion). In addition, the individual hazards within a disaster record are associated with the same footprint, even though their footprints may have very different extents. Similarly, the temporal information in EM-DAT is crude. As end dates are partially missing, we used start dates and a time lag, which is a crude approximation of the actual time between hazards. The temporal information used here is also provided on the disaster record level but not on the level of individual hazards. Finally, we still lack understanding on how much time lag and overlap should be considered, although some suggestions and sensitivity analysis are provided by Claassen et al. (2023). De Ruiter et al. (2020) suggest that hazards should be analysed together if direct impacts of a subsequent hazard spatially overlap before recovery from a previous hazard is considered to be completed, but information on recovery duration is limited.
On the other hand, the increasing trend in the reporting of associated disasters in EM-DAT (Lee et al., 2024) suggest that impacts may have been, and still are being, assigned to a single main hazard even though additional hazards have occurred, leading to an underestimation of multi-hazards. We also encountered several similar cases during our analysis. An example is tropical cyclone Grace, which followed the 7.2-magnitude earthquake in Haiti in August 2021 (Daniels, 2021) but is not reported in EM-DAT. Despite these uncertainties in the data and method, multi-hazards are likely underreported in EM-DAT.
We also found that the reported multi-hazards contribute to a disproportionately high share of total impacts globally compared to single hazards, which is in agreement with the results of Lee et al. (2024). When statistically comparing impacts of hazard pairs, single hazards, and combinations of two single hazards, the results differed per impact and hazard type, suggesting that there are different patterns of compounding impacts. In all cases, the average impact of a hazard pair was comparable to or higher than the average impact of a single hazard. This suggests that multi-hazard interactions leading to increased impact tend to outweigh multi-hazard interactions leading to decreased impact. However, the average impact of a hazard pair could be higher than, comparable to, or lower than the combined average impact of two single hazards. Again, the results need to be treated with care because of large uncertainties in the impact data but also because of known biases and limitations of EM-DAT.
In cases where there is a significant difference, this could indeed point to an actual difference in impacts. However, it may also be caused by biases such as systematic double counting of impacts of consecutive disasters or geographical biases. For example, two consecutive earthquakes in Iceland have the exact same reported total damages (reported under disaster nos. 00-0076-ISL and 2000-0335-ISL), suggesting potential double counting when adding them up. The fact that we came across these inconsistencies by chance suggests that there are many more.
In cases where there is no significant difference found between two impact variables, this could either mean that there is indeed no difference between those variables or that there is a difference but not sufficient evidence in the dataset to detect it. Several factors contribute to the uncertainties. Firstly, a handful of extremely high data points are pulling the mean impact value up from the bulk of data points clustered at the lower end of the distribution. In addition, the sample sizes of impact data are small per hazard pair type, which is due to the many different event types as well as missing impact data in EM-DAT. While we considered nine hazard types, we could only analyse impacts for four hazard types and four hazard pair types when requiring a sample size of at least N = 50. In particular, impacts for extreme temperatures and droughts are missing. For these types, the complexity and difficulty of assessing impacts is well known (Wilhite et al., 2007). Lastly, the hazards occurred under diverse conditions in terms of hazard intensity, exposure, and vulnerability, which can cause a wide range of impacts. Ideally, these factors would be controlled for in the analysis, as done for example by Budimir et al. (2014). However, EM-DAT does not contain sufficient information to do so.
Finally, we could identify and conceptualise four distinct patterns of compounding impacts. While we acknowledge the substantial uncertainty in associating each case to a particular archetype in our results, there are possible explanations and real world cases that support the existence of such patterns in general:
- 1.
Archetype 1 (“The whole is greater than the sum of its parts”): a pattern where the impact of a hazard pair is significantly higher than the impact of two hazards combined would arise when both hazards in the pair exacerbate each other's impacts if they co-occur simultaneously or consecutively. Real world examples of such a pattern are a previous flood that increases vulnerability leading to more impacts from a second flood (de Ruiter et al., 2020), a previous flood that intensifies a second flood due to already saturated soils and thus leading to higher impacts (Berghuijs et al., 2019), and a progressive increase in a building's physical vulnerability due to multiple loads (Zuccaro et al., 2008).
- 2.
Archetype 2 (“The whole equals the sum of its parts”): a pattern where the impact of a hazard pair is comparable to the combined impact of two single hazards would emerge when the hazards do not significantly affect each other's impact. This could, for example, be the case for damage to the built environment caused by extreme wind and a flood, because they have different damage-causing mechanisms. Floods tend to affect the interior of buildings and the lower floors, whereas extreme winds tend to damage the exterior of buildings and, in particular, the roof (Amini and Memari, 2020).
- 3.
Archetype 3 (“One part determines the whole”): a third pattern would emerge when one hazard is so impactful that, in comparison, the contribution of other hazards is negligible, possibly combined with a “the whole and the parts are limited by total impact” effect (Archetype 4). This could, for example, be the case for the number of people affected by flood–landslide pairs and earthquake–landslide pairs. Floods and earthquakes usually occur on larger spatial scales than landslides and trigger landslides within the already affected area so that the landslide will not add to the number of affected people, even though it may add to the severity in which they are affected.
- 4.
Archetype 4 (“The whole and the parts are limited by total impact”): another pattern could emerge when one hazard causes an ultimate impact to an exposed element, such as total loss of a building or death of a person, or when the impact metric only reports that an element has been affected but not to what degree. In both cases, a second hazard acting on the same elements can no longer increase the value of the impact metric. This could potentially be the case for the number of people affected by extreme wind and flood pairs when the same area is hit by both hazards.
We propose the further investigation and development of archetypes to capture different patterns. Such archetypes could help determine the level of complexity to take into account in risk assessments and risk management for a region of interest if relevant hazard types and impact metrics are known. For some types of hazard and impact, modelling the impact of a dominant hazard may yield a reasonable approximation of the total multi-hazard impact. In other cases, modelling single-hazard impacts separately and summing them may be sufficient. However, in other situations, considering interaction effects is crucial, as they can either increase or decrease the total impact compared to a simple sum of individual impacts. However, further research using more reliable data sources is needed to confirm these archetypes, to validate them for use in forward-looking risk assessments, to explore potentially additional forms of compounding impacts, and to expand them for additional hazard types and impact metrics.
Future research should also be directed at improving the reporting of multi-hazards and their impacts. In the long run, standardised reporting procedures should be established and implemented to ensure that multi-hazards and their impacts are documented sufficiently and consistently. This is essential for aligning research efforts and advancing the disaster risk field, as well as for translating findings into effective policy recommendations for risk assessment and reduction.
In the short term, we recommend improving and supporting the existing information in EM-DAT. To start with, a quality control of the impact data that solely focuses on the most disastrous records could already improve overall reliability because these records dominate any statistical data analysis that is based on mean values or total values. Data science techniques could be explored to automate the identification of errors and inconsistencies. Another key area to improve the usability of EM-DAT would be to develop high-resolution datasets of (multi-)hazard intensities, exposure, and vulnerability that can readily be linked to the disaster records. This would enable a deeper analysis of multi-hazard occurrence and impacts because factors determining the context in which the hazards occurred can be controlled for. Additionally, this could help identify as yet unrecorded impactful events and reduce reporting bias. Finally, consistent and standardised methods to estimate impacts are needed to better enable comparison across countries and even events. Quality of impact data could also be improved by leveraging new impact datasets that are becoming available with novel methods. These datasets should also be made linkable to EM-DAT to enable cross-validation and increase the sample size, which in turn could enable an analysis of (multi-)hazard types that had to be excluded from the statistical analysis in this study.
By accounting for spatiotemporal overlaps between disaster records in EM-DAT, we found that almost 50 % more hazards occurred in a multi-hazard context than previously reported, although substantial uncertainty remains in the identification of multi-hazard events. Despite the uncertainty, the identified multi-hazard events provide promising case studies for investigating impact-relevant spatiotemporal relations between hazards and their role in compounding impacts. Overall, multi-hazards have caused disproportionately high impacts in global disasters, but it appears that there are different patterns of compounding impacts which depend on the impact and hazard type. We conceptualised four distinct archetypes to capture the encountered patterns. In all archetypes, hazard pairs tend to have at least as much impact as single hazards but never less. This suggests that multi-hazard interactions that increase impact tend to outweigh those that decrease it. Nonetheless, we found hazard pairs whose impacts can be higher than, comparable to, or lower than the combined impact of two individual hazards.
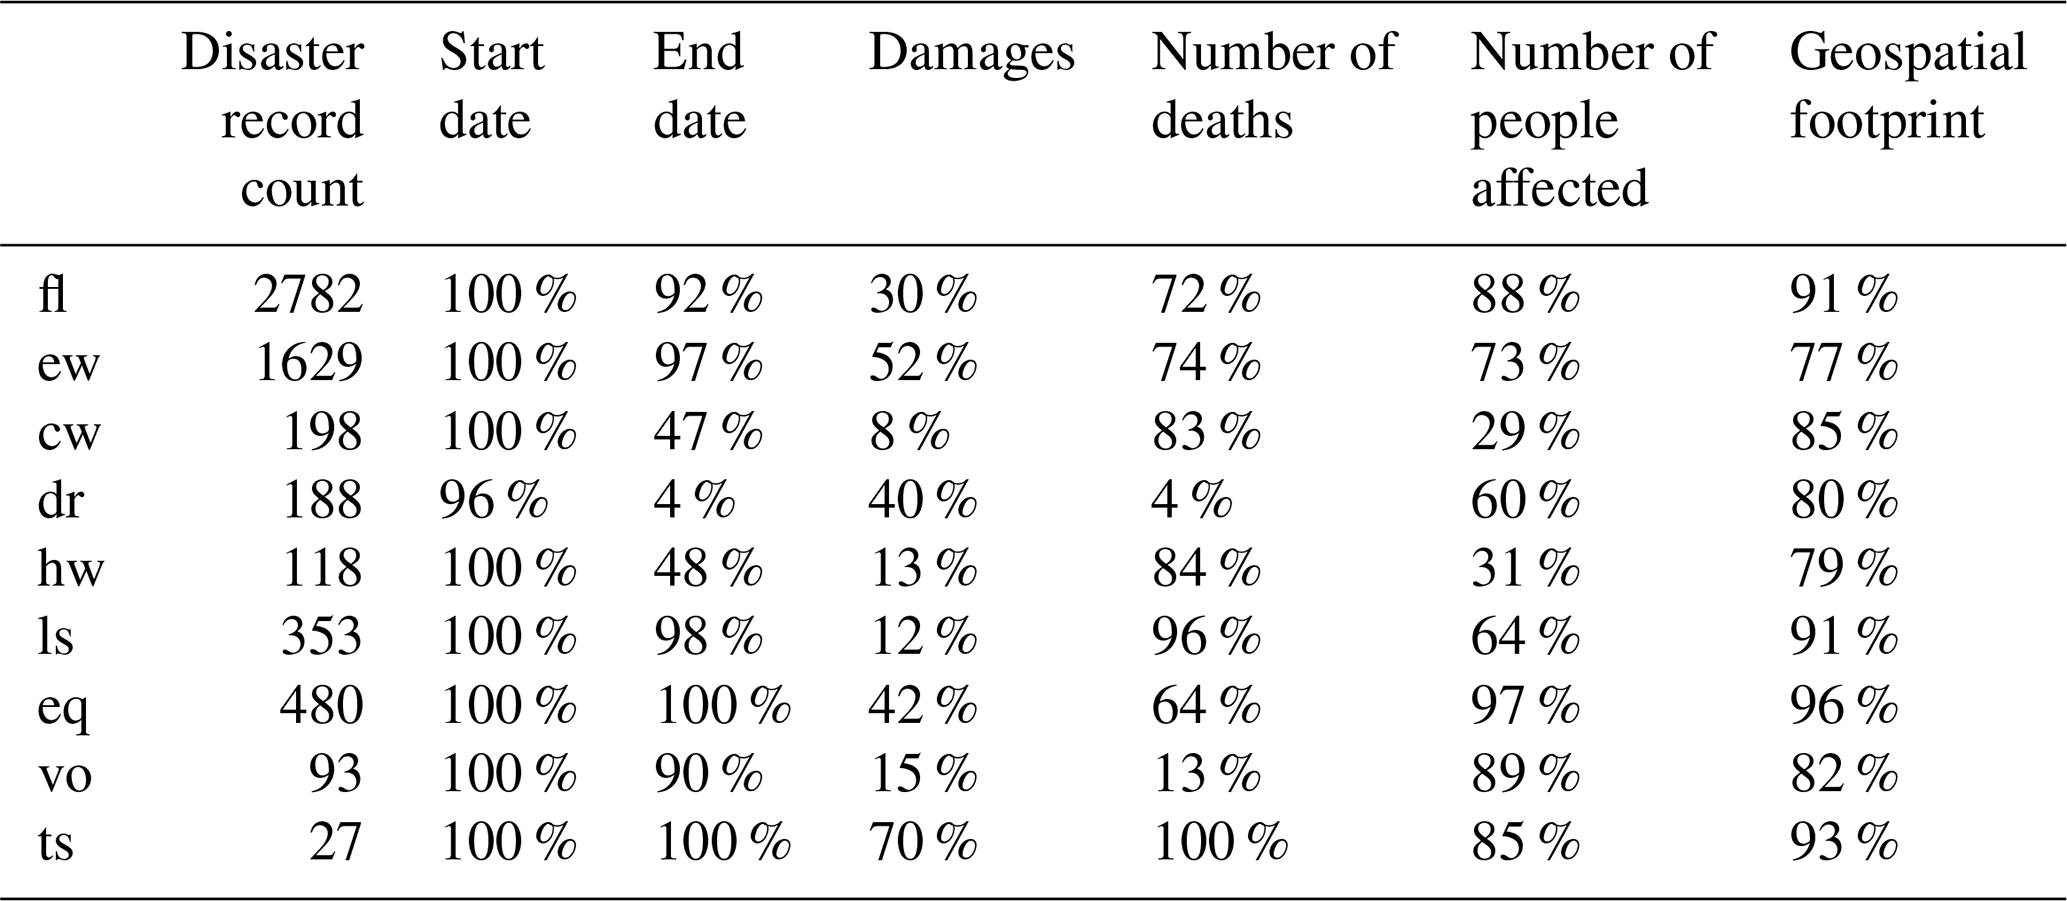
This section is related to method step 3.1.1. The dataset of geo-referenced disaster records covers the period 2000–2018 and the nine hazard types listed in Table 2. It contains 5868 disaster records. Table A1 shows the availability of data in the optional fields in these records. In the case of associated disasters, we assume that empty fields mean that no other hazards have taken place. In all other cases, we assume that data are missing. The temporal information is mostly complete. All disaster records have a start year, start month, and end year. All hazards other than droughts also have an end month. The exact day is missing more frequently.
The availability of impact data depends on the hazard type as well as impact type and ranges from 4 % for number of deaths due to droughts to 100 % for number of deaths due to tsunamis. Human impact is available more than total damages. Availability also fluctuates across the years and continents. For total deaths it ranges from 64 % in 2004 to 78 % in 2007 and from 40 % in Oceania to 79 % in Asia. For total affected it ranges from 73 % in 2010 and 2018 to 87 % in 2017 and from 55 % in Europe to 90 % in Africa. For damages it ranges from 22 % in 2006 to 48 % in 2013 and from 14 % in Africa to 44 % in Oceania.
The availability of spatial footprints also differs per hazard type, year, and continent but less so than the impact variables. It ranges from 77 % for extreme wind to 96 % of earthquakes, from 71 % in 2018 to 93 % in 2006, and from 77 % in Europe to 89 % in the Americas. Overall, we could associate 87 % (5090/5668) of all disaster records with a spatial footprint, which is in line with the 89 % reported by the developers of GDIS (Rosvold and Buhaug, 2021).
Table A1Count of events and the data availability of key variables in the geo-referenced dataset.
These results suggests that data for impact and geospatial footprint are missing not at random in our extracted dataset, which poses a risk of bias in the subsequent analysis. This is in line with the findings of Jones et al. (2022), who identified the year the disaster occurred, income classification of the affected country, and hazard types as significant predictors of missingness for human and economic impact variables in a formal statistical analysis of the entire EM-DAT dataset.
This section is related to method step 3.1.2. Out of the 5868 disaster records, 5090 have spatial footprints. These can be grouped into 12 951 505 unique combinations of two disaster records. There are 107 406 pairs with spatial overlap.
Figure B1 shows a histogram of the intersection percentage. Notable is the high number of disaster record pairs with 0 % overlap and with 100 % when rounded to two decimals. The high number of disaster records with 0 % overlap is likely caused by rounding errors for disaster records that impacted adjacent administrative areas, and these disaster record pairs are considered to not be overlapping. Figure B2a shows an example. The high number of disaster records with 100 % overlap is also likely due to the fact that the resolution is on administrative boundary level: as soon as disaster records are within the same administrative district they fully overlap, whereas only large-scale impact disaster records that affected multiple administrative districts can partially overlap. Figure B2b–c show examples with different overlap percentages.
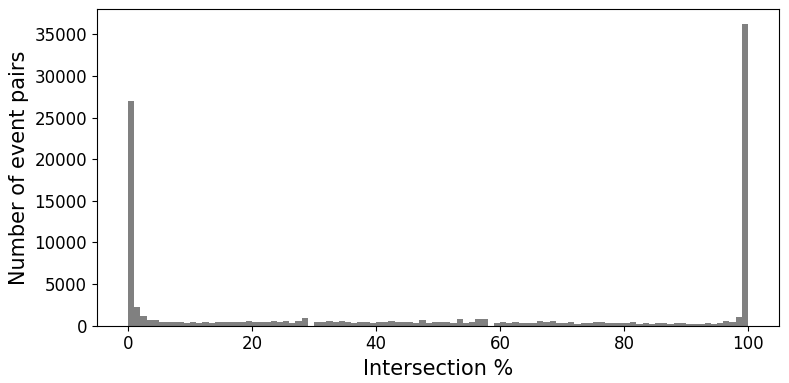
Figure B1Histogram of the intersection percentage of the 107406 EM-DAT disaster records with spatial overlap.
Table B1Number of pairs of overlapping events using different spatial and temporal overlap criteria.
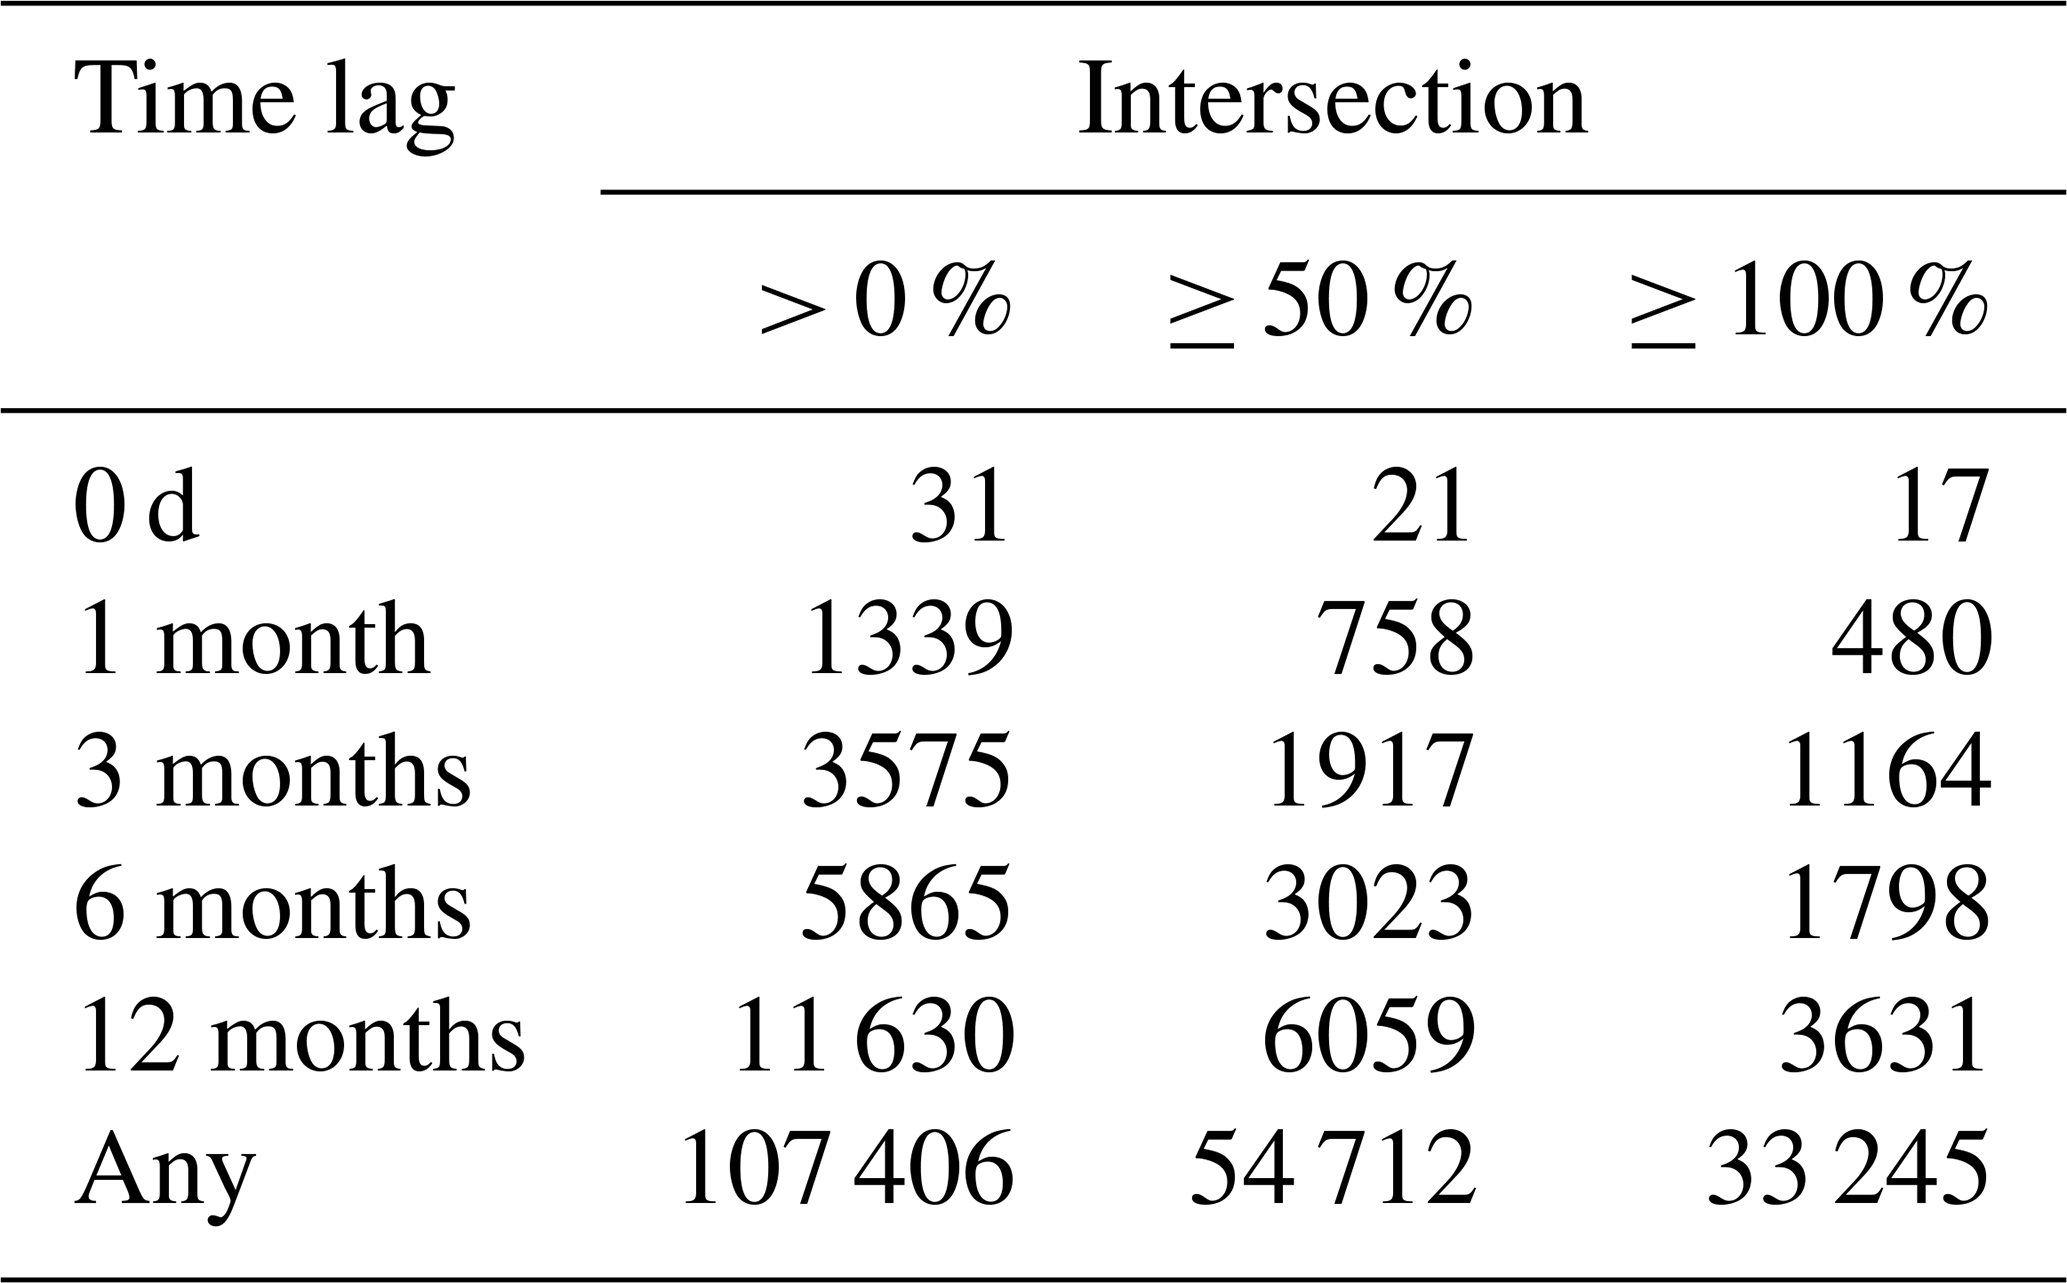
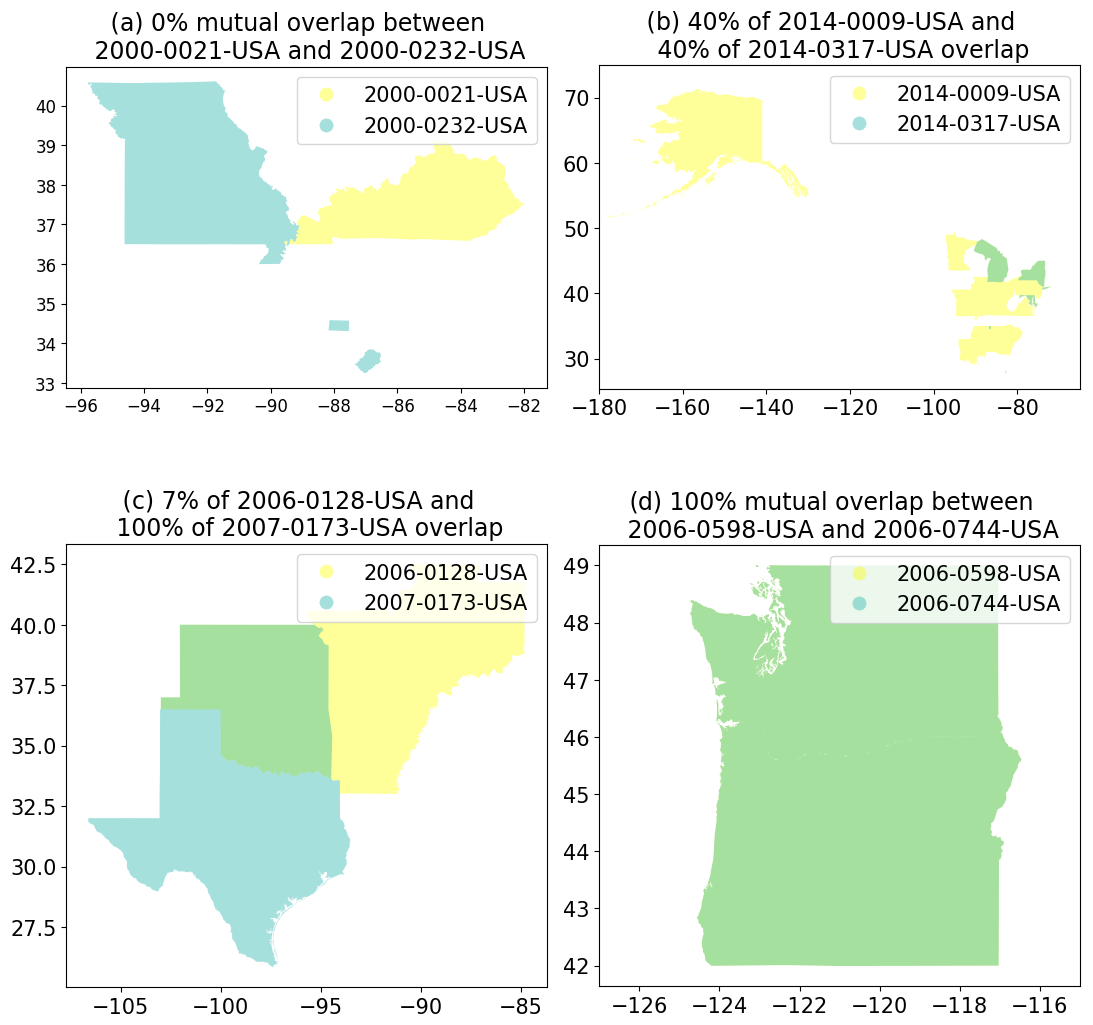
Figure B2Example disaster record pairs with spatial overlap. Individual impact zones are plotted in blue and yellow. The overlapping impact zone is plotted in green.
There is uncertainty as to whether or not the actual impact zones overlap for all pairs of intersecting disaster records because the spatial footprints are an approximation on the level of administrative regions and the disasters are unlikely to have affected the entire region (Rosvold and Buhaug, 2021). This uncertainty could potentially be reduced by considering the combination of the scale of the natural hazards (e.g. landslides are local phenomena, while heatwaves and cold waves are regional or national phenomena), the extent of the damage (e.g. higher damages and fatalities are likely to stem from larger impact zones), and the administrative level of the footprint (e.g. a footprint consisting of multiple district-level polygons which have been joint to a greater area is more likely to represent the actual impact area than a footprint consisting of a single country-level polygon).
For example, in Fig. B2b, disaster record 2014-0009-USA is a cold wave and disaster record 2014-0317-USA is a convective storm associated with a cold wave. As these are larger-scale weather phenomena, the overlapping administrative zone is likely to reflect the actual overlapping impact zone. However, in Fig. B2c, disaster record 2006-0128-USA is a storm associated with a flood and disaster record 2008-0173-USA is a riverine flood; in Fig. B2d, disaster record 2006-0598-USA is a riverine flood associated with heavy rain and disaster record 2006-0744-USA is a storm. In these two cases, additional data on impact extent, or by proxy hazard extent, would be required to confirm actual overlap.
Table B1 shows the number of pairs of overlapping disaster records for different spatial and temporal criteria. As expected, the number of pairs of overlapping disaster records is lowest when requiring a high intersection percentage and a low time lag as overlap criteria.
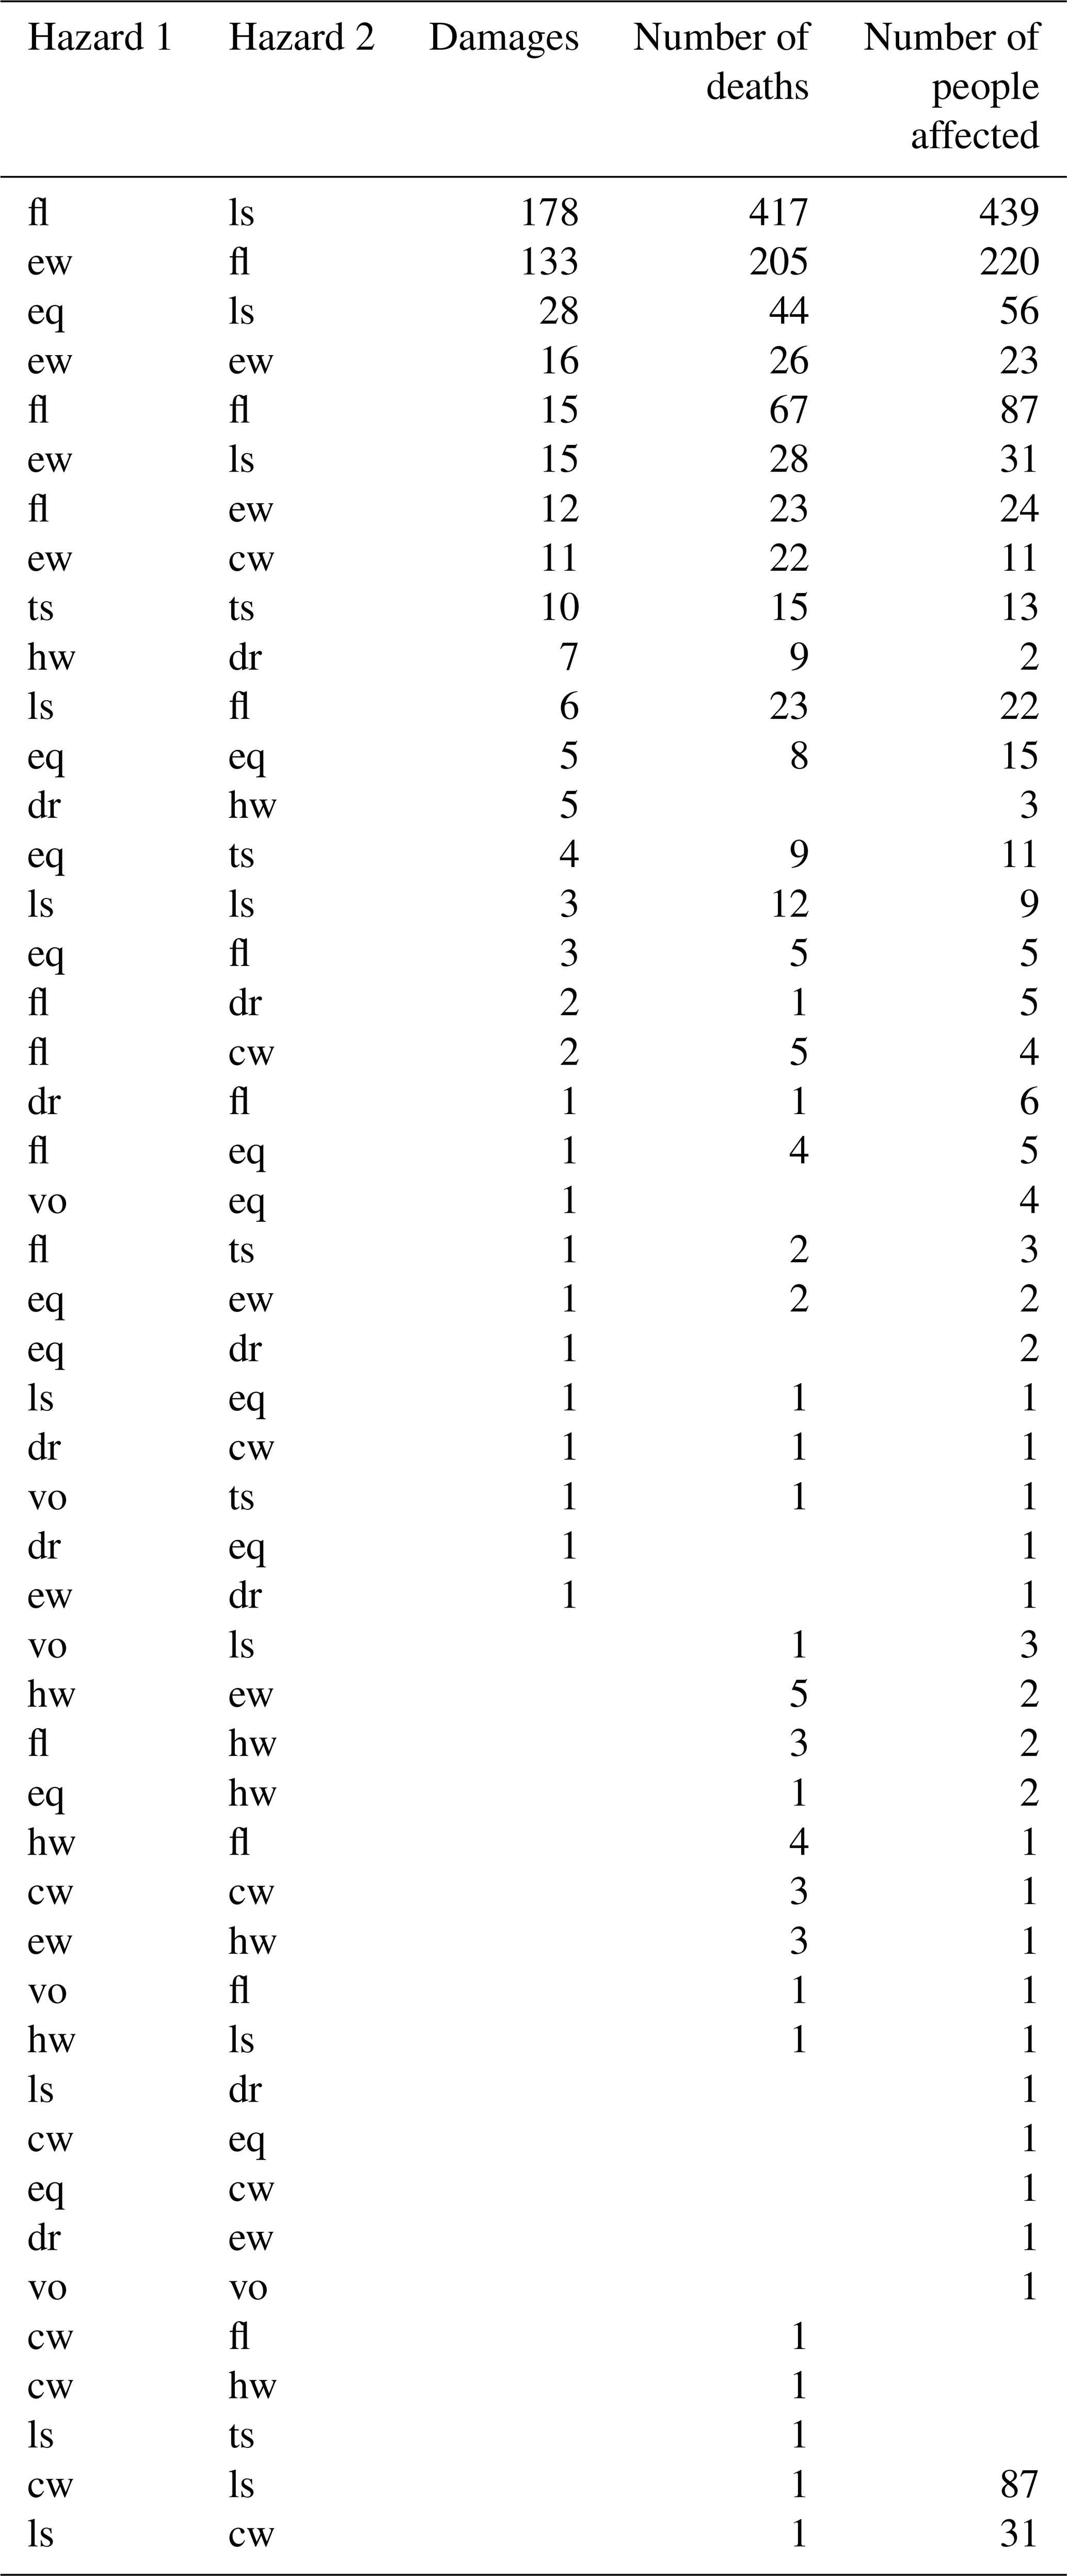
This section presents sample size for the data used in Sect. 4.2. Table C1 shows the sample sizes for single hazards for a spatial overlap of at least 50 % and a maximum time lag of 91 d. Table C2 shows the sample sizes for hazard pairs for a spatial overlap of at least 50 % and a maximum time lag of 91 d.
Table C1Sample sizes of impact data for single hazards for a minimum spatial overlap of 50 % and a maximum time lag 91 d (ew – extreme wind, fl – flood, ls – landslide, eq – earthquake, dr – drought, cw – cold wave, hw – heatwave, vo – volcanic activity, ts – tsunami).
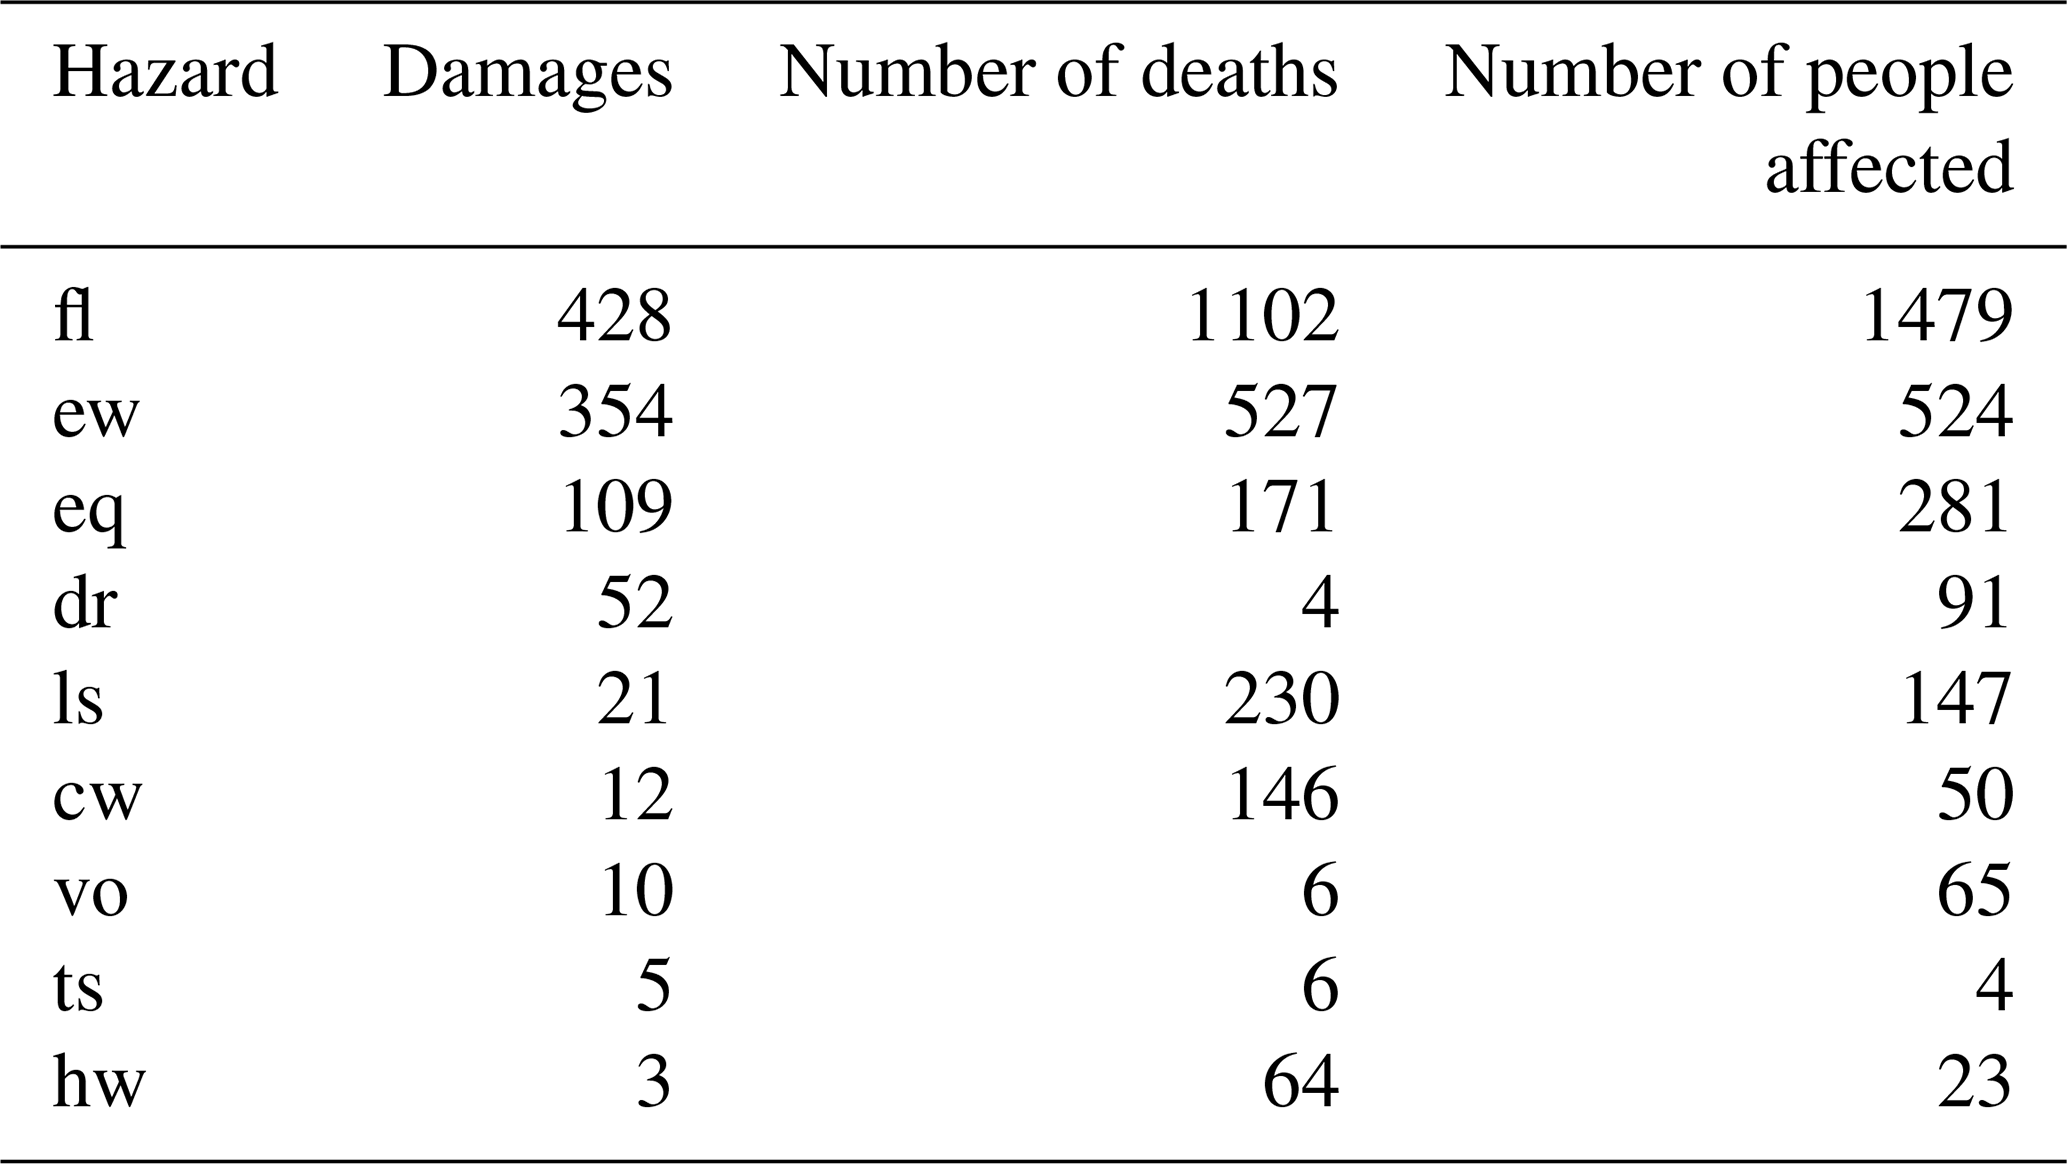
Table C2Sample size of impact data for hazard pairs for a minimum spatial overlap of 50 % and a maximum time lag of 91 d (ew – extreme wind, fl – flood, ls – landslide, eq – earthquake, dr – drought, cw – cold wave, hw – heatwave, vo – volcanic activity, ts – tsunami).
The code used to develop the datasets and to perform the analysis of impacts has been publicly released on GitHub at https://github.com/wiebkejager/emdat-multi-hazards-and-impacts (last access: 5 August 2025) and can also be accessed via https://doi.org/10.5281/zenodo.16748179 (Jäger, 2025). This repository also includes all (intermediate) datasets.
The single- and multi-hazard event datasets compiled during the is study are openly available on Zenodo at https://doi.org/10.5281/zenodo.15012691 (Jäger et al., 2025).
MCdR and PJW conceived the initial idea for the study. WSJ developed, designed, and performed the analysis, interpreted the results, and prepared the paper, with contributions from all co-authors.
At least one of the (co-)authors is a member of the editorial board of Natural Hazards and Earth System Sciences. The peer-review process was guided by an independent editor, and the authors also have no other competing interests to declare.
Publisher’s note: Copernicus Publications remains neutral with regard to jurisdictional claims made in the text, published maps, institutional affiliations, or any other geographical representation in this paper. While Copernicus Publications makes every effort to include appropriate place names, the final responsibility lies with the authors.
This article is part of the special issue “Methodological innovations for the analysis and management of compound risk and multi-risk, including climate-related and geophysical hazards (NHESS/ESD/ESSD/GC/HESS inter-journal SI)”. It is not associated with a conference.
We would like to thank Aloïs Tilloy, Mohammed Sarfaraz Gani Adnan and the anonymous reviewer for their constructive feedback on the article.
This research has been supported by the EU Horizon 2020 (grant no. 101003276), the Nederlandse Organisatie voor Wetenschappelijk Onderzoek (grant no. VI.Veni.222.169), and the SURF Cooperative (grant no. EINF-4493).
This paper was edited by Aloïs Tilloy and reviewed by Mohammed Sarfaraz Gani Adnan and one anonymous referee.
Amini, M. and Memari, A. M.: Review of Literature on Performance of Coastal Residential Buildings under Hurricane Conditions and Lessons Learned, J. Perform. Constr. Fac., 34, 04020102, https://doi.org/10.1061/(ASCE)CF.1943-5509.0001509, 2020.
Berghuijs, W. R., Harrigan, S., Molnar, P., Slater, L. J., and Kirchner, J. W.: The Relative Importance of Different Flood-Generating Mechanisms Across Europe, Water Resour. Res., 55, 4582–4593, https://doi.org/10.1029/2019WR024841, 2019.
Bevacqua, E., De Michele, C., Manning, C., Couasnon, A., Ribeiro, A. F. S., Ramos, A. M., Vignotto, E., Bastos, A., Blesić, S., Durante, F., Hillier, J., Oliveira, S. C., Pinto, J. G., Ragno, E., Rivoire, P., Saunders, K., van der Wiel, K., Wu, W., Zhang, T., and Zscheischler, J.: Guidelines for Studying Diverse Types of Compound Weather and Climate Events, Earths Future, 9, e2021EF002340, https://doi.org/10.1029/2021EF002340, 2021.
Brimicombe, C., Di Napoli, C., Cornforth, R., Pappenberger, F., Petty, C., and Cloke, H. L.: Borderless Heat Hazards With Bordered Impacts, Earths Future, 9, e2021EF002064, https://doi.org/10.1029/2021EF002064, 2021.
Budimir, M. E. A., Atkinson, P. M., and Lewis, H. G.: Earthquake-and-landslide events are associated with more fatalities than earthquakes alone, Nat. Hazards, 72, 895–914, https://doi.org/10.1007/s11069-014-1044-4, 2014.
Claassen, J. N., Ward, P. J., Daniell, J., Koks, E. E., Tiggeloven, T., and de Ruiter, M. C.: A new method to compile global multi-hazard event sets, Sci. Rep., 13, 13808, https://doi.org/10.1038/s41598-023-40400-5, 2023.
Daniels, J. P.: Tropical Storm Grace's heavy rains pour misery on Haiti earthquake survivors, The Guardian, https://www.theguardian.com/global-development/2021/aug/17/haiti-tropical-storm-grace-earthquake-rain (last access: 5 August 2025), 17 August 2021.
De Angeli, S., Malamud, B. D., Rossi, L., Taylor, F. E., Trasforini, E., and Rudari, R.: A multi-hazard framework for spatial-temporal impact analysis, Int. J. Disast. Risk Re., 73, 102829, https://doi.org/10.1016/j.ijdrr.2022.102829, 2022.
Delforge, D., Wathelet, V., Below, R., Sofia, C. L., Tonnelier, M., Loenhout, J. van, and Speybroeck, N.: EM-DAT: the Emergency Events Database, Research Square [preprint], https://doi.org/10.21203/rs.3.rs-3807553/v1, 27 December 2023.
de Ruiter, M. C. and van Loon, A. F.: The challenges of dynamic vulnerability and how to assess it, iScience, 25, 8104720, https://doi.org/10.1016/j.isci.2022.104720, 2022.
de Ruiter, M. C., Couasnon, A., van den Homberg, M. J. C., Daniell, J. E., Gill, J. C., and Ward, P. J.: Why We Can No Longer Ignore Consecutive Disasters, Earths Future, 8, e2019EF001425, https://doi.org/10.1029/2019EF001425, 2020.
DesInventar: https://www.desinventar.net/index.html, last access: 27 January 2025.
Eilander, D., Couasnon, A., Leijnse, T., Ikeuchi, H., Yamazaki, D., Muis, S., Dullaart, J., Haag, A., Winsemius, H. C., and Ward, P. J.: A globally applicable framework for compound flood hazard modeling, Nat. Hazards Earth Syst. Sci., 23, 823–846, https://doi.org/10.5194/nhess-23-823-2023, 2023.
GADM: Database of Global Administrative Areas, https://gadm.org/data.html, last access: 5 July 2024.
Gall, M., Borden, K. A., and Cutter, S. L.: When Do Losses Count?, B. Am. Meteorol. Soc., 90, 799–810, https://doi.org/10.1175/2008BAMS2721.1, 2009.
Gill, J. C. and Malamud, B. D.: Reviewing and visualizing the interactions of natural hazards, Rev. Geophys., 52, 680–722, https://doi.org/10.1002/2013RG000445, 2014.
Gill, J. C. and Malamud, B. D.: Hazard interactions and interaction networks (cascades) within multi-hazard methodologies, Earth Syst. Dynam., 7, 659–679, https://doi.org/10.5194/esd-7-659-2016, 2016.
Guha-Sapir, D. and Below, R.: The quality and accuracy of disaster data: A comparative analyse of 3 global data sets, CRED Working Paper, 18 pp., https://www.cred.be/sites/default/files/Quality_accuracy_disaster_data.pdf (last access: 5 August 2025), 2002.
Harrington, L. J. and Otto, F. E. L.: Reconciling theory with the reality of African heatwaves, Nat. Clim. Change, 10, 796–798, https://doi.org/10.1038/s41558-020-0851-8, 2020.
Hillier, J. K., Matthews, T., Wilby, R. L., and Murphy, C.: Multi-hazard dependencies can increase or decrease risk, Nat. Clim. Change, 10, 595–598, https://doi.org/10.1038/s41558-020-0832-y, 2020.
Hochrainer-Stigler, S., Colon, C., Boza, G., Poledna, S., Rovenskaya, E., and Dieckmann, U.: Enhancing resilience of systems to individual and systemic risk: Steps toward an integrative framework, Int. J. Disast. Risk Re., 51, 101868, https://doi.org/10.1016/j.ijdrr.2020.101868, 2020.
IPCC: Climate Change 2023: Synthesis Report, Contribution of Working Groups I, II and III to the Sixth Assessment Report of the Intergovernmental Panel on Climate Change, edited by: Core Writing Team, Lee, H., and Romero, J., IPCC, Geneva, Switzerland, 14–15, https://www.ipcc.ch/report/ar6/syr/downloads/report/IPCC_AR6_SYR_FullVolume.pdf (last access: 5 August 2025), 2023.
Jäger, W. S.: wiebkejager/emdat-multi-hazards-and-impacts: First release, Version v1.0.0, Zenodo [code], https://doi.org/10.5281/zenodo.16748179, 2025.
Jäger, W. S., Ruiter, de, M. C., Tiggeloven, T., and Ward, P. J.: Dataset of Global Single- and Multi-Hazard Events Based on EM-DAT and GDIS, Version v1, Zenodo [data set], https://doi.org/10.5281/zenodo.15012691, 2025.
Jones, R. L., Guha-Sapir, D., and Tubeuf, S.: Human and economic impacts of natural disasters: can we trust the global data?, Sci. Data, 9, 572, https://doi.org/10.1038/s41597-022-01667-x, 2022.
Jones, R. L., Kharb, A., and Tubeuf, S.: The untold story of missing data in disaster research: a systematic review of the empirical literature utilising the Emergency Events Database (EM-DAT), Environ. Res. Lett., 18, 103006, https://doi.org/10.1088/1748-9326/acfd42, 2023.
Kappes, M. S., Keiler, M., von Elverfeldt, K., and Glade, T.: Challenges of analyzing multi-hazard risk: a review, Nat. Hazards, 64, 1925–1958, https://doi.org/10.1007/s11069-012-0294-2, 2012.
Kornhuber, K., Coumou, D., Vogel, E., Lesk, C., Donges, J. F., Lehmann, J., and Horton, R. M.: Amplified Rossby waves enhance risk of concurrent heatwaves in major breadbasket regions, Nat. Clim. Change, 10, 48–53, https://doi.org/10.1038/s41558-019-0637-z, 2020.
Lee, R., White, C. J., Adnan, M. S. G., Douglas, J., Mahecha, M. D., O'Loughlin, F. E., Patelli, E., Ramos, A. M., Roberts, M. J., Martius, O., Tubaldi, E., van den Hurk, B., Ward, P. J., and Zscheischler, J.: Reclassifying historical disasters: From single to multi-hazards, Sci. Total Environ., 912, 169120, https://doi.org/10.1016/j.scitotenv.2023.169120, 2024.
Leonard, M., Westra, S., Phatak, A., Lambert, M., van den Hurk, B., McInnes, K., Risbey, J., Schuster, S., Jakob, D., and Stafford-Smith, M.: A compound event framework for understanding extreme impacts, WIREs Clim. Change, 5, 113–128, https://doi.org/10.1002/wcc.252, 2014.
Li, Y., Ahuja, A., and Padgett, J. E.: Review of Methods to Assess, Design for, and Mitigate Multiple Hazards, J. Perform. Constr. Fac., 26, 104–117, https://doi.org/10.1061/(ASCE)CF.1943-5509.0000279, 2012.
Liu, B., Siu, Y. L., and Mitchell, G.: Hazard interaction analysis for multi-hazard risk assessment: a systematic classification based on hazard-forming environment, Nat. Hazards Earth Syst. Sci., 16, 629–642, https://doi.org/10.5194/nhess-16-629-2016, 2016.
Moriyama, K., Sasaki, D., and Ono, Y.: Comparison of Global Databases for Disaster Loss and Damage Data, J. Disaster Res., 13, 1007–1014, https://doi.org/10.20965/jdr.2018.p1007, 2018.
Murray, V., Abrahams, J., Abdallah, C., Ahmed, K., Angeles, L., Benouar, D., Brenes Torres, A., Chang Hun, C., Cox, S., Douris, J., Fagan, L., Fra Paleo, U., Han, Q., Handmer, J., Hodson, S., Khim, W., Mayner, L., Moody, N., Moraes, L. L., Osvaldo, Nagy, M., Norris, J., Peduzzi, P., Perwaiz, A., Triyanti, A., Weir, M., and Wright, N.: Hazard Information Profiles: Supplement to UNDRR-ISC Hazard Definition & Classification Review: Technical Report, Geneva, Switzerland, United Nations Office for Disaster Risk Reduction, Paris, France, International Science Council, Geneva, Switzerland, https://doi.org/10.24948/2021.05, 2021.
Nakagawa, S. and Freckleton, R. P.: Missing inaction: the dangers of ignoring missing data, Trends Ecol. Evol., 23, 592–596, https://doi.org/10.1016/j.tree.2008.06.014, 2008.
NOAA: Natural Hazards Data, https://www.ngdc.noaa.gov/hazard/, last access: 27 January 2025.
Panwar, V. and Sen, S.: Disaster Damage Records of EM-DAT and DesInventar: A Systematic Comparison, Econ. Disasters Clim. Change, 4, 295–317, https://doi.org/10.1007/s41885-019-00052-0, 2020.
Paprotny, D., Morales-Nápoles, O., and Jonkman, S. N.: HANZE: a pan-European database of exposure to natural hazards and damaging historical floods since 1870, Earth Syst. Sci. Data, 10, 565–581, https://doi.org/10.5194/essd-10-565-2018, 2018.
Rosvold, E. L. and Buhaug, H.: GDIS, a global dataset of geocoded disaster locations, Sci. Data, 8, 61, https://doi.org/10.1038/s41597-021-00846-6, 2021.
Rubin, D. B.: Inference and missing data, Biometrika, 63, 581–592, https://doi.org/10.1093/biomet/63.3.581, 1976.
Senge, P.: The Fifth Discipline, The Art and Practice of the Learning Organisation, Century, London, 1990.
Simpson, N. P., Mach, K. J., Constable, A., Hess, J., Hogarth, R., Howden, M., Lawrence, J., Lempert, R. J., Muccione, V., Mackey, B., New, M. G., O'Neill, B., Otto, F., Pörtner, H.-O., Reisinger, A., Roberts, D., Schmidt, D. N., Seneviratne, S., Strongin, S., Aalst, M. van, Totin, E., and Trisos, C. H.: A framework for complex climate change risk assessment, One Earth, 4, 489–501, https://doi.org/10.1016/j.oneear.2021.03.005, 2021.
Terzi, S., Torresan, S., Schneiderbauer, S., Critto, A., Zebisch, M., and Marcomini, A.: Multi-risk assessment in mountain regions: A review of modelling approaches for climate change adaptation, J. Environ. Manage., 232, 759–771, https://doi.org/10.1016/j.jenvman.2018.11.100, 2019.
Tierolf, L., Haer, T., Botzen, W. J. W., de Bruijn, J. A., Ton, M. J., Reimann, L., and Aerts, J. C. J. H.: A coupled agent-based model for France for simulating adaptation and migration decisions under future coastal flood risk, Sci. Rep., 13, 4176, https://doi.org/10.1038/s41598-023-31351-y, 2023.
Tilloy, A., Malamud, B. D., Winter, H., and Joly-Laugel, A.: A review of quantification methodologies for multi-hazard interrelationships, Earth-Sci. Rev., 196, 102881, https://doi.org/10.1016/j.earscirev.2019.102881, 2019.
United Nations Office for Disaster Risk Reduction (UNDRR): The Sendai Framework Terminology on Disaster Risk Reduction, https://www.undrr.org/terminology/disaster-risk (last access: 5 August 2025), 2017.
van den Hurk, B. J. J. M., White, C. J., Ramos, A. M., Ward, P. J., Martius, O., Olbert, I., Roscoe, K., Goulart, H. M. D., and Zscheischler, J.: Consideration of compound drivers and impacts in the disaster risk reduction cycle, iScience, 26, 106030, https://doi.org/10.1016/j.isci.2023.106030, 2023.
van Westen, C. J. and Greiving, S.: Multi-hazard risk assessment and decision making, in: Environmental Hazards Methodologies for Risk Assessment and Management, edited by: Dalezios, N. R., IWA Publishing, Chap. 2, 31 pp., https://doi.org/10.2166/9781780407135_0031, 2017.
Ward, P. J., Daniell, J., Duncan, M., Dunne, A., Hananel, C., Hochrainer-Stigler, S., Tijssen, A., Torresan, S., Ciurean, R., Gill, J. C., Sillmann, J., Couasnon, A., Koks, E., Padrón-Fumero, N., Tatman, S., Tronstad Lund, M., Adesiyun, A., Aerts, J. C. J. H., Alabaster, A., Bulder, B., Campillo Torres, C., Critto, A., Hernández-Martín, R., Machado, M., Mysiak, J., Orth, R., Palomino Antolín, I., Petrescu, E.-C., Reichstein, M., Tiggeloven, T., Van Loon, A. F., Vuong Pham, H., and de Ruiter, M. C.: Invited perspectives: A research agenda towards disaster risk management pathways in multi-(hazard-)risk assessment, Nat. Hazards Earth Syst. Sci., 22, 1487–1497, https://doi.org/10.5194/nhess-22-1487-2022, 2022.
Wilhite, D. A., Svoboda, M. D., and Hayes, M. J.: Understanding the complex impacts of drought: A key to enhancing drought mitigation and preparedness, Water Resour. Manag., 21, 763–774, https://doi.org/10.1007/s11269-006-9076-5, 2007.
Zschau, J.: Where are we with multihazards, multirisks assessment capacities?, in: Science for disaster risk management 2017: knowing better and losing less, edited by: Poljansek, K., Marin Ferrer, M., De Groeve, T., and Clark, I., European Union, Brussels, Belgium, https://drmkc.jrc.ec.europa.eu/knowledge/science-for-drm/science-for-disaster-risk-management-2017 (last access: 27 January 2025), 2017.
Zscheischler, J. and Seneviratne, S. I.: Dependence of drivers affects risks associated with compound events, Sci. Adv., 3, e1700263, https://doi.org/10.1126/sciadv.1700263, 2017.
Zscheischler, J., Westra, S., van den Hurk, B. J. J. M., Seneviratne, S. I., Ward, P. J., Pitman, A., AghaKouchak, A., Bresch, D. N., Leonard, M., Wahl, T., and Zhang, X.: Future climate risk from compound events, Nat. Clim. Change, 8, 469–477, https://doi.org/10.1038/s41558-018-0156-3, 2018.
Zscheischler, J., Martius, O., Westra, S., Bevacqua, E., Raymond, C., Horton, R. M., van den Hurk, B., AghaKouchak, A., Jézéquel, A., Mahecha, M. D., Maraun, D., Ramos, A. M., Ridder, N. N., Thiery, W., and Vignotto, E.: A typology of compound weather and climate events, Nat. Rev. Earth Environ., 1, 333–347, https://doi.org/10.1038/s43017-020-0060-z, 2020.
Zuccaro, G., Cacace, F., Spence, R. J. S., and Baxter, P. J.: Impact of explosive eruption scenarios at Vesuvius, J. Volcanol. Geoth. Res., 178, 416–453, https://doi.org/10.1016/j.jvolgeores.2008.01.005, 2008.
“Missing not at random” is a statistical term referring to the likelihood of data being missing being dependent on characteristics of the disaster event (Rubin, 1976), for example, geographic location or disaster type.
The criterion is “=” for all spatial overlap values, except for the 0 % value. In this case the criterion is “>”.
The criterion is “=” for all time lag values.
- Abstract
- Introduction
- Data
- Method
- Results
- Discussion
- Recommendations
- Conclusion
- Appendix A: An exploratory data analysis of the joint EM-DAT and GDIS dataset
- Appendix B: Pairs of spatiotemporally overlapping disaster records
- Appendix C: Sample size of impact data for single hazards and hazard pairs
- Code availability
- Data availability
- Author contributions
- Competing interests
- Disclaimer
- Special issue statement
- Acknowledgements
- Financial support
- Review statement
- References