the Creative Commons Attribution 4.0 License.
the Creative Commons Attribution 4.0 License.
 | 28 Jul 2025
Drought propagation in high-latitude catchments: insights from a 60-year analysis using standardized indices
Claudia Teutschbein
Thomas Grabs
Markus Giese
Andrijana Todorović
Roland Barthel
Droughts, traditionally less associated with high-latitude regions, are emerging as significant challenges due to changing climatic conditions. Recent severe droughts in Europe have exposed the vulnerability of northern catchments, where shifts in temperature and precipitation patterns may intensify drought impacts. This study investigates the dynamics of drought propagation in high-latitude regions, focusing on four key aspects: (1) the typical lag time for drought conditions to propagate from initial precipitation deficits to impacts on soil moisture, streamflow, and groundwater systems; (2) the probability of precipitation deficits leading to these droughts; (3) the key catchment characteristics influencing drought propagation; and (4) the way in which drought propagation has evolved under changing climate conditions. By analyzing long-term observational records from 50 Swedish catchments, the study reveals that drought propagation is highly variable and influenced by a complex interplay of catchment characteristics, hydroclimatic conditions, and soil properties. Soil moisture exhibits the shortest propagation times, often responding within a month to precipitation deficits, while groundwater shows the longest and most variable response times, sometimes exceeding several months. The probability of precipitation deficits propagating into soil moisture droughts is highest, followed by streamflow and groundwater, with these probabilities increasing over time. Across all drought types, annual precipitation and streamflow emerge as the most influential factors governing both propagation time and probability. Although most catchments have become wetter year-round due to climate change, southern catchments are increasingly vulnerable to spring droughts (particularly soil moisture drought), driven by increasing evaporative demand. Despite these hydroclimatic shifts, no significant long-term trends in propagation times or probabilities have been observed over the past 60 years. These findings highlight the need for tailored region-specific water management strategies to address seasonal and regional variations in drought risks, particularly as climate change continues to reshape hydrological regimes.
- Article
(8370 KB) - Full-text XML
- BibTeX
- EndNote


Droughts, typically described as episodic socio-climatologically induced water deficits caused by anomalies in average conditions (Pereira et al., 2006), can occur in any climate zone (Wilhite, 1996; WMO and GWP, 2016). They stand out among natural hazards due to their unique characteristics, progressing gradually with slow onset and long recovery times, making them difficult to identify precisely (Rajsekhar et al., 2015; Spinoni et al., 2015; UNDRR, 2021). Often referred to as “creeping disasters” (Van Loon, 2015), they are subtle but can persist for extended periods and have considerable impacts across various sectors, including water supply quality and quantity, ecosystems, agriculture, and hydropower production (Blauhut et al., 2022; Teutschbein et al., 2023b; UNDRR, 2021).
Although droughts are typically associated with arid or semi-arid regions, recent events, such as the 2018 or the 2022 European droughts (Blauhut et al., 2022; Garrido-Perez et al., 2024; Tripathy and Mishra, 2023), have shown that colder high-latitude regions, including Scandinavia, are also at risk (Bakke et al., 2020; Teutschbein et al., 2022, 2023a). High-latitude catchments, which feature distinct hydrological processes, such as snow accumulation or snowmelt, exhibit unique responses to climate change and drought conditions. These regions are particularly sensitive to climate change (IPCC, 2021) and have already seen substantial alterations in streamflow regimes (Arheimer and Lindström, 2015; Blöschl et al., 2017; Teutschbein et al., 2022) and groundwater recharge (Nygren et al., 2020, 2021). As the climate further warms, changes in temperature and changing precipitation patterns are expected to disrupt snow-related processes even more, leading to profound shifts in the hydrological dynamics in these regions (Arheimer and Lindström, 2015; Irannezhad et al., 2015; Skålevåg and Vormoor, 2021; Teutschbein et al., 2015; Wilson et al., 2010). These changes are likely to intensify the development and propagation of droughts (Ahopelto et al., 2023; Spinoni et al., 2018; Teutschbein et al., 2023b), with complex and multifaceted hydrological consequences.
This complexity arises because drought development involves changes in water fluxes that affect various feedback mechanisms within the hydrological cycle (Van Loon, 2015). Drought propagation is generally understood as a hierarchical top-down process (Changnon, 1987), where variations in precipitation (rain/snow) and temperature (as a proxy for evaporative demand) cause a meteorological drought (Fig. 1). Over time, this can cascade down to other hydrological variables in the water cycle, e.g., to snowpack, soil moisture, streamflow, and groundwater, often occurring in a non-linear manner and with considerable delays (Mukherjee et al., 2018). Deficits in soil moisture that affect soil vegetation and crops are typically framed as agricultural/ecological droughts (Van Loon, 2015), and deficits in streamflow and groundwater as hydrological droughts (Mishra and Singh, 2010). These various types of drought are interlinked through both positive and negative feedback processes (Van Loon, 2015) and the seasonal dynamics of snow and ice add further complexity to the processes. The timing and intensity of snow accumulation and melt can significantly influence water availability, either counteracting or amplifying seasonal precipitation deficits (Staudinger et al., 2014).
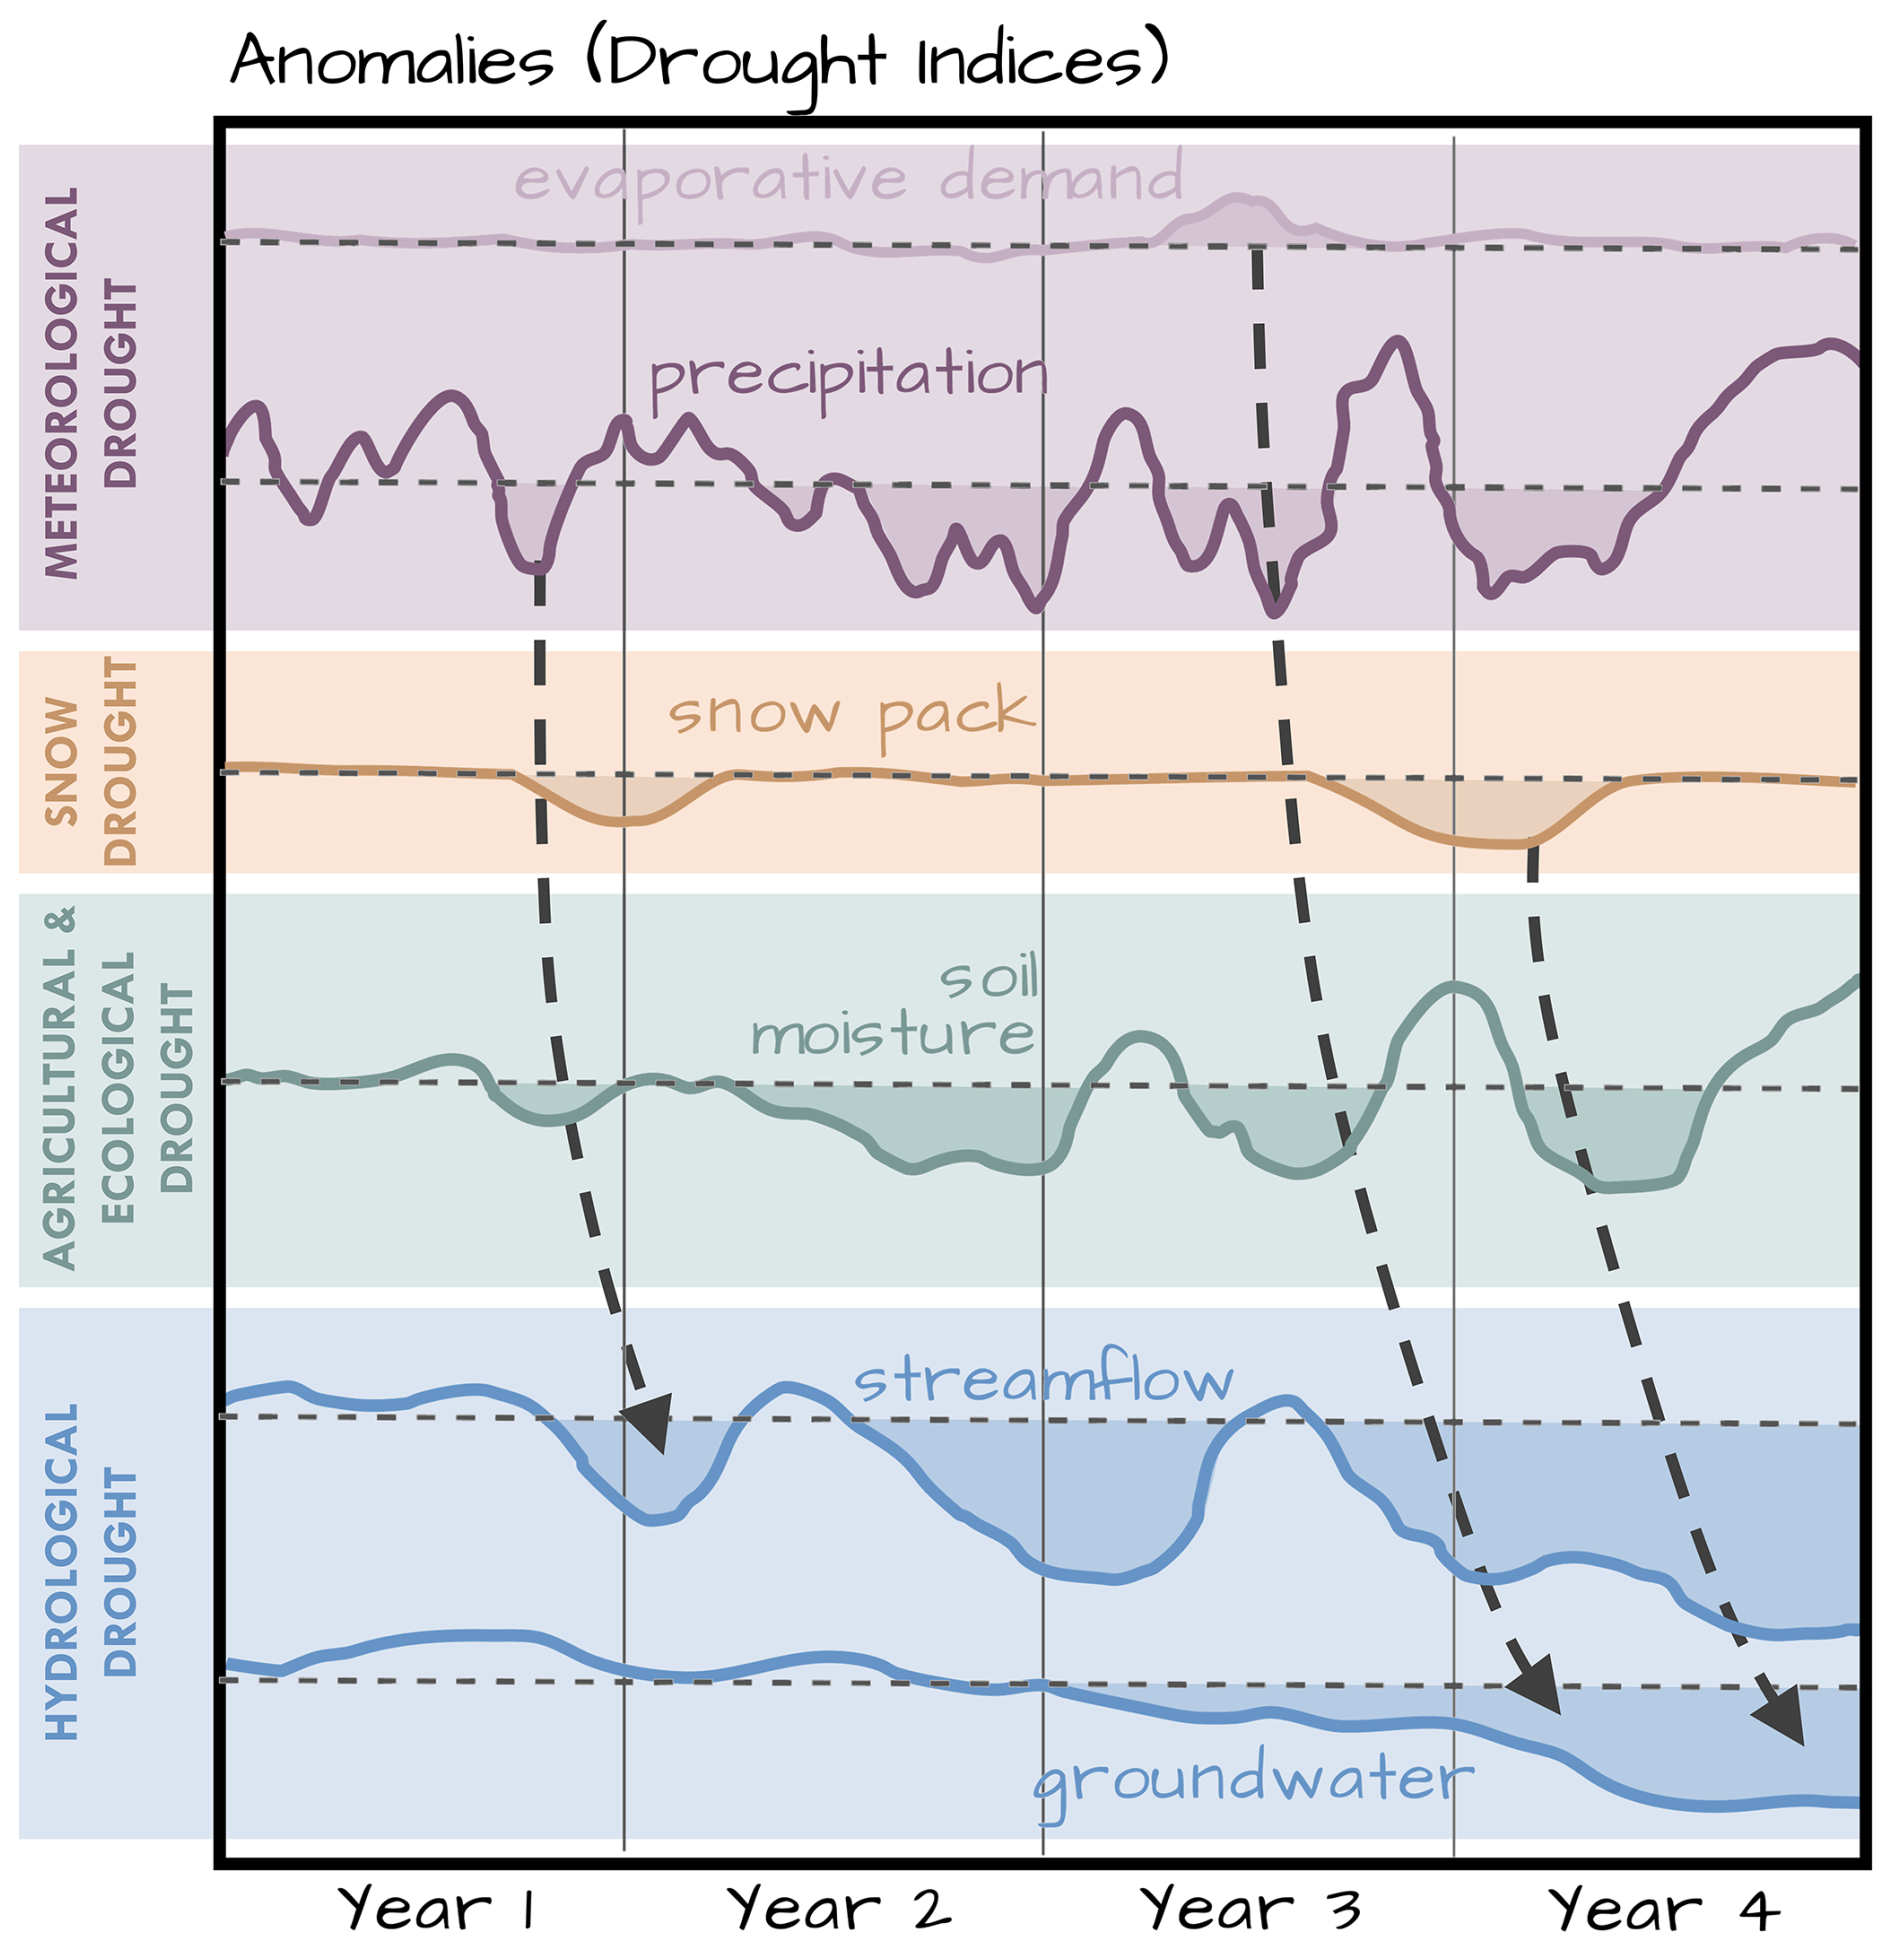
Figure 1Conceptual framework depicting the onset and hierarchical progression of drought within the water cycle (adopted and modified from Changnon, 1987). The framework begins with meteorological drought and illustrates the cascading effects on snowpack and soil moisture, as well as on streamflow and groundwater.
While drought propagation has been examined in other parts of the world, particularly in more temperate and arid regions (Bevacqua et al., 2021; Brunner and Chartier-Rescan, 2024; Entekhabi, 2023; Geng et al., 2024; Heudorfer and Stahl, 2016; Odongo et al., 2023; Sattar et al., 2019), many analyses have focused on individual events, often framed as “storylines” (Chan et al., 2022; Gessner et al., 2022), on large-scale comparative studies (Li et al., 2023; Orth and Destouni, 2018), or on the relationship between only two drought types, such as precipitation and soil moisture (Geng et al., 2024), streamflow (Hellwig et al., 2022; Ma et al., 2021; Zhang et al., 2022a), or groundwater (Bloomfield and Marchant, 2013). In contrast, high-latitude catchments, which are expected to receive more precipitation in a future climate (IPCC, 2021), have not received the same level of systematic and statistical attention, and studies that adopt an integrated approach by simultaneously examining multiple hydrological components remain rare. A key research gap lies in understanding how the heterogeneity in high-latitude catchments, including differences in catchment size, topographic features, land use patterns, and climatic conditions unique to these regions, influences the propagation of precipitation deficits. This gap hampers our ability to discern common patterns and key factors influencing drought propagation, resulting in an incomplete understanding of how droughts evolve and transition across these landscapes. To address these knowledge gaps, this paper seeks to answer the following research questions in the context of high-latitude catchments:
- 1.
What is the typical lag time for drought conditions to propagate from initial precipitation deficits to subsequent impacts on soil moisture, surface water, and groundwater systems in high-latitude catchments?
- 2.
What is the propagation probability of precipitation deficits translating into droughts in soil moisture, surface water, and groundwater in these regions?
- 3.
Which topographic, hydroclimatic, soil, and land-cover characteristics are most strongly linked to drought propagation and progression in high-latitude catchments?
- 4.
How has drought propagation in high-latitude catchments evolved in response to a changing climate?
This study addresses these questions using long-term observational data from 50 Swedish catchments, complemented by ERA5-Land reanalysis data, providing a robust empirical foundation for tracing precipitation deficits through different parts of the hydrological system. The analysis minimizes uncertainty and captures real-world variability in drought responses, which is particularly valuable for understanding complex hydrological processes across diverse northern landscapes.
2.1 Study sites
The propagation of drought was analyzed using the CAMELS-SE dataset (Teutschbein, 2024a, b), which includes data from 50 high-latitude catchments in Sweden (Fig. 2), spanning the years 1961 to 2020. These catchments are distributed across a longitudinal range from 56 to 68° N and encompass all three major climate zones in Sweden (Fig. 2a): the polar tundra climate (ET) in the Scandinavian Mountains of northwestern Sweden, the subarctic boreal climate (Dfc) in central and northern Sweden, and the warm-summer hemiboreal climate zone (Dfb) in southern Sweden (Teutschbein, 2024a; Todorović et al., 2024).
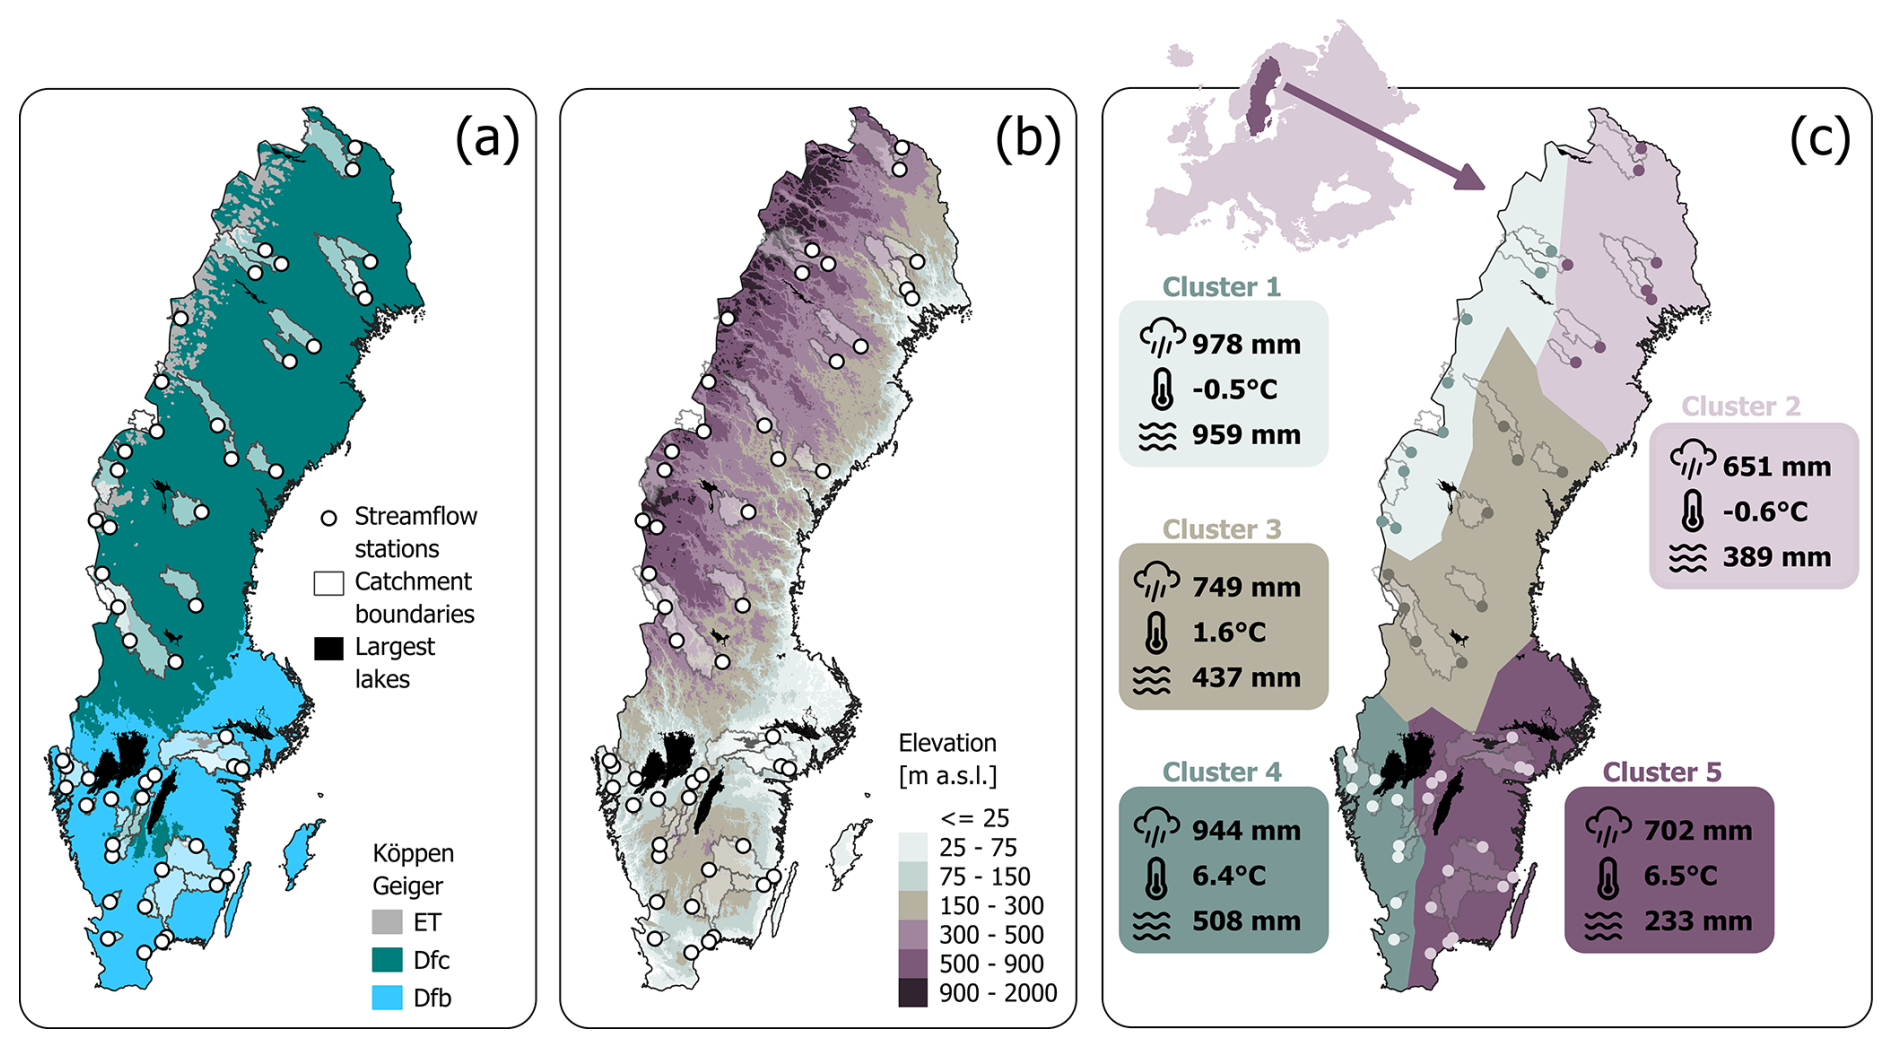
Figure 2Illustration of the 50 streamflow stations along with their catchment areas in relation to (a) Sweden's climate zones, as classified by the Köppen–Geiger system (Beck et al., 2018), encompassing the polar tundra (ET), subarctic boreal (Dfc), and warm-summer hemiboreal (Dfb) climates, (b) elevation data sourced from Lantmäteriet, the Swedish mapping, cadastral, and land registration authority, and (c) hydroclimatic catchment clusters identified by Teutschbein et al. (2022) with their corresponding annual precipitation, mean temperature, and streamflow statistics.
Average elevation across the catchments varies from 12 to 942 m a.s.l. (Fig. 2b), with catchment areas ranging from 2 to 8425 km2. Forests dominate the land cover of these catchments, with only a very few catchments exhibiting intensive agricultural activities. Glaciers and urbanized areas occupy negligible portions of the catchment area, up to 2 % and 3 %, respectively, while lakes and wetlands are generally scarce, with a median area of 12 %. Approximately one-third of the catchments are subject to regulation, though the impact of reservoirs on streamflow is relatively minor (Todorović et al., 2022; Tootoonchi et al., 2023); this is crucial for accurately representing natural drought propagation.
The catchments exhibit different hydroclimatic properties, and can – following the grouping by Teutschbein et al. (2022) – be clustered in five different groups based on their streamflow dynamics (Fig. 2c). The selected catchments are predominantly humid, with the wettest areas, found in western Sweden, characterized by both high precipitation and streamflow (clusters 1, 3, and 4). Snow-dominated and transitional catchments (clusters 1–3) are more common than those dominated by rainfall (clusters 4 and 5). A noticeable north–south temperature gradient exists, with catchments in clusters 1 and 2 featuring mean temperatures below zero, catchments in cluster 3 around 1.6 °C, and catchments in clusters 4 and 5 around 6.5 °C (Fig. 2c). A similar gradient is observed in the runoff coefficient, which reflects the proportion of precipitation converted into runoff rather than lost through evapotranspiration. The highest runoff coefficient is found in cluster 1 (nearly 97 %), followed by clusters 2 (60 %) and 3 (57 %), with clusters 4 (53 %) and 5 (33 %) exhibiting lower values. A detailed description of the physiographic and hydroclimatic features of the catchments can be found in Teutschbein (2024a, b).
2.2 Data
Daily precipitation, temperature, and streamflow data from 1961 to 2020 were obtained from the freely available CAMELS-SE dataset (Teutschbein, 2024a, b) and aggregated into monthly mean values. The daily temperature and precipitation series in the dataset were originally derived from the Swedish Meteorological and Hydrological Institute (SMHI) national precipitation–temperature grid, which has a spatial resolution of 4 km × 4 km (SMHI, 2023; Johansson, 2002).
Due to the lack of long-term soil moisture observations, monthly mean volumetric soil moisture for the uppermost 7 cm of soil over the same period (1961–2020) was obtained from the ERA5-Land reanalysis dataset, which is publicly available at a spatial resolution of 11 km × 11 km through the Copernicus Climate Data Store (Hersbach et al., 2023). Catchment-specific values for precipitation and soil moisture were computed by averaging all grid cells whose centers were fully located within the catchment boundaries.
Monthly mean groundwater observations were downloaded from the Swedish Geological Survey (SGU), which provides measurements for 1506 wells across Sweden on its publicly accessible website. For this study, we selected wells based on the following criteria:
-
located within the boundaries of any of the 50 study catchments or within a 5 km buffer,
-
minimum of 20 years of data coverage,
-
at least 120 data points,
-
no gaps in the data lasting more than 5 months.
A spatial match between groundwater wells meeting these criteria and catchments was found for only 15 out of the 50 catchments, enabling the study of drought propagation throughout the entire hydrological system in these areas. The number of groundwater wells within the 15 catchments varied from 1 to 14. Data gaps up to 5 months were filled using the average of normalized groundwater levels from the remaining wells in the catchment when more than one well was available and otherwise through linear interpolation.
2.3 Drought identification through standardized drought indices
Numerous drought indices have been developed over the past decades to simplify the complex task of identifying and quantifying droughts using single interpretable values (WMO and GWP, 2016). To identify periods of drought across different components of the water cycle (Fig. 1), we selected the following widely used dimensionless standardized drought indices that express droughts as a deviation from normal hydroclimatic conditions:
-
The standardized precipitation index (SPI), originally proposed by McKee et al. (1993), is based exclusively on precipitation data. Due to its adaptability across various spatial and temporal scales, it has become a widely used tool in drought comparison studies. The World Meteorological Organization (WMO) and other institutions have recognized the SPI as the primary method for assessing meteorological drought (WMO and GWP, 2016).
-
The standardized soil moisture index (SSMI), as described by Sheffield and Wood (2007), is derived from volumetric soil moisture values. These values echo the combined effects of a range of hydrological processes, such as plant transpiration, soil evaporation, infiltration, runoff, and the accumulation and melting of snow.
-
The standardized streamflow index (SSFI) operates on a similar concept to the previous indices but utilizes streamflow data instead (Vicente-Serrano et al., 2011). It is commonly used to quantify hydrological droughts (Vicente-Serrano et al., 2012).
-
The standardized groundwater index (SGI), developed by Bloomfield and Marchant (2013), standardizes groundwater-level time series to characterize groundwater droughts. Given the complexity of groundwater flow systems, the SGI is useful for understanding fluctuations in groundwater levels and storage in response to variations in water input.
Each index was calculated by first fitting a suitable probability distribution to the monthly time series of the respective variable. This allowed the determination of cumulative probabilities, which were subsequently converted into standardized values (so-called z scores) assuming a normal distribution with a mean of 0 and a standard deviation of 1. These z scores represent by how many standard deviations a given value deviates from the mean and directly represent the standardized drought index. Positive values reflect conditions that are wetter than average (i.e., no drought), while negative scores correspond to drier-than-normal conditions, typically classified as extreme drought ≤−2, severe drought ≤−1.5, moderate drought ≤−1.0, and mild drought ≤0. All indices were calculated for different aggregation periods (i.e., for 1, 3, 6, 12, and 24 months), following the procedures described in Teutschbein et al. (2022). Aggregation over shorter time spans (less than 3 months) highlights short-term variability and is useful for assessing immediate drought impacts. In contrast, longer aggregation periods (more than 6 months) are better suited for identifying prolonged anomalies and the cumulative influence of drought across the water cycle.
The computation of all standardized indices is influenced by both the data record length (Wu et al., 2005) and the type of probability distribution applied (Stagge et al., 2015). We followed the methodology outlined by Teutschbein et al. (2022) and tested 16 one-, two, and three-parameter probability distributions (Fig. 3) for each considered series (four indices, obtained for 50 gauging stations and 12 months of the year at five different aggregation periods) separately. For a detailed description and corresponding equations of each tested distribution, we refer the reader to Teutschbein et al. (2022). To determine the most suitable distribution for each case, we utilized Kuiper's goodness-of-fit test (Kuiper, 1960).
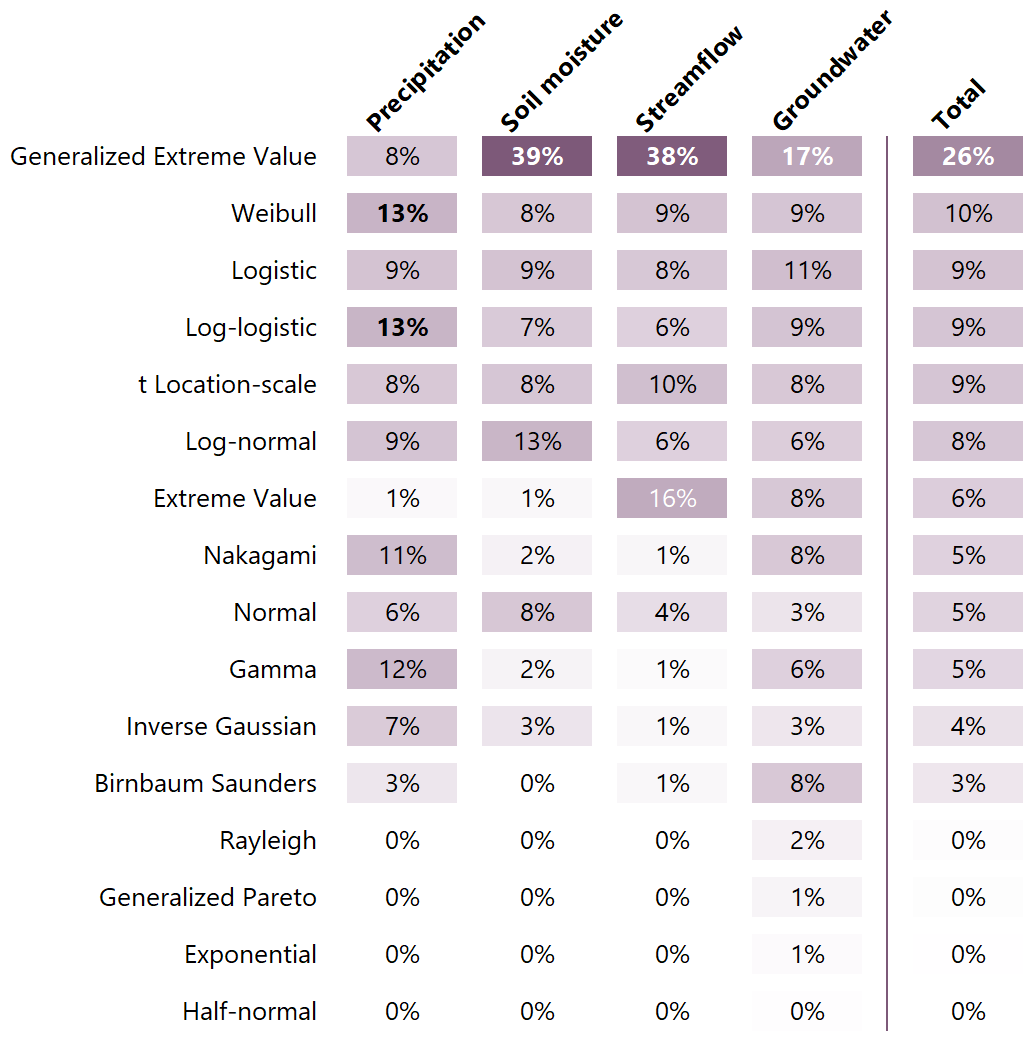
Figure 3Summary of 16 candidate distributions and the percentage of times each was selected as the best fit for 3 month aggregated data across the four hydrological variables. The final column shows the overall selection frequency across all fitting instances. Best-fitting distributions are highlighted in varying shades of purple, with darker shades indicating higher selection percentages.
2.4 Detection of spatiotemporal patterns
To explore overarching spatiotemporal drought patterns, we examined the standardized drought indices based on both 3 and 12 month aggregation periods, covering the full observation period from 1961 to 2020 and including all studied catchments. This approach enabled us to detect distinct drought episodes and assess their geographical distribution. Particular attention was given to identifying possible north–south gradients, which were expected due to regional differences in evaporation dynamics and snow-related processes, such as accumulation and melt.
2.5 Statistical analysis of drought propagation
For all statistical analyses of drought propagation described in this section, we adopted the 3 month aggregation period, which is regularly used to evaluate drought effects on such sectors as drinking water supply, industrial operations, hydropower generation, and freshwater ecosystems (Bae et al., 2019; Stagge et al., 2015). The choice of a 3 month period strikes a balance between capturing the immediate effects of precipitation deficits and the broader seasonal impacts.
2.5.1 Propagation time
Given the inherent complexity of hydrological processes and their interactions, considerable variability in drought responses is expected across different hydrological components. To assess how various components react to precipitation deficits, we calculated the cross-correlation between the SPI and the three other indices (SSMI, SSFI, and SGI), focusing exclusively on periods when SSMI, SSFI, or SGI indicated moderate, severe, or extreme drought (i.e., indices ), thus excluding mild droughts and non-drought conditions from the analysis. Cross-correlation served as a metric to quantify the similarity between the SPI time series and the lagged time series of the other indices, with lags ranging from 1 to 12 months.
Following the procedure outlined by Bloomfield and Marchant (2013), which was initially applied to groundwater response times, we used the lag time that produced the highest Spearman's rank correlation coefficient θs (Spearman, 1904) as an indicator of response times. Lag time is a commonly used metric to describe drought propagation (Odongo et al., 2023; Zhang et al., 2022b); shorter lag times indicate a faster response of a specific component to SPI changes.
In this study, we determined propagation times from precipitation to soil moisture, streamflow, and groundwater separately for each catchment and the results were grouped and analyzed according to catchment cluster (c.f. Fig. 2c) to facilitate the identification of spatial patterns.
2.5.2 Propagation probability
To investigate the role of precipitation deficits in triggering drought conditions across the hydrological system, we conducted a probabilistic analysis focused on the occurrence of different drought types following a precipitation drought event. After identifying precipitation droughts with (i.e., excluding mild droughts) as separate events/runs, we evaluated whether corresponding deficits in soil moisture (SSMI), streamflow (SSFI), or groundwater (SGI) could be observed within different drought propagation time frames. This analysis is captured by the conditional probability:
Here, indexlag represents any of the drought indices for soil moisture, streamflow, or groundwater (i.e., SSMI, SSFI or SGI) at a given temporal lag. Therefore, is the conditional probability of any of the drought indices indicating drought conditions given that a precipitation drought (indicated by SPI < −1) has already occurred.
In this analysis, we tested all possible time lags ranging from 1 to 12 months. This involved starting with the probability that a precipitation drought would cause a soil moisture, streamflow, or groundwater drought within the same month, then extending the analysis to include the same and subsequent months, and so forth, up to 12 months.
We also performed this analysis separately for each season, categorizing months as follows: spring (March–May; MAM), summer (June–August; JJA), autumn (September–November; SON), and winter (December–February; DJF). To assess the variation of clusters within each season, we utilized the coefficient of variation (CV).
This conditional probability framework provides insights into how precipitation deficits propagate through the hydrological system, reflecting the strength and timing of drought signal transmission across different hydrological components (Zhu et al., 2021). It offers a useful approach to highlight how precipitation shortages can trigger subsequent soil moisture, streamflow, or groundwater droughts.
2.5.3 Governing factors of drought propagation
To explore the relationship between propagation time and probability, considering underlying catchment characteristics and hydroclimatic factors, we employed the non-parametric Spearman's rank correlation coefficient θs (Spearman, 1904). This statistical approach allowed us to assess correlations across all pairwise combinations of standardized drought indices and a comprehensive range of potential influencing factors. These factors included geographic and physical attributes such as latitude, catchment area, elevation, and slope, as well as hydrological and climatic variables like the degree of regulation (DOR), regulation volume, annual mean precipitation, annual mean temperature, and annual streamflow. Additionally, we considered the impact of soil type and land cover variation, such as the percentage of forest cover or agricultural land.
The choice of Spearman's rank correlation over the linear Pearson product-moment correlation (Pearson, 1920) was driven by its ability to capture a monotonic relationship without assuming any specific form of the relationship, such as linearity or logarithmic behavior. This flexibility is particularly advantageous for drought propagation through the hydrological system because relationships between variables often do not follow a strict linear pattern (Mukherjee et al., 2018). By using Spearman's correlation, we ensured that our analysis could detect and quantify both linear and non-linear associations, providing a more robust understanding of how different catchment and climatic characteristics influence drought propagation dynamics.
2.6 Droughts and their propagation in a changing climate
The extensive 60-year observational data record encompassed two “climate normal periods” (CNPs), each representing a 30-year climatological baseline as defined by the World Meteorological Organization (WMO Climatological Normals, 2021). This provided a unique opportunity to conduct an assessment of potential long-term shifts in droughts and their propagation in high-latitude catchments. Specifically, we investigated whether there were significant differences in the drought indices, the propagation time, and the propagation probability in each catchment cluster between the CNPs of 1961–1990 and 1991–2020, utilizing the non-parametric Wilcoxon rank sum test (Asadzadeh et al., 2014; Montgomery and Runger, 2010). This analysis focused primarily on precipitation drought propagation into soil moisture and streamflow, as the available groundwater observations were not of sufficient length for such an assessment.
To analyze variations in annual drought conditions, we utilized 12 month aggregated drought indices (SPI-12, SSMI-12, SSFI-12), calculated for September each year. This selection covers the full hydrological year, from the preceding October through to the current September. For seasonal drought conditions, we employed 3 month aggregated drought indices (SPI-3, SSMI-3, SSFI-3) corresponding to the final month of each season: May (spring, MAM), August (summer, JJA), November (autumn, SON), and February (DJF).
3.1 Spatiotemporal drought patterns across the hydrological system
The computed standardized indices (SPI, SSMI, SSFI, and SGI) for the 3 month aggregation period highlight multiple significant drought periods across the country, with both temporal and spatial variations evident across the different hydrological components (Fig. 4, left panels). We also showcase the less noisy 12 month aggregation period to facilitate visual comparisons of different catchments and drought indices (Fig. 4, right panels). Notably, two pronounced drought periods, occurring in the late 1960s and mid-1970s, affected the entire country and had major impacts on the hydrological system. These events began with precipitation deficits, as indicated by the SPI (Fig. 4a, b), and propagated through to soil moisture (Fig. 4c, d), streamflow (Fig. 4e, f), and groundwater systems (Fig. 4g, h), with each component experiencing drought conditions for several months.
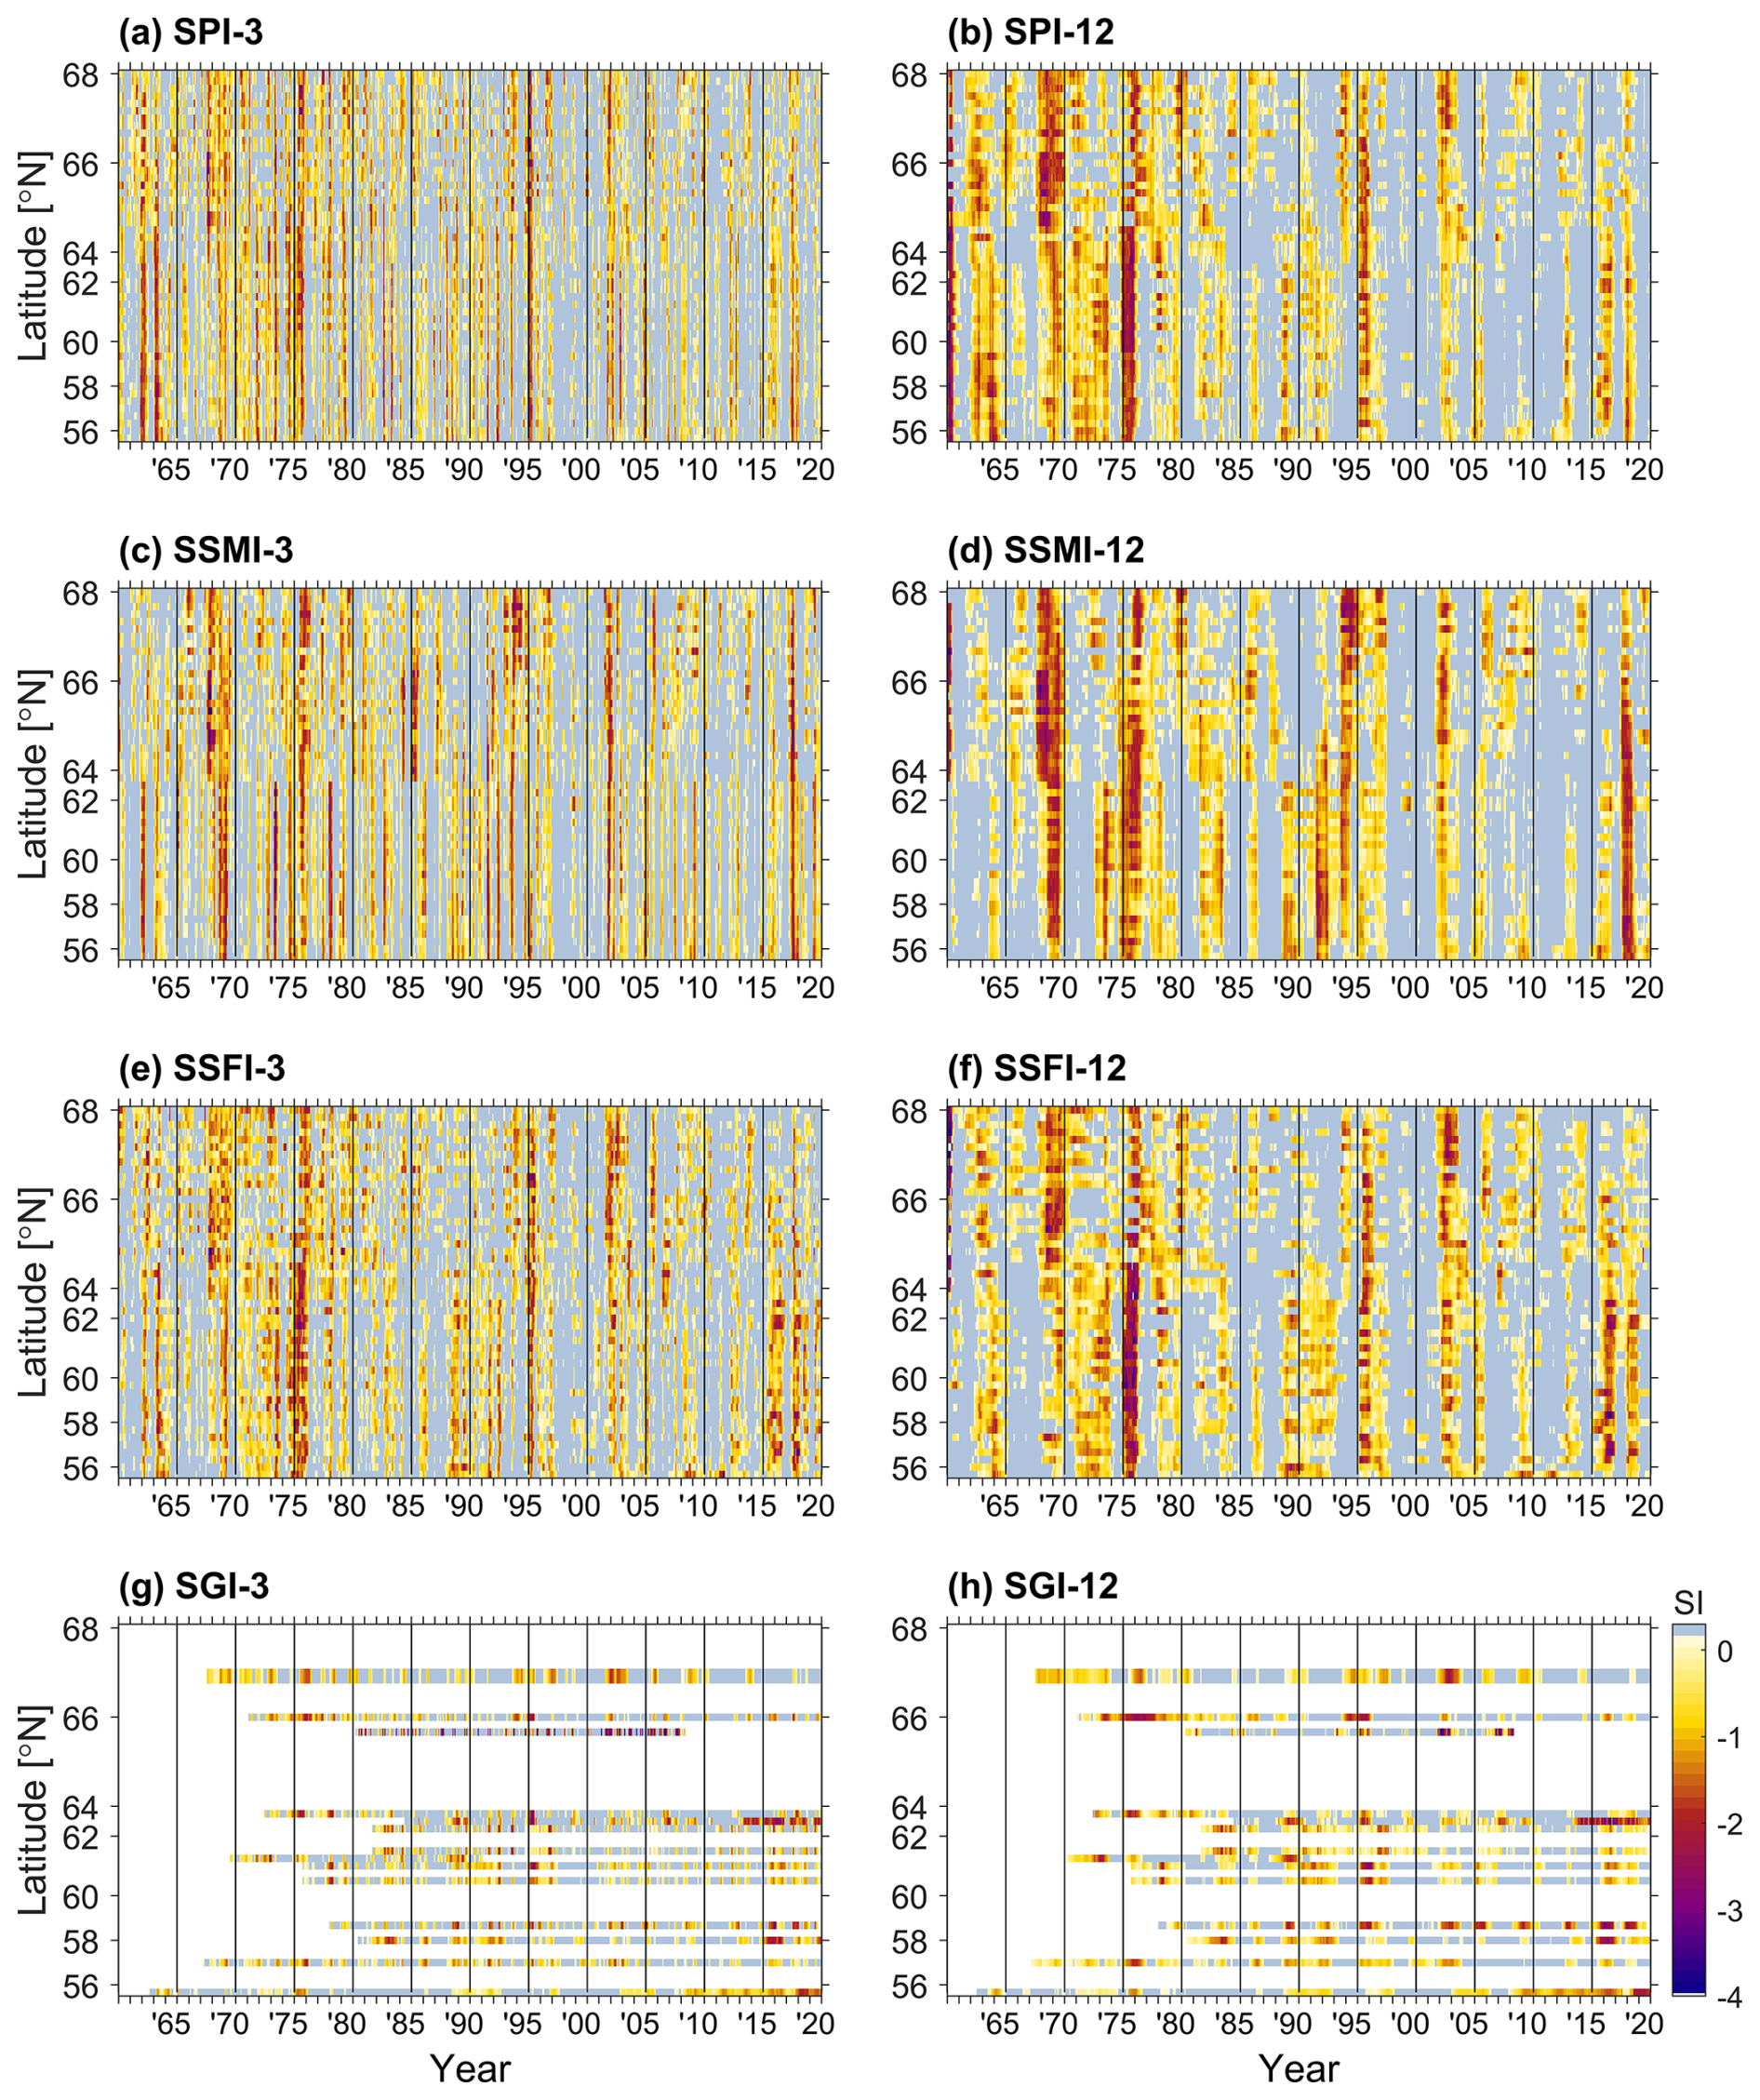
Figure 4Computed standardized indices for all Swedish study catchments from 1961–2020, sorted by latitude on the y axis (with uneven spacing reflecting variations in catchment density across latitudes) and time on the x axis. Panels show (a, b) precipitation (SPI), (c, d) soil moisture (SSMI), (e, f) streamflow (SSFI), and (g, h) groundwater (SGI) over two different aggregation periods: 3 month indices (a, c, e, g) and less noisy 12 month indices (b, d, f, h). Light blue indicates non-drought conditions, yellow indicates mild drought, and darker red and blue represent more severe drought. White areas in SGI (g, h) denote missing values.
The droughts of 1996 and the 2003 European heatwave are also clearly visible across all hydrological components, demonstrating the widespread effects of these events. Similarly, more recent droughts, particularly those in 2016/17 and 2018, are well represented, affecting soil moisture, streamflow, and groundwater, although the severity and extent vary by region.
Beyond these general patterns, the standardized indices also reveal notable spatial variations in how different hydrological components were affected by droughts. For example, the early 1990s drought primarily affected catchments in southern Sweden, where the impact on soil moisture (Fig. 4c, d) was substantially stronger compared with other components. Similarly, the droughts of 2016/17 and 2018 display distinct spatial patterns: while precipitation and streamflow deficits were observed nationwide, groundwater levels were disproportionately affected in southern Sweden.
3.2 Propagation time
The cross-correlation analysis uncovered differences in drought propagation times across the five identified clusters (Fig. 5). Soil moisture exhibited the shortest propagation times across all clusters, with average response times ranging from 0.1 to 2.7 months, highlighting its sensitivity to short-term climatic fluctuations. Streamflow showed slightly longer propagation times compared with soil moisture, with some regional differences observed. The western/central clusters 1, 3, and 4 (Fig. 5a, c, e) exhibited response times of 0.9 to 2.4 months, whereas the other two clusters – cluster 2 (Fig. 5b) and cluster 5 (Fig. 5d) – had somewhat longer average response times, of 3 and 3.5 months, respectively. This suggests that while streamflow responds quickly to precipitation deficits, the speed of this response is influenced by regional hydrological and climatic conditions.
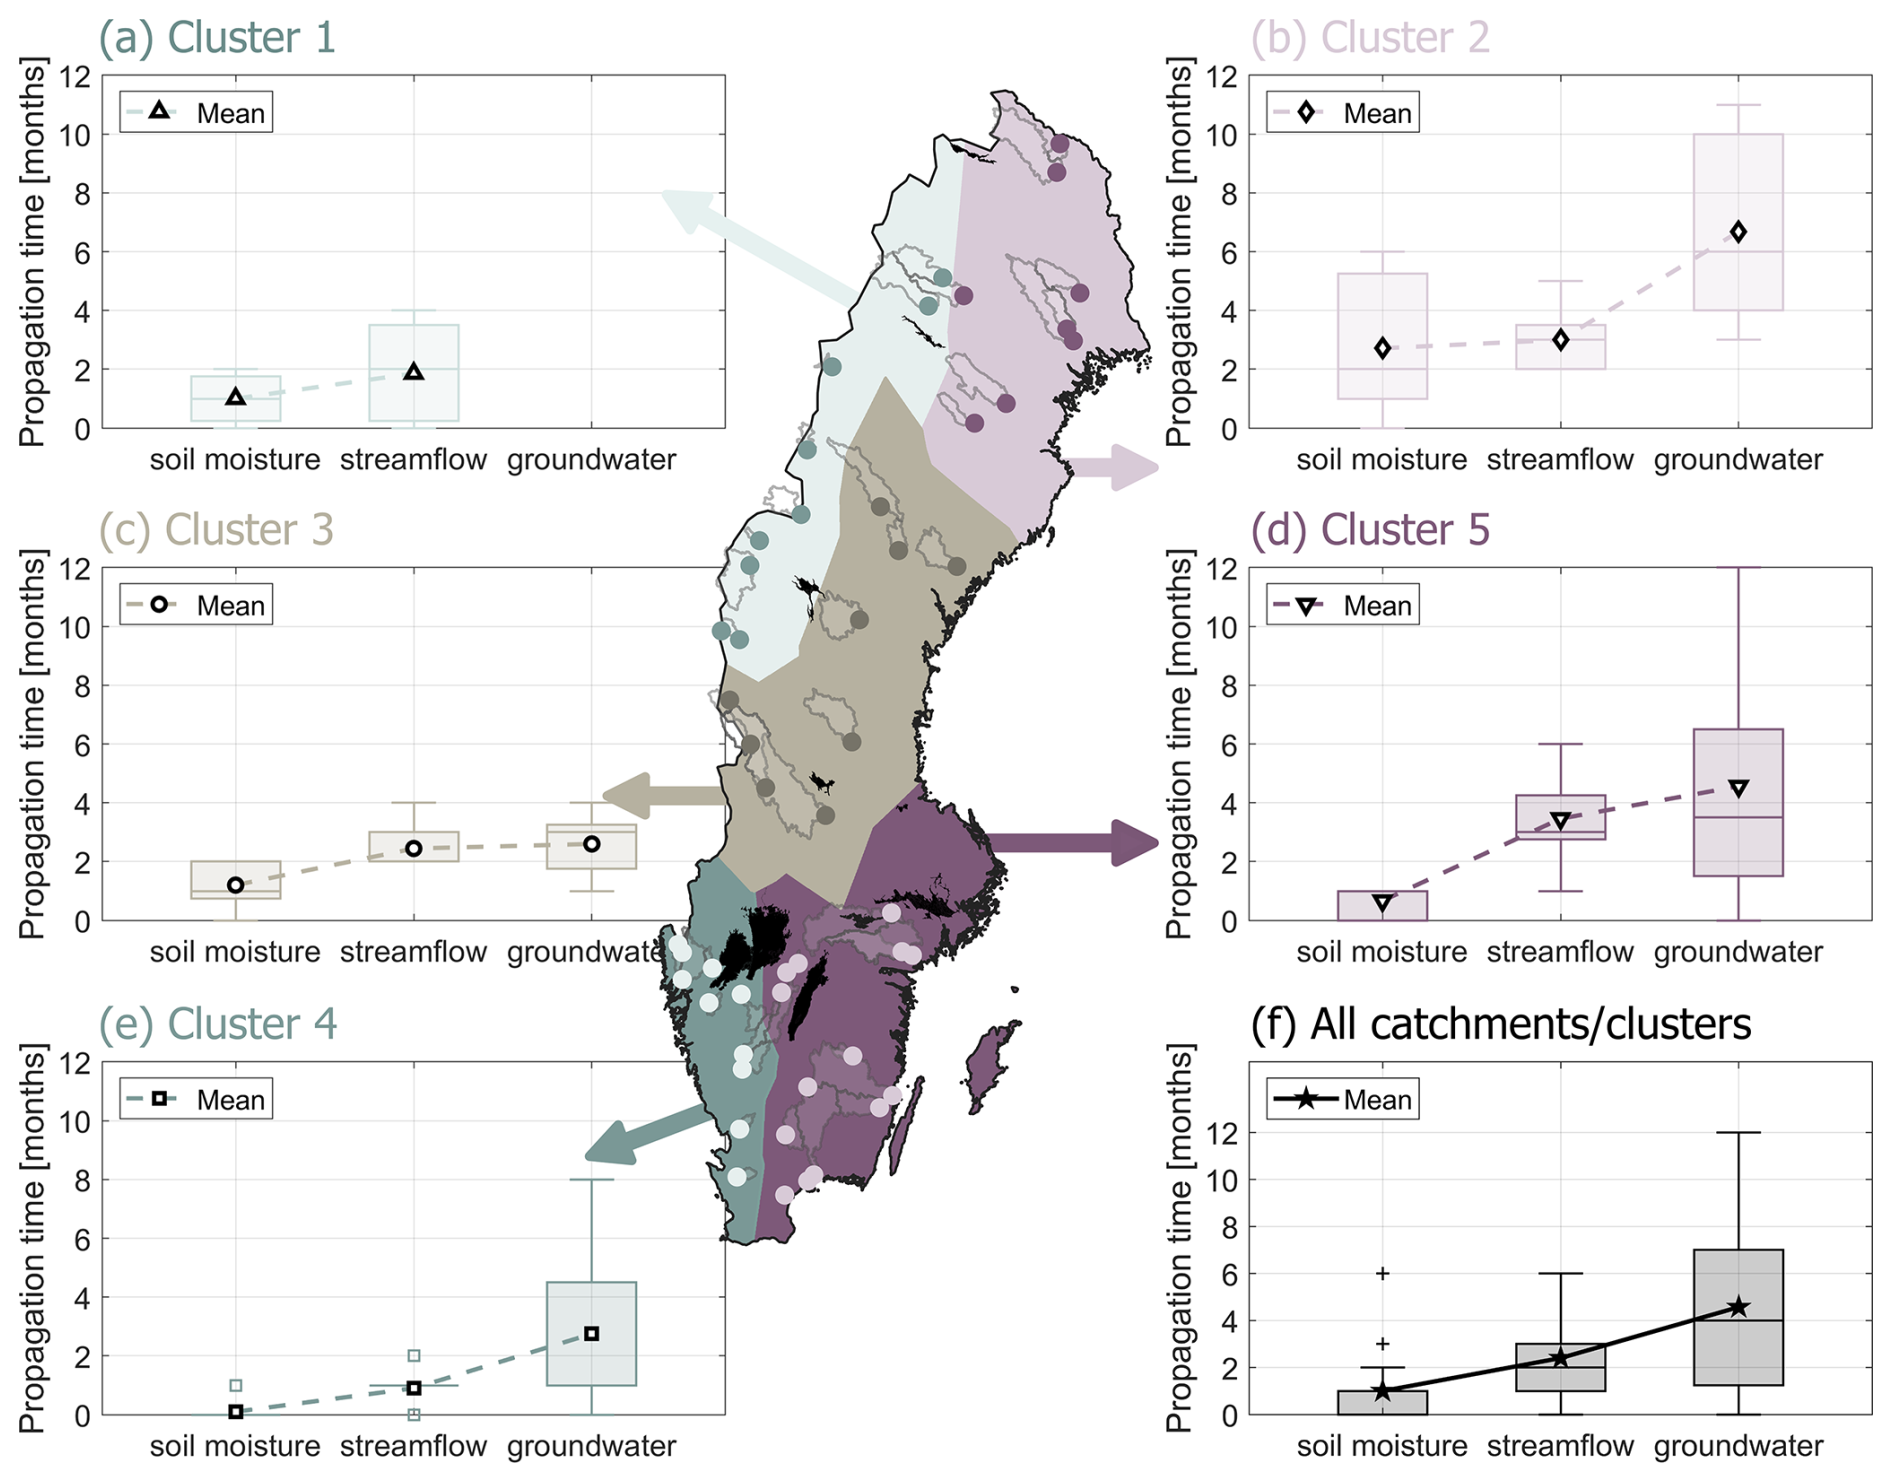
Figure 5Propagation times (in months) from precipitation deficits to soil moisture, streamflow, and groundwater drought in Sweden, across (a–e) the five different catchment clusters and (f) all catchments.
Groundwater displayed the longest and most variable propagation times among the hydrological components analyzed. The response times varied considerably across clusters, with slightly longer response times in eastern clusters 2 and 5. Note that the northwestern cluster 1 (Fig. 5a) had only one groundwater observation in the region, for which no correlation could be found to precipitation deficits. In the other clusters, average groundwater response times ranged from 2.6 to 6.7 months.
Groundwater also exhibited the highest internal variability within each cluster, with differences of several months between the fastest and slowest responses. Clusters 2 and 5 were particularly notable, with differences of up to 10 months observed between the shortest and longest groundwater response times. This high variability underscores the complexity of groundwater dynamics and its longer, more delayed, response to precipitation deficits compared with other hydrological components.
Across all 50 catchments in Sweden (Fig. 5f), soil moisture responds to precipitation deficits within an average of 1 month, streamflow responds in 2 months, and groundwater within 4 months.
3.3 Propagation probability
To quantify how precipitation deficits contribute to the development of more severe droughts in other hydrological components, we analyzed conditional probabilities. The systematic assessment of step-wise time lags (Fig. 6) revealed that, at the shortest lag of 1 month, a precipitation deficit resulted in an agricultural/ecological drought in 48 % of cases, a streamflow drought in 41 % of cases, and a groundwater drought in 38 % of cases (Fig. 6a). As the lag times are progressively extended month by month, the likelihood of a precipitation drought triggering subsequent droughts in other components increased considerably. Over time, the frequencies of agricultural/ecological, streamflow, and groundwater droughts converged, indicating a more uniform occurrence of drought across the hydrological system.
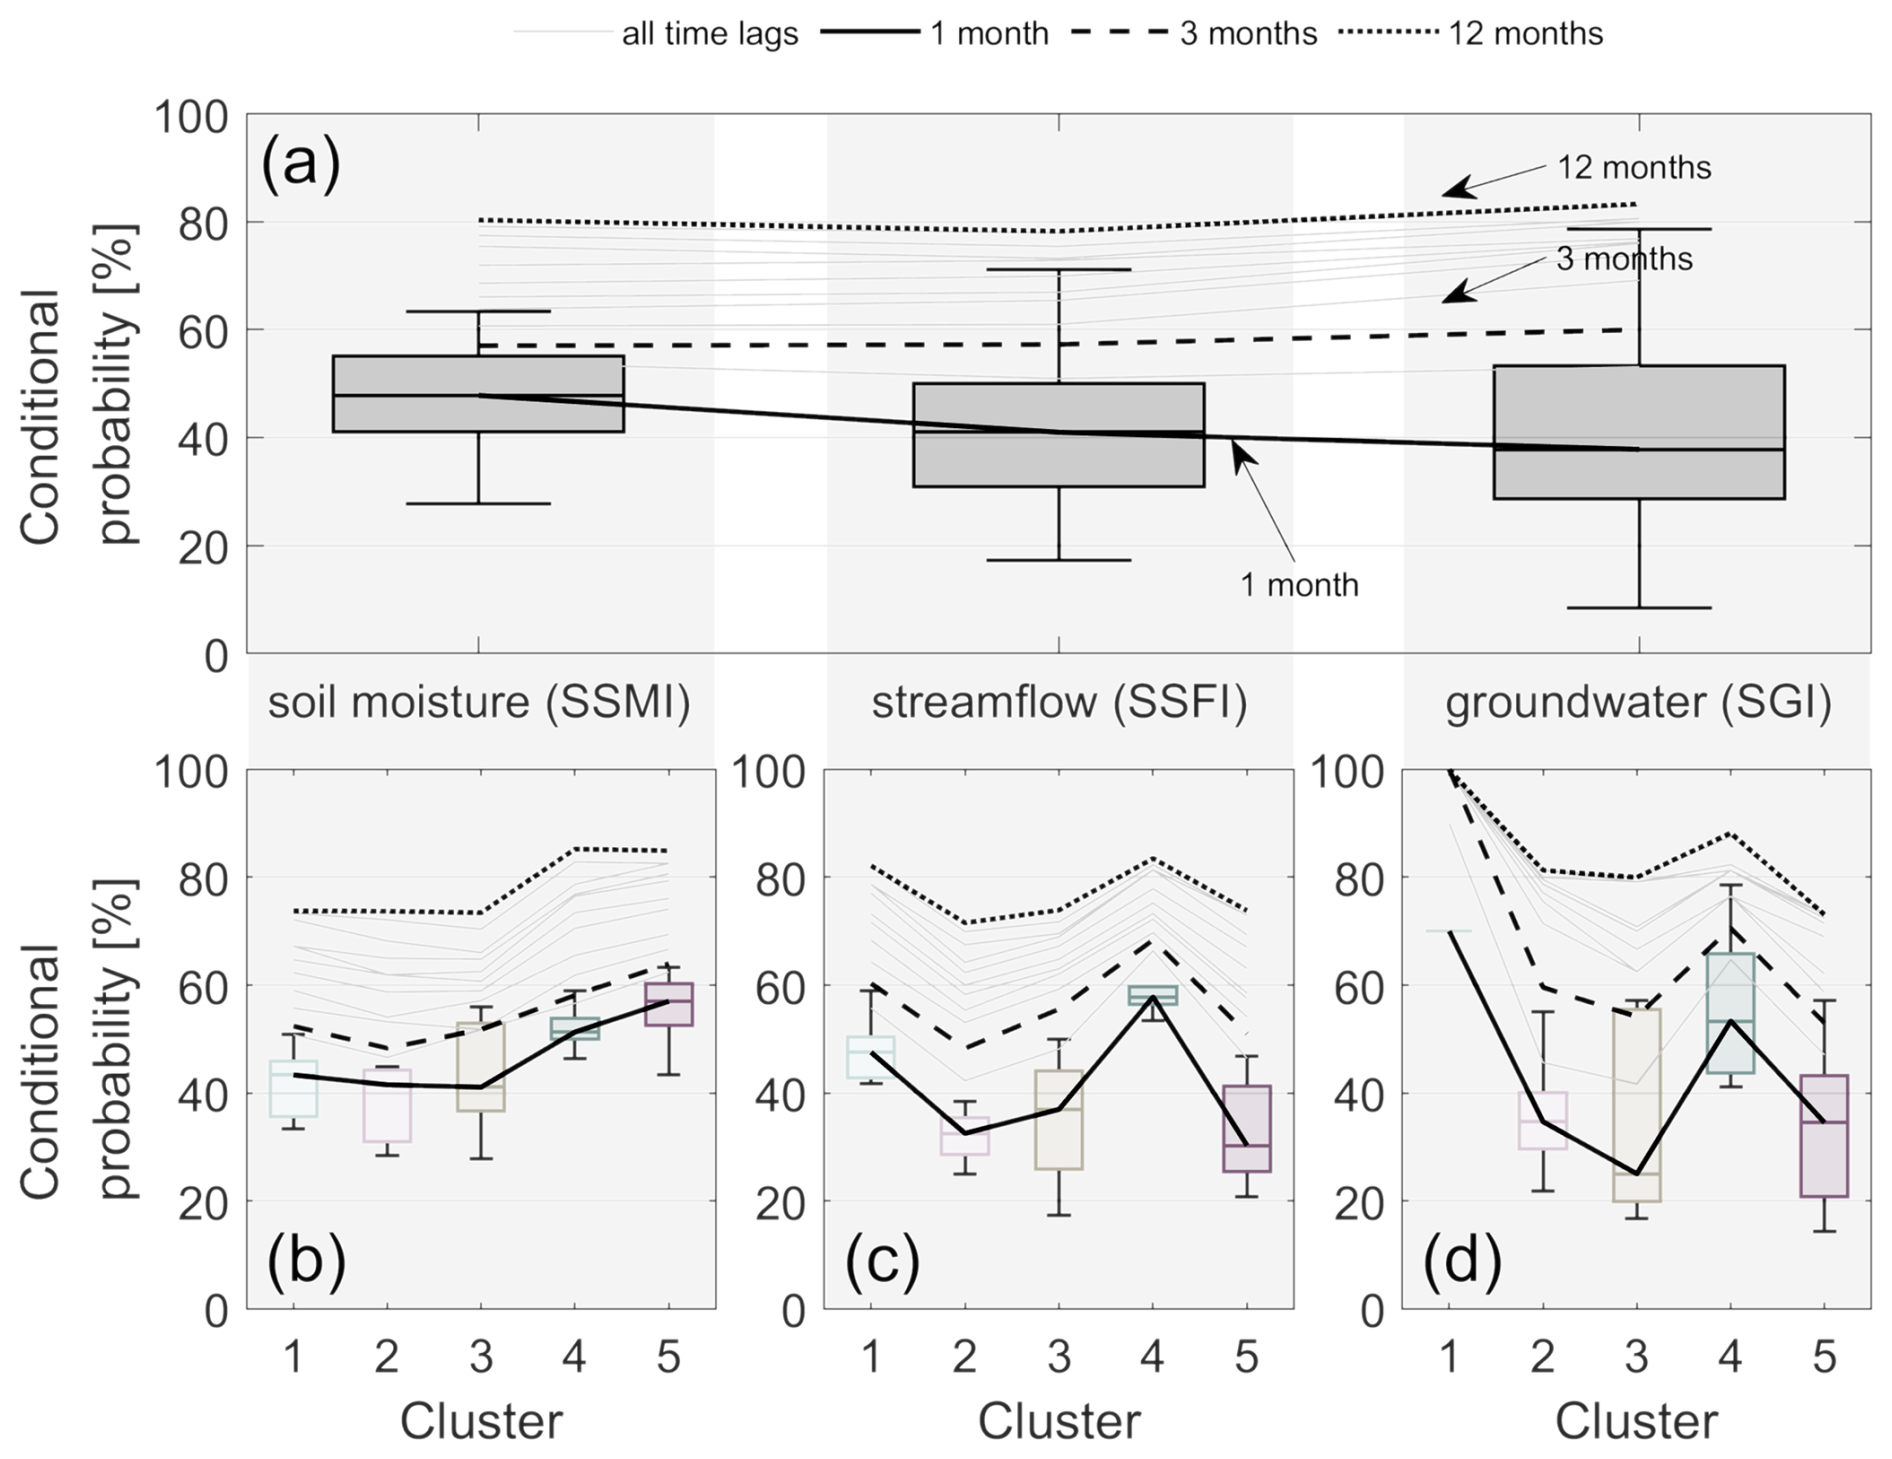
Figure 6Probability of a moderate, severe, or extreme precipitation drought (SPI<1) triggering subsequent droughts in soil moisture, streamflow, or groundwater (SSMI, SSFI, or ) across different time lags. Panel (a) shows the overall conditional probability for all catchments combined. The boxplots depict the distribution of probabilities across catchments, with the solid black line representing the median probability for a 1 month lag time. The thin gray lines correspond to the median probabilities for step-wise increasing time lags, while the lines for 3 and 12 months are highlighted for clarity. The bottom panels provide a detailed breakdown by cluster for (b) soil moisture (SSMI), (c) streamflow (SSFI), and (d) groundwater (SGI), respectively.
Across the clusters, the conditional probability of a soil moisture drought occurring within 1 month of a precipitation deficit ranged from 41 % to 43 % in northern clusters 1–3, increasing to 51 % and 57 % in southern clusters 4 and 5. As the time lag increased, the probabilities rose, and the differences between northern and southern catchments became less pronounced. This general pattern also applied to streamflow (Fig. 6c) and groundwater droughts (Fig. 6d). However, these components did not exhibit as strong a north–south gradient. Instead, the propagation probabilities across the different clusters were more balanced, with the exception of cluster 4, located in southwestern Sweden, where the probabilities of precipitation deficits propagating to streamflow or groundwater consistently remained 20 %–30 % higher than in other Swedish regions.
The propagation probabilities varied not only across clusters but also across seasons (Fig. 7). The biggest difference can be seen in the propagation probabilities for soil moisture (Fig. 7a), where the highest propagation probabilities occurred in summer. This means that a precipitation deficit of in summer had, on average, a 68 % probability of inducing a soil moisture drought within 1 month, while the probability in spring and winter was less than 40 %. This pattern was also consistent for longer time lags. For streamflow, the pattern was less pronounced. At a 1 month time lag, the propagation probability was slightly higher in the autumn (45 %) than in the other seasons (≈40 %, Fig. 7b), though the differences were not statistically significant. However, when considering longer time lags, spring consistently showed somewhat higher propagation probabilities (Fig. 7b). For groundwater, propagation probabilities remained fairly consistent – ranging from 34 % to 39 % in spring, summer, and winter (Fig. 7c). Only autumn stuck out with somewhat lower probabilities (32 % at 1 month lag), a pattern that persisted across all time lags, though the differences were modest and statistically insignificant.
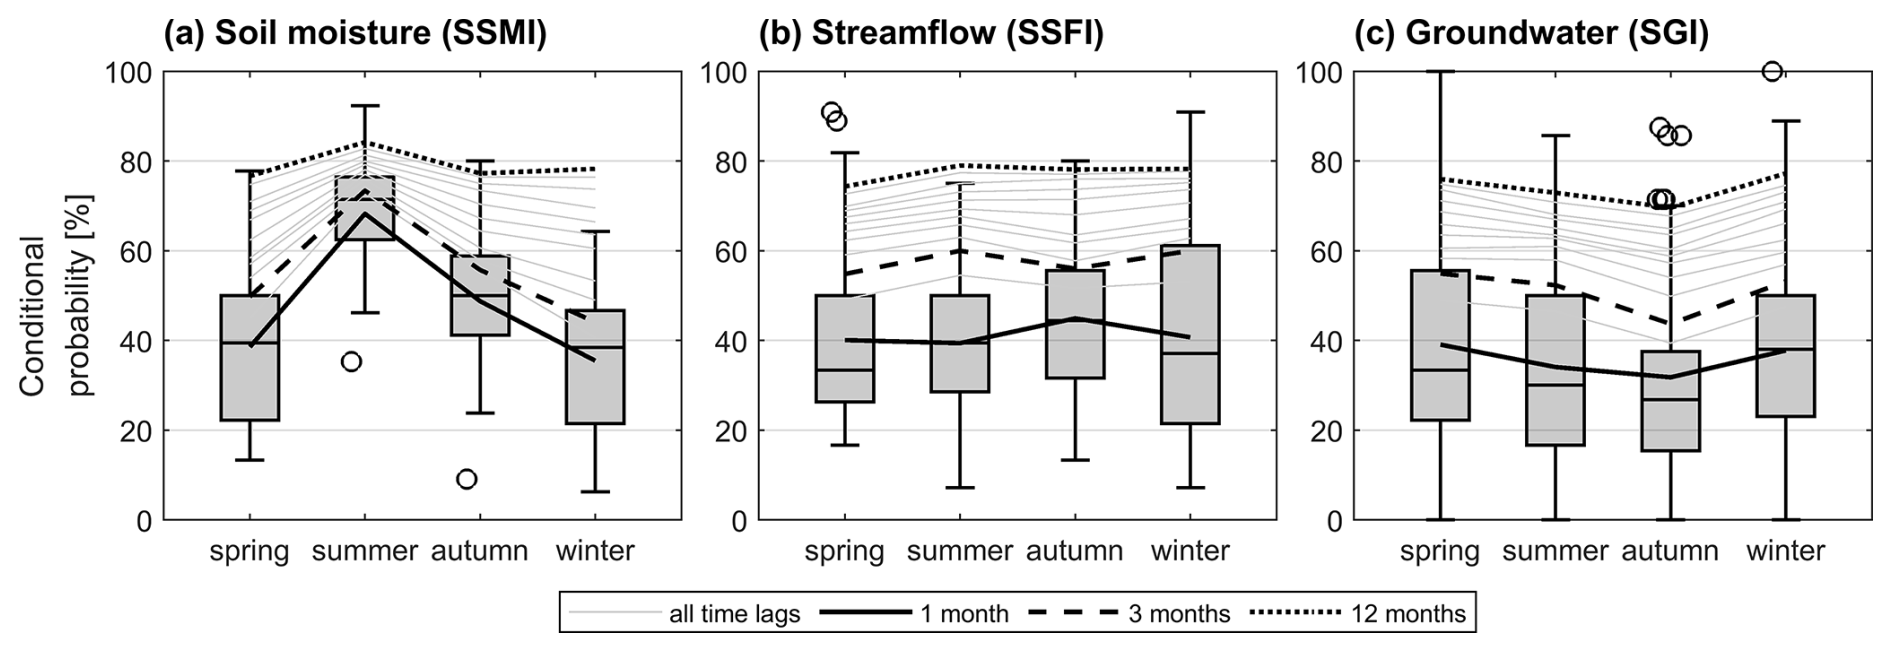
Figure 7Probability of a moderate, severe, or extreme precipitation drought () in different seasons (spring, summer, autumn, and winter) triggering subsequent droughts in (a) soil moisture, (b) streamflow, or (c) groundwater (SSMI, SSFI, or ) across different time lags. The boxplots depict the distribution of probabilities across catchments, with the solid black line representing the median probability for a 1 month lag time. The thin gray lines correspond to the median probabilities for step-wise increasing time lags, while the lines for 3 and 12 months are highlighted for clarity.
A more detailed analysis of propagation probability by cluster revealed distinct north–south patterns during certain seasons and drought types (Fig. 8). In spring (MAM), the propagation probability for soil moisture (Fig. 8a) was considerably higher for the two southernmost clusters (4 and 5) at 50 % and 53 %, compared with the northern clusters, where it ranged from 23 % to 27 %. For streamflow (Fig. 8b) and groundwater (Fig. 8c), cluster 4 stood out with notably higher propagation probabilities, exceeding 60 %.
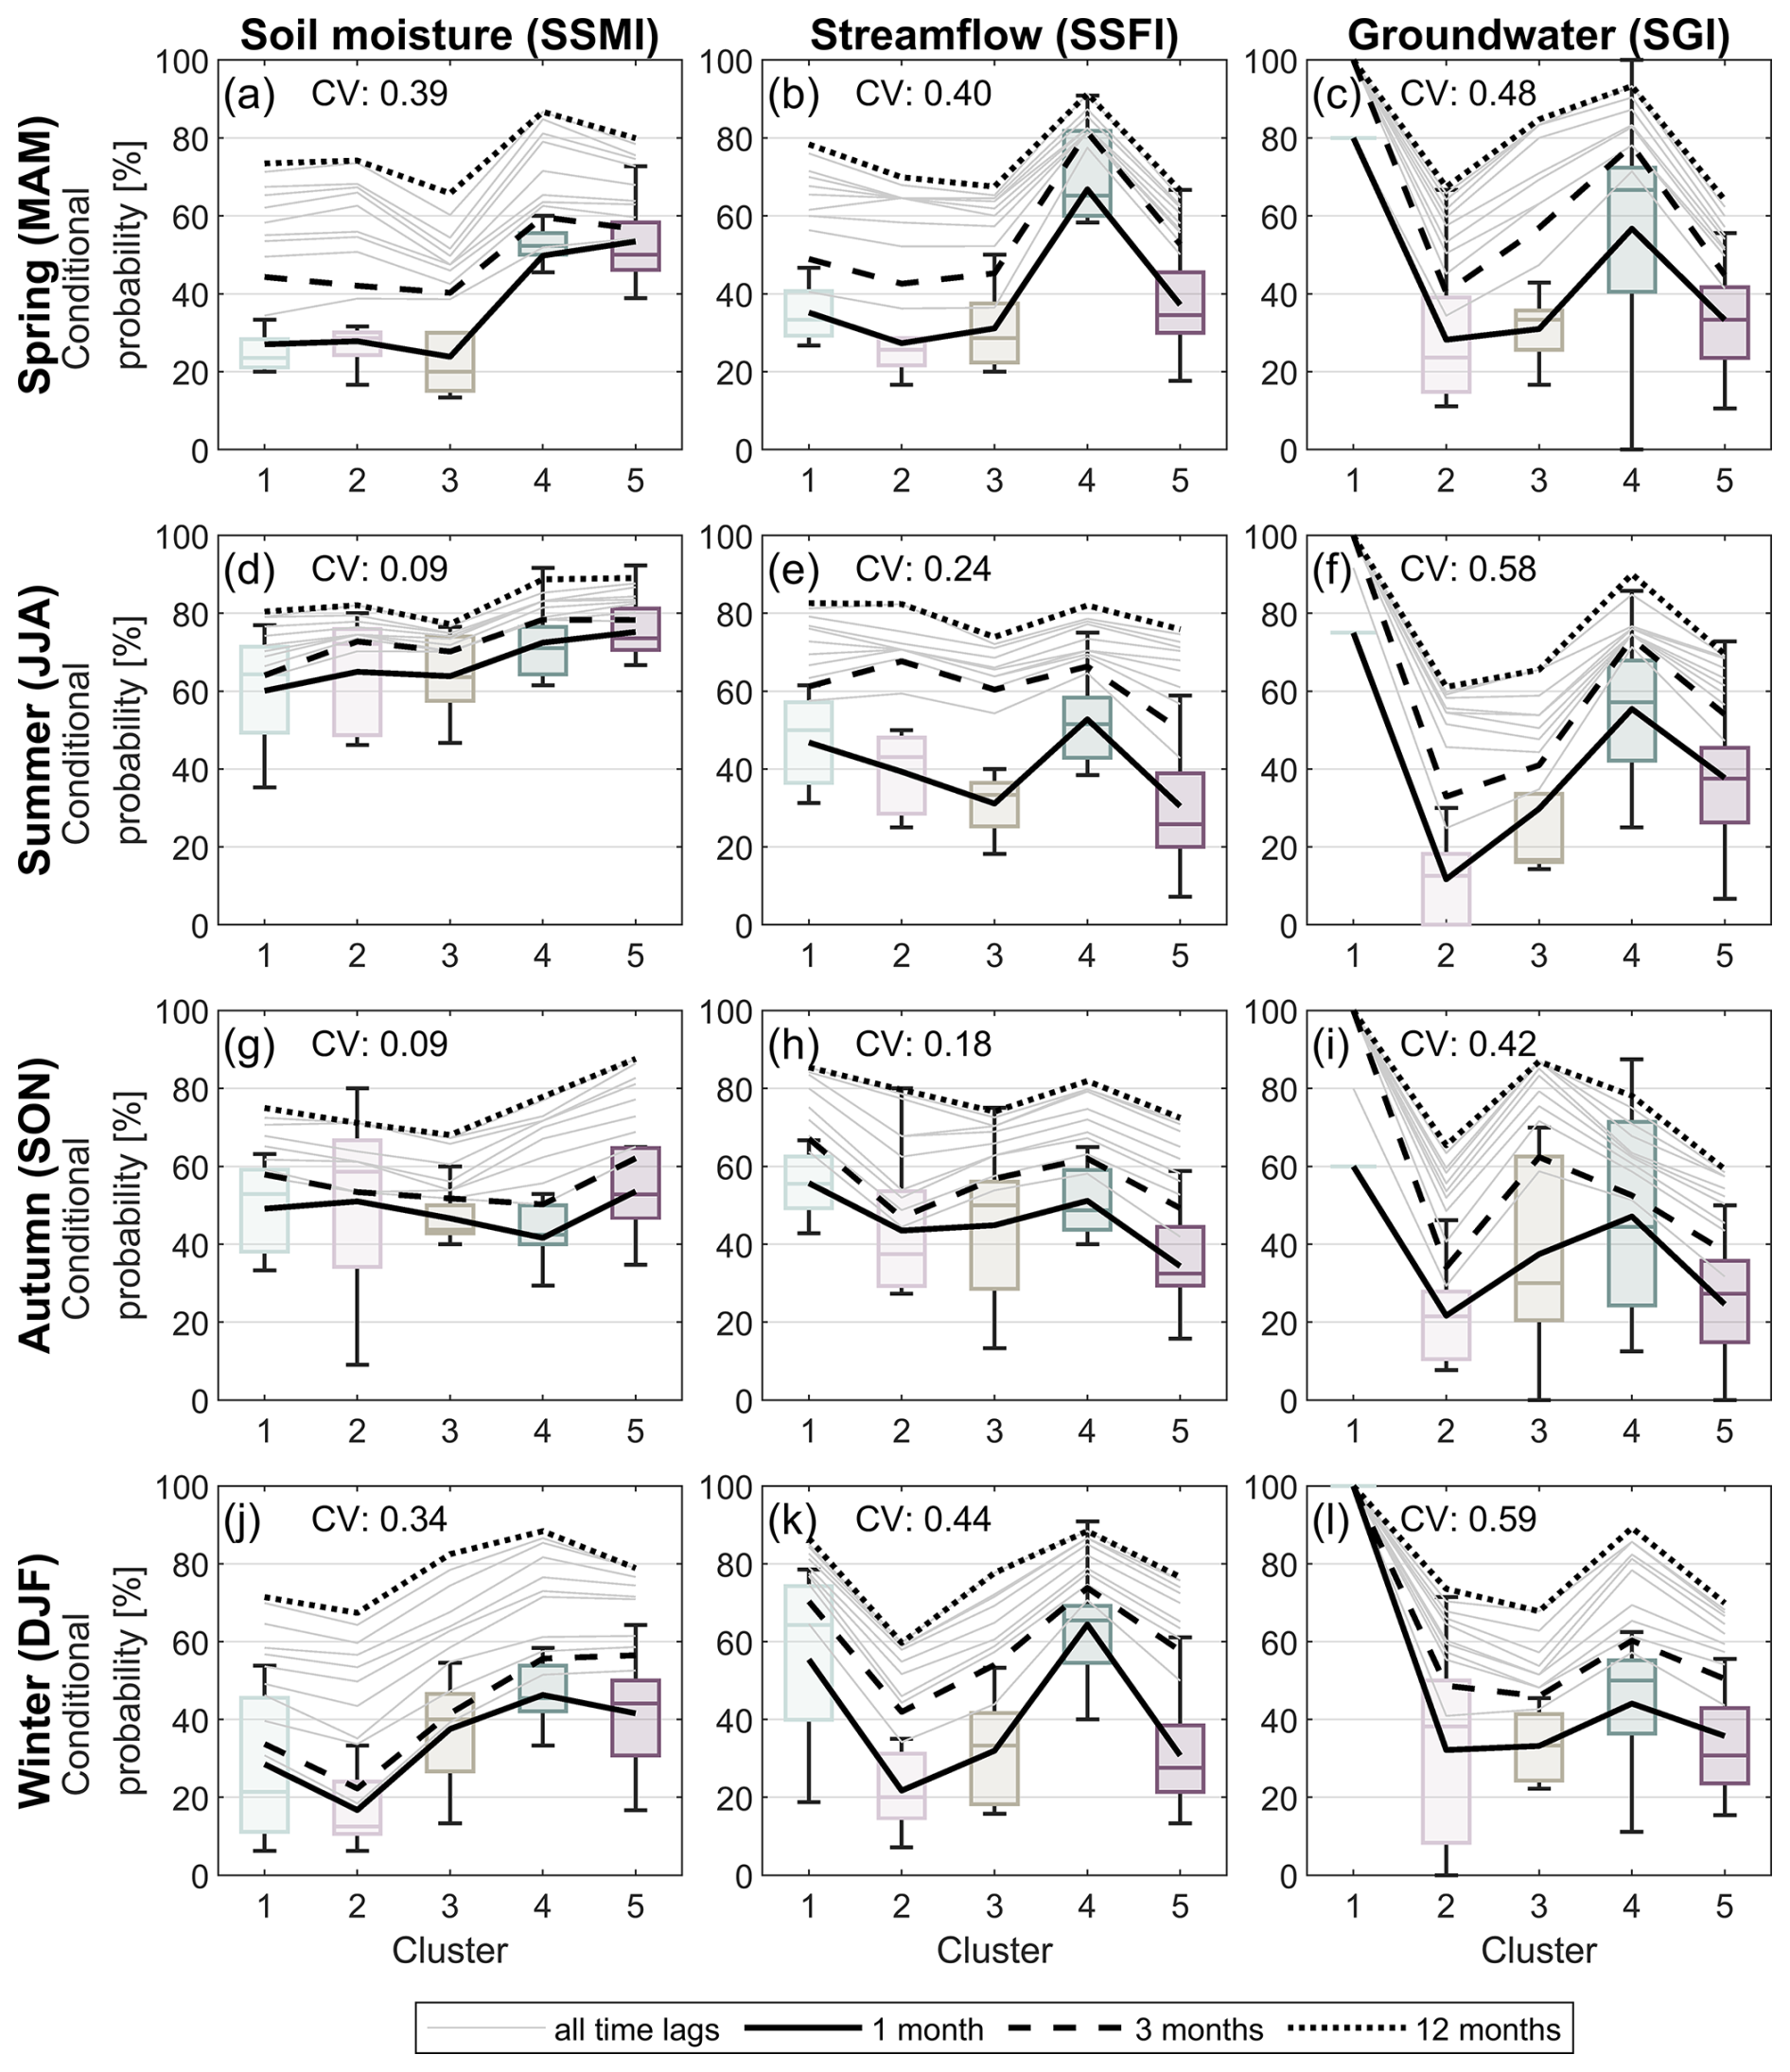
Figure 8Cluster-wise probability of a moderate, severe, or extreme precipitation drought () triggering subsequent droughts by season (rows) and type of subsequent drought (columns). Each subplot also depicts the coefficient of variation (CV) across clusters for time lag 1.
In summer (JJA), the propagation probability for soil moisture increased linearly from 60 % to nearly 75 % across all time lags as one moved farther south (Fig. 8d). Conversely, the propagation probability for streamflow (Fig. 8e) showed an inverse trend at a 1 month time lag, i.e., decreasing from 47 % in the north to 30 % in the south, with the exception of cluster 4 (53 %). This north–south gradient was less pronounced for longer time lags.
In autumn (SON), the spatial patterns resembled those of summer. However, the overall propagation probabilities for soil moisture were 10 % to 20 % lower than in summer (Fig. 8g), while probabilities for streamflow (Fig. 8h) and groundwater (Fig. 8i) were slightly higher compared with summer levels.
Winter (DJF) exhibited the lowest propagation probabilities for soil moisture (Fig. 8j) across all clusters, with the exception of cluster 3, which had the lowest probability in spring. Both winter and spring displayed the highest variations in soil moisture (Fig. 8a, j) and streamflow (Fig. 8b, k) across clusters, with coefficients of variation (CVs) ranging from 0.34 to 0.44. Groundwater showed generally higher variations than both soil moisture and streamflow, with CVs ranging from 0.42 to 0.59, peaking in summer (Fig. 8f) and winter (Fig. 8l).
3.4 Governing factors of drought propagation
Among the three hydrological components, the propagation time for soil moisture generally exhibited the most significant correlations with physical/topographic catchment features (Fig. 9a, left). Significant positive correlations (p value < 0.05) were observed with latitude, elevation, slope, shrubs and grassland, and wetlands (θs=0.31 to 0.43), indicating longer propagation times. Significant negative correlations included annual mean precipitation, mean temperature, silt, urban areas, and agriculture ( to −0.41). For propagation time for streamflow (Fig. 9a, center), significant positive correlations were observed with catchment area, till soils, and water features (θs=0.29 to 0.41), while annual precipitation, streamflow, and the runoff coefficient exhibited strong negative correlations with drought propagation time ( to −0.59), indicating that higher precipitation and absolute as well as relative streamflow generation are associated with shorter propagation times. Propagation times for groundwater tended toward negative correlations (Fig. 9a, right), with significant correlations observed only for annual precipitation () and an area's annual streamflow (). Notably, only a single catchment characteristic exerted a strong influence on drought propagation across all three hydrological components simultaneously, namely, annual precipitation, indicating shorter propagation times for catchments with higher annual precipitation.
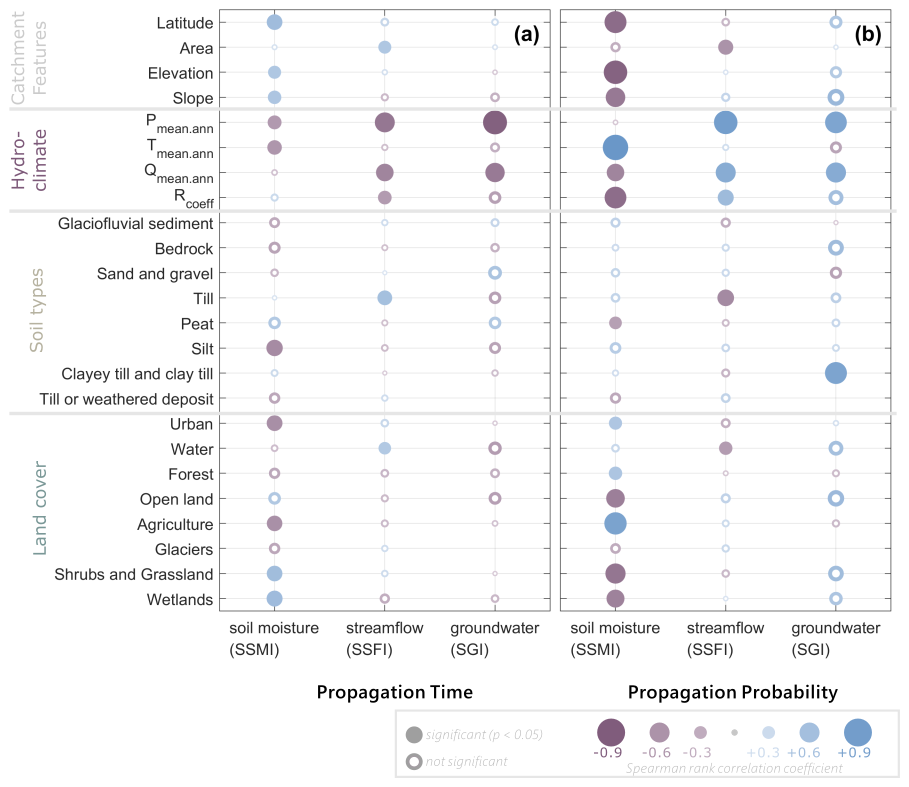
Figure 9Spearman's rank correlation coefficients between various catchment characteristics, ranging from physical/topographic catchment features and hydroclimatic properties to soil types and land cover (y axis), and (a) drought propagation times, as well as (b) propagation probabilities of precipitation deficits in soil moisture, streamflow, and groundwater (x axis). Larger/darker circles represent a stronger correlation coefficient, with blue indicating positive correlations and purple negative correlations. Filled circles represent significant correlations.
In terms of propagation probabilities, soil moisture again showed the most extensive correlation (Fig. 9b, left). Negative correlations were detected with all catchment features, particularly with latitude, elevation, and slope ( to −0.73). Strong negative correlations were also found with till or weathered deposits, open land, shrubs, and grassland, as well as wetlands ( to −0.61). In contrast, strong positive correlations were observed with annual temperature (θs=0.81) and agriculture (θs=0.68). For propagation probability for streamflow (Fig. 9b, center), fewer significant correlations were evident. Negative correlations were found with catchment area, till soils, and water bodies ( to −0.50), whereas strong positive correlations were detected for annual precipitation (θs=0.73), streamflow (θs=0.59), and the runoff coefficient (θs=0.43). Propagation probability for groundwater (Fig. 9b, right) showed only three significant correlations, all of them positive: annual precipitation (θs=0.66) and streamflow (θs=0.59), as well as clayey and clay till soils (θs=0.66).
3.5 Droughts and their propagation in a changing climate
3.5.1 Changes in spatiotemporal drought patterns
The analysis of 12 month aggregated drought indices revealed a general upward trend from CNP1 to CNP2 (i.e., indices become more positive), indicating a reduction in the severity of droughts overall (Fig. 10a–e). In all five clusters, the Wilcoxon rank sum test consistently rejected the null hypothesis that the SPI and SSMI values for CNP1 and CNP2 were drawn from distributions with equal medians. This indicates a statistically significant shift (p<0.05) in precipitation and soil moisture drought conditions across Sweden between these two periods. For the SSFI, significant differences between CNP1 and CNP2 were only observed in the northernmost clusters 1–3 (Fig. 10a–c), implying a notable shift in streamflow drought severity in these areas.
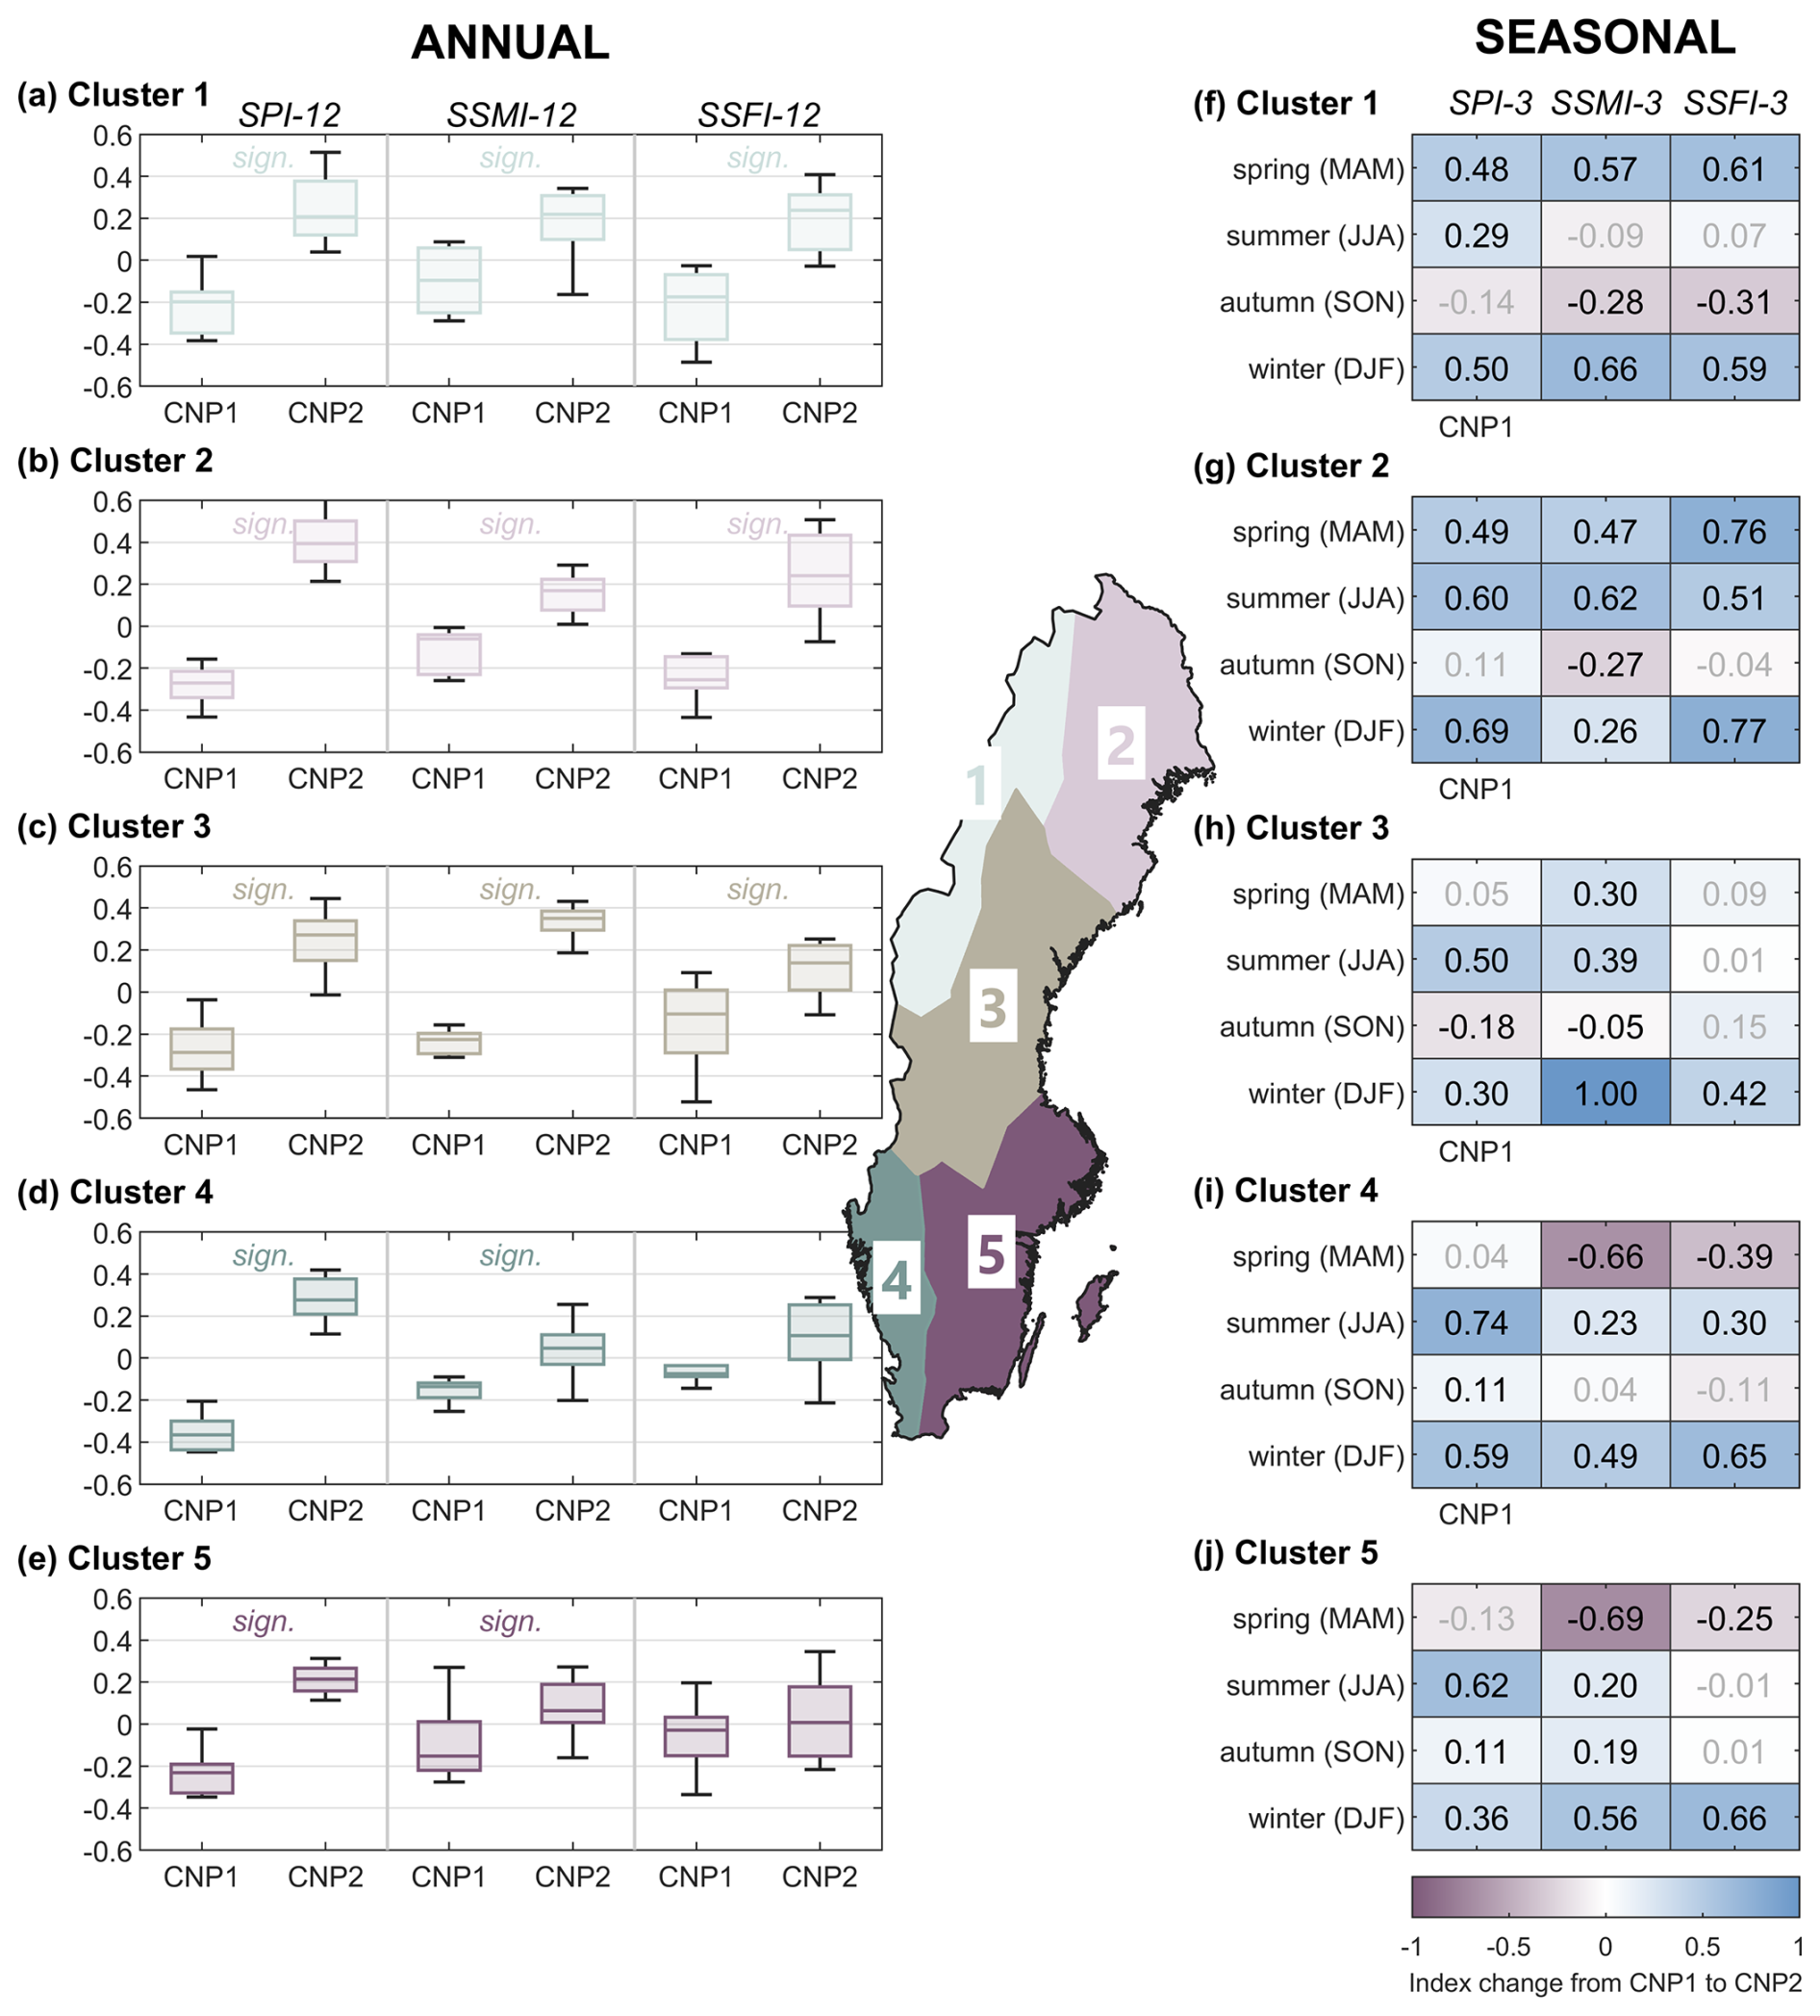
Figure 10Shifts in (a–e) annual and (f–j) seasonal drought indices (SPI, SSMI, and SSFI) between two climate normal periods, 1961–1990 (CNP1) and 1991–2020 (CNP2), for five hydrological clusters. Boxplots in panels (a–e) represent the range of index values (SPI, SSMI, and SSFI) across catchments within each cluster, with significant shifts between CNP1 and CNP2, indicated by “sign.,” based on the Wilcoxon rank sum test (p<0.05). Panels (f–j) display the absolute change in indices for different seasons (spring, summer, autumn, and winter), with darker blue shading representing more pronounced increases in index values (wetter conditions), and darker purple shading representing stronger decreases (drier conditions). Significant seasonal changes are highlighted with black text.
Seasonal analysis of 3 month aggregated drought indices showed a similar pattern, with predominantly positive shifts across most clusters and seasons (Fig. 10f–j), suggesting a reduction in drought severity. However, some exceptions are observed. In the two northernmost clusters 1 and 2, autumn indices (particularly soil moisture and streamflow) exhibited slight negative shifts, indicating slightly drier conditions during this season (Fig. 10f, g). Similarly, in the southernmost clusters 4 and 5, substantial negative changes were observed in spring soil moisture and streamflow indices (Fig. 10i, j), suggesting increased drought severity during this season in southern Sweden.
3.5.2 Changes in propagation time
For propagation time for soil moisture drought (SSMI) (Table 1a), most clusters exhibited no change between CNP1 and CNP2 (i.e., values of 0), except for cluster 2, which showed a modest increase of +0.5 month. For propagation time for streamflow drought (SSFI), cluster 2 also experienced a small increase (+0.5 month), while cluster 3 showed a more noticeable reduction, of −1 month. However, in all cases, the Wilcoxon rank sum test failed to reject the null hypothesis that the propagation times for soil moisture and for streamflow during CNP1 and CNP2 were drawn from continuous distributions with equal medians (Table 1a). This implies that there has been no statistically significant change (all p values > 0.05) in the drought propagation times between these two periods.
Table 1Drought propagation characteristics from precipitation deficits for soil moisture (SSMI) and streamflow droughts (SSFI), including (a) observed median propagation times and (b) propagation probabilities for drought transitions. The changes in these characteristics are compared between two climate periods, CNP1 (1961–1990) and CNP2 (1991–2020). The p values reflect the statistical significance of these changes, tested using the Wilcoxon rank sum test. Significant changes (p values < 0.5) are highlighted in bold. NaN denotes “not a number”.

3.5.3 Changes in propagation probability
Similarly, we investigated whether the conditional probability of soil moisture or streamflow drought following a precipitation drought has changed over time (Table 1b). The probability of propagation for soil moisture (SSMI) generally increased by 1 % to 7 % in CNP2 compared with CNP1, while the probabilities of propagation for streamflow (SSFI) slightly decreased by −1 % to −4 %. Despite these observed changes, the Wilcoxon rank sum test again did not reject the hypothesis of equal medians, indicating that no statistically significant shift occurred in drought propagation probabilities over the 60-year observational record (p values > 0.05, Table 1b).
4.1 Droughts across hydrological components
The computation of standardized drought indices enabled a visual exploration of the complex interactions between precipitation deficits and drought propagation across different hydrological components – soil moisture, streamflow, and groundwater – in high-latitude catchments. A consistent temporal alignment is observed between the standardized indices (SPI, SSMI, SSFI, and SGI), which is visually particularly clear for the longer 12 month aggregation period. This alignment suggests that prolonged precipitation deficits typically result in more severe and widespread drought conditions across all components, affecting soil moisture, surface water, and groundwater.
Spatially, the analysis highlights notable variability, especially across latitudes. Southern regions, particularly during drought events like those in 2016 and 2018, experienced more pronounced impacts on groundwater systems (Bakke et al., 2020). This pattern may be attributed to unique regional hydrological processes, such as the role of snowmelt in the north versus higher evaporative demand, water extraction rates, and slower recharge processes in the south. These findings emphasize the importance of considering both spatial and temporal dimensions in drought analysis. They also suggest that groundwater systems in southern areas may be more vulnerable to prolonged dry periods, raising concerns about sustainable water management in these regions (Barthel et al., 2021).
While short-term indices capture the immediate impacts of precipitation deficits (critical for understanding the onset of drought conditions), the long-term indices reveal the persistence and severity of droughts that can strain water resources, ecosystems, and agricultural productivity over extended periods (Stagge et al., 2015; Teutschbein et al., 2023b). Groundwater droughts, in particular, are less frequent but tend to be more severe and prolonged compared with those affecting soil moisture and streamflow (Bloomfield and Marchant, 2013).
4.2 Propagation time
The analysis of drought propagation times across the five identified clusters revealed notable variations in response times among different hydrological components, specifically soil moisture, streamflow, and groundwater. These variations highlight the complex and region-specific nature of drought dynamics in the study area. Some general observations were that soil moisture consistently had the shortest propagation times, often responding almost immediately (within 1 month) to precipitation deficits. Therefore, soil moisture in the uppermost soil layer is highly sensitive to changes in precipitation, probably due to its direct exposure to surface conditions (Singh et al., 2021). Streamflow generally exhibits slightly longer propagation times than soil moisture but these remain within a relatively short time frame, averaging about 2 months across all clusters. This indicates that while streamflow is also responsive to precipitation changes, the routing process through catchments introduces a slight delay compared with soil moisture (Robinson et al., 1995; Singh et al., 2021). In contrast, groundwater consistently displays the longest propagation times, averaging around 4 months, with significant variation observed across different clusters. This delay in groundwater response is expected, as groundwater systems typically take longer to react to precipitation deficits due to the slow recharge of aquifers and the movement of water through subsurface layers. Notably, catchments with longer groundwater propagation times may have deeper aquifers, lower recharge rates, or specific hydrogeological conditions, such as confined aquifers or low permeability, leading to a delayed response (Gong et al., 2023). Our findings align with previous research indicating that groundwater responses to precipitation anomalies are more heterogeneous than those of streamflow (Weider and Boutt, 2010).
Clusters 3, 4, and 5 demonstrate shorter groundwater propagation times compared with clusters 1 and 2, indicating more responsive groundwater systems, possibly due to shallower aquifers or regions where groundwater recharge processes occur more rapidly (Cochand et al., 2020; Gong et al., 2023).
This variability supports earlier findings that drought propagation into groundwater is highly site-specific (Bloomfield and Marchant, 2013; Kumar et al., 2016; Nygren et al., 2022; Stoelzle et al., 2014), emphasizing the critical role of hydrogeological characteristics and subsurface storage processes in shaping groundwater responses. Because of their delayed and prolonged responses, groundwater systems require proactive and sustained adaptive management (Thomann et al., 2022). Early detection is challenging; once groundwater droughts develop, they can be slow to recover (Alam et al., 2021; Hellwig et al., 2021). This highlights the importance of targeted monitoring and preparedness strategies, such as water source diversification and drought reserves (Langridge and Daniels, 2017), regulatory schemes for groundwater extraction (Vaux, 2011), or strategies for implementing managed aquifer recharge (Petersen-Perlman et al., 2022), especially in areas where groundwater serves as a critical resource.
In contrast, the quicker responses of soil moisture and streamflow to precipitation deficits across all clusters emphasize the importance of implementing timely drought response measures for these components as they quickly reflect precipitation deficits. In agriculture, such measures may include regulated deficit irrigation (Chai et al., 2015), mulching, or optimized seeding dates (Bodner et al., 2015). In water supply systems, such options as adaptive reservoir management or temporary water-saving advisories (Wendt et al., 2021) may be particularly relevant in regions dependent on river water resources.
4.3 Propagation probability
Our conditional probability analysis provides new insight into how precipitation deficits propagate through different components of the hydrological system, revealing both temporal and spatial dynamics of drought transmission in Sweden. At the shortest lag (1 month), the probability of a precipitation deficit leading to a soil moisture drought is the highest, emphasizing that agricultural and ecological systems are often the first to be impacted by water shortages. In contrast, the probabilities of precipitation deficits propagating to streamflow and then to groundwater are lower (Geng et al., 2024; Meresa et al., 2023; Wang et al., 2022).
As the lag time is systematically extended, the conditional probabilities for all three components (soil moisture, streamflow, groundwater) begin to converge, indicating that prolonged precipitation deficits increase the likelihood of all components experiencing drought. This suggests that, while some systems (like soil moisture) respond quickly, over time, the effects of prolonged precipitation deficits will eventually impact all components, necessitating a comprehensive approach to drought risk management, considering the entire cycle of disaster management from prediction and prevention to practical measures for reducing impacts of droughts and supporting recovery in a sustainability context (AghaKouchak et al., 2015; Grobicki et al., 2015).
There is clear spatial variability in how droughts propagate across different clusters, with distinct north–south gradients observed in the propagation probabilities of soil moisture droughts. The fact that only 41 %–43 % of all precipitation deficits () in the northern clusters 1–3 lead to soil moisture deficits within 1 month suggests that other factors also play a crucial role for the development of agricultural/ecological drought. Snow might be a key player, as is indicated by the probability getting higher when moving toward southern catchments with less snow and more rainfall. We can also speculate that this regional pattern is formed by other factors, such as high soil water storage capacities (Geris et al., 2015) or different drought-generating mechanisms in these snow-dominated regions (Van Loon and Van Lanen, 2012). Conversely, clusters 4 and 5 exhibit higher probabilities (up to 57 % within 1 month), indicating a stronger link between precipitation deficits and soil moisture droughts. These regions may have soil types or land cover that are more susceptible to rapid drying during periods of low precipitation, or may be influenced by regional climatic factors, such as higher evaporative demand (Teutschbein, 2024a). However, this gradient is less pronounced for streamflow and groundwater, where probabilities are more balanced across clusters, except for cluster 1 in northwestern and cluster 4 in southwestern Sweden, which consistently show higher conditional drought probabilities. In fact, catchments in clusters 1 and 4 receive considerably higher amounts of annual precipitation (978 and 944 mm, respectively, compared with the Swedish average of 784 mm). In particular, catchments in cluster 4 also experience greater evaporative demand (particularly during summer) due to their southern location, while also receiving the least amount of snow (10 %–20 % of annual precipitation compared with 30 % in central and 40 % in northern Sweden).
The delayed but persistent response of groundwater (propagation probabilities of 52 %–70 % within 3 months in clusters 2–5) underscores once again the need for long-term monitoring and proactive management strategies, especially in regions with high groundwater dependence (Saito et al., 2021; Thomann et al., 2022). The variability in drought propagation probabilities and response times across different clusters and hydrological components suggests that a one-size-fits-all approach to drought management is unlikely to be effective across diverse regions and sectors (Stenfors et al., 2024b). Instead, a more tailored approach is required, involving context-specific analysis that considers local climatic, topographic, and hydrological conditions (Kchouk et al., 2022), while also recognizing the dependency of water supply on different resources, such as surface or groundwater (Stenfors et al., 2024a).
It is noteworthy that groundwater droughts featured the highest variability within clusters; this highlights the complexity of subsurface hydrological processes and may reflect differences in regional hydrological conditions, groundwater storage capacity, or data quality (Kumar et al., 2016; Stoelzle et al., 2014). Thus, more research efforts are needed to study the propagation into groundwater (Barthel et al., 2021) and to link it to aquifer properties and recharge rates.
Our analysis also revealed significant seasonal variations in the probability of precipitation deficits leading to droughts for different hydrological components. Generally, summer stands out as the season with the highest propagation probabilities across all time lags, particularly for soil moisture droughts. This can be attributed to several factors – high evapotranspiration rates, reduced soil moisture recharge, and greater demand for water by vegetation during this period (Andersson, 1989; Cienciala et al., 1999) – which make the soil system even more sensitive to precipitation deficits. In contrast, spring and winter show lower propagation probabilities of soil moisture droughts, probably due to lower evapotranspiration demands and a greater influence of snow and snowmelt, which seems to buffer the effects of precipitation deficits and dampen soil moisture droughts (Potopová et al., 2016). These patterns are less pronounced for streamflow and groundwater droughts, which show relatively stable propagation probabilities across all seasons.
North–south differences also emerged in seasonal propagation probabilities, particularly for soil moisture and streamflow. While the overall inter-cluster patterns remain consistent across all four seasons, the absolute probabilities vary. For instance, the conditional probability of soil moisture droughts is generally higher in southern catchments and lower in northern catchments throughout the year. In spring, snowmelt plays a key role in mitigating precipitation deficits, resulting in significantly lower propagation probabilities in the snow-dominated northern clusters (1–3) of around 20 %–30 % – compared with 50 % in the southern clusters. During summer and autumn, total precipitation and evaporative demand become the dominant factors (Koster et al., 2019; Wang et al., 2022), driving up the probability of soil moisture droughts, especially in the south. In winter, snow accumulation acts as a buffer, further reducing the propagation probabilities for soil moisture droughts, particularly in regions with substantial snowfall (Potopová et al., 2016). Conversely, streamflow drought propagation probability during summer decreases as one moves south, in line with the southward-decreasing runoff coefficients (i.e., proportionally less precipitation turns into runoff). These coefficients range from 97 % in northern cluster 1 to 37 % in southern cluster 5; this is consistent with the results of the correlation analysis, in which the runoff coefficient emerged as an explanatory factor for streamflow drought propagation probability.
It should be noted that inter-cluster variation is largest during spring and winter for both soil moisture and streamflow propagation probabilities. This indicates that northern and southern catchments behave more distinctly in these seasons, with northern clusters showing stronger buffering effects due to snow accumulation and snowmelt. In contrast, summer and autumn see a more uniform response across regions; this emphasizes the proportionally larger influence of snow processes in the north during spring and winter, compared with the evaporative demand in the summer and autumn. However, groundwater propagation exhibits consistently high inter-cluster variability across all seasons, suggesting that additional regional factors, particularly in cluster 4, may outweigh the effects of snow and evaporative demand. This could include regional geological differences in, for example, aquifer characteristics and groundwater storage capacities, which play a critical role in determining the speed and extent of drought propagation in groundwater systems.
These results suggest that drought propagation and resulting impacts are highly dependent on both seasonal timing and geographical location, reflecting the complex interactions between climate conditions, hydrological processes, and land characteristics, which can either accelerate (e.g., high evaporative demand) or delay (e.g., snowmelt in snow-dominated catchments) drought propagation (Koster et al., 2019; Potopová et al., 2016). In practical terms, this analysis highlights the need for seasonally adaptive water management strategies, especially in the southern clusters where the propagation probability for soil moisture is elevated. It also points to the importance of long-term monitoring, particularly for groundwater, where slow but persistent drought impacts may be underestimated in the short term (Barthel et al., 2021). In restoration efforts or pilot monitoring programs, the regional variability revealed in these findings could guide targeted interventions, such as enhancing water storage in high-risk areas or focusing conservation efforts during high-risk seasons (Srivastav et al., 2021).
4.4 Governing factors of drought propagation
Our analysis revealed that the processes driving drought dynamics vary considerably between soil moisture, streamflow, and groundwater. Propagation time of precipitation deficits to soil moisture in the studied catchments is influenced by a range of governing factors, while, for streamflow and groundwater, only four and two significant factors, respectively, were identified.
Generally, faster propagation times across all three hydrological components occur in catchments with high annual precipitation, warmer temperatures, and higher annual streamflow levels. This suggests that, in regions with greater water input and output, the hydrological system responds more quickly to changes in precipitation, resulting in faster drought onset but potentially quicker recovery from drought conditions as well. Additionally, soil moisture and streamflow propagation times are shorter in catchments with less till, more silt, and fewer water features, suggesting that water bodies can exert a buffering and delay function. For soil moisture, propagation time is further controlled by urban areas and agriculture, where surface runoff dominates, and is more rapid in warmer catchments at lower latitudes and elevations. Conversely, open land types (e.g., shrubs and grasslands, open land, and wetlands) tend to slow water propagation and promote water retention.
The propagation probability generally exhibits stronger correlations than propagation time. Our analysis showed that propagation probability for groundwater was significantly correlated with just three factors: higher annual precipitation, greater streamflow, and the presence of clayey till, which enhanced the likelihood of groundwater recharge. For streamflow, propagation probability is influenced by a few more factors. Catchments with higher precipitation and streamflow also tend to exhibit greater propagation probabilities. In addition, smaller catchments, less till, and fewer water features are associated with higher streamflow propagation probability. The propagation for soil moisture was associated with the greatest number of governing factors. Specifically, catchments with higher mean temperatures, more agriculture, and lower latitude, elevation, and slope had the highest soil moisture propagation probabilities. Lower streamflow in these areas further amplified the likelihood of soil moisture response.
Across both drought propagation characteristics (i.e., time and probability), annual precipitation and annual streamflow emerged as the most influential drivers across all three hydrological components, indicating their potential as proxies for identifying areas with faster hydrological responses, which can support more targeted resource allocation and management decisions during emerging drought conditions. However, the remaining factors shaping drought propagation dynamics vary by component, reflecting the distinct physical and hydrological processes at play. Soil moisture is generally influenced by a broader array of factors, whereas streamflow is more directly linked to catchment size, the presence of till soils, and overall water availability. Groundwater is most strongly affected by hydroclimatic variables and the hydrological regime.
This analysis underscores that drought propagation is not solely determined by catchment properties; rather, it is shaped by complex interactions between seasonal precipitation, evaporative demand, and snow dynamics (Van Loon et al., 2015). The timing and severity of the drought (Bae et al., 2019) and the season (Meresa et al., 2023), location (Bevacqua et al., 2021), and precipitation patterns (or lack thereof), as well as antecedent conditions/“memory effects” (Bales et al., 2018; Soulsby et al., 2021) all potentially play important roles in determining whether a meteorological drought will evolve into more severe forms, such as agricultural/ecological or hydrological droughts. In high latitudes, snow becomes a critical factor in drought propagation, particularly for longer aggregation periods. This is evident in northern regions, where reduced precipitation does not always lead to other types of drought, probably due to the buffering effect of snowpack. Moreover, not all precipitation deficits necessarily progress into agricultural/ecological or hydrological droughts, as these deficits can be mitigated by the landscape's buffering capacity (Maxwell et al., 2021). Conversely, not all agricultural/ecological or hydrological droughts are (solely) triggered by precipitation deficits; some result from extraordinarily high evaporative demands, lack of snowmelt, or a combination of several factors.
4.5 Drought propagation in a changing climate
The analysis of changes in standardized drought indices (SPI, SSMI, and SSFI) across two climate normal periods (CNP1 and CNP2) revealed distinct regional and seasonal patterns in drought dynamics, which are crucial for understanding the evolving drought risk in various clusters across the studied region. All clusters consistently indicate a wetting trend, i.e., drought conditions across all hydrological components have consistently become less severe – a pattern that aligns with previous findings of increasing precipitation and runoff over Sweden during the twentieth and early twenty-first centuries (Chen et al., 2020; Teutschbein et al., 2022). This trend is stronger in northern catchments, with clusters 1 and 2 featuring especially strong increases during the cold season, when snowmelt and seasonal precipitation are likely to be contributing to the water surplus. This pronounced seasonal signal highlights the importance of snowpack and spring melt in driving the hydrological response in these northern clusters, and suggests that these regions may be less prone to drought in the near term. The southern clusters 4 and 5 show significant decreases in both soil moisture (SSMI) and streamflow (SSFI) indices, despite relatively stable or even slightly increasing precipitation (SPI) during that season. This implies that the available water is not being retained in the system, potentially due to increased evaporation, reduced infiltration, or changes in land use such as urbanization and agriculture. These regions may be increasingly prone to hydrological drought, where water deficits in the soil and streams become more frequent and severe, affecting ecosystems, agriculture, and water supplies. This trend is particularly concerning as it indicates that, even if precipitation remains stable, water resources in these southern clusters are becoming less available for both natural ecosystems and human use.
The evaluation of the differences in drought propagation times and conditional probabilities of drought occurrence between CNP1 and CNP2 demonstrated that there has been no statistically significant change in drought propagation times for soil moisture and streamflow across all clusters. This implies that, despite global climatic changes and the associated shifts in precipitation patterns, the response times of these hydrological components to droughts have remained consistent over the past 60 years. The failure to reject the null hypothesis (p value > 0.05) implies that any observed differences in propagation times are not large enough to be statistically significant and thus the underlying processes governing drought propagation have probably remained stable across these two periods.
Similarly, the investigation into the conditional probabilities of soil moisture and streamflow droughts following a precipitation drought reveals predominantly no statistically significant change between the two CNPs for the vast majority of the evaluated time lags. This broad failure of the Wilcoxon rank sum test to reject the hypothesis of equal medians (p values > 0.05) suggests that the likelihood of a soil moisture or streamflow drought occurring after a precipitation deficit has not changed significantly over the 60-year observational record (on an annual basis). This may be different for seasonal drought events but is – due to the limited number of drought events, owing to their rare nature – more difficult to test given the existing dataset. The observed stability in drought propagation times and probabilities suggests that the physical properties of the landscape, such as soil type, vegetation cover, and catchment characteristics, have a more dominant role in controlling drought propagation than any potential changes in climatic conditions between these periods. However, further research – particularly into seasonal dynamics – is needed to unravel these links.
The absence of significant changes in both drought propagation times and the conditional probabilities of drought occurrence over the two climate normal periods has important implications for drought management. Despite an observed increase in average temperature by 2.2° and a 20 % increase in precipitation over the past 60 years (Teutschbein et al., 2022), these climatic shifts have not resulted in significant alterations in drought propagation within the study period. Thus, historical data and established models for predicting drought behavior based on past observations may still be relevant and reliable under current climate conditions. This stability allows for a certain level of confidence in using past trends to inform future drought preparedness and mitigation strategies. However, it is also important to recognize that while no significant changes have been detected over the studied periods, ongoing climate change could still pose future challenges and potential alterations in drought propagation in these high-latitude catchments (Teutschbein et al., 2023b). Continuous monitoring and periodic reassessment of these trends will be necessary to detect any emerging shifts in drought dynamics that could impact water resource management and planning.
4.6 Limitations and potential for future research
One key limitation of this study lies in the reliance on modeled soil moisture data derived from the ERA5-Land reanalysis. While reanalysis products offer consistent and spatially comprehensive datasets, they are generated using land surface models that incorporate generalized assumptions about land use, vegetation, and soil types. This has several implications for our analysis. First, the spatial resolution of ERA5-Land (approximately 11 km) may be too coarse to capture local-scale heterogeneity in soil properties, topography, and land use that can significantly influence soil moisture dynamics, particularly in small or heterogeneous catchments. As a result, the propagation of meteorological droughts to soil moisture droughts may be influenced by model structure rather than reflecting purely observed physical processes.
Second, since ERA5-Land already integrates information on land cover and soil types within its modeling framework, any correlations between drought propagation metrics and these same physical features may be muted or confounded. This limits the explanatory power of our correlation analysis when it comes to identifying the role of specific soil or land use characteristics in driving drought propagation, particularly for soil moisture droughts.
Third, due to the lack of consistent long-term in situ soil moisture observations across Sweden, we were unable to validate the reanalysis-based soil moisture indices or assess potential biases in the data. This is a known limitation in high-latitude regions and highlights the need for improved soil moisture monitoring networks to support drought research.
Finally, while we focused on standardized drought indices to ensure comparability across drought types and catchments, this approach may oversimplify some of the complex non-linear interactions between meteorological inputs and hydrological responses. For example, the role of evaporative demand, which is a key driver of soil moisture deficits during the summer months, was not explicitly accounted for in our analysis. Variables such as potential evapotranspiration or vapor pressure deficit could provide valuable additional insights, especially in southern regions where atmospheric demand plays a dominant role in controlling drought severity. Similarly, snow accumulation and snowmelt processes, which strongly influence streamflow and groundwater recharge in northern and mountainous catchments, were only indirectly represented through the use of SPI and SSMI. While some seasonal effects were captured in the propagation patterns, we did not include snow-related variables such as snow water equivalent or snowmelt timing in the analysis. These factors are particularly relevant for high-latitude and snow-dominated systems, where snowmelt can buffer or delay drought onset. Thus, we recommend that future studies incorporate evaporative demand and snow-related variables more explicitly, either through additional predictors in statistical models or by applying process-based hydrological modeling. This would help to better capture the physical mechanisms underlying drought propagation and further improve the understanding of seasonal and regional variability in high-latitude watersheds.
This study highlights key patterns in drought propagation across high-latitude regions by analyzing both propagation time (how quickly precipitation deficits impact soil moisture, streamflow, and groundwater) and propagation probability (the likelihood that a precipitation deficit leads to drought in these components). Soil moisture responds fastest, with a typical lag of 1 month, followed by streamflow, at 2 months. Groundwater exhibits the longest and most variable response times, averaging 4 months.
Precipitation deficits are a major driver of droughts in high latitudes, particularly in the early stages. Within the first month of a precipitation deficit, the probability of drought occurrence is highest for soil moisture (48 %), followed by streamflow (41 %) and groundwater (38 %). These probabilities increase with time, showing that prolonged deficits can lead to more widespread and severe droughts. However, not all hydrological droughts are driven solely by precipitation deficits; factors such as high evaporation or insufficient snowmelt are also likely to contribute. This highlights the need for a more nuanced understanding of complex drought dynamics that includes atmospheric and cryospheric processes, especially under changing climate conditions.
Although all catchments are experiencing a general trend of increased wetness throughout the year, driven by snowmelt and rising precipitation, southern catchments show heightened vulnerability to hydrological drought in the spring. This is largely due to increasing evaporative demand, which offsets stable or slightly rising precipitation levels during that season. Importantly, no significant changes in drought propagation times or probabilities were observed over the past 60 years but continuous monitoring and reassessment remain essential to detect any emerging shifts in drought dynamics that could impact water resource management in the future.
Drought dynamics in high-latitude regions are influenced by diverse factors, including local topography, hydroclimatic conditions, and soil properties. Soil moisture propagation is governed by catchment features, hydroclimate, and land cover, while streamflow and groundwater are more closely linked to water availability.
By focusing on the unique conditions of high-latitude regions, this research has contributed to the broader scientific understanding of drought dynamics, offering new perspectives on the interactions between various hydrological systems during prolonged dry periods. Future studies should expand the geographical scope and explore seasonal and climate change impacts to further validate these findings and enhance their generalizability. As climate change intensifies, proactive and region-specific strategies will be essential to safeguard water resources and the ecosystems that depend on them.
The CAMELS-SE data that support the findings of this study are openly available at the Swedish National Data Service at https://doi.org/10.57804/t3rm-v029 (Teutschbein, 2024b).
CT: conceptualization, methodology, formal analysis, investigation, resources, data curation, writing – original draft, writing – review and editing, visualization, supervision, project administration, funding acquisition. TG: conceptualization, methodology, writing – review and editing, supervision. MG: methodology, writing – review and editing, supervision. AT: methodology, data curation, writing – review and editing. RB: conceptualization, project administration, funding acquisition.
The contact author has declared that none of the authors has any competing interests.
Publisher's note: Copernicus Publications remains neutral with regard to jurisdictional claims made in the text, published maps, institutional affiliations, or any other geographical representation in this paper. While Copernicus Publications makes every effort to include appropriate place names, the final responsibility lies with the authors.
This article is part of the special issue “Drought, society, and ecosystems (NHESS/BG/GC/HESS inter-journal SI)”. It is not associated with a conference.
We would like to express our sincere gratitude to Sabrina Atigui for her assistance with data preparation, initial work on compiling relevant literature, and helpful input during discussions. During the preparation of this work, the corresponding author used ChatGPT to improve writing style and to check for grammar and spelling on an earlier version of the paper. The authors carefully reviewed, edited, and revised ChatGPT-generated content according to their preferences and take full responsibility for the content of the publication.
This research has been supported by the Svenska Forskningsrådet Formas (grant nos. 2023-00515_Formas and 2015-01123_Formas) and the Royal Swedish Academy of Sciences (grant no. LN2016-0101).
The publication of this article was funded by the Swedish Research Council, Forte, Formas, and Vinnova.
This paper was edited by Giulia Vico and reviewed by two anonymous referees.
AghaKouchak, A., Cheng, L., Mazdiyasni, O., and Farahmand, A.: Global warming and changes in risk of concurrent climate extremes: Insights from the 2014 California drought, Geophys. Res. Lett., 8847–8852, https://doi.org/10.1002/2014GL062308, 2015.
Ahopelto, L., Kallio, M., Veijalainen, N., Kouki, R., and Keskinen, M.: Drought hazard and annual precipitation predicted to increase in the Sirppujoki river basin, Finland, Clim. Serv., 31, 100400, https://doi.org/10.1016/j.cliser.2023.100400, 2023.
Alam, S., Gebremichael, M., Ban, Z., Scanlon, B. R., Senay, G., and Lettenmaier, D. P.: Post-Drought Groundwater Storage Recovery in California's Central Valley, Water Resour. Res., 57, e2021WR030352, https://doi.org/10.1029/2021WR030352, 2021.
Andersson, L.: Soil Moisture Deficits in South-Central Sweden: I – Seasonal and Regional Distributions, Hydrol. Res., 20, 109–122, https://doi.org/10.2166/nh.1989.0009, 1989.
Arheimer, B. and Lindström, G.: Climate impact on floods: changes in high flows in Sweden in the past and the future (1911–2100), Hydrol. Earth Syst. Sci., 19, 771–784, https://doi.org/10.5194/hess-19-771-2015, 2015.
Asadzadeh, M., Tolson, B. A., and Burn, D. H.: A new selection metric for multiobjective hydrologic model calibration, Water Resour. Res., 50, 7082–7099, https://doi.org/10.1002/2013WR014970, 2014.
Bae, H., Ji, H., Lim, Y.-J., Ryu, Y., Kim, M.-H., and Kim, B.-J.: Characteristics of drought propagation in South Korea: relationship between meteorological, agricultural, and hydrological droughts, Nat. Hazards, 99, 1–16, https://doi.org/10.1007/s11069-019-03676-3, 2019.
Bakke, S. J., Ionita, M., and Tallaksen, L. M.: The 2018 northern European hydrological drought and its drivers in a historical perspective, Hydrol. Earth Syst. Sci., 24, 5621–5653, https://doi.org/10.5194/hess-24-5621-2020, 2020.
Bales, R. C., Goulden, M. L., Hunsaker, C. T., Conklin, M. H., Hartsough, P. C., O'Geen, A. T., Hopmans, J. W., and Safeeq, M.: Mechanisms controlling the impact of multi-year drought on mountain hydrology, Sci. Rep., 8, 690, https://doi.org/10.1038/s41598-017-19007-0, 2018.
Barthel, R., Stangefelt, M., Giese, M., Nygren, M., Seftigen, K., and Chen, D.: Current understanding of groundwater recharge and groundwater drought in Sweden compared to countries with similar geology and climate, Geogr. Ann. A, 103, 323–345, https://doi.org/10.1080/04353676.2021.1969130, 2021.
Beck, H. E., Zimmermann, N. E., McVicar, T. R., Vergopolan, N., Berg, A., and Wood, E. F.: Present and future Köppen-Geiger climate classification maps at 1-km resolution, Sci. Data, 5, 180214, https://doi.org/10.1038/sdata.2018.214, 2018.
Bevacqua, A. G., Chaffe, P. L. B., Chagas, V. B. P., and AghaKouchak, A.: Spatial and temporal patterns of propagation from meteorological to hydrological droughts in Brazil, J. Hydrol., 603, 126902, https://doi.org/10.1016/j.jhydrol.2021.126902, 2021.
Blauhut, V., Stoelzle, M., Ahopelto, L., Brunner, M. I., Teutschbein, C., Wendt, D. E., Akstinas, V., Bakke, S. J., Barker, L. J., Bartošová, L., Briede, A., Cammalleri, C., Kalin, K. C., De Stefano, L., Fendeková, M., Finger, D. C., Huysmans, M., Ivanov, M., Jaagus, J., Jakubínský, J., Krakovska, S., Laaha, G., Lakatos, M., Manevski, K., Neumann Andersen, M., Nikolova, N., Osuch, M., van Oel, P., Radeva, K., Romanowicz, R. J., Toth, E., Trnka, M., Urošev, M., Urquijo Reguera, J., Sauquet, E., Stevkov, A., Tallaksen, L. M., Trofimova, I., Van Loon, A. F., van Vliet, M. T. H., Vidal, J.-P., Wanders, N., Werner, M., Willems, P., and Živković, N.: Lessons from the 2018–2019 European droughts: a collective need for unifying drought risk management, Nat. Hazards Earth Syst. Sci., 22, 2201–2217, https://doi.org/10.5194/nhess-22-2201-2022, 2022.
Bloomfield, J. P. and Marchant, B. P.: Analysis of groundwater drought building on the standardised precipitation index approach, Hydrol. Earth Syst. Sci., 17, 4769–4787, https://doi.org/10.5194/hess-17-4769-2013, 2013.
Blöschl, G., Hall, J., Parajka, J., Perdigão, R. A. P., Merz, B., Arheimer, B., Aronica, G. T., Bilibashi, A., Bonacci, O., Borga, M., Čanjevac, I., Castellarin, A., Chirico, G. B., Claps, P., Fiala, K., Frolova, N., Gorbachova, L., Gül, A., Hannaford, J., Harrigan, S., Kireeva, M., Kiss, A., Kjeldsen, T. R., Kohnová, S., Koskela, J. J., Ledvinka, O., Macdonald, N., Mavrova-Guirguinova, M., Mediero, L., Merz, R., Molnar, P., Montanari, A., Murphy, C., Osuch, M., Ovcharuk, V., Radevski, I., Rogger, M., Salinas, J. L., Sauquet, E., Šraj, M., Szolgay, J., Viglione, A., Volpi, E., Wilson, D., Zaimi, K., and Živković, N.: Changing climate shifts timing of European floods, Science, 357, 588–590, https://doi.org/10.1126/science.aan2506, 2017.
Bodner, G., Nakhforoosh, A., and Kaul, H.-P.: Management of crop water under drought: a review, Agron. Sustain. Dev., 35, 401–442, https://doi.org/10.1007/s13593-015-0283-4, 2015.
Brunner, M. I. and Chartier-Rescan, C.: Drought Spatial Extent and Dependence Increase During Drought Propagation From the Atmosphere to the Hydrosphere, Geophys. Res. Lett., 51, e2023GL107918, https://doi.org/10.1029/2023GL107918, 2024.
Chai, Q., Gan, Y., Zhao, C., Xu, H.-L., Waskom, R. M., Niu, Y., and Siddique, K. H. M.: Regulated deficit irrigation for crop production under drought stress. A review, Agron. Sustain. Dev., 36, 3, https://doi.org/10.1007/s13593-015-0338-6, 2015.
Chan, W. C. H., Shepherd, T. G., Facer-Childs, K., Darch, G., and Arnell, N. W.: Storylines of UK drought based on the 2010–2012 event, Hydrol. Earth Syst. Sci., 26, 1755–1777, https://doi.org/10.5194/hess-26-1755-2022, 2022.
Changnon, S. A.: Detecting Drought Conditions in Illinois (No. 169), Circular, Illinois State Water Survey, Champaign, Illinois, https://www.isws.illinois.edu/pubdoc/C/ISWSC-169.pdf (last access: 21 July 2025), 1987.
Chen, D., Zhang, P., Seftigen, K., Ou, T., Giese, M., and Barthel, R.: Hydroclimate changes over Sweden in the twentieth and twenty-first centuries: a millennium perspective, Geogr. Ann. A, 103, 103–131, https://doi.org/10.1080/04353676.2020.1841410, 2020.
Cienciala, E., Kučera, J., and Lindroth, A.: Long-term measurements of stand water uptake in Swedish boreal forest, Agr. Forest Meteorol., 98–99, 547–554, https://doi.org/10.1016/S0168-1923(99)00122-7, 1999.
Cochand, M., Molson, J., Barth, J. A. C., van Geldern, R., Lemieux, J.-M., Fortier, R., and Therrien, R.: Rapid groundwater recharge dynamics determined from hydrogeochemical and isotope data in a small permafrost watershed near Umiujaq (Nunavik, Canada), Hydrogeol. J., 28, 853–868, https://doi.org/10.1007/s10040-020-02109-x, 2020.
Entekhabi, D.: Propagation in the Drought Cascade: Observational Analysis Over the Continental US, Water Resour. Res., 59, e2022WR032608, https://doi.org/10.1029/2022WR032608, 2023.
Garrido-Perez, J. M., Vicente-Serrano, S. M., Barriopedro, D., García-Herrera, R., Trigo, R., and Beguería, S.: Examining the outstanding Euro-Mediterranean drought of 2021–2022 and its historical context, J. Hydrol., 630, 130653, https://doi.org/10.1016/j.jhydrol.2024.130653, 2024.
Geng, G., Zhang, B., Gu, Q., He, Z., and Zheng, R.: Drought propagation characteristics across China: Time, probability, and threshold, J. Hydrol., 631, 130805, https://doi.org/10.1016/j.jhydrol.2024.130805, 2024.
Geris, J., Tetzlaff, D., McDonnell, J., and Soulsby, C.: The relative role of soil type and tree cover on water storage and transmission in northern headwater catchments, Hydrol. Process., 29, 1844–1860, https://doi.org/10.1002/hyp.10289, 2015.
Gessner, C., Fischer, E. M., Beyerle, U., and Knutti, R.: Multi-year drought storylines for Europe and North America from an iteratively perturbed global climate model, Weather Clim. Extrem., 38, 100512, https://doi.org/10.1016/j.wace.2022.100512, 2022.
Gong, R., Chen, J., Liang, Z., Wu, C., Tian, D., Wu, J., Li, S., and Zeng, G.: Characterization and propagation from meteorological to groundwater drought in different aquifers with multiple timescales, J. Hydrol. Reg. Stud., 45, 101317, https://doi.org/10.1016/j.ejrh.2023.101317, 2023.
Grobicki, A., MacLeod, F., and Pischke, F.: Integrated policies and practices for flood and drought risk management, Water Policy, 17, 180–194, https://doi.org/10.2166/wp.2015.009, 2015.
Hellwig, J., Stoelzle, M., and Stahl, K.: Groundwater and baseflow drought responses to synthetic recharge stress tests, Hydrol. Earth Syst. Sci., 25, 1053–1068, https://doi.org/10.5194/hess-25-1053-2021, 2021.
Hellwig, J., Liu, Y., Stahl, K., and Hartmann, A.: Drought propagation in space and time: the role of groundwater flows, Environ. Res. Lett., 17, 094008, https://doi.org/10.1088/1748-9326/ac8693, 2022.
Hersbach, H., Bell, B., Berrisford, P., Biavati, G., Horányi, A., Muñoz Sabater, J., Nicolas, J., Peubey, C., Radu, R., Rozum, I., Schepers, D., Simmons, A., Soci, C., Dee, D., and Thépaut, J.-N.: ERA5 monthly averaged data on single levels from 1940 to present, Copernicus Climate Change Service (C3S) Climate Data Store (CDS) [data set], https://doi.org/10.24381/CDS.F17050D7, 2023.
Heudorfer, B. and Stahl, K.: Comparison of different threshold level methods for drought propagation analysis in Germany, Hydrol. Res., 48, 1311–1326, https://doi.org/10.2166/nh.2016.258, 2016.
IPCC: Climate Change 2021: The Physical Science Basis. Contribution of Working Group I to the Sixth Assessment Report of the Intergovernmental Panel on Climate Change, edited by: Masson-Delmotte, V., Zhai, P., Pirani, A., Connors, S. L., Péan, C., Berger, S., Caud, N., Chen, Y., Goldfarb, L., Gomis, M. I., Huang, M., Leitzell, K., Lonnoy, E., Matthews, J. B. R., Maycock, T. K., Waterfield, T., Yelekçi, O., Yu, R., and Zhou, B., Cambridge University Press, Cambridge, United Kingdom and New York, NY, USA, 2391 pp. https://doi.org/10.1017/9781009157896, 2021.
Irannezhad, M., Ronkanen, A.-K., and Kløve, B.: Effects of climate variability and change on snowpack hydrological processes in Finland, Cold Reg. Sci. Technol., 118, 14–29, https://doi.org/10.1016/j.coldregions.2015.06.009, 2015.
Johansson, B.: Estimation of areal precipitation for hydrological modelling in Sweden, Doctoral dissertation, Report A76, Earth Science Centre, Göteborg University, Göteborg, Sweden, https://gupea.ub.gu.se/handle/2077/15575?show=full (last access: 24 July 2025), 2002.
Kchouk, S., Melsen, L. A., Walker, D. W., and van Oel, P. R.: A geography of drought indices: mismatch between indicators of drought and its impacts on water and food securities, Nat. Hazards Earth Syst. Sci., 22, 323–344, https://doi.org/10.5194/nhess-22-323-2022, 2022.
Koster, R. D., Schubert, S. D., Wang, H., Mahanama, S. P., and DeAngelis, A. M.: Flash Drought as Captured by Reanalysis Data: Disentangling the Contributions of Precipitation Deficit and Excess Evapotranspiration, J. Hydrometeorol., 20, 1241–1258, https://doi.org/10.1175/JHM-D-18-0242.1, 2019.
Kuiper, N. H.: Tests concerning random points on a circle, Indag. Math. Proc., 63, 38–47, https://doi.org/10.1016/S1385-7258(60)50006-0, 1960.
Kumar, R., Musuuza, J. L., Van Loon, A. F., Teuling, A. J., Barthel, R., Ten Broek, J., Mai, J., Samaniego, L., and Attinger, S.: Multiscale evaluation of the Standardized Precipitation Index as a groundwater drought indicator, Hydrol. Earth Syst. Sci., 20, 1117–1131, https://doi.org/10.5194/hess-20-1117-2016, 2016.
Langridge, R. and Daniels, B.: Accounting for Climate Change and Drought in Implementing Sustainable Groundwater Management, Water Resour. Manag., 31, 3287–3298, https://doi.org/10.1007/s11269-017-1607-8, 2017.
Li, W., Reichstein, M., O, S., May, C., Destouni, G., Migliavacca, M., Kraft, B., Weber, U., and Orth, R.: Contrasting Drought Propagation Into the Terrestrial Water Cycle Between Dry and Wet Regions, Earth's Future, 11, e2022EF003441, https://doi.org/10.1029/2022EF003441, 2023.
Ma, L., Huang, Q., Huang, S., Liu, D., Leng, G., Wang, L., and Li, P.: Propagation dynamics and causes of hydrological drought in response to meteorological drought at seasonal timescales, Hydrol. Res., 53, 193–205, https://doi.org/10.2166/nh.2021.006, 2021.
Maxwell, C. M., Fernald, A. G., Cadol, D., Faist, A. M., and King, J. P.: Managing flood flow connectivity to landscapes to build buffering capacity to disturbances: An ecohydrologic modeling framework for drylands, J. Environ. Manage., 278, 111486, https://doi.org/10.1016/j.jenvman.2020.111486, 2021.
McKee, T. B., Doesken, N. J., and Kleist, J.: The relationship of drought frequency and duration to time scales, in: Proceedings of the 8th Conference on Applied Climatology, Conference on Applied Climatology, Anaheim, California, USA, 17–22 January 1993, American Meteorological Society Boston, MA, 179–183, 1993.
Meresa, H., Zhang, Y., Tian, J., and Abrar Faiz, M.: Understanding the role of catchment and climate characteristics in the propagation of meteorological to hydrological drought, J. Hydrol., 617, 128967, https://doi.org/10.1016/j.jhydrol.2022.128967, 2023.
Mishra, A. K. and Singh, V. P.: A review of drought concepts, J. Hydrol., 391, 202–216, https://doi.org/10.1016/j.jhydrol.2010.07.01, 2010.
Montgomery, D. C. and Runger, G. C.: Applied Statistics and Probability for Engineers, John Wiley & Sons, 791 pp., ISBN 978-0-470-05304-1, 2010.
Mukherjee, S., Mishra, A., and Trenberth, K. E.: Climate Change and Drought: a Perspective on Drought Indices, Curr. Clim. Change Rep., 4, 145–163, https://doi.org/10.1007/s40641-018-0098-x, 2018.
Nygren, M., Giese, M., Kløve, B., Haaf, E., Rossi, P. M., and Barthel, R.: Changes in seasonality of groundwater level fluctuations in a temperate-cold climate transition zone, Journal of Hydrology X, 8, 100062, https://doi.org/10.1016/j.hydroa.2020.100062, 2020.
Nygren, M., Giese, M., and Barthel, R.: Recent trends in hydroclimate and groundwater levels in a region with seasonal frost cover, J. Hydrol., 602, 126732, https://doi.org/10.1016/j.jhydrol.2021.126732, 2021.
Nygren, M., Barthel, R., Allen, D. M., and Giese, M.: Exploring groundwater drought responsiveness in lowland post-glacial environments, Hydrogeol. J., 30, 1937–1961, https://doi.org/10.1007/s10040-022-02521-5, 2022.
Odongo, R. A., De Moel, H., and Van Loon, A. F.: Propagation from meteorological to hydrological drought in the Horn of Africa using both standardized and threshold-based indices, Nat. Hazards Earth Syst. Sci., 23, 2365–2386, https://doi.org/10.5194/nhess-23-2365-2023, 2023.
Orth, R. and Destouni, G.: Drought reduces blue-water fluxes more strongly than green-water fluxes in Europe, Nat. Commun., 9, 3602, https://doi.org/10.1038/s41467-018-06013-7, 2018.
Pearson, K.: Notes on the History of Correlation, Biometrika, 13, 25–45, https://doi.org/10.2307/2331722, 1920.
Pereira, L. S., Louro, V., do Rosário, L., and Almeida, A.: Desertification, territory and people, a holistic approach in the Portuguese context, in: Desertification in the Mediterranean Region. A Security Issue, Dordrecht, 269–289, https://doi.org/10.1007/1-4020-3760-0_11, 2006.
Petersen-Perlman, J. D., Aguilar-Barajas, I., and Megdal, S. B.: Drought and groundwater management: Interconnections, challenges, and policyresponses, Curr. Opin. Environ. Sci. Health, 28, 100364, https://doi.org/10.1016/j.coesh.2022.100364, 2022.
Potopová, V., Boroneanţ, C., Možný, M., and Soukup, J.: Driving role of snow cover on soil moisture and drought development during the growing season in the Czech Republic, Int. J. Climatol., 36, 3741–3758, https://doi.org/10.1002/joc.4588, 2016.
Rajsekhar, D., Singh, Vijay. P., and Mishra, Ashok. K.: Multivariate drought index: An information theory based approach for integrated drought assessment, J. Hydrol., 526, 164–182, https://doi.org/10.1016/j.jhydrol.2014.11.031, 2015.
Robinson, J. S., Sivapalan, M., and Snell, J. D.: On the relative roles of hillslope processes, channel routing, and network geomorphology in the hydrologic response of natural catchments, Water Resour. Res., 31, 3089–3101, https://doi.org/10.1029/95WR01948, 1995.
Saito, L., Christian, B., Diffley, J., Richter, H., Rohde, M. M., and Morrison, S. A.: Managing Groundwater to Ensure Ecosystem Function, Groundwater, 59, 322–333, https://doi.org/10.1111/gwat.13089, 2021.
Sattar, M. N., Lee, J.-Y., Shin, J.-Y., and Kim, T.-W.: Probabilistic Characteristics of Drought Propagation from Meteorological to Hydrological Drought in South Korea, Water Resour. Manag., 33, 2439–2452, https://doi.org/10.1007/s11269-019-02278-9, 2019.
Sheffield, J. and Wood, E. F.: Characteristics of global and regional drought, 1950–2000: Analysis of soil moisture data from off-line simulation of the terrestrial hydrologic cycle, J. Geophys. Res.-Atmos., 112, D17115, https://doi.org/10.1029/2006JD008288, 2007.
Singh, N. K., Emanuel, R. E., McGlynn, B. L., and Miniat, C. F.: Soil Moisture Responses to Rainfall: Implications for Runoff Generation, Water Resour. Res., 57, e2020WR028827, https://doi.org/10.1029/2020WR028827, 2021.
Skålevåg, A. and Vormoor, K.: Daily streamflow trends in Western versus Eastern Norway and their attribution to hydro-meteorological drivers, Hydrol. Process., 35, e14329, https://doi.org/10.1002/hyp.14329, 2021.
SMHI: Nedladdning av griddad nederbörd- och temperaturdata (en: Download of gridded precipitation and temperature data), PTHBV, https://www.smhi.se/data/ladda-ner-data/griddade-nederbord-och-temperaturdata-pthbv (last access: 21 July 2025), 2023.
Soulsby, C., Scheliga, B., Neill, A., Comte, J.-C., and Tetzlaff, D.: A longer-term perspective on soil moisture, groundwater and stream flow response to the 2018 drought in an experimental catchment in the Scottish Highlands, Hydrol. Process., 35, e14206, https://doi.org/10.1002/hyp.14206, 2021.
Spearman, C.: The Proof and Measurement of Association between Two Things, Am. J. Psychol., 15, 72–101, https://doi.org/10.1093/ije/dyq191, 1904.
Spinoni, J., Naumann, G., Vogt, J. V., and Barbosa, P.: The biggest drought events in Europe from 1950 to 2012, J. Hydrol. Reg. Stud., 3, 509–524, https://doi.org/10.1016/j.ejrh.2015.01.001, 2015.
Spinoni, J., Vogt, J. V., Naumann, G., Barbosa, P., and Dosio, A.: Will drought events become more frequent and severe in Europe?, Int. J. Climatol., 38, 1718–1736, https://doi.org/10.1002/joc.5291, 2018.
Srivastav, A. L., Dhyani, R., Ranjan, M., Madhav, S., and Sillanpää, M.: Climate-resilient strategies for sustainable management of water resources and agriculture, Environ. Sci. Pollut. R., 28, 41576–41595, https://doi.org/10.1007/s11356-021-14332-4, 2021.
Stagge, J. H., Tallaksen, L. M., Gudmundsson, L., Van Loon, A. F., and Stahl, K.: Candidate Distributions for Climatological Drought Indices (SPI and SPEI), Int. J. Climatol., 35, 4027–4040, https://doi.org/10.1002/joc.4267, 2015.
Staudinger, M., Stahl, K., and Seibert, J.: A drought index accounting for snow, Water Resour. Res., 50, 7861–7872, https://doi.org/10.1002/2013WR015143, 2014.
Stenfors, E., Blicharska, M., Grabs, T., and Teutschbein, C.: Sectoral Vulnerability to Drought: Exploring the Role of Blue and Green Water Dependency in Mid and High-Latitudes, EGUsphere [preprint], https://doi.org/10.5194/egusphere-2024-2726, 2024a.
Stenfors, E., Blicharska, M., Grabs, T., and Teutschbein, C.: User-Validated Drought Vulnerability Factors in Forested Cold Climates: Multi-Sectoral Perspectives from Sweden, EGUsphere [preprint], https://doi.org/10.5194/egusphere-2024-1988, 2024b.
Stoelzle, M., Stahl, K., Morhard, A., and Weiler, M.: Streamflow sensitivity to drought scenarios in catchments with different geology, Geophys. Res. Lett., 41, 6174–6183, https://doi.org/10.1002/2014GL061344, 2014.
Teutschbein, C.: CAMELS-SE: Long-term hydroclimatic observations (1961–2020) across 50 catchments in Sweden as a resource for modelling, education, and collaboration, Geosci. Data J., 11, 655–668, https://doi.org/10.1002/gdj3.239, 2024a.
Teutschbein, C.: Swedish Hydroclimatic Data 1961–2020 – Precipitation, Temperature and Streamflow Observations across 50 Catchments (CAMELS-SE), Version 1, Swedish National Data Service (researchdata.se) [data set], https://doi.org/10.57804/t3rm-v029, 2024b.
Teutschbein, C., Grabs, T., Karlsen, R. H., Laudon, H., and Bishop, K.: Hydrological response to changing climate conditions: Spatial streamflow variability in the boreal region, Water Resour. Res., 51, 9425–9446, https://doi.org/10.1002/2015WR017337, 2015.
Teutschbein, C., Quesada Montano, B., Todorović, A., and Grabs, T.: Streamflow droughts in Sweden: Spatiotemporal patterns emerging from six decades of observations, J. Hydrol. Reg. Stud., 42, 101171, https://doi.org/10.1016/j.ejrh.2022.101171, 2022.
Teutschbein, C., Albrecht, F., Blicharska, M., Tootoonchi, F., Stenfors, E., and Grabs, T.: Drought hazards and stakeholder perception: Unraveling the interlinkages between drought severity, perceived impacts, preparedness, and management, Ambio, 52, 1262–1281, https://doi.org/10.1007/s13280-023-01849-w, 2023a.
Teutschbein, C., Jonsson, E., Todorović, A., Tootoonchi, F., Stenfors, E., and Grabs, T.: Future drought propagation through the water-energy-food-ecosystem nexus – A Nordic perspective, J. Hydrol., 617, 128963, https://doi.org/10.1016/j.jhydrol.2022.128963, 2023b.
Thomann, J. A., Werner, A. D., and Irvine, D. J.: Developing adaptive management guidance for groundwater planning and development, J. Environ. Manage., 322, 116052, https://doi.org/10.1016/j.jenvman.2022.116052, 2022.
Todorović, A., Grabs, T., and Teutschbein, C.: Advancing traditional strategies for testing hydrological model fitness in a changing climate, Hydrolog. Sci. J., 67, 1790–1811, https://doi.org/10.1080/02626667.2022.2104646, 2022.
Todorović, A., Grabs, T., and Teutschbein, C.: Improving performance of bucket-type hydrological models in high latitudes with multi-model combination methods: Can we wring water from a stone?, J. Hydrol., 632, 130829, https://doi.org/10.1016/j.jhydrol.2024.130829, 2024.
Tootoonchi, F., Todorović, A., Grabs, T., and Teutschbein, C.: Uni- and multivariate bias adjustment of climate model simulations in Nordic catchments: Effects on hydrological signatures relevant for water resources management in a changing climate, J. Hydrol., 623, 129807, https://doi.org/10.1016/j.jhydrol.2023.129807, 2023.
Tripathy, K. P. and Mishra, A. K.: How Unusual Is the 2022 European Compound Drought and Heatwave Event?, Geophys. Res. Lett., 50, e2023GL105453, https://doi.org/10.1029/2023GL105453, 2023.
UNDRR: GAR Special report on drought 2021, United Nations Office for Disaster Risk Reduction, Geneva, Switzerland, 173 pp., ISBN 9789212320274, 2021.
Van Loon, A. F.: Hydrological drought explained, WIREs Water, 2, 359–392, https://doi.org/10.1002/wat2.1085, 2015.
Van Loon, A. F. and Van Lanen, H. A. J.: A process-based typology of hydrological drought, Hydrol. Earth Syst. Sci., 16, 1915–1946, https://doi.org/10.5194/hess-16-1915-2012, 2012.
Van Loon, A. F., Ploum, S. W., Parajka, J., Fleig, A. K., Garnier, E., Laaha, G., and Van Lanen, H. A. J.: Hydrological drought types in cold climates: quantitative analysis of causing factors and qualitative survey of impacts, Hydrol. Earth Syst. Sci., 19, 1993–2016, https://doi.org/10.5194/hess-19-1993-2015, 2015.
Vaux, H.: Groundwater under stress: the importance of management, Environ. Earth Sci., 62, 19–23, https://doi.org/10.1007/s12665-010-0490-x, 2011.
Vicente-Serrano, S. M., López-Moreno, J. I., Beguería, S., Lorenzo-Lacruz, J., Azorin-Molina, C., and Morán-Tejeda, E.: Accurate computation of a streamflow drought index, J. Hydrol. Eng., 17, 318–332, https://doi.org/10.1061/(ASCE)HE.1943-5584.000043, 2011.
Vicente-Serrano, S. M., Beguería, S., Lorenzo-Lacruz, J., Camarero, J. J., López-Moreno, J. I., Azorin-Molina, C., Revuelto, J., Morán-Tejeda, E., and Sanchez-Lorenzo, A.: Performance of Drought Indices for Ecological, Agricultural, and Hydrological Applications, Earth Interact., 16, 1–27, https://doi.org/10.1175/2012EI000434.1, 2012.
Wang, H., Zhu, Y., Qin, T., and Zhang, X.: Study on the propagation probability characteristics and prediction model of meteorological drought to hydrological drought in basin based on copula function, Front. Earth Sci., 10, 961871, https://doi.org/10.3389/feart.2022.961871, 2022.
Weider, K. and Boutt, D. F.: Heterogeneous water table response to climate revealed by 60 years of ground water data, Geophys. Res. Lett., 37, L24405, https://doi.org/10.1029/2010GL045561, 2010.
Wendt, D. E., Bloomfield, J. P., Van Loon, A. F., Garcia, M., Heudorfer, B., Larsen, J., and Hannah, D. M.: Evaluating integrated water management strategies to inform hydrological drought mitigation, Nat. Hazards Earth Syst. Sci., 21, 3113–3139, https://doi.org/10.5194/nhess-21-3113-2021, 2021.
Wilhite, D. A.: A methodology for drought preparedness, Nat. Hazards, 13, 229–252, https://doi.org/10.1007/BF00215817, 1996.
Wilson, D., Hisdal, H., and Lawrence, D.: Has streamflow changed in the Nordic countries? – Recent trends and comparisons to hydrological projections, J. Hydrol., 394, 334–346, https://doi.org/10.1016/j.jhydrol.2010.09.010, 2010.
WMO and GWP: Handbook of Drought Indicators and Indices, edited by: Svoboda, M. and Fuchs, B. A., Integrated Drought Management Programme (IDMP), Geneva, Switzerland, ISBN 978-91-87823-24-4, 2016.
WMO Climatological Normals: https://community.wmo.int/wmo-climatological-normals, last access: 16 December 2021.
Wu, H., Hayes, M. J., Wilhite, D. A., and Svoboda, M. D.: The effect of the length of record on the standardized precipitation index calculation, Int. J. Climatol., 25, 505–520, https://doi.org/10.1002/joc.1142, 2005.
Zhang, Q., Miao, C., Gou, J., Wu, J., Jiao, W., Song, Y., and Xu, D.: Spatiotemporal characteristics of meteorological to hydrological drought propagation under natural conditions in China, Weather Clim. Extrem., 38, 100505, https://doi.org/10.1016/j.wace.2022.100505, 2022a.
Zhang, X., Hao, Z., Singh, V. P., Zhang, Y., Feng, S., Xu, Y., and Hao, F.: Drought propagation under global warming: Characteristics, approaches, processes, and controlling factors, Sci. Total Environ., 838, 156021, https://doi.org/10.1016/j.scitotenv.2022.156021, 2022b.
Zhu, Y., Liu, Y., Wang, W., Singh, V. P., and Ren, L.: A global perspective on the probability of propagation of drought: From meteorological to soil moisture, J. Hydrol., 603, 126907, https://doi.org/10.1016/j.jhydrol.2021.126907, 2021.