the Creative Commons Attribution 4.0 License.
the Creative Commons Attribution 4.0 License.
 | 04 Jul 2025
Dynamic fragility of a slender rock pillar in a carbonate rock mass
Alaa Jbara
Michael Tsesarsky
Fragile geological features (FGFs) provide critical empirical data for the validation of probabilistic seismic hazard models over prehistoric timescales. Among FGFs, precariously balanced rocks (PBRs) are the most widely studied, with fragility analyses based on simple rigid-body rocking dynamics. FGFs formed from sedimentary rock masses differ from PBRs and require the consideration of rock mass properties in their fragility assessments. Sedimentary FGFs have received limited attention from the geological and engineering communities. This study presents a detailed dynamic fragility analysis of a 42 m high Ramon pillar (Negev Desert, Israel). Composed of a sedimentary rock mass with various discontinuities, the pillar was modeled using a high-resolution finite-element (FE) model, with 1.25×10⁶ elements. The model was constructed using high-resolution aerial lidar scanning and in situ measurements of rock elastic modulus along the pillar's height. Validation was achieved by comparing computational modal analysis with in situ measurements of natural vibrations, accurately predicting the first mode (1.3 Hz) and estimating the second mode (2.7 Hz) with a 10 % deviation from the observed values (3 Hz). The assumption of uniform rock elastic moduli (back-calculated) or simplified geometries yielded unsatisfactory results, highlighting the importance of precise characterization. Situated near two significant seismic sources, the Sinai–Negev Shear Zone (SNSZ), with a potential M 6 earthquake, and the Dead Sea Transform (DST), with a potential M 7 earthquake, both with sub-millennial return periods, the pillar's fragility was used to test regional seismic hazard estimates. Two methodologies were employed: a simplified spectral analysis based on empiric ground motion models and a fully dynamic FE analysis incorporating recorded ground motions from the Pacific Earthquake Engineering Research Center (PEER) strong-motion database. Results show that an M 7 on the DST (45 km away) will not compromise the pillar integrity, whereas an M 6 earthquake on the SNSZ (6 to 20 km away) would likely lead to breakage at its base due to tensile stresses exceeding its basal strength. Given the pillar fragility age of 11.4 kyr, these findings challenge the assumption that the SNSZ can produce an M 6 event.
- Article
(10959 KB) - Full-text XML
- BibTeX
- EndNote


The recurrence intervals of large earthquakes generally exceed the observation length of instrumental records; hence, existing catalogs cannot provide complete information on seismic sources and seismic hazards (Anderson et al., 2011). While historical records are useful in constraining the return periods, they are less useful in constraining earthquake locations, magnitudes, and ground motion intensity. The standard method used to assess the hazard of potentially damaging earthquakes is the probabilistic seismic hazard analysis (PSHA). This framework allows the estimation of the rate or probability of exceeding ground motion intensity at a site (Gerstenberger et al., 2020). While the underlying assumptions of PSHA are still being debated (e.g., Mulargia et al., 2017; Stark, 2022; Bommer, 2022), its widespread use in the earthquake engineering community requires independent validation (Marzocchi and Meletti, 2024).
Fragile geological features (FGFs) provide critical empirical data for validating probabilistic seismic hazard models over prehistoric timescales. The development of robust and quantitative validation and evaluation methods to reduce uncertainties in earthquake ground motion estimates are required for long return periods (103 to 104 yr) in particular because PSHA estimates for such return periods are highly uncertain yet are essential for the siting, design, and continued maintenance and monitoring of critical civic facilities, such as large dams, power plants (including nuclear), and nuclear waste repositories (Rood et al., 2020). Ancient fragile geologic features (FGFs) have been previously identified as potentially useful for validating the un-exceeded ground motions estimated from PSHA models (Anderson et al., 2011, and references therein; Stirling and Anooshehpoor, 2006) and were recently incorporated into the formal design of earthquake motions for a significant engineered structure (Stirling et al., 2021a).
1.1 Fragile geological features
A fragile geological feature (FGF) is a feature that might be easily destroyed by strong earthquake ground motions and is mechanically simple enough to analyze the ground motions that might cause its destruction (Anderson et al., 2011). FGFs include various delicate natural features such as paleo-sea stacks, tufa towers, hoodoos, badlands, and unstable regoliths, which can potentially be used to constrain past ground motions (Stirling et al., 2021b). In practice, the most studied and used FGFs are precariously balanced rocks (PBRs), introduced by Brune (1996) for PSHA applications in southern California and Nevada. PBRs are boulders balanced on and mechanically separated from a sub-horizontal pedestal and are susceptible to toppling when exposed to earthquake ground shaking (Hall et al., 2019; Rood et al., 2022; Chen et al., 2024; McPhillips and Pratt, 2024).
The ubiquity of granitic PBRs near the San Andreas Fault system enabled statistically meaningful analysis and reduced uncertainties in earthquake hazard analysis (Rood et al., 2020). The relative simplicity of determining the fragility of PBRs enabled the spread of the method worldwide. However, this method cannot be readily exported to different geological terrains and lithologies, as the mechanical response to the dynamic loading of various FGFs fundamentally differs from the rocking dynamics of PBRs. In a recent workshop titled “Evaluation of seismic hazard models with fragile geological features” (Stirling et al., 2021a), the topic of fragility estimation was recognized as a critical research need. Specifically, there was an emphasis on case studies of the fragility of various categories of FGFs and cost- and time-effective methods for quantifying fragility that account for frequency content of ground motions, which will yield greater confidence in fragility assessment and greater uptake of FGF data for constraining seismic hazard models.
1.2 Dynamic analysis of FGFs
Contrary to rigid PBRs, FGFs with fragility depending on rock mass structure and properties have received less attention from the geological and engineering communities. A common issue for non-PBR FGFs is the strength of rock mass discontinuities, specifically across the base (basal attachment). For FGFs evolving from sedimentary rock masses, complete basal detachment along bedding planes cannot be assured. Shang et al. (2018) showed that in siltstone, an incipient bedding plane's uniaxial tensile strength (UTS) ranged from 32 % to 88 % of the parent rock UTS. Rock joints in the same rock type exhibited UTSs of 23 % to 70 % of the parent rock, and rock bridges consisted of 23 % to 70 % of the discontinuity. Frayssines and Hantz (2009) showed that steep limestone cliffs were stable due to relatively small rock bridges, up to 5 % of the failure surface. Any attempt to quantify rock bridges is hampered by the fact that rock bridges are not visible unless human activities or natural events expose the rock mass (Elmo et al., 2018). Should rock bridges be neglected in hazard assessment, the analysis would conclude that cliffs that exist on the centennial to millennial timescales have low safety factors. Therefore, a realistic fragility assessment of rock pillars should consider the basal attachment and its tensile strength.
Accurate estimation of natural frequencies, elastic moduli, and damping ratios is critical for the assessment of the dynamic fragility of freestanding rock structures. Several research groups studied the vibrational behavior of freestanding rock masses, such as rock arches (Moore et al., 2016, 2018) and rock towers (Moore et al., 2019; Valentin et al., 2017). Combined with numerical analysis to back-calculate the elastic (small-strain) moduli, the seismic resonance technique proved feasible to determine the natural modes and the elastic moduli of freestanding rock masses. Specifically, Moore et al. (2019) claim that with basic geometry and material property estimates, other freestanding rock structures' resonant frequencies can be estimated a priori. It should be noted that installing seismometers atop large-scale structures, such as the 120 m high Castleton tower in Utah (Moore et al., 2019), is not a simple task and involves rock climbing and rappeling expertise.
In this study, we present a comprehensive analysis of the dynamic fragility of a slender rock pillar (Ramon, Israel) based on accurate lidar scanning of its geometry, in situ rock elastic modulus determination, and finite-element (FE) modal and dynamic analysis. The mechanical model was validated by comparing the results of the modal analysis to vibrational measurements of the pillar (Finzi et al., 2020), ensuring its reliability. Leveraging the validated model, we performed a fully dynamic FE analysis under various seismic loading (distance–magnitude) scenarios. The dynamic analysis results are used to challenge previous assumptions regarding the region's seismic hazard. This research shows the significance of accurate and detailed material models of sedimentary structures for a dynamic fragility analysis and provides a straightforward approach for their analysis as FGFs. The findings highlight the potential of this approach in advancing seismic hazard assessment methodologies and improving the understanding of the fragility of sedimentary rock formations.
The main seismic source in the eastern Mediterranean is the active tectonic border of the Dead Sea Transform (DST). The DST, with a total length of 1100 km, consists of several en-echelon segments extending from the Gulf of Aqaba in the south to the Syrian–Turkish border in the north (Garfunkel, 2014). The seismic hazard of the central Negev (Israel) is dominated by two seismogenic sources: the Sinai–Negev Shear Zone (SNSZ) and the southern part of the DST. The SNSZ includes five E–W trending faults (Fig. 1) from north to south: Sa'ad–Nafha, Ramon, Arif–Batur, Paran, and Thamad. The region exhibits low modern-day seismicity. Seismic hazard studies regard the entire zone cautiously by setting a relatively high maximal magnitude of M 6.2 (Grünthal et al., 2009). They also report a common b value of 0.838 ± 0.022 for the DST, which is to be used for small seismic source zones within the large zone. The annual rate for an M 6.2 earthquake is on the order of 10−2. Shamir et al. (2001) and the Israeli earthquake building code consider only the Thamad and Paran faults as seismic sources capable of producing M 6 earthquakes. The Arava fault, a relatively simple linear segment of the DST, is characterized by almost pure strike-slip motion, with a slip rate of about 4–5 mm yr−1 (Hamiel et al., 2016). Grünthal et al. (2009) report a b value of 0.904 ± 0.60 for the Dead Sea area faults. While the DST (at large) has been responsible for numerous M ≥ 7 earthquakes in the last 3000 years (Agnon, 2014; Zohar, 2020), only a few significant events were documented along the Arava fault section (Lefevre et al., 2018). There is a wide range of uncertainty regarding the magnitudes of earthquakes along this remote section. The challenge in deciphering historical data is demonstrated in the case of the 873 CE event, which some studies suggest to be the strongest historical earthquake in the region, M 7 to 7.5 (Lefevre et al., 2018; Klinger et al., 2015), while other studies do not mention it at all (Ambraseys et al., 2005).
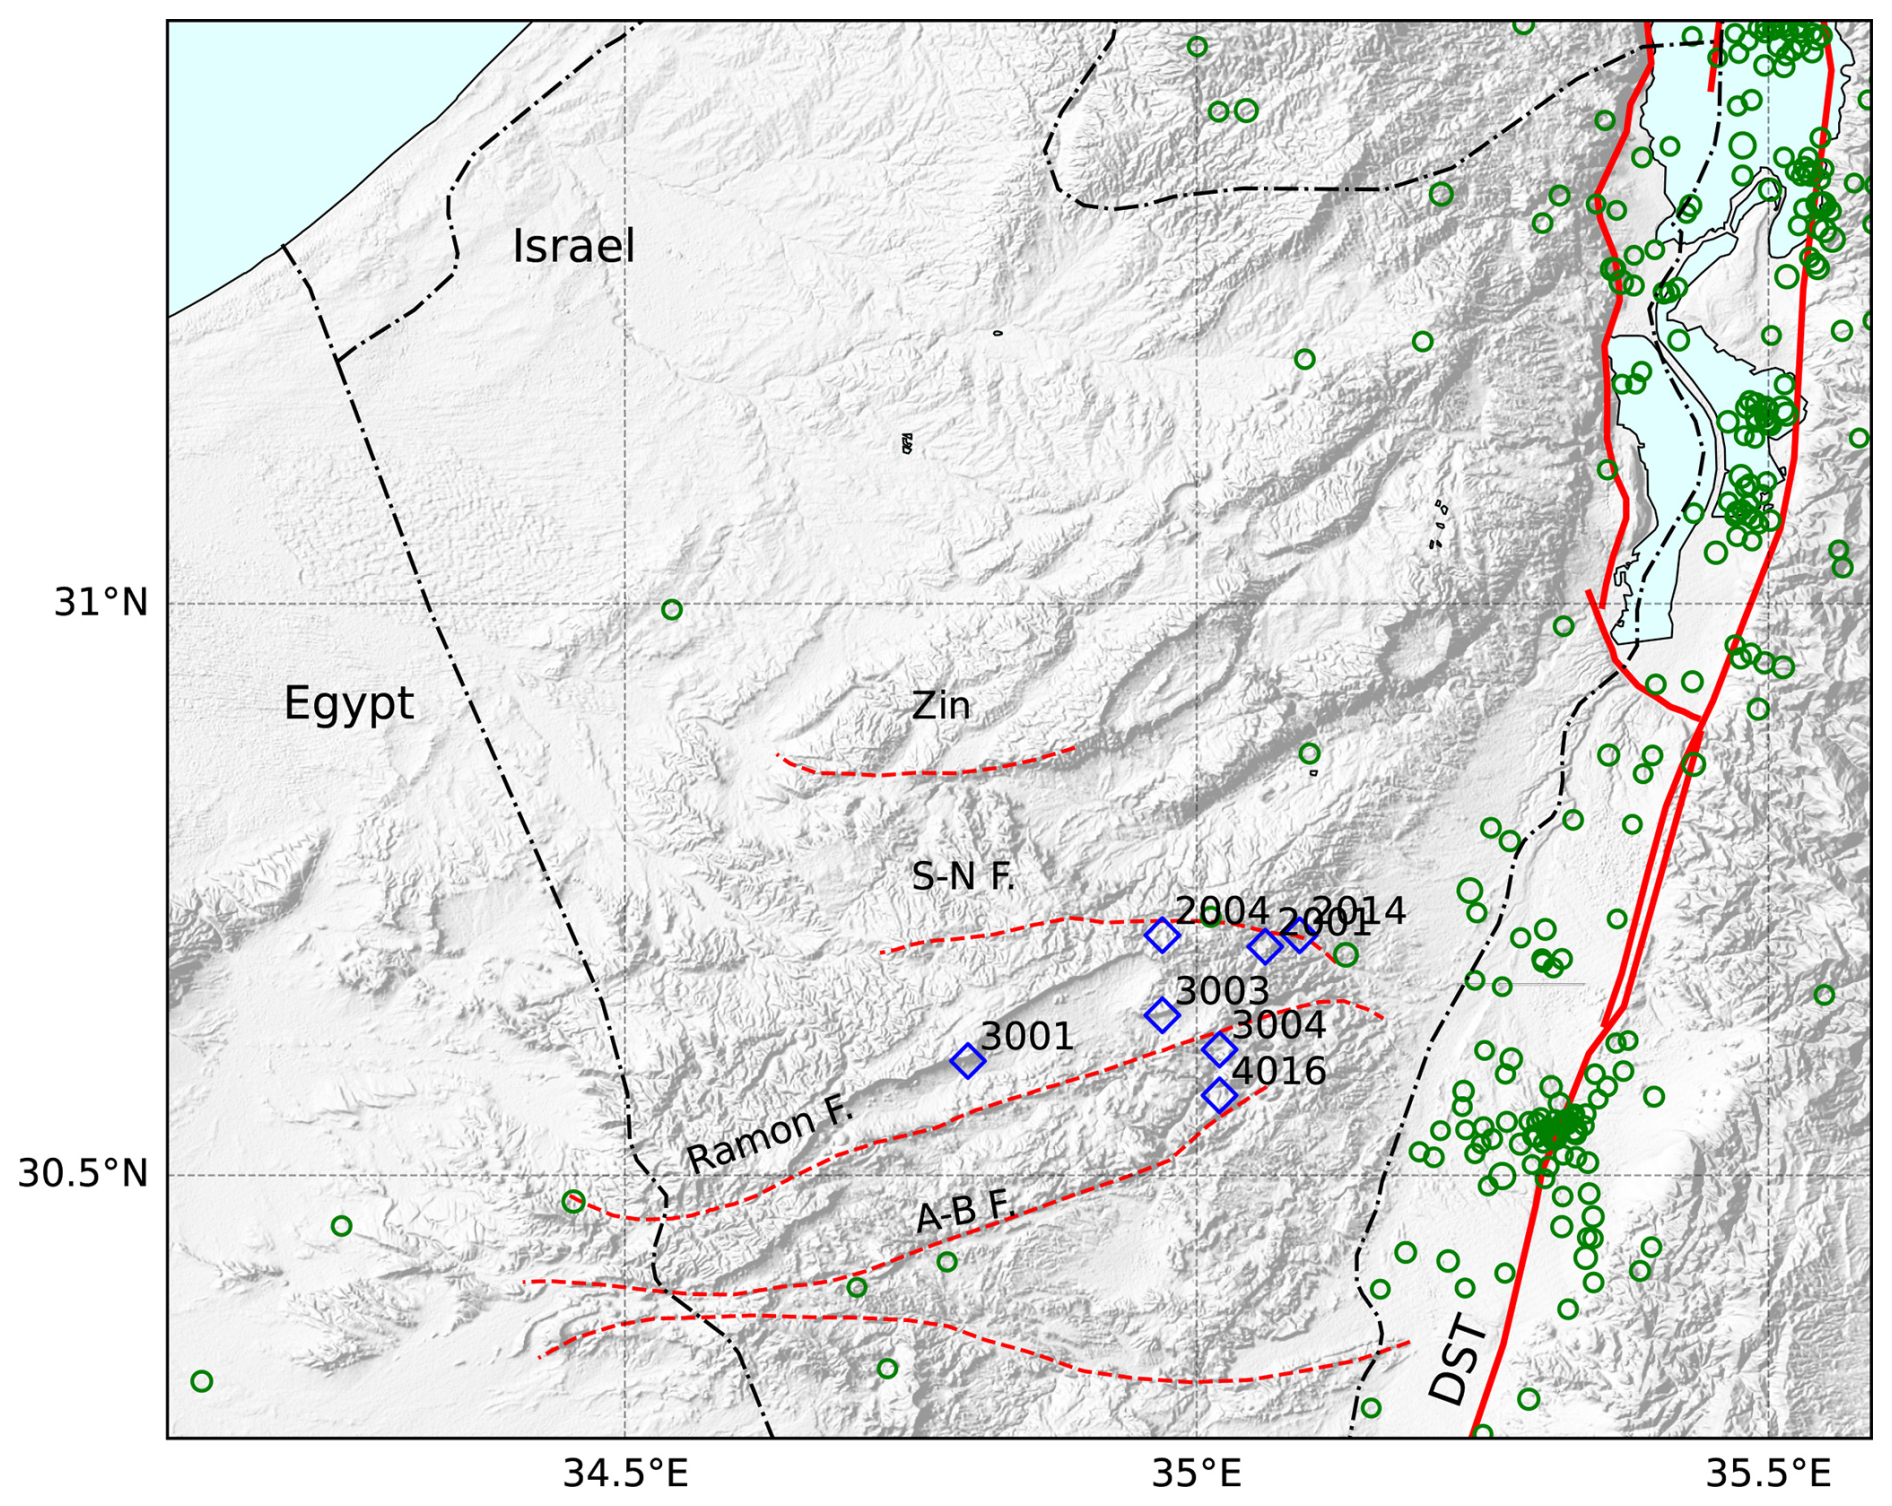
Figure 1Regional shaded relief map of southern Israel. Dead Sea Transform (DST) active faults are plotted with continuous red lines, and the Sinai–Negev Shear Zone faults are plotted with broken red lines. S-N F is the Sa'ad–Nafha Fault; A-B F is the Arif–Batur fault. Blue diamonds are the locations of dated rock pillars (Finzi et al., 2020). Green circles are seismic events (Israel Seismic Bulletin, 2024, M > 2).
Negev Desert FGFs
Finzi et al. (2020) conducted an extensive survey of fragile geological features (FGFs) in the Negev Desert, documenting over 80 FGFs, half of which are rock pillars. For nine rock pillars, the fragility age was determined using the optical stimulated luminescence (OSL) technique, ranging from 123 to 1.7 kyr. The Negev rock pillars form along pre-existing fracture sets that cut vertically into cliff-forming layers of the hard carbonates of the Judea group. As the fractures grow and widen, they separate rock columns from the cliff (Frayssines and Hantz, 2009; Bakun-Mazor et al., 2013), eventually transforming them into freestanding pillars (Fig. 2). The erosional slope retreat rate in this hyperarid (< 80 mm yr−1 precipitation) area is slow, about 10 m Ma−1 (Boroda et al., 2014) and has prevailed since the middle Pleistocene (Enzel et al., 2008). The long-term climatic stability and proximity to seismic sources make the Negev rock pillars excellent candidates for studying dynamic fragility and testing basic assumptions of regional PSHA.
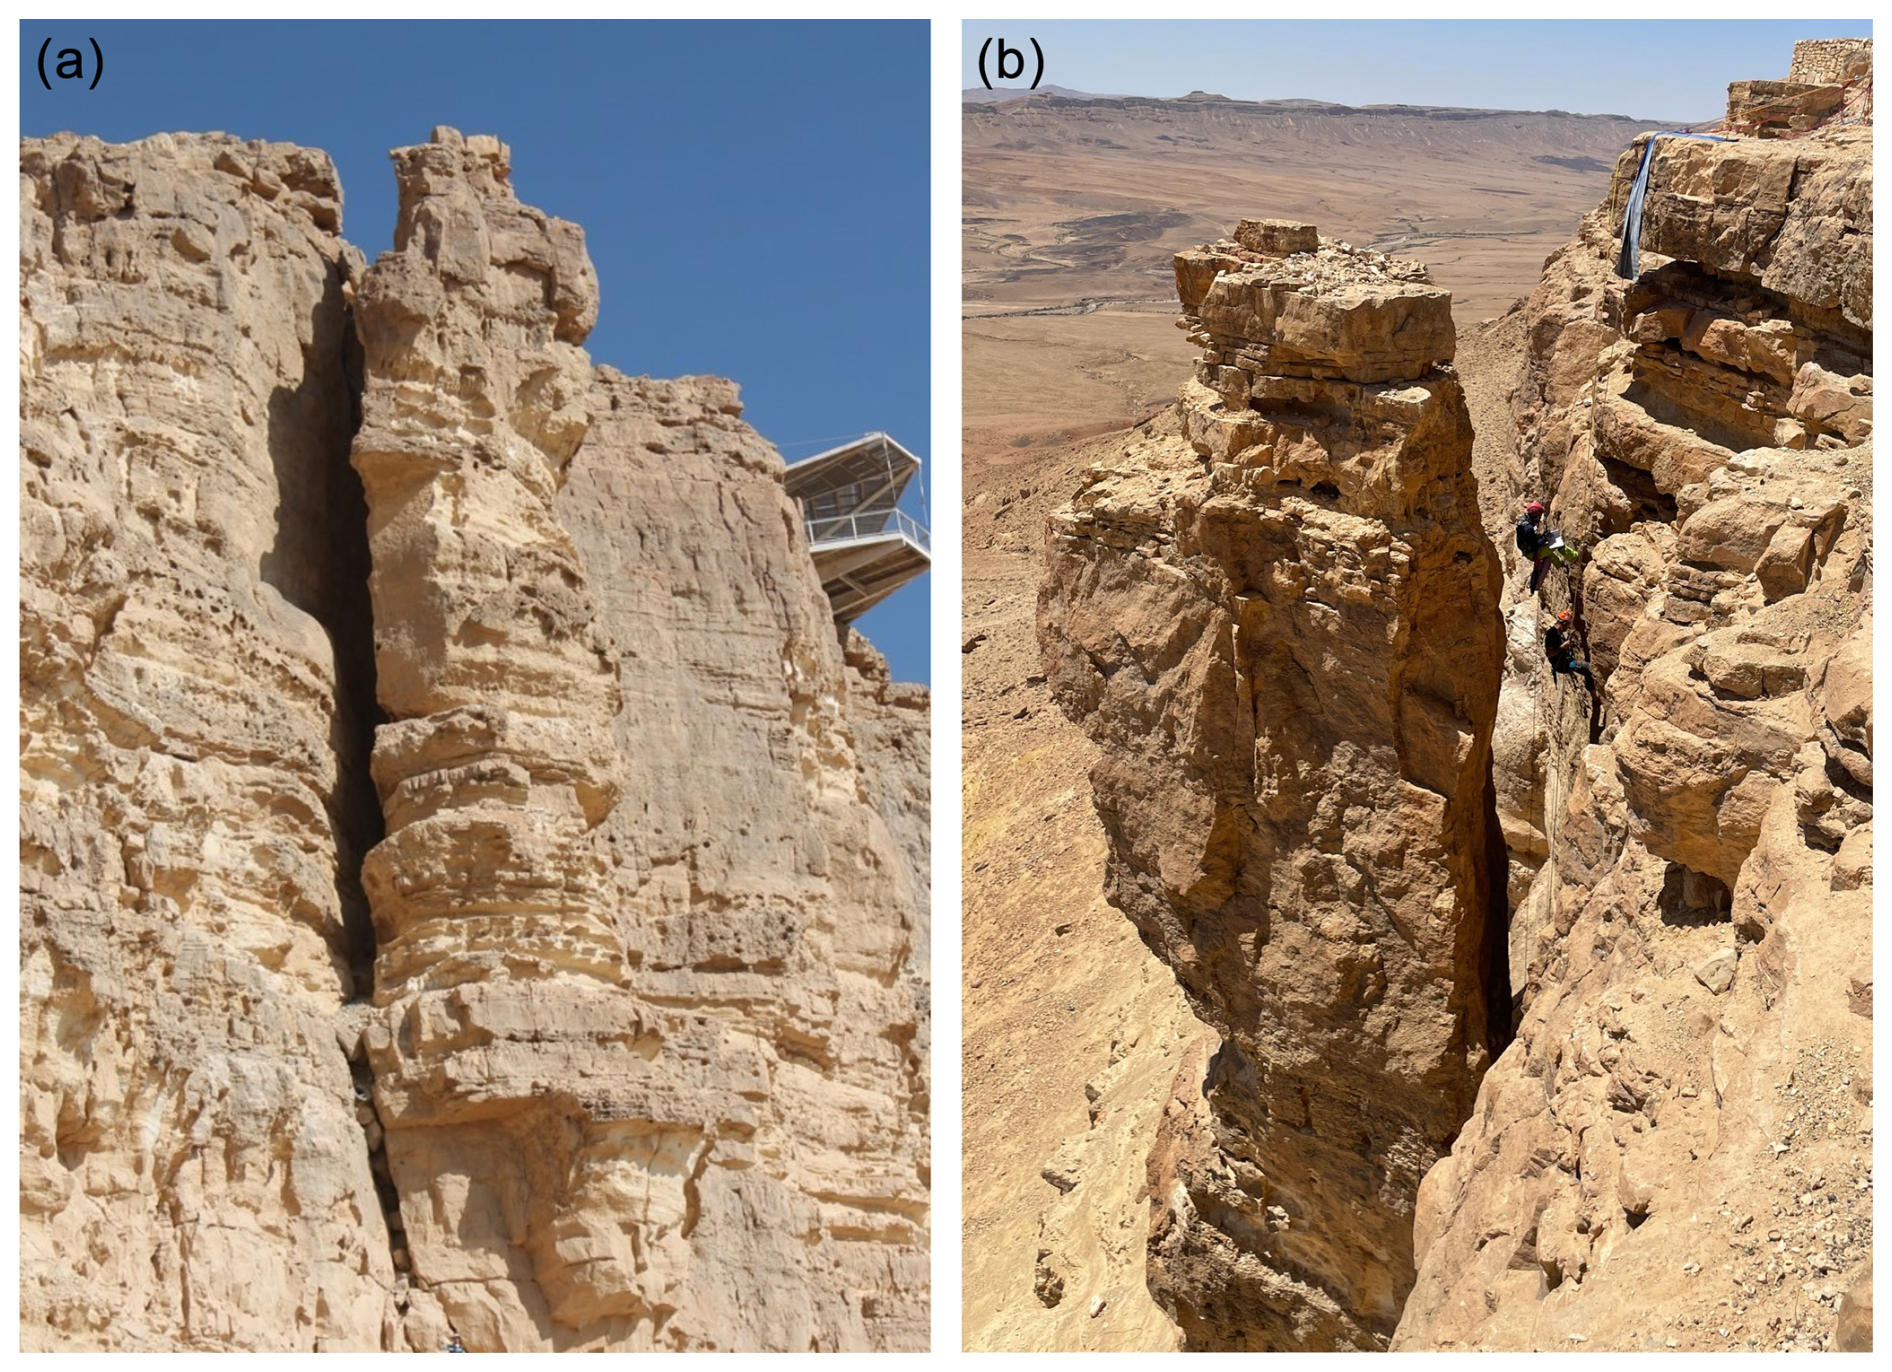
Figure 2The Ramon pillar: (a) photo taken from the Ramon crater floor, looking northeast. (b) Rappeling along the back crack to measure the rock elastic modulus, looking southwest.
Among the rock pillars mapped in the Negev Desert, the Ramon pillar (no. 3001 in Finzi et al., 2020), located at the northern cliff of the Ramon crater (30.606° N 34.804° E), is the most impressive (Fig. 2). The pillar's height is 42 m, with a slenderness ratio (height width) of 8; it is composed mainly of hard carbonates of the upper Cretaceous Hevyon Fm. The fragility age of the pillar based on OSL dating of silt accumulated in the large crack separating it from the cliff is 11.4 kyr (Finzi et al., 2020).
3.1 Pillar geometry and rock mass properties
The Ramon pillar was scanned using airborne lidar (Geoslam ZebHorizon sensor) with a 2–4 cm accuracy. A solid model was rendered from the point cloud using the AutoDesk MeshMixer v. 3.5 (https://meshmixer.com/, last access: 9 August 2023) software bundle. In this study, the various discontinuities within the rock mass were not explicitly modeled. Instead, their influence was incorporated indirectly by adjusting key rock mass properties, specifically stiffness and damping, to account for their presence. The density of the hard carbonate is 2230 kg m−3, and tensile strength (Brazilian splitting test) ranges from 5 to 9 MPa (Saltzman, 2001). The rock's elastic modulus was estimated from direct measurements of elastic rebound at the back of the Ramon pillar (Fig. 2b). The team led by co-author Tsesarsky rappeled the entire length of the pillar back joint (42 m), taking measurements using a rebound hammer (Proceq Rock Schmidt) at discrete locations along the pillar's height to capture lithological and mechanical variations. The Schmidt hammer rebound hardness was determined following the ASTM C805/C805M-18 standard. Measurements focused on transitions between lithological units, such as from hard dolomites/limestones to softer limestones (e.g., fossil reefs) and within limestones transitioning from massive to bedded structures. For instance, at a depth of 12 m, the rock consists of massive limestone, transitioning to a porous fossilized reef at 15 m (refer to Fig. A1) and subsequently to uniform limestone. Due to lithological heterogeneity and the physical constraints of rappeling, the resulting hardness profile is not evenly spaced. Details of the sampling layout are provided in Table A1 of Appendix A. The Katz et al. (2000) correlation was applied to estimate the rock elasticity modulus. Rock mass modulus (ERM) was assessed using the Hoek and Diederichs (2006) equation and a geological strength index (GSI) value of 65 based on a close visual inspection of the rock mass. The variation in the rebound value and ERM along the height of the pillar is presented in Fig. 3. Based on these measurements, the visual inspection, and geological judgment, the pillar was divided into four vertical regions, each with a representative rock mass modulus, which are presented in Fig. 3 as vertical gray lines.
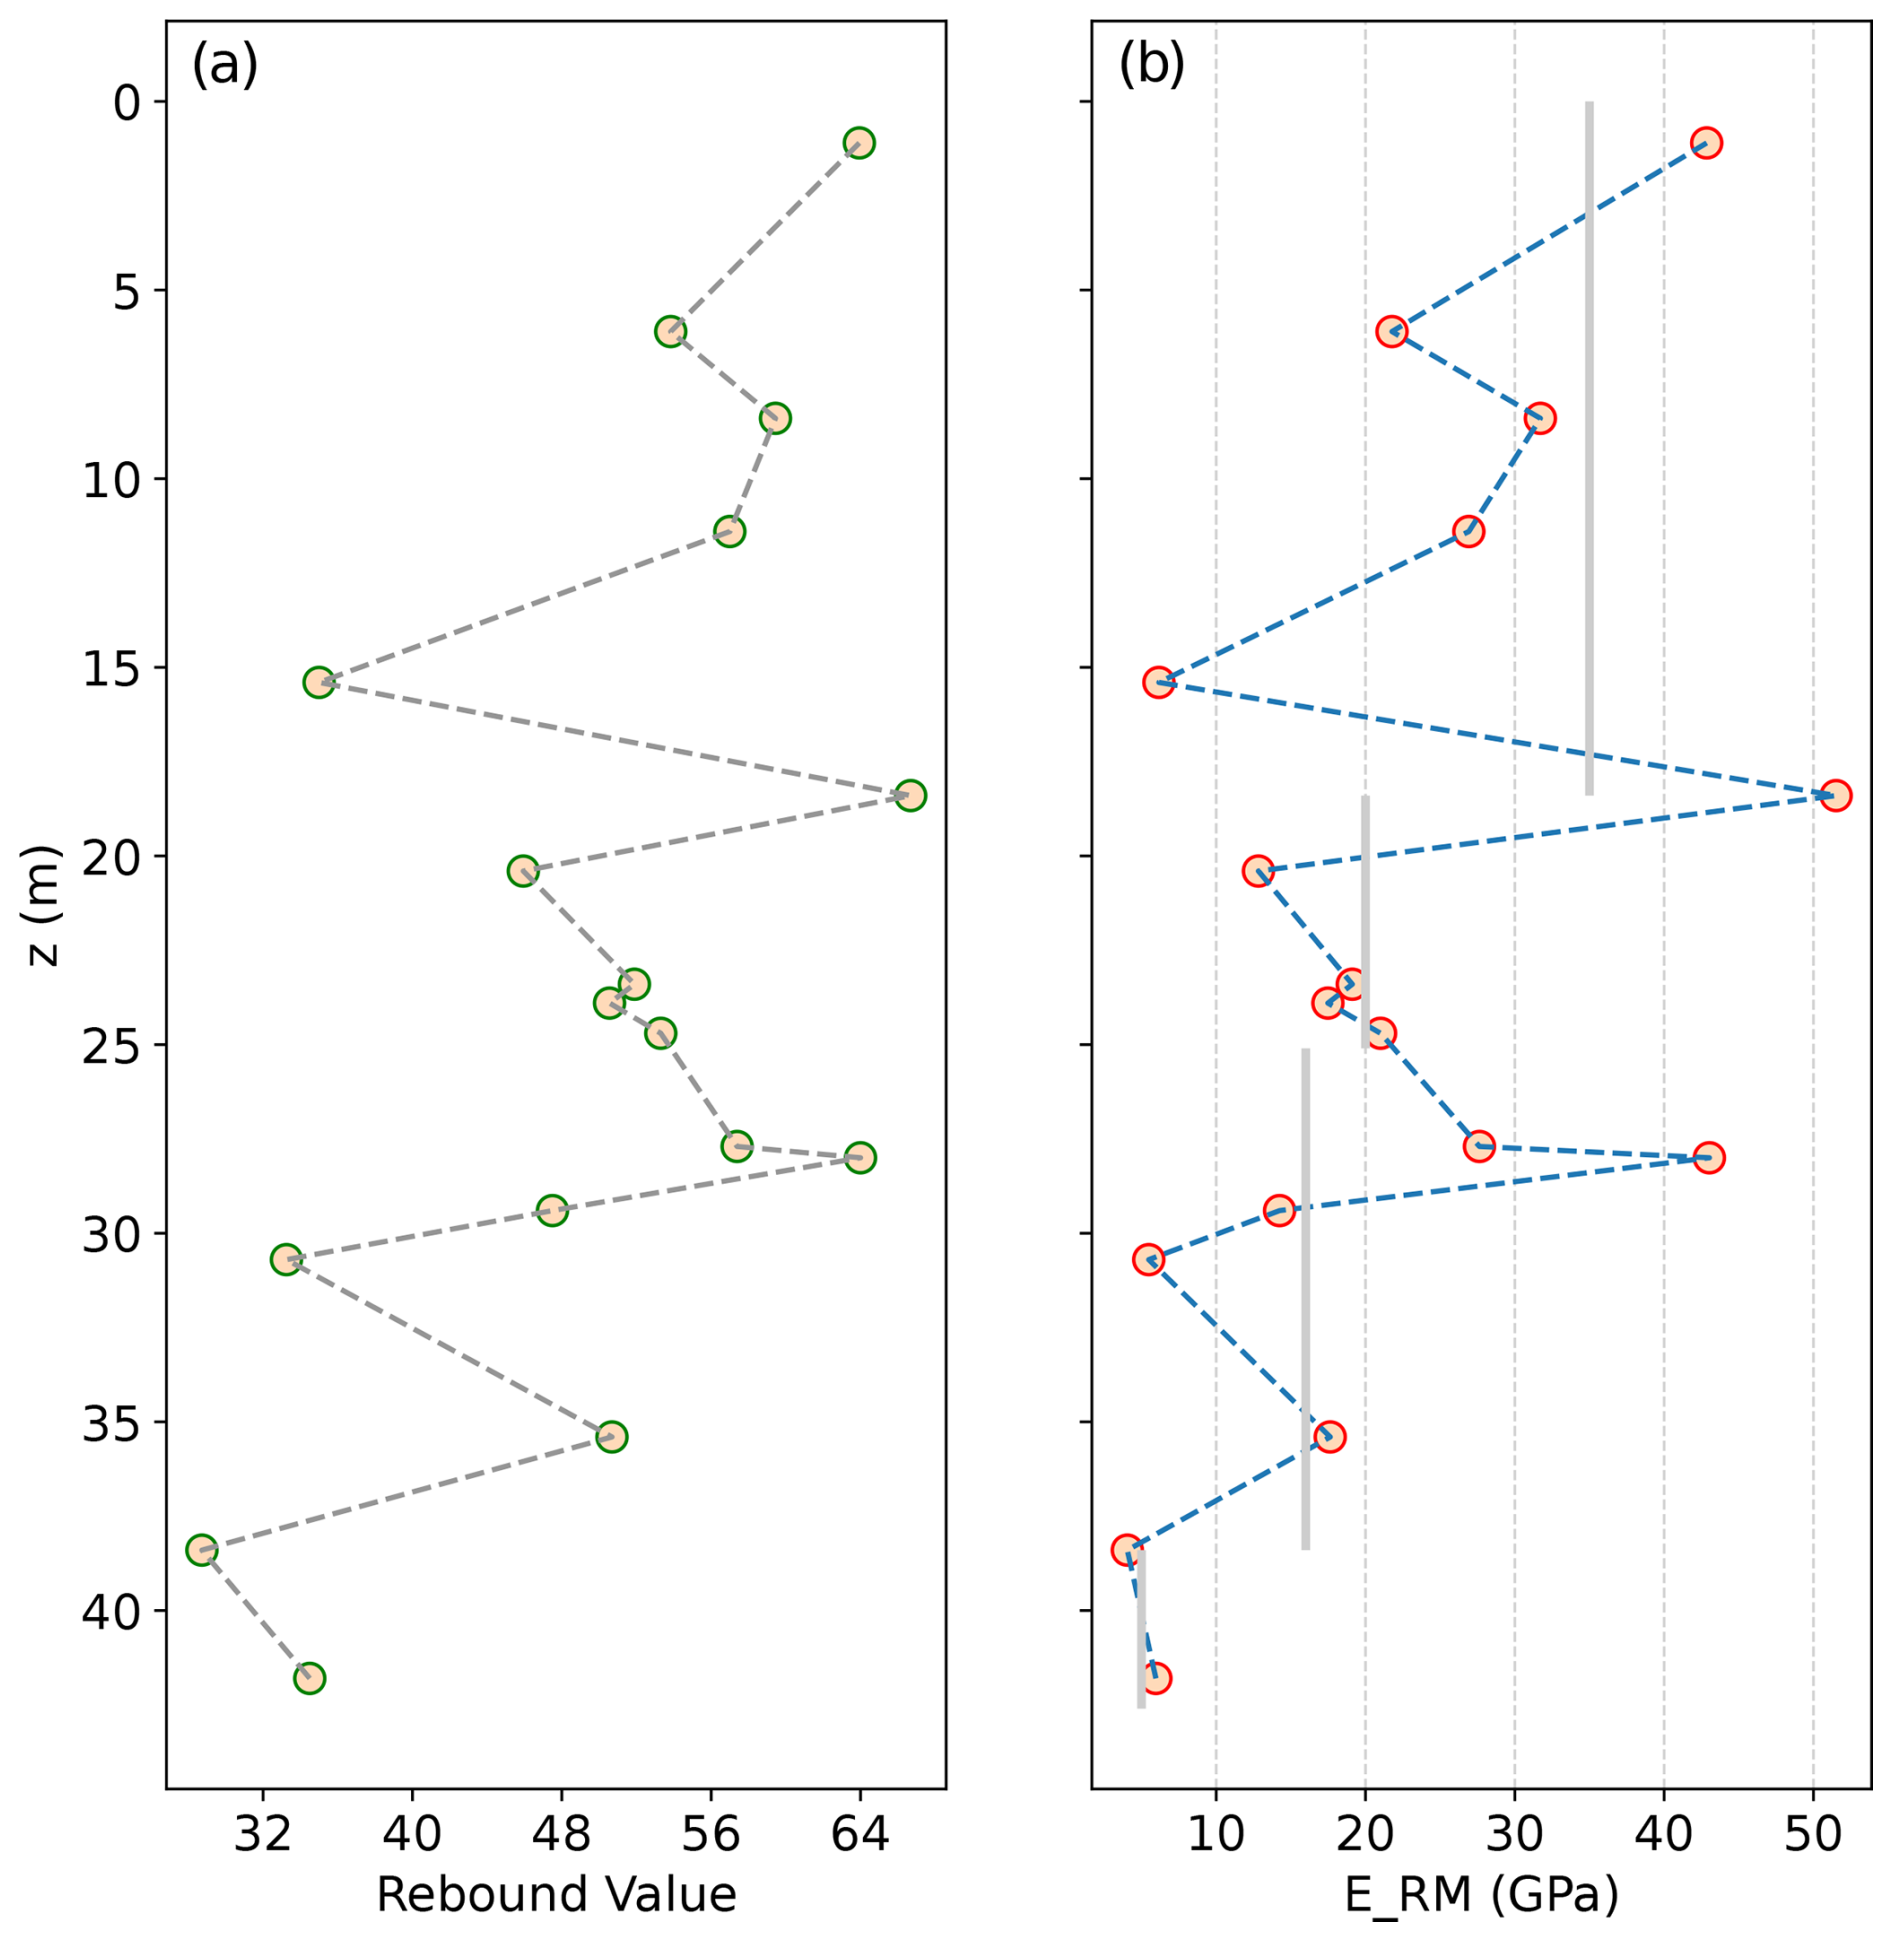
Figure 3Variation in the rock rebound value (a) and rock mass elastic modulus (b) along the Ramon pillar back crack; z is the depth from the surface. Gray lines are representative values of the four vertical regions used in the FE model.
3.2 FEM analysis
Finite-element method (FEM) analysis was performed using the ABAQUS software package (Simulia, 2020). The solid MeshMixer model was imported into ABAQUS and, due to the structure's complex geometry, was meshed using tetrahedral linear elements. The pillar was modeled as an isolated freestanding structure, excluding the parent cliff of the Ramon crater from the computational domain. During the gravity loading phase, fixed-boundary conditions were applied at the base, constraining the translational and rotational degrees of freedom. The boundary conditions for the dynamic loading phase were adjusted to zero vertical displacements at the base while applying time-dependent horizontal accelerations to simulate seismic excitation. The model was horizontally loaded in one direction at a time by one horizontal component. H1 was loaded in the 135° direction and H2 in the 45° direction.
Convergence analysis was performed to set the optimal element size, resulting in 0.5 m elements. In total, the model comprised 1.248×10⁶ elements. For modal analysis, material properties were changed between models from simple homogenous models to models with vertical changes in ERM. For all the models, the rock density was set to 2230 kg m−3, and the Poisson ratio was assumed to be 0.25. Dynamic models were executed using implicit formulation. Loading time histories were selected from the Pacific Earthquake Engineering Research Center (PEER) ground motion database (Ancheta et al., 2013) for selected magnitudes and distances.
4.1 Modal analysis
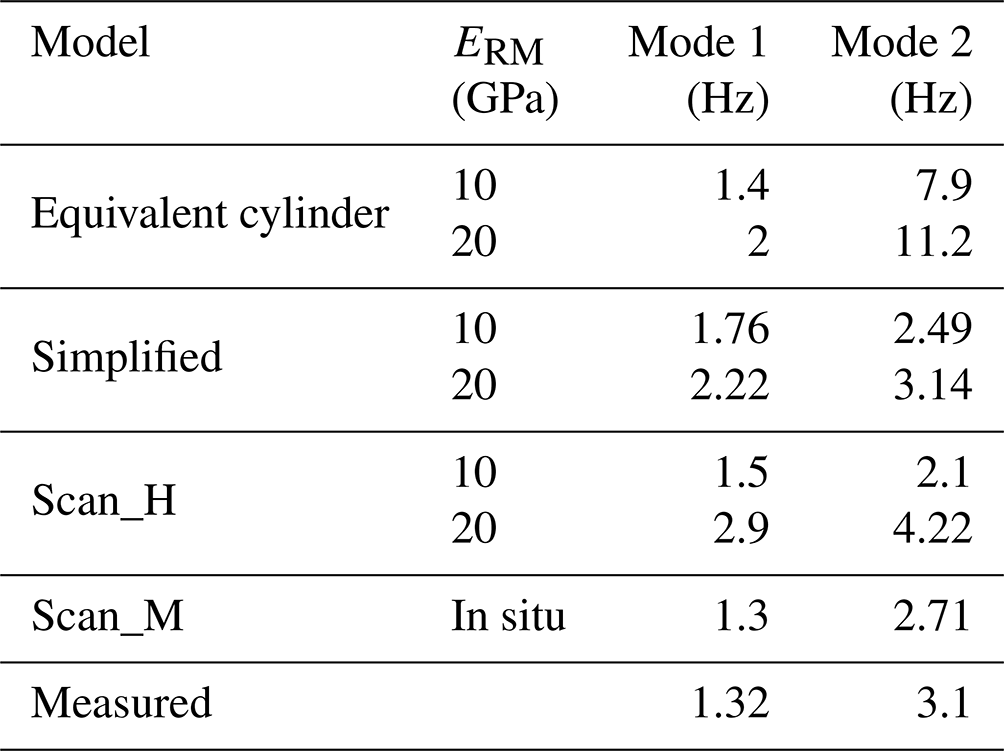
Modal analysis of the Ramon pillar with different levels of complexity was performed, starting with an equivalent homogenous cylinder and followed by higher-complexity models (refer to Table 1). The “simplified” model was based on simplified geometry developed from selected cross-sections extracted from photogrammetric scans and interpolated using AutoCAD software. The Scan_H and Scan_M models were based on high-resolution lidar scans. These two models differ in the assigned ERM; it was assumed to be homogenous for the H model and was measured for the M model. Our analysis focuses on the first two modes of the pillar (refer to Table 1), as they collectively account for over 80 % of the modal mass participation (Chopra, 2014). Visualization of the modal analysis for the Scan_M model is presented in Fig. A2.
These results were compared with measurements of the natural vibration modes reported by Finzi et al. (2020). The original measurements were planned and supervised by co-author Tsesarsky. A broadband seismometer (Geospace GS-1) was positioned on the top of the pillar to record the ambient vibrations. The data were processed using a typical seismic noise data analysis workflow: the instrumental response was removed, and data were detrended and band-pass filtered between 0.1 and 30 Hz (the original recording was performed at 100 Hz). The results of these measurements are presented in Fig. 4 for completeness. The revisited data also contain corrected orientation data.
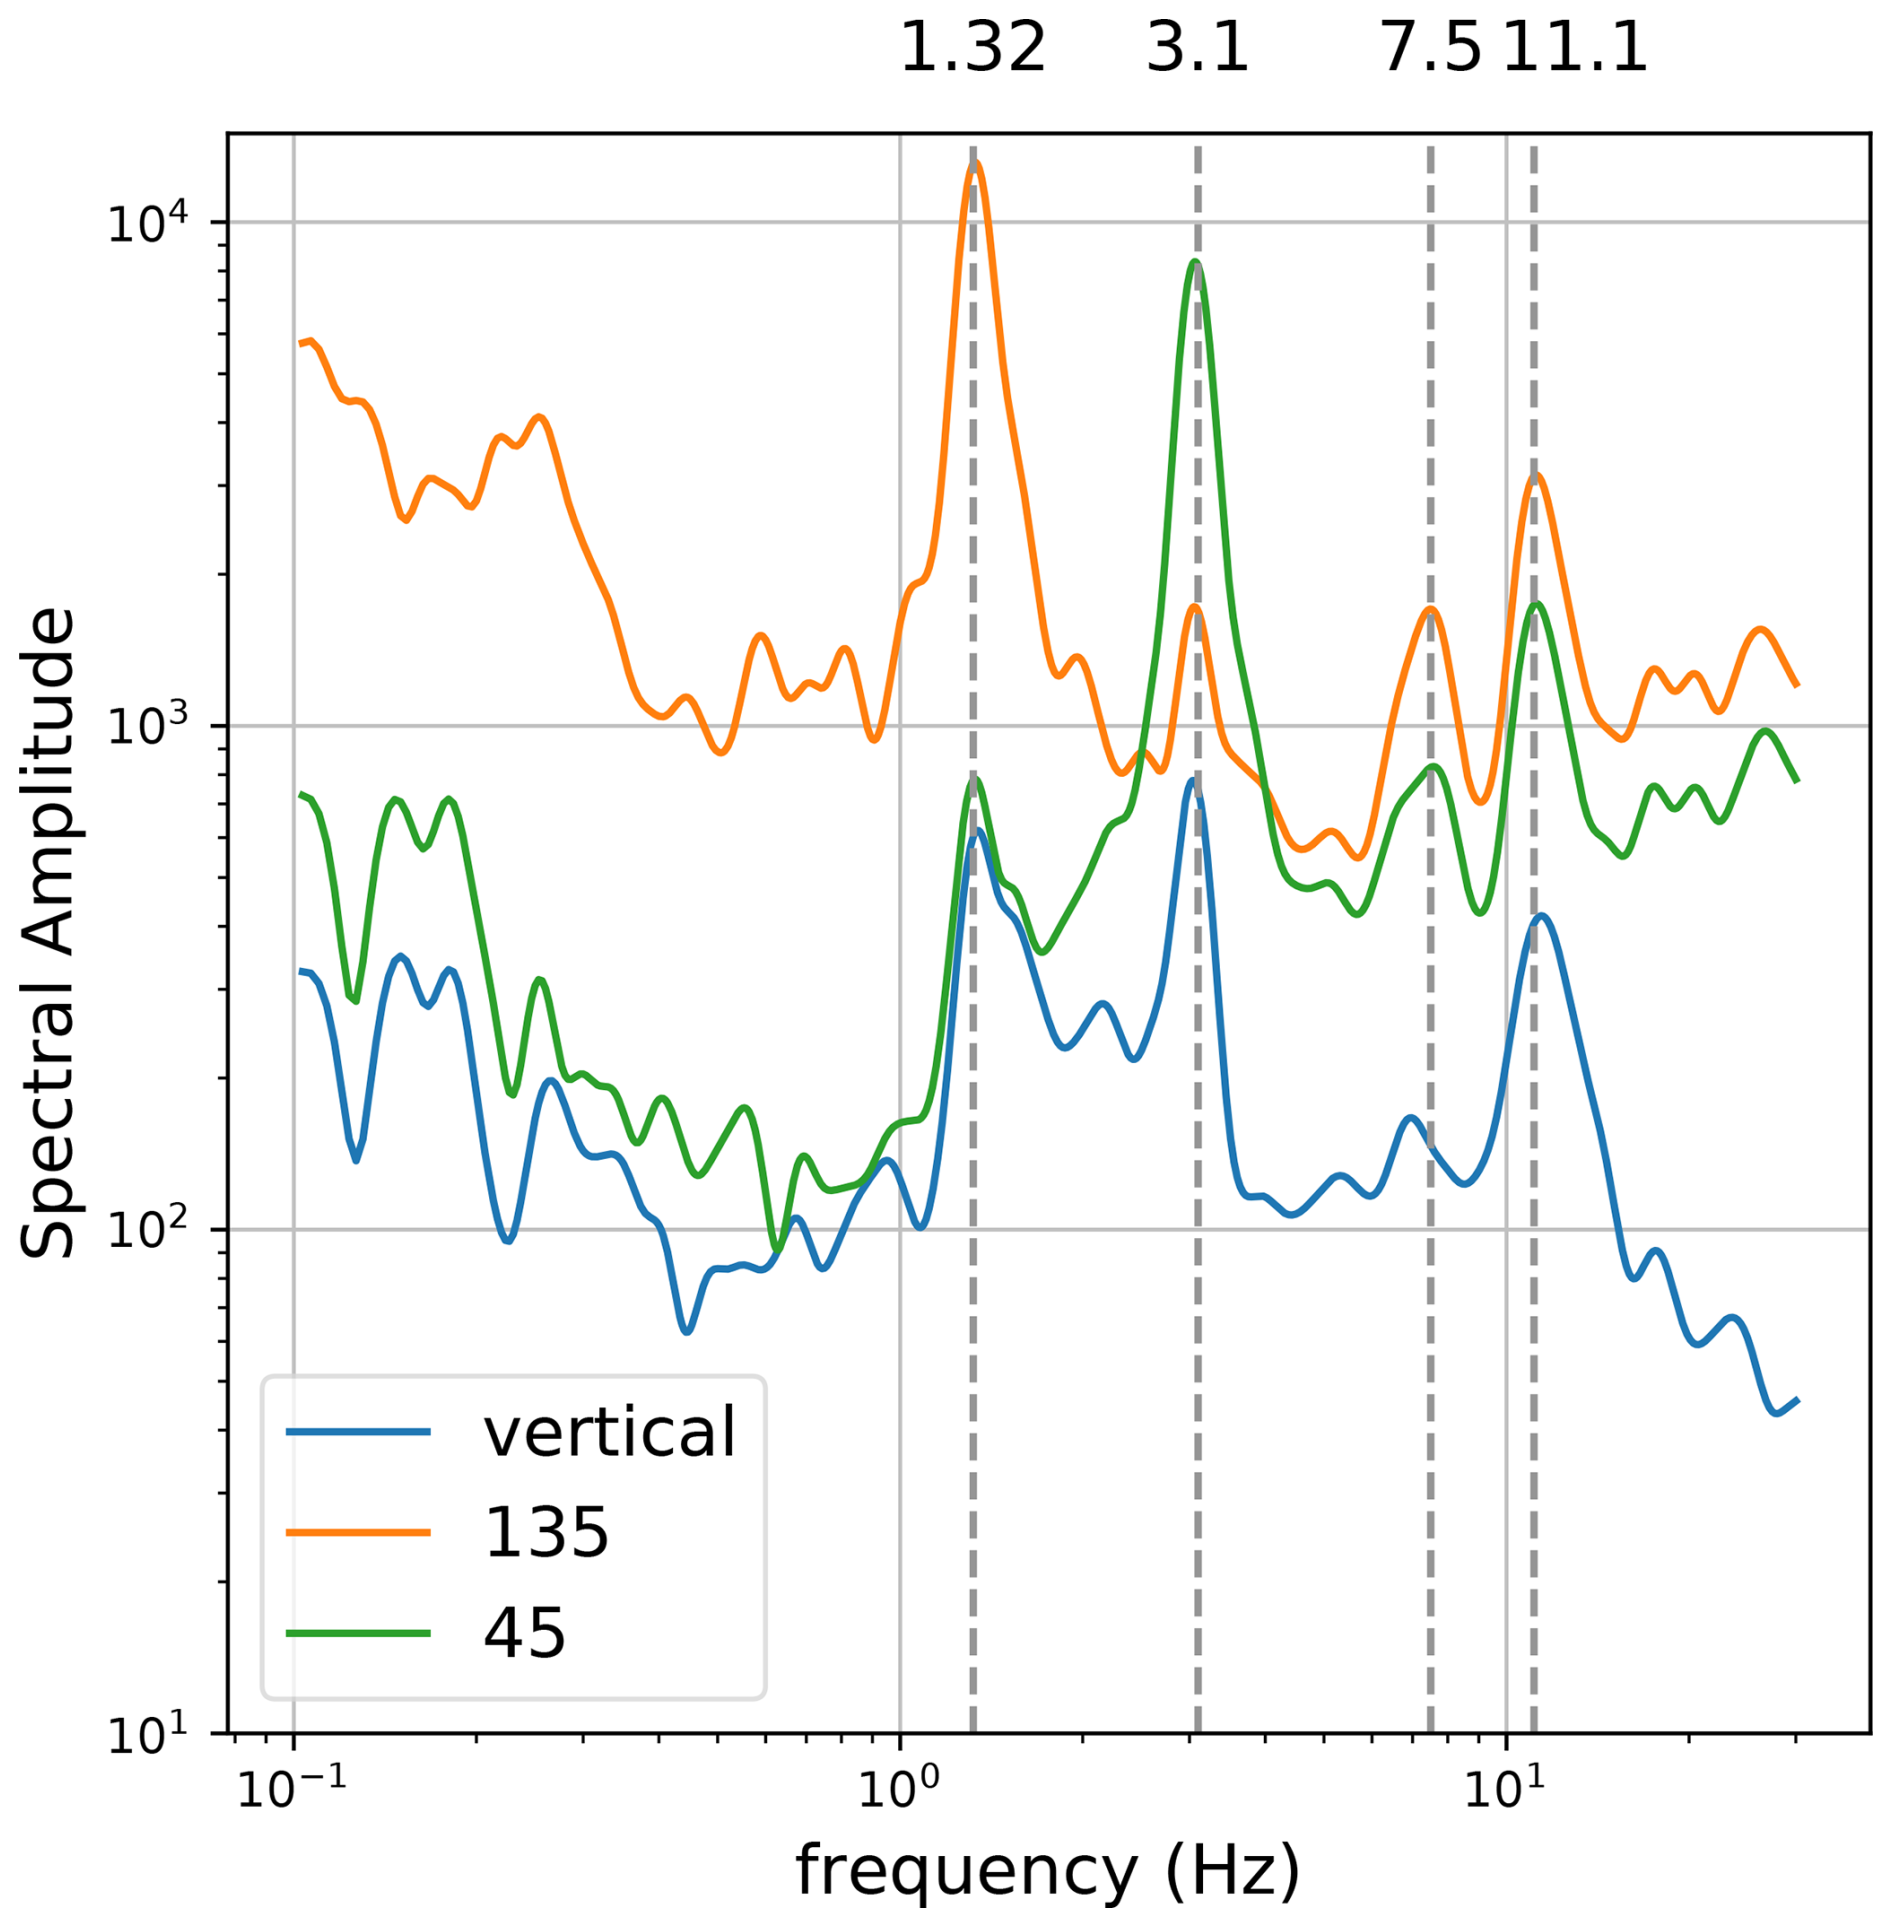
The first two modes of the pillar are bending modes at 1.32 and 3.1 Hz, clearly visible in the horizontal components. The first mode is bending over the thinner horizontal dimension normal to the cliff direction (135°), whereas the second mode is bending parallel to the cliff (45°) over the thicker horizontal dimension. The horizontal-to-vertical ratio of the vibrations can be used to define the prominence of the modes: 18 and 13 for the first and second modes, respectively. Higher modes, at 7.5 and 11.1 Hz, are also clearly visible in the two horizontal components. Damping ratios were determined using the half-power bandwidth method (Chopra, 2014). Using the horizontal-to-vertical channel ratio, the damping ratios are 6 % and 4 % for 135 and 45 components, respectively.
As expected, the calculated modes are determined by the interplay between the rock mass elastic modulus (ERM) value, here changed from 10 to 20 GPa, and the model geometry. Using an equivalent cylinder model shows considerable discrepancy between the measured and calculated modes, specifically in the second mode. Moving forward to a simplified yet more representative geometrical model improves the prediction; however, it still has low accuracy. The two scanned models exemplify the differences between assumed and measured ERM. For the Scan_H model, assuming ERM = 10 GPa yields a good approximation of the first vibration mode: 1.5 Hz compared with the measured 1.32 Hz. However, the second vibration mode is considerably lower than the measurements: 2.1 Hz compared with 3.1 Hz. Assuming ERM = 20 GPa increases the discrepancy in both modes. Using the same geometry, however, with in situ determined ERM, including vertical variations, yields the most accurate results. The first vibration mode is 1.3 Hz, measured and calculated, and the second mode is 3.1 Hz measured compared to 2.7 Hz calculated. The discrepancy between the measured and modeled values in the second mode suggests that the model could be further refined, specifically the vertical distribution elastic modulus. The accurate predictions of the natural vibration modes are considered to be the validation of our FE model for the Ramon pillar and use this model for dynamic analysis.
4.2 Simplified fragility analysis
Prior to conducting the computationally intensive finite-element method (FEM) dynamic analysis, the fragility of the Ramon pillar was assessed using a simplified approach. For this analysis, a maximum magnitude earthquake was defined for each causative fault at the closest distance to the Ramon pillar (refer to Table 2). The pseudo-spectral accelerations (PSAs) for each scenario were calculated using the ASK14 ground motion model (Abrahamson et al., 2014). ASK14 was selected as the representative of NGA-2-West-based ground motion models (GMMs). Comparison of the different NGA-2-West-based GMMs (Gregor et al., 2014) for the studied magnitude range shows little variation between the different models. This research focuses on the median PSA and 1 standard deviation (SD; 1σ) to analyze the stresses. In deterministic seismic hazard analysis, it is typically assumed that 1 SD (84th percentile) represents the maximum (worst-case scenario) ground motion, which is assumed to be the boundary between physically possible and unphysical ground motions (Strasser et al., 2008). Such a limit is not imposed in PSHA; the truncation depends on the return periods. Assuming an annual frequency of exceedance (EFA) of 10−3 (millennial return), the difference between 1σ and 2σ–3σ is relatively small; large deviations are expected for an EFA of < 10−4. Figure A3 in Appendix A presents the PSA of the different scenarios. Assuming that the pillar behaves as a cantilever, which was proven by the in situ measurements and modeling, the moment and the tensile stresses at the base of the cantilever were calculated using an equivalent cylinder with R = 3.8 m. For the calculation, an elastic modulus of 13 GPa was assumed, which gave the best compliance with the first natural mode of 1.32 Hz. The results of the simplified analysis are presented in Table 2.
Table 2Results of the simplified fragility analysis for an equivalent cylinder (R = 3.8 m). PGA is the peak ground acceleration; values in parentheses are plus 1 SD. SA at f1 is the median spectral acceleration at the first natural mode, SD is the standard deviation, and σt is the median tensile stress at the base of the pillar. PGA and SA were calculated using the ASK14 ground motion model.
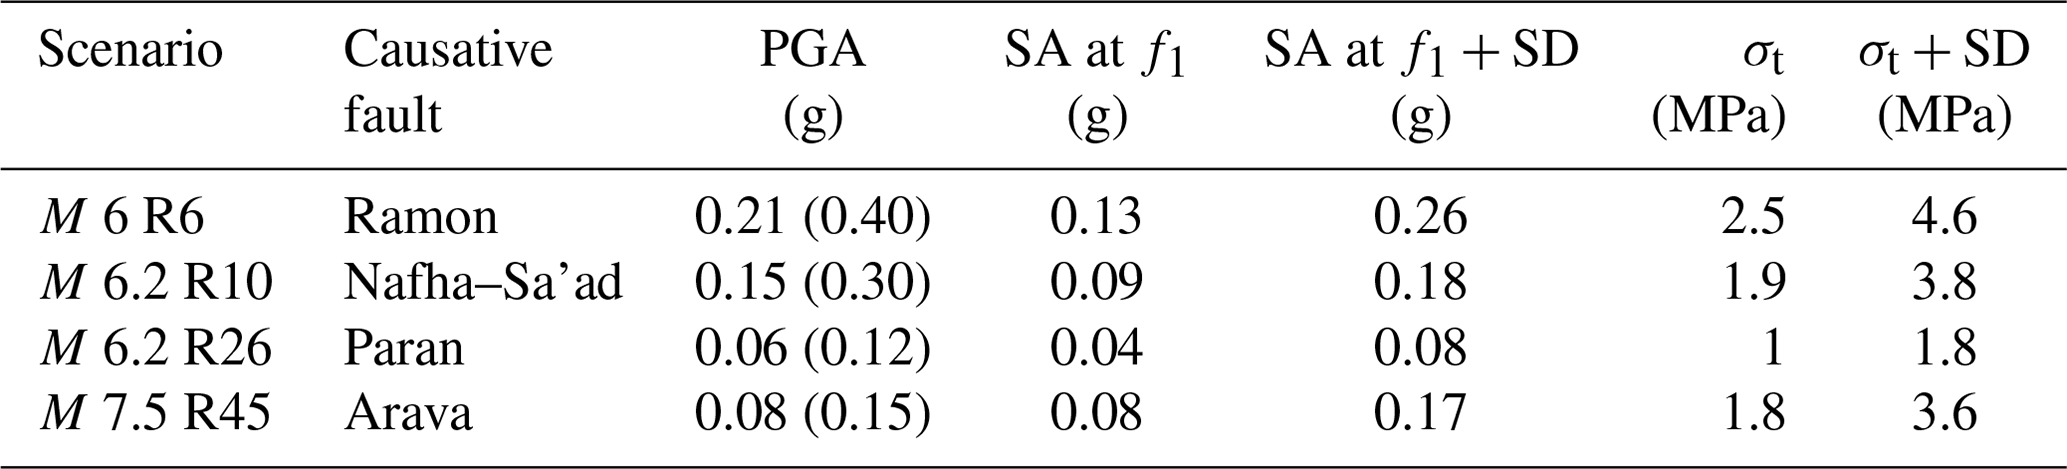
For each of the scenarios studied, the median tensile stress at the base of the pillar is below the tensile strength of the rock. The highest value is 2.5 MPa for the Ramon fault scenario, and the lowest value is for the Paran fault scenario, 1 MPa. These values are lower than the tensile strength of the rock (5–9 MPa). Assuming a 50 % strength reduction due to incipient discontinuities will bring the tensile stresses at the base to the lower bound of rock strength only for the Ramon fault scenario.
Taking into account 1 SD, the stresses at the base of the pillar are typically doubled. For the Ramon scenario, the tensile stress is 4.6 MPa, and for the Nafha–Sa'ad and Arava scenarios, it is 3.8 MPa, bringing the stresses at the base of the pillar close to failure.
4.3 Dynamic analysis
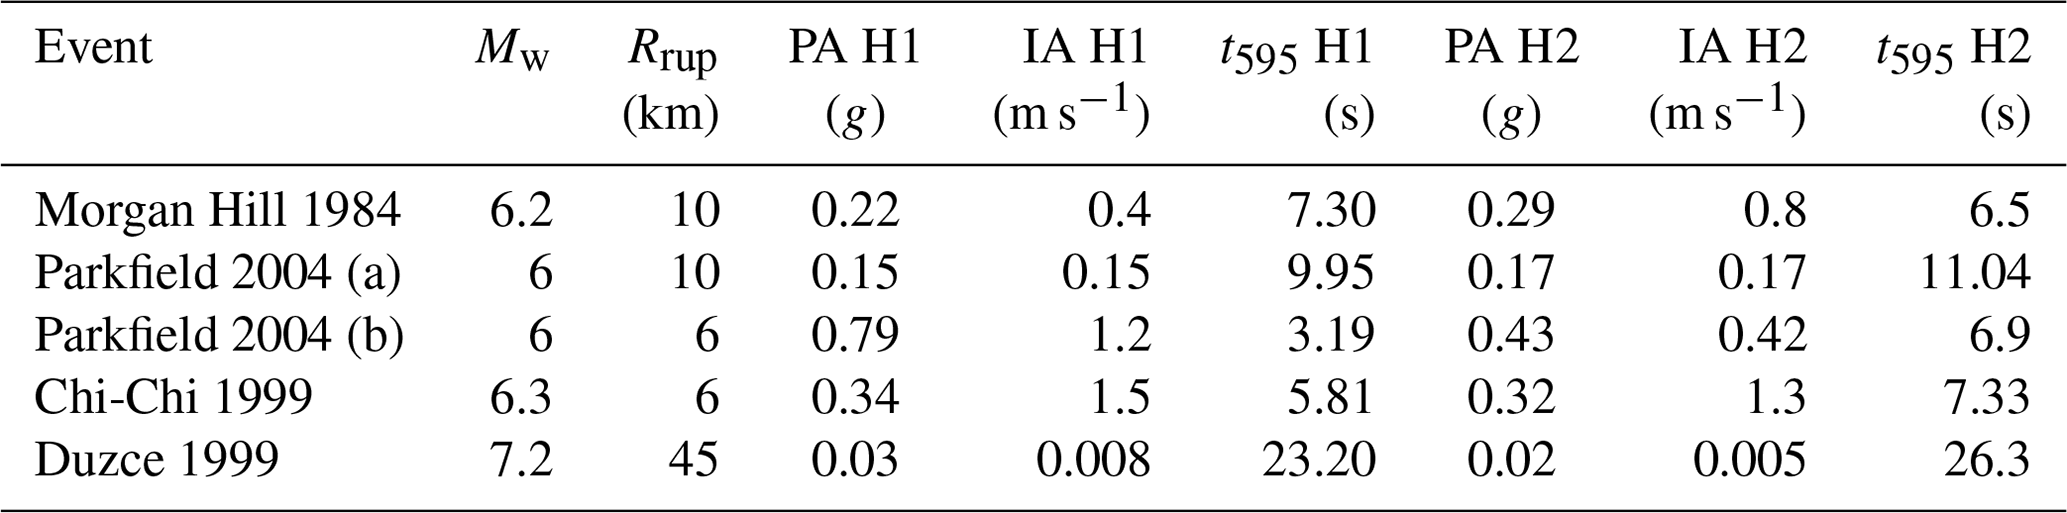
The dynamic analysis focuses on loading scenarios typical to the seismic sources of the region: M 6.2 on the SNSZ faults and M 7 on the DST. For the SNSZ, the analysis focused on RRup < 10 km, representing earthquakes on the Ramon and Sa'ad–Nafha faults. For the DST, RRup of 45 km was assumed, representing the shortest distance to the Arava fault. Time series for the dynamic analysis were obtained from the PEER strong-motion database using faulting style, magnitude, distance, and site criteria. These criteria are assumed to serve as a fundamental analogy for the faults under consideration. Names of the events and ground motion parameters used in our analysis are presented in Table 3. For each event, the two orthogonal horizontal loading components were simulated.
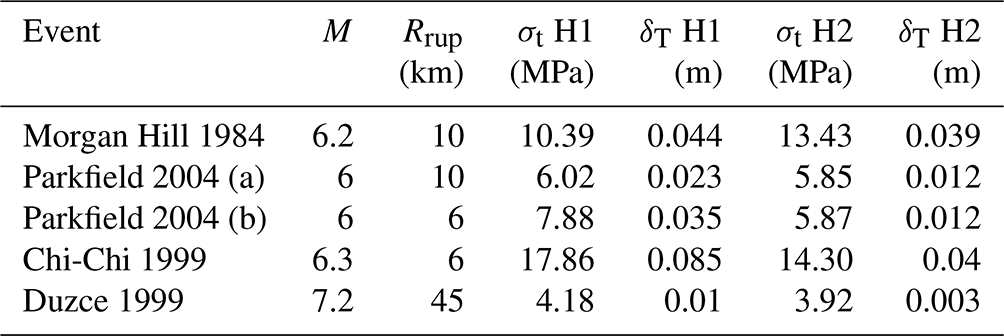
Table 3Earthquake catalog used in the dynamic analysis of the Ramon pillar. M is the magnitude, RRup is the distance to rupture, PA is the peak acceleration, IA is the Arias intensity, and t595 is the significant duration of the event. H1 and H2 are the horizontal components. Ground motion time histories were downloaded from the PEER strong-motion database (Ancheta et al., 2013).
The first step of our analysis was to study the effect of damping on the pillar's stresses and displacements. Damping ratios for freestanding rock structures depend on geometry, mass and stiffness distribution, degree of continuity, and other attributes of natural rock masses. Finnegan et al. (2022) and references therein show that for freestanding sandstone rock structures, the damping ratio ranges from 1 % to 3 %; however, higher values of 8 % to 10 % have been reported for heavily jointed rock masses. Our estimate for the Ramon pillar falls within the reported range, with a damping ratio of about 5 %, reflecting the discontinuous nature of the rock mass. In ABAQUS, Rayleigh damping of 2 %, 5 %, and 7 % was used to study the variations in the tensile stress at the pillar's base and the displacement at the top. For this analysis, the Morgan Hill M 6.2 earthquake was utilized (refer to Table 2). As expected, the maximal tensile stress and the displacements diminished with damping. The tensile stresses reduced from 15.6 MPa for 2 % damping to 10.3 MPa for 5 % and 8.65 MPa for 7 %. The displacement at the top of the pillar decreased from 0.07 to 0.04 and 0.037 m, respectively. The sensitivity to the damping ratio is maximal when changing the value from 2 % to 5 %; the tensile stress value changes by 34 % and the displacement by 57 %. Further increasing the damping ratio results in considerably smaller changes. A damping value of 5 % was selected for the dynamic analysis based on the measurements and the results of the sensitivity study.
A typical result of the dynamic analysis, the Morgan Hill 1984 M 6.2 earthquake (MH), is presented in Fig. 5. Results for selected elements at the base are presented in Appendix A, Fig. A4. Please recall that each component is loaded in one direction at a time, representing the thinner and thicker dimensions of the pillar, respectively. H1 is loaded in the 135° direction and H2 in the 45° direction. Dynamic loading induces a transition in elements from compressive to tensile stress (and strain) regimes, with boundary elements experiencing the most significant changes. For the MH earthquake, the dynamic loading is almost symmetric (refer to Fig. 5), resulting in almost symmetric changes in dynamic stresses. However, due to the pillar's geometry, the initial (gravity) stress distribution at the base is nonuniform. Elements initially subjected to compressive stresses (e.g., element 115637 in Fig. A4) experience increased compressive stresses during dynamic loading, while those initially in tension experience increased tensile stresses. In our analysis, the maximum compressive stresses exceeded maximum tensile stresses by up to 25 %. However, the compressive strength of most rocks typically surpasses the tensile strength by a factor of 3 (Yu et al., 2020) to 10 (Sheorey et al., 1989). Consequently, the limiting strength condition is tensile strength, which is the primary focus of this study.
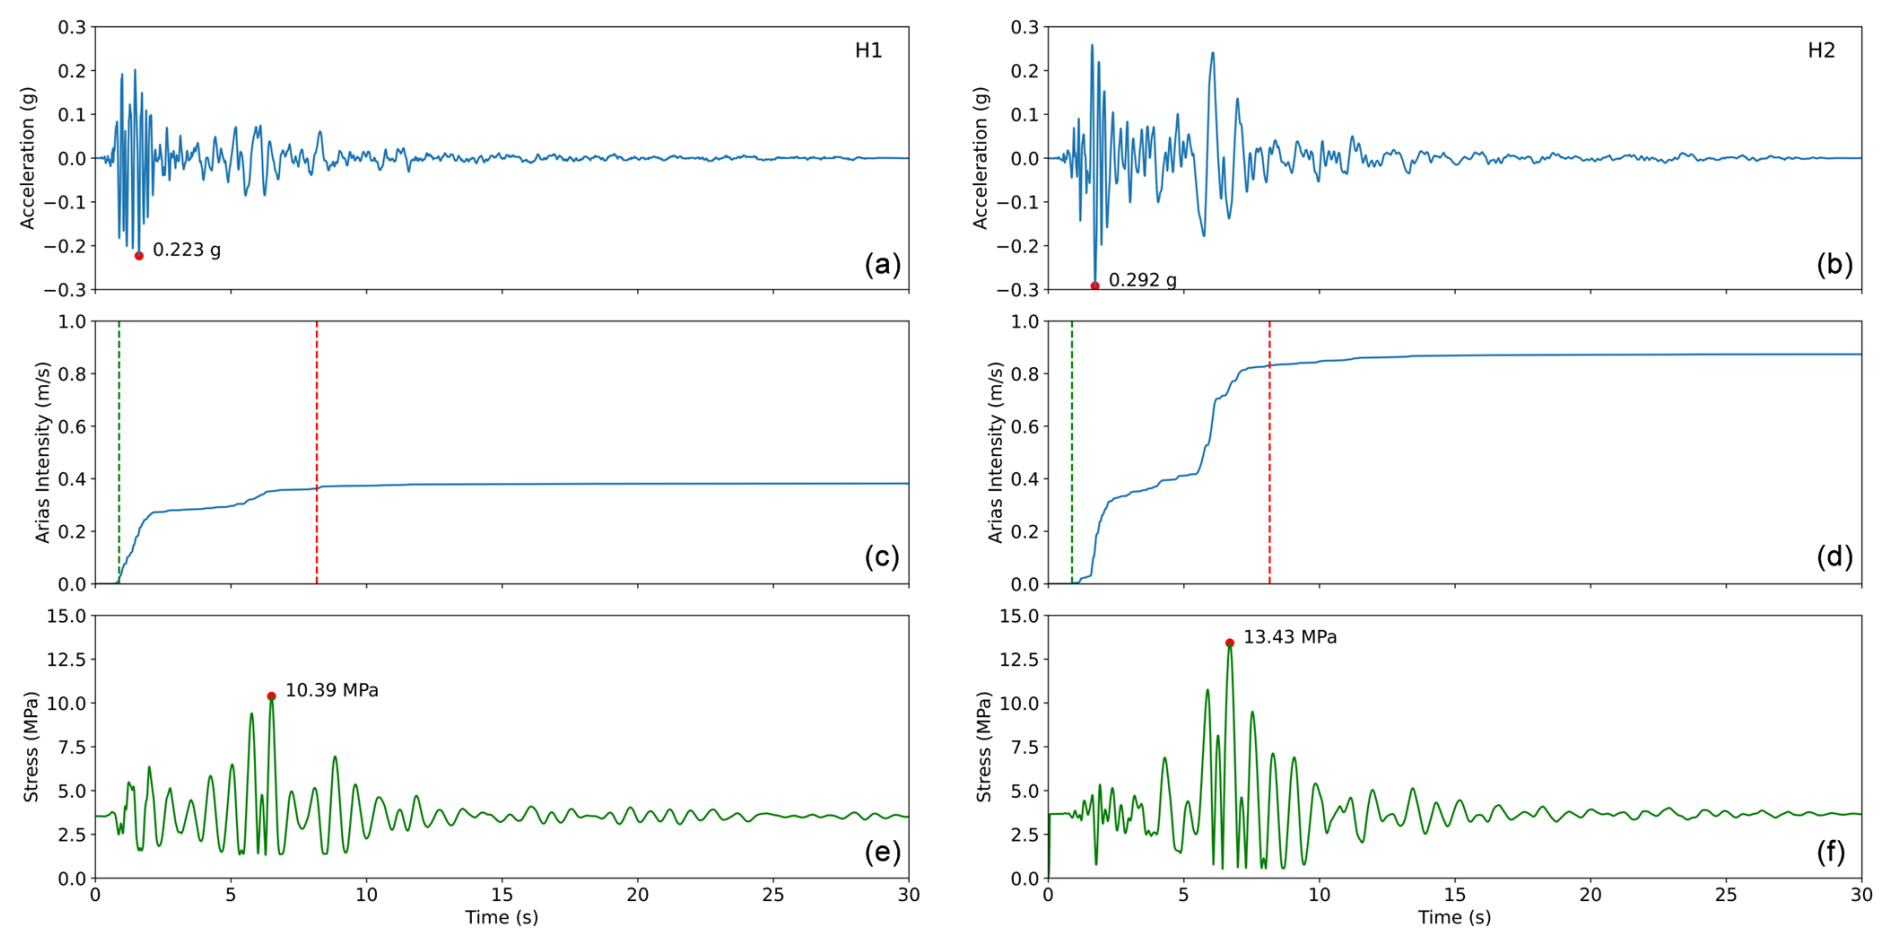
Figure 5Results of the Ramon pillar dynamic analysis for the Morgan Hill 1984 earthquake, with M 6 and RRup = 10 km. Panel (a) is the H1 loading component, and panel (b) is the H2 loading component. (a, b) Acceleration time history, (c, d) Arias intensity (vertical lines are the t5 and t95 values), and (e, f) maximal tensile stress at the bottom of the pillar.
For the MH earthquake and all other earthquakes modeled, each loading component results in different stresses at the base and displacements at the top of the pillar, reflecting the loading time history (amplitude and duration) and the direction of loading. The main difference between the two horizontal components is the amplitude of the surface waves. In the H1 direction, the amplitude of the surface waves is considerably lower than the amplitude of the shear waves, whereas in the H2 direction, the surface wave amplitude is on the same order as the amplitude of the shear waves (please refer to Fig. 5). The strong “jolt” in the surface waves in the H2 direction results in a 30 % increase in the tensile stresses at the pillar's base, from 10.4 to 13.3 MPa.
The results of the dynamic analysis are summarized in Table 4. The highest tensile stress value at the pillar's base is 17.68 MPa for the Chi-Chi M 6.2 H1 component. The lowest tensile stress value at the pillar's base is 5.85 MPa for the Parkfield M 6 (RRup = 10 km) H1 component. It should be noted that these two extremes reflect the different faulting styles of the two events: while the Chi-Chi event (an aftershock of the Mw 7.7 event) is reverse faulting, the Parkfield event is a strike-slip fault. Typically, reverse faults produce stronger ground motions than strike-slip faults (such as SNSZ or DST). However, we wanted to study the dynamic behavior of the pillar under various loading scenarios with different PGAs, IAs, and durations. The scenario of a remote M 7 earthquake, which is represented by the 1999 Duzce M 7.2 event, results in relatively low tensile stress and displacement: 3.92 MPa and 0.003 m, respectively.
Table 4Horizontal displacement (δh) at the top of the pillar and tensile stress (σt) at the bottom of the pillar for the ground motions modeled. H1 and H2 are the horizontal components of ground motion.
PBR stability analysis implicitly assumes that hard, discontinuous contact (no moment resistance) exists between the base and the pedestal. In sedimentary rock masses, such as the Cretaceous carbonates of the northern Negev, this assumption is not satisfied, as many discontinuities and specifically bedding contain rock bridges with considerable tensile strength. Our measurements of natural vibrations of the Ramon pillar and subsequent FE modal analysis show that the pillar behaves as a cantilever. Static FEM analysis of the pillar shows that due to eccentric geometry and irregular geometry, the maximum tensile stress at the base of the pillar is 3.6 MPa. This value can be regarded as the lower bound of the basal strength, including incipient discontinuities and rock bridges. Compared with the rock tensile strength, 5 to 9 MPa, this value represents a 56 % to 20 % strength reduction in the laboratory strength.
A simplified analysis based on an equivalent cylinder model and loads based on the ASK14 GMM show that for the scenarios studied, only the Ramon fault (M 6 and RRup = 6 km) can induce tensile stresses high enough to overcome the basal strength (refer to Fig. 6). For the median load, the basal tensile stress, 2.6 MPa, is well below the strength, and only for the single standard deviation load is the tensile stress 4.6 MPa, which is only 20 % higher than the basal strength. Other scenarios yielded stresses lower than basal strength. Extending the analysis to 2σ truncation, the ground motion values elevate the SA and stresses at the pillar's base. For the Ramon scenario, basal stresses rise to 9.4 MPa, and for the Nafha–Sa'ad scenario (M 6.2 R10), the basal stress is 7.5 MPa. For the other two scenarios, the stresses are below the static value. The analysis presented here uses the ergodic ground motion model; a non-ergodic model (accounting for path and site effects) should be used if available. However, non-ergodic models for this region are not available yet.
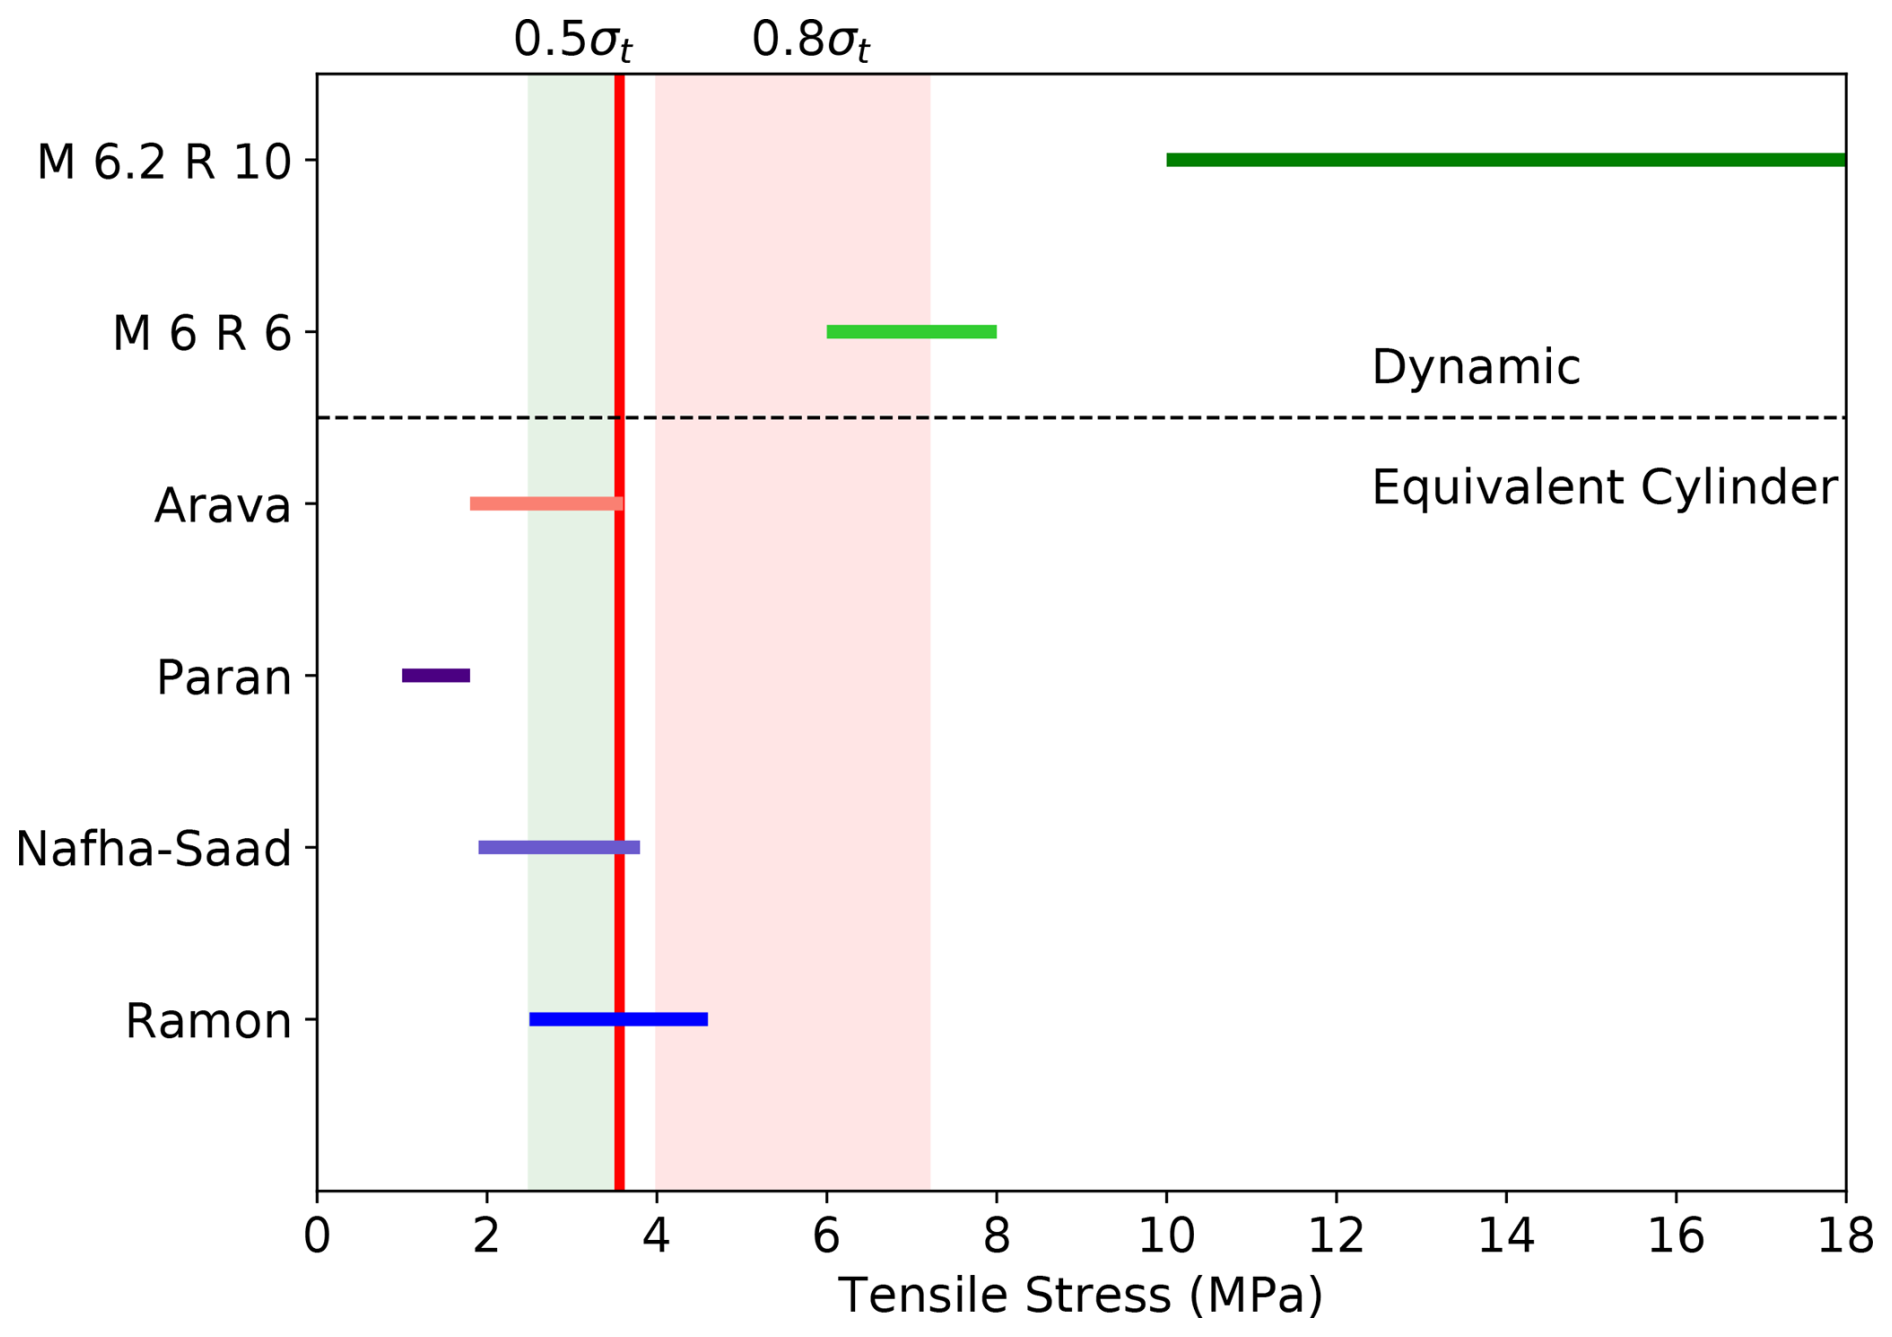
Figure 6Compilation of basal stresses for the Ramon pillar analysis. For the equivalent-cylinder models, the horizontal bar spans the tensile stresses for the spectral acceleration's median (low) and single standard deviation (high) at 1.32 Hz. For the dynamic analysis, the horizontal bar spans the minimum and maximum tensile stresses. The vertical line at 3.6 MPa represents the maximum static basal stress. Shaded regions span the 80 % (pink) and 50 % (green) ranges of laboratory rock tensile strength.
Assuming that the basal strength is exceeded for the Ramon fault scenario and that the pillar is entirely disconnected requires a renewed analysis of the pillar in terms of PBR. Finzi et al. (2020) report a critical acceleration of 0.12 g and dynamic acceleration (Anooshehpoor et al., 2004) of 0.16 g for the toppling of the Ramon pillar, assuming entirely discontinuous basal conditions. For the Ramon scenario, the median PGA of 0.21 g is larger than the dynamic value, and for the Nafha–Sa'ad scenario, it is slightly lower. For the Paran and Arava scenarios, the median PGA values of 0.06 and 0.08 g, respectively, are considerably lower than the dynamic acceleration value. The 1σ PGAs are larger than the dynamic acceleration, rendering the Ramon and Nafha–Sa'ad scenarios unstable. However, the Paran and Arava scenario's PGAs are still lower than the dynamic acceleration required to topple the pillar.
5.1 Dynamic fragility
The equivalent cylinder analysis is based on a time-invariant single-value (PSA) determination of basal stresses. However, since dynamic loading is inherently time-dependent, a fully dynamic analysis was conducted using the validated finite-element (FE) model. The selected time series represent a range of acceleration and duration values (Table 3) from 0.15 to 0.75 g and from 3 to 10 s. Naturally, the modeled ground motions do not encompass a full suite of accelerations and durations but show general trends.
Clearly, the dynamic analysis results in higher basal stresses. The minimal increase in tensile stresses was calculated for the Parkfield 2004 event (PGA of ∼ 0.2 g and IA of ∼ 0.2 m s−1 with a duration of ∼ 10 s) to a value of 6 MPa, a factor of 2 higher than the static basal strength. The Morgan Hill 1984 event (PGA of ∼ 0.3 g and IA of ∼ 0.4 to 0.8 m s−1 with a duration of ∼ 7 s) increased the tensile stresses to 10 and 13 MPa. The highest stresses were calculated for the M 6.2 Chi-Chi 1999 event (an aftershock of the Mw 7.7 event) with values of 14 and 18 MPa in the two horizontal components.
Interestingly, the pulse-like loading of the Parkfield (b) event at RRup = 6 km, with a PGA of 0.7 g and a duration of 3 s, yielded similar displacement and stress values as those of the Parkfield (a) event (PGA = 0.17 g and duration of 11 s), showing the detrimental effect of lower PGA with higher duration. Loading the pillar by a larger yet more distant earthquake, represented by the M 7.2 Duzce 1999 earthquake, at RRup = 45 km (not shown in Fig. 6), has little effect on the pillar, elevating the stresses by only 17 % and 9 % above the static values for the two horizontal components. It should be noted that the records used in our dynamic analysis are from a global database. Due to different source, path, and site conditions, local time series are expected to differ in ground motion intensities (acceleration, velocity, duration, etc.). However, many regions globally lack instrumental coverage, or the recurrence intervals are long; hence, using global records is a necessary step towards a better understanding of the dynamic fragility of FGFs.
In this research, the pillar was modeled as a continuous cantilever structure fixed at its bottom. The accurate forward calculation of the natural vibration modes performed in this research supports the validity of our model and modeling approach. The rock mass's discontinuous nature was incorporated into the GSI rating to calculate the rock mass modulus. Under this assumption, the stresses at the pillar's base are maximal, as neither frictional sliding nor rocking is allowed, and the only energy dissipation is through the viscous Rayleigh damping. A damping value of 5 % was employed, consistent with the measured damping. Modeling sliding and rocking in FE is challenging, as incorporating discontinuities into the continuous model is not trivial. An alternative approach is utilizing discrete-element methods (DEM) to study dynamic fragility. However, numerous numerical controls, such as penalties and frictional properties, are not easily calibrated or measured in situ. Furthermore, assessing the number and distribution of rock bridges across bedding and joints is a non-trivial task. It should be recalled that even a 5 % inclusion of rock bridges stabilizes cliffs of carbonate rocks (Elmo et al., 2018).
5.2 Implications for seismic hazard
The Ramon pillar is not sensitive to loading from strong and remote earthquakes (M 7 and RRup > 45 km) and, therefore, cannot be used to constrain the seismic hazard from the DST. However, it was found to be sensitive to moderate and close earthquakes (M 6 and RRup < 10 km) originating on the SNSZ. The equivalent-cylinder approach and the GMM-based load result in a non-conservative estimate of basal stresses. Fully dynamic analysis yields considerably higher stresses and indicates that the Ramon pillar is sensitive to close earthquakes.
All of the M 6 earthquakes modeled dynamically induce tensile stresses at the pillar's base that are higher than its basal strength. The first exceedance of the strength typically occurs in the first seconds of the loading, typically within 25 % of the loading duration (t595), well before reaching the peak stress. Thus, it can be assumed that a bedding plane with rock bridges will fail during loading, leading to the detachment of the base. Under fully discontinuous conditions and assuming rocking mechanics (PBR type), the required dynamic acceleration to topple the pillar is 0.16 g, well within the PGA range for the magnitude–distance of the SNSZ faults.
Based on the analysis, we postulate that an M 6 event on the Ramon and Nafha–Sa'ad faults did not occur during the pillar's fragility age over the past 11 000 years. Our analysis challenges the assumption that the SNSZ as a whole can produce an M 6.2 earthquake. To determine whether the southern Paran fault is capable of an M 6.2 earthquake, a closer FGF should be analyzed.
The analysis presented here is the first step to constraining the seismic hazard on the SNSZ, and more FGFs in the region should be analyzed for better temporal and spatial coverage. The work of Finzi et al. (2020) lists nine pillars in this region (including the Ramon pillar), with fragility ages ranging from 1.4 to 123 kyr. It should be recalled here that typically the number of FGFs used for constraining PSHA is low; please refer to the recent examples of Rood et al. (2024) and Stirling et al. (2021a).
This research studied the dynamic fragility of a 42 m high slender rock column comprised of discontinuous sedimentary rock mass located on the rim of the Ramon erosional crater (Israel). The pillar is found near two seismic sources: the Sinai–Negev Shear Zone (SNSZ) and the Dead Sea Transform (DST).
The pillar was aerially scanned with high-precision lidar. Rock mass elastic stiffness was measured in situ by rappeling the entire length of the pillar. Based on the scan and measurements, a finite-element (FE) model of the pillar was developed.
The FE model was validated by comparing the modal analysis (assuming cantilever boundary conditions) results to the in situ measured vibrational modes of the pillar. The comparison shows that the first two modes are highly compatible: 1.3 and 3 Hz measured vs. 1.3 and 2.7 Hz modeled.
We first studied the pillar's fragility using a simplified approach based on pseudo-spectral accelerations and an equivalent cylinder, with R = 3.8 m. For the different scenarios studied, only the M 6 and RRup = 6 km scenario yielded basal stresses exceeding the pillar's basal strength, while the other scenarios resulted in considerably lower stresses.
A fully dynamic fragility analysis was performed based on the favorable validation of the FE model. Two major scenarios were studied: an M 6 earthquake with RRup < 10 km on one of the potentially active faults of the Sinai–Negev Shear Zone and an M 7 earthquake with RRup =M 45 km on the active Dead Sea Transform. For the M 6 earthquakes, the dynamic analysis yielded considerably higher basal stresses than the equivalent-cylinder analysis. The dynamic stresses exceed the basal strength of the pillar by a factor of 2 or higher.
Based on our findings, we postulate that the M 6 scenario on the SNSZ should lead to the breakage of the Ramon pillar at its base due to tensile stresses exceeding its strength. Conservatively assuming that the first exceedance does not lead to pillar collapse but does change the mechanical behavior from cantilever to PBR, we predict a toppling failure during the next M 6 earthquake. With a fragility age of 11.4 kyr, our analysis challenges the assumption that the SNSZ as a whole can produce an M 6 event.
Table A1Schmidt hammer elastic modulus survey data. ASTM averaging mode.
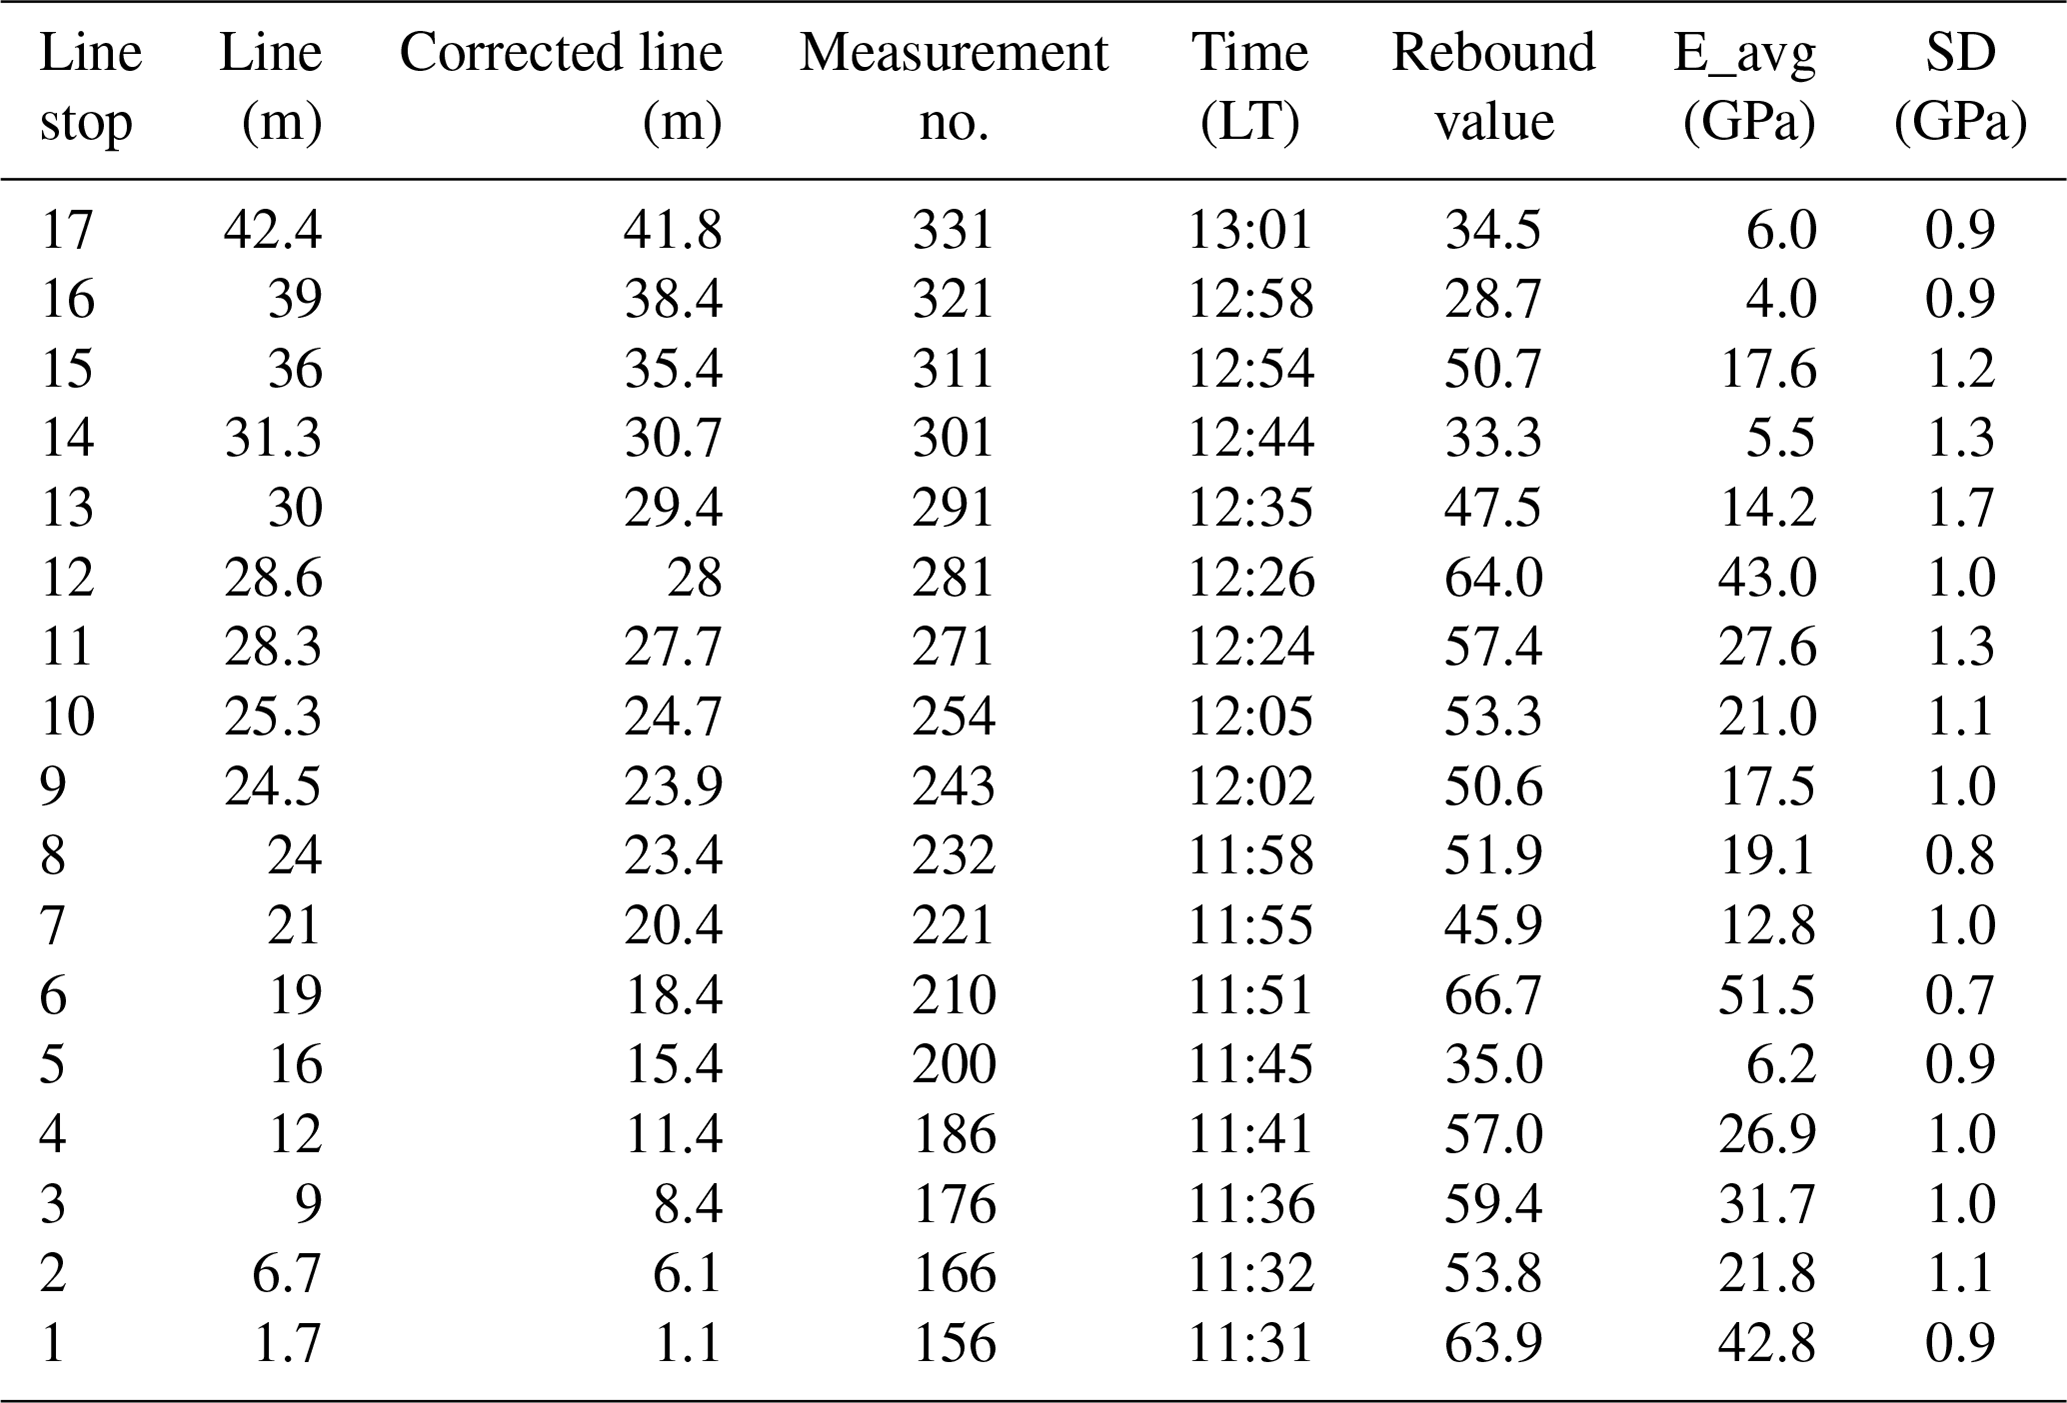
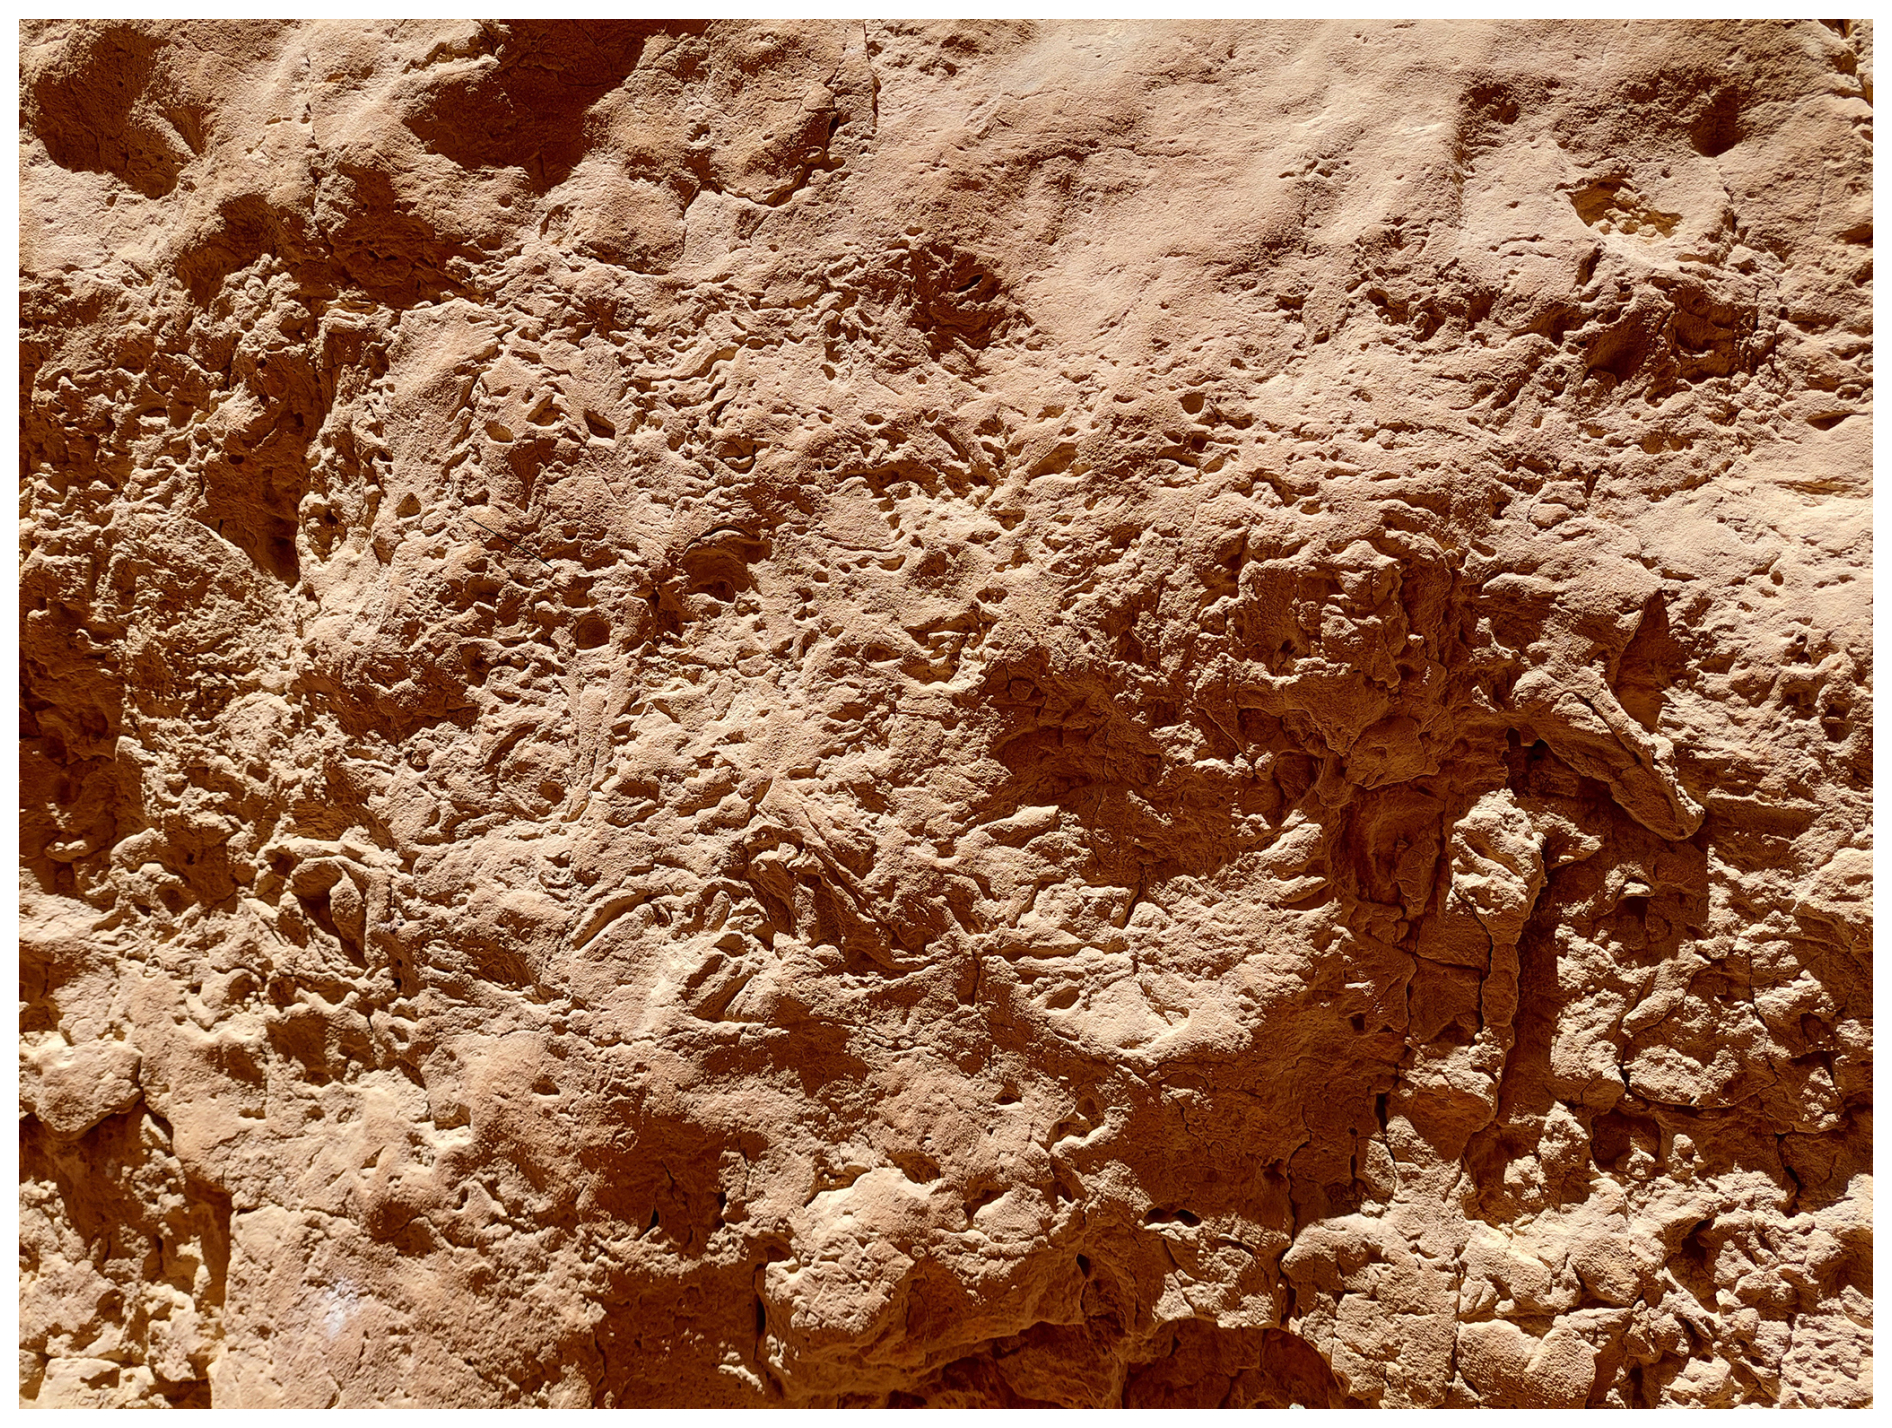
Figure A1The transition from massive limestone to a porous fossilized reef at a back-crack depth of 15 m.
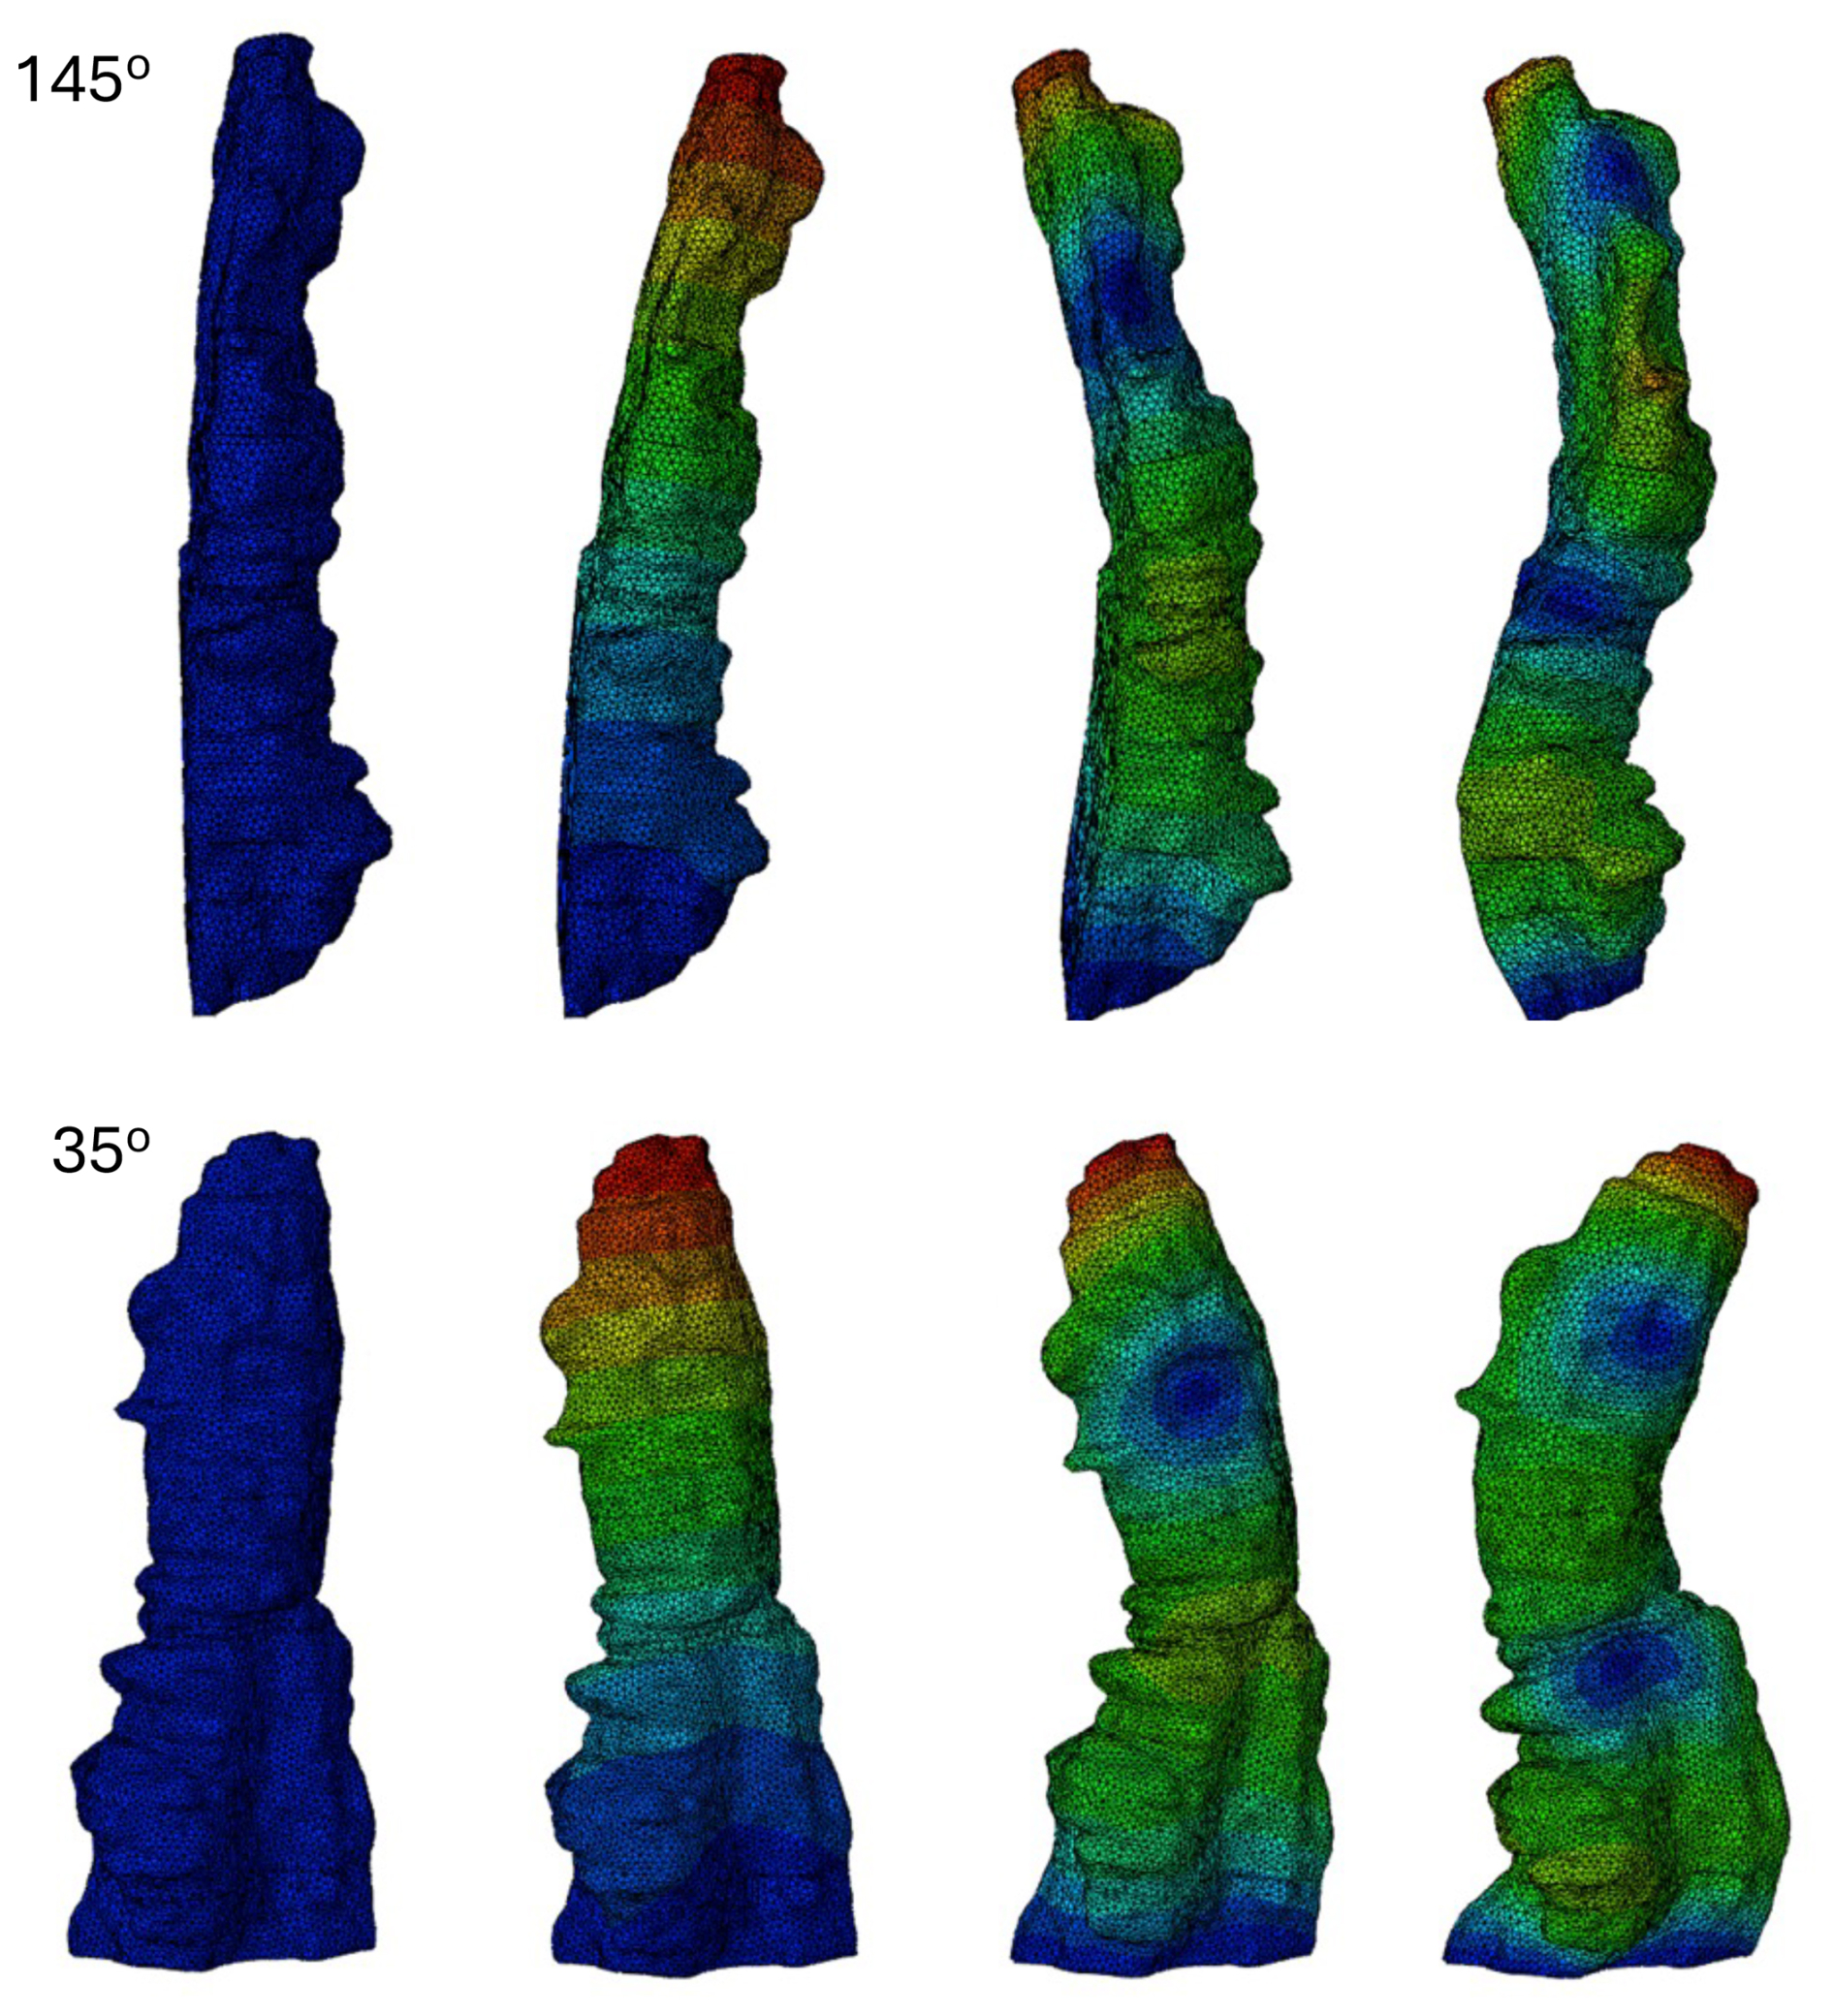
Figure A2Visualization of the ABAQUS FE modal analysis of the Scan_H model for the first 3 modes. The top four visualizations are in the 145° direction and the bottom four in the 35° direction. Color scales for each direction and mode are for different values of modal displacement: blue (zero) to red (maximum). For the 145° direction, the maximum values are , , and m (first, second, and third modes, respectively). For the 35° direction, the maximum values are , , and m (first, second, and third modes, respectively).
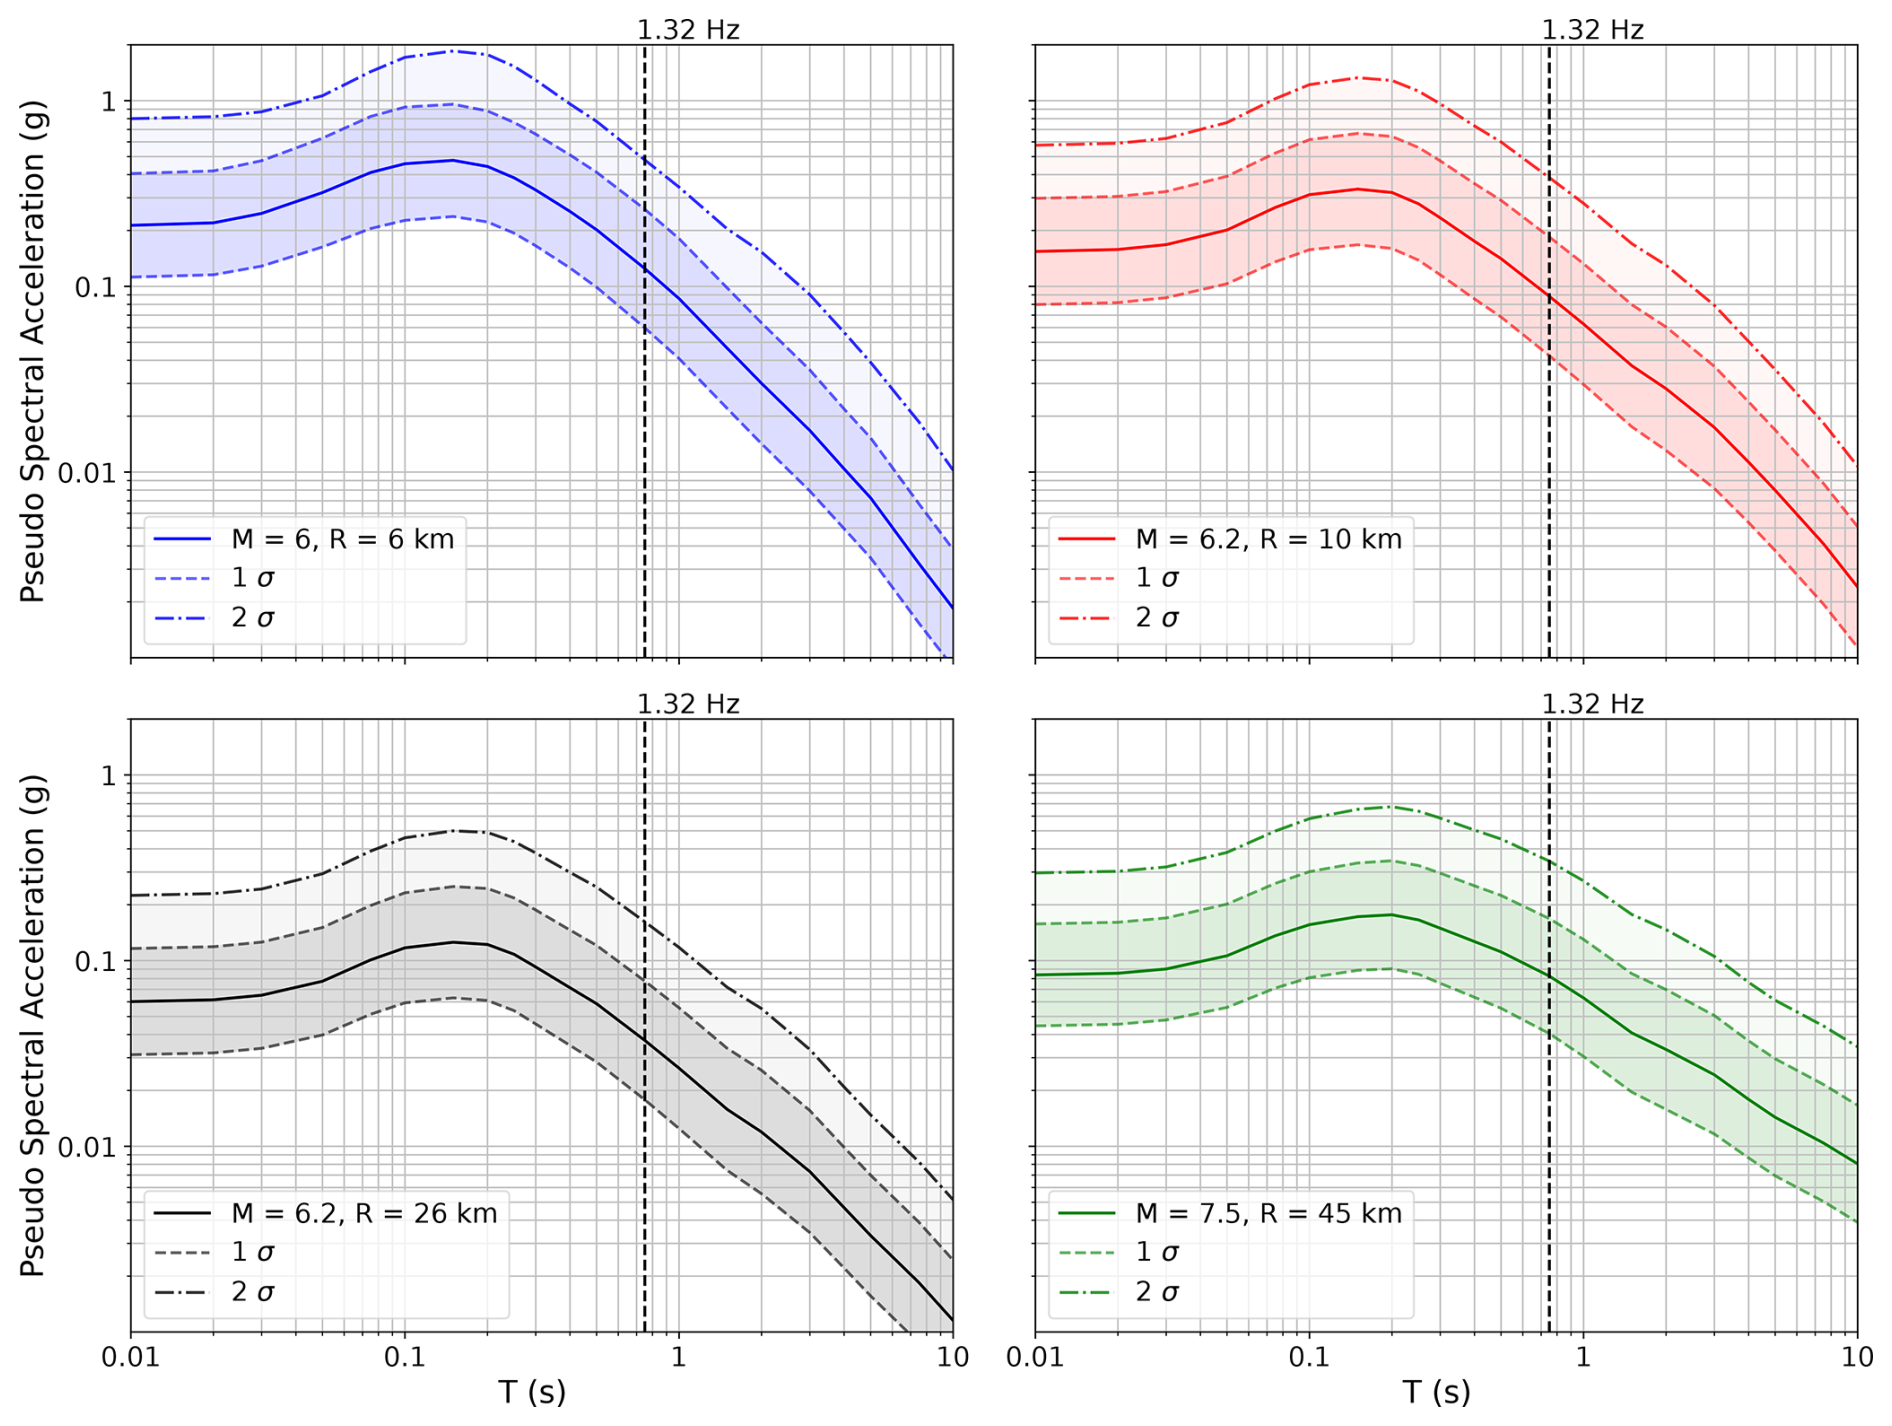
Figure A3Pseudo-spectral accelerations for the different fault–distance scenarios based on the ASK14 (Abrahamson et al., 2014) ground motion model. The continuous line is the median value, and the shaded region is 1 SD. The first mode of the Ramon pillar is 1.32 Hz.
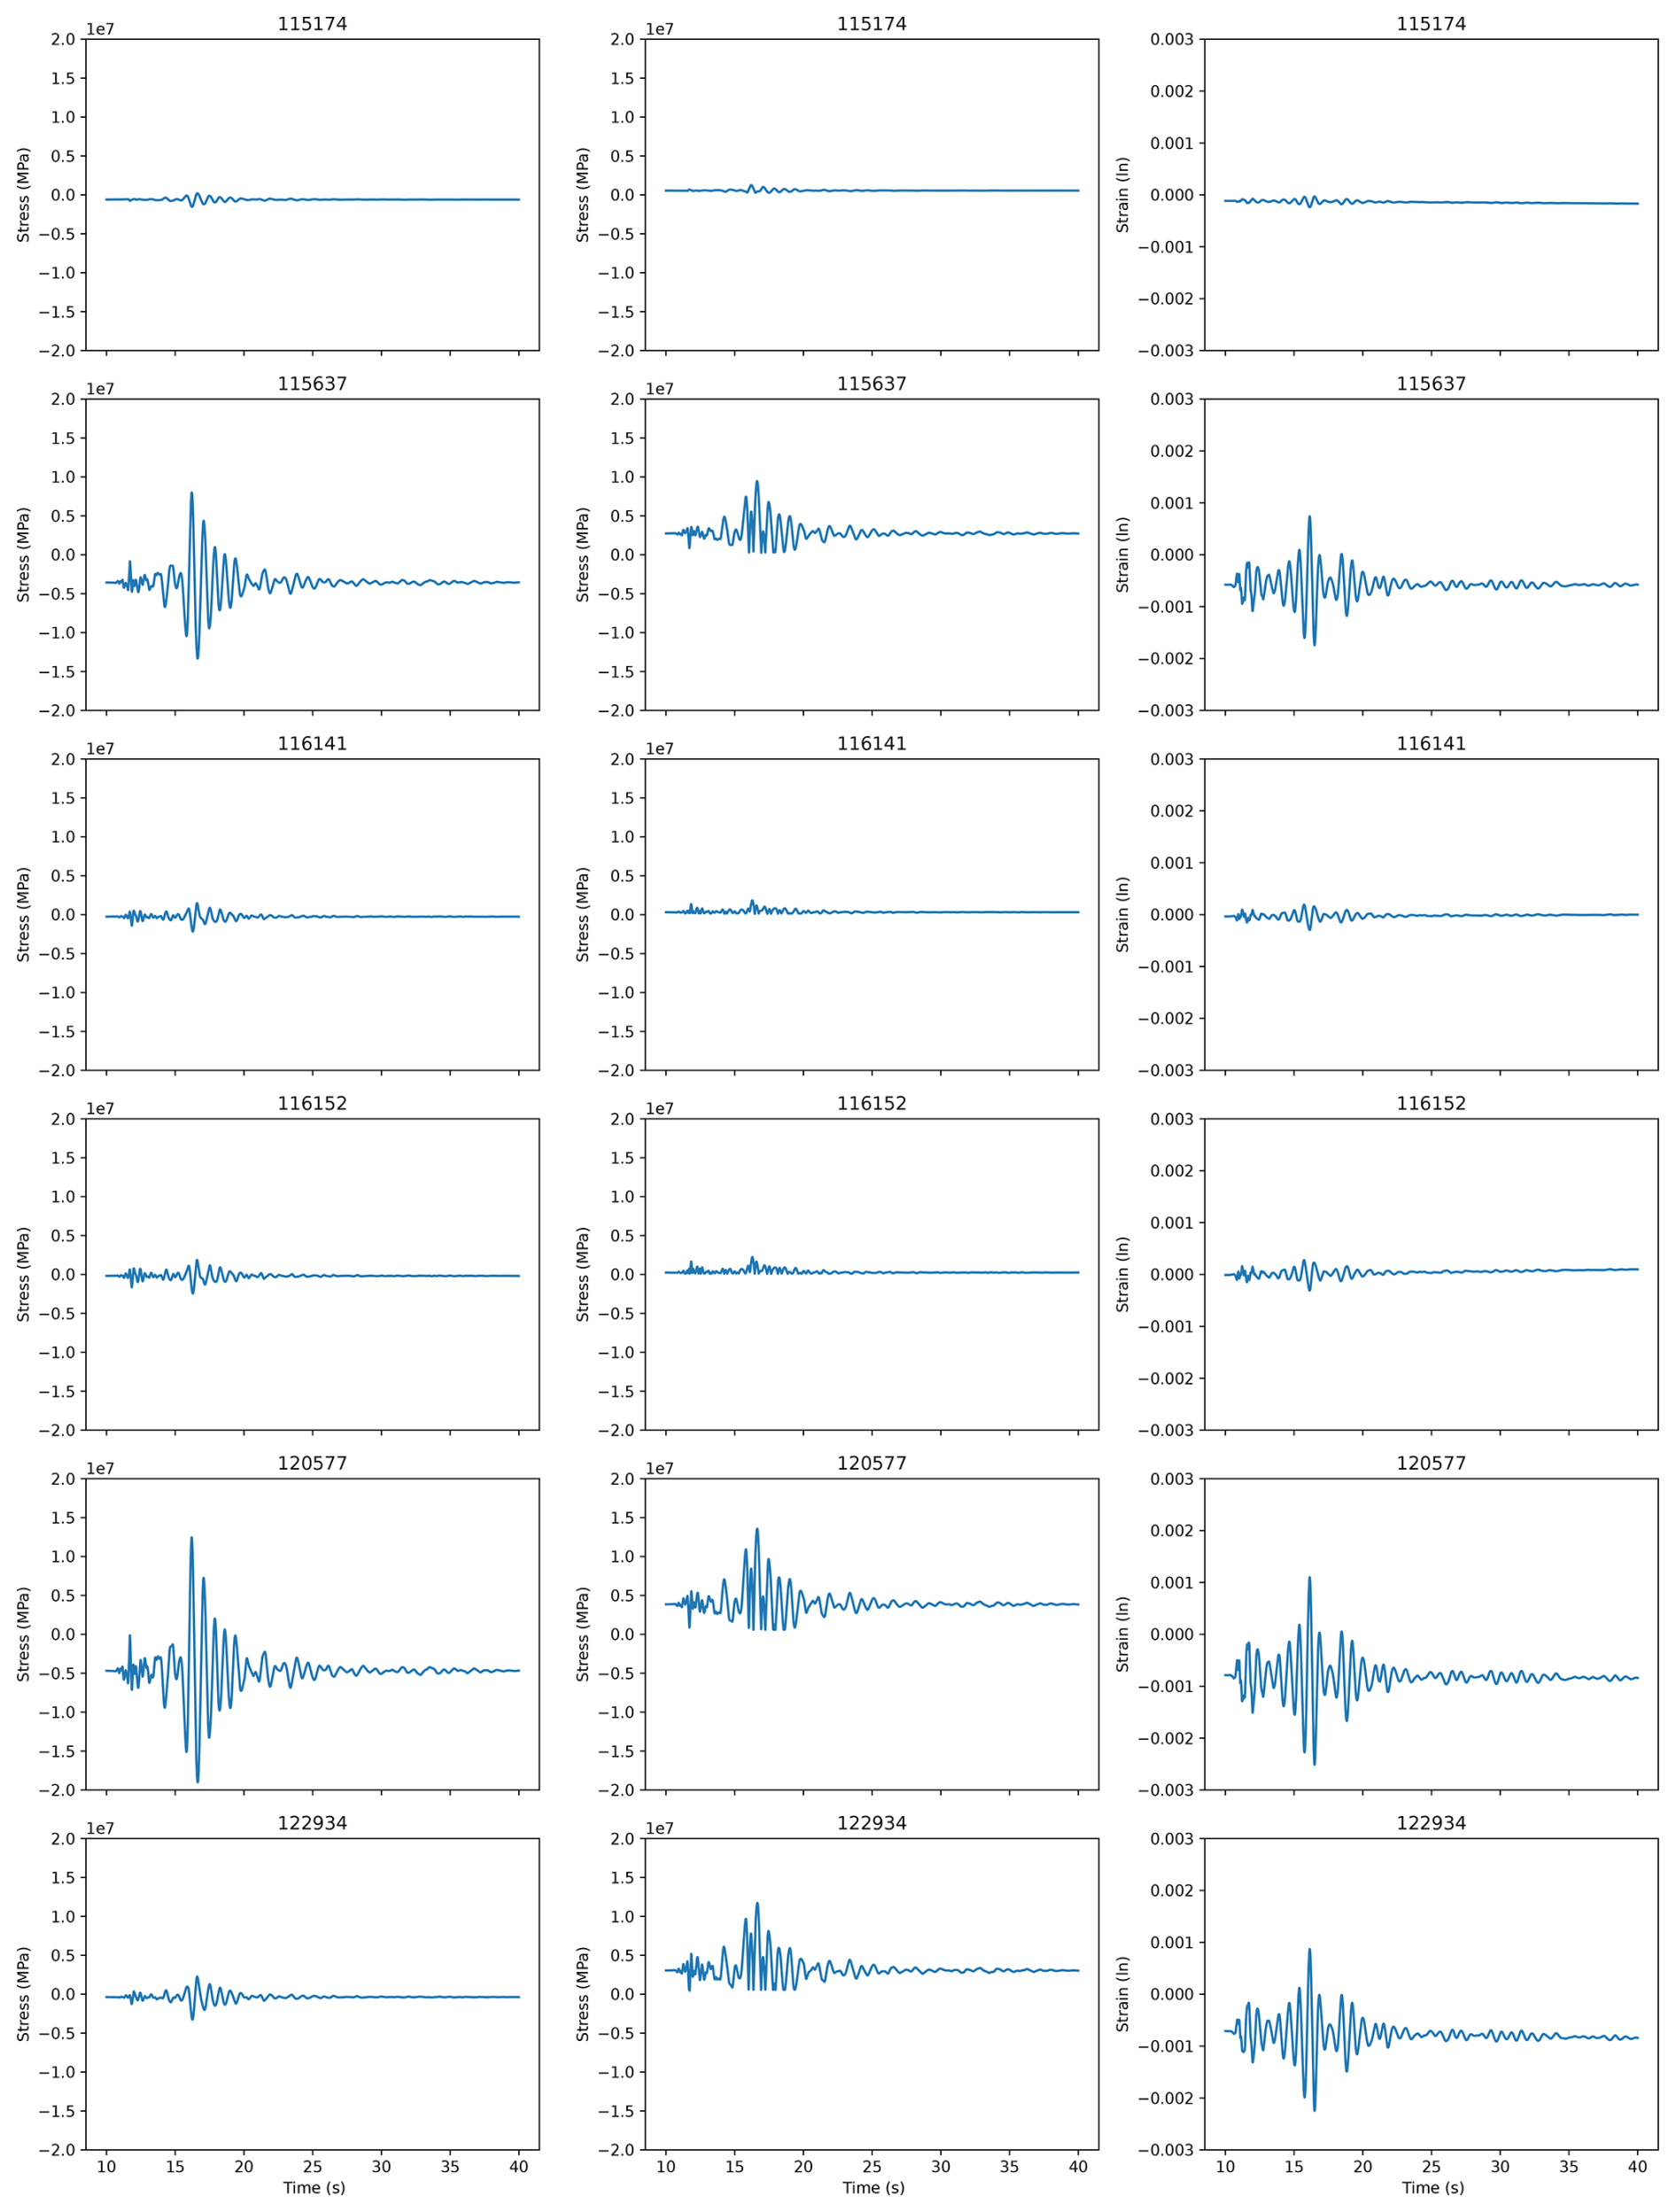
Figure A4Stress and strain outputs for selected elements at the pillar's base. The left column represents vertical stress (S22), the central column represents Tresca stress, and the right column represents logarithmic strain. Values are plotted for the dynamic-loading phase.
The Earthquake Catalog of Israel is available at https://eq.gsi.gov.il/en/earthquake/searchEQS.php (Geological Survey of Israel, 2024). Rock mass data can be made available upon request from the corresponding author (michatse@bgu.ac.il ).
AJ – investigation, formal analysis, and writing. MT – conceptualization, funding acquisition, supervision, methodology, investigation, and writing.
The contact author has declared that neither of the authors has any competing interests.
Publisher’s note: Copernicus Publications remains neutral with regard to jurisdictional claims made in the text, published maps, institutional affiliations, or any other geographical representation in this paper. While Copernicus Publications makes every effort to include appropriate place names, the final responsibility lies with the authors.
The authors acknowledge the financial support of the Israel Science Foundation. We thank Boaz Langford for his assistance with rappeling and in situ measurements.
This research has been supported by the Israel Science Foundation (grant no. 1163/22).
This paper was edited by Oded Katz and reviewed by two anonymous referees.
Abrahamson, N. A., Silva, W. J., and Kamai, R.: Summary of the ASK14 Ground Motion Relation for Active Crustal Regions, Earthq. Spectra, 30, 1025–1055, https://doi.org/10.1193/070913eqs198m, 2014.
Agnon, A.: Pre-Instrumental Earthquakes Along the Dead Sea Rift, in: Dead Sea Transform Fault System: Reviews, edited by: Garfunkel, Z., Ben-Avraham, Z., and Kagan, E., Springer, 207–262, https://doi.org/10.1007/978-94-017-8872-4_8, 2014.
Ambraseys, N., Melville, C. P., and Adams, R. D.: The seismicity of Egypt, Arabia and the Red Sea: a historical review, Cambridge University Press, 180 pp., ISBN: 9780521020251, 2005.
Ancheta, T. D., Darragh, R. B., Stewart, J. P., Seyhan, E., Silva, W. J., Chiou, B. S. J., Wooddell, K. E., Graves, R. W., Kottke, A. R., Boore, D. M., Kishida, T., and Donahue, J. L.: PEER NGA-West2 Database, PEER Report 2013-03, Pacific Earthquake Engineering Research Center, https://peer.berkeley.edu/sites/default/files/2013_03_ancheta_7.3.2020.pdf (last access: 1 July 2025), 2013.
Anderson, J. G., Brune, J. N., Biasi, G., Anooshehpoor, A., and Purvance, M.: Workshop Report: Applications of Precarious Rocks and Related Fragile Geological Features to U.S. National Hazard Maps, Seismol. Res. Lett., 82, 431–441, https://doi.org/10.1785/gssrl.82.3.431, 2011.
Anooshehpoor, A., Brune, J. N., and Zeng, Y.: Methodology for Obtaining Constraints on Ground Motion from Precariously Balanced Rocks, B. Seismol. Soc. Am., 94, 285–303, https://doi.org/10.1785/0120020242, 2004.
Bakun-Mazor, D., Hatzor, Y. H., Glaser, S. D., and Carlos Santamarina, J.: Thermally vs. seismically induced block displacements in Masada rock slopes, Int. J. Rock Mech. Min. Sci., 61, 196–211, https://doi.org/10.1016/j.ijrmms.2013.03.005, 2013.
Bommer, J. J.: Earthquake hazard and risk analysis for natural and induced seismicity: towards objective assessments in the face of uncertainty, B. Earthq. Eng., 20, 2825–3069, https://doi.org/10.1007/s10518-022-01357-4, 2022.
Boroda, R., Matmon, A., Amit, R., Haviv, I., Arnold, M., Aumaître, G., Bourlès, D. L., Keddadouche, K., Eyal, Y., and Enzel, Y.: Evolution and degradation of flat-top mesas in the hyper-arid Negev, Israel revealed from 10Be cosmogenic nuclides, Earth Surf. Proc. Land., 39, 1611–1621, https://doi.org/10.1002/esp.3551, 2014.
Brune, J. N.: Precariously balanced rocks and ground-motion maps for Southern California, B. Seismol. Soc. Am., 86, 43–54, 1996.
Chen, Z., Arrowsmith, R., Das, J., Wittich, C., Madugo, C., and Kottke, A.: Virtual Shake Robot: Simulating Dynamics of Precariously Balanced Rocks for Overturning and Large-displacement Processes, Seismica, 3, https://doi.org/10.26443/seismica.v3i1.692, 2024.
Chopra, A. K.: Dynamics of Structures, 4th, Pearson, 944 pp., ISBN 10: 0-273-77424-7 2014.
Elmo, D., Donati, D., and Stead, D.: Challenges in the characterisation of intact rock bridges in rock slopes, Eng. Geol., 245, 81-96, https://doi.org/10.1016/j.enggeo.2018.06.014, 2018.
Enzel, Y., Amit, R., Dayan, U., Crouvi, O., Kahana, R., Ziv, B., and Sharon, D.: The climatic and physiographic controls of the eastern Mediterranean over the late Pleistocene climates in the southern Levant and its neighboring deserts, Global Planet. Change, 60, 165–192, https://doi.org/10.1016/j.gloplacha.2007.02.003, 2008.
Finnegan, R., Moore, J. R., Geimer, P. R., Dzubay, A., Bessette-Kirton, E. K., Bodtker, J., and Vollinger, K.: Ambient Vibration Modal Analysis of Natural Rock Towers and Fins, Seismol. Res. Lett., 93, 1777-1786, https://doi.org/10.1785/0220210325, 2022.
Finzi, Y., Ganz, N., Dor, O., Davis, M., Volk, O., Langer, S., Arrowsmith, R., and Tsesarsky, M.: Stability Analysis of Fragile Rock Pillars and Insights on Fault Activity in the Negev, Israel, J. Geophys. Res.-Sol. Ea., 125, e2019JB019269, https://doi.org/10.1029/2019JB019269, 2020.
Frayssines, M. and Hantz, D.: Modelling and back-analysing failures in steep limestone cliffs, Int. J. Rock Mech. Min., 46, 1115–1123, https://doi.org/10.1016/j.ijrmms.2009.06.003, 2009.
Garfunkel, Z.: Lateral motion and deformation along the Dead Sea transform, in: Dead Sea Transform Fault System: Reviews, edited by: Garfunkel, Z., Ben-Avraham, Z., and Kagan, E. J., Springer, Dordrecht, the Netherlands, 109–150, https://doi.org/10.1007/978-94-017-8872-4_5, 2014.
Geological Survey of Israel: Earthquake Catalog of Israel, https://eq.gsi.gov.il/en/earthquake/searchEQS.php (last access: 24 December 2024), 2024.
Gerstenberger, M. C., Marzocchi, W., Allen, T., Pagani, M., Adams, J., Danciu, L., Field, E. H., Fujiwara, H., Luco, N., Ma, K.-F., Meletti, C., and Petersen, M. D.: Probabilistic Seismic Hazard Analysis at Regional and National Scales: State of the Art and Future Challenges, Rev. Geophys., 58, e2019RG000653, https://doi.org/10.1029/2019rg000653, 2020.
Gregor, N., Abrahamson, N. A., Atkinson, G. M., Boore, D. M., Bozorgnia, Y., Campbell, K. W., Chiou, B. S.-J., Idriss, I. M., Kamai, R., Seyhan, E., Silva, W., Stewart, J. P., and Youngs, R.: Comparison of NGA-West2 GMPEs, Earthq. Spectra, 30, 1179–1197, https://doi.org/10.1193/070113eqs186m, 2014.
Grünthal, G., Hakimhashemi, A., Schelle, H., Bosse, C., and Wahlström, R.: The long-term temporal behaviour of the seismicity of the Dead Sea Fault Zone and its implication for time-dependent seismic hazard assessments, GFZ, Potsdam, 48 pp., https://doi.org/10.2312/GFZ.b103-09098, 2009.
Hall, C. M., Webb, H. N., Girty, G. H., Allam, A. A., and Rockwell, T. K.: A case study of a precariously balanced rock, its partially exhumed corestone platform, and encasing saprock and soil, CATENA, 172, 719–737, https://doi.org/10.1016/j.catena.2018.09.029, 2019.
Hamiel, Y., Piatibratova, O., and Mizrahi, Y.: Creep along the northern Jordan Valley section of the Dead Sea Fault, Geophys. Res. Lett., 43, 2494–2501, https://doi.org/10.1002/2016GL067913, 2016.
Hoek, E. and Diederichs, M. S.: Empirical estimation of rock mass modulus, Int. J. Rock Mech. Min., 43, 203–215, https://doi.org/10.1016/j.jijrmms.2005.06.005, 2006.
Katz, O., Reches, Z., and Roegiers, J. C.: Evaluation of mechanical rock properties using a Schmidt Hammer, Int. J. Rock Mech. Min., 37, 723–728, https://doi.org/10.1016/S1365-1609(00)00004-6, 2000.
Klinger, Y., Le Beon, M., and Al-Qaryouti, M.: 5000 yr of paleoseismicity along the southern Dead Sea fault, Geophys. J. Int., 202, 313–327, https://doi.org/10.1093/gji/ggv134, 2015.
Lefevre, M., Klinger, Y., Al-Qaryouti, M., Le Béon, M., and Moumani, K.: Slip deficit and temporal clustering along the Dead Sea fault from paleoseismological investigations, Scientific Reports, 8, 4511, https://doi.org/10.1038/s41598-018-22627-9, 2018.
Marzocchi, W. and Meletti, C.: PSHA: Does It Deal with What It Is or What We Want It to Be?, Seismol. Res. Lett., 95, 1469–1472, https://doi.org/10.1785/0220230418, 2024.
McPhillips, D. and Pratt, T. L.: Precariously Balanced Rocks in Northern New York and Vermont, U.S.A.: Ground-Motion Constraints and Implications for Fault Sources, B. Seismol. Soc. Am., 114, 3171–3182, https://doi.org/10.1785/0120240069, 2024.
Moore, J. R., Geimer, P. R., Finnegan, R., and Michel, C.: Dynamic Analysis of a Large Freestanding Rock Tower (Castleton Tower, Utah), B. Seismol. Soc. Am., 109, 2125–2131, https://doi.org/10.1785/0120190118, 2019.
Moore, J. R., Geimer, P. R., Finnegan, R., and Thorne, M. S.: Use of Seismic Resonance Measurements to Determine the Elastic Modulus of Freestanding Rock Masses, Rock Mech. Rock Eng., 51, 3937–3944, https://doi.org/10.1007/s00603-018-1554-6, 2018.
Moore, J. R., Thorne, M. S., Koper, K. D., Wood, J. R., Goddard, K., Burlacu, R., Doyle, S., Stanfield, E., and White, B.: Anthropogenic sources stimulate resonance of a natural rock bridge, Geophys. Res. Lett., 43, 9669–9676, https://doi.org/10.1002/2016gl070088, 2016.
Mulargia, F., Stark, P. B., and Geller, R. J.: Why is Probabilistic Seismic Hazard Analysis (PSHA) still used?, Phys. Earth Planet. In., 264, 63–75, https://doi.org/10.1016/j.pepi.2016.12.002, 2017.
Rood, A. H., Stafford, P. J., and Rood, D. H.: San Andreas Fault Earthquake Hazard Model Validation Using Probabilistic Analysis of Precariously Balanced Rocks and Bayesian Updating, Seismol. Res. Lett., 95, 1776–1793, https://doi.org/10.1785/0220220287, 2024.
Rood, A. H., Rood, D. H., Balco, G., Stafford, P. J., Ludwig, L. G., Kendrick, K. J., and Wilcken, K. M.: Validation of earthquake ground-motion models in southern California, USA, using precariously balanced rocks, GSA Bulletin, 135, 2179–2199, https://doi.org/10.1130/b36484.1, 2022.
Rood, A. H., Rood, D. H., Stirling, M. W., Madugo, C. M., Abrahamson, N. A., Wilcken, K. M., Gonzalez, T., Kottke, A., Whittaker, A. C., Page, W. D., and Stafford, P. J.: Earthquake Hazard Uncertainties Improved Using Precariously Balanced Rocks, AGU Advances, 1, e2020AV000182, https://doi.org/10.1029/2020av000182, 2020.
Saltzman, B.: Possible correlation between the mechanical layer's joint spacing and rock mechanical properties, MSc thesis, Ben Gurion University of the Negev, 2001.
Shamir, G., Bartov, Y., Sneh, A., Fleischer, L., Arad, V., and Rosensaft, M.: Preliminary seismic zonation for Israel, GII Report No. 550/95/01(1), https://www.gov.il/BlobFolder/reports/shamir-et- al-report-2001/en/report_2001_12 Shamir-G-2001-Preliminary-Seismic-Zonation-Israel-GSI-12-2001.pdf (last access: 1 July 2025), 2001.
Shang, J., West, L. J., Hencher, S. R., and Zhao, Z.: Tensile strength of large-scale incipient rock joints: a laboratory investigation, Acta Geotech., 13, 869–886, https://doi.org/10.1007/s11440-017-0620-7, 2018.
Sheorey, P. R., Biswas, A. K., and Choubey, V. D.: An empirical failure criterion for rocks and jointed rock masses, Eng. Geol., 26, 141–159, https://doi.org/10.1016/0013-7952(89)90003-3, 1989.
Simulia: Abaqus Users' Manual (6.20), Dassault Systèmes Simulia Corporation [code], https://www.3ds.com/products/simulia/abaqus/cae (last access: 1 July 2025), 2020.
Stark, P. B.: Pay No Attention to the Model Behind the Curtain, Pure Appl. Geophys., 179, 4121–4145, https://doi.org/10.1007/s00024-022-03137-2, 2022.
Stirling, M. W. and Anooshehpoor, R.: Constraints on Probabilistic Seismic-Hazard Models from Unstable Landform Features in New Zealand, B. Seismol. Soc. Am., 96, 404–414, https://doi.org/10.1785/0120050034, 2006.
Stirling, M. W., Abbott, E. R., Rood, D. H., McVerry, G. H., Abrahamson, N. A., Barrell, D. J. A., Huso, R., Litchfield, N. J., Luna, L., Rhoades, D. A., Silvester, P., Van Dissen, R. J., Van Houtte, C., and Zondervan, A.: First Use of Fragile Geologic Features to Set the Design Motions for a Major Existing Engineered Structure, B. Seismol. Soc. Am., 111, 2673–2695, https://doi.org/10.1785/0120210026, 2021a.
Stirling, M. W., Oskin, M. E., Arrowsmith, J. R., Rood, A. H., Goulet, C. A., Grant Ludwig, L., King, T. R., Kottke, A., Lozos, J. C., Madugo, C. M., McPhillips, D., Rood, D. H., Sleep, N. H., and Wittich, C. E.: Evaluation of Seismic Hazard Models with Fragile Geologic Features, Seismol. Res. Lett., 92, 314–324, https://doi.org/10.1785/0220200197, 2021b.
Strasser, F. O., Bommer, J. J., and Abrahamson, N. A.: Truncation of the distribution of ground-motion residuals, J. Seismol., 12, 79–105, https://doi.org/10.1007/s10950-007-9073-z, 2008.
Valentin, J., Capron, A., Jongmans, D., Baillet, L., Bottelin, P., Donze, F., Larose, E., and Mangeney, A.: The dynamic response of prone-to-fall columns to ambient vibrations: comparison between measurements and numerical modeling, Geophys. J. Int., 208, 1058–1076, https://doi.org/10.1093/gji/ggw440, 2017.
Yu, H., Ng, K., Grana, D., Alvarado, V., Kaszuba, J., and Campbell, E.: A generalized power-law criterion for rocks based on Mohr failure theory, Int. J. Rock Mech. Min., 128, 104274, https://doi.org/10.1016/j.ijrmms.2020.104274, 2020.
Zohar, M.: Temporal and Spatial Patterns of Seismic Activity Associated with the Dead Sea Transform (DST) during the Past 3000 Yr, Seismol. Res. Lett., 91, 207–221, https://doi.org/10.1785/0220190124, 2020.