the Creative Commons Attribution 4.0 License.
the Creative Commons Attribution 4.0 License.
 | 04 Jul 2025
Tree fall along railway lines: modelling the impact of wind and other meteorological factors
Rike Lorenz
Barry Gardiner
Marc Hanewinkel
Benjamin Schmitz
Strong winter wind storms can lead to billions of euros in forestry losses, disrupt train services and necessitate millions of euros in spending on vegetation management along the German railway system. Therefore, understanding the link between tree fall and wind is crucial.
Existing tree fall studies often emphasize tree and soil factors more than meteorology. Using a tree fall dataset from Deutsche Bahn (DB; 2017–2021) and meteorological data from the ERA5 reanalysis and RADOLAN (Routineverfahren zur Online-Aneichung der Radarniederschlagsdaten mit Hilfe von automatischen Bodenniederschlagsstationen (Ombrometer)) radar, we employed stepwise model selection to build a logistic regression model predicting the risk of a tree falling on a railway line in a 31 km grid cell.
While the daily maximum gust speed (the maximum wind speed in a model time step at 10 m height) is the strongest risk factor, we also found that the duration of strong wind speeds (wind speeds above the local 90th percentile), the gust factor (the ratio of the maximum daily gust wind speed to the mean daily gust speed), precipitation, soil water volume, air density and the precipitation sum of the previous year are impactful. Therefore, our findings suggest that high wind speeds, a low gust factor and a prolonged duration of strong winds, especially in combination with wet conditions (high precipitation and high soil moisture) and high air density, increase tree fall risk. Incorporating meteorological parameters linked to local climatological conditions (through anomalies or in relation to local percentiles) improved the model accuracy. This indicates the importance of considering tree adaptation to the environment.
- Article
(2355 KB) - Full-text XML
- BibTeX
- EndNote


Strong wind speeds are a major factor leading to tree fall and are therefore a risk both to the railway service and forestry. Strong winter wind storms can cause billions of euros in damages for forestry (Gliksman et al., 2023). These losses have been increasing over recent decades (Gregow et al., 2017). Additionally, there is an interconnection between storm damage and other ecological risks like droughts and bark beetle infestation in summer or the unfreezing of soils in winter which put further stress on forest ecosystems and are likely to change in a warming climate (Gregow, 2013; Temperli et al., 2013; Seidl et al., 2014; Stadelmann et al., 2014; Venäläinen et al., 2020). In 2018, Deutsche Bahn (DB) increased its budget for vegetation management to enhance storm safety, now spending approximately EUR 125 million annually (DB, 2023). And yet the cost of tree fall remains of the order of millions of euros per year (Meßenzehl, 2019). With 68 % of railway tracks lined by trees and forests, ongoing management is necessary. Since 2018, over 1000 workers have been employed to monitor and maintain railway vegetation (DB, 2023). Despite these efforts, there was an annual average of approximately 3000 tree fall incidents from 2017 to 2021, causing service disruptions and infrastructure damage. In recent years interest in the topic has increased. A number of studies on tree fall hazards show that this problem is also present outside the German railway network (Bíl et al., 2017; Koks et al., 2019; Kučera and Dobesova, 2021; Szymczak et al., 2022). Therefore, it is vital to study the relationship of tree fall and wind. Such research aids the management of vegetation alongside transportation routes as well as the development of climate-resilient forests. There are many studies which investigate the impact of wind speed on tree fall, including tree motion measurements and tree-pulling experiments (Peltola et al., 2000; Kamimura et al., 2012; Schindler and Kolbe, 2020; Jackson et al., 2021), mechanistic modelling (Gardiner et al., 2008; Hale et al., 2015; Kamimura et al., 2016; Costa et al., 2023), and statistical and machine learning approaches (Schindler et al., 2009; Schmidt et al., 2010; Hanewinkel et al., 2014; Hale et al., 2015; Jung et al., 2016; Kamimura et al., 2016; Kamo et al., 2016; Hart et al., 2019; Valta et al., 2019; Zeppenfeld et al., 2023). One issue the field of tree and forest damage modelling faces is the lack of highly resolved gust and airflow data. Great efforts have been made in recent years to develop small-scale gust speed products which can also be used for impact modelling (Primo, 2016; Albrecht et al., 2019; Schulz and Lerch, 2022). Additionally, there are a number of studies that identify, track and classify the storms most damaging to forests and infrastructure (Mohr et al., 2017; Jung and Schindler, 2019; Tervo et al., 2021). Among the statistical modelling approaches, logistic regression models are very common and are also used in our study. Numerous existing studies on storm damage focus on a single storm event or a small spatial region (Albrecht et al., 2012; Hale et al., 2015; Kamimura et al., 2016; Hart et al., 2019; Hall et al., 2020; Zeppenfeld et al., 2023). Consequently, there is a need for long-term and large-scale investigations in this field.
Additionally, previous studies have mainly analysed the impact of tree-, stand- and soil-related factors on wind-induced damages but often excluded metrology. Those which consider meteorological predictors often focus on the relationship between tree damage and mean or maximum wind speeds (Schindler et al., 2009; Jung et al., 2016; Morimoto et al., 2019). Yet, there are some other meteorological predictors which are considered in previous works and which we will consider as well.
To account for the turbulent aspect of wind, some studies employ the gust factor. There are different understandings of the term gust factor in the fields of meteorology and forestry. In forestry the gust factor is often referred to as the ratio of the maximum to mean bending moment experienced by a tree (Gardiner et al., 1997). In other works the gust factor is defined as the ratio of the maximum short-term-averaged wind speed over a shorter duration ts to a long-term-averaged wind speed over a longer duration tl (Ancelin et al., 2004; Gromke and Ruck, 2018). The durations ts and tl then need to be adapted to the specific research questions. Wind load is the wind force per area applied to a tree and the product of a tree's specific drag coefficient, air density, a tree's exposed frontal area and wind speed (see Eq. 13). Wind load and air density are considered in a few studies on tree fall and storm damage (Schelhaas et al., 2007; Ciftci et al., 2014; Gromke and Ruck, 2018; Sterken, 2021) as well as the wind direction (Akay and Taş, 2019; Valta et al., 2019). The role of the wind event duration is also discussed in some literature (Gardiner et al., 2013; Mitchell, 2013; Kamimura et al., 2022) but is not studied in detail. Next to wind, snow, frozen soils and precipitation have been identified as impactful meteorological factors (Peltola et al., 2000; Gardiner et al., 2010; Pasztor et al., 2015; Kamo et al., 2016). For example, heavy rain or snow during a storm event may add considerable weight to the crowns and increase tree fall risk (Gardiner et al., 2010). A decrease of frozen soils in the past as well as in future climate scenarios has been found for example for Finland, where it was connected to higher risks of uprooting (Gregow, 2013; Lehtonen et al., 2019). Soil moisture is also sometimes considered (Kamo et al., 2016; Csilléry et al., 2017), as excessive water in the soil is expected to weaken root anchorage (Kamimura et al., 2012; Défossez et al., 2021). However, the role of soil moisture on tree fall risk is not completely clear and only a few field experiments have been done on the topic (Gardiner, 2021). Both very wet and very dry soils might have a negative impact. The legacy effects of drought may cause lasting changes in tree physiology and weaken the tree (Kannenberg et al., 2020; Zweifel et al., 2020; Haberstroh and Werner, 2022). Therefore, droughts are expected to increase damage caused by wind (Gardiner et al., 2013). Yet, Csilléry et al. (2017) found both positive and negative effects on tree damage. They suggest that in some stands drought weakens the trees and makes them more vulnerable to wind loading, while in others dry soils make them less vulnerable to overturning.
We aim to develop a meteorology-based tree fall impact model, which is a first step toward a more complex predictive tree fall model. On the one hand, such a predictive model could be used to identify areas at risk and support management decisions, for example, which trees to cut down, especially when environmental and forest data become available and can be taken into account in the future. On the other hand, the model can be applied to climate model data to identify future changes in tree fall risk. To accomplish this, we need to identify meteorological parameters and parameter combinations that impact tree fall risk alongside railway lines in Germany over the long term and across a large-scale area. We aim to deepen the understanding of tree fall risk and wind and to explore how far wind-related parameters like the daily maximum gust speed, the gust factor, air density, wind load, the duration of strong wind speeds or wind direction have an impact on tree fall. We also examine the impacts of other predictors related to meteorology that have been included in previous studies, such as soil moisture, precipitation, snow or soil frost. Additionally, we study legacy effects of dry and wet spells by including the soil water volume and precipitation in antecedent time periods.
We will introduce both the tree fall data as well as the meteorological data used in this study (Sect. 3). We will describe the background theory and the selection process for the logistic regression model (Sect. 4), and we will finally present (Sect. 5) and discuss (Sect. 6) our results and conclude with our most important findings (Sect. 7).
2.1 Tree fall data
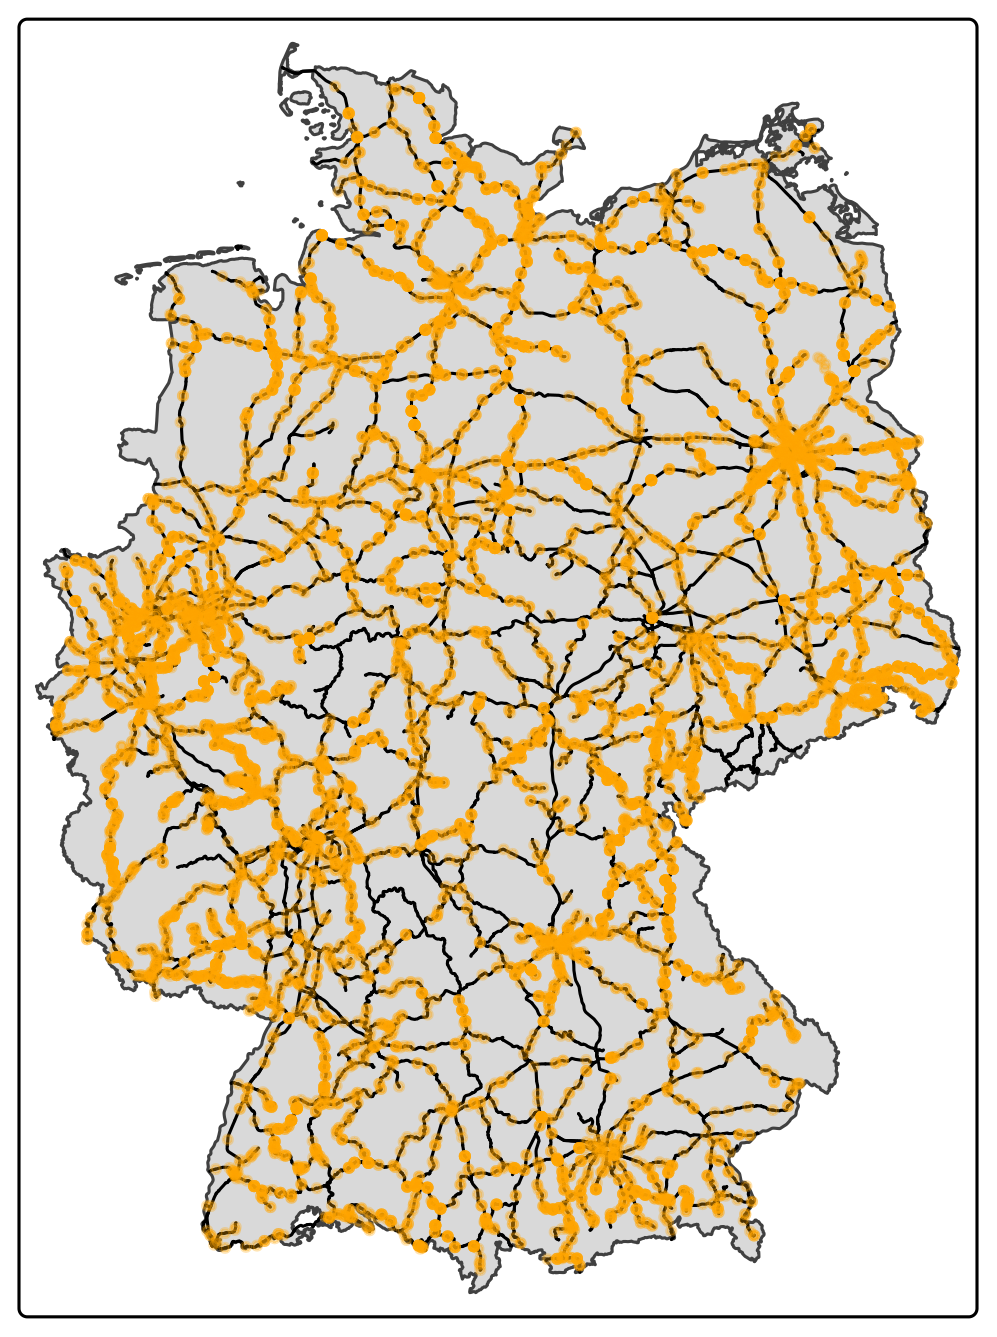
Figure 1All tree fall events (orange dots) alongside railway lines (black lines) in Germany in the extended winter season (October–March) of 2017–2021.
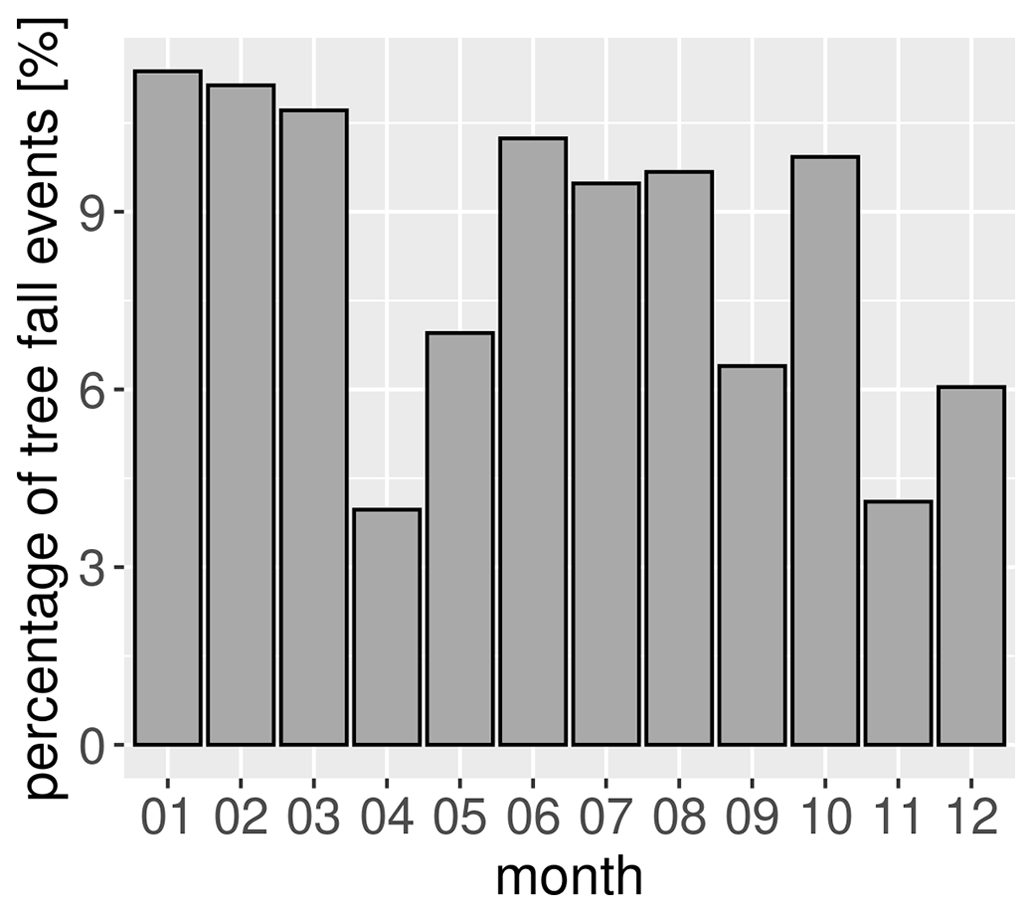
Figure 2Percentage of tree fall events per month alongside German railway lines for the period 2017–2021.
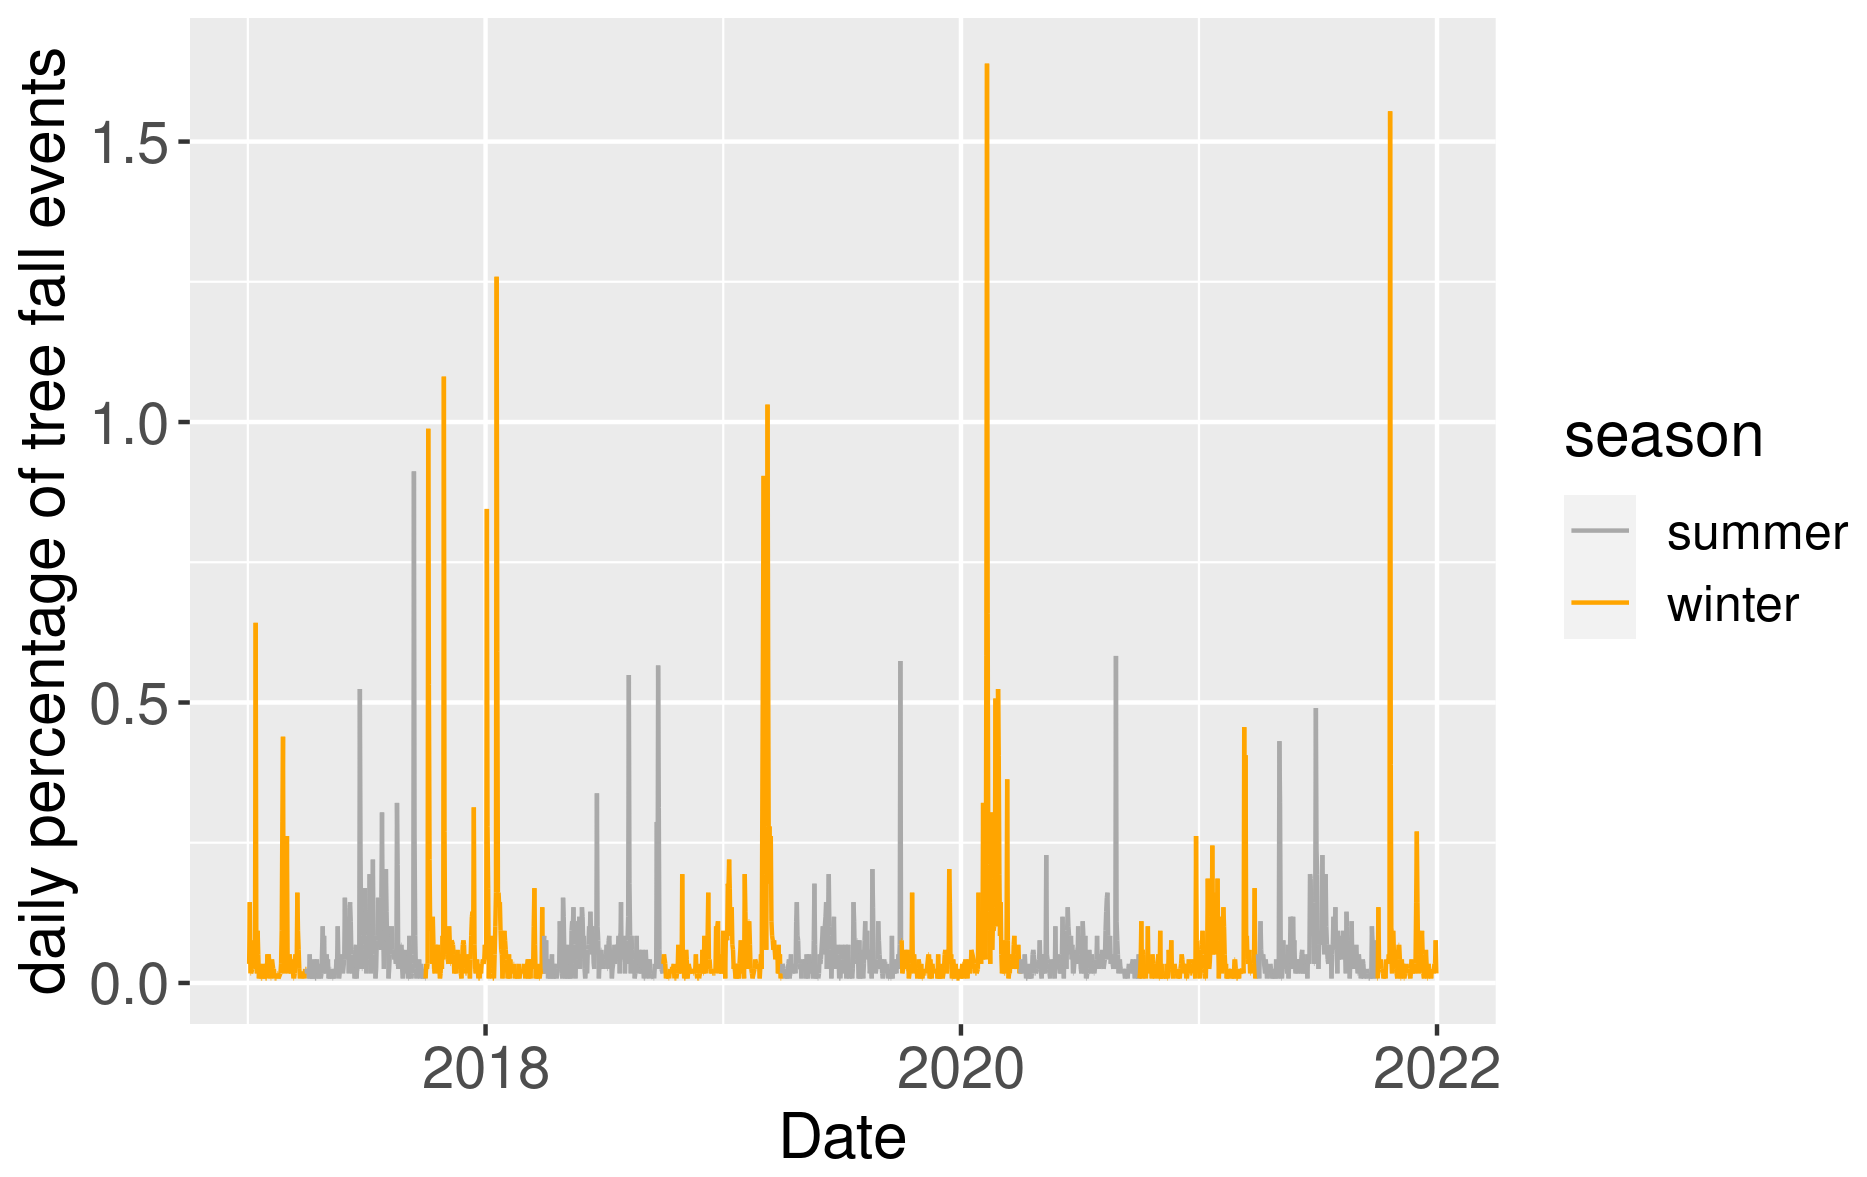
Figure 3Percentage of tree falls per day relative to the total number of tree falls over the entire period alongside German railway lines. Summer and winter are colour-coded. Most extreme peaks of event numbers are caused by winter wind storms, for example Friederike (18 January 2018), Sabine (20 February 2020) and Hendrik (21 October 2021).
Tree fall events along the German railway network were derived from a dataset created by Deutsche Bahn (Fig. 2). The data consist of disturbance events reported by rail drivers and local inspectors. These reports were later merged into one dataset by the railway infrastructure company InfraGO AG (formerly called Netz AG) of Deutsche Bahn. For each tree fall event, the date and time of the report, the coordinates of the event, and further railway-related information like the route section number are included.
The highest number of monthly tree fall events occurs from January to March and from June to August. There is also a peak in October (Fig. 3). The most extreme daily number of tree fall occurs during the winter season and is connected to winter wind storm events due to extra-tropical cyclones (Fig. 4).
2.2 Meteorological data
We used hourly ERA5 data (Hersbach et al., 2020; Hersbach et al., 2023) for all meteorological parameters, except precipitation. ERA5 (provided by the ECMWF, European Centre for Medium-Range Weather Forecasts) is a reanalysis dataset from 1940 to the present with a spatial resolution of ∼31 km. It was accessed using the ClimXtreme Central Evaluation System framework (Kadow et al., 2021). We performed our analysis only for the extended winter season (October to March) to focus on winter wind storms, which cause the most extreme peaks in tree fall events. We used hourly data to calculate daily means, sums or maxima for each predictor (see Table 1) as well as local percentiles (2nd, 10th, 90th and 98th) in each grid cell over the years 2000 to 2019 for some predictors. The CDO module (Climate Data Operators; Schulzweida, 2023) was used for each of these operations. The advantage of using wind speeds from ERA5 is the coverage of the complete area and period under investigation. For these reasons ERA5 and similar reanalysis products are already used as input data in many forecast and impact models (Pardowitz et al., 2016; Valta et al., 2019; Battaglioli et al., 2023; Cusack, 2023). Previous versions of the ECMWF reanalysis have successfully been used to reproduce windstorm-related damage as recorded by the German Insurance Association (Donat et al., 2010; Prahl et al., 2015), suggesting the usability of these data in spite of deviations with local station measurements (Minola et al., 2020). Studies comparing wind speed observation with the ERA5 reanalysis find good correlations (Minola et al., 2020; Molina et al., 2021).
For precipitation data we used RADOLAN (Routineverfahren zur Online-Aneichung der Radarniederschlagsdaten mit Hilfe von automatischen Bodenniederschlagsstationen (Ombrometer)) data provided by the German Weather Service (Bartels et al., 2004; DWD, 2004) with a spatial resolution of 1 km. RADOLAN combines radar reflectivity, measured by the 16 C-band Doppler radars of the German weather radar network, and ground-based precipitation gauge measurements.
In this section, we describe data pre-processing as well as the theoretical background and the model selection process for the logistic regression model. The aim of this model is to calculate the probability of at least one tree falling on a given day in a 31 km grid cell, depending on meteorological parameters. It is used to analyse the impact of a set of predictor variables.
3.1 Data pre-processing
A shapefile of the German railway lines (DB, 2019) was used to mask the ERA5 grid and select all grid cells in Germany that are crossed by at least one railway line. We calculated the rail density (total length of all railway lines in kilometres) for each grid cell in order to quantify the length of exposed railway lines.
Daily mean air density ρ was calculated as
where p is the daily mean surface air pressure (hPa), T is the daily mean near-surface air temperature (K) (both derived from ERA5 hourly data) and R is the universal gas constant (8.314 J K−1 mol−1).
Daily precipitation sums were calculated from the hourly data. We then remapped the precipitation radar data to the ERA5 grid using bilinear interpolation by applying the remapbil function of the CDO module and thus ascribing daily precipitation sums to each grid cell. We calculated percentile exceedance of the 2nd, 10th, 90th and 98th percentile for gust speed maxima, the soil water volume, and precipitation via the relation of the daily value and the local percentile.
Finally, we collected all these data for the months of October to March in 2017 to 2021 in a dataset containing grid cell IDs, a variety of daily meteorological predictors (see Table 1), rail density, and the daily occurrence of at least one tree fall event in the grid cell given as true or false. This dataset contains only grid cells crossed by at least one railway line.
3.2 Logistic regression
Logistic regression was used to relate the probability of an event to a linear combination of predictor variables, which is converted with the logit link function into the scale of a probability:
Here, θ is the probability of an event, x1−k is the predictor variables, b1−k are the estimated coefficients and a is the intercept term. Equation (2) can be rearranged in the following way to calculate the event probability (MacKenzie et al., 2018):
Interactions allow for expressing the dependence of two or more variables on each other in a model. The effect (a.k.a. the estimated coefficient) for one predictor might change depending on the value of another predictor. Compared to a model without interaction (see Eq. 2), two predictors that are assumed to have an influence on each other are multiplied and a coefficient is estimated for this new term, resulting in
where b3 is the estimated coefficient for the interaction of the predictors x1 and x2. It represents how the effect of x1 on the event probability changes with x2 (and vice versa). A significant b3 would indicate that the effect of x1 on the probability is different at different levels of x2.
For quantifying the model's forecast quality we use the Brier skill score (BSS), which is based on the Brier score (BS) (Wilks, 2011):
where N is the number of observations, f is the forecast probability and o is the outcome (either 1 or 0). The BSS is then calculated as
where BS is the modelled Brier score and BSref is the score of a reference model, in this case a model that simply assumes the mean tree fall probability in each grid cell. This mean probability is used as the forecast probability f in BSref and compared to the outcome o. The BSS ranges from −∞ to 1, where a positive value indicates that the model is better than the reference model. For calculating the BSS we use 10-fold cross validation. Here, the dataset is randomly divided into 10 equal sequences. The model is trained on 9 sequences, while the BS score is calculated for the 10th sequence and used for validation. This is repeated 10 times, each time using a different sequence for the validation.
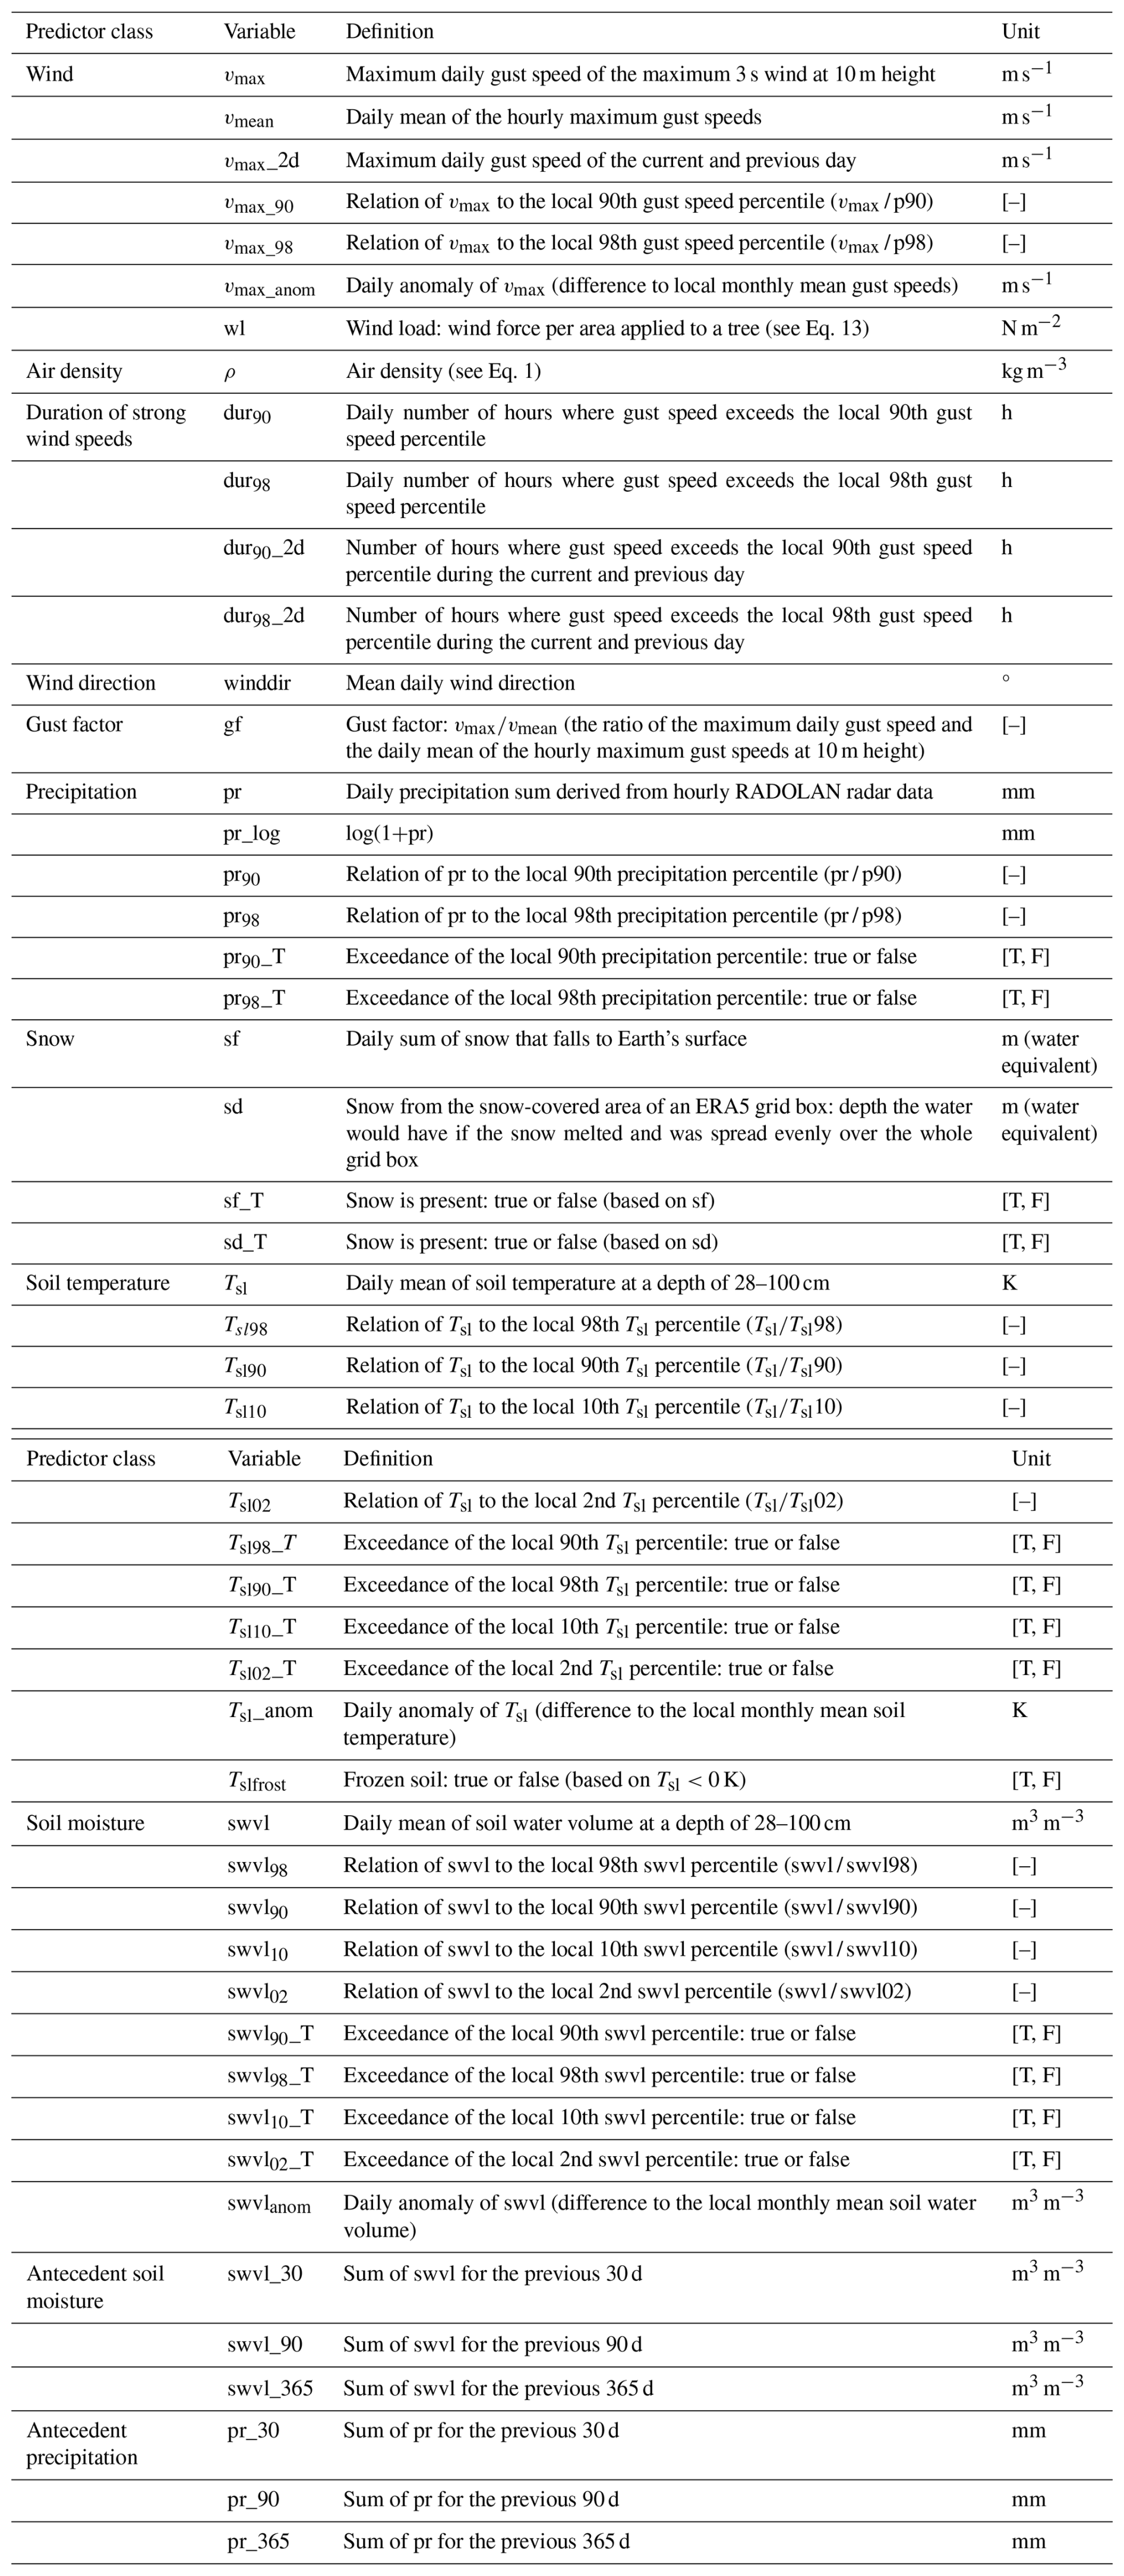
We selected a set of meteorological parameters based on the literature cited in the Introduction and grouped them into 11 predictor classes, e.g. “wind”, “snow” and “precipitation” (see Table A1 for full list of predictors and classes). To test for legacy effects we also include the precipitation sum and soil water volume from antecedent time periods of 3 months, 9 months and 1 year. The goal is not to build the “perfect” model but to examine which predictor classes influence tree fall, which are not influential and which are most clearly improving the skill of the model against the basic reference model.
Since the length of railway lines in a grid cell is highly influential regarding the tree fall probability, this variable is included as well.
We were interested in the impact of each predictor class and also the predictor modifications (for example anomalies or relations to local percentiles) which improve the model skill the most. At the same time we wanted to avoid multicollinearity. Therefore, model selection followed three criteria:
-
There must be exactly one predictor from each predictor class in the model (see Table A1 for a full list of predictors and classes).
-
Only the predictor of each class improving the model's BSS the most is added to the model.
-
The predictor has to be significant with p<0.05 based on Student's t test.
We then moved gradually from class to class. We added and removed each of the predictors in the class in a stepwise approach, keeping only the class predictor with the best BSS performance.
We assume gust speeds to be the key predictor, but interactions with other predictors that influence a tree's vulnerability are likely. Therefore, we added interaction terms between the daily maximum gust speed and each other model predictor in the model in the same stepwise approach. Again, we only kept the interaction term if it improved the model's BSS.
After adding all predictors to the model we tested for multicollinearity. Multicollinearity exists when two or more predictors in a regression model are moderately or highly correlated with one another. We used the variance inflation factor (VIF) to test for multicollinearity:
where is the R2 value obtained by regressing the jth predictor on the remaining predictors. All predictors with VIF < 5 were considered to have no critical multicollinearity (Sheather, 2009).
We calculated the standardized effect size for each predictor to estimate their effects on tree fall probability compared to each other. For this, we standardized the absolute value of the predictor's estimated coefficient by calculating the standardized coefficient or beta coefficient:
where bj is the estimated coefficient for the jth predictor, sxj is the standard deviation of the independent predictor xj and sy is the standard deviation of the dependent variable y.
Finally, we tested the significance of each independent variable in the model. We kept only those independent variables that are significant (with p<0.05 based on Student's t test) and then continued analysis with this reduced model.
In this section we describe the selected model and the impact of the model predictors on tree fall risk.
As can be seen in Figs. 3 and 4, winter wind storms cause the highest number of tree fall events, while a very high monthly number of tree fall events occurs from January to March, the season of winter wind storms. However, meteorological predictors other than wind speed caused by storms factor into tree fall risk: according to the selection criteria described in Sect. 4 the resulting model (using the McCullagh and Nelder, 1989, model notation) is
Explanations for the different predictor abbreviations are given in Tables 1 and A1. This model predicts the tree fall risk for each grid cell using the meteorological variables of each cell as input. The terms vmax_anom:dur90 and vmax_anom:gf represent the interactions of the gust speed with duration and the gust factor. They serve to account for the fact that the individual parameters do not change tree fall risk independently. Their impact in the model becomes apparent mainly on days with relatively high wind speeds. See Sect. 6.3 for further discussion of this effect. Sine and cosine terms are used for winddir to ensure that the tree fall probability as a function of winddir has the same values at 0 and 360°. The model's BSS is 0.069, compared to a BSS of 0.0637 for
showing an improvement of model skill when using additional meteorological predictors compared to just rail density rd and the daily maximum gust speed vmax.
In Table 1 the predictors, their definitions, and corresponding model coefficients and metrics are listed. All coefficients except for those of snow depth (sd), soil frost (Tslfrost) and the mean soil water volume during the previous year (swvl_365) are significantly different from 0. We find the highest effect sizes (with absolute standardized coefficients greater than 1) for the gust speed anomaly (vmax_anom), the interaction of the gust speed anomaly and the duration of strong wind speeds (dur90), the interaction of the gust speed anomaly and the gust factor (gf), rail density (rd), and the duration of strong wind speeds. Interactions between the gust speed anomaly and other predictors (except the duration of strong wind speeds and the gust factor) do not improve the model's BSS.
For daily precipitation, the daily soil water volume and the daily maximum gust speed we compare unmodified predictors and predictors related to local conditions (using anomalies or percentiles) and find that the latter improve the BSS more, with pr90, swvlanom and vmax_anom being the best predictors.
To test for multicollinearity, we use the VIF and find all values to be below 5 and therefore not critically correlated with each other. Interaction terms are excluded from this as they are naturally highly correlated with the interaction partners.
In a second step we adapt the model and identify all non-significant predictors: sd, Tslfrost and swvl_365. To reduce model complexity we remove these predictors. After removing the three non-significant predictors the BSS remains at 0.069. This results in the following model:
We find that the rail density, anomaly of daily maximum gust speeds vmax_anom, duration of strong wind speeds based on the local 90th gust speed percentile dur90, gust factor gf, wind direction winddir, precipitation related to the local 90th percentile pr90, soil water volume anomaly swvlanom, precipitation sum in the previous year pr_365, air density ρ, and the two interactions of the gust speed anomaly with either the gust factor or duration of strong wind speeds were significant, improved the model's BSS and therefore meet the model selection criteria. This model is used to plot the functional relationships between the tree fall probability and meteorological predictors (Fig. 5). For these plots one model parameter is varied, while the others are fixed to a certain value (detailed in the caption of Fig. 5) that was determined during previous data exploration. For the fixed values of vmax anom and dur90 we picked 18 m s−1 and 5 h, which represent values of a short but strong winter storm. A wind speed of 18 m s−1 is exceeded on about 0.5 % of days and thus occurs approximately 2 days a year. For swvlanom and pr90 we selected values that represent a dry situation, thus very low soil moisture and very low precipitation. For wind direction we picked a north-easterly wind. For the other variables (pr_365, ρ) we chose the average over the time period 2017–2021. Based on these plots and the standardized coefficients (Table 1) we find a relatively strong increasing impact on tree fall risk for vmax_anom, dur90 and rd. We find a relatively weak but still significant increasing impact for swvlanom, pr90, ρ and pr_365. We find a relatively strong decreasing effect for gf and a relatively weak impact for winddir with easterly to south-easterly winds having a decreasing and westerly to north-westerly winds having an increasing impact respectively.
Based on these findings, we propose that high and prolonged wind speeds, especially in combination with wet conditions (high precipitation and high soil moisture) and high air density, increase tree fall risk.
Table 1Model predictors (ordered by their effect size) and their corresponding model coefficients and metrics. Bold numbers indicate values below the required threshold for significance and multi-correlation (with p<0.05 based on Student's t test and VIF < 5). See Table A1 for further details.
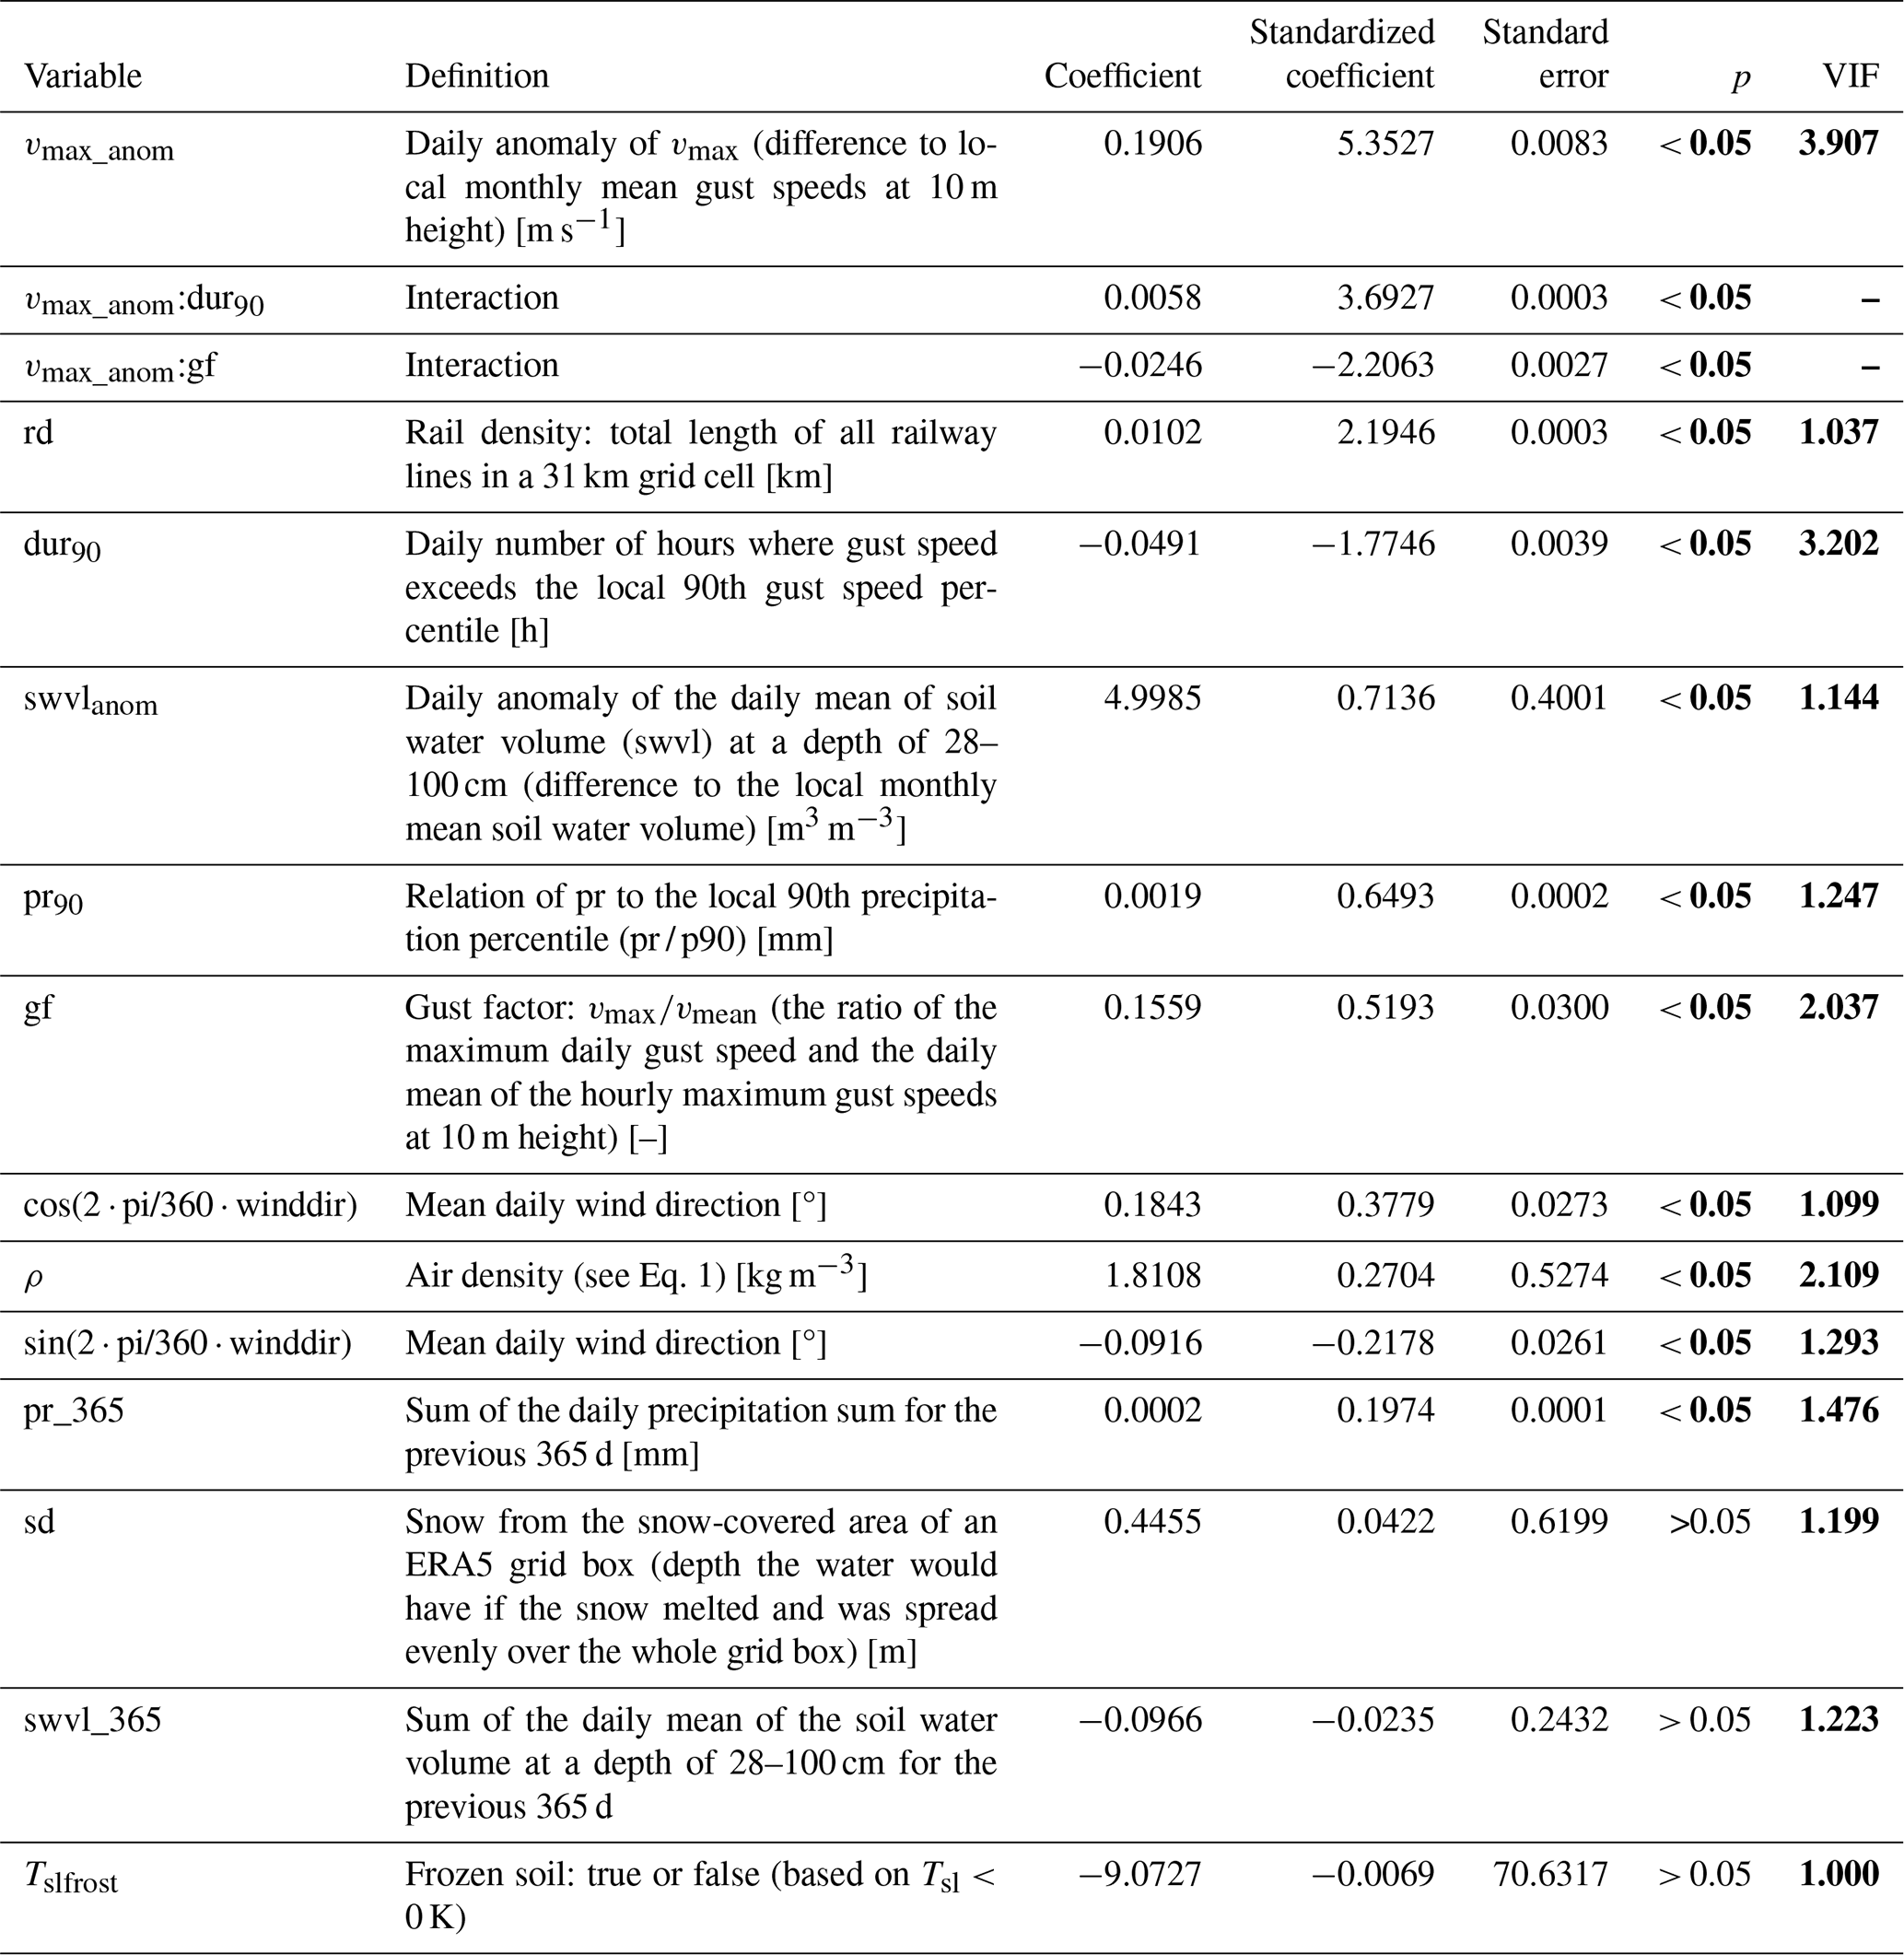
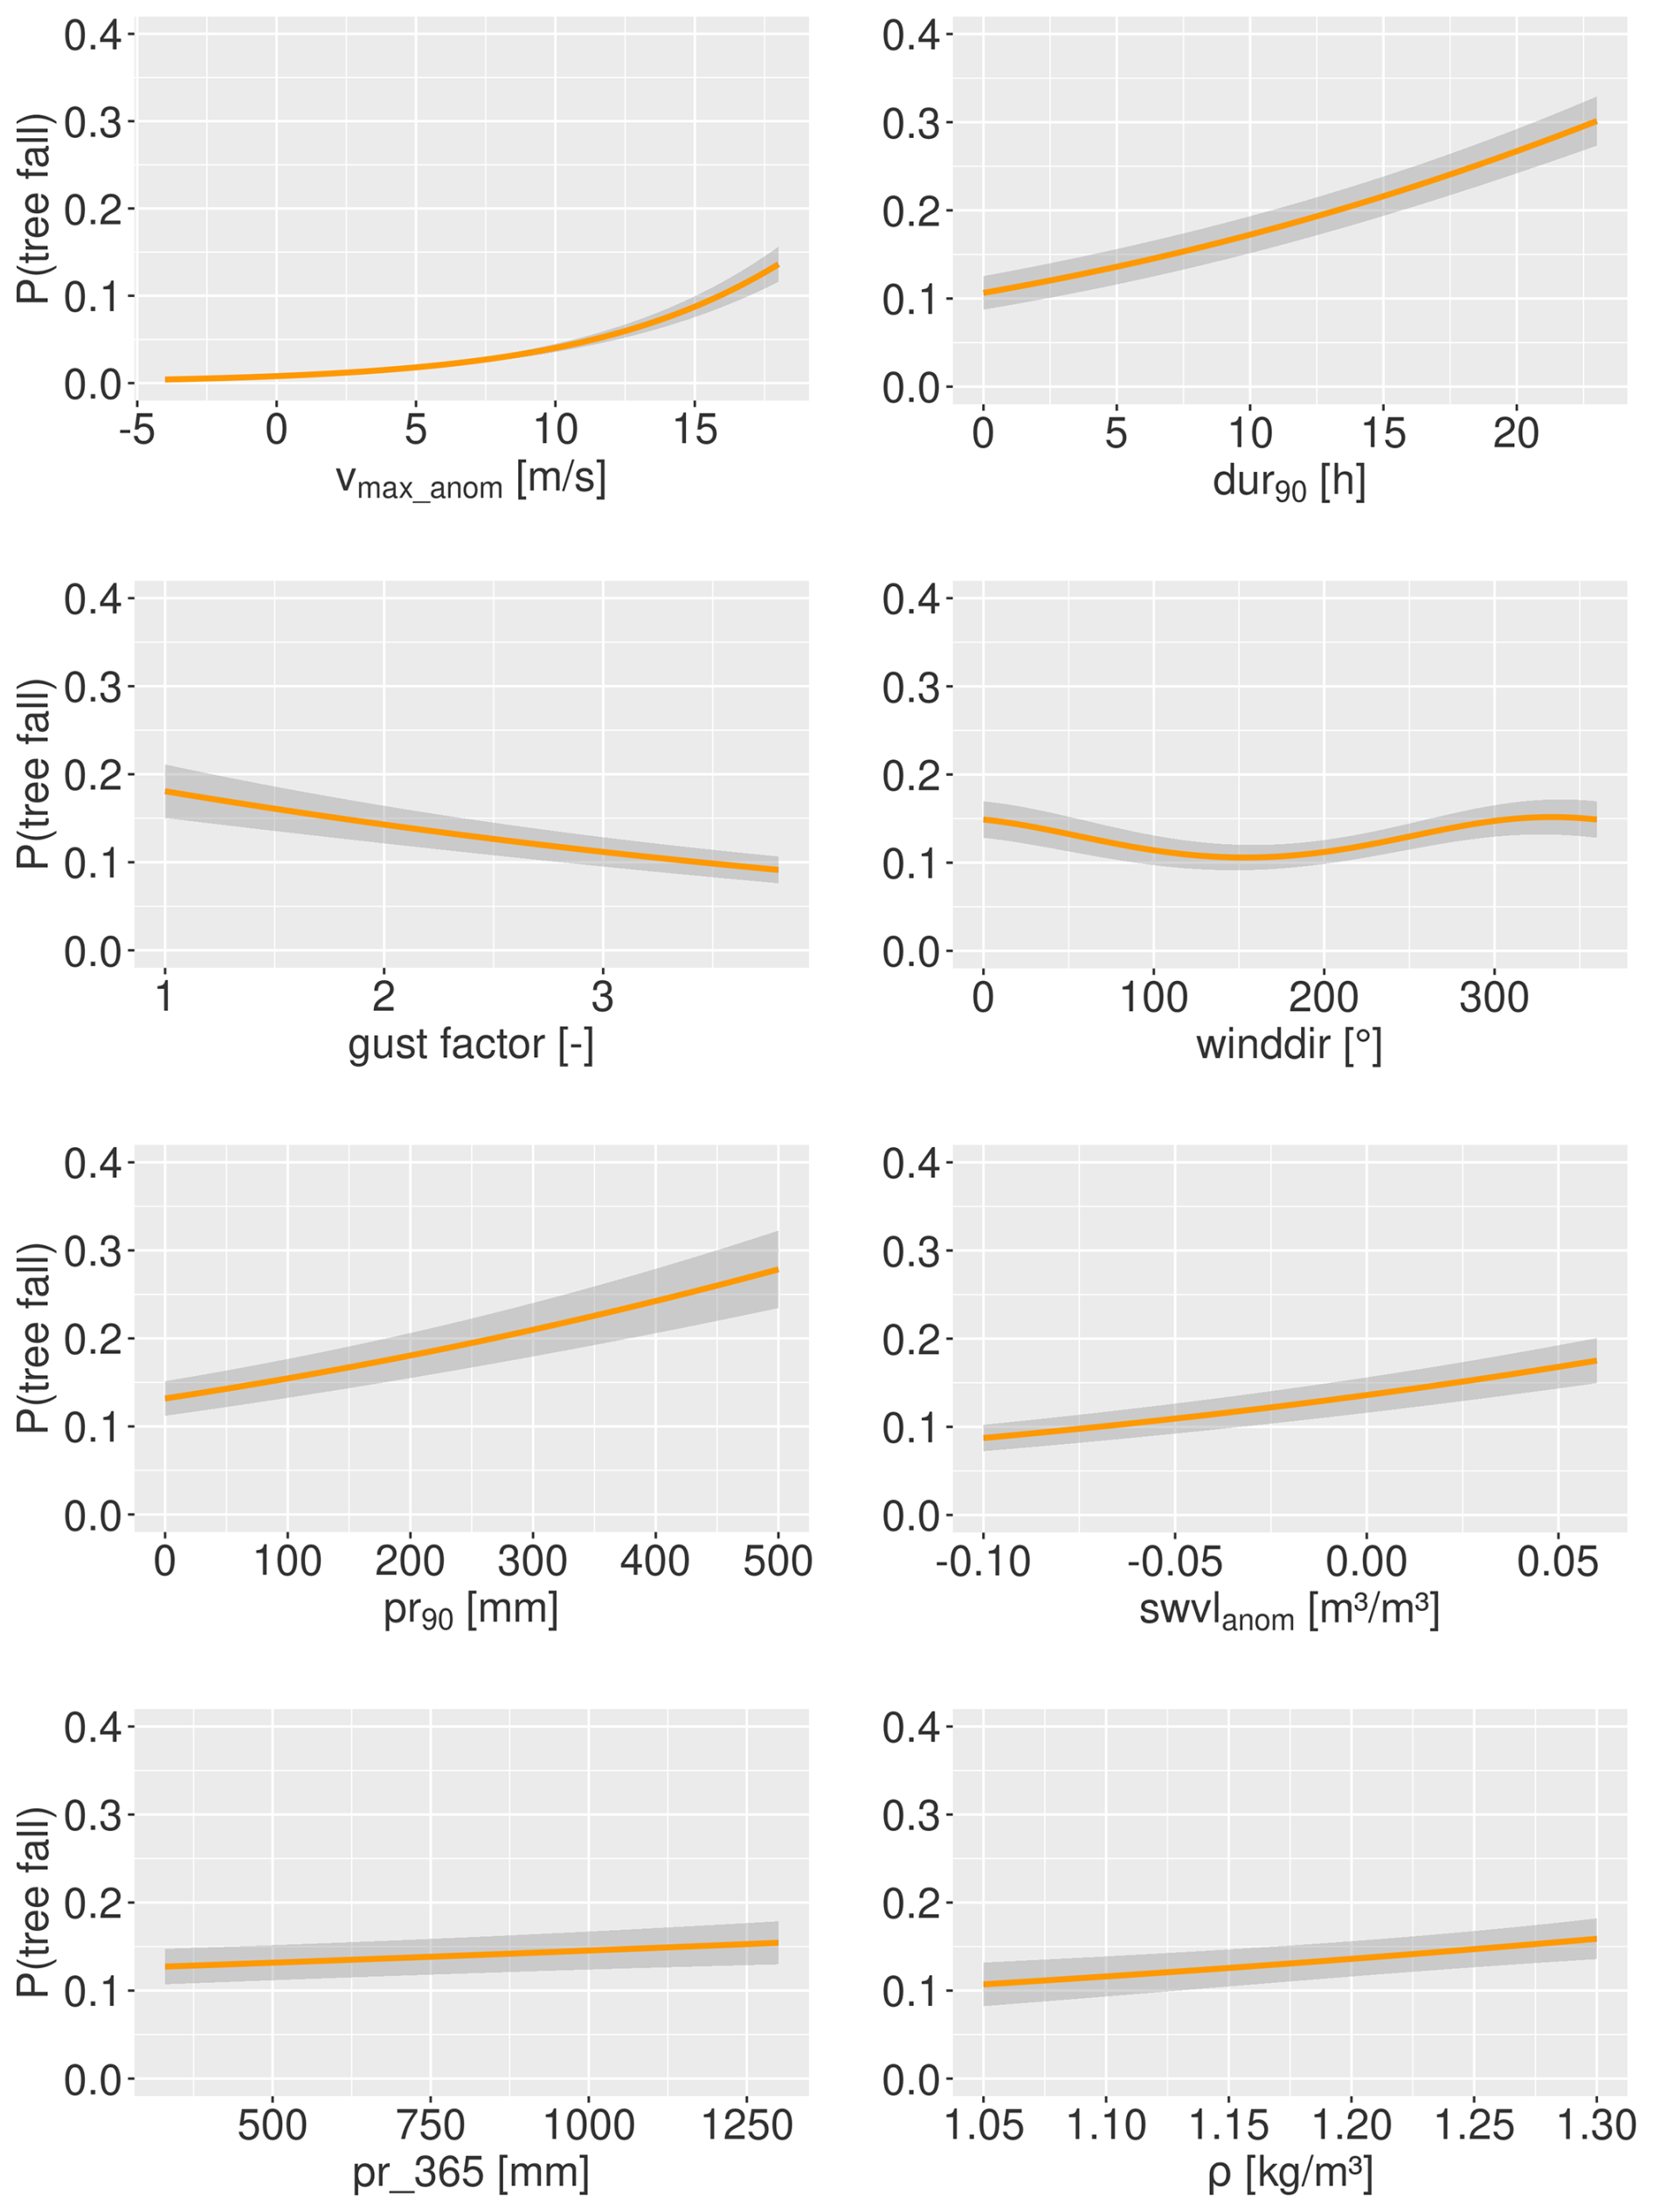
Figure 4Changes in tree fall probability in an ERA5 grid cell with 100 km railway length (urban conditions) depending on different parameters. In each figure one model parameter is varied, while the others are fixed to a certain value: vmax_anom=18 m s−1, dur90=5 h, gf = 2.2, pr90=20 mm, winddir = 41°, swvlanom=0 m3 m−3, pr_365 = 663 mm and ρ=1.2 kg m3. Grey areas signify the confidence interval with a level of 95 %.
There are a vast number of studies which contributed significantly to understanding storm impacts on forests, particularly in areas such as impact modelling (Gardiner et al., 2008; Hale et al., 2015; Kamimura et al., 2016; Valta et al., 2019; Costa et al., 2023), wind climatology (Mohr et al., 2017; Jung and Schindler, 2019; Tervo et al., 2021), or field campaigns and pulling experiments (Kamimura et al., 2016; Kamo et al., 2016; Schindler and Kolbe, 2020). A key goal of these research efforts is to develop functional forecast models which can predict tree and forest damage. Such a model should be applicable to major tree species, diverse landscapes and various forest types. It would help to identify areas of risk, estimate damages in a future climate scenario or during possible extreme events, and assess management strategies for foresters and infrastructure providers like Deutsche Bahn (Akay and Taş, 2019; Albrecht et al., 2019). However, there are several hurdles on the way to this goal. (1) There are a lack of damage data covering large areas and longer time periods which are needed to train these models and often a lack of environmental data to feed into them (Hart et al., 2019; Maringer et al., 2020). (2) There is also a lack of highly resolved gust speed data. Such data are needed to fully understand and model tree damage (Jung and Schindler, 2019; Gregow et al., 2020). (3) Many of the existing studies focus on a partial aspect of the issue, for example on a small spatial region, a single damaging storm event or one tree species (often due to the lack of bigger data). (4) And finally such a model would need to incorporate parameters from many relevant fields (such as tree biology, forestry, meteorology, fluid dynamics, pedology and others) as well as their interactions. So far, many studies have focused on the parameters from their respective fields. These issues make it difficult to apply existing works to different tree species or forest types and also to use the existing impact models on data from climate models. Several works call for more impact data and longer time series, addressing the interaction of multiple risks, and inter-disciplinary approaches and cooperation (Valta et al., 2019; Gregow et al., 2020; Venäläinen et al., 2020; Gardiner, 2021). Additionally, there is ongoing work dedicated to developing more accurate small-scale gust speed products (Primo, 2016; Schulz and Lerch, 2022).
In the field of forest impact modelling many models focus on biological and environmental predictors such as tree, stand and soil properties (Mayer et al., 2005; Schindler et al., 2009; Kamo et al., 2016; Kabir et al., 2018; Díaz-Yáñez et al., 2019; Hart et al., 2019; Wohlgemuth et al., 2022). Meteorological predictors like precipitation or soil moisture are considered less often (Schmidt et al., 2010; Hall et al., 2020). Wind is mostly considered regarding the mean or maximum wind speed (Hale et al., 2015; Morimoto et al., 2019; Hall et al., 2020). This focus on environmental predictors and mean wind speeds is often also true for studies that consider tree fall on railway lines (Bíl et al., 2017; Kučera and Dobesova, 2021; Gardiner et al., 2024).
Many impact studies focus on singular and very damaging storm events (Hale et al., 2015; Kabir et al., 2018; Hart et al., 2019; Hall et al., 2020; Zeppenfeld et al., 2023). Those who study longer time periods are often focused on small areas such as experimental plots (Albrecht et al., 2012; Kamimura et al., 2016) or smaller administrative units (Jung et al., 2016). In this study, we try to contribute to this ongoing research using data covering a large area over several years (2017 to 2021) and exploring the impact of different meteorological factors. In a next step, our model can be applied to gridded climate model data to estimate risks for trees in future climate scenarios.
We focused on not only different types of meteorological predictors, including those that describe wind characteristics, but also predictors describing precipitation and soil conditions. We showed that meteorological predictors other than the mean or maximum wind speed have a significant effect on tree fall risk and improve the model's predictive skill.
5.1 Model building and predictor selection
The model selection process resulted in a model with 10 independent variables and 2 interactions, raising the possibility of over-complexity. To account for this we calculated the Akaike information criterion (AIC), which is a relative measure showing how well different models fit the data. It penalizes numbers of independent variables that are too high. The model with the lowest AIC value is considered the best. We calculated the AIC for the resulting model as well as reduced versions of the model in which we left out (1) the interactions, (2) all predictors with an absolute standardized coefficient < 1 and (3) all predictors with an absolute standardized coefficient < 0.5. We find that our selected model has the lowest AIC (56 985.43) compared to options 1 to 3 (57 339.14, 57 512.49 and 57 062.27 respectively).
In our model the influence of the wind direction on tree fall risk is relatively small compared to the effect of the wind speed itself. Nonetheless, it appears that north-westerly winds slightly increase tree fall risk. This seems counter-intuitive as this is the predominant wind direction in Germany. It is assumed that trees adapt to the dominant wind direction and that untypical wind directions, in this case easterly winds, increase tree fall risk (Bonnesoeur et al., 2016; Valta et al., 2019). An explanation might be that westerly winds are on average stronger. ERA5 is not a perfect representation of local winds and sometimes underestimates gust speeds (Molina et al., 2021). Thus, in cases where ERA5 underestimates the real gust speeds but shows westerly winds the wind direction might become a proxy for stronger winds. While Akay and Taş (2019) found the wind direction at three stations to be one of the predictors with the highest impact on storm damage risk, it has a relatively small effect in our model. Their result may be related to the role of wind direction on wind speeds at stations located in an area with high orography, which is much weaker in the rather coarse ERA5 data. Certainly there can also be a relationship between the wind direction and a tree's exposure, for example depending on the topography, the tree's acclimation to the average local wind direction (Mitchell, 2013) or the location of the tree to an exposed edge (Quine et al., 2021). We did not account for these factors. Future modelling might benefit by adding local tree wind exposure.
Duration of strong winds is important because trees do not fail instantly but fail with repeated swaying that fractures the root–soil system, and this process can take many hours (Kamimura et al., 2022). The gust factor and air density are also known to be critical components in calculations of tree wind damage risk (see Eqs. 4.4, 4.12 and 4.15 in Quine et al., 2021).
We found that both the soil water volume anomaly and daily precipitation sum have an increasing impact on tree fall probability, which is in agreement with previous studies (Kamimura et al., 2016; Hall et al., 2020). This could be due to the fact that heavy precipitation can contribute to the accumulation of weight on tree crowns, consequently increasing wind-induced stress (Neild and Wood, 1999; Gardiner et al., 2010; Hale et al., 2015). Additionally, water-logged soils can have a negative affect on root anchorage (Kamimura et al., 2012). The influence of precipitation and soil moisture on tree fall during winter will likely increase in northern forest areas. Here rising temperatures and shortened winter decrease soil frost and thus root anchorage (Gregow et al., 2017, 2020; Lehtonen et al., 2019; Venäläinen et al., 2020).
We also included predictors describing antecedent soil moisture and precipitation conditions, namely mean soil water volume accumulation and the precipitation sum of the previous 12 months. The antecedent soil water volume is not significant in our model, but the precipitation sum of the previous year is, showing a weak increasing impact on tree fall risk. The role of droughts in other hazards such as fires or bark beetle infestation is well studied (Venäläinen et al., 2020; Singh et al., 2024). However, research on the impact of drought on wind-induced tree damage is inconclusive. Csilléry et al. (2017) found both positive but mainly negative effects on tree damage. They suggest that in some stands drought weakens the trees and makes them more vulnerable to wind loading, while in others dry soils make them less vulnerable to overturning. We suggest that further research should consider antecedent weather situations in more detail, for example, by including indices like the standardized precipitation–evapotranspiration index (SPEI), which has been used in recent research on forest disturbance (Klein et al., 2019; Gazol and Camarero, 2022). It is also likely that trees react very differently to dry and wet conditions depending on their species, height or soil type. Whenever such information is available, it should be included in the analysis.
Several studies have found snow and frozen soil to be influential (Peltola et al., 2000; Hanewinkel et al., 2008; Kamimura et al., 2012; Kamo et al., 2016). Snow loading can apply stress on the canopy and branches, and this stress can be increased by additional wind (Kamo et al., 2016; Zubkov et al., 2023). Frozen soil has been shown to prevent uprooting (Gardiner et al., 2010; Pasztor et al., 2015). Yet, in our study snow and soil frost did not prove to be significant. This is likely connected to the rare occurrence of such conditions in Germany between 2017 and 2021. On average, over all model grid cells snow depth exceeded 0.05 m water equivalent only on 1.3 % of all winter days and soil frost occurred only on 0.03 % of the days. Our snow data are derived from ERA5 and are therefore modelled data. In their evaluation of snow cover properties in ERA5, Kouki et al. (2023) found that ERA5 generally overestimates snow water equivalent in the Northern Hemisphere. Thus, snow coverage might even be lower than shown in our data. Using measured instead of modelled snow data could potentially improve the modelling results.
For wind speed, precipitation and soil water volume we compared unaltered predictors with anomalies and percentile exceedances. For all three parameter types, we found that predictors based on percentile exceedances (pr90) or anomalies (swvlanom, vmax_anom) improve the model's BSS the most and, thus, reflect the trees' ability to acclimate. Trees adapt to the local climate (Mitchell, 2013; Gardiner et al., 2016), and what might be windy or dry conditions for a tree in one region might be average in another. When modelling tree damage over larger spatial regions, we therefore suggest relating meteorological predictors to local climatological conditions, for example using anomalies or percentiles.
We found that air density has a positive impact on tree fall risk. As our model includes both the maximum gust speed and air density we considered wind load as a model predictor. Wind load is proportional to air density and the square of wind speed:
where C is a non-dimensional drag coefficient, ρ is the air density (kg m−3), A is the frontal area and v is the wind speed (m s−1) (Ciftci et al., 2014; Gardiner et al., 2016; Quine et al., 2021). Therefore, wind load is highly correlated with wind speed. In our data, vmax_anom and wind load have a high Pearson correlation coefficient of 0.95. Due to this, they should not be used together in a single model since a high correlation between parameters makes model interpretation difficult. As both the drag coefficient and the tree's frontal area are unknown, we reduced the equation to
We tested a model that used wind load instead of air density and vmax_anom. We removed air density from the predictors of Eq. (11) and exchanged vmax_anom with wind load. We found a lower BSS for this model of 0.0678 compared to 0.069. Yet, wind load is highly significant and has a strong effect size with a standardized coefficient of 4.07. Additionally, the wind load model has a marginally lower AIC (56 980.45) than the original model (56 985.43). Due to the lower BSS, wl did not meet the selection criteria in our modelling process. Yet, it is certainly influential regarding tree fall and might add value to other impact models. We suggest considering it in future studies.
5.2 The effect of interaction terms
Interactions can show the combined effect predictors may have on model outcome and how the effect of one predictor changes depending on the value of the other. We tested if interaction terms with the gust speed anomaly add to the model skill and found positive results for the interaction with the duration of strong wind speeds as well as gust factor. Both predictor interactions improve the BSS and are highly significant (see Table 1).
A low gust factor could be the result of a day with a high maximum gust speed and a high mean gust speed as well as the result of a low maximum gust speed and a low mean gust speed. Thus, this predictor lacks information without the interaction with the maximum gust speed. The duration of strong wind speeds depends on the local 90th gust speed percentile. As the average 90th percentile in our data is 12 m s−1, a wide range of gust speeds exceed the percentile since a vmax greater than 30 m s−1 is possible during strong storms. Here too, the interaction adds missing information to the model. The duration and gust factor are not strongly correlated (with a Spearman's correlation coefficient of 0.15) and therefore provide complementary information as long durations are accompanied by a vast range of gust factor values.
In Fig. 5 the effect of the duration of strong wind speeds and gust factor for the model with and without interaction terms is compared. When the interactions are removed, the decreasing impact of the gust factor on tree fall probability is much smaller, while the duration of strong wind speeds seems to be not at all connected to tree fall probability. The effect size of these predictors also decreases strongly: in a model without interactions, the standardized coefficient of the gust factor is −0.3181 and that of the duration of strong wind speeds is 0.0275 (compare to Table 1). Only when we add the interaction does the impact of these predictors become visible, thus showing their combined effect. Furthermore, the model without interactions has a BSS of only 0.0678 compared to 0.069 for the model that includes interactions (Eq. 11).
The combined effect of the predictors is illustrated in Fig. 6. We compare the model outcome depending on the duration of strong wind speeds for two values of vmax_anom, 10 and 18 m s−1. Both represent values that exceed the 98th percentile of daily gust speeds in most grid cells, but one represents a low exceedance, while the other is very high. The duration of strong wind speeds has a much stronger increasing impact on tree fall probability in the second scenario. This also fits with the observations of Kamimura et al. (2022), who showed that even in a typhoon with very high wind speeds the duration of the storm was important regarding the occurrence of damage.
A high maximum daily gust speed could be not only the result of just one strong gust but also the result of a stormy day with lasting high wind speeds. Adding additional wind properties like the gust factor or duration of strong wind speeds can help differentiate between these scenarios. Figure 7 illustrates this. Here, we compare modelled tree fall probabilities for a day with a high gust factor and low duration of strong wind speeds (a gusty day) and a day with a low gust factor and long duration of strong wind speeds (a day of sustained high wind speeds). The relationship between vmax_anom and the tree fall probability is much weaker on the gusty day, showing how strongly the interaction with additional wind properties can change tree fall risk.
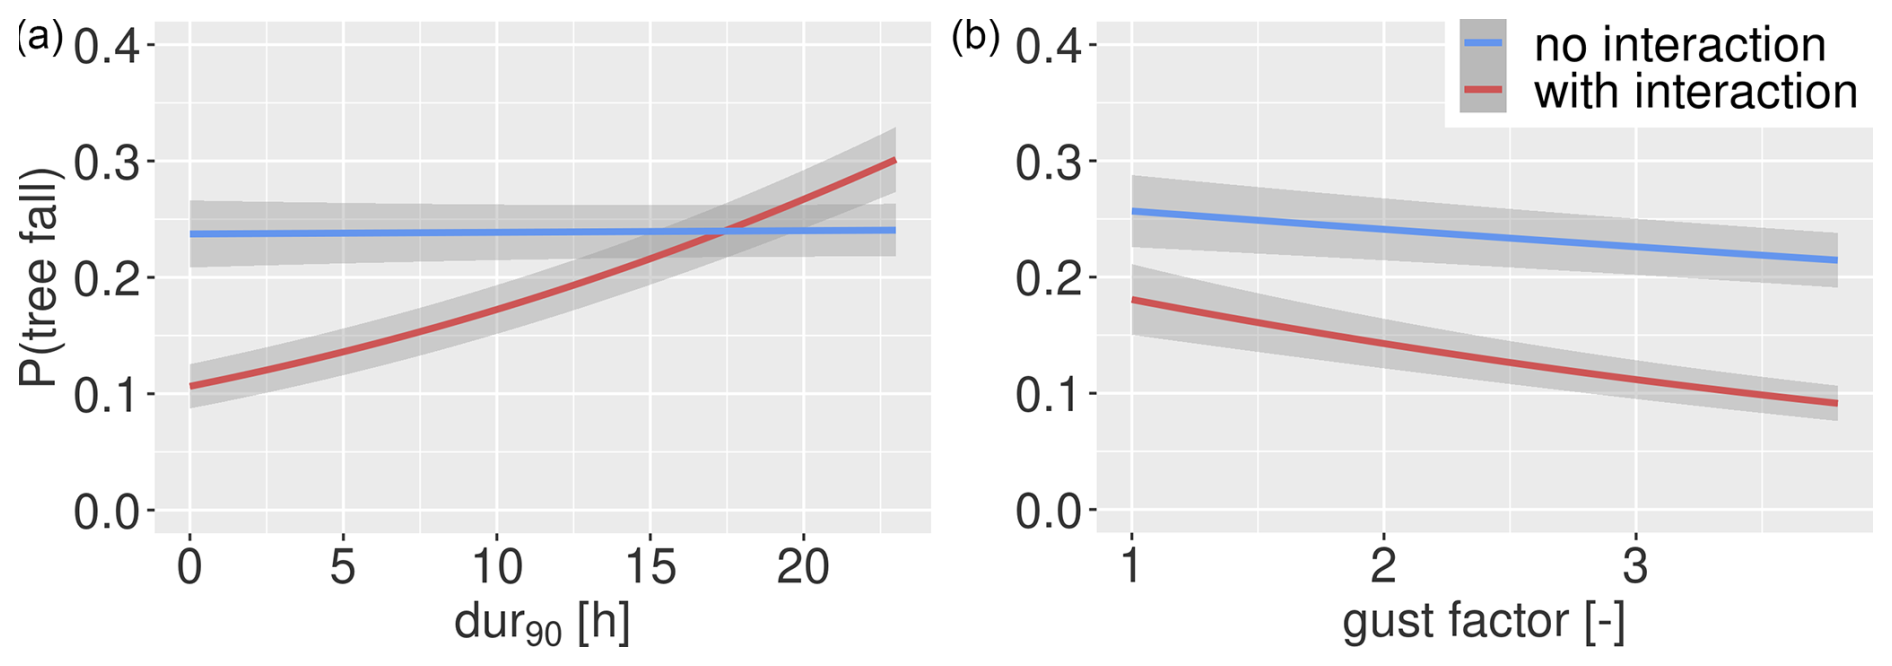
Figure 5Comparison of the effects of the duration of strong wind speeds (dur90, a) and the gust factor (gf, b) on tree fall risk for the model with and without interaction terms. Parameters are fixed to the same values as in Fig. 4 with vmax_anom=18 m s−1. Grey areas signify the confidence interval with a level of 95 %.
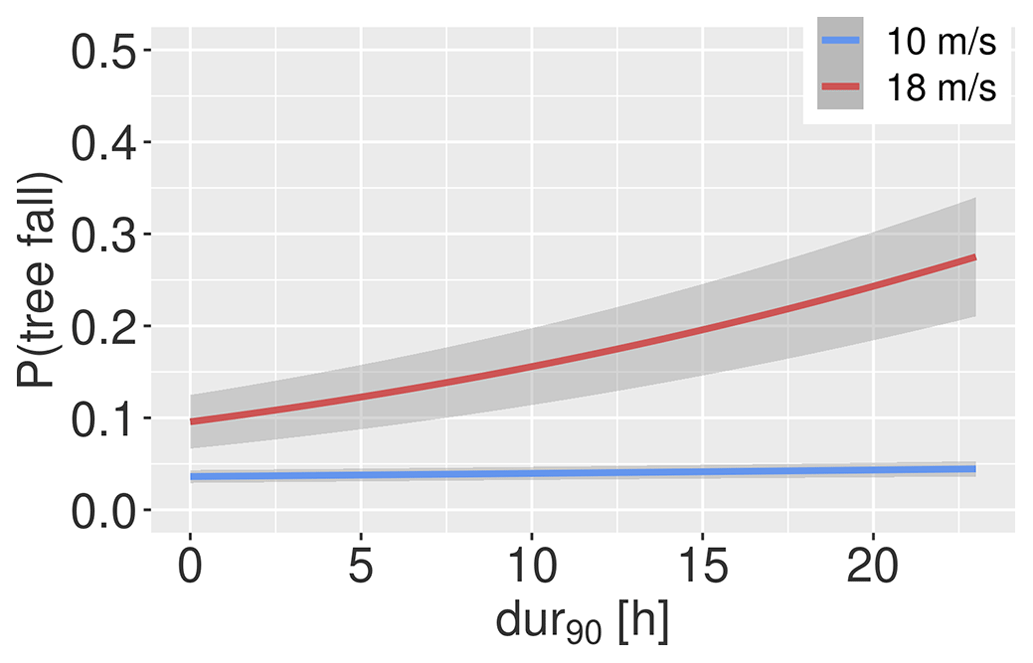
Figure 6Interaction effect of vmax_anom and storm duration for two different values of vmax_anom (10 and 18 m s−1). All other parameters are fixed to the same values as in Fig. 4. Grey areas signify the confidence interval with a level of 95 %.
5.3 Limitations
This study aimed, among other things, to create a meteorological basis for a predictive tree fall model that can support decisions regarding the management of vegetation alongside transportation routes, as well as climate-resilient forests. However, local ecological information (soil, tree species, stand structure, etc.) is not taken into account. Thus, the results are not representative of every individual setting but rather for an average setting across Germany.
Many studies have pointed out the influence of tree, stand and soil factors (Mayer et al., 2005; Kamo et al., 2016; Kabir et al., 2018; Díaz-Yáñez et al., 2019; Hart et al., 2019; Gardiner, 2021; Wohlgemuth et al., 2022) on wind damage vulnerability. Thus, model results could vary if such information were to be incorporated. The tree fall risk according to this model might vary at the same gust speed level for different trees and different stands. For example, Gardiner et al. (2024) demonstrated how critical wind speeds for tree fall along railway lines vary significantly depending on factors such as tree height, canopy shape, and whether the tree is coniferous or deciduous. However, our results show clear evidence for the importance of specific meteorological predictors in tree fall and storm damage modelling. Finding the specific relationships for meteorological predictors and different tree species, forest types and soil types should be the next step in understanding the impact of different meteorological conditions on wind damage.
In the dataset about 25 % of tree fall events occur at a maximum daily gust speed below 11 m s−1. These tree fall events might be caused by processes unrelated to meteorology. Valta et al. (2019) point out that an individual tree fall instance is already possible at low wind speeds such as 15 m s−1. Events at an even lower speed cannot be ruled out. On the other hand, these events might be related to wind events not resolved by the ERA5 reanalysis and thus caused by wind speeds that were higher in reality than shown in the data. For example, convection is not explicitly resolved by the underlying atmospheric model of ERA5. Therefore, the wind speeds caused by convective events are likely to be underestimated. Additionally, the coarse resolution of ERA5 is generally suboptimal when trying to connect small-scale events such as a single tree fall instance with meteorological data. Yet, at the time of our research ERA5 was the only reanalysis dataset covering the years 2017 to 2021. While evaluations of ERA5 gust speeds with observational data point out some limitations, they also find the data in general to be a good representation of local measurements. Molina et al. (2021) compare hourly 10 m wind speed from ERA5 with wind observations from 245 stations across Europe. They find that “Most of the stations exhibit hourly [Pearson correlation coefficients] ranging from 0.8 to 0.9, indicating that ERA5 is able to reproduce the wind speed spectrum range ... for any location over Europe”. Minola et al. (2020) compare ERA5 with hourly near-surface wind speed and gust observations across Sweden for 2013–2017. They, too, find Pearson correlations of 0.8 and higher for daily maximum gust speeds. However, they do point out that “evident discrepancies are still found across the inland and mountain regions” and that higher wind speeds and gust speeds display stronger negative biases. Data with higher spatial resolutions that include convective effects might help in understanding the effects of thunderstorms and other small-scale phenomena in future research. There is already some concern that such phenomena are becoming more problematic in Europe (Suvanto et al., 2016; Sulik and Kejna, 2020).
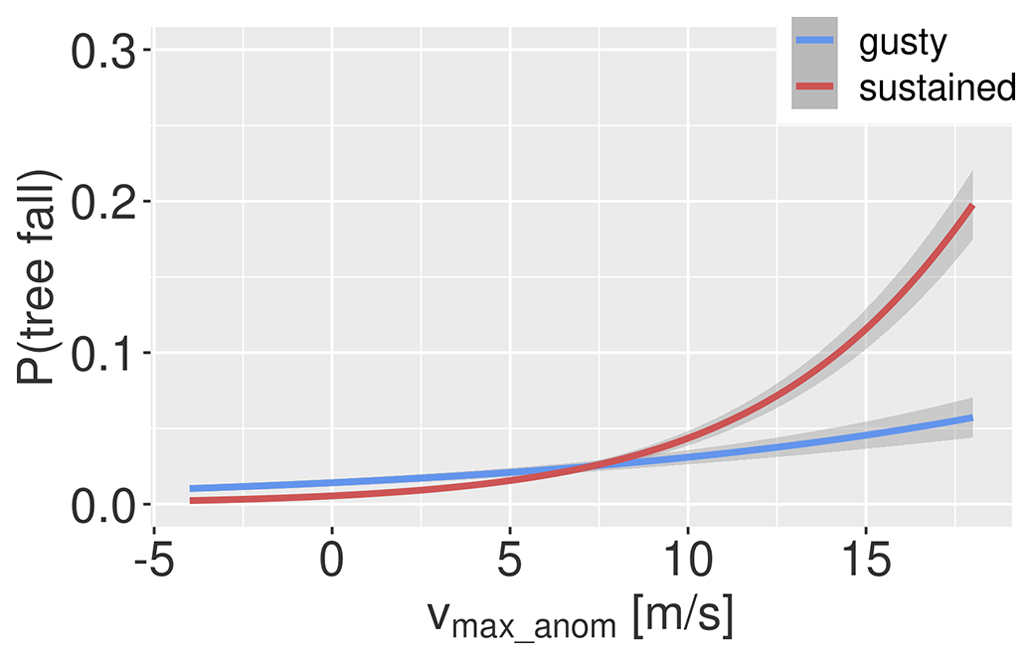
Figure 7Comparison of the interaction effect. Gusty day: dur90=2 h and gf = 5; sustained day: dur90= 12 h and gf = 2. All other parameters are fixed to the same values as in Fig. 4. Grey areas signify the confidence interval with a level of 95 %.
The addition and removal of model predictors during the stepwise model selection process caused only very small changes in the model's BSS, which was very low to begin with. This is quite likely connected to all of the limitations listed above. Models which are able to add tree, soil or stand data or have access to meteorological data of a higher spatial resolution will likely produce a better model skill rating and be able to examine the relationships of tree fall and meteorology in more detail. Nonetheless, our approach provides clear evidence about which meteorological predictors have a significant impact and indicates the magnitude of their effect.
Our aim was to investigate the relationship between tree fall and wind as well as other meteorological conditions. For this, we used a stepwise approach to build a logistic regression model predicting tree fall risk.
We showed that high and prolonged wind speeds, especially in combination with wet conditions (high precipitation and high soil moisture) and a high air density, increase tree fall risk. We find a relatively strong increasing impact on tree fall risk for the daily maximum gust speed anomaly and duration of strong wind speeds. We find a relatively weak but still significant increasing impact for the daily soil water volume anomaly, the daily precipitation exceedance of the 90th percentile, daily air density and the precipitation sum of the previous year. We find a relatively strong decreasing effect for the gust factor and a relatively weak impact for wind direction, with easterly to south-easterly winds having a decreasing and westerly to north-westerly winds having an increasing impact. Snow and soil frost predictors, which were found to be important in past research, have no significant impact in our model. To account for the potential acclimation of trees to the local climate we compared unmodified predictors and predictors related to local conditions (using anomalies or percentiles) for the daily precipitation, daily soil water volume and daily maximum gust speed. We find that the latter predictors, which reflect acclimation, improve the model's skill the most. Finally we showed that the inclusion of interaction terms improved the model's skill score, changed modelled risk probabilities and helped to illustrate the combined effect meteorological predictors may have on tree fall probability.
Many previous studies on tree fall and forest storm damage are restricted to a single event or small research region. Additionally, past research has primarily focused on tree, soil and stand parameters. When studies have taken meteorology into account, they often implemented only mean or maximum gust speeds. We were able to conduct a long-term and large-scale study on tree fall risk and were able to show that other wind-related parameters such as the gust factor, duration of strong wind speeds or air density as well as other predictors related to meteorology, including precipitation and soil moisture, have a significant impact on tree fall risk. Our results also highlight the importance of using anomalies or relations to local percentiles for meteorological predictors in large-scale studies to account for the acclimation of trees to their local climatic conditions.
This work is a step towards future research on the topic of wind damage and tree fall. It shows how meteorological factors can be incorporated into a probabilistic tree fall model. Such a model can be applied to climate model data to estimate changes in tree fall risk in future climate scenarios and during potential extreme events. We aim to elaborate on these goals in future research.
The RADOLAN radar dataset by the German Weather Service (DWD) is free for download from their open data server (https://opendata.dwd.de/climate_environment/CDC/grids_germany/hourly/radolan/historical/bin, DWD, 2004). The ERA5 atmospheric parameters are also free for download from the Climate Data Store (CDS) of the Copernicus Climate Change Service (C3S) (https://cds.climate.copernicus.eu, CDS, 2024). Due to the data protection policies of the data provider, Deutsche Bahn, the tree damage data cannot be made available.
RL: data curation, formal analysis, methodology, software, visualization, writing (original draft preparation and review and editing). NB: conceptualization, supervision, project administration. BG: advice and counsel, writing (review and editing). MH: advice and counsel, supervision, project administration, writing (review and editing). UU: conceptualization, supervision, funding acquisition, project administration, writing (review and editing). BS: resources (provision of data), data curation.
At least one of the (co-)authors is a member of the editorial board of Natural Hazards and Earth System Sciences.
The generative AI ChatGPT was used to aid in the writing process for parts of this text. It was used solely to improve grammar and readability. The authors reviewed and edited all artificially generated output carefully.
Publisher’s note: Copernicus Publications remains neutral with regard to jurisdictional claims made in the text, published maps, institutional affiliations, or any other geographical representation in this paper. While Copernicus Publications makes every effort to include appropriate place names, the final responsibility lies with the authors.
This research has been supported by the Bundesministerium für Bildung und Forschung (grant no. 01LP1902H).
The article processing charges for this open-access publication were covered by the Freie Universität Berlin.
This paper was edited by Ricardo Trigo and reviewed by Hilppa Gregow and three anonymous referees.
Akay, A. E. and Taş, İ.: Mapping the risk of winter storm damage using GIS-based fuzzy logic, J. Forest. Res., 31, 729–742, https://doi.org/10.1007/s11676-019-00904-1, 2019.
Albrecht, A., Hanewinkel, M., Bauhus, J. and Kohnle, U.: How does silviculture affect storm damage in forests of south-western Germany? Results from empirical modeling based on long-term observations, Eur. J. Forest Res., 131, 229–247, https://doi.org/10.1007/s10342-010-0432-x, 2012.
Albrecht, A. T., Jung, C., and Schindler, D.: Improving empirical storm damage models by coupling with high-resolution gust speed data, Agr. Forest Meteorol., 268, 23–31, https://doi.org/10.1016/j.agrformet.2018.12.017, 2019.
Ancelin, P., Courbaud, B., and Fourcaud, T.: Development of an individual tree-based mechanical model to predict wind damage within forest stands, Forest Ecol. Manage., 203, 101–121, https://doi.org/10.1016/j.foreco.2004.07.067, 2004.
Bartels, H., Weigl, E., Reich, T., Lang, P., Wagner, A., Kohler, O., and Gerlach, N.: Routineverfahren zur Online-Aneichung der Radarniederschlagsdaten mit Hilfe von automatischen Bodenniederschlagsstationen (Ombrometer), DWD, 111, 2004.
Battaglioli, F., Groenemeijer, P., Tsonevsky, I., and Púčik, T.: Forecasting large hail and lightning using additive logistic regression models and the ECMWF reforecasts, Nat. Hazards Earth Syst. Sci., 23, 3651–3669, https://doi.org/10.5194/nhess-23-3651-2023, 2023.
Bíl, M., Andrášik, R., Nezval, V., and Bílová, M.: Identifying locations along railway networks with the highest tree fall hazard, Appl. Geogr., 87, 45–53, https://doi.org/10.1016/j.apgeog.2017.07.012, 2017.
Bonnesoeur, V., Constant, T., Moulia, B., and Fournier, M.: Forest trees filter chronic wind-signals to acclimate to high winds, New Phytol., 210, 850–860, https://doi.org/10.1111/nph.13836, 2016.
CDS: Dive into this wealth of information about the Earth's past, present and future climate, https://cds.climate.copernicus.eu (last access: October 2023), 2024.
Ciftci, C., Arwade, S. R., Kane, B., and Brena, S. F.: Analysis of the probability of failure for open-grown trees during wind storms, Probabilist. Eng. Mech., 37, 41–50, https://doi.org/10.1016/j.probengmech.2014.04.002, 2014.
Costa, M., Gardiner, B., Locatelli, T., Marchi, L., Marchi, N., and Lingua, E.: Evaluating wind damage vulnerability in the Alps: A new wind risk model parametrisation, Agr. Forest Meteorol., 341, 109660, https://doi.org/10.1016/j.agrformet.2023.109660, 2023.
Csilléry, K., Kunstler, G., Courbaud, B., Allard, D., Lassègues, P., Haslinger, K., and Gardiner, B.: Coupled effects of wind-storms and drought on tree mortality across 115 forest stands from the Western Alps and the Jura mountains, Global Change Biol., 23, 5092–5107, https://doi.org/10.1111/gcb.13773, 2017.
Cusack, S.: A long record of European windstorm losses and its comparison to standard climate indices, Nat. Hazards Earth Syst. Sci., 23, 2841–2856, https://doi.org/10.5194/nhess-23-2841-2023, 2023.
DB (Deutsche Bahn): Geo-Streckennetz, Deutsche Bahn [data set], https://data.deutschebahn.com/dataset/geo-strecke.html (last access: 30 June 2023, no longer available), 2019.
DB: Grün an der Bahn – Wie die DB Bäume und Sträucher an ihren Strecken pflegt, https://www.deutschebahn.com/de/presse/suche_Medienpakete/medienpaket_vegetationsmanagement-6854346 (last access: 25 August 2023), 2023.
Défossez, P., Veylon, G., Yang, M., Bonnefond, J., Garrigou, D., Trichet, P., and Danjon, F.: Impact of soil water content on the overturning resistance of young Pinus Pinaster in sandy soil, Forest Ecol. Manage., 480, 118614, https://doi.org/10.1016/j.foreco.2020.118614, 2021.
Díaz-Yáñez, O., Mola-Yudego, B., and González-Olabarria, J.R.: Modelling damage occurrence by snow and wind in forest ecosystems, Ecol. Modell., 408, 108741, https://doi.org/10.1016/j.ecolmodel.2019.108741, 2019.
Donat, M., Leckebusch, G., Wild, S., and Ulbrich, U.: Benefits and limitations of regional multi-model ensembles for storm loss estimations, Clim. Res., 44, 211–225, https://doi.org/10.3354/cr00891, 2010.
DWD, C. D. C.: Historische stündliche RADOLAN-Raster der Niederschlagshöhe (binär), version V001, DWD [data set], https://opendata.dwd.de/climate_environment/CDC/grids_germany/hourly/radolan/historical/bin/ (last access: 2 October 2023), 2004.
Gardiner, B.: Wind damage to forests and trees: a review with an emphasis on planted and managed forests, J. Forest Res., 26, 248–266, https://doi.org/10.1080/13416979.2021.1940665, 2021.
Gardiner, B. A., Stacey, G. R., Belcher, R. E., and Wo, C. J.: Field and wind tunnel assessments of the implications of respacing and thinning for tree stability, Forestry, 70, 233–252, https://doi.org/10.1093/forestry/70.3.233, 1997.
Gardiner, B., Berry, P., and Moulia, B.: Review: Wind impacts on plant growth, mechanics and damage, Plant Sci., 245, 94–118, https://doi.org/10.1016/j.plantsci.2016.01.006, 2016.
Gardiner, B., Blennow, K., Carnus, J.-M., Fleischer, P., Ingemarson, F., Landmann, G., Lindner, M., Marzano, M., Nicoll, B., Orazio, C., Peyron, J.-L., Schelhaas, M.-J., Schuck, A., and Usbeck, T.: Destructive storms in European forests: past and forthcoming impacts, European Forest Institute, 138, https://doi.org/10.13140/RG.2.1.1420.4006, 2010.
Gardiner, B., Byrne, K., Hale, S., Kamimura, K., Mitchell, S.J., Peltola, H., and Ruel, J.-C.: A review of mechanistic modelling of wind damage risk to forests, Forestry, 81, 447–463, https://doi.org/10.1093/forestry/cpn022, 2008.
Gardiner, B., Lorenz, R., Hanewinkel, M., Schmitz, B., Bott, F., Szymczak, S., Frick, A., and Ulbrich, U.: Predicting the risk of tree fall onto railway lines, Forest Ecol. Manage., 553, 121614, https://doi.org/10.1016/j.foreco.2023.121614, 2024.
Gardiner, B., Schuck, A., Schelhaas, M.-J., Orazio, C., Blennow, K., and Nicoll, B.: Living with Storm Damage to Forests What Science Can Tell Us What Science Can Tell Us. European Forest Institute, Joensuu, Finland, 129, https://doi.org/10.13140/2.1.1730.2400, 2013.
Gazol, A. and Camarero, J. J.: Compound climate events increase tree drought mortality across European forests, Sci. Total Environ., 816, 151604, https://doi.org/10.1016/j.scitotenv.2021.151604, 2022.
Gliksman, D., Averbeck, P., Becker, N., Gardiner, B., Goldberg, V., Grieger, J., Handorf, D., Haustein, K., Karwat, A., Knutzen, F., Lentink, H. S., Lorenz, R., Niermann, D., Pinto, J. G., Queck, R., Ziemann, A., and Franzke, C. L. E.: Review article: A European perspective on wind and storm damage – from the meteorological background to index-based approaches to assess impacts, Nat. Hazards Earth Syst. Sci., 23, 2171–2201, https://doi.org/10.5194/nhess-23-2171-2023, 2023.
Gregow, H.: Impacts of strong winds, heavy snow loads and soil frost conditions on the risks to forests in Northern Europe, Finnish Meteorological Institute Contributions, No. 94, Finnish Meteorological Institute, Helsinki, 44, ISBN 978-951-697-782-2, 2013.
Gregow, H., Laaksonen, A., and Alper, M. E.: Increasing large scale windstorm damage in Western, Central and Northern European forests, 1951–2010, Sci. Rep., 7, 1–7, https://doi.org/10.1038/srep46397, 2017.
Gregow, H., Rantanen, M., Laurila, T. K., and Mäkelä, A.: Review on winds, extratropical cyclones and their impacts in Northern Europe and Finland, Finnish Meteorological Institute Reports, 2020:3, Finnish Meteorological Institute, Helsinki, 36., https://doi.org/10.35614/isbn.9789523361188, 2020.
Gromke, C. and Ruck, B.: On wind forces in the forest-edge region during extreme-gust passages and their implications for damage patterns, Bound.-Lay. Meteorol., 168, 269–288, https://doi.org/10.1007/s10546-018-0348-4, 2018.
Haberstroh, S. and Werner, C.: The role of species interactions for forest resilience to drought, Plant Biol., 24, 1098–1107, https://doi.org/10.1111/plb.13415, 2022.
Hale, S. E., Gardiner, B., Peace, A., Nicoll, B., Taylor, P., and Pizzirani, S.: Comparison and validation of three versions of a forest wind risk model, Environ. Modell. Softw., 68, 27–41, https://doi.org/10.1016/j.envsoft.2015.01.016, 2015.
Hall, J., Muscarella, R., Quebbeman, A., Arellano, G., Thompson, J., Zimmerman, J. K., and Uriarte, M.: Hurricane-induced rainfall is a stronger predictor of tropical forest damage in Puerto Rico than maximum wind speeds, Sci. Rep., 10, 4318, https://doi.org/10.1038/s41598-020-61164-2, 2020.
Hanewinkel, M., Breidenbach, J., Neeff, T., and Kublin, E.: Seventy-seven years of natural disturbances in a mountain forest area – the influence of storm, snow, and insect damage analysed with a long-term time series, Can. J. Forest Res., 38, 2249–2261, https://doi.org/10.1139/x08-070, 2008.
Hanewinkel, M., Kuhn, T., Bugmann, H., Lanz, A., and Brang, P.: Vulnerability of uneven-aged forests to storm damage, Forestry, 87, 525–534, https://doi.org/10.1093/forestry/cpu008, 2014.
Hart, E., Sim, K., Kamimura, K., Meredieu, C., Guyon, D., and Gardiner, B.: Use of machine learning techniques to model wind damage to forests, Agr. Forest Meteorol., 265, 16–29, https://doi.org/10.1016/j.agrformet.2018.10.022, 2019.
Hersbach, H., Bell, B., Berrisford, P., Hirahara, S., Horányi, A., Muñoz-Sabater, J., Nicolas, J., Peubey, C., Radu, R., Schepers, D., Simmons, A., Soci, C., Abdalla, S., Abellan, X., Balsamo, G., Bechtold, P., Biavati, G., Bidlot, J., Bonavita, M., Chiara, G.D., Dahlgren, P., Dee, D., Diamantakis, M., Dragani, R., Flemming, J., Forbes, R., Fuentes, M., Geer, A., Haimberger, L., Healy, S., Hogan, R.J., Hólm, E., Janisková, M., Keeley, S., Laloyaux, P., Lopez, P., Lupu, C., Radnoti, G., de Rosnay, P., Rozum, I., Vamborg, F., Villaume, S., and Thépaut, J.-N.: The ERA5 global reanalysis, Q. J. Roy. Meteorol. Soc., 146, 1999–2049, https://doi.org/10.1002/qj.3803, 2020.
Hersbach, H., Bell, B., Berrisford, P., Biavati, G., Horányi, A., Muñoz Sabater, J., Nicolas, J., Peubey, C., Radu, R., Rozum, I., Schepers, D., Simmons, A., Soci, C., Dee, D., Thépaut, J-N.: ERA5 hourly data on single levels from 1940 to present, Copernicus Climate Change Service (C3S) Climate Data Store (CDS) [data set], https://doi.org/10.24381/cds.adbb2d47, 2023.
Jackson, T. D., Sethi, S., Dellwik, E., Angelou, N., Bunce, A., van Emmerik, T., Duperat, M., Ruel, J.-C., Wellpott, A., Van Bloem, S., Achim, A., Kane, B., Ciruzzi, D. M., Loheide II, S. P., James, K., Burcham, D., Moore, J., Schindler, D., Kolbe, S., Wiegmann, K., Rudnicki, M., Lieffers, V. J., Selker, J., Gougherty, A. V., Newson, T., Koeser, A., Miesbauer, J., Samelson, R., Wagner, J., Ambrose, A. R., Detter, A., Rust, S., Coomes, D., and Gardiner, B.: The motion of trees in the wind: a data synthesis, Biogeosciences, 18, 4059–4072, https://doi.org/10.5194/bg-18-4059-2021, 2021.
Jung, C. and Schindler, D.: Historical Winter Storm Atlas for Germany (GeWiSA), Atmosphere, 10, 387, https://doi.org/10.3390/atmos10070387, 2019.
Jung, C., Schindler, D., Albrecht, A., and Buchholz, A.: The role of highly-resolved gust speed in simulations of storm damage in forests at the landscape scale: A case study from southwest Germany, Atmosphere, 7, 1, https://doi.org/10.3390/atmos7010007, 2016.
Kabir, E., Guikema, S., and Kane, B.: Statistical modeling of tree failures during storms, Reliab. Eng. Syst. Safe., 177, 68–79, https://doi.org/10.1016/j.ress.2018.04.026, 2018.
Kadow, C., Illing, S., Lucio-Eceiza, E. E., Bergemann, M., Ramadoss, M., Sommer, P. S., Kunst, O., Schartner, T., Pankatz, K., Grieger, J., Schuster, M., Richling, A., Thiemann, H., Kirchner, I., Rust, H. W., Ludwig, T., Cubasch, U., and Ulbrich, U.: Introduction to Freva – A Free Evaluation System Framework for Earth System Modeling, J. Open Res. Softw., 9, 13, https://doi.org/10.5334/jors.253, 2021.
Kamimura, K., Gardiner, B., Dupont, S., Guyon, D., and Meredieu, C.: Mechanistic and statistical approaches to predicting wind damage to individual maritime pine (Pinus pinaster) trees in forests, Can. J. For. Res., 46, 88–100, https://doi.org/10.1139/cjfr-2015-0237, 2016.
Kamimura, K., Kitagawa, K., Saito, S., and Mizunaga, H.: Root anchorage of hinoki (Chamaecyparis obtuse (Sieb. Et Zucc.) Endl.) under the combined loading of wind and rapidly supplied water on soil: analyses based on tree-pulling experiments, Eur. J. Forest Res., 131, 219–227, https://doi.org/10.1007/s10342-011-0508-2, 2012.
Kamimura, K., Nanko, K., Matsumoto, A., Ueno, S., Gardiner, J., and Gardiner, B.: Tree dynamic response and survival in a category-5 tropical cyclone: The case of super typhoon Trami, Sci. Adv., 8, 11, https://doi.org/10.1126/sciadv.abm7891, 2022.
Kamo, K.-I., Konoshima, M., and Yoshimoto, A.: Statistical Analysis of Tree-Forest Damage by Snow and Wind:Logistic Regression Model for Tree damage and Cox Regression for Tree Survival, FORMATH, 15, 44–55, https://doi.org/10.15684/formath.15.005, 2016.
Kannenberg, S. A., Schwalm, C. R., and Anderegg, W. R. L.: Ghosts of the past: how drought legacy effects shape forest functioning and carbon cycling, Eco. Lett., 23, 891–901, https://doi.org/10.1111/ele.13485, 2020.
Klein, T., Cahanovitc, R., Sprintsin, M., Herr, N., and Schiller, G.: A nation-wide analysis of tree mortality under climate change: Forest loss and its causes in Israel 1948–2017, Forest Ecol. Manage., 432, 840-849, https://doi.org/10.1016/j.foreco.2018.10.020, 2019.
Koks, E. E., Rozenberg, J., Zorn, C., Tariverdi, M., Vousdoukas, M., Fraser, S. A., Hall, J. W., and Hallegatte, S.: A global multi-hazard risk analysis of road and railway infrastructure assets, Nat. Commun., 10, 11, https://doi.org/10.1038/s41467-019-10442-3, 2019.
Kouki, K., Luojus, K., and Riihelä, A.: Evaluation of snow cover properties in ERA5 and ERA5-Land with several satellite-based datasets in the Northern Hemisphere in spring 1982–2018, The Cryosphere, 17, 5007–5026, https://doi.org/10.5194/tc-17-5007-2023, 2023.
Kučera, M. and Dobesova, Z.: Analysis of the Degree of Threat to Railway Infrastructure by Falling Tree Vegetation, ISPRS Int. J. Geo-Info., 10, 292, https://doi.org/10.3390/ijgi10050292, 2021.
Lehtonen, I., Venäläinen, A., Kämäräinen, M., Asikainen, A., Laitila, J., Anttila, P., and Peltola, H.: Projected decrease in wintertime bearing capacity on different forest and soil types in Finland under a warming climate, Hydrol. Earth Syst. Sci., 23, 1611–1631, https://doi.org/10.5194/hess-23-1611-2019, 2019.
MacKenzie, D. I., Nichols, J. D., Royle, J. A., Pollock, K. H., Bailey, L. L. and Hines, J. E.: Chapter 3 – Fundamental Principals of Statistical Inference. in: Occupancy Estimation and Modeling (Second Edition), editd by: MacKenzie, D. I., Nichols, J. D., Royle, J. A., Pollock, K. H., Bailey, L. L., and Hines, J. E., Elsevier, 71–111 pp., https://doi.org/10.1016/b978-0-12-407197-1.00004-1, 2018.
Maringer, J., Stelzer, A.-S., Paul, C., and Albrecht, A.T.: Ninety-five years of observed disturbance-based tree mortality modeled with climate-sensitive accelerated failure time models, Eur. J. Forest Res., 140, 255–272, https://doi.org/10.1007/s10342-020-01328-x, 2020.
Mayer, P., Brang, P., Dobbertin, M., Hallenbarter, D., Renaud, J.-P., Walthert, L., and Zimmermann, S.: Forest storm damage is more frequent on acidic soils, Ann. For. Sci., 62, 303–311, https://doi.org/10.1051/forest:2005025, 2005.
McCullagh, P. and Nelder, J. A.: Generalized Linear Models, Chapman and Hall, London, 532, https://doi.org/10.1007/978-1-4899-3242-6, ISBN 9781489932426, 1989.
Meßenzehl, K.: Das Naturgefahrenmanagement der DB Netz AG, Deine Bahn, 10/2019, 16–22, 2019.
Minola, L., Zhang, F., Azorin-Molina, C., Pirooz, A. A. S., Flay, R. G. J., Hersbach, H., and Chen, D.: Near-surface mean and gust wind speeds in ERA5 across Sweden: towards an improved gust parametrization, Clim. Dynam., 55, 887–907, https://doi.org/10.1007/s00382-020-05302-6, 2020.
Mitchell, S. J.: Wind as a natural disturbance agent in forests: a synthesis, Forestry, 86, 147–157, https://doi.org/10.1093/forestry/cps058, 2013.
Mohr, S., Kunz, M., Richter, A., and Ruck, B.: Statistical characteristics of convective wind gusts in Germany, Nat. Hazards Earth Syst. Sci., 17, 957–969, https://doi.org/10.5194/nhess-17-957-2017, 2017.
Molina, M. O., Gutiérrez, C., and Sánchez, E.: Comparison of ERA surface wind speed climatologies over Europe with observations from the HadISD dataset, Int. J. Climatol., 41, 4864–4878, https://doi.org/10.1002/joc.7103, 2021.
Morimoto, J., Nakagawa, K., Takano, K. T., Aiba, M., Oguro, M., Furukawa, Y., Mishima, Y., Ogawa, K., Ito, R., Takemi, T., Nakamura, F., and Peterson, C. J.: Comparison of vulnerability to catastrophic wind between Abies plantation forests and natural mixed forests in northern Japan, Forestry: An Int. J. Forest Res., 92, 436–443, https://doi.org/10.1093/forestry/cpy045, 2019.
Neild, S. and Wood, C.: Estimating stem and root-anchorage flexibility in trees, Tree Physiol., 19, 141–151, 1999.
Pardowitz, T., Osinski, R., Kruschke, T., and Ulbrich, U.: An analysis of uncertainties and skill in forecasts of winter storm losses, Nat. Hazards Earth Syst. Sci., 16, 2391–2402, https://doi.org/10.5194/nhess-16-2391-2016, 2016.
Pasztor, F., Matulla, C., Zuvela-Aloise, M., Rammer, W., and Lexer, M. J.: Developing predictive models of wind damage in Austrian forests, Ann. Forest Sci., 72, 289–301, https://doi.org/10.1007/s13595-014-0386-0, 2015.
Peltola, H., Kellomäki, S., Hassinen, A., and Granander, M.: Mechanical stability of Scots pine, Norway spruce and birch: an analysis of tree-pulling experiments in Finland, Forest Ecol. Manage., 135, 143–153, https://doi.org/10.1016/s0378-1127(00)00306-6, 2000.
Prahl, B. F., Rybski, D., Burghoff, O., and Kropp, J. P.: Comparison of storm damage functions and their performance, Nat. Hazards Earth Syst. Sci., 15, 769–788, https://doi.org/10.5194/nhess-15-769-2015, 2015.
Primo, C.: Wind gust warning verification, Adv. Sci. Res., 13, 113–120, https://doi.org/10.5194/asr-13-113-2016, 2016.
Quine, C. P., Gardiner, B. A., and Moore, J.: Wind disturbance in forests: The process of wind created gaps, tree overturning, and stem breakage, in: Plant Disturbance Ecology, editd by: Johnson, E. A. and Miyanishi, K., Elsevier, 117–184, https://doi.org/10.1016/b978-0-12-818813-2.00004-6, 2021.
Schelhaas, M., Kramer, K., Peltola, H., van der Werf, D., and Wijdeven, S.: Introducing tree interactions in wind damage simulation, Ecol. Modell., 207, 197–209, https://doi.org/10.1016/j.ecolmodel.2007.04.025, 2007.
Schindler, D., Grebhan, K., Albrecht, A., and Schönborn, J.: Modelling the wind damage probability in forests in Southwestern Germany for the 1999 winter storm `Lothar', Int. J. Biometeorol., 53, 543–554, https://doi.org/10.1007/s00484-009-0242-3, 2009.
Schindler, D. and Kolbe, S.: Assessment of the Response of a Scots Pine Tree to Effective Wind Loading, Forests, 11, 145, https://doi.org/10.3390/f11020145, 2020.
Schmidt, M., Hanewinkel, M., Kändler, G., Kublin, E., and Kohnle, U.: An inventory-based approach for modeling single-tree storm damage – experiences with the winter storm of 1999 in southwestern Germany, Can. J. For. Res., 40, 1636–1652, https://doi.org/10.1139/X10-099, 2010.
Schulz, B. and Lerch, S.: Machine Learning Methods for Postprocessing Ensemble Forecasts of Wind Gusts: A Systematic Comparison, Mon. Weather Rev., 150, 235–257, https://doi.org/10.1175/mwr-d-21-0150.1, 2022.
Schulzweida, U.: CDO User Guide, 251, Zenodo, https://doi.org/10.5281/ZENODO.10020800, 2023.
Seidl, R., Rammer, W., and Blennow, K.: Simulating wind disturbance impacts on forest landscapes: Tree-level heterogeneity matters, Environ. Modell. Softw., 51, 1–11, https://doi.org/10.1016/j.envsoft.2013.09.018, 2014.
Sheather, S.: A Modern Approach to Regression with R. Springer Science + Business Media, LLC, New York, 397, https://doi.org/10.1007/978-0-387-09608-7, ISBN 9780387096087, 2009.
Singh, V. V., Naseer, A., Mogilicherla, K., Trubin, A., Zabihi, K., Roy, A., and Erbilgin, N.: Understanding bark beetle outbreaks: exploring the impact of changing temperature regimes, droughts, forest structure, and prospects for future forest pest management, Rev. Environ. Sci. Biotechnol., 23, 257–290, https://doi.org/10.1007/s11157-024-09679-w, 2024.
Stadelmann, G., Bugmann, H., Wermelinger, B., and Bigler, C.: Spatial interactions between storm damage and subsequent infestations by the European spruce bark beetle, Forest Ecol. Manage., 318, 167–174, https://doi.org/10.1016/j.foreco.2014.01.022, 2014.
Sterken, P.: On trees and wind turbines, Arboricul. J., 43, 235–248, https://doi.org/10.1080/03071375.2021.1903239, 2021.
Sulik, S. and Kejna, M.: The origin and course of severe thunderstorm outbreaks in Poland on 10 and 11 August, 2017, B. Geography. Phys. Geogr. Ser., 18, 25–39, https://doi.org/10.2478/bgeo-2020-0003, 2020.
Suvanto, S., Henttonen, H. M., Nöjd, P., and Mäkinen, H.: Forest susceptibility to storm damage is affected by similar factors regardless of storm type: Comparison of thunder storms and autumn extra-tropical cyclones in Finland, Forest Ecol. Manage., 381, 17–28, https://doi.org/10.1016/j.foreco.2016.09.005, 2016.
Szymczak, S., Bott, F., Babeck, P., Frick, A., Stöckigt, B., and Wagner, K.: Estimating the hazard of tree fall along railway lines: a new GIS tool, Nat. Hazards, 112, 2237–2258, https://doi.org/10.1007/s11069-022-05263-5, 2022.
Temperli, C., Bugmann, H., and Elkin, C.: Cross-scale interactions among bark beetles, climate change, and wind disturbances: a landscape modeling approach, Ecol. Monogr., 83, 383–402, https://doi.org/10.1890/12-1503.1, 2013.
Tervo, R., Láng, I., Jung, A., and Mäkelä, A.: Predicting power outages caused by extratropical storms, Nat. Hazards Earth Syst. Sci., 21, 607–627, https://doi.org/10.5194/nhess-21-607-2021, 2021.
Valta, H., Lehtonen, I., Laurila, T. K., Venäläinen, A., Laapas, M., and Gregow, H.: Communicating the amount of windstorm induced forest damage by the maximum wind gust speed in Finland, Adv. Sci. Res., 16, 31–37, https://doi.org/10.5194/asr-16-31-2019, 2019.
Venäläinen, A., Lehtonen, I., Laapas, M., Ruosteenoja, K., Tikkanen, O., Viiri, H., Ikonen, V., and Peltola, H.: Climate change induces multiple risks to boreal forests and forestry in Finland: A literature review, Global Change Biol., 26, 4178–4196, https://doi.org/10.1111/gcb.15183, 2020.
Wilks, D. S.: Statistical methods in the atmospheric sciences, Elsevier, Oxford, 704, https://doi.org/10.1016/C2017-0-03921-6, ISBN 9780123850225, 2011.
Wohlgemuth, T., Hanewinkel, M., and Seidl, R.: Wind Disturbances. in: Disturbance Ecology, editd by: Wohlgemuth, T., Jentsch, A., and Seidl, R., Springer International Publishing, 173–194, https://doi.org/10.1007/978-3-030-98756-5_8, 2022.
Zeppenfeld, T., Jung, C., Schindler, D., Sennhenn-Reulen, H., Ipsen, M. J., and Schmidt, M.: Winter storm risk assessment in forests with high resolution gust speed data, Eur. J. Forest Res., 142, 1045–1058, https://doi.org/10.1007/s10342-023-01575-8, 2023.
Zubkov, P., Gardiner, B., Nygaard, B. E., Guttu, S., Solberg, S., and Eid, T.: Predicting snow damage in conifer forests using a mechanistic snow damage model and high-resolution snow accumulation data, Scan. J. Forest Res., 39, 59–75, https://doi.org/10.1080/02827581.2023.2289660, 2023.
Zweifel, R., Etzold, S., Sterck, F., Gessler, A., Anfodillo, T., Mencuccini, M., von Arx, G., Lazzarin, M., Haeni, M., Feichtinger, L., Meusburger, K., Knuesel, S., Walthert, L., Salmon, Y., Bose, A.K., Schoenbeck, L., Hug, C., Girardi, N. D., Giuggiola, A., Schaub, M., and Rigling, A.: Determinants of legacy effects in pine trees – implications from an irrigation-stop experiment, New Phytol., 227, 1081–1096, https://doi.org/10.1111/nph.16582, 2020.