the Creative Commons Attribution 4.0 License.
the Creative Commons Attribution 4.0 License.
 | 13 May 2025
Classifying extratropical cyclones and their impact on Finland's electricity grid: insights from 92 damaging windstorms
Ilona Láng-Ritter
Terhi Kristiina Laurila
Antti Mäkelä
Hilppa Gregow
Victoria Anne Sinclair
This study investigates the impacts of extratropical cyclones on Finland's electricity grids, focusing on 92 significant windstorms from 2005 to 2018. We present a classification method for extratropical cyclones based on the arrival location and direction. Rather than using meteorological criteria to identify windstorms, we select them based on their impacts, namely the number of power outages, to reach a more targeted understanding of windstorm impacts compared to traditional approaches. Key findings indicate that south-west-originating windstorms cause the most damage in total, while north-westerly windstorms individually lead to the highest average outages. The largest impacts occur when a windstorm moves across the northern part of the country, from the north-west to east, with the strongest wind gusts concentrated on the southern side of the low-pressure centre, in highly populated regions. Of the meteorological characteristics of windstorms, the most relevant for grid damage besides the wind gust speed are the extent and spatial distribution of wind gusts. The seasonal analysis shows that windstorms are more frequent and damaging in autumn and winter, but even weaker wind speeds during summer can cause significant damage. Factors such as soil frost influence the severity of windstorm damage, highlighting the importance of expanding research to include environmental and geographical aspects.
- Article
(5868 KB) - Full-text XML
- Companion paper
- BibTeX
- EndNote


Extratropical cyclones are among the most significant natural hazards in the mid-latitudes, driving daily weather fluctuations and potentially causing substantial impacts (Browning, 2004). These large-scale, low-pressure systems, associated with fronts where cold and warm air masses meet, can become particularly impactful if they intensify into windstorms. Intense extratropical cyclones pose considerable risks to society (Wernli et al., 2002) and forests (Schelhaas et al., 2003; Schelhaas, 2008), particularly due to extreme winds, which notably impact critical infrastructure such as power distribution networks. Disruptions to distribution grids can lead to widespread power outages, significantly impacting residences and essential services (Panteli and Mancarella, 2017).
Climate change is expected to influence the frequency and characteristics of extratropical cyclones and windstorms. Although projections for wind speeds associated with extratropical cyclones remain uncertain (Christensen et al., 2013; Masson-Delmotte et al., 2018; Priestley and Catto, 2022), some trends are generally agreed upon. The total number of extratropical cyclones is expected to slightly decrease (Bengtsson et al., 2006; Catto et al., 2011; Zappa et al., 2013; Chang et al., 2013; Sinclair et al., 2020), and while the mean intensity of extratropical cyclones is not anticipated to change significantly, the most extreme cyclones are expected to become even more extreme (Bengtsson et al., 2006; Ulbrich et al., 2009; Zappa et al., 2013). In Finland and northern Europe, the climate projections suggest only minimal changes in mean (Ruosteenoja and Jylhä, 2022) and extreme wind speeds, with a slight increase of up to 2.5 % in extreme winds during autumn by the late 21st century (Ruosteenoja et al., 2019). While the overall windstorm and wind climate in Finland and northern Europe may not change significantly, the potential for damaging windstorms could still increase. This is due to factors such as the expansion of areas impacted by intense winds during extreme windstorms by up to 40 % (Priestley and Catto, 2022) and an increase in cyclone wind speeds near the warm sector by up to 3.5 m s−1 (Sinclair et al., 2020). Additionally, climate change is expected to intensify tropical cyclones and shift them eastward, increasing the risk that they can undergo extratropical transition and impact northern Europe more frequently than before (Haarsma, 2021).
Extratropical cyclones have been the focus of various classification efforts based on meteorological features. Classifications can help explain the physical mechanisms driving societal impacts (Catto, 2016). Early methods relied on simple conceptual models based on cyclone structure (e.g. Bjerknes and Solberg, 1922; Shapiro and Keyser, 1990) or life cycle characteristics. The most common approaches classify cyclones by their intensity, with studies using metrics such as the maximum 850 hPa relative vorticity or the minimum mean sea level pressure (MSLP) (Catto et al., 2010; Sinclair et al., 2020) or rapid deepening rates (e.g. a 24 h pressure drop, also known as meteorological bombs; Sanders and Gyakum, 1980). A recent analysis classified cyclones into clusters based on multiple intensity measures – 850 hPa vorticity, wind speed, wind footprint, precipitation and a storm severity index – highlighting variability in intensity and life cycle characteristics (Cornér et al., 2025). Other classifications focus on cyclone origins, such as transitioning cyclones (Klein et al., 2000), Mediterranean cyclones (Campins et al., 2000) or polar lows (Rasmussen and Turner, 2003). Since wind is often the most damaging feature of extratropical cyclones, classifications have utilised statistical methods to define extreme events based on high wind gust percentiles (90th, 98th or 99.5th) (Laurila et al., 2021a; Klawa and Ulbrich, 2003; Nissen et al., 2010). Societal impact assessments are typically conducted following the meteorological classification of hazards (e.g. Klawa and Ulbrich, 2003). However, studies rarely classify or filter events primarily based on their societal impacts, which can result in the most critical aspect being overlooked: the societal consequences.
The IPCC risk framework (Oppenheimer et al., 2014) describes how the physical climate hazard, exposure and vulnerability interact to produce risk. Power transmission and distribution networks, especially in regions with overhead lines, are highly vulnerable to windstorms. The risk of windstorms is widely present in Europe, with over 10×106 km of power lines (Rullaud and Gruber, 2019), and windstorms indeed often cause significant outages, particularly in low- and medium-voltage regional grids. In forested regions such as Finland, where 70 % of the land is covered by forest (Venäläinen et al., 2020), the risk of power outages is common due to trees falling on power lines. For example, 46 % of transmission faults in Finland from 2010 to 2018 were due to windstorms, with peak years reaching 69 % (Tervo et al., 2021). Measures like underground cabling and the relocation of lines are being increasingly implemented to mitigate the risk and improve resilience, though they come at high costs (Nurmi et al., 2019). Balancing effective adaptation with cost efficiency is essential for mitigating outage risks (Jasiūnas et al., 2023a).
This study examines the impacts of extratropical cyclones and windstorms on Finland's electricity grids between 2005 and 2018. Out of the 3304 extratropical cyclones examined, 92 are considered significant windstorms due to having caused at least 50 000 power outages (Sect. 3.2). We aim to provide a more targeted understanding of windstorm impacts compared to traditional classifications based purely on meteorological parameters. The long-term goal is to enhance preparedness for future windstorms, identify what types of storms result in the most damage, and offer guidance for electric grid resilience and emergency response planning in Finland or similar regions. We address these objectives by developing a novel classification for all extratropical cyclones and windstorms based on their arrival location and direction as well as the climatological locations of the strongest wind gusts and by identifying windstorms through their impact (power outages) rather than solely through meteorological features. Furthermore, we compare the meteorological characteristics of windstorms to extratropical cyclones, determine windstorm-related meteorological properties (e.g. minimum MSLP), and quantify how the impacts vary depending on the type of windstorm and its meteorological characteristics. We further investigate how the impacts vary by region and season.
The paper is structured as follows: Sect. 2 introduces the meteorological and power outage data; Sect. 3 outlines the methodology for classifying and tracking windstorms; Sect. 4 presents the results, showing windstorm class characteristics, impacts on the power grid and the seasonality of damaging windstorms; and Sect. 5 concludes the study.
2.1 Meteorological data: wind gust observations and ERA5 reanalysis
In this section, we describe the wind gust observations and ERA5 reanalysis data used to identify typical characteristics of extratropical cyclones and windstorms. We utilised multiple data sources to better understand the relationship between wind gusts and windstorm impacts in Finland.
The SYNOP (surface synoptic observation) data of the Finnish Meteorological Institute (Finnish Meteorological Institute, 2020) are quality-controlled meteorological measurements, and we utilised 10 m wind gusts from 180 observation stations for the period 2005–2018. The wind gust observations are used in Sect. 4.4.1 to examine the most significant factors affecting the electrical grid by analysing the correlation between key electrical grid parameters and meteorological wind gust data.
ERA5 reanalysis (Hersbach et al., 2020) is the latest reanalysis (i.e. combination of weather observations and past short-term forecasts; ECMWF, 2020) produced by the European Centre for Medium Range Weather Forecasts (ECMWF). It has a horizontal resolution of 31 km and 137 vertical levels, with the top level at approximately 80 km altitude. The meteorological parameters included in ERA5 are available at hourly resolution from 1940 to the present. In this study, we use the mean sea level pressure (hereafter MSLP) and maximum wind gust (maximum 3 s wind at 10 m height) since these parameters are often referred to as a measure of the intensity of an extratropical cyclone. The 3 s wind gust is computed at every model time step (12 min), and the maximum value since the last post-processing period is output. In ERA5, the post-processing period is 1 h, and thus we obtain the maximum 3 s wind gust that occurred in the previous 1 h (ECMWF, 2022). Maximum wind gusts are a dominant factor for wind impacts: trees tend to fall (uproot or break) especially due to turbulence and wind gusts of extratropical cyclones, contributing significantly to forest damage and electrical grid failures in forested areas (Gardiner et al., 2013).
ERA5 reanalysis provides a spatially uniform dataset compared to the in situ weather observations. The wind gusts in ERA5 are parametrised and calculated as a sum of three terms: 10 m wind speed, the turbulent gust term and the convective gust term (ECMWF, 2016). Ramon et al. (2019) evaluated ERA5 wind speeds on daily, seasonal and decadal scales, comparing wind observations from 77 globally placed tall-tower sites with reanalysis wind speeds, and discovered that ERA5 provides the best correlation with the observed wind speeds, especially on the daily scale. ERA5 demonstrates good performance in wind and gust analyses but has certain biases. It tends to overestimate low wind speeds while underestimating high winds, with wind gusts frequently being underestimated (Chen et al., 2024). The accuracy of ERA5 varies by region, performing better offshore than onshore and facing challenges in mountainous areas (Minola et al., 2020). Ongoing (unpublished) work at the Finnish Meteorological Institute has compared ERA5 10 m winds and wind gusts to observations and found that results in Finland are largely similar to those reported by Minola et al. (2020) for Sweden: weak winds are overestimated, while high winds and gusts are underestimated. Additionally, land cover influences wind speed estimates, with overestimations over forests and underestimations over grasslands and deserts (Shestakova et al., 2024). Thus, although ERA5 has been shown to overestimate surface wind gust speeds in some areas (ECMWF, 2019), these regions are outside the domain of this study. ERA5 is a viable alternative to in situ observations of wind gusts since it provides a spatially uniform dataset covering a longer period in higher temporal resolution than wind gust observations. Moreover, wind gust observations can be inhomogeneous due to the differences in measurement instruments, observation frequencies or observation station locations (Feser et al., 2015). In Finland, for example, Laapas and Venäläinen (2017) homogenised wind observations with statistical tools and found that up to 95 % of the analysed wind speed time series were inhomogeneous. In this paper, we use ERA5 wind parameters for defining characteristics of extratropical cyclones and windstorms in Sect. 4.2. By combining reanalysis and observations, we aim to capture both the broad-scale atmospheric conditions and localised variations that influence windstorm impacts in Finland.
2.2 Impact data: power outages
In this section we describe the power outage data, which were used to connect the impacts with the meteorological features of the windstorms and extratropical cyclones. The analysis period was determined by the temporal coverage of the power outage data: a 14-year period from 2005 to 2018. The outage data in Finland are recorded by multiple independent distribution system operators (hereafter DSOs). The scattered outage data are collected and merged at the national level for further yearly statistical analysis by the consulting company ENEASE Oy (Anssi Seppälä ENEASE Oy, personal communication, 6 April 2017). Finally, the yearly statistics are published by Finnish Energy (2021), which is the union of the DSOs. ENEASE Oy and Finnish Energy can share data with third parties as long as the identity of the DSOs is not revealed. To ensure anonymity and fair competition for the companies, the outage data are provided as aggregates for areas comprising a minimum of six DSOs, shown in Fig. 1. This aggregation results in the data being provided for five geographical areas that are based on the operating areas of the DSOs and the boundaries of the provinces of Finland. The dataset has also been previously utilised by Tervo et al. (2021), Jasiūnas et al. (2023a, b, 2024) and Haakana et al. (2024) to develop impact models to predict power outages induced by extratropical cyclones and to investigate the resilience of the electricity distribution system.
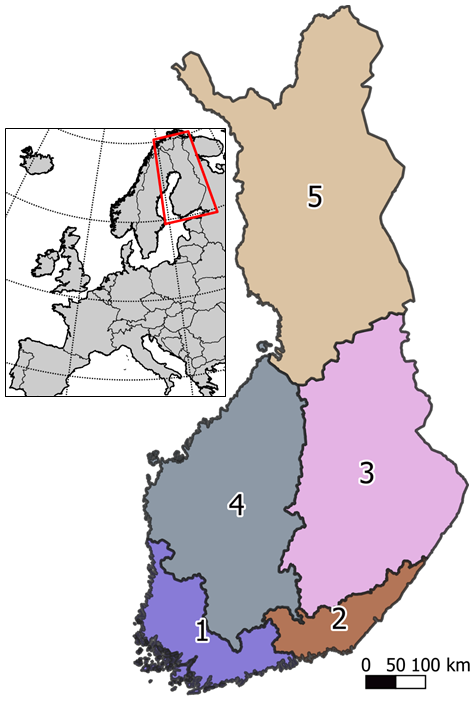
Figure 1The aggregation regions of the power outage dataset. Later, when we refer to regions 1–5, we call them as follows. Area 1: south-western region (including the capital Helsinki); area 2: south-eastern region; area 3: eastern region; area 4: western region; and area 5: northern region.
Each power outage in the outage dataset is labelled according to its most plausible cause. The original dataset contains labels for meteorological causes, such as “thunder”, “snow load” or “wind and storm”, but non-meteorological causes like “animals” or “unknown” are also included. The cause labels are assigned by the engineers repairing the faults in the field and can therefore contain occasional errors, e.g. mistaking the cause “wind and storm” for the cause “thunder”.
Among the impact attributes recorded in the dataset, we focus on the following two categories: number of delivery points without electricity (hereafter NDP) and faults. NDP represents roughly the number of households without electricity, and “faults” describe the number of faults in the electrical grid. One fault in a critical place of the grid structure can result in power cuts in several households. We consider NDP to be more relevant and meaningful than faults for scientists and forecasters and therefore mainly use this category in our analysis. However, the total number of faults may be a more important measure of impacts for DSOs. Therefore we include them in the correlation analysis, in Sect. 4.4.1.
The original outage data consist of a total of 581 430 faults (number of data rows) for the period 2005–2018. We have removed duplicates, faults with unrealistic duration and time values (negative duration or non-existing dates), and empty data entries, resulting in a total of 571 634 faults. Among these, the number of faults labelled with the cause “wind and storm” is 238 869, representing 42 % of the filtered faults. The NDP in the “wind and storm” category was 31 121 052.
To strengthen the understanding of the dependency between windstorms and their impacts, we developed a novel classification method for extratropical cyclones, based on their propagation track and arrival location in the area of interest and on the related impacts. In the following subsections we describe the three steps of the method in detail: (1) identifying the extratropical cyclone tracks and characteristics (Sect. 3.1), (2) identifying the most impactful windstorms based on power outages (Sect. 3.2), (3) classifying the extratropical cyclones and windstorms (Sect. 3.3).
3.1 Extratropical cyclone tracking and characteristics
An extratropical cyclone track consists of the latitude and longitude coordinates of the low-pressure centre at each point along its propagation route. In this study, the extratropical cyclone tracking was performed by applying the TRACK method (Hodges, 1994, 1995, 1999) to the ERA5 MSLP data from 2005–2018. We tracked all extratropical cyclones in the Northern Hemisphere based on the localised minimum MSLP at 3 h temporal resolution and regridded to T63 resolution (around 180 km). The interpolation to coarser resolution was made to reduce noise in the MSLP fields and to only select synoptic-scale extratropical cyclones. From these tracks, we first excluded short-lived (lifetime of less than 1 d) and stationary (moving less than 500 km during their lifetime) tracks. Second, we found the value of the native, i.e. high-resolution, MSLP at each point along each track. Third, we identified the maximum 10 m wind gust at the native resolution within a 6° geodesic radius of the cyclone centre. The 6° radius was chosen as Laurila et al. (2021a) found that the maximum wind gusts associated with windstorms are commonly observed within that radius. To narrow down the number of considered extratropical cyclones to those potentially affecting Finland, we only retain the tracks that passed through the domain of 50–75° N, 0–60° E. This resulted in a total number of 3304 extratropical cyclones in the 14-year period.
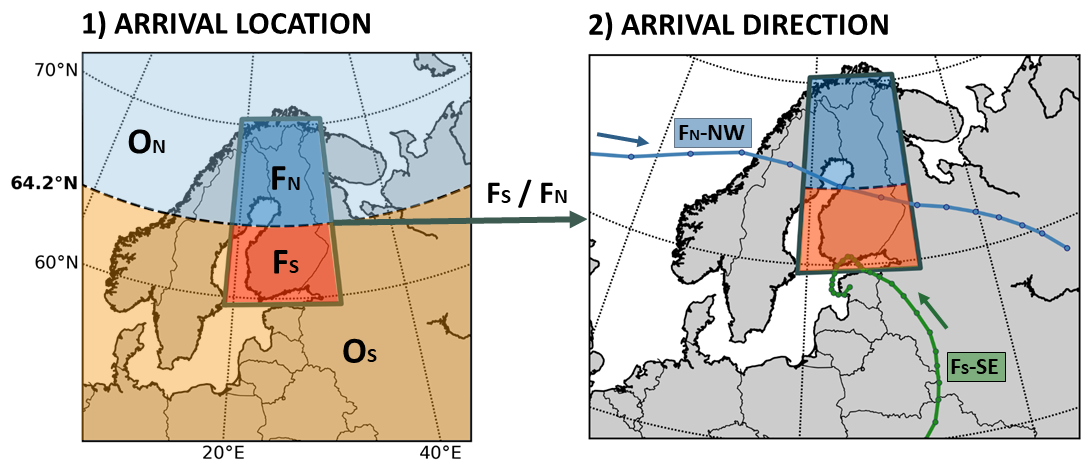
Figure 2The two steps of the extratropical cyclone classification method. (1) The first part of the class name is defined according to the arrival location of the extratropical cyclone. If the low-pressure centre does not pass directly over Finland at all, it is classified as class O (outside of Finland but inside of the 50–75° N, 0–60° E, box). The O-class extratropical cyclone gets an additional letter N (north, light-blue area) or S (south, orange area) depending on which side of the latitudinal centre (64.2° N) of Finland the storm arrives from. If the extratropical cyclone passes over Finland, it is classified as class FN (northern Finland, dark-blue box) or class FS (southern Finland, red box) according to which box it entered first. (2) In the second part of the classification, FN and FS extratropical cyclones are further classified based on their arrival direction. The arrival direction is calculated as an average of 3 h propagation directions over the previous 12 h of the extratropical cyclone track before entering the box. Thus, 0–90° is classified as the NE class, 90–180° as the SE class, 180–270° as the SW class and 270–360° as the NW class.
After identifying the extratropical cyclone tracks, various meteorological characteristics were derived from ERA5 data. The lifetime of each extratropical cyclone was calculated over its entire track, whereas the minimum MSLP, mean propagation speed, maximum deepening rate, maximum wind gusts and percentage of ERA5 grid cells exceeding 21 m s−1 (the official storm definition in Finland is when the 10 min average wind speed exceeds 21 m s−1; FMI, 2022) were calculated only inside the Finnish domain (i.e. the red box in Fig. 1). The mean propagation speed of each extratropical cyclone was obtained by averaging the propagation speeds of all time steps. The deepening rate describes how the minimum MSLP of the track changes in time, and it can be either negative (cyclone is deepening) or positive (cyclone is decaying). We calculated the deepening rate for each 3 h time interval separately and then defined the maximum deepening rate to be the biggest negative change in MSLP in 3 h. The percentage of ERA5 grid cells (31 km × 31 km) with wind gusts exceeding 21 m s−1 was calculated by defining a percentage of how many grids inside the domain of Finland have gust values exceeding 21 m s−1 while the track is inside the domain of Finland (59.5–70.1° N, 20.0–31.4° E; i.e. the rectangle box in Figs. 1 and 2).
3.2 Identifying the most impactful extratropical cyclones based on power outages
In this study, we are especially interested in the most impactful extratropical cyclones (i.e. windstorms). Due to the high temporal resolution of the power outage data (1 s; see Sect. 2.2), it is relatively straightforward to connect the power outages to specific meteorological events (e.g. wide power outage cases caused by extratropical cyclones). We further filtered the “wind and storm”-related outages to retain only those occurring on days when the overall NDP exceeded 50 000. Using this impact-based threshold to filter the windstorms, we were able to identify 119 d with the highest reported impacts. We further validated these 119 d date by date, ultimately excluding 17 dates where (1) the same windstorm caused power cuts during 2 consecutive days, (2) no extratropical cyclone tracks were found within the defined area (50–75° N, 0–60° E), or (3) outages were caused by a small-scale convective storm. In the case of (1), we retain the date that had the largest NDP. This resulted in 92 extratropical cyclone cases, which are referred to throughout this document as “windstorms” to be investigated more thoroughly in this study.
3.3 Extratropical cyclone classification
In this section we describe the classification that is applied to all extratropical cyclones (including windstorms). The extratropical cyclone classification consists of two main steps: the cyclones are classified based on their (1) arrival location in and (2) arrival direction to Finland.
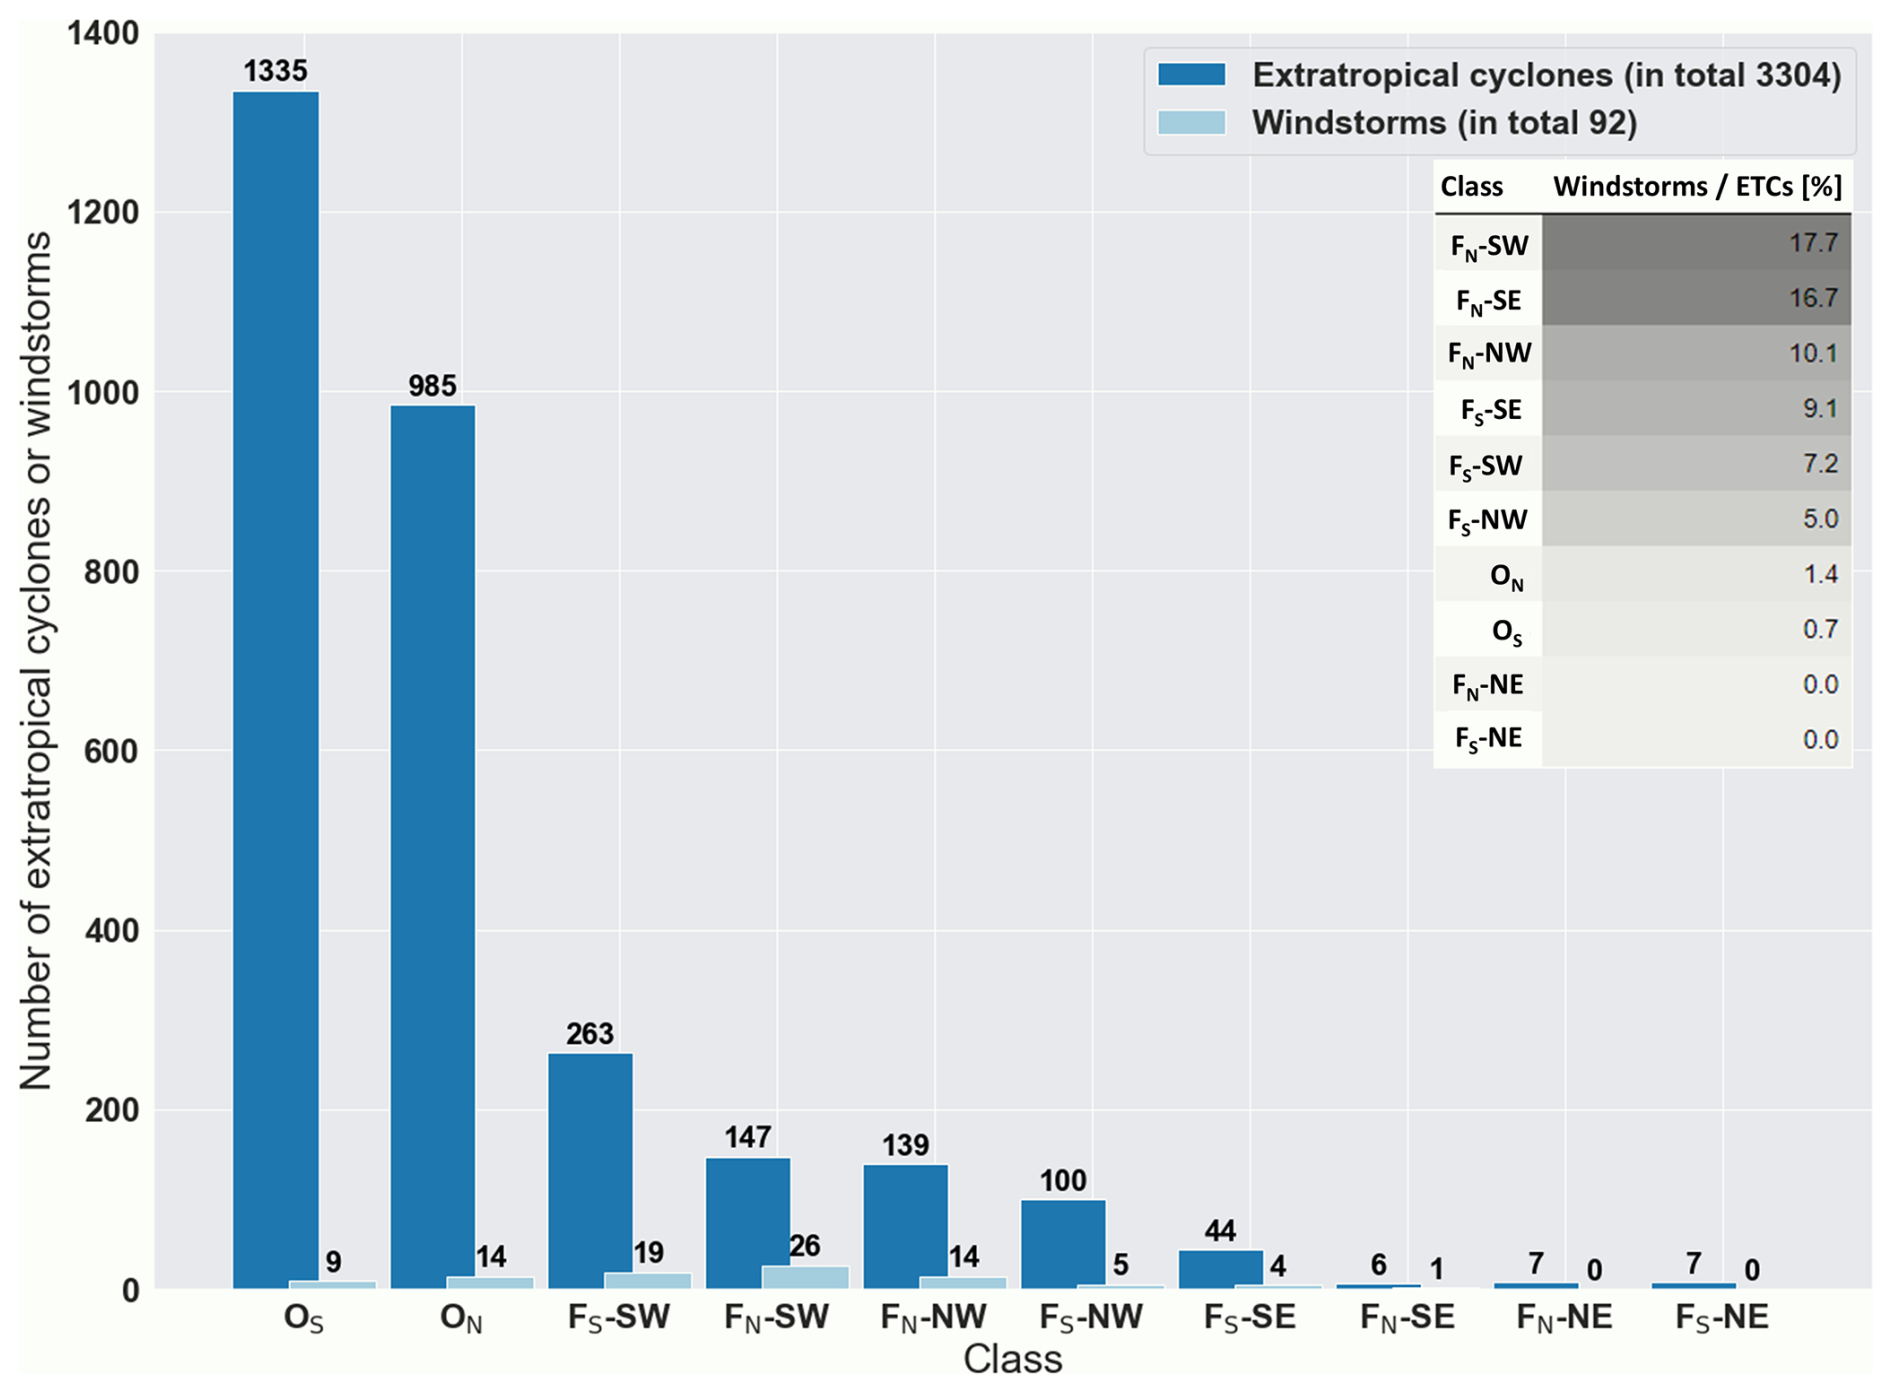
Figure 3Number of all extratropical cyclones and windstorms (2005–2018) and the share of windstorms of the total number of extratropical cyclones in each class. Light-blue bars represent the total number of all extratropical cyclones and dark-blue bars the windstorms (extratropical cyclones causing at least 50 000 delivery points without electricity) within the domain of Finland (50–75° N, 0–60° E).
Rather than using real geographical borders, we defined the domain of Finland within 59.5–70.1° N, 20.0–31.4° E (i.e. the box rectangle in Figs. 1 and 2). First, we identify whether the centre of the extratropical cyclone passes over southern (class FS) or northern Finland (class FN) or whether it does not pass directly across Finland at all (class O, outside of Finland but inside of the 50–75° N, 0–60° E, box). Class FS contains cyclones whose low-pressure centres are located south of the latitudinal centre of Finland (64.2° N; Fig. 2) and class FN the ones north of this line. If a cyclone passes over both the southern and northern Finland boxes, it is classified based on the area it enters first. To further classify the class O cases, we first found the closest coordinate of the cyclone track in comparison to the longitudinal centre of the Finland domain (25° E). Then, we checked whether the latitude of the storm track at that point is north or south of the latitudinal centre of Finland (64.2° N) and defined an additional definition as class ON for northerly and class OS for southerly cyclones. For example, an extratropical cyclone that never passes through the domain of Finland and is located farther north than 64.2° N when it is closest to Finland is classified as an ON extratropical cyclone or windstorm. In the second step of the classification, the direction from which the extratropical cyclones of class FS and FN approach Finland was determined by calculating the mean propagation direction of the previous 12 h before entering the domain (Fig. 2). Based on this average propagation direction, the extratropical cyclone class gets an additional definition: 0–90° is classified as the NE class, 90–180° as the SE class, 180–270° as the SW class and 270–360° as the NW class. Thus, for example, an extratropical cyclone that arrives in northern Finland (north of 64.2° N) from the 295° direction is classified as the FN–NW class (e.g. the blue track in Fig. 2).
In the previous section we classify windstorms and extratropical cyclones based on their impacts and arrival location and direction with respect to Finland. By connecting the windstorms with impacts, we describe the differences between the impacts of different windstorm classes in the following sections. In Sects. 4.1–4.3 we describe the meteorological characteristics of the windstorms and extratropical cyclones. In Sect. 4.4 we focus on the windstorm impacts on the electric grid in Finland.
4.1 Extratropical cyclone and windstorm classes
Figure 3 represents the distribution of the number of extratropical cyclones and windstorms and the ratio of windstorms/extratropical cyclones in each class. Between 2005 and 2018, a total of 3304 extratropical cyclone tracks were found, of which 713 occurred within the domain of Finland (FN and FS classes). Thus, every week four to five extratropical cyclones occurred in total, and in the domain of Finland on average one extratropical cyclone passed by per week. Of all the identified extratropical cyclones, 92 were classified as “windstorms” based on their impacts in Finland; i.e. they caused a minimum of 50 000 delivery points without electricity (Sect. 3.1). Windstorms occurred on average only six times per year. Almost 3 % of the extratropical cyclones were classified as windstorms (classes O, FN and FS). Of the extratropical cyclones which passed over Finland (class F), almost 10 % were windstorms.
Based on our results, the extratropical cyclones outside of the domain of Finland (class O; Fig. 3) are overall the most common type of extratropical cyclone. However, quite a small share of class O cyclones actually impact the electrical network in Finland (around 2 %). This is most likely because although they are inside of our defined larger domain, they either never arrive in the very close vicinity of Finland, and their highest wind gusts are located far from Finland. Among the windstorms analysed, however, the share of class O is significant: these represent a total of 23, which equals 25 % of all the damaging windstorms. Although the extratropical cyclones in class OS are more common (1335 cyclones) than in class ON (985 cyclones), Finland is impacted more often by class ON (14 windstorms) than class OS windstorms (9 windstorms). This is most likely due to the strongest wind gusts being located on the southern side of the windstorm track. In ON windstorms, the strong winds reach Finland especially in the northern and western parts because of their typical route through the North Atlantic and Barents Sea. In contrast, for OS windstorms, a large share of wind gusts remain outside Finland (the strongest wind gusts often occur on the southern side of the low-pressure centre). When the wind gusts do extend over Finland, they impact southern or south-eastern Finland.
In classes where the extratropical cyclones pass over Finland (FN and FS; see Fig. 3), a south-westerly propagation direction was the most frequent. In total we identified 263 extratropical cyclones in class FS–SW, of which 19 were windstorms, and 147 in class FN–SW, with 26 windstorms. It comes as no surprise that a majority of windstorms (around 70 %) arrived from westerly directions, (south-west: 49 %; north-west: 21 %) because of Finland's location in relation to typical storm tracks in northern Europe. In general, concerning Finland, the windstorms with a northern storm track (class FN and ON windstorms) were more often damaging than the ones with a southerly route (FS and OS windstorms). Among all classes, FN–SW had the highest ratio of windstorms in relation to all extratropical cyclones (17.7 %). North-west is also a relatively frequent arrival direction of extratropical cyclones passing over Finland. As Fig. 3 shows, there were 139 class FN–NW extratropical cyclones (14 windstorms) and 100 class FS–NW extratropical cyclones (5 windstorms) in total. The most seldom arrival directions for extratropical cyclones and windstorms in Finland are NE and SE. There were 44 extratropical cyclones in class FS–SE, of which 4 were classified as windstorms. The rarest class was FN–SE (six extratropical cyclones, one windstorm). The north-eastern arrival direction was very rare, and there were no windstorms among the extratropical cyclones in classes FN–NE (seven extratropical cyclones) and FS–NE (seven extratropical cyclones).
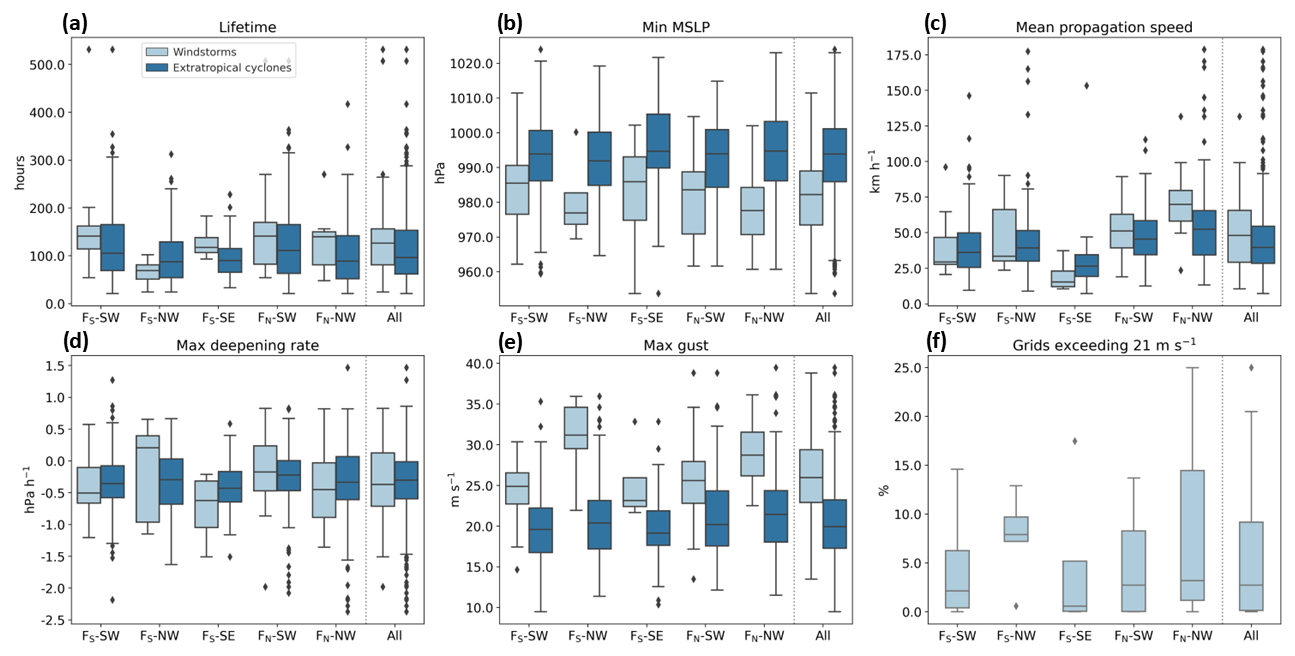
Figure 4Extratropical cyclone characteristics inside the domain of Finland in each class. Light-blue boxes represent windstorms and dark-blue boxes extratropical cyclones. The following characteristics are shown: (a) track lifetime, (b) minimum mean sea level pressure, (c) mean propagation speed, (d) maximum deepening rate, (e) maximum wind gust and (f) percentage of ERA5 grid cells (31 km × 31 km) with wind gusts exceeding 21 m s−1 in the Finnish domain. The “all” column on the right displays the characteristics of all examined windstorms (69) and extratropical cyclones (713) for comparison.
4.2 Extratropical cyclone and windstorm characteristics
The characteristics of extratropical cyclones and windstorms can also indicate their damaging potential. Therefore, we first selected some of the characteristics known to be connected to the impacts of the cyclones. Second, we compared the characteristics of all extratropical cyclones (713) with the 69 windstorms which passed over Finland (class F) (Fig. 4). In the characteristic comparison, we only considered class F because a comparison with class O would not be fair. This is due to the large size of the bounding box, including numerous cyclone tracks in class O that do not affect the domain of Finland at all. Also, classes FN–NE and FS–NE are omitted here because they did not contain any windstorms.
As Fig. 4a shows, the lifetime of the extratropical cyclones can vary from less than 50 h to up to over 500 h; i.e. from 2–21 d. The median lifetime across all classes ranges from 70 to 150 h, with FS–NW windstorms having the shortest lifetime and FS–SW windstorms the longest. When comparing the extratropical cyclones and windstorms, there does not seem to be a consistent difference between the lifetimes of the windstorms and extratropical cyclones, which indicates that the lifetime of the extratropical cyclone is likely not a strong predictor for the eventual amount of damage. In contrast, the minimum MSLP of the extratropical cyclones and windstorms differs very clearly (Fig. 4b). When comparing the minimum MSLP of the extratropical cyclones and windstorms, we observed that in each of the classes, the median of the minimum MSLP of the windstorms is 10–20 hPa lower than that of the extratropical cyclones. In addition, the minimum MSLP also differs between the classes. FN–NW and FS–NW have the lowest medians of minimum MSLP, reaching below 980 hPa. In contrast, class FS–SE windstorms have the highest median of minimum MSLP, which indicates that they are not very intense extratropical cyclones. When considering the propagation speed of the extratropical cyclones and windstorms, there are differences between the classes (Fig. 4c). The FS–SE windstorms have the slowest propagation speed, with a median of 20 km h−1. In contrast, FN–NW windstorms propagate the fastest, with a median propagation speed of 75 km h−1. The propagation speed is a significant characteristic for two main reasons: (1) slow windstorm propagation speeds indicate that the strong wind gusts influence the same area for a long time, and the damage thus accumulates, or (2) fast windstorm propagation speeds suggest that the storm has intense meteorological characteristics, such as extreme maximum wind gusts, leading to significant damage.
The maximum deepening rate of the cyclone also suggests a possibility of an intense windstorm if the development is very rapid. The median of the maximum deepening rates of the windstorms varies between −0.5 and 0.3 hPa h−1, and the most extreme deepening rates are between −1.5 (FS–SE) and −0.8 hPa h−1 (FN–SW). Previous studies show that rapidly deepening extratropical cyclones that move, for instance, across central Finland present a significant risk of wind damage, particularly for the southern half of the country (Valta et al., 2019; Gregow et al., 2020).
Maximum wind gusts of the windstorms are often considered the most important indicator connected to the damage to the electrical grid. The maximum wind gusts in different classes are presented in Fig. 4e. In the most extreme FS–NW windstorms, the median wind gust speed is 32 m s−1. In contrast, the lowest wind gust median (24 m s−1) was found in class FS–SE windstorms. The maximum wind gusts are clearly higher in windstorms than in all extratropical cyclones.
The amount of windstorm damage can also be influenced by the size of the area affected by strong wind gusts. Thus, we compared the areas of strong wind gusts in each windstorm class by identifying the percentage of ERA5 grid cells inside the domain of Finland with gust values exceeding 21 m s−1 while the windstorm track is inside the domain (Fig. 4f). The median of the percentage of ERA5 grid cells exceeding 21 m s−1 varies between 2 % and 9 %; however, in the most extreme situations the gusts of over 21 m s−1 can cover 15 % to 25 % of the domain of Finland. The smallest median of strong wind gust areas is found in class FS–SE. This result is in line with the study of Laurila et al. (2021a), for example, who show that the strongest gusts typically occur on the southern side of the storm track and from the southern arrival direction of FS–SE windstorms (described in more detail in Sect. 4.3). This means that the FS–SE windstorms often influence only a small area in southern Finland (regional analysis in more detail in Sect. 4.4) because the strongest wind gusts usually stay on the southern side of Finland unless the storm track moves more north over the country. In contrast, the windstorms with more northern storm tracks have slightly higher coverage of strong wind gusts. If a large part of Finland is influenced by the warm sector and the cold front of the windstorm, there is also wider coverage of the grid cells exceeding the 21 m s−1 threshold. For example, FS–NW has the highest median of the strong-wind-gust area (9 %), and FN–NW has the highest individual value of the windstorm's wind gust coverage (25 %). Generally speaking, the medians of strong-wind-gust areas do not appear to be a large number compared to the overall area; however, the location of the strong wind gusts can also impact the amount of damage (more thoroughly explained in Sect. 4.4). Generally, northern Finland is very sparsely populated; thus most of the electrical grids in Finland are located in the southern and central parts of the country, and those parts are also more vulnerable to strong winds. In contrast, in the south, the electrical cables are more often under the ground, which makes the electrical grid more resistant to windstorms.
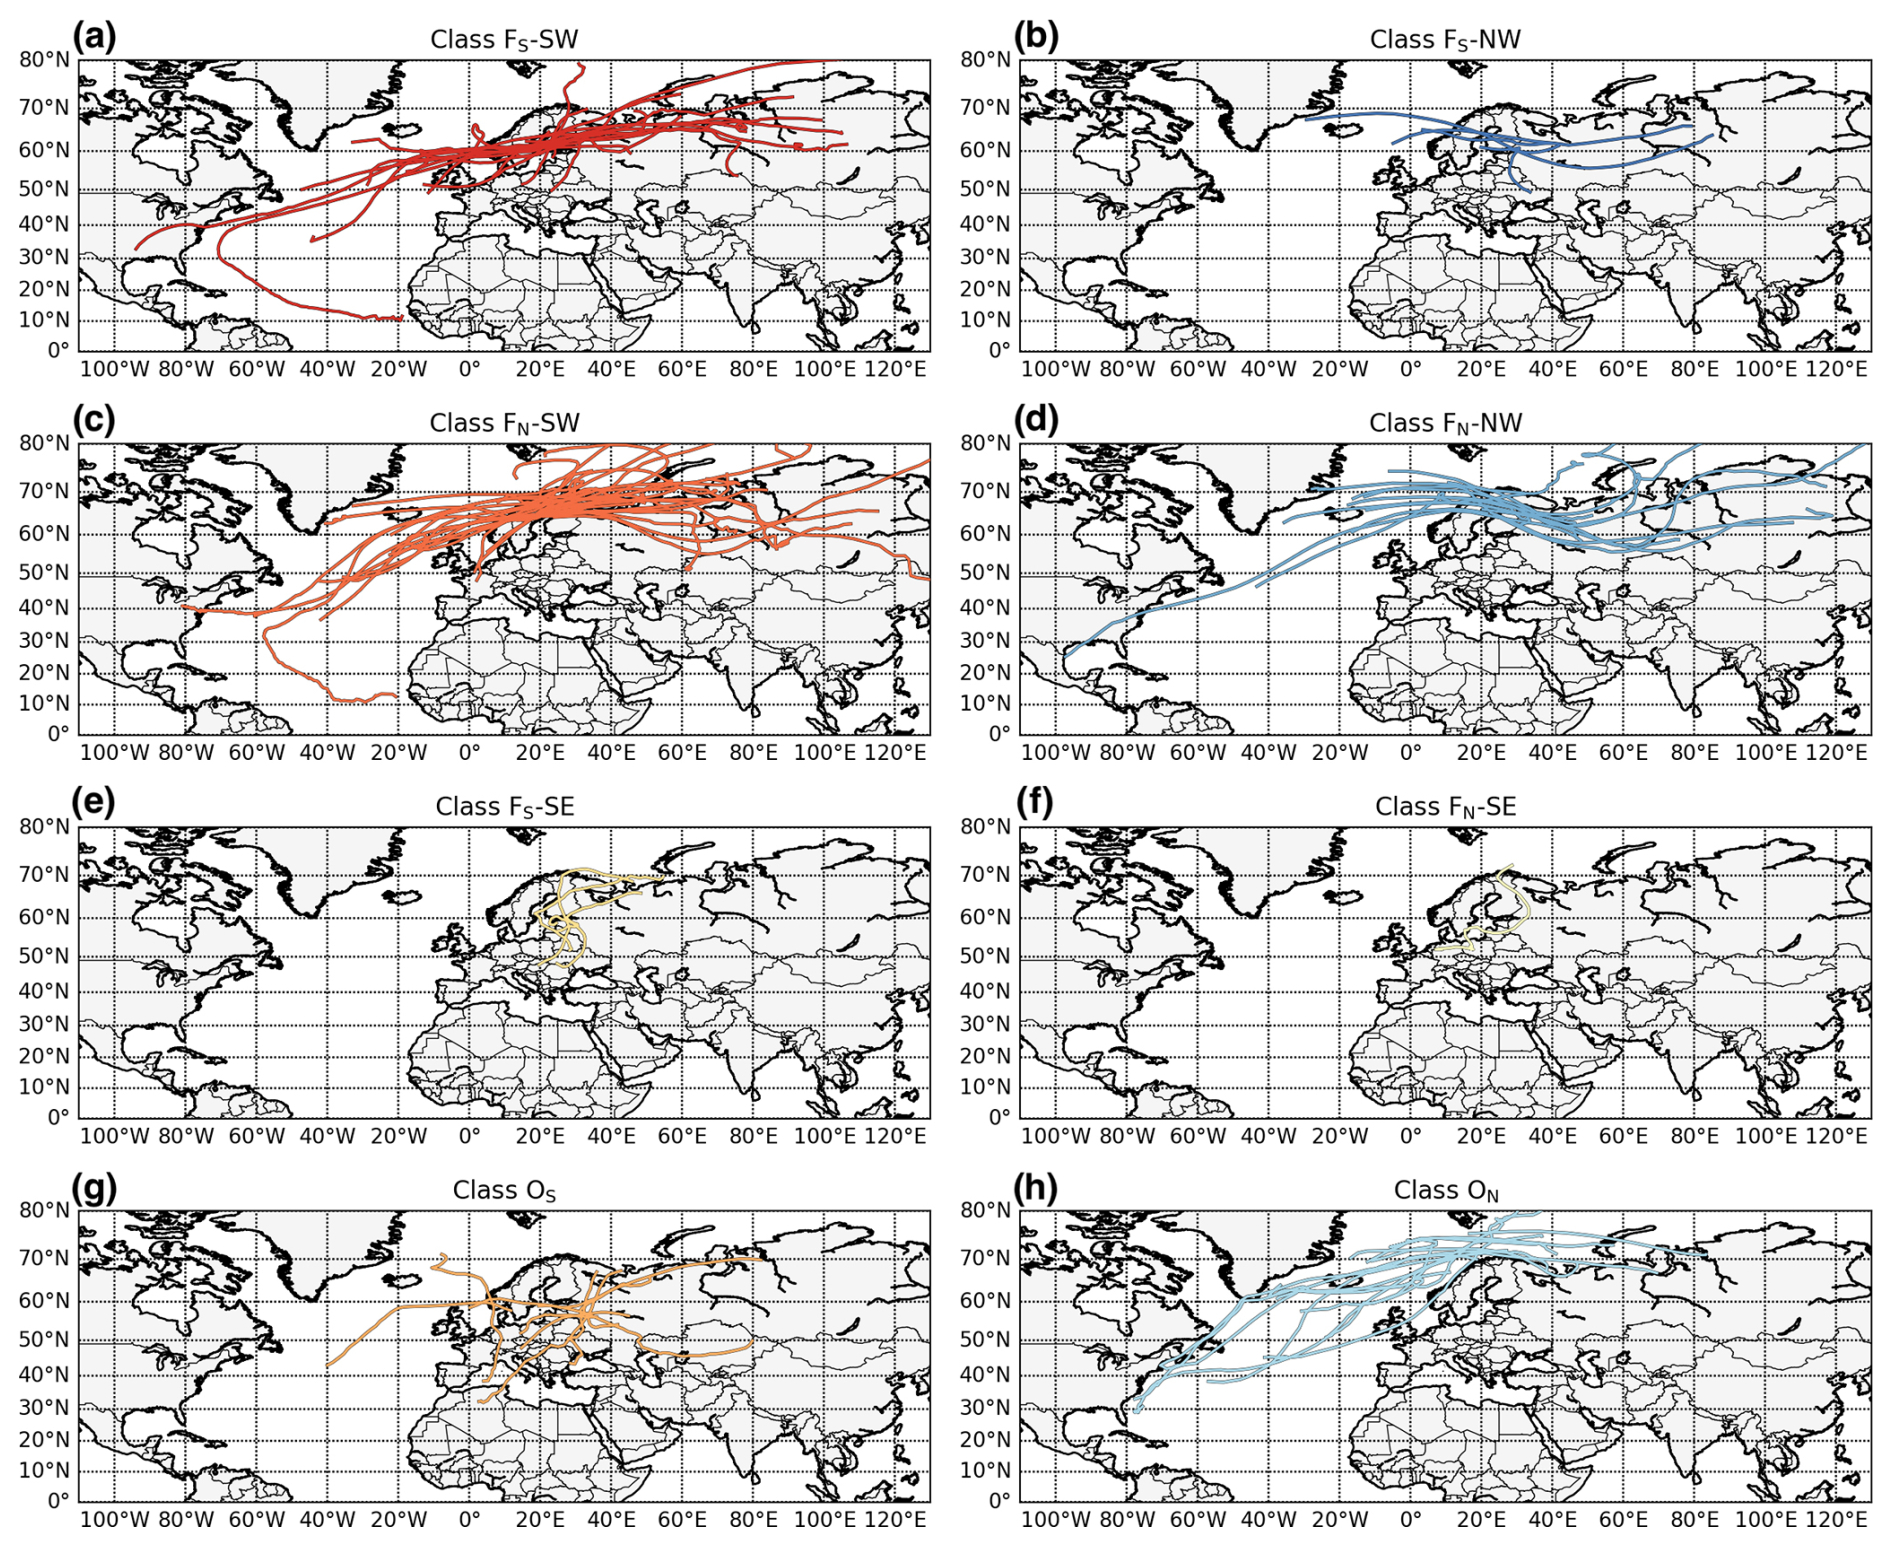
Figure 5The tracks of the 92 windstorm cases divided by the class.
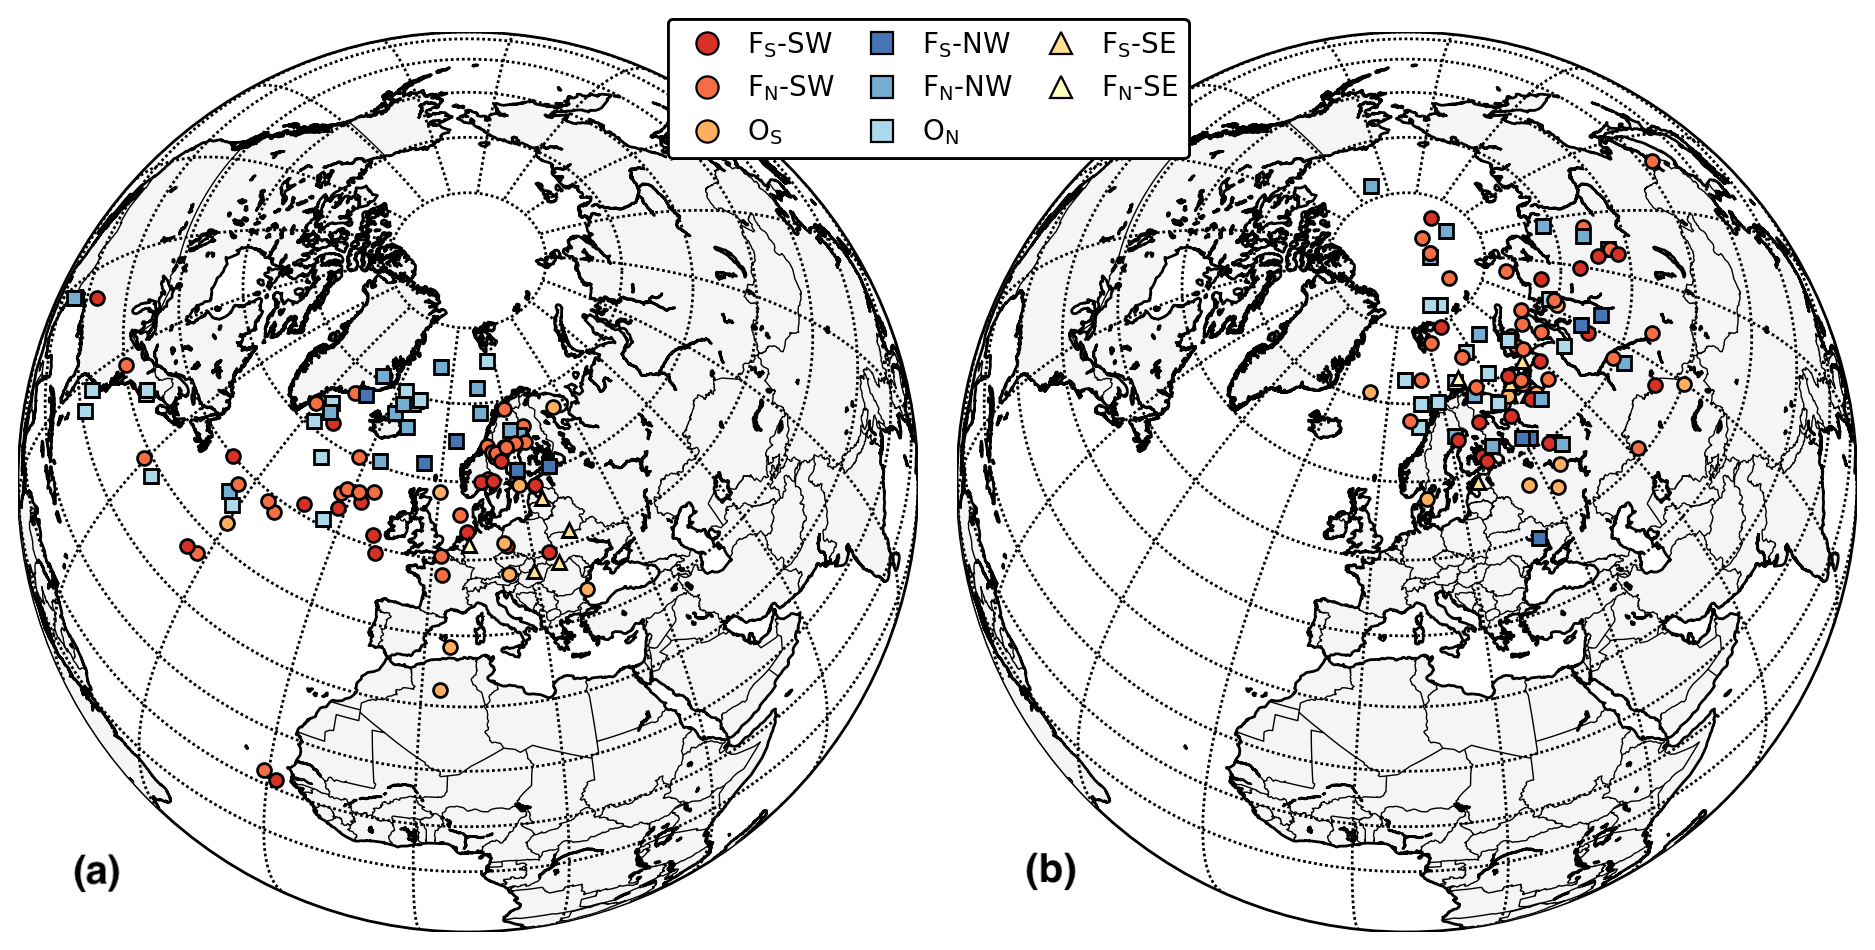
Figure 6(a) Genesis and (b) lysis of the windstorms in each class.
4.3 Tracks, genesis and lysis locations of the windstorms
To be able to understand the windstorm characteristics in more depth, we studied the tracks of the windstorms, in particular where the development of the storms starts (genesis) and ends (lysis). We analyse the tracks separately for each class and map them in Fig. 5. In Fig. 6, a colour coding of windstorm classes is used to present the genesis and lysis locations of the windstorms (the same colours for the classes are used throughout the study). The windstorms arriving from the south-west typically travel the longest distance (Fig. 5a and c), which is also consistent with these storms having the longest lifetimes (Fig. 4a). In comparison, the tracks of windstorms arriving from the north-west (Fig. 5b and d) are shorter than the south-western windstorms (Fig. 5a and c); however, in rare cases NW windstorms also develop in the southernmost regions of the North Atlantic (Fig. 6a). Most of the NW windstorms develop in the Norwegian Sea, while the SW windstorms have a more southern genesis location. The storm tracks and genesis locations of class ON windstorms are a blend of the tracks of SW and NW windstorms, since many of them also develop in the Norwegian Sea but some also much further west in the Atlantic. ON windstorms (Fig. 5h) typically have rather long tracks and a more northern route than the storms in other classes.
The windstorms arriving from the south-east and OS windstorms have a different location of genesis and route of the storm tracks than the ones arriving from the western and northern directions. Figures 6a and 5e–f show that the SE windstorms typically develop in eastern or central Europe, and the storm tracks of SE windstorms resemble the letter “S”, suggesting the presence of a high-pressure system to the north of Finland or Russia. Alternatively, this pattern may indicate that the overall airflow or jet stream is weak, causing the storms to be pushed eastward. The FS–SE and OS windstorms have similar storm tracks, and the windstorms in these classes typically pass Finland from the eastern side. However, the development of the OS windstorms in some cases starts farther south than class FS–SE windstorms (Fig. 6a), starting from the Mediterranean Sea and northern Africa. OS windstorms have their lysis locations (Fig. 6b) generally farther south than other classes. FS–SE windstorms have short tracks, and they tend to have their lysis locations close to Finland.
Many of the ON storms have their lysis locations to the north of Finland and over the Barents Sea. In general, for the lysis of the windstorms, there is not a very clear pattern between different classes. The classification is done based on the arrival direction, and, thus, possibly for that reason the lysis locations of the storms do not follow as clearly the class distribution as the genesis location.
4.4 Windstorm impacts on electricity grids
After analysing the differences in the meteorological characteristics of the windstorms, we now focus on the differences in the damage to electricity grids. In Sect. 4.4.1 we first describe the impacts in different windstorm classes. In Sect. 4.4.2 we focus on the seasonal impacts and distribution of the windstorms, and finally, in Sect. 4.4.3, we focus on the regional windstorm impacts.
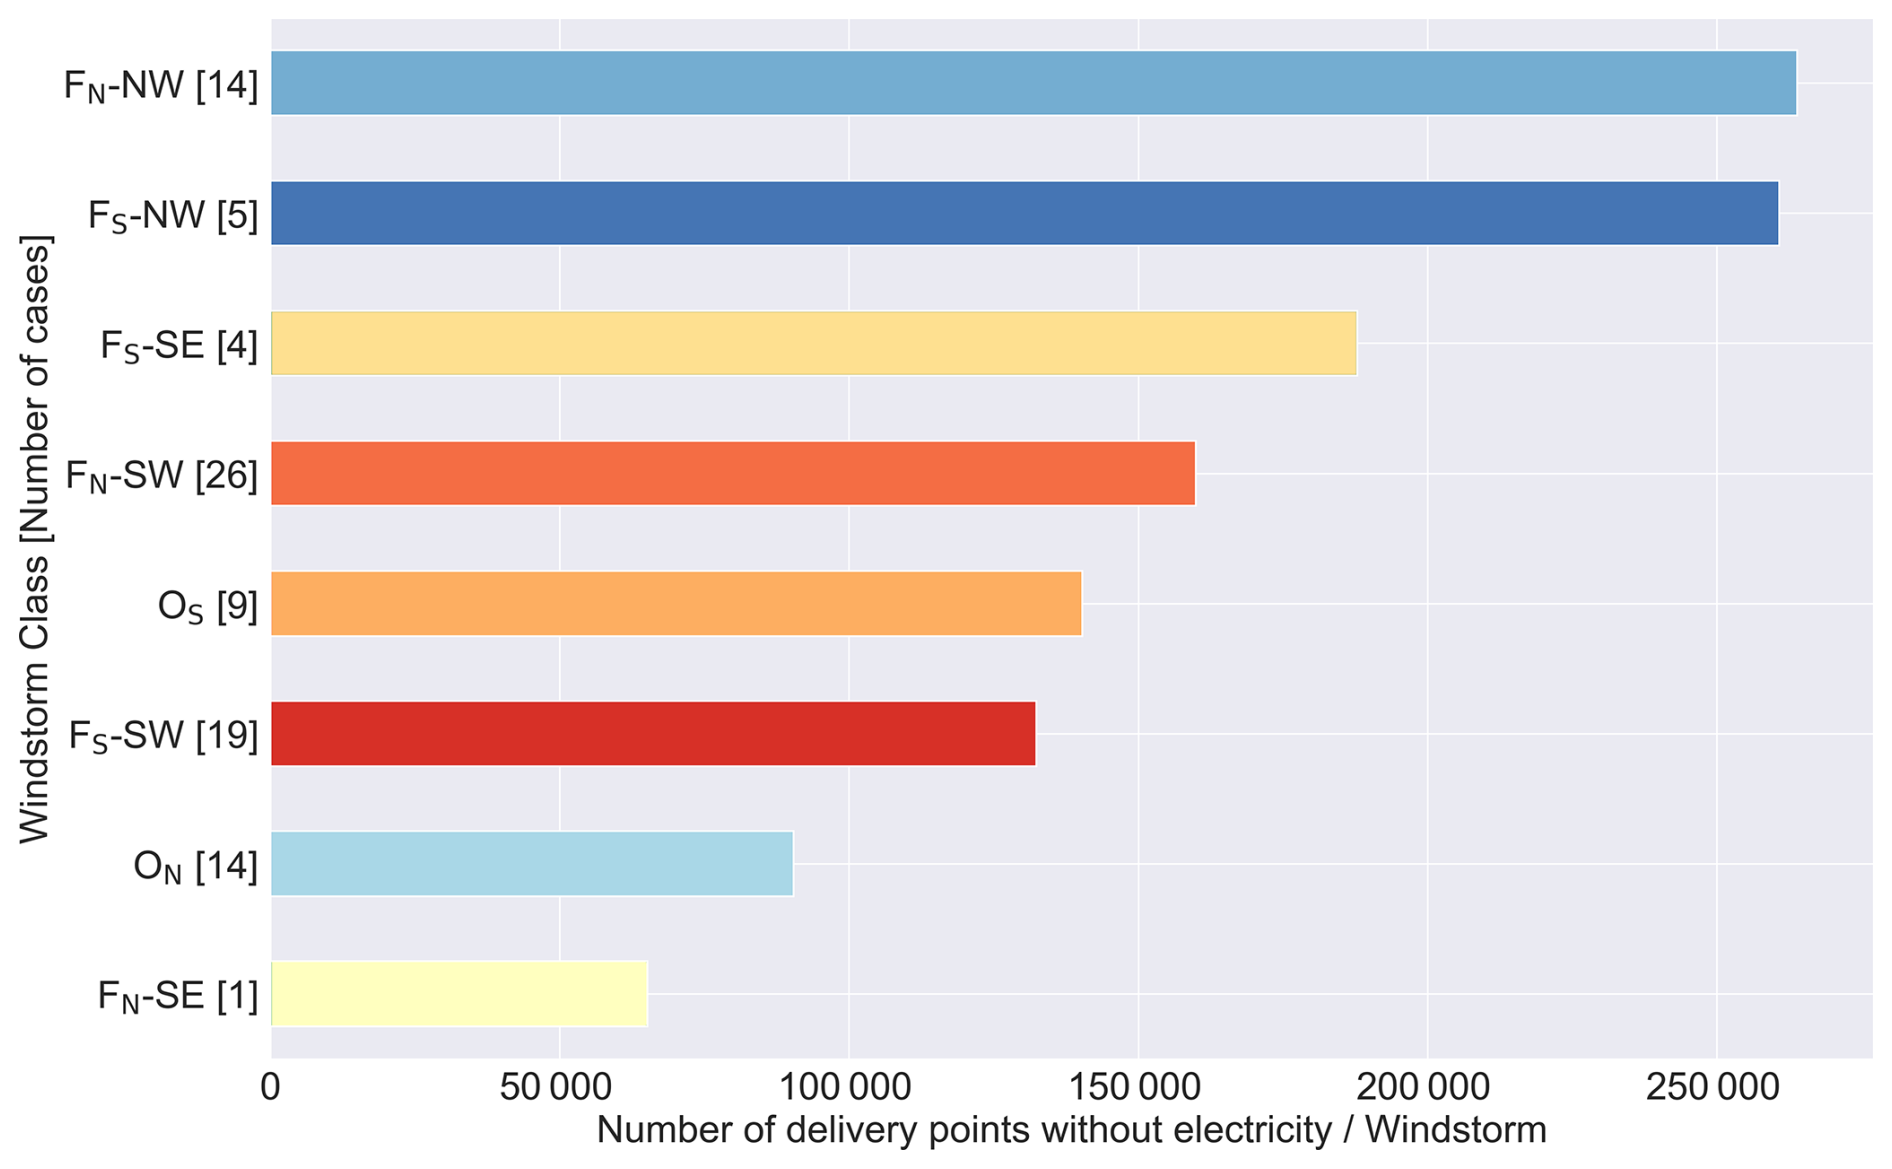
Figure 7The average number of delivery points (NDP) without electricity per windstorm class. The numbers in square brackets on the y axis represent the number of cases in each class. The colours of the bars represent the colours of the different windstorm class also used in other figures.
4.4.1 Impacts of windstorms and power outage correlation with wind parameters
To quantify the damage of the windstorms in different classes, we calculated the NDP per windstorm case and windstorm type (Fig. 7). From Fig. 7 we can conclude that, in the analysed period, the highest damage per windstorm occurred on average in the NW windstorm cases: FN–NW and FS–NW windstorms caused on average over 250 000 delivery points without electricity. Furthermore, on average, FS–SE windstorms caused high impacts (180 000 delivery points per windstorm). The windstorms in the rest of the classes caused 70 000 (FN–SE) to 160 000 (FN–SW) delivery points without electricity per windstorm. As presented earlier in Sects. 4.2 and 4.3, classes differ in their characteristics and their windstorm tracks and genesis/lysis locations. Therefore, the impacts of the different-windstorm-class storms also have different reasons for their damaging potential. NW windstorms are the most impactful, likely due to their widespread and strong wind gusts (Fig. 4e and f). Furthermore, they have the lowest minimum MSLP (Fig. 4b), and they propagate fast (Fig. 4c), which also indicates other damaging features such as a gusty and turbulent surface wind layer. FS–SE windstorms also cause high impacts, likely because they affect areas with high population density and dense electrical grids (southern and south-western Finland), and they propagate slowly, which can accumulate damage and slow down the fixing of the faults. Another possible reason might be the easterly direction of arrival with more easterly winds, as trees are less used to this wind direction, making them more prone to falling. However, the FS–SE class contains only four cases, which does not allow us to draw clear conclusions. The least damage occurred in class FN–SE and ON windstorms. In these classes, the wind gusts are not very strong (Fig. 4), and they usually do not reach the highly populated areas in Finland.

Figure 8Correlation matrix presenting the correlation coefficient values between observed and ERA5 wind gust parameters, windstorm characteristic parameters, NDP and electrical grid faults. The red box around NDP and fault values highlights the importance of the correlations. The ∗ symbol indicates that the correlations were calculated with the characteristics of 69 windstorms (FS and FN) instead of all 92 windstorms, as was the case for the other correlations.
To examine the most significant windstorm-related factors impacting the electrical grid, we computed the correlation coefficients between the daily sums of the NDP and electrical grid faults with ERA5 wind gust parameters, wind gust observations from the Finnish Meteorological Institute (Fig. 8) and daily storm track parameters (e.g. minimum MSLP) over the Finland domain (59.5–70.1° N, 20.0–31.4° E). For example, we calculated the mean of the maximum wind gusts across all FMI observation stations for each windstorm day and correlated them with the daily NDP sum. A similar analysis was performed using ERA5 data by computing the mean of the maximum wind gusts across all grid cells within the Finland domain. Similarly, correlations were also computed for other parameters, such as the minimum MSLP and propagation speed. The wind parameters included are the daily mean of maximum wind gusts at observation stations, the daily mean of maximum wind gusts in ERA5 grid cells, the 90th percentile of daily wind gusts of ERA5, the daily maximum wind gust value in ERA5 and the area in percentage where wind gusts are over 21 m s−1. Due to the different characteristics of the meteorological variables, a simple Pearson correlation coefficient was used. The results using the Spearman and Kendall correlation coefficients, which show qualitatively similar results, can be found in Appendix A2. Correlation interpretations vary by field of study, but generally, they are classified as weak (0 to 0.3), moderate (0.3 to 0.5) or strong (above 0.5), which we also use in this study (Turney, 2022). The highest correlation coefficient was found between the area of strong wind gusts and both NDP (0.61) and faults (0.59), which can be considered to be a strong correlation (Fig. 8). The wind gust speed is commonly known to influence the amount of damage. However, in traditional weather forecasting and impact assessment, the spatial extent of strong wind gusts is not often considered carefully; rather, the maximum wind gusts are examined. Based on our results, the size of the area of strong wind gusts may play a more important role in damage to the electricity network than expected.
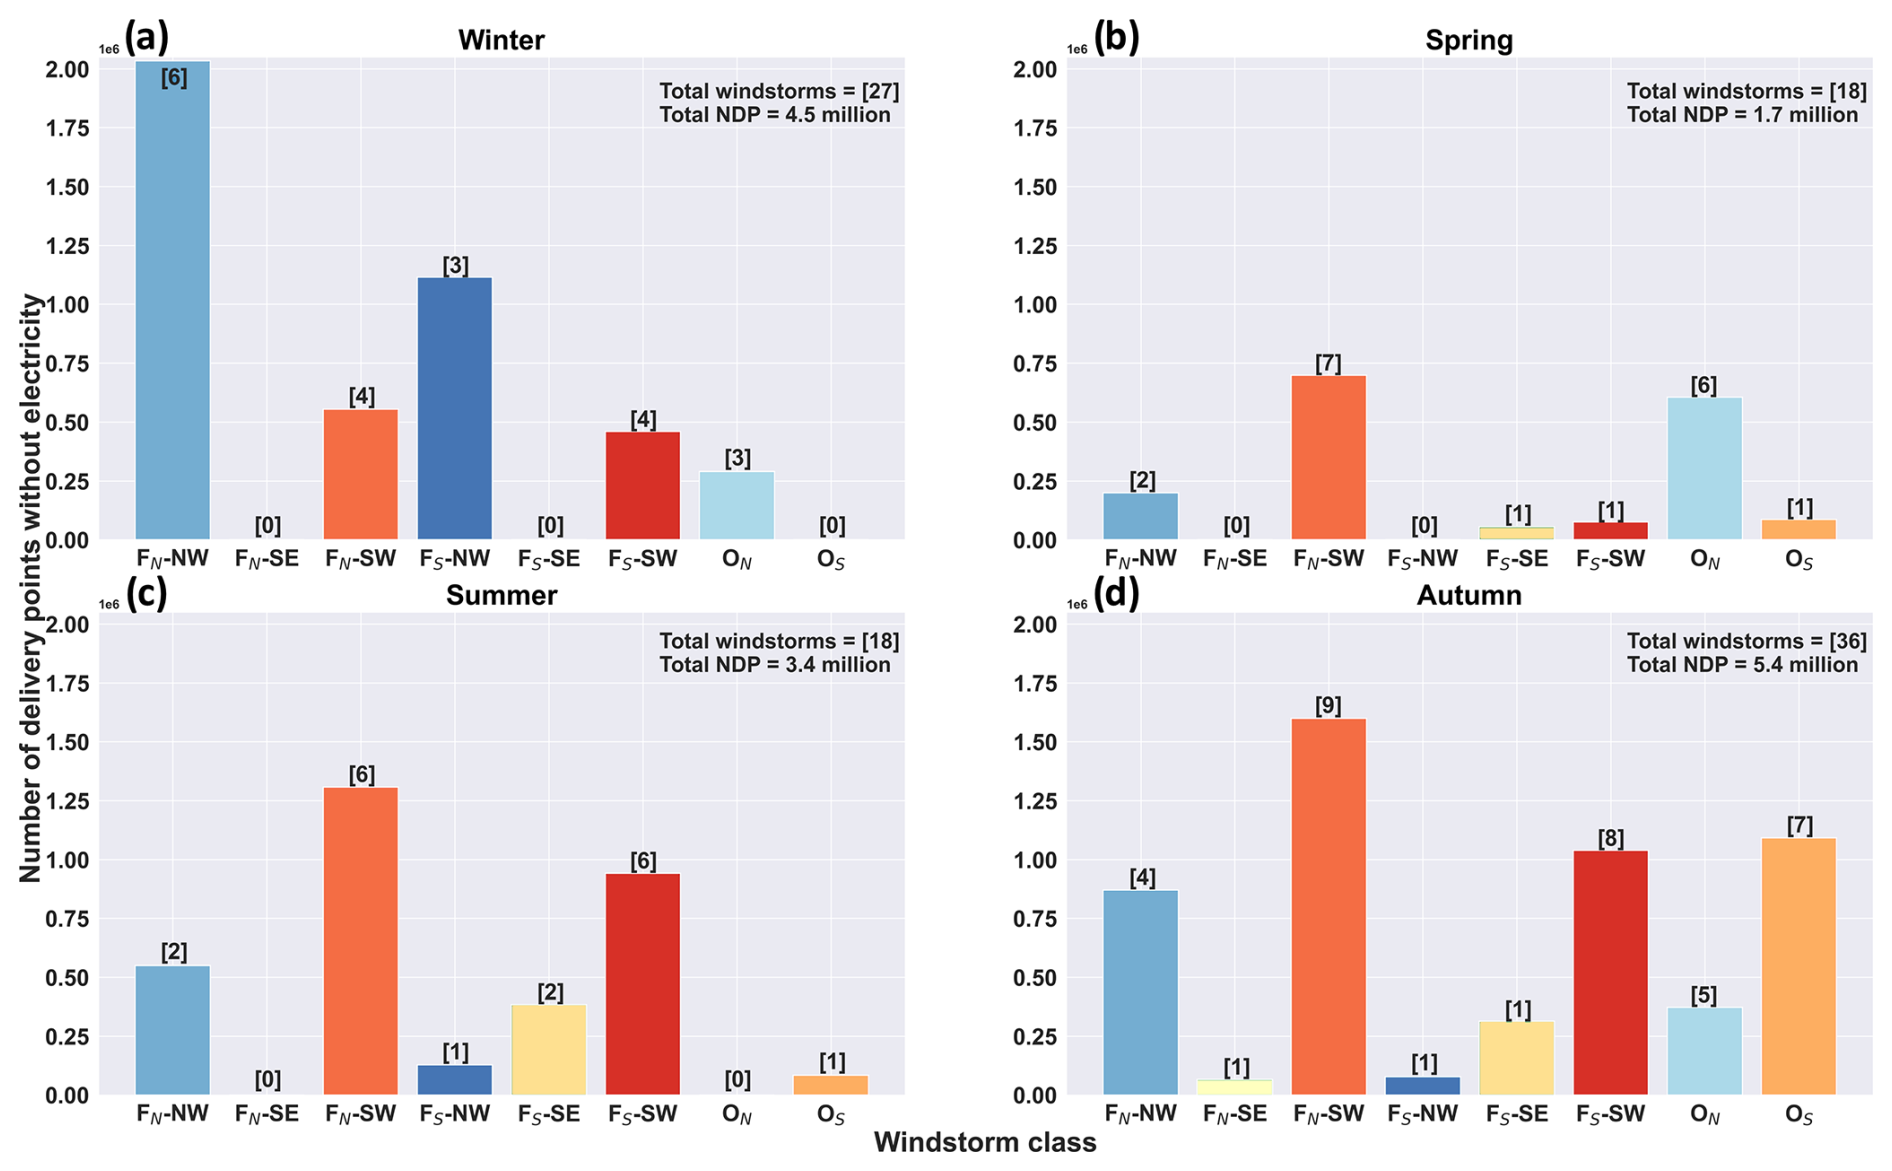
Figure 9Distribution of number of delivery points without electricity (NDP) by windstorm class in (a) winter (December, January, February), (b) spring (March, April, May), (c) summer (June, July, August) and (d) autumn (September, October, November). The number of windstorms in each class and season is shown in square brackets.
Figure 8 shows a moderate correlation (0.46) between the observed wind gusts and NDP. Similarly, the 90th percentile of ERA5 wind gusts reaches a correlation of 0.45 with NDP. The ERA5 maximum wind gust has a correlation of 0.42 with NDP and 0.39 with faults. The daily mean of maximum wind gusts of ERA5 correlates the least (weak correlation) of the wind parameters examined with both NDP (0.26) and faults (0.21). It is important to also note the negative, although rather weak, correlation between minimum MSLP and both NDP and faults, indicating that lower MSLP is associated with more damage caused by the windstorm. This is not surprising, as MSLP is often considered a meteorological indicator of windstorm strength due to its relationship with maximum wind gusts. All correlations were tested with p values. At the significance level of 1 % (p value < 0.01), all parameters that showed either moderate or strong correlations were found to be statistically significant. The ERA5 mean of maximum wind gust and minimum MSLP correlation with both NDP and faults were found to be statistically significant at the 5 % level (ep value < 0.05). The correlations were not significant (p value > 0.05) for parameters with very weak correlation with NDP and faults (maximum deepening rate and lifetime; for more detail see the correlations and p values in Table A1). Finally, the wind gust values of ERA5 and the observed wind gusts are compared in Fig. A1 in more detail, which shows that ERA5 underestimates the most extreme wind gust values compared to the observed wind gusts.
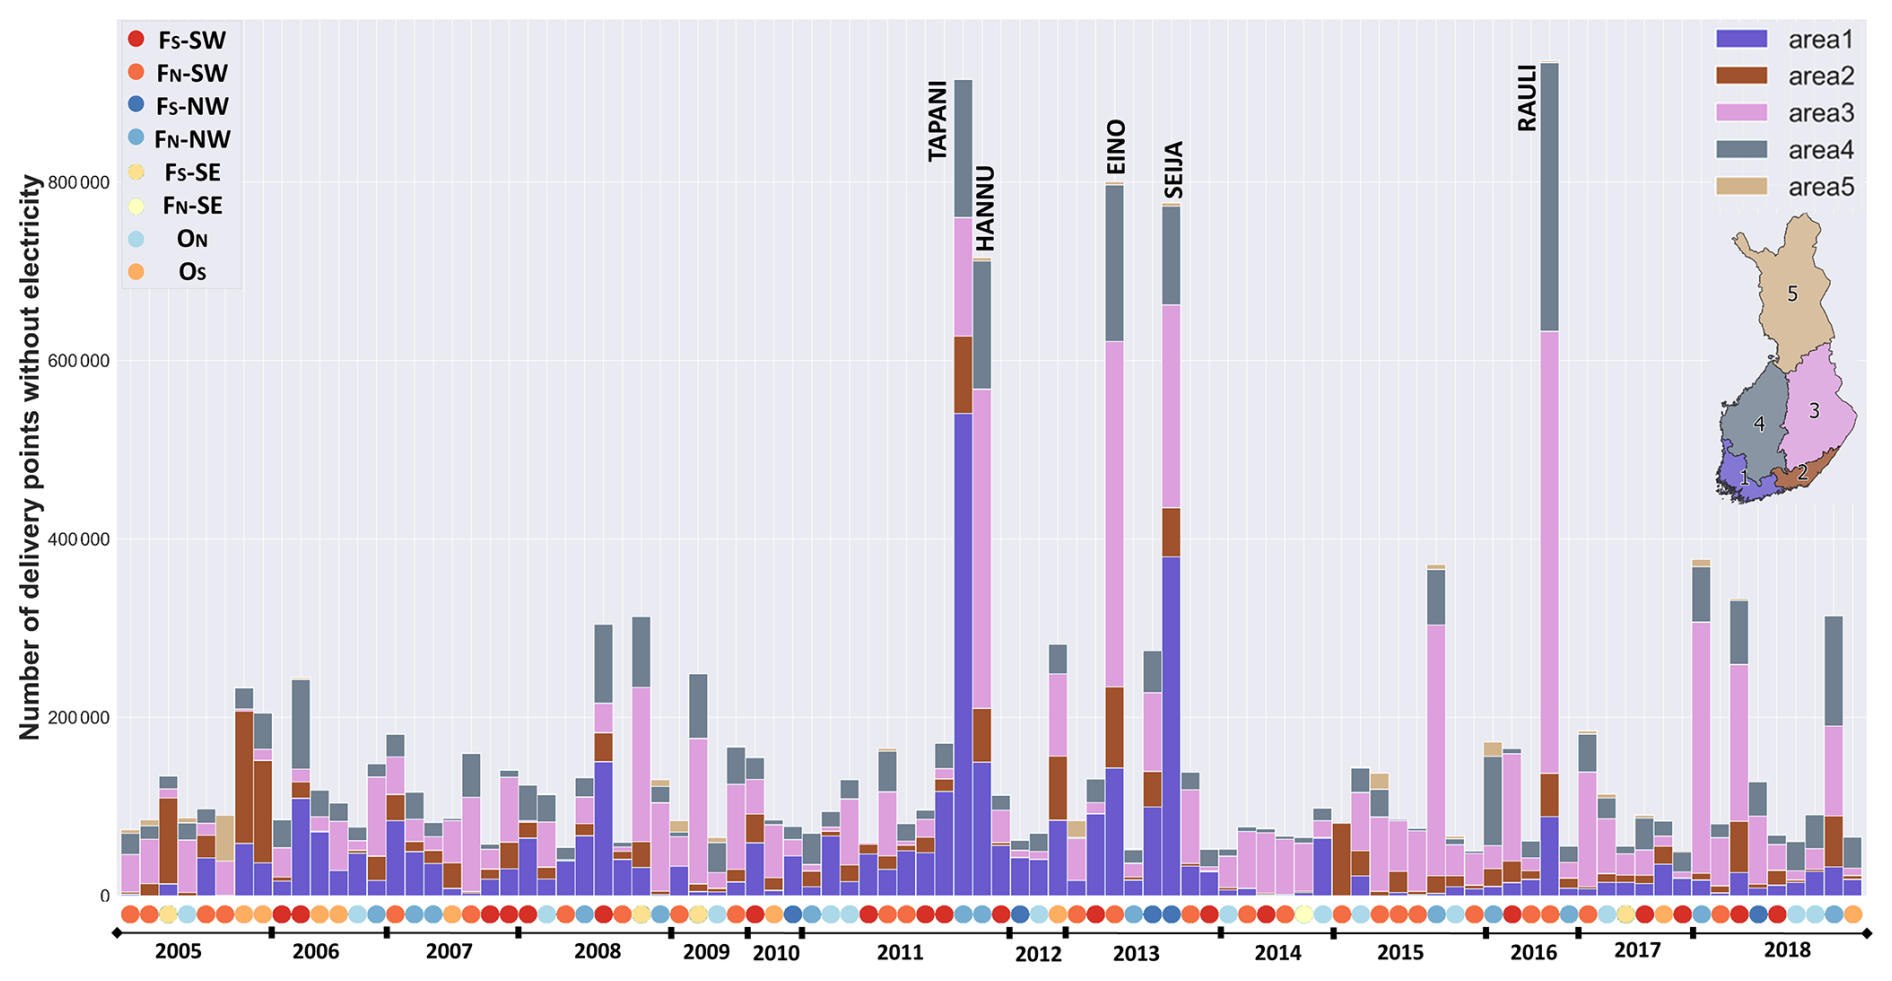
Figure 10Numbers of delivery points for each of the 92 windstorm cases. The coloured circles below the bars indicate the windstorm class. The Finnish names of the five most damaging windstorms are shown on top of the corresponding bars.
4.4.2 Seasonality in windstorm occurrence and impacts
To better understand the seasonal impacts of windstorms and the reasons behind the differences, we analysed the distribution of NDP by season and windstorm class.
In spring (March, April, May) and summer (June, July, August) (Fig. 9b and c), the climatological storm tracks move polewards (Hoskins and Hodges, 2019), and the typical track of an extratropical cyclone is more northerly; they are in general weaker than in autumn (September, October, November) and winter (December, January, February). The difference in impacts between the winter and autumn months may be influenced by factors other than wind speed alone, such as the lack of soil frost and the presence of vegetation canopy and soil moisture, all of which affect the potential for tree uprooting along power lines.
As Fig. 9a and d show, the most windstorm cases occurred in autumn (36) and winter (27). The largest total damage was also related to autumn (5.4×10⁶ delivery points) and winter windstorms (4.5×10⁶ delivery points without electricity). Among the windstorms analysed in this study, autumn storms had a median minimum MSLP of 975 hPa, and winter storms had a median minimum MSLP of 977 hPa; however, winter storms produced stronger median wind gusts (28.3 m s−1 compared to 26.8 m s−1 for autumn; analysis not shown). This suggests that soil frost in winter anchors tree roots more effectively, preventing trees from falling, as recently demonstrated by Haakana et al. (2024). In spring and summer, the number of windstorms is lower (18 windstorms per season); however, during the spring the damage (1.7×10⁶ delivery points) is only half of the damage in the summer (3.4×10⁶ delivery points). Additionally, summer windstorms show slightly higher medians in minimum MSLP and maximum wind gusts than spring windstorms, with values of 988 hPa and 23.6 m s−1 compared to 980 hPa and 23.0 m s−1, respectively. In addition, this supports the assumption of the significance of soil frost in the prevention of tree uprooting: especially during March (when Finland is still partly covered in snow), the soil frost is often still present and prevents trees from falling in many parts of the country. Additionally, the trees carry leaves in summer, which causes the trees to uproot more easily due to a larger area for wind resistance. If we look at the average NDP per windstorm, the most damage actually occurs during the summer (188 000 delivery points without electricity per windstorm). In winter the number is 166 000 per windstorm, in autumn it is 150 000 per windstorm, and in spring it is 94 000 per windstorm. We conclude, therefore, that even though windstorms in summer often have weaker wind gusts than in autumn and winter, based on some other environmental factors like vegetation or lack of soil frost, the summer windstorms can in some cases be even more damaging than those that occur in winter.
When looking into the seasonality of different windstorm classes in Fig. 9, it seems that in winter NW windstorms are dominant, but there are no FS–SE, FN–SE or OS windstorms. In all other seasons, SE and OS storms are also present. If we look into the seasonality of all extratropical cyclones (Fig. A3), there are indeed more NW cyclones in winter, although the total number of extratropical cyclones is not notably larger than in summer. As Fig. 6 shows, the NW windstorms typically start in the North Atlantic. In winter, windstorms typically develop in the vicinity of the jet stream, and the North Atlantic is particularly active with windstorms, which may explain the larger number of NW windstorms and extratropical cyclones. On the other hand, in summer there are no ON windstorms (and less extratropical cyclones than in other seasons; Fig. A3), which might be a result of a more northerly located jet stream during the summer preventing this type of windstorm from reaching Finland. Furthermore, the seasonality analysis of all extratropical cyclones suggests that SE cyclones are more common in spring and summer than in autumn or winter. Thus, we can conclude that NW windstorms and extratropical cyclones are more “winter and autumn systems”, whereas SE windstorms and extratropical cyclones occur rather in the warm season. The variability in the windstorm (Fig. 9) and extratropical cyclone types (Fig. A3) is slightly smaller in winter and autumn than in spring and summer.
Our results support previous studies which have stated that the intensity and extent of the windstorms are stronger during the cold season (October–March) than the warm season (April–September) (Laurila et al., 2021a). The extratropical cyclone activity is typically highest in the North Atlantic during the winter (December–February) and lowest in summer (June–August) (Wickström et al., 2020). Wind speeds in northern Europe are on average 30 % higher in winter than in summer (Laurila et al., 2021b).
4.4.3 Impacts by region
Finally, we examined the regional impacts of windstorms. As described in Sect. 2.2, the power outage data were provided for five areas in Finland. The areas have different features that also influence the potential for impacts. Area 1 is the most densely populated, including, for instance, the urban areas of the capital Helsinki and Turku. The process of placing cables underground is most advanced in such urban centres. Areas 2 and 4 include a few bigger cities as well as rural areas. In area 3, there are a few cities, but a large share of the electricity grid is above the ground and often located in highly forested areas. Area 5 is the least densely populated and less forested than any of the other areas.
Most of the damage occurred in eastern Finland (area 3), most likely because of the structure of the grid (many overhead lines) and the highly forested terrain. As Fig. 10 shows, until 2013 a lot of damage occurred in south-western Finland (area 1), after which the NDP in area 1 distinctly decreased. This may be partly explained by the development in the ground cabling, especially in area 1 (Jasiūnas et al., 2023b). Ground cabling is gradually becoming more common in other areas as well, but due to the challenging terrain and cost of ground cabling, it is not profitable (or even possible) to transfer the entire grid below the ground, especially in more rural areas (areas 3–5). The windstorms that also cause damage in area 5 are in general either FN or ON storms, since only in these classes do the strong wind gusts reach this far north. In extreme cases, like the five strongest windstorms labelled in Fig. 10, the wind gusts are usually widely spread and therefore cause damage over large areas. However, in these cases there are also differences depending on the route of the windstorm.
OS windstorms cause damage mostly in areas 1, 2 and 3. As Fig. 5g shows, the route of OS windstorms is typically located on the southern side of Finland, and since the strongest wind gusts primarily remain on the southern side of the track, only a small part of the wind gusts reach the southern and eastern parts of Finland. In the case of FS–SE windstorms the situation is similar, and they affect mainly areas 2 and 3 (in a few cases also areas 1 and 4). FS–SE windstorms' arrival direction is similar to OS; the wind direction varies from southern to eastern, and impact areas are similar. The location of the arrival plays a role in the regional distribution of damage. For instance, southern Finland (FS) windstorms almost never cause damage in area 5. Although Windstorm Seija (class FS–NW) was a very intense windstorm, it caused nearly no damage in area 5 (Fig. 10).
We can conclude that the route of the windstorms plays a role; however, the most important thing in the damaging power of the storm is the overall strength of the windstorm, including the wind gust speed. In addition, the season and environmental and climatological factors have an effect on the resulting damage; e.g. the top five most damaging windstorms occurred when there was no soil frost present to anchor the trees to the ground.
This study examines windstorms and extratropical cyclones that impacted Finland from 2005 to 2018, focusing on their meteorological characteristics, effects on the electrical grid, and seasonal and regional variations.
We seek to develop a focused understanding of windstorm impacts that goes beyond conventional meteorological classifications. The goal is to improve understanding of the relationship between windstorm characteristics and impacts and to propose new methods for distinguishing impactful windstorms from non-impactful ones, as well as for assessing windstorm impacts in Finland and similar regions. To address these objectives, we created a novel classification method for extratropical cyclones, focusing on their arrival location and direction. We further selected windstorms based solely on their impact, specifically the number of power outages, rather than relying on meteorological parameters. If impact data are available, this classification can be applied beyond Finland, making it relevant for other regions affected by windstorms as well. We then analysed the meteorological characteristics of windstorms in comparison with extratropical cyclones by class, studied the windstorm-related meteorological properties, and assessed how impacts vary based on the type of windstorm and its meteorological attributes. We examined how the impacts differ by region and season across different extratropical cyclone classes.
Our findings show that the most common type of extratropical cyclone that affects Finland originates from the south-west (classes FN–SW and FS–SW, 55 %). Notably, class ON and OS windstorms, which together account for 25 % of all damaging windstorms, illustrate that damage can occur even if the windstorm's low centre does not directly move over the country. Although FS–SE windstorms are relatively rare (4 %), their impact is significant when they do occur.
The characteristics and impacts of these extratropical cyclones are closely linked to their origin and movement. Windstorms from the south-west (classes FN–SW and FS–SW) travel longer distances and cause in total the most damage. Some of these types of windstorms may have originally been tropical cyclones that transitioned to extratropical cyclones, as indicated by their storm tracks. Extratropical cyclones arriving from the north-west (classes FN–NW and FS–NW) mainly originate in the Norwegian Sea, while FS–SE and OS windstorms come from eastern and southern Europe. FN–NW and FN–SW windstorms create severe damage due to their higher wind gust speed. FS–SE storms, propagating more slowly, tend to cause accumulating damage over time, whereas FN–NW and FS–NW windstorms in particular are characterised by their extreme strength regarding maximum wind gust, minimum MSLP and widespread gusts in highly populated areas like southern Finland. In the analysed period, class FN–NW and FS–NW windstorms caused the highest average number of delivery points (NDP) without electricity. FS–SE windstorms also caused significant impacts, particularly in densely populated areas with extensive electrical grids. Wind gusts and the spatial extent of strong winds were identified as major contributors to grid damage, with larger areas of strong gusts showing higher correlations with electrical grid key parameters: NDP and faults. The results emphasise the importance of considering both wind speed and the area affected by strong gusts in impact assessments.
Seasonal patterns indicate that windstorms are more frequent, and the total damage is higher in autumn and winter compared to spring and summer. The variability in the damaging extratropical cyclones is higher in spring, summer and autumn, reflecting a broader range of cyclone classes in these seasons than in winter. In autumn and winter, while windstorms can be intense, factors like soil frost reduce damage by preventing tree uprooting, whereas summer windstorms, though typically weaker, can cause significant damage due to foliage and lack of soil frost. This highlights the importance of considering environmental conditions beyond wind speed when assessing windstorm impacts.
Regional analysis shows variability in windstorm impacts across Finland. Areas with overhead power lines and dense forests, particularly eastern Finland, experience more frequent and severe damage. A shift in damage patterns over time may also be influenced by increased ground cabling in urban areas. The route and strength of windstorms also affect regional damage distribution, with certain storm classes causing concentrated impacts in specific areas. With climate change potentially shifting the jet stream northward (Bengtsson et al., 2006; Haarsma et al., 2013), Finland might experience an increase in powerful windstorms from north-westerly and south-westerly directions, south-westerly windstorms currently being the most common. Climate change will also likely impact the soil frost conditions in the future (Kellomäki et al., 2010; Gregow et al., 2011; Lehtonen et al., 2019). Recent studies suggest a negative correlation between soil frost and wind-related power outages (Haakana et al., 2024; Láng-Ritter et al., 2023); i.e. soil frost prevents the uprooting of trees and reduces the number of power outages. Future research should study these insights in more detail as well as climate change aspects to refine impact assessments and improve forecasting and mitigation strategies. Other environmental factors, such as soil moisture and vegetation, also play a role in windstorm impacts, highlighting the need for comprehensive, multivariate analysis.
Using impact data is crucial for understanding windstorm damage, developing new impact models and enhancing meteorological tools. However, challenges such as data reliability, variability and limitations of current datasets need to be addressed (Láng-Ritter and Mäkelä, 2021). Although our results are not directly usable for operational impact forecasts or warnings, they demonstrate the high potential of such new meteorological applications. An operational impact model (likely machine learning-based) would need to be trained with an extensive dataset of meteorological, environmental and impact variables, and it would need to be tested and validated in real cases. In a national Finnish context, this would be possible to establish due to the availability of impact (i.e. power outage) data, but unfortunately for larger regions such a service would be difficult to establish due to limitations in the impact data availability. In summary, this study improves our understanding of extratropical cyclones and windstorm impacts, highlighting the importance of seasonality and regional characteristics. Future research should explore the relationship between meteorological conditions and societal and environmental factors to enhance resilience to windstorm impacts. Extending the work to include analysis of vulnerability (e.g. electricity grid located close to trees) and exposure (the part of the electricity grid above the ground) would then also improve the understanding of windstorm risks. The classification method could likely be applied especially to other northern European forested countries, though some adjustments may be needed.
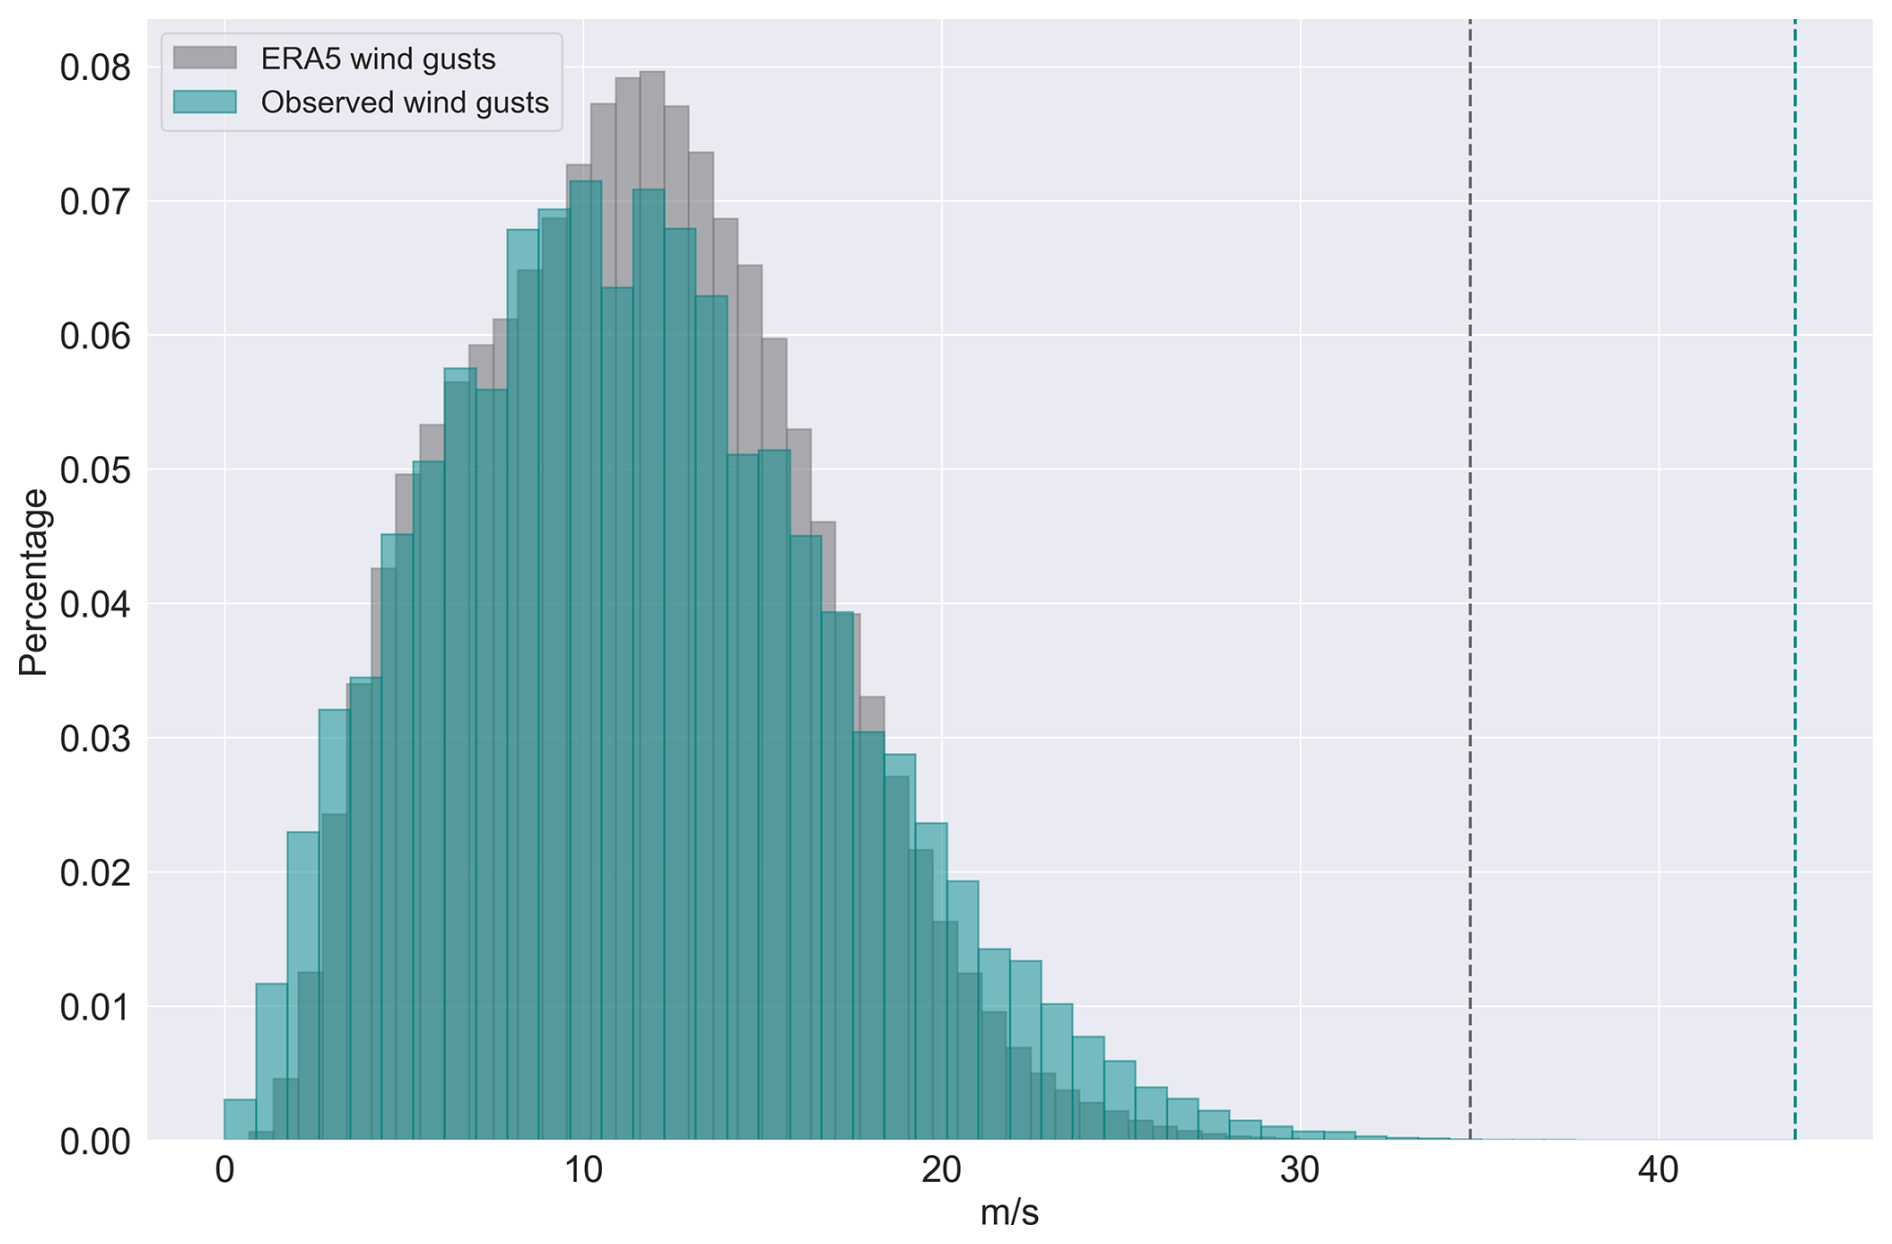
Figure A1Comparison between ERA5 reanalysis and observed wind gust values in Finland (2005–2018). ERA5 wind gusts are represented in grey and observed wind gusts in green. The dashed lines represent the maximum wind gust speed value for both datasets. The ERA5 wind gust values represent all recorded wind gusts within the Finland box during the windstorm dates.
Table A1Pearson's correlation coefficient for different parameters and p values.
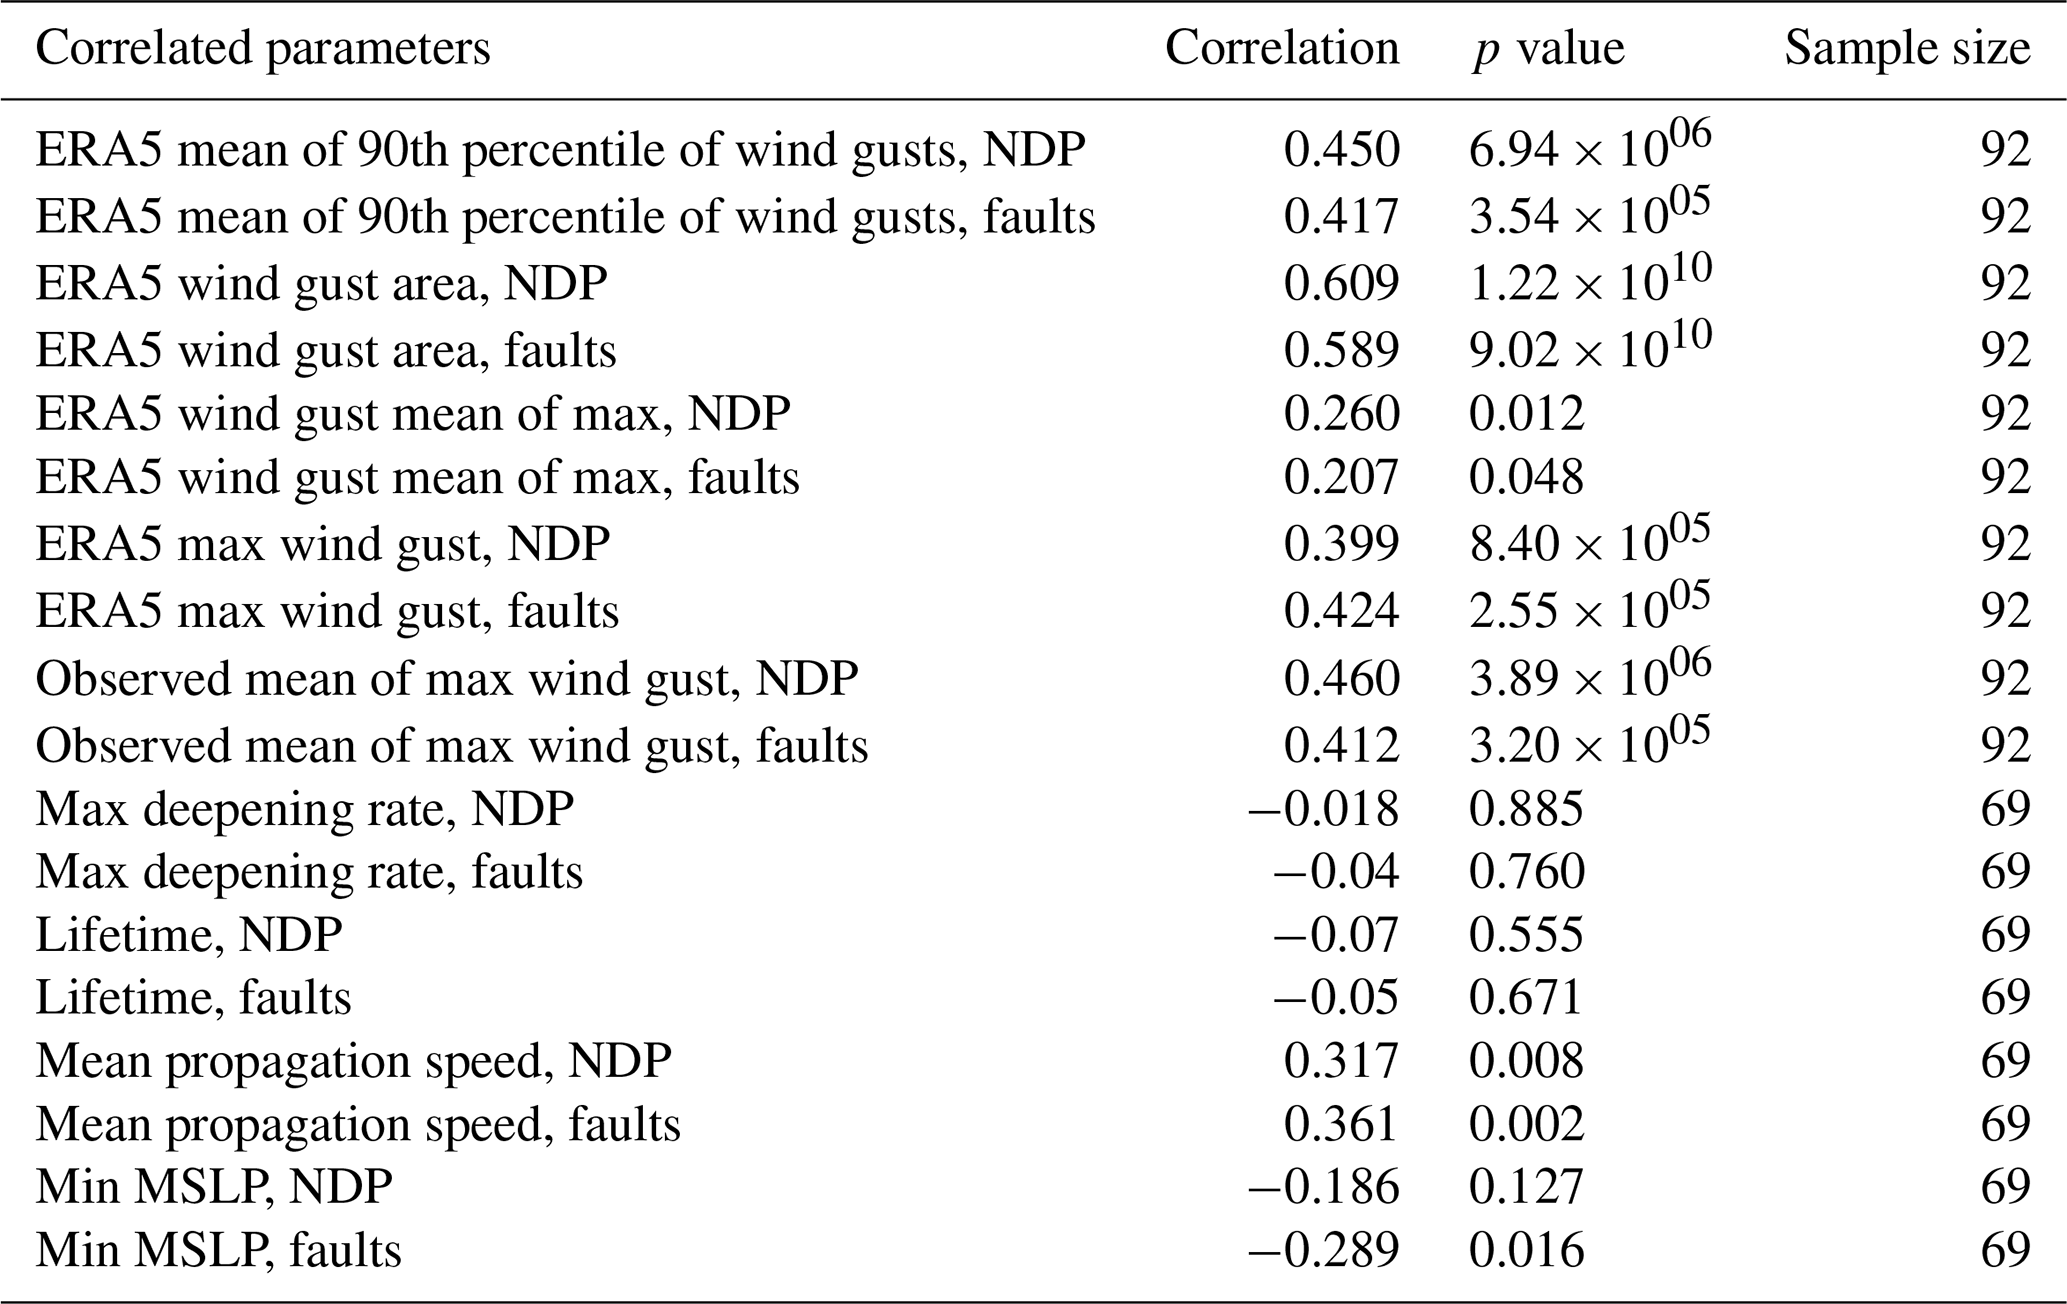
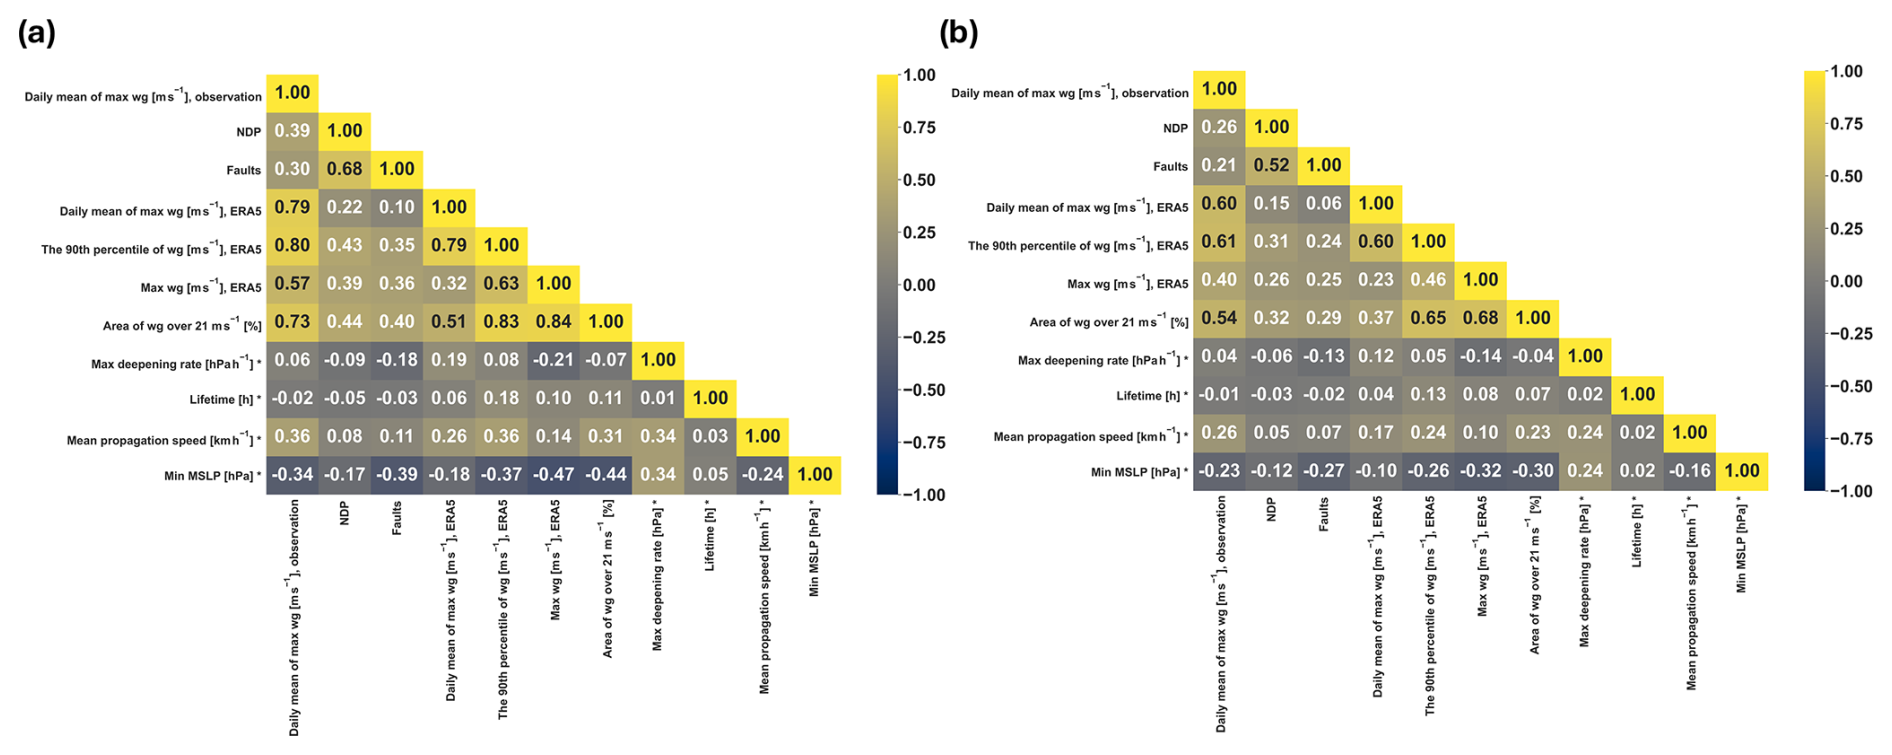
Figure A2(a) Spearman and (b) Kendall correlation coefficient values for meteorological parameters.
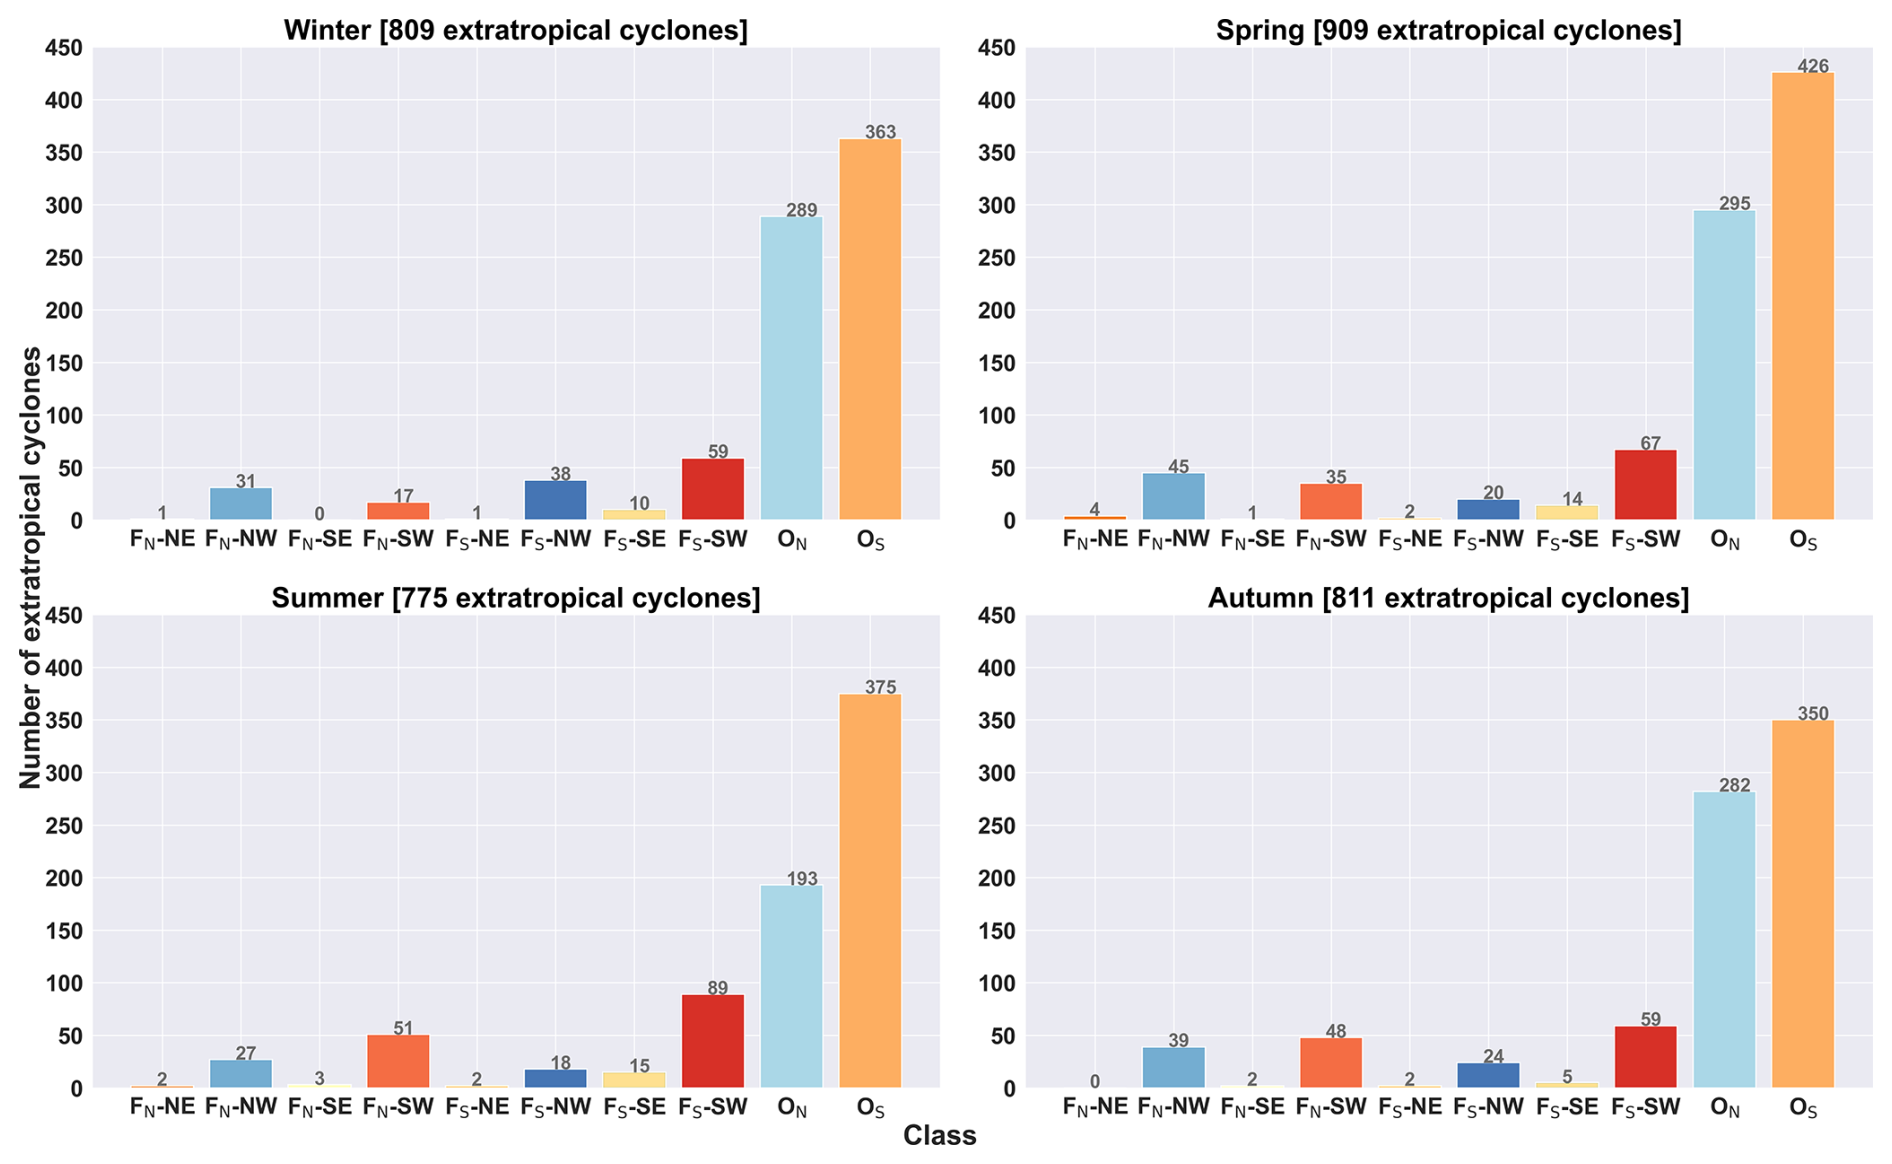
Figure A3The seasonal distribution of all extratropical cyclones between 2005 and 2018. The number inside the brackets in the titles represents the total number of extratropical cyclones during the season.
The extratropical cyclone tracks in northern Europe for 2005–2018 are available on Zenodo: https://doi.org/10.5281/zenodo.13807849 (Láng-Ritter et al., 2024). The ERA5 data can be downloaded from the Copernicus Climate Data Store: https://doi.org/10.24381/cds.bd0915c6 (Hersbach et al., 2023). The FMI wind observation data can be downloaded using the open data portal of the FMI: https://en.ilmatieteenlaitos.fi/download-observations (FMI, 2025). The authors do not have property rights to distribute the power outage data other than in scientific cooperation.
ILR conceptualised the classification method, filtered and analysed the power outage data, and wrote a significant part of the article. TKL tracked the extratropical cyclones, extracted their characteristics, contributed to writing the meteorological sections and revised the article. AM and HG gave advice, revised the article and provided funding. VAS provided supervision, advice and guidance on scientific viewpoints and edited and revised the article.
The contact author has declared that none of the authors has any competing interests.
Publisher's note: Copernicus Publications remains neutral with regard to jurisdictional claims made in the text, published maps, institutional affiliations, or any other geographical representation in this paper. While Copernicus Publications makes every effort to include appropriate place names, the final responsibility lies with the authors.
Research for this paper at the Finnish Meteorological Institute was funded by the European Union's Horizon Europe programme (CREXDATA project, grant agreement no. 101092749), NordForsk (NordicLink project, project no. 98335) and the LODE project (2018–2021, European Commission – DG ECHO). The research at the University of Helsinki was supported by the Academy of Finland (grant no. 338615). The authors would like to thank Enease Oy for providing the power interruption data and insights into the electricity distribution system in Finland. Additionally, the authors sincerely thank Josias Láng-Ritter from Aalto University for his valuable comments and assistance in editing the article. The language of the paper was in some parts revised using ChatGPT; however, ILR reviewed and edited the suggested text and takes responsibility for this publication's final content.
This research has been supported by the Horizon Europe Research Infrastructures (grant no. 101092749), the European Civil Protection and Humanitarian Aid Operations (grant no. 826567), NordForsk (grant no. 98335), and the Research Council of Finland (grant no. 338615).
This paper was edited by Joaquim G. Pinto and reviewed by three anonymous referees.
Bengtsson, L., Hodges, K. I., and Roeckner, E.: Storm Tracks and Climate Change, J. Climate, 19, 3518–3543, https://doi.org/10.1175/JCLI3815.1, 2006. a, b, c
Bjerknes, J. and Solberg, H.: Life cycle of cyclones and the polar front theory of atmospheric circulation, Geophys. Publ., 3, 1–18, 1922. a
Browning, K. A.: The sting at the end of the tail: Damaging winds associated with extratropical cyclones, Q. J. Roy. Meteor. Soc., 130, 375–399, https://doi.org/10.1256/qj.02.143, 2004. a
Campins, J., Genovés, A., Jansà, A., Guijarro, J., and Ramis, C.: A catalogue and a classification of surface cyclones for the Western Mediterranean, Int. J. Climatol., 20, 969–984, https://doi.org/10.1002/1097-0088(200007)20:9<969::AID-JOC519>3.0.CO;2-4, 2000. a
Catto, J. L.: Extratropical cyclone classification and its use in climate studies, Rev. Geophys., 54, 486–520, https://doi.org/10.1002/2016RG000519, 2016. a
Catto, J. L., Shaffrey, L. C., and Hodges, K. I.: Can Climate Models Capture the Structure of Extratropical Cyclones?, J. Climate, 23, 1621–1635, https://doi.org/10.1175/2009JCLI3318.1, 2010. a
Catto, J. L., Shaffrey, L. C., and Hodges, K. I.: Northern Hemisphere Extratropical Cyclones in a Warming Climate in the HiGEM High-Resolution Climate Model, J. Climate, 24, 5336–5352, https://doi.org/10.1175/2011JCLI4181.1, 2011. a
Chang, E. K. M., Guo, Y., Xia, X., and Zheng, M.: Storm-Track Activity in IPCC AR4/CMIP3 Model Simulations, J. Climate, 26, 246–260, https://doi.org/10.1175/JCLI-D-11-00707.1, 2013. a
Chen, T.-C., Collet, F., and Di Luca, A.: Evaluation of ERA5 precipitation and 10-m wind speed associated with extratropical cyclones using station data over North America, Int. J. Climatol., 44, 729–747, https://doi.org/10.1002/joc.8339, 2024. a
Christensen, J., Kanikicharla, K., Aldrian, E., An, S., Albuquerque Cavalcanti, I., de Castro, M., Dong, W., Goswami, P., Hall, A., Kanyanga, J., Kitoh, A., Kossin, J., Lau, N., Renwick, J., Stephenson, D., Xie, S., Zhou, T., Abraham, L., Ambrizzi, T., Anderson, B., Arakawa, O., Arritt, R., Baldwin, M., Barlow, M., Barriopedro, D., Biasutti, M., Biner, S., Bromwich, D., Brown, J., Cai, W., Carvalho, L., Chang, P., Chen, X., Choi, J., Christensen, O., Deser, C., Emanuel, K., Endo, H., Enfield, D., Evan, A., Giannini, A., Gillett, N., Hariharasubramanian, A., Huang, P., Jones, J., Karumuri, A., Katzfey, J., Kjellström, E., Knight, J., Knutson, T., Kulkarni, A., Kundeti, K., Lau, W., Lenderink, G., Lennard, C., Leung, L., Lin, R., Losada, T., Mackellar, N., Magaña, V., Marshall, G., Mearns, L., Meehl, G., Menéndez, C., Murakami, H., Nath, M., Neelin, J., van Oldenborgh, G., Olesen, M., Polcher, J., Qian, Y., Ray, S., Reich, K., de Fonseca, B., Ruti, P., Screen, J., Sedláček, J., Solman, S., Stendel, M., Stevenson, S., Takayabu, I., Turner, J., Ummenhofer, C., Walsh, K., Wang, B., Wang, C., Watterson, I., Widlansky, M., Wittenberg, A., Woollings, T., Yeh, S., Zhang, C., Zhang, L., Zheng, X., and Zou, L.: Climate phenomena and their relevance for future regional climate change, vol. 9781107057999, publisher Copyright: ©Intergovernmental Panel on Climate Change 2014, Cambridge University Press, United Kingdom, https://doi.org/10.1017/CBO9781107415324.028, 1217–1308 pp., 2013. a
Cornér, J., Bouvier, C., Doiteau, B., Pantillon, F., and Sinclair, V. A.: Classification of North Atlantic and European extratropical cyclones using multiple measures of intensity, Nat. Hazards Earth Syst. Sci., 25, 207–229, https://doi.org/10.5194/nhess-25-207-2025, 2025. a
ECMWF: Part IV: Physical Processes, chap. 4, IFS Documentation, ECMWF, https://www.ecmwf.int/node/16648 (last access: 3 February 2021), 2016. a
ECMWF: ERA5: large 10m winds, European Centre for Medium-Range Weather Forecasts, https://confluence.ecmwf.int/display/CKB/ERA5:+large+10m+winds (last access: 8 May 2025), 2019. a
ECMWF: Fact sheet: Reanalysis, ECMWF, https://www.ecmwf.int/en/about/media-centre/focus/2020/fact-sheet-reanalysis (last access: 8 May 2025), 2020. a
ECMWF: Parameter details, ECMWF, https://apps.ecmwf.int/codes/grib/param-db/?id=49 (last access: 8 May 2025), 2022. a
Feser, F., Barcikowska, M., Krueger, O., Schenk, F., Weisse, R., and Xia, L.: Storminess over the North Atlantic and northwestern Europe—A review, Q. J. Roy. Meteor. Soc., 141, 350–382, https://doi.org/10.1002/qj.2364, 2015. a
Finnish Energy: About Us, Finnish Energy, https://energia.fi/en/about_us (last access: 8 May 2025), 2021. a
Finnish Meteorological Institute: Open data, observation download service, Zenodo, https://en.ilmatieteenlaitos.fi/download-observations (last access: 8 May 2025), 2020. a
Finnish Meteorological Institute: Strong low-pressure systems, Finnish Meteorological institute, https://www.ilmatieteenlaitos.fi/voimakkaat-matalapaineet (last access: 8 May 2025), 2022. a
FMI: Download observations, Finnish Meteorological Institute's open data service, https://en.ilmatieteenlaitos.fi/download-observations (last access: 8 May 2025), 2025. a
Gardiner, B., Schuck, A., Schelhaas, M.-J., Orazio, C., Blennow, K., and Nicoll, B.: Storm damage in Europe – an overview, European Forest Institute, https://efi.int/publications-bank/living-storm-damage-forests (last access: 8 May 2025), 2013. a
Gregow, H., Peltola, H., Laapas, M., Saku, S., Venäläinen, A., and Laapas, H.: Combined Occurrence of Wind, Snow Loading and Soil Frost with Implications for Risks to Forestry in Finland under the Current and Changing Climatic, Silva Fenn., 45, 35–54, https://doi.org/10.14214/sf.30, 2011. a
Gregow, H., Rantanen, M., Laurila, T. K., and Mäkelä, A.: Review on winds, extratropical cyclones and their impacts in northern Europe and Finland, Tech. rep., Finnish Meteorological Institute, https://doi.org/10.35614/isbn.9789523361188, 2020. a
Haakana, J., Räisänen, O., Karhunen, M., Láng-Ritter, I., and Lassila, J.: Impact of Wind Speed and Soil Frost on Electricity Distribution System Reliability, Heliyon, 10, e40846, https://doi.org/10.2139/ssrn.4756613, 2024. a, b, c
Haarsma, R.: European Windstorm Risk of Post-Tropical Cyclones and the Impact of Climate Change, Geophys. Res. Lett., 48, e2020GL091483, https://doi.org/10.1029/2020GL091483, 2021. a
Haarsma, R. J., Hazeleger, W., Severijns, C., De Vries, H., Sterl, A., Bintanja, R., Van Oldenborgh, G. J., and Van Den Brink, H. W.: More hurricanes to hit western Europe due to global warming, Geophys. Res. Lett., 40, 1783–1788, https://doi.org/10.1002/grl.50360, 2013. a
Hersbach, H., Bell, B., Berrisford, P., Hirahara, S., Horányi, A., Muñoz-Sabater, J., Nicolas, J., Peubey, C., Radu, R., Schepers, D., Simmons, A., Soci, C., Abdalla, S., Abellan, X., Balsamo, G., Bechtold, P., Biavati, G., Bidlot, J., Bonavita, M., De Chiara, G., Dahlgren, P., Dee, D., Diamantakis, M., Dragani, R., Flemming, J., Forbes, R., Fuentes, M., Geer, A., Haimberger, L., Healy, S., Hogan, R. J., Hólm, E., Janisková, M., Keeley, S., Laloyaux, P., Lopez, P., Lupu, C., Radnoti, G., de Rosnay, P., Rozum, I., Vamborg, F., Villaume, S., and Thépaut, J.-N.: The ERA5 Global Reanalysis, Q. J. Roy. Meteor. Soc., 146, 1999–2049, https://doi.org/10.1002/qj.3803, 2020. a
Hersbach, H., Bell, B., Berrisford, P., Biavati, G., Horányi, A., Muñoz Sabater, J., Nicolas, J., Peubey, C., Radu, R., Rozum, I., Schepers, D., Simmons, A., Soci, C., Dee, D., and Thépaut, J.-N.: ERA5 hourly data on pressure levels from 1940 to present, Copernicus Climate Change Service (C3S) Climate Data Store (CDS) [data set], https://doi.org/10.24381/cds.bd0915c6, 2023. a
Hodges, K. I.: A General Method for Tracking Analysis and Its Application to Meteorological Data, Mon. Weather Rev., 122, 2573–2586, https://doi.org/10.1175/1520-0493(1994)122<2573:AGMFTA>2.0.CO;2, 1994. a
Hodges, K. I.: Feature Tracking on the Unit Sphere, Mon. Weather Rev., 123, 3458–3465, https://doi.org/10.1175/1520-0493(1995)123<3458:FTOTUS>2.0.CO;2, 1995. a
Hodges, K. I.: Adaptive Constraints for Feature Tracking, Mon. Weather Rev., 127, 1362–1373, https://doi.org/10.1175/1520-0493(1999)127<1362:ACFFT>2.0.CO;2, 1999. a
Hoskins, B. J. and Hodges, K. I.: The Annual Cycle of Northern Hemisphere Storm Tracks. Part II: Regional Detail, J. Climate, 32, 1761–1775, https://doi.org/10.1175/JCLI-D-17-0871.1, 2019. a
Jasiūnas, J., Heikkinen, T., Lund, P. D., and Láng-Ritter, I.: Resilience of electric grid to extreme wind: Considering local details at national scale, Reliab. Eng. Syst. Safe., 232, 109070, https://doi.org/10.1016/j.ress.2022.109070, 2023a. a, b
Jasiūnas, J., Láng-Ritter, I., Heikkinen, T., and Lund, P. D.: Electricity Load Lost in the Largest Windstorms—Is the Fragility-Based Model up to the Task?, Energies, 16, 5678, https://doi.org/10.3390/en16155678, 2023b. a, b
Jasiūnas, J., Láng-Ritter, I., Heikkinen, T., and Lund, P. D.: Case beyond historical severity: Winds, faults, outages, and costs for electric grid, Appl. Energ., 373, 123884, https://doi.org/10.1016/j.apenergy.2024.123884, 2024. a
Kellomäki, S., Strandman, H., Kilpeläinen, A., and Peltola, H.: Model computations on the climate change effects on snow cover, soil moisture and soil frost in the boreal conditions over Finland, Silva Fenn., 44, 213–233, https://doi.org/10.14214/sf.455, 2010. a
Klawa, M. and Ulbrich, U.: A model for the estimation of storm losses and the identification of severe winter storms in Germany, Nat. Hazards Earth Syst. Sci., 3, 725–732, https://doi.org/10.5194/nhess-3-725-2003, 2003. a, b
Klein, P. M., Harr, P. A., and Elsberry, R. L.: Extratropical Transition of Western North Pacific Tropical Cyclones: An Overview and Conceptual Model of the Transformation Stage, Weather Forecast., 15, 373–395, https://doi.org/10.1175/1520-0434(2000)015<0373:ETOWNP>2.0.CO;2, 2000. a
Laapas, M. and Venäläinen, A.: Homogenization and trend analysis of monthly mean and maximum wind speed time series in Finland, 1959–2015, Int. J. Climatol., 37, 4803–4813, https://doi.org/10.1002/joc.5124, 2017. a
Láng-Ritter, I., Laurila, T. K., Mäkelä, A., Gregow, H., and Sinclair, V. A.: The extratropical cyclone tracks in Northern Europe for 2005–2018, Zenodo [data set], https://doi.org/10.5281/zenodo.13807849, 2024. a
Laurila, T. K., Gregow, H., Cornér, J., and Sinclair, V. A.: Characteristics of extratropical cyclones and precursors to windstorms in northern Europe, Weather Clim. Dynam., 2, 1111–1130, https://doi.org/10.5194/wcd-2-1111-2021, 2021a. a, b, c, d
Laurila, T. K., Sinclair, V. A., and Gregow, H.: Climatology, variability, and trends in near-surface wind speeds over the North Atlantic and Europe during 1979–2018 based on ERA5, Int. J. Climatol., 41, 2253–2278, https://doi.org/10.1002/joc.6957, 2021b. a
Lehtonen, I., Venäläinen, A., Kämäräinen, M., Asikainen, A., Laitila, J., Anttila, P., and Peltola, H.: Projected decrease in wintertime bearing capacity on different forest and soil types in Finland under a warming climate, Hydrol. Earth Syst. Sci., 23, 1611–1631, https://doi.org/10.5194/hess-23-1611-2019, 2019. a
Láng-Ritter, I. and Mäkelä, A.: Lessons learned from working with windstorm-related impact data, in: EGU General Assembly 2021, online, 19–30 Apr 2021, EGU21-8288, https://doi.org/10.5194/egusphere-egu21-8288, 2021, 2021. a
Láng-Ritter, I., Mäkelä, A., van Kooten, S., Perrels, A., Gisnås, K., and Laapas, M.: Impacts of soil-frost on wind-related energy grid disturbances, in: EMS Annual Meeting 2023, Bratislava, Slovakia, 4–8 Sep 2023, EMS2023-395, https://doi.org/10.5194/ems2023-395, 2023. a
Masson-Delmotte, T., Zhai, P., Pörtner, H.-O., Roberts, D. C., Skea, J., Shukla, P. R., Pirani, A., Moufouma-Okia, W., Péan, C., Pidcock, R., Connors, S., Matthews, J. B. R., Yang, C., Zhou, X., and Steg, L.: IPCC: Summary for Policymakers, in: Global warming of 1.5 °C: Summary for policy makers. IPCC - The Intergovernmental Panel on Climate Change, IPCC, Geneva, Switzerland, 2018. a
Minola, L., Zhang, F., Azorin-Molina, C., Safaei Pirooz, A. A., Flay, R. G. J., Hersbach, H., and Chen, D.: Near-surface mean and gust wind speeds in ERA5 across Sweden: Towards an improved gust parametrization, Clim. Dynam., 55, 887–907, https://doi.org/10.1007/s00382-020-05302-6, 2020. a, b
Nissen, K. M., Leckebusch, G. C., Pinto, J. G., Renggli, D., Ulbrich, S., and Ulbrich, U.: Cyclones causing wind storms in the Mediterranean: characteristics, trends and links to large-scale patterns, Nat. Hazards Earth Syst. Sci., 10, 1379–1391, https://doi.org/10.5194/nhess-10-1379-2010, 2010. a
Nurmi, V., Pilli-Sihvola, K., Gregow, H., and Perrels, A.: Overadaptation to Climate Change? The Case of the 2013 Finnish Electricity Market Act, Economics of Disasters and Climate Change, 3, 161–190, https://doi.org/10.1007/s41885-018-0038-1, 2019. a
Oppenheimer, M., Campos, M., Warren, R., Birkmann, J., Luber, G., O'Neill, B., and Takahashi, K.: Emergent risks and key vulnerabilities, in: Climate Change 2014: Impacts, Adaptation, and Vulnerability. Part A: Global and Sectoral Aspects. Contribution of Working Group II to the Fifth Assessment Report of the Intergovernmental Panel on Climate Change, edited by: Field, C. B., Barros, V. R., Dokken, D. J., Mach, K. J., Mastrandrea, M. D., Bilir, T. E., Chatterjee, M., Ebi, K. L., Estrada, Y. O., Genova, R. C., Girma, B., Kissel, E. S., Levy, A. N., MacCracken, S., Mastrandrea, P. R., and White, L. L., Cambridge University Press, Cambridge, United Kingdom and New York, pp. 1039–1099, 2014. a
Panteli, M. and Mancarella, P.: Modeling and Evaluating the Resilience of Critical Electrical Power Infrastructure to Extreme Weather Events, IEEE Systems Journal, 11, 1733–1742, https://doi.org/10.1109/JSYST.2015.2389272, 2017. a
Priestley, M. D. K. and Catto, J. L.: Future changes in the extratropical storm tracks and cyclone intensity, wind speed, and structure, Weather Clim. Dynam., 3, 337–360, https://doi.org/10.5194/wcd-3-337-2022, 2022. a, b
Ramon, J., Lledó, L., Torralba, V., Soret, A., and Doblas-Reyes, F. J.: What global reanalysis best represents near-surface winds?, Natural Disasters and Adaptation to Climate Change, 145, 3236–3251, https://doi.org/10.1002/qj.3616, 2019. a
Rasmussen, E. and Turner, J.: Polar Lows: Mesoscale Weather Systems in the Polar Regions, Cambridge University Press, https://doi.org/10.1017/CBO9780511524974, 2003. a
Rullaud, L. and Gruber, C: Power Distribution in Europe, Facts and Figures, https://www.eurelectric.org/publications/distribution-grids-in-europe-facts-and-figures-2020/ (last access: 8 May 2025), 2019. a
Ruosteenoja, K. and Jylhä, K.: Projected climate change in Finland during the 21st century calculated from CMIP6 model simulations, Geophysica, 56, 39–69, 2022. a
Ruosteenoja, K., Vihma, T., and Venäläinen, A.: Projected Changes in European and North Atlantic Seasonal Wind Climate Derived from CMIP5 Simulations, J. Climate, 32, 6467–6490, https://doi.org/10.1175/JCLI-D-19-0023.1, 2019. a
Sanders, F. and Gyakum, J., R.: Synoptic-Dynamic Climatology of the “Bomb”, Mon. Weather Rev., 108, 1589–1606, https://doi.org/10.1175/1520-0493(1980)108<1589:SDCOT>2.0.CO;2, 1980. a
Schelhaas, M.-J.: Impacts of natural disturbances on the development of European forest resources: application of model approaches from tree and stand levels to large-scale scenarios, Dissertationes Forestales, Finnish Society of Forest Science, https://doi.org/10.14214/df.56, 2008. a
Schelhaas, M.-J., Nabuurs, G.-J., and Schuck, A.: Natural disturbances in the European forests in the 19th and 20th centuries, Glob. Change Biol., 9, 1620–1633, https://doi.org/10.1046/j.1365-2486.2003.00684.x, 2003. a
Shapiro, M. A. and Keyser, D.: Fronts, jet streams, and the tropopause, in: Extratropical Cyclones, The Erik Palmén Memorial Volume, edited by: Newton, C. and Holopainen, E. O., American Meteorological Society, Boston, MA, 167–191 pp., Online ISBN 978-1-944970-33-8, 1990. a
Shestakova, A. A., Fedotova, E. V., and Lyulyukin, V. S.: Relevance of ERA5 Reanalysis for Wind Energy Applications: Comparison with Sodar Observations, Geography Environment Sustainability, 17, 54–66, https://doi.org/10.24057/2071-9388-2023-2782, 2024. a
Sinclair, V. A., Rantanen, M., Haapanala, P., Räisänen, J., and Järvinen, H.: The characteristics and structure of extra-tropical cyclones in a warmer climate, Weather Clim. Dynam., 1, 1–25, https://doi.org/10.5194/wcd-1-1-2020, 2020. a, b, c
Tervo, R., Láng, I., Jung, A., and Mäkelä, A.: Predicting power outages caused by extratropical storms, Nat. Hazards Earth Syst. Sci., 21, 607–627, https://doi.org/10.5194/nhess-21-607-2021, 2021. a, b
Turney, S.: Scribbr, https://www.scribbr.com/statistics/pearson-correlation-coefficient/ (last access: 31 January 2025), 2022. a
Ulbrich, U., Leckebusch, G. C., and Pinto, J. G.: Extra-tropical cyclones in the present and future climate: A review, Theor. Appl. Climatol., 96, 117–131, https://doi.org/10.1007/s00704-008-0083-8, 2009. a
Valta, H., Lehtonen, I., Laurila, T. K., Venäläinen, A., Laapas, M., and Gregow, H.: Communicating the amount of windstorm induced forest damage by the maximum wind gust speed in Finland, Adv. Sci. Res., 16, 31–37, https://doi.org/10.5194/asr-16-31-2019, 2019. a
Venäläinen, A., Lehtonen, I., Laapas, M., Ruosteenoja, K., Tikkanen, O.-P., Viiri, H., Ikonen, V.-P., and Peltola, H.: Climate change induces multiple risks to boreal forests and forestry in Finland: A literature review, Glob. Change Biol., 26, 4178–4196, https://doi.org/10.1111/gcb.15183, 2020. a
Wernli, H., Dirren, S., Liniger, M. A., and Zillig, M.: Dynamical aspects of the life cycle of the winter storm `Lothar' (24–26 December 1999), Q. J. Roy. Meteor. Soc., 128, 405–429, https://doi.org/10.1256/003590002321042036, 2002. a
Wickström, S., Jonassen, M. O., Vihma, T., and Uotila, P.: Trends in cyclones in the high-latitude North Atlantic during 1979–2016, Q. J. Roy. Meteor. Soc., 146, 762–779, https://doi.org/10.1002/QJ.3707, 2020. a
Zappa, G., Shaffrey, L. C., Hodges, K. I., Sansom, P. G., and Stephenson, D. B.: A Multimodel Assessment of Future Projections of North Atlantic and European Extratropical Cyclones in the CMIP5 Climate Models, J. Climate, 26, 5846–5862, https://doi.org/10.1175/JCLI-D-12-00573.1, 2013. a, b