the Creative Commons Attribution 4.0 License.
the Creative Commons Attribution 4.0 License.
 | 29 Apr 2025
Mapping vulnerability to climate change for spatial planning in the region of Stuttgart
Joanna M. McMillan
Franziska Göttsche
Joern Birkmann
Rainer Kapp
Corinna Schmidt
Britta Weisser
Ali Jamshed
The Stuttgart region in southwest Germany already experiences heat stress and extreme precipitation events. According to German law, spatial planning at the municipal and regional levels has an important role in adapting to such events. However, this is a challenge to achieve alongside other demands on land use. One important resource to support adaptive planning is spatial risk analyses, which can provide justification for prioritising adaptation and information about where and how to prioritise different measures. Such maps should not just consider information on the nature of the hazards but also on the vulnerability of people and exposed areas. While in theory this has been recognised and vulnerability analysis methods have been developed, there is a significant gap in linking this research to planning practice in the German context. In this paper, we use a GIS-based method for mapping quantitative indicators of social vulnerability to heat and pluvial flooding for the region of Stuttgart. We share insights from the process of developing these maps based on the needs of spatial planning and discuss how such information can be used in planning practice. We propose solutions regarding issues such as spatial resolution, indicator selection, aggregation, and complexity; report initial feedback from planners; and make recommendations for further bridging the gap between risk and vulnerability research and planning practice.
- Article
(10169 KB) - Full-text XML
-
Supplement
(436 KB) - BibTeX
- EndNote


Heatwaves and extreme rainfall events have had dire consequences around the world, including in Germany, and some people are more affected than others are from such impacts (IPCC, 2022). For example, in both the European heatwave of 2003 and the Ahr Valley flooding in 2021, older people were overrepresented in the fatalities (DKKV, 2022; Winklmayr et al., 2022). In Germany, heatwaves are becoming more probable and severe (Hundhausen et al., 2023), and heavy rainfall events are becoming more intense and erosive (Deumlich and Gericke, 2020). These hazards are not just exacerbated by climate change but also by climate-insensitive urban development, for example, through urban expansion into areas important for urban ventilation or for water management, or through development of settlement areas with high rates of soil sealing or lack of blue-green infrastructure (Rüdiger, 2018). At the same time, the population in Germany is ageing and thus the number of people particularly susceptible to heath impacts of climate extremes is increasing. In addition to age, other factors including the socioeconomic situation of individuals and areas also influence if a person is able to prepare for or deal with extreme climate events (Bolte et al., 2023). In order to reduce the impact of climate extremes on people and settlements, we need to consider different factors that contribute to climate risks, including the urban environment, demographic and socioeconomic structures, and adaptive capacities, in addition to the nature of the hazards themselves. This has been recognised in policy, for example, in the state adaptation strategy of the case study region which states, “Socioeconomic and demographic characteristics… are important for assessing the health risk associated with climate change” (Ministerium für Umwelt, Klima und Energiewirtschaft Baden-Württemberg, 2023, p. 30, own translation).
Spatial planning at the regional and local levels can play an important role in reducing climate risk (Hurlimann and March, 2012; Hurlimann et al., 2021). That it is necessary for spatial planning to address climate change adaptation, in addition to mitigation, is stipulated in German planning law (see Regional Planning Act amendment in 2008; Federal Building Code amendments in 2011 and 2013; Regional Planning Act § 1 Para. 2; Federal Building Code § 1 Para. 6). Spatial planning can influence how the built environment and land-use change modifies hazards, for example, through altering the heat-island effect, water retention, or air and water flows. This has been recognised by policy (e.g. Ministerium für Umwelt, Klima und Energiewirtschaft Baden-Württemberg, 2023, p. 59). However, spatial planning also has implications for social equality and for people's ability to deal with hazards, for example, by being able to access shaded parks during a heatwave or the accessibility of essential and emergency services by vulnerable populations. In general, the impact of social inequalities on climate risk and vice versa is still insufficiently addressed in Germany (Bolte et al., 2023), including in the field of spatial planning in which the implications for, and relevance of, adaptive capacities and social vulnerability are not well recognised (Greiving and Fleischhauer, 2022).
The need for an information basis about risk, including vulnerability, for planning has been recognised in policy (Ministerium für Umwelt, Klima und Energiewirtschaft Baden-Württemberg, 2023). While hazard mapping and the integration of these maps into planning is still a dynamically developing field, there are relatively well-established methods, particularly regarding heat stress. In contrast, the necessary spatial information about vulnerability to determine to what extent the exposure of particular areas poses a risk to the population and settlement function remains largely in the realm of research. While there are established methods for performing vulnerability analyses, the practical application of their results by planning authorities in Germany is far from standard procedure (Greiving and Fleischhauer, 2022). Reasons for this include methodological challenges of spatial vulnerability analyses, as well as a lack of translation of analysis results into maps that can be used in planning processes. This gap between research on spatial vulnerability analyses and their usability in spatial planning practice is the focus of our paper. We address the following research questions:
-
What are the requirements for maps of vulnerability from a spatial planning perspective?
-
How can vulnerability to climate extremes be mapped in a way that spatial planners can use?
-
How can vulnerability maps be interpreted and used in planning practice?
We investigate these research questions in the case study region of Stuttgart, Germany, as part of a transdisciplinary process to create an online tool for planners to support climate adaptation. This tool is to include spatial information about the hazards of pluvial flooding and urban heat islands as well as the other dimensions of risk, including vulnerability. Thus, it was necessary also from a practical perspective to bridge the gap between vulnerability research and planning practice. In this paper, we share the insights gained from this process of working with planners to include vulnerability in the information basis about climate risk for planning.
In this paper, we first summarise the research on the spatial dimension of vulnerability and methodological challenges of mapping vulnerability, as well as the gap between research and planning practice (Sect. 2). The following sections outline the case study and the research approach (Sect. 3), present the preliminary findings about planning requirements (Sect. 4.1) and data availability (Sect. 4.2), and justify the selection of key vulnerability indicators for the Stuttgart region (Sect. 4.3). These preliminary findings provide the basis for the chosen GIS-based vulnerability mapping methods described in Sect. 5. In Sect. 6, we present the final catalogue of maps for the Stuttgart region's adaptation planning tool. We then discuss the usability of the vulnerability maps to assess risk (Sect. 7.1), feedback from planners (Sect. 7.2), and recommendations for further bridging the gap between vulnerability mapping and planning practice (Sect. 7.3).
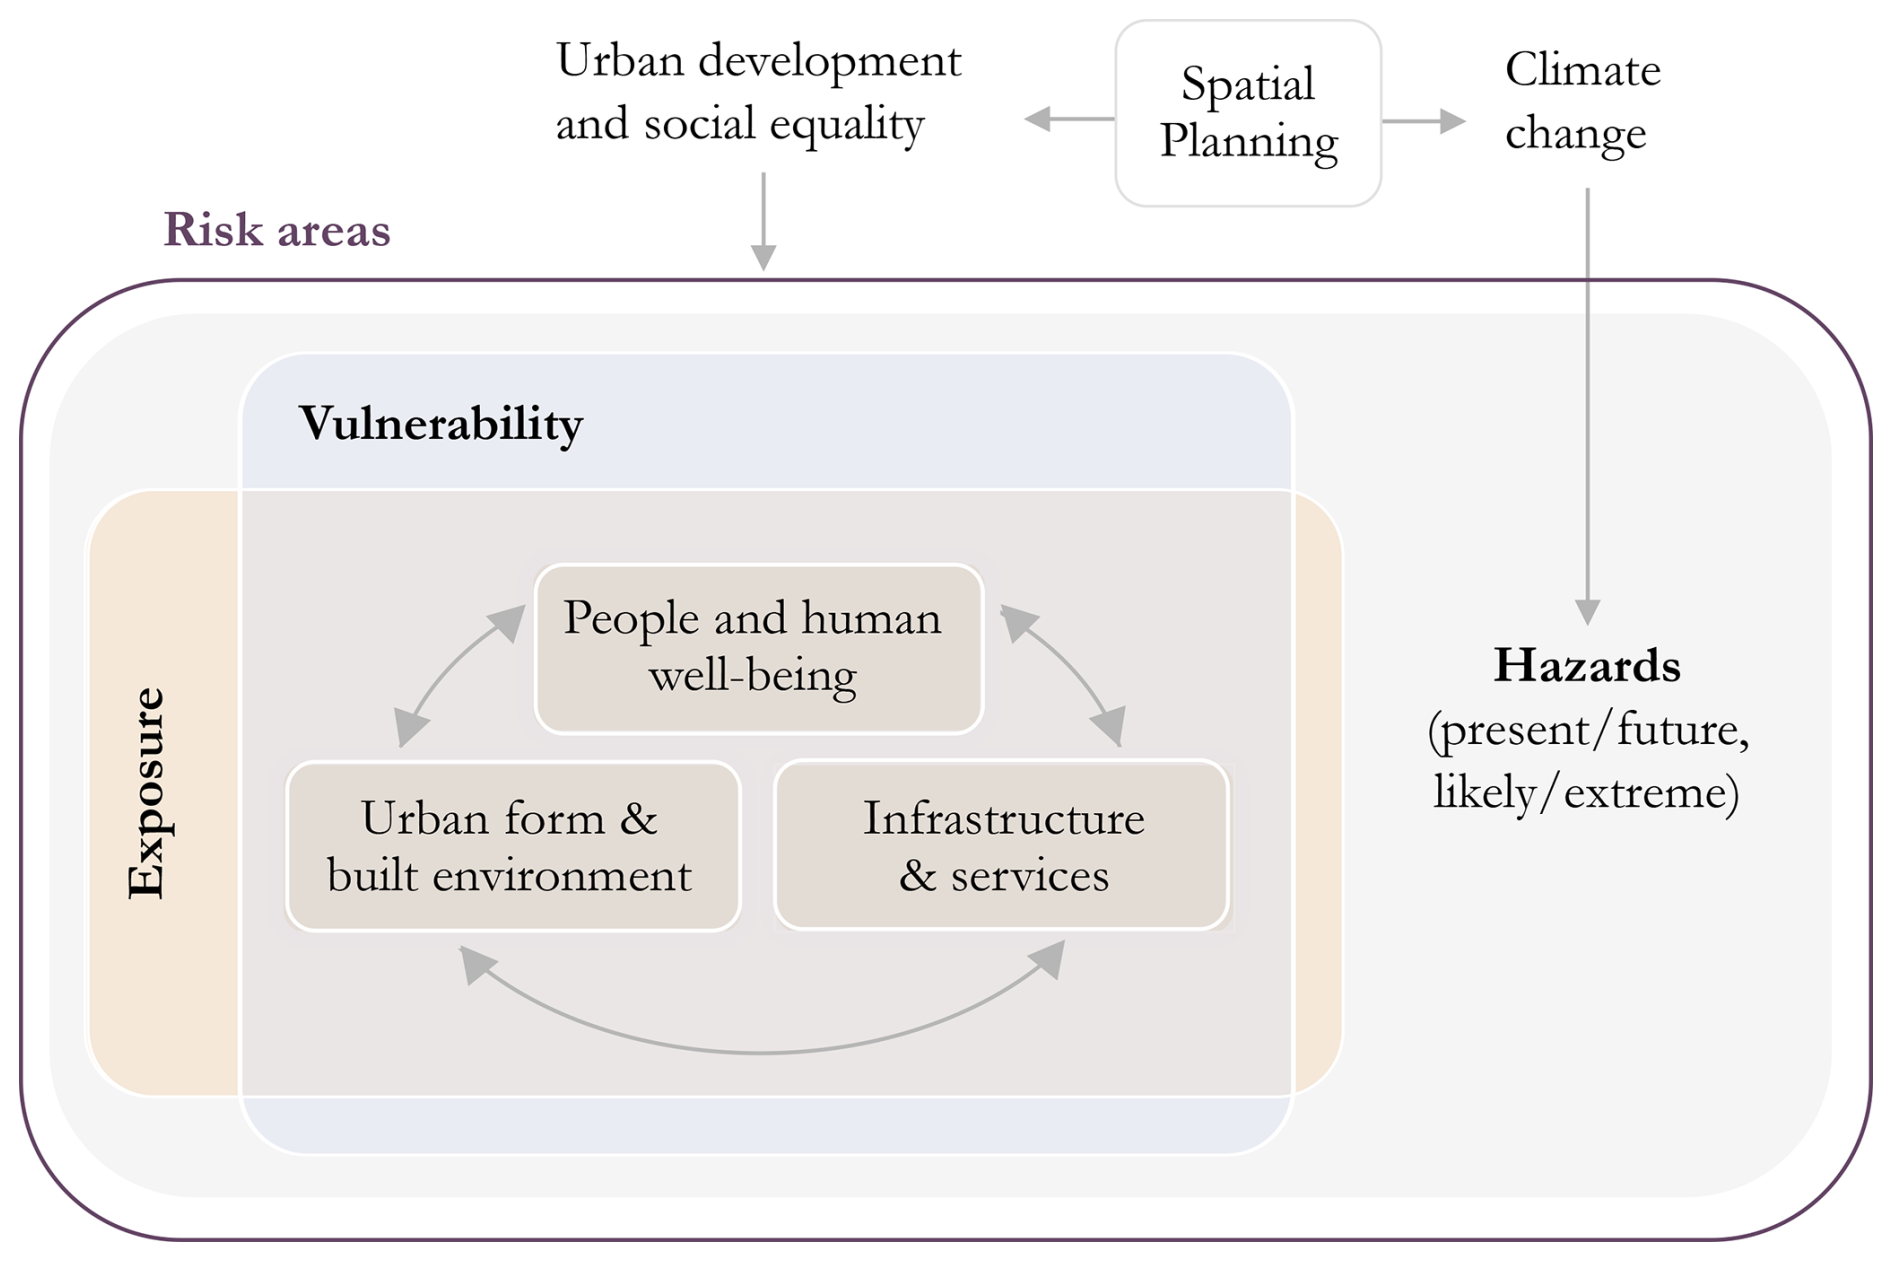
Figure 1Conceptualisation of climate risk used in this study, emphasising the importance of human vulnerability and exposure and surrounding urban structures and functions on human well-being. The basic three-dimensional concept of risk is based on the IPCC conceptualisation (IPCC, 2014), and the link to spatial planning is based on previous work by the authors (McMillan et al., 2022).
2.1 Vulnerability and risk
This research is based on the understanding of climate risk as a result of interaction between hazards, exposure, and vulnerability, in which vulnerability consists of susceptibility and coping and adaptive capacity (IPCC, 2014, 2022). This emphasises the importance of understanding the social and environmental context in which a hazard occurs in order to understand the resulting impact and consequences of climate hazards. The term vulnerability is often used synonymously with risk, with exposure defined as part of vulnerability (Jurgilevich et al., 2017). However, in this research we use the definition of the current IPCC report (IPCC, 2022), which has remained essentially the same over the past decade and has become a widespread basis for research, providing a useful common definition of the terminology (Greiving and Fleischhauer, 2022; Tyler and Moench, 2012). Accordingly, we look at vulnerability as explicitly different from exposure – with exposure defined as the presence of something of value that may be affected by adverse impacts of a hazard, and vulnerability defined as “the propensity or predisposition to be adversely affected” (IPCC, 2022). Vulnerability describes the susceptibility to being negatively affected by a hazard and the lack of ability to cope and adapt. The term “social vulnerability” (or human vulnerability) is often used to make explicit that one is not referring to risk but rather to the aspect of vulnerability in the sense described above and the various relevant social factors such as economic status, age, gender, and access to resources (Christmann and Ibert, 2012; Birkmann, 2007; Cutter and Finch, 2008; Fordham et al., 2013). However, vulnerability is not just determined by demographic or socioeconomic factors, and thus the term “social vulnerability” can be too narrow. Our surroundings – the built environment, the structure and design of the urban area – are a major factor in determining the level of risk, not just by modifying the microclimate and water runoff, but also by affecting people's capacity to cope and adapt through factors such as housing type, building standard, urban form, access to green space or blue-green infrastructure, and access to health services (Ellena et al., 2020; Sandholz et al., 2021).
Figure 1 depicts the conceptualisation of risk used in this research, in which risk areas are areas where there is a need to reduce risk through adaptation. Risk areas are those in which people and things of value (e.g. homes, schools) are exposed to hazards (e.g. flooding, heat) and vulnerable to being negative impacts (e.g. loss of life, health issues, property damage), considering the current intensity and extent of the hazard (including in extreme scenarios) and considering changes to these spatial hazard patterns in the future, including changes due to climate change or urban development. Urban development can exacerbate or mitigate all dimensions of risk, and adaptive spatial planning can regulate and coordinate spatial development to reduce risk. Spatial planning can also affect greenhouse gas emissions and thus climate change, which in turn exacerbates hazards. Importantly, climate change and related hazards such as high air temperatures or heavy rainfall are not the only factors in determining risk and well-being. Crucial factors are also the urban surroundings including the urban form and surface characteristics, as well as access to and quality of critical urban functions such as green space.
2.2 The spatial dimension of vulnerability and its integration into spatial planning
The study of spatial inequality and socio-spatial segregation within cities has a long tradition in sociology and geography and has been of central concern to the study of cities since the early 1900s. That social equality is also the concern of planning is anchored in German spatial planning law at the regional planning level, which formulates the guiding principles of “balanced and equitable living conditions” between places (Regional Planning Act § 1 Para. 2), and at the urban planning level, which states that “the social and cultural needs of the population, in particular the needs of families, young, old and disabled people” must be taken into account (Federal Building Code § 1 Para. 6). That there is an environmental dimension to spatial inequality has been the focus of the environmental justice discourse since the 1980s, with a focus on the use of spatial analysis since the 2000s (Sze and London, 2008; Greiving and Fleischhauer, 2022). However, in spatial planning practice in Germany, Greiving and Fleischhauer (2022) find that such analyses are rare but gaining attention along with consideration of climate change impacts.
That there is a spatial dimension to risk has also long been recognised, but in research, especially in a European context, the focus has been on hazard mapping without including socioeconomic aspects (Greiving and Fleischhauer, 2022). Likewise, the link between climate change adaptation and spatial planning, including land-use planning and urban and regional planning, has been made (Wilson and Piper, 2010; Hurlimann and March, 2012; Davoudi et al., 2009). This has been increasingly recognised in policy and planning law in Germany, with climate change adaptation introduced as a planning principle that must be considered when making plans at the regional level (Regional Planning Act amendment in 2008) and the local level (amendments to the Federal Building Code in 2011 and 2013). However, the analysis of risk from a spatial perspective only expanded to consider aspects of vulnerability in the 1990s. Likewise, spatial planning research focused on hazards until the late 1990s when the relevance of spatial planning to social dimensions of risk and disaster management was recognised (Greiving and Fleischhauer, 2022). Christmann and Ibert (2012) note a lack of attention given to the spatial dimension of vulnerability in the German context, noting “Apart from Birkmann's (2008) criticism that spatial planning in Germany concerned itself primarily with physical sources of vulnerability, further more broadly expressed spatial terms and spatial relations have so far attracted little attention in the literature” (Christmann and Ibert, 2012: p. 264). Since then there has been significant work making the link between vulnerability, socio-spatial disparities, and spatial planning conceptually, and this link is increasingly recognised in adaptation strategies (Greiving and Fleischhauer, 2022). For example, in the case study context, in 2023 the state of Baden-Württemberg passed a climate change mitigation and adaptation law and an updated adaptation strategy, which supersedes the climate mitigation law from 2013 and the adaptation strategy from 2015. The adaptation strategy states the relevance of socioeconomic and demographic characteristics for assessing health stress from heat and the need for mapping vulnerable population groups and overlaying this information with climate data to justify the location of infrastructure for older people and target adaptation measures (Ministerium für Umwelt, Klima und Energiewirtschaft Baden-Württemberg, 2023).
In summary, as depicted in Fig. 2, it is widely acknowledged that there is a social dimension to climate risk, that there is a spatial dimension to climate risk, and that there is a spatial dimension to social inequality. However, while climate risk and social inequality are both considered individually in planning, they are rarely considered together. Specifically in spatial planning practice in Germany, the social dimension of climate risk is still considered less than the physical aspects of risk. This was found in an empirical study by Greiving and Fleischhauer (2022), who found that only a small proportion of urban adaptation concepts and analysis take socioeconomic information into account. The reasons for this have not been explicitly studied. Possible reasons based on insights from the aforementioned study and the authors' own experience in the German context include the following:
-
a time lag between the relatively recent conceptual and methodological developments in research practice and the transfer of these approaches into practice;
-
limits to the availability of up-to-date socioeconomic data at a sufficient resolution;
-
the separation of administrative responsibilities and mandates (e.g. social monitoring, technical infrastructure, environmental protection);
-
insufficient translation of social vulnerability analyses into recommended action for planners to implement; and
-
reluctance to explicitly map social data due to issues of miscommunication (e.g. stigmatisation of social hotpots, underrepresenting pockets of vulnerable populations, confusion about vulnerability vs. risk).

Figure 2Schematic diagram describing that both climate adaptation and social inequality have been integrated into spatial planning but that the vulnerability dimension of risk and the environmental aspect of social inequality, which are closely related, have not been adequately integrated into spatial planning.
Several of these reasons are related to methodological issues that we outline in the following section.
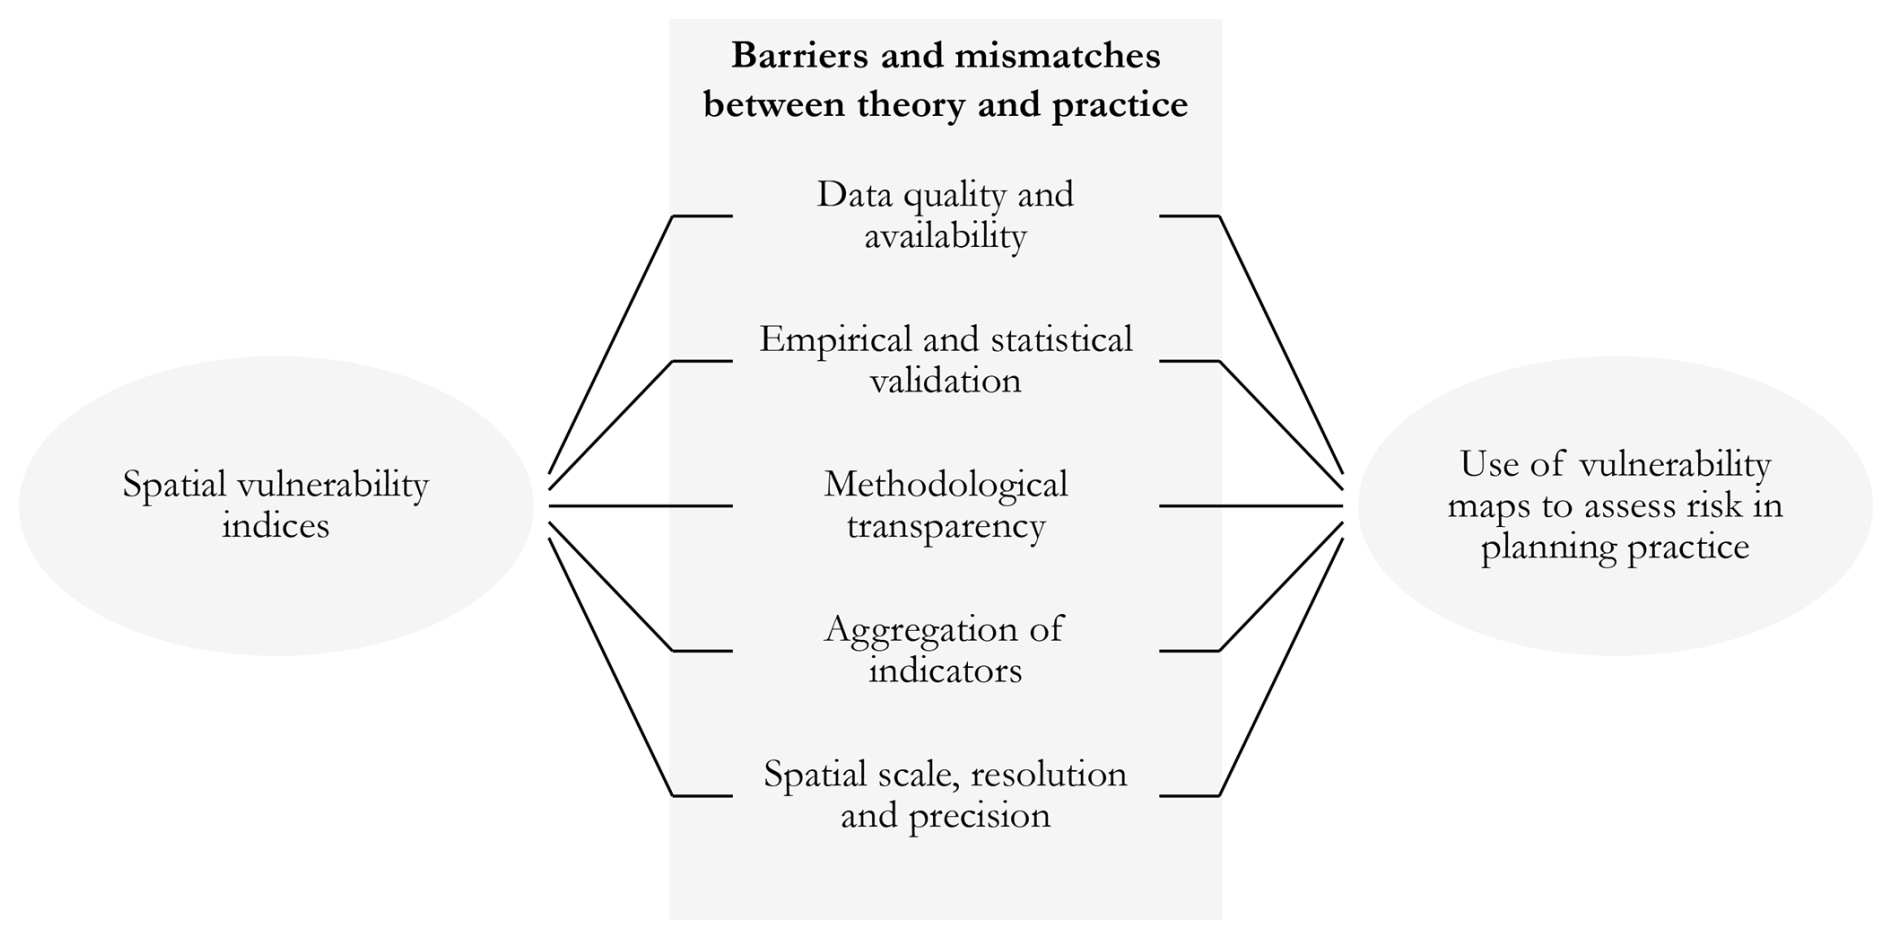
Figure 3Summary of barriers and mismatches between the academic work on spatial vulnerability indices and the application of these in planning practice.
2.3 Methodological challenges of mapping vulnerability
Vulnerability is a phenomenon that cannot be directly measured, so it has become common practice in research to use indicators and indices (Fekete, 2019; Kuhlicke et al., 2023). There is a large body of work developing social vulnerability indicators, indices, and maps worldwide in many case studies. Relevant examples for capturing the vulnerability dimension of climate risks are the Climate Just tool in the United Kingdom (Lindley et al., 2011; Breil et al., 2018) and several studies in the German context (Welle et al., 2014; Scholze et al., 2020; Birkmann et al., 2021; Hölzl et al., 2021; Greiving et al., 2023; von Szombathely et al., 2023). The scale and resolution of such indices range from a comparison of countries at a global level, through comparing municipalities, to spatial differentiation within cities. In this paper, we are interested in vulnerability maps for use in local and regional planning and thus in studies that differentiate between and within neighbouring cities and municipalities.
Social vulnerability indices rank places according to various socioeconomic variables. Such indices are often mapped spatially based on the “hazard of place” theory and the Social Vulnerability Index (Cutter et al., 2003). Main vulnerability factors supported empirically in a US context and with a statistical explanatory power include personal wealth, age (children and elderly), density of the built environment, single-sector economic dependence, housing quality and tenancy, race, ethnicity, occupation, and infrastructure dependence (Cutter et al., 2003). In the decades following the development of the Social Vulnerability Index, authors have reached a general agreement on the main components of vulnerability. In a review of empirical studies globally, Li et al. (2023) found the most common indicators of social vulnerability to be age, income/employment, sex/gender, and education level, followed by ethnicity/minority, education, access to green and blue spaces, social isolation, language proficiency, access to health services, health condition/disability, urbanness/remoteness, and housing tenure. It is important to note that, while each of these indicators is empirically and theoretically justified, the frequency of usage of indicators in not necessarily determined by the importance of the indicator to explain vulnerability but rather by the fact that demographic data such as age and sex are more readily available in more countries than information about, for example, social capital or housing conditions.
There is a wide consensus that vulnerability can be differentiated socially and spatially and that such an indicator-based approach to mapping vulnerability is valid (Fekete, 2019; Christmann and Ibert, 2012). Despite a large body of scientific work on these approaches, Cheng et al. (2021) found in a literature review of heat vulnerability indices that many such indices do not provide useful guidance for urban planners. Also in the German context, vulnerability indices are rarely integrated into planning processes (Greiving and Fleischhauer, 2022). There is an established practice of social monitoring in many major cities around the world and in German cities in which socioeconomic indicators and their dynamics are regularly reported in order to identify disadvantaged areas that require welfare and structural measures and funding. However, in Germany such indicator sets are rarely used as a part of assessing needs for climate change adaptation or include specific environmental or climate-related indicators (Greiving and Fleischhauer, 2022). There are various reasons for the limited uptake of vulnerability indices in spatial planning practice, as discussed in the previous section; Fig. 3 provides an overview of some of the main methodological challenges.
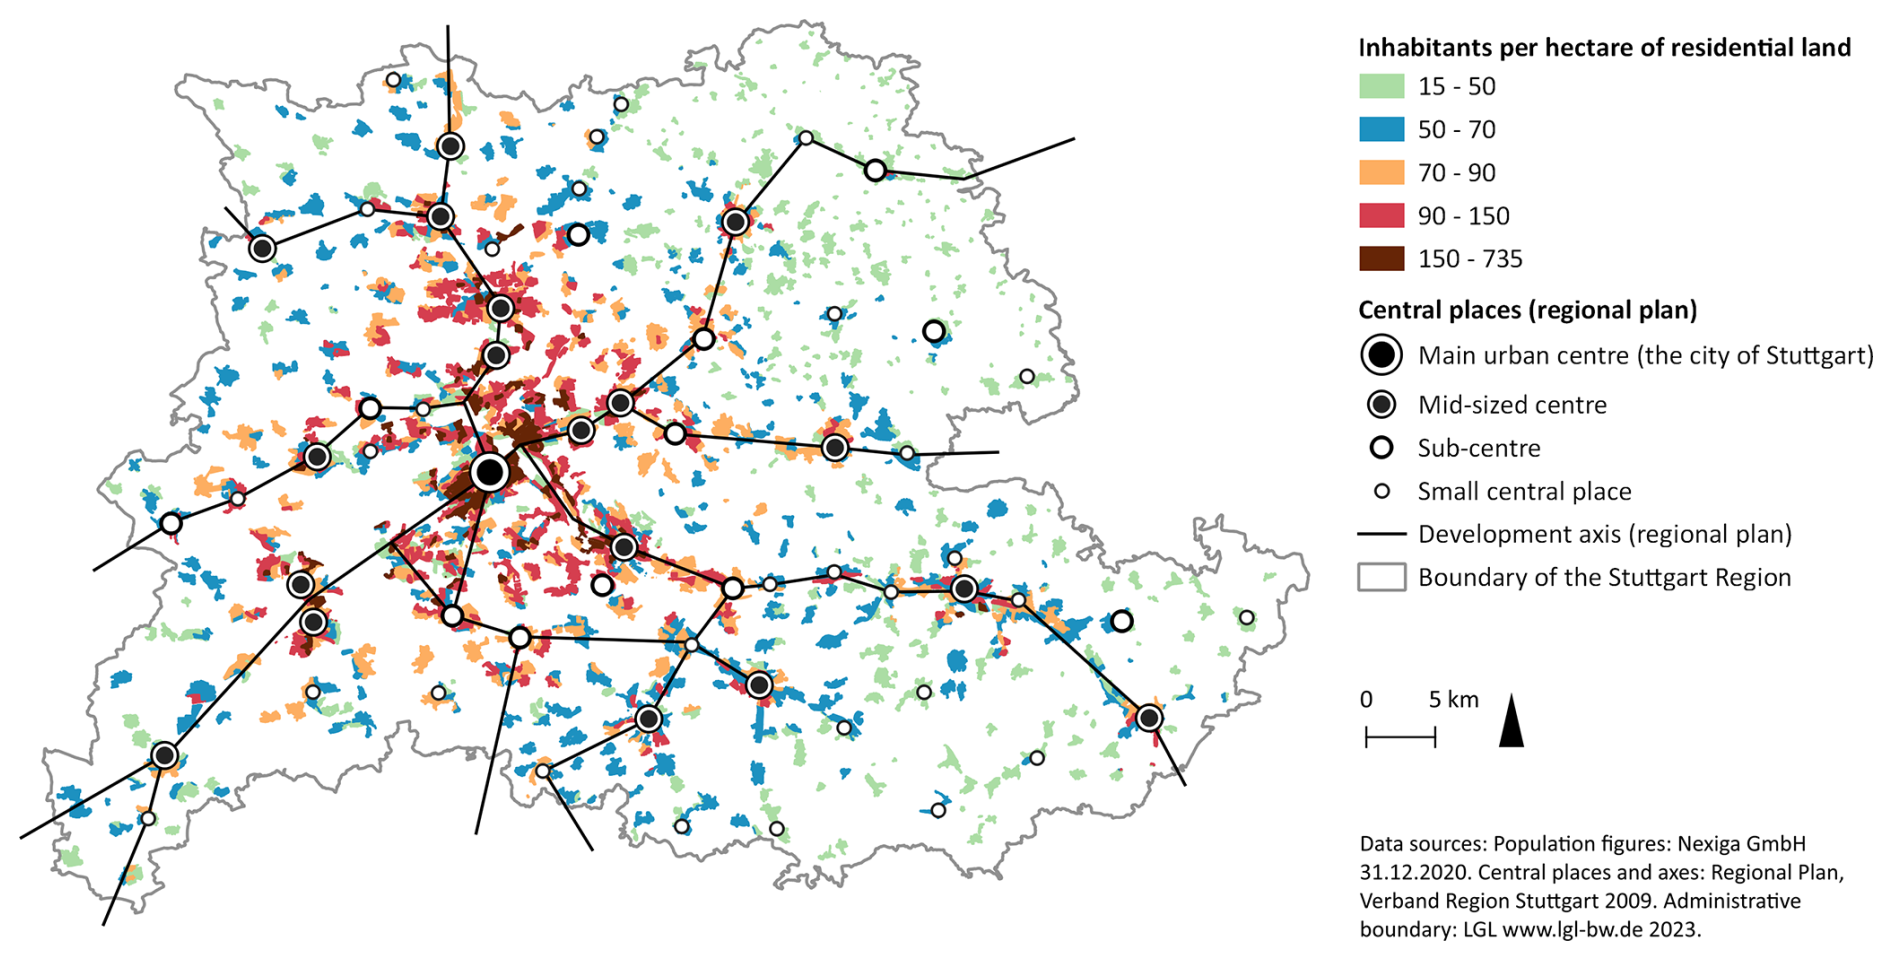
Figure 4Overview map of the Stuttgart region and its polycentric nature.
There remains an active methodological discourse to address these challenges, particularly regarding the empirical and statistical validation of indices and limitations of data quality and availability (Fekete, 2019, 2009; Rufat, 2013). Fekete (2009) provides a detailed and transparent overview of the many methodological challenges of mapping vulnerability, including those particular to Germany – for example, data limitations and the challenge of balancing transparency and statistical sophistication. Particularly critical is the aggregation of indicators into an index, which can disguise underlying conditions and make the results hard to interpret correctly (Fekete, 2019; Weichselgartner and Kelman, 2015; Heesen et al., 2014). Hence, Fekete (2019) took a practical approach and chose to map indicators individually rather than creating composites. This methodological approach of mapping individual components or indicators rather than, or as well as, composites is rare in the context of vulnerability studies. We employ such an approach in this study due to considerations of user requirements from a spatial planning perspective and practical consideration regarding data scale and resolution (see Sect. 4.1 and 4.2).
In summary, spatial vulnerability indices are state of the art and a standard in research. However, they are still rarely integrated into planning processes and suffer limitations due to data quality, resolution, aggregation issues, and transparency. Therefore, in this paper we focus on bridging the gap between vulnerability indices and application in planning practice. We are concerned with the relevance and usability of the results for spatial planners specifically, as well as how the vulnerability information can enable planners to include considerations of vulnerability and risk in planning processes in the context of climate change adaptation. We investigate this by mapping vulnerability for the case study region of Stuttgart in the context of a transdisciplinary research project (see Sect. 3).
The Stuttgart region in southwest Germany with a size of 3654 km2 consists of 179 municipalities, including the state capital and several medium-sized cities in a polycentric structure, as well as many smaller towns (Fig. 4). The region with a population of about 2.8 million is one of the most densely populated regions of Germany and a key economic centre of Europe, with a lot of pressure on the housing market in and around the urban centres. At the same time, there are many other pressures on land use in the region, including adaptation to climate extremes. Of particular concern for the settlements in the region are heatwaves and pluvial flooding caused by heavy rainfall. Life in the region has already been disrupted by such events, with pluvial flooding and heatwaves occurring to various extents in most recent years. In terms of pluvial flooding, storm events of various scales (including flooding, heavy rainfall, and sometimes hail) occurred each year between 2017 and 2023 in the Stuttgart region. Most dramatic was the storm event of 1972 in which six died in the Stuttgart city centre. Also notable is the highly destructive flash flood in 2016 in a small town called Braunsbach 20 km outside of the region, which led nationally to a greater awareness of the risks of heavy rainfall events. It cannot be stated that the frequency of such heavy rainfall events has been increasing or will increase in Germany, but they are becoming more intense and erosive (Deumlich and Gericke, 2020). In terms of extreme heat, the European heatwave of 2003 that led to about 9500 deaths in Germany is notable as it was the first such extreme heatwave since the previous one in 1994 (Winklmayr et al., 2022). However, since then extreme heatwaves have been occurring more frequently, including in 2018, which led to about 8700 deaths (Winklmayr et al., 2022). There have been heatwaves and record-breaking temperatures in every summer since then (Imbery et al., 2022). The probability of heatwaves occurring in Germany is expected to increase significantly, and their severity is projected to rise dramatically to different degrees depending on the level of global warming (Hundhausen et al., 2023).
These hazards and their impact on the health of people and ecosystems and the function of infrastructure in the region do not stop at administrative boundaries. Not only do water and airflows disregard administrative boundaries, but so do important urban functions such as critical infrastructure networks, everyday commuting routes, and supply chains. This is especially the case for the Stuttgart region due to its polycentric structure with its interconnected local centres and companies with multiple locations and suppliers. That is why the planning authority at the regional level in Stuttgart plays a particularly central role in climate adaptation as part of strategic spatial planning that coordinates the local land-use planning – as anchored in the German spatial planning law.
One role of the regional authority is to provide an information basis for regional and local spatial planning. Currently the main information basis for planning is the regional “climate atlas” published in 2008, which provides information such as the location of important airflows and green open space as well as urban areas with poor ventilation, which is relevant to the mitigation of urban heat islands and poor air quality. These analyses have provided an important basis for justifying the protection of green spaces in the regional spatial plan as well as in local land-use plans. The regional authority in collaboration with city administrations, specialist offices, and research institutes is currently updating this climate atlas as part of a collaborative research project entitled “ISAP – Integrative city-regional adaptation strategies for a growing polycentric region: Region Stuttgart” funded by the German Federal Ministry of Education and Research (BMBF). The new climate atlas will include not only information relevant to extreme heat but will also include hazard maps for heavy rainfall events, information about the current and future changes in the climate, and further information to identify areas that have a need for adaptation. This identification of adaptation needs requires information on exposure and vulnerability. It is this task of providing a spatial information basis for the assessment of exposure and vulnerability – and ultimately risk and adaptation needs – that is the focus of this paper.
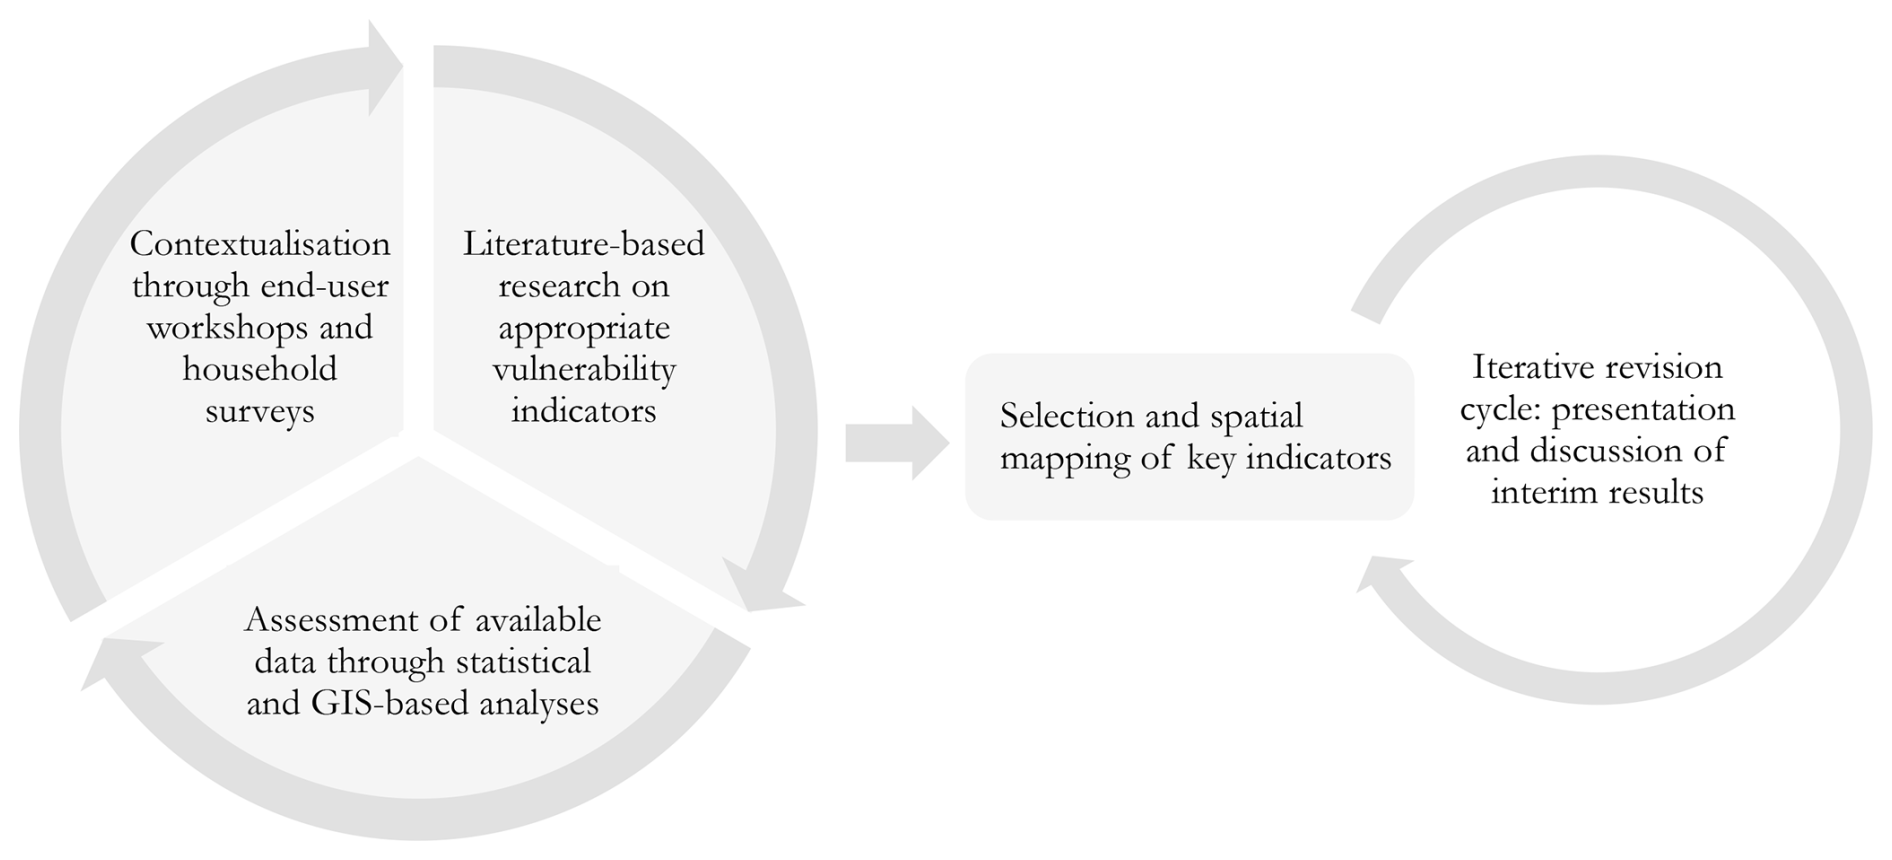
This research took place over the years 2020 to 2023 and is embedded in the above-described planning process in which input from practitioners was central to the research process and results (Fig. 5). We gathered this input at different stages of the process and in various forms. Firstly, the regional planning authority conducted a workshop with local planners from throughout the region to elicit end-user requirements of the climate atlas online tool. Meanwhile, the Stuttgart city climatology department also conducted three workshops with spatial planners from the city administration. These workshops focused on the climate atlas as a whole and included valuable insights relevant to the vulnerability maps. Together with the regional planning authority, we also conducted a workshop to discuss interim results of the vulnerability and exposure maps with regional planners. In addition to these more structured workshops, there were regular discussions within the project team, which included not only the regional and city officials but also specialists in the fields of urban climate modelling and modelling of pluvial flooding caused by heavy rainfall. We presented interim results at scientific conferences (one focused on spatial planning and the other on risk management), which provided feedback from different disciplinary perspectives. In parallel, we conducted household surveys in the region, which provided insights from the local population about perceptions of climate risk and implementation of adaptation measures. The following section (Sect. 4) summarises initial findings from these discussions and from literature-based research, which determined the method for mapping vulnerability, described in Sect. 5.
4.1 Map requirements from a planning perspective
The target audience of the maps of vulnerability is spatial planning at the local and regional levels, and additionally the maps will be made available to the public and should be of interest to a wider professional audience and interested public. The analysis results should be relevant to the general strategic level for the region as a whole, while also providing information that is relevant to municipalities. The regional planning authority has a particular responsibility to provide information relevant to the many small municipalities in the region, which otherwise would not have access to such climate services. Thus, the analysis approach involved a balancing act between these planning levels in terms of spatial resolution (i.e. how detailed or finely spatially differentiated the map is).
The analysis of vulnerability is also a balancing act between simplicity and complexity. On the one hand, it is common practice in an academic context to include many indicators in a composite weighted index as a way to capture vulnerability. However, this leads to a type of black box which is difficult for planners to judge, interpret, and communicate. We found in our exchange with planners that there is a strong preference for single indicators where it is simple to understand what is being measured and mapped. However, at the same time there is also the need to synthesise or overlay individual indicators to be able to see connections between the spatial phenomena or characteristics of settlement areas.
In the exchanges with planners at the regional and local levels in the Stuttgart region (see Sect. 3), we identified the following key criteria for the usability of the maps in spatial planning processes:
-
Accurate and current data. The data should be accurate and not more than a year or 2 old so that planners can be confident that they are basing plans on information about the current situation that will stand up to legal scrutiny.
-
Transparent and traceable method. The data sources, their qualities, and the analysis methods should be clearly and simply documented and available so that planners can judge and accurately interpret the implications of the results.
-
Clear and comprehensible communication. The results should be easy to understand and communicate to diverse audiences in order to allow planners to justify and defend the resulting plans and in order to foster greater understanding of climate adaptation considerations amongst the administration and public.
-
Spatial resolution and aggregation. The information should allow a differentiation within municipalities as well as between municipalities to be relevant to the local and regional planning levels. The spatial differentiation should also be at a fine enough scale to allow a useful overlay with the fine-scale hazard maps, but at the same time the results should be aggregated so that they can be interpreted and formulated into clear requirements for actions.
-
Regional coverage. The information should be available for the whole region, not just the major cities, because especially the small municipalities do not have access to such information and require it.
We thus conclude that the vulnerability maps should be detailed and meaningful for the entire region in order to be applicable for local and regional planning levels and comparable to hazard information but at the same time be as simple as possible while still correctly characterising the settlement areas and allowing the identification of adaptation needs. These conclusions provided the basis for subsequent methodological decisions outlined in the following two subsections.
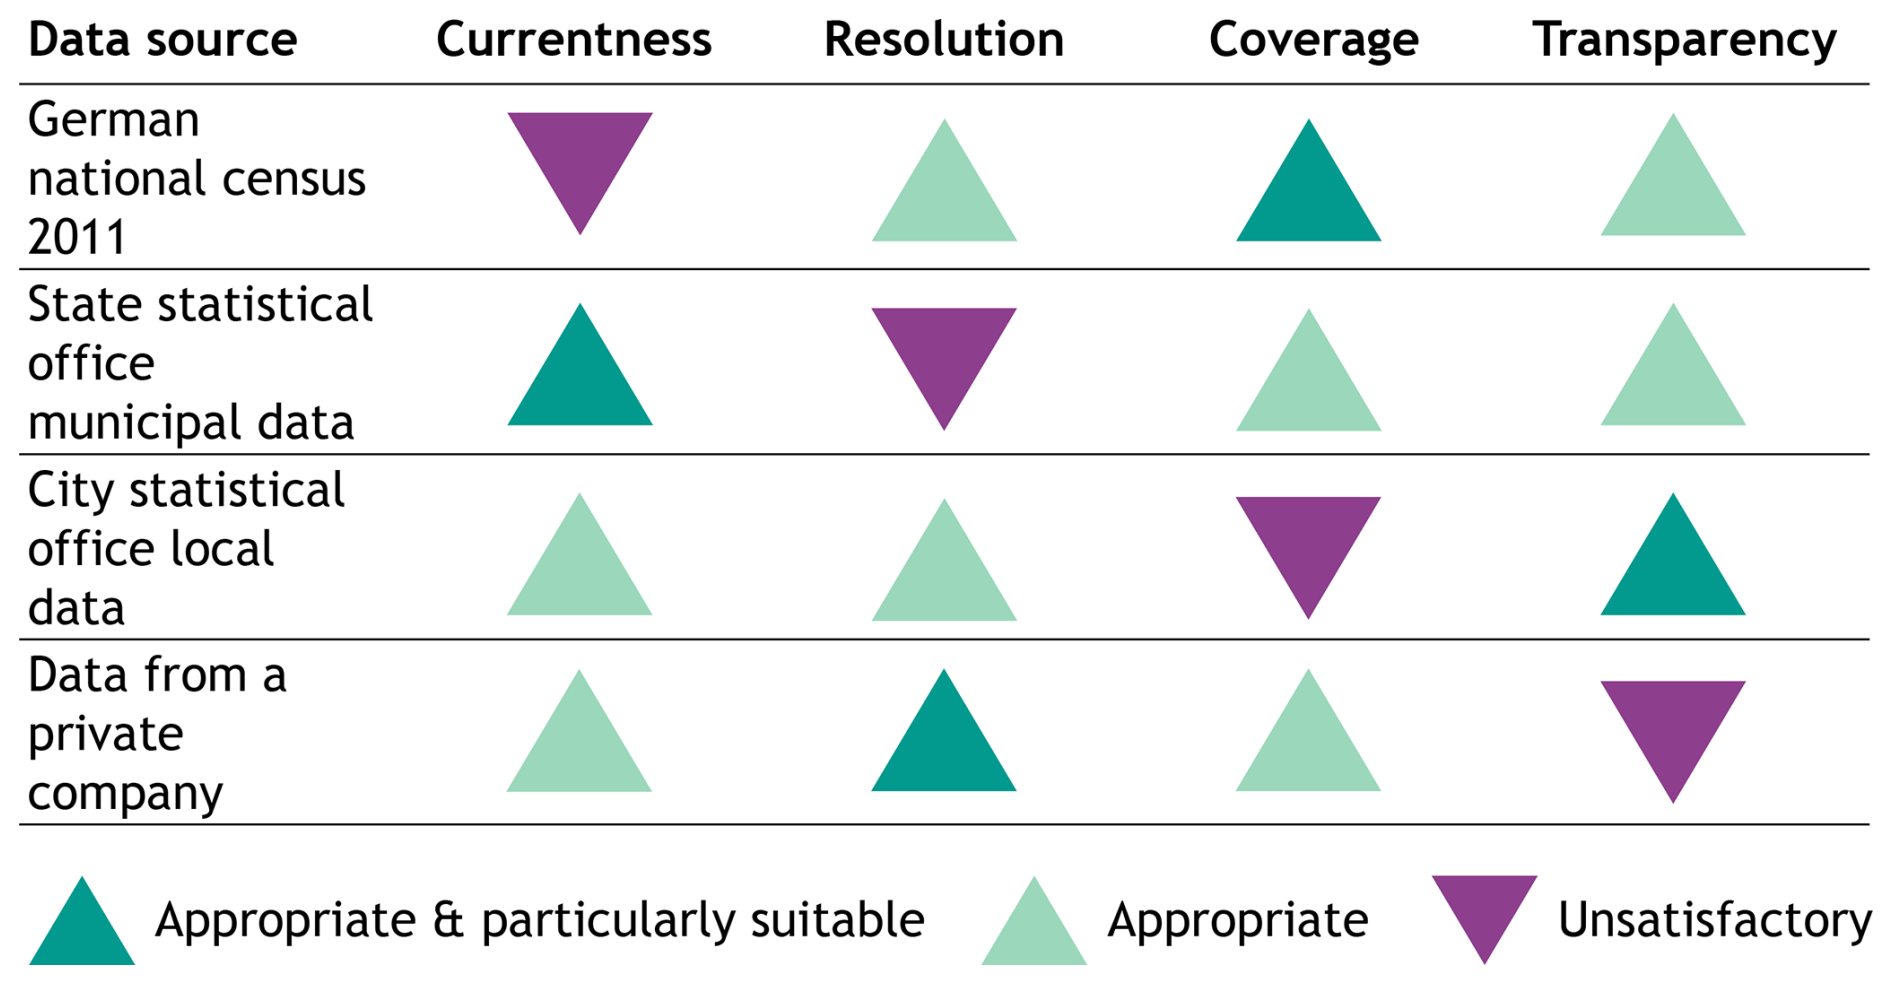
Figure 6Assessment of the available social–spatial statistical data according to the main identified end-user requirements.
4.2 Assessment of data options and spatial units
To map vulnerability, we require two main types of data: firstly, social–spatial statistics and, secondly, spatial data about the physical urban environment and its use. The data on building shape, type and use, and land use were provided by the planning authority from the official property cadastral information system. The cadastral data are, however, not sufficiently current, so we supplemented them with OpenStreetMap data. OpenStreetMap data are entered by users and validated using a systematic process. In terms of social–spatial statistics, the core of the vulnerability analysis, there is currently no option that meets all the necessary criteria (see Fig. 6). Based on the findings from Sect. 4.1, we require social data for the entire region at sub-municipality resolution. Census data are a good high-resolution data source, but at the time of this research the available census data were from 2011 and thus outdated (the new census was published mid-2024). The state statistical office updates the social statistics annually, but these are only available at the spatial resolution of whole municipalities. For these reasons, we purchased data from the geodata company Nexiga GmbH. Nexiga receives data from the state statistical office and the employment agency and supplements it with its own survey data. They use a statistical procedure to disaggregate the data sets to a finer scale. Due to the procedure, full transparency of the data is no longer possible, which is the main weakness of this data source.
The data from the company Nexiga provided a sufficient alternative given the limitations in the official data at the time of the study (2020–2023). Furthermore, the data from Nexiga provided another benefit, namely suburb boundaries as a spatial unit for analysis. These are not an official administrative unit as there is no such administrative unit except for in some larger cities but not for their surrounding regions (e.g. the city of Stuttgart has official suburb boundaries but the other municipalities in the region of Stuttgart do not). Nexiga constructed these suburb polygons based on data about urban and social structures. On average (regional average), 1245 residents live in a suburb. Unlike grid cells, these polygon boundaries correspond to the actual urban environment and thus, according to our exchanges with planners, are easier to interpret. We thus deemed these suburbs to be a spatial unit well suited for spatial planning purposes and for overlaying with other risk information (i.e. hazard maps).
4.3 Selection of vulnerability indicators
We selected key indicators for vulnerability to pluvial flooding and extreme heat based on literature and data availability, as well as on availability of empirical evidence from a German context and on conclusions from initial statistical and spatial analysis of the data. Firstly, considering the commonly used indicators of social vulnerability outlined in Sect. 2.3 and the availability of appropriate data described in Sect. 4.2, the following indicators could not be operationalised for the Stuttgart region due to a lack of appropriate data: education level, health condition/disability, ethnicity/minority, social isolation, and language proficiency. There are also many other less common indicators that would be relevant in this context but not operational due to lack of data, particularly measures of hazard-specific experience or relevant knowledge about coping in a disaster or about implementing adaptation measures, as well as measures of intersectionality such as single parents with young children or older people living alone.
While for some common indicators we did have data available – for example for age, gender, household size, income, unemployment, and housing tenure – we did not include maps of each of these indicators in our final selection. We eliminated gender as an indicator due to the complexity of the relationship between hazard impacts and gender found in empirical evidence in the German context. Butsch et al. (2023) found that men are more often affected by the immediate consequences while women more often suffer long-term consequences. In this context, it must be noted that there is a lack of research and data on the specific vulnerabilities of gender-diverse people (Simmonds et al., 2022). We also eliminated the indicator “household size” because although being a single-person household is a relevant factor, it is not a significant enough factor on its own. Living alone is rather an exacerbating factor to the vulnerability factors old age and underlying physical and mental health conditions. The level of aggregation of our data did not let us make the connection between single-person households and other conditions.
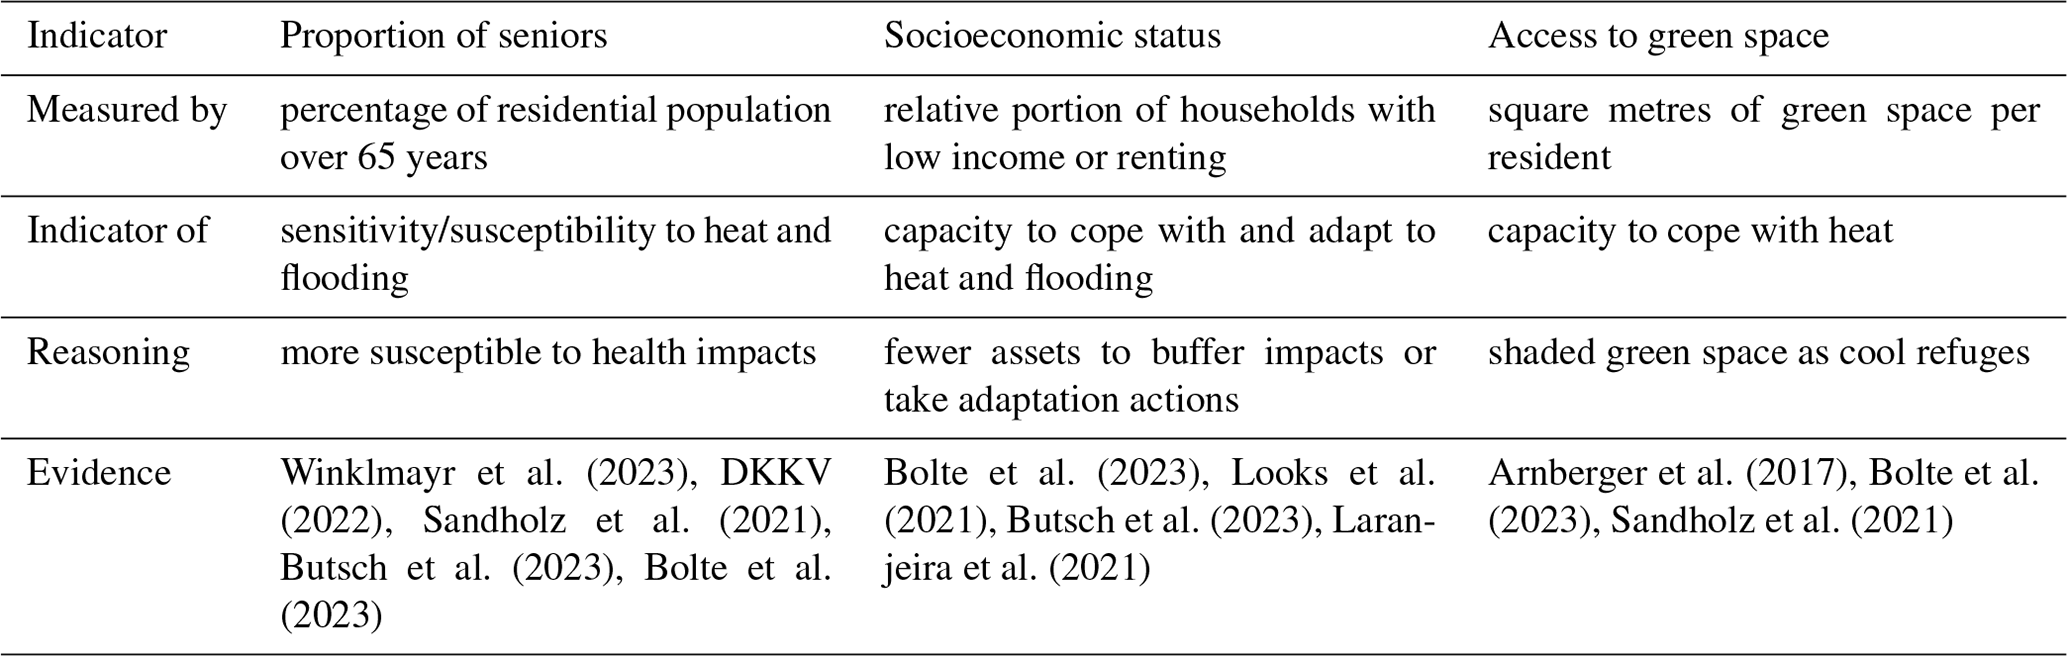
Table 1The three vulnerability indicators selected for the residential areas of the Stuttgart region.
For the further definition of a final set of key indicators, we considered the two climate-related hazards separately and assessed the empirical evidence from Germany (based on existing literature reviews). A key current collection of meta-studies provides the empirical basis for the final selection of our vulnerability indicators, namely the German Status Report on Climate Change and Health (2023). This report analyses and synthesises studies on the health impacts of extreme weather events (specifically floods, storms, droughts, and fires; see Butsch et al. 2023) and extreme temperatures (specifically heat; see Winklmayr et al., 2023) and assesses the evidence from Germany on the social determinants of vulnerability (Bolte et al., 2023). Butsch et al. (2023) find that “four population groups are particularly affected by the health consequences of extreme weather events for different reasons”, the first being “children, older people and people with physical limitations” due to the physical stress of extreme events. The second group are “people with low socioeconomic status” due to being “more directly exposed to extreme weather events and often have lower coping capacities”. The third and fourth group are men and women, as discussed in the previous paragraph.
Winklmayr et al. (2023) show strong evidence for the significantly higher susceptibility of older people to extreme heat in Germany, showing that with higher weekly mean temperatures the mortality rate increases for all age groups, but with a particularly steep curve for the group over 65 years and even more so for those over 85 years. The synthesis report noted a lack of knowledge and need for more research about socioeconomic determinants of vulnerability to health impacts by heat in Germany (Bolte et al., 2023). The report found evidence from European studies on the following socioeconomic factors being related to higher risk of health impacts from heat: social isolation (especially in old age), homelessness, and an unfavourable housing situation (Winklmayr et al., 2023). While national studies are lacking, there are several local empirical studies. A study of the city of Dresden found a link between dense urban areas with low greenery and fewer parks, a higher social burden (according to the city's social index of their education monitoring report), and frequency of being subjectively burdened by heat (Looks et al., 2021; Bolte et al., 2023). Additionally, a recent household survey within the case study region of Stuttgart found socioeconomic status to be a significant determinant of adaptive capacity (Laranjeira et al., 2021).
In addition to socio-demographic factors, access to green space is known to be an important factor of heat vulnerability and have a direct relevance to spatial planning. In extreme heat, public shaded green spaces can provide places for people to retreat on hot days, especially for older people, children, and people without their own garden (Sandholz et al., 2021; Arnberger et al., 2017). It is important to note here that we explicitly separated the assessment of green space from the assessment already part of the climate analysis. In the climate analysis, areas such as meadows and fields around the cities are judged as highly important due to their function as areas of cold-air production and are thus essential for the nightly cooling of urban heat islands. However, in the vulnerability analysis we focus only on green spaces that provide accessible shade for people to use during hot days. While green space is also important for pluvial flood mitigation, we excluded it from the calculation of social vulnerability to pluvial flooding because here we are measuring only the sensitivity and capacities of the residential population. In the case of heat, having access to green space is a way that residents can reduce to some extent how much they are affected by heat. However, in the case of flooding the green space is not for use directly by residents in a flooding event, but rather a means to mitigate the flood hazard through water retention or diversion. Our approach was to keep the analysis of the vulnerability separate from the consideration of hazard mitigation.
We undertook a spatial analysis of different age groups and of the three indicators for which we had data that relate to socioeconomic status, namely income, unemployment, and housing tenure. Regarding socioeconomic status, statistical analysis of the three variables found that unemployment is significantly correlated with household income, and spatial analysis showed that spatial differences between higher or lower portions of unemployed population are minimal. Therefore, we chose only to include the two indicators “low income” and “home ownership” as key indicators to explain socioeconomic status and one aspect of vulnerability. Regarding age, we found for children (tested for age groups under 10) there was little spatial variation at the resolution of suburbs, and due to the small differences, the pattern can be presumed to be quite dynamic over time. We therefore determined such a map to be inappropriate as a basis for planning and rather selected the map of older people (over 65) which showed a much stronger spatial pattern. Furthermore, the empirical evidence for the vulnerability of older people is very robust, with older age also correlating with other vulnerability factors including heath conditions and a higher likelihood of living alone. Thus, in accordance with the end-user requirements outlined in Sect. 4.1, the data availability outlined in Sect. 4.2, the empirical evidence outlined in this section, and the initial statistical and spatial analysis of the data, we selected the following three key indicators for vulnerability: age, socioeconomic status, and green space provision (see Table 1).
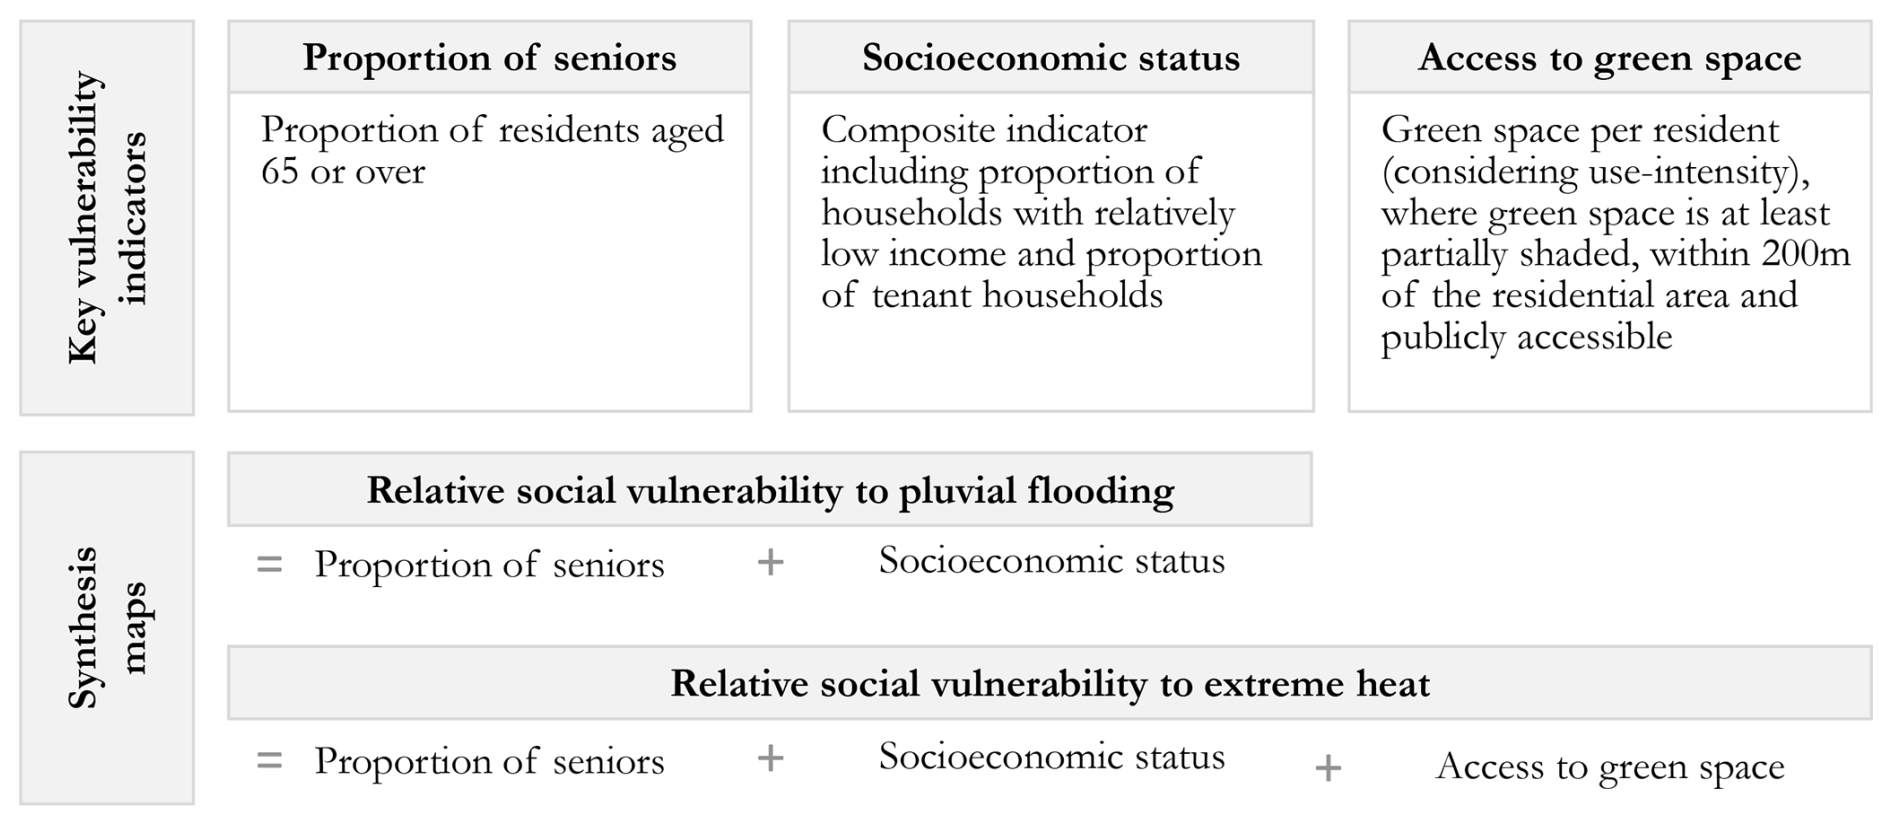
Figure 7Overview of the vulnerability maps for the Stuttgart region, including three key vulnerability indicators and the two synthesis maps based on these indicators.
5.1 Indicator and index construction
Based on the three selected key vulnerability indicators (see Sect. 4.3 for the selection process) we produced a regional map for each indicator, namely (1) proportion of seniors, (2) socioeconomic status, and (3) access to green space. In addition, we combined these key indicators into two indices which we call synthesis maps – one map to synthesise the indicators relevant to heat stress (namely all three key indicators) and the other to synthesise the indicators relevant to pluvial flooding (namely proportion of seniors and socioeconomic status). Figure 7 provides an overview of the resulting five maps to show spatial patterns of vulnerability in the Stuttgart region. Here it is important to repeat that we define vulnerability as one dimension of risk; these maps do not depict risk as they do not include information about exposure or hazards (see Sect. 2.1). We also produced maps for the assessment of exposure, including about population density, settlement structure, land use, and critical and sensitive infrastructure, in addition the hazard maps – these are all also important elements of the spatial risk assessment but are not the focus of this paper.
To construct the synthesis maps we first standardised the three key indicators using the quantile classification method and then added the indicators to produce two unweighted composite indices according to the following formulas (see also Fig. 7):
where Vul_PFn is the relative social vulnerability to pluvial flooding in suburb n, Vul_Hn is the relative social vulnerability to heat in suburb n, Sn is the standardised indicator for vulnerable age group (proportion of residents over the age of 65 in suburb n), En is the standardised indicator for socioeconomic status (based on the average of the proportion of renters and the proportion of lower income households in suburb n), and Gn is the standardised indicator for accessibility to shaded green space for residents in suburb n.
We describe the method for calculating indicator S and E in Sect. 5.2 and indicator G in Sect. 5.3. The indicators were statistically validated using a sensitivity analysis in order to check if the selected indicators are each relevant for explaining the final index values for vulnerability. The results of the sensitivity analyses for vulnerability to flooding and vulnerability to extreme heat are provided in the Appendix (Fig. A1).
5.2 Socio-demographic data analysis
For all vulnerability maps, we used the quantile classification to divide the suburbs into five equally populated classes (quantiles). This method creates classes with the same number of suburbs in each class, with the median and average in the middle class. This method has the advantage that data outliers do not have a significant influence on the classification. It encourages a spatial differentiation throughout the region, which is a disadvantage in that it can lead to the appearance of differences between areas when there is only a minimal difference. However, this is also an advantage in that differences within smaller municipalities become more visible. The results are relative values that describe the deviation from the median, which is simple to communicate. For example, the indicator “proportion of senior citizens” shows the average proportion of residents over 65 years of age per suburb in five classes. This classification method is also commonly used and transparent, and thus aligned with the user requirements identified in Sect. 4.1.
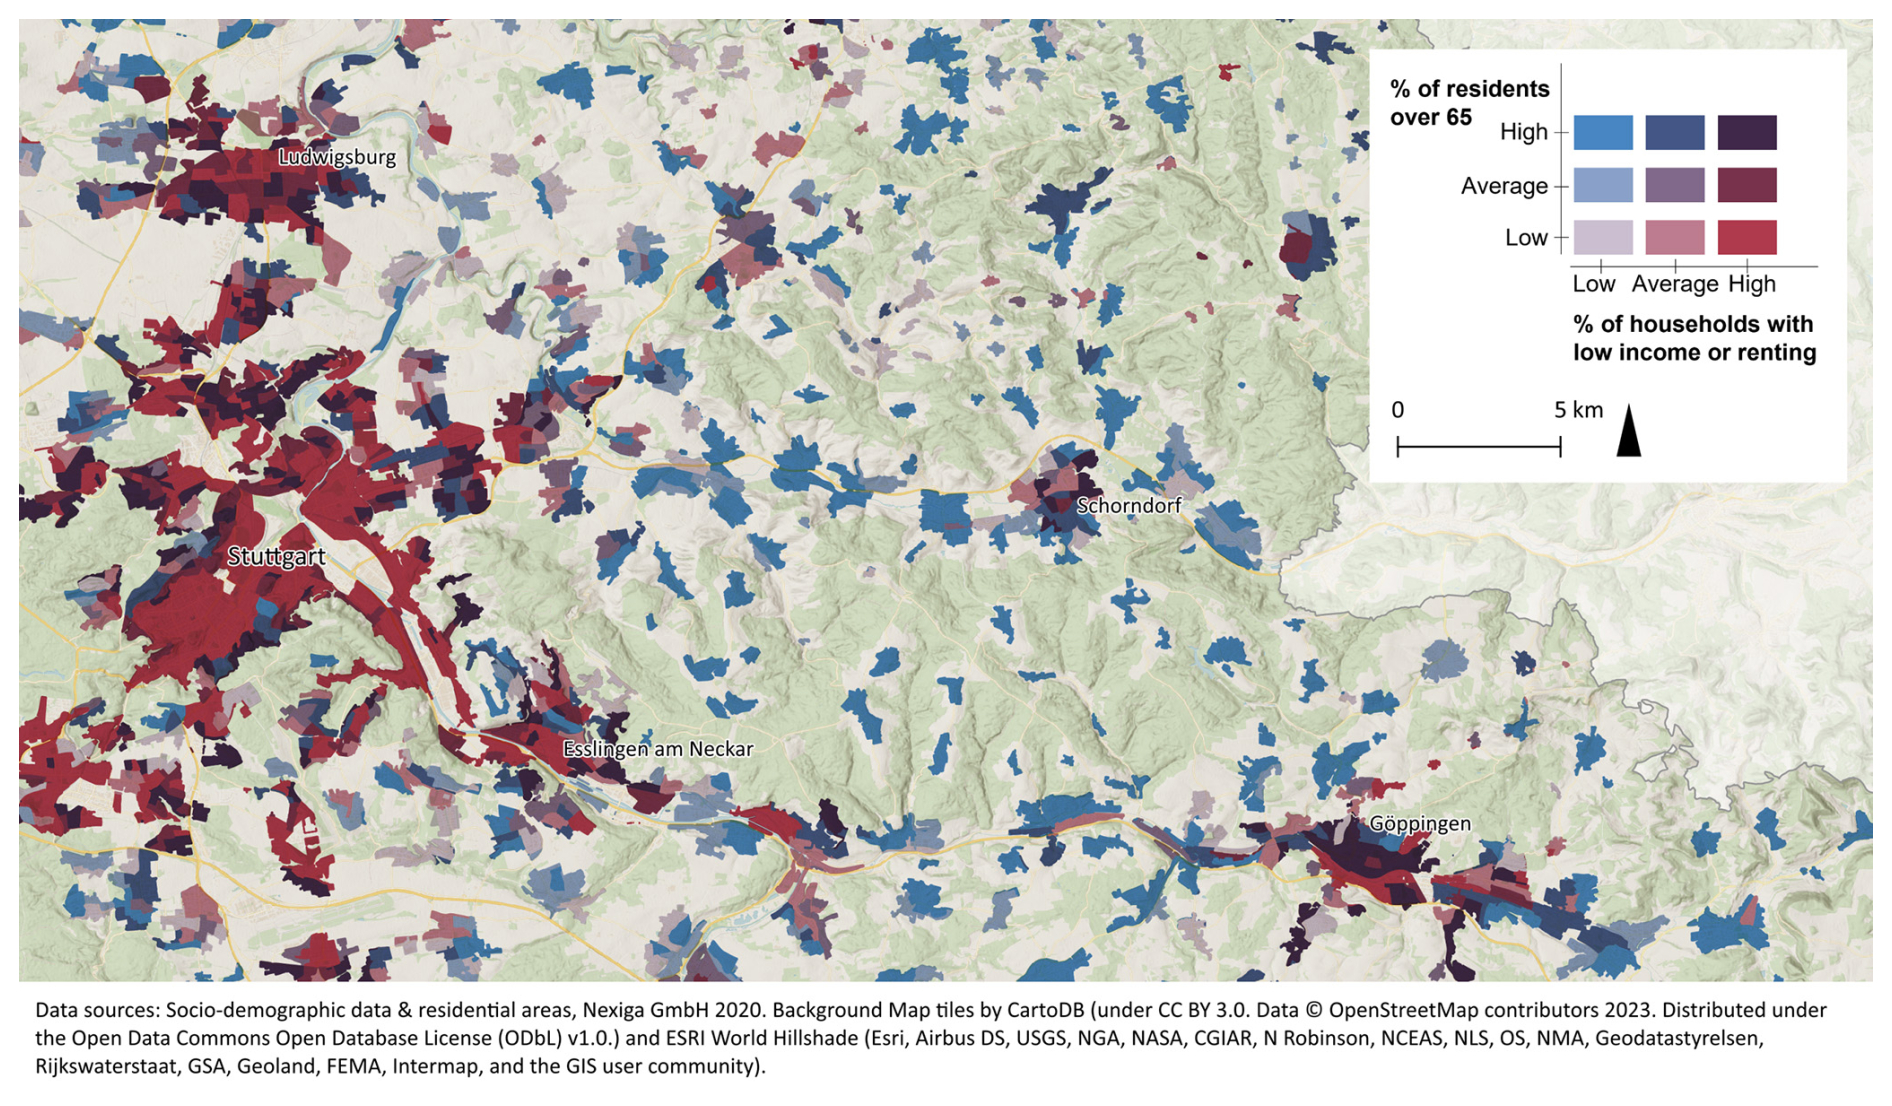
Figure 8The socio-demographic indicators (old age, housing, and low income) mapped together to show their contrasting spatial patterns (excerpt of regional map).
We also used this quantile classification method to standardise the indicators. We constructed the second key indicator “socioeconomic status” out of two components: (1) tenure (proportion of households living in rented homes out of the total number of households per suburb) and (2) household income (proportion of households with a monthly net income of less than EUR 1500 in the total number of households per suburb). These two components are correlated (r = 0.65). To construct the key indicator “socioeconomic status” we first standardised both components using the quantile method with classes named 1 to 5, in which 5 represents the highest proportion of renters and the highest proportion of low-income households. We then calculated the average of these two components and reclassified the composite again into five equal classes.
5.3 Analysis of access to shaded green space
The third key indicator “green space” describes the amount of shaded accessible public green space per resident. Such spaces include parks in urban areas, forests, or shaded paths. This indicator is not about the many other uses of such spaces, such as rainwater management, cold-air production, ventilation, recreation, or biodiversity. We only consider green space in terms of their benefits as cooler places to retreat to during heatwaves and thus as an aspect of adaptive capacity and vulnerability to health impacts of heat stress. We constructed this indicator based on available data (see Appendix Table A1). We first identified relevant green spaces based on the following criteria:
-
vegetated (grass, plants),
-
shaded (by trees),
-
public (not private, continuously open and free),
-
amenities (benches, paths),
-
proximity (within walking distance to residential areas), and
-
size (relevant capacity considering nearby residential population).
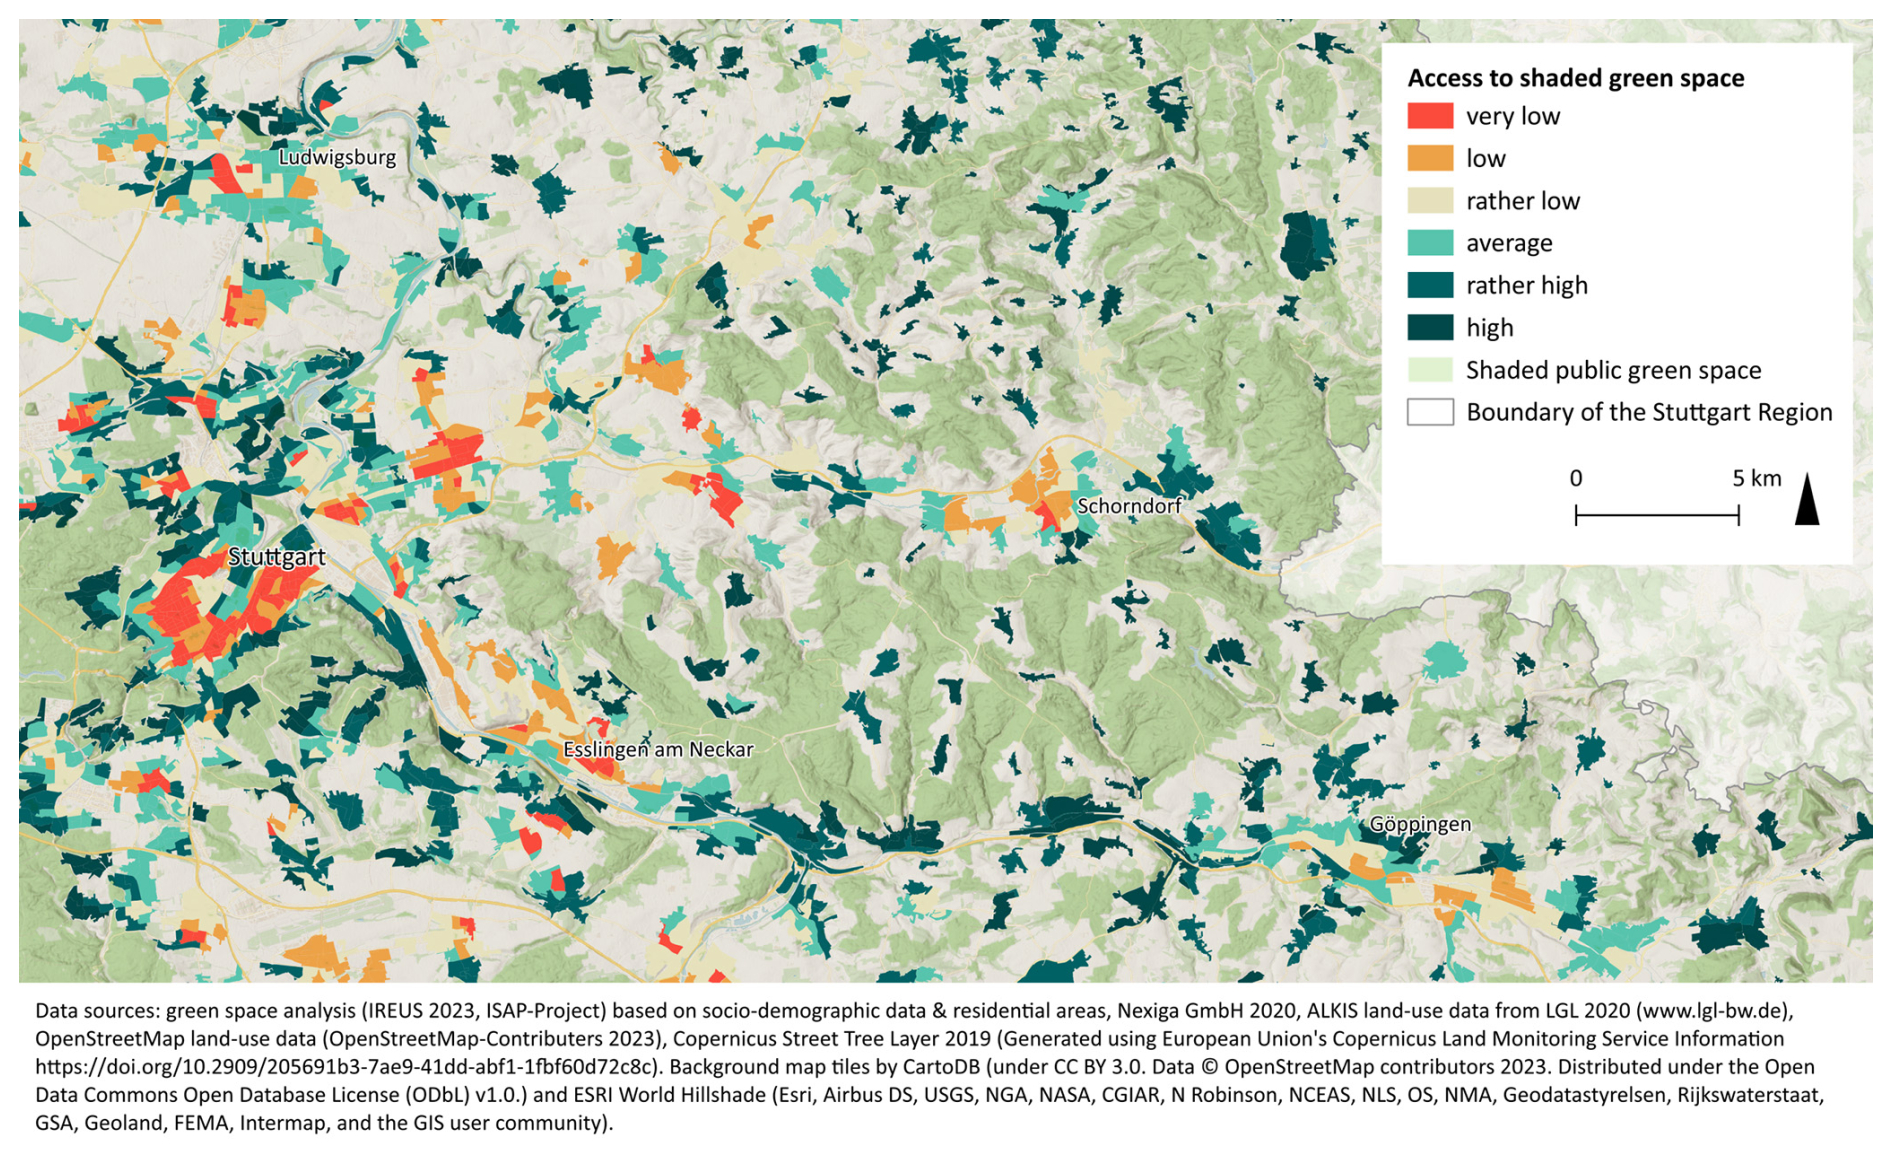
Figure 9Map of the access-to-green-space indicator (excerpt of regional map).
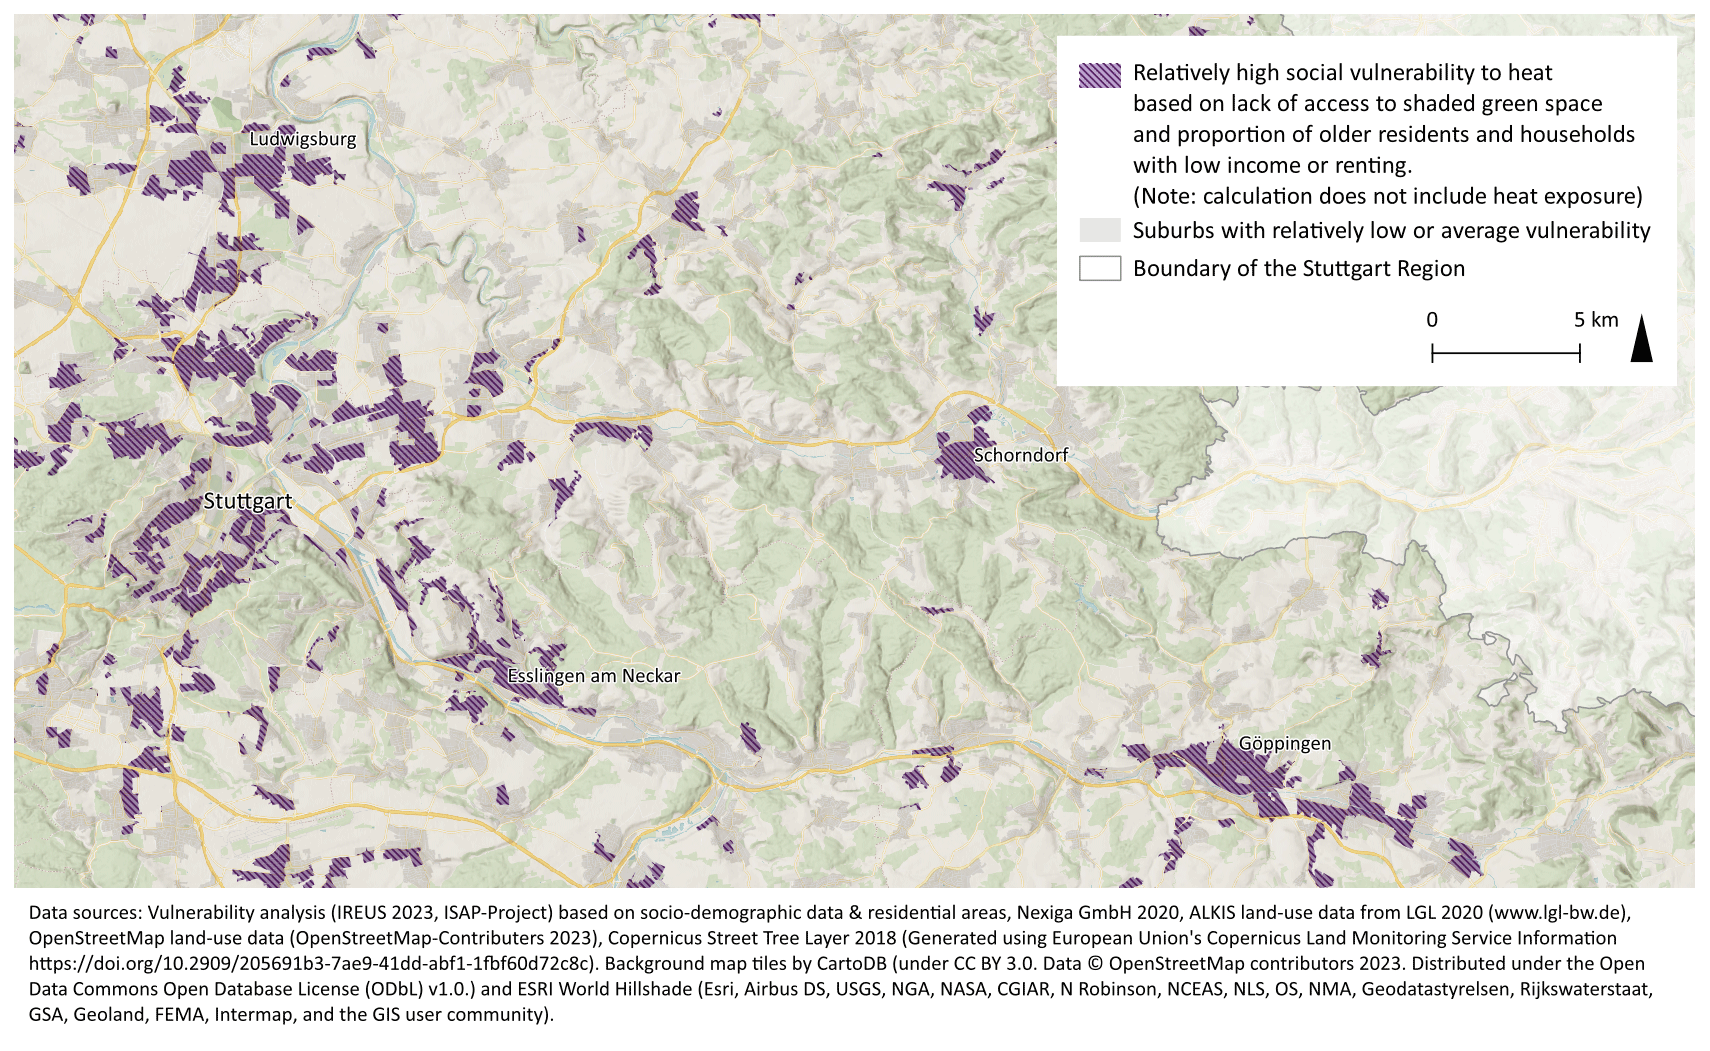
Figure 10Synthesis map of social vulnerability to heat that combines all three key indicators (excerpt of regional map).
We were not able to visit all of the relevant spaces throughout the region and assess them according to the above criteria. We had to rely on a data-based method with some ground truthing.
We first selected the following areas from the land-use cadastre as heat-relevant green spaces: forest, parks, green spaces, garden land, and cemeteries. Cemeteries are often not considered green public space in a more general sense, as they cannot be used in the same way that parks can, but in Germany, they are often well shaded with established trees, offer basic amenities (e.g. benches), are places of social connection for older residents, and thus are highly relevant to heat vulnerability. Garden land is also not usually considered public space, as the gardens are mainly private. However, in the Stuttgart region the small lanes between the gardens are often well shaded by established trees and dense green surroundings and thus can be relevant retreats from the heat. We did not include land uses that are vegetated but without trees or amenities (e.g. footpaths), thus we did not include agricultural fields, vineyards, orchards, or roadside vegetation. We only considered such areas within 200 m of a suburb boundary by straight-line distance. We only took areas that are publicly accessible into account; i.e. we excluded private gardens, communal gardens of apartment buildings, and parks that cost entry (based on OpenStreetMap data). In addition, we only considered areas that are at least partially shaded (according to the Copernicus Street Tree Layer).
After identifying these public shaded green spaces, we determined the availability of such green spaces in terms of effective available area of green space per resident in each suburb. This measure differs from the gross area of green space per resident and takes into account the fact that a unit area of green space that has a high “use intensity”, i.e. one that is shared between many users, has a different usage quality compared to one with a low use intensity. Refer to the Supplement for a detailed description of these GIS-based calculation steps.
The resulting maps of the Stuttgart region provide information on vulnerability, including on the spatial distribution of older residents, on the population's socioeconomic resources, and on public green space provision. These maps complement the regional climate analysis and pluvial flood hazard maps. As described in Sect. 4.2, we undertook this analysis at the resolution of statistically generated suburbs rather than using the more common approach of municipal averages. We based this decision on the end-user requirements outlined in Sect. 4.1. In this section, we present a selection of the final maps below and identify emergent clusters of high vulnerability.
Figure 8 shows that older residents tend to live outside or on the outer edges of cities and municipalities, while the proportion of older people in inner-city areas, especially in the larger centres, is relatively low. There is also a high proportion of seniors in many of the smaller municipalities in the eastern districts of the region. Figure 8 also shows that the spatial pattern of socioeconomic structure, as measured by household income and housing tenure, has a contrasting spatial pattern to that of the proportion of senior citizens. Households that rent or have a lower household income are located more in the inner-city districts of large and medium-sized cities. There are notable exceptions in the very small hamlets in the northeastern districts (e.g. in the Swabian–Franconian Forest) where the proportion of households with low incomes is relatively high.
The access-to-green-space map shows areas with relatively low green space per resident primarily in inner-city areas (Fig. 9). This is mainly due to higher population density and higher pressure on land use. The analysis also shows a relatively low supply of green space in some small towns. This result is mainly because fields and private gardens were deliberately not included in the calculation. Although these areas tend to be dominated by single-family dwellings with gardens, this will not necessarily continue to be the case in the future if the policy of reducing land consumption, through measures such as requiring a minimum density in new residential developments, is successful.
When we combine these three factors – proportion of older people, socioeconomic status, and access to green space – to form the synthesis map “relative social vulnerability to heat”, areas become apparent where vulnerability is relatively high on average (Fig. 10). The synthesis map “relative social vulnerability to pluvial flooding” which considers the average of only the two socio-demographic indicators, and not access to green space, is included in the appendix (Fig. A2) because there are only minimal differences between these two maps except that the urban centres tend to have a higher vulnerability class when the access-to-green-space indicator is included. As discussed above, the indicator of socioeconomic structure also identifies mainly the urban centres as vulnerable. Aside from the urban centres, the synthesis map also points to vulnerable areas on the outskirts of Stuttgart and the mid-sized cities throughout the region, particularly due to the higher proportion of older population in the outer suburbs. We discuss the interpretation and usefulness of these maps in the following section.
7.1 Using vulnerability maps to prioritise and differentiate adaptation needs
In this section, we discuss the vulnerability maps (described above in Sect. 6) in combination with maps of the hazards and exposure. We discuss how the inclusion or omission of different data can lead to different conclusions about high-risk areas.
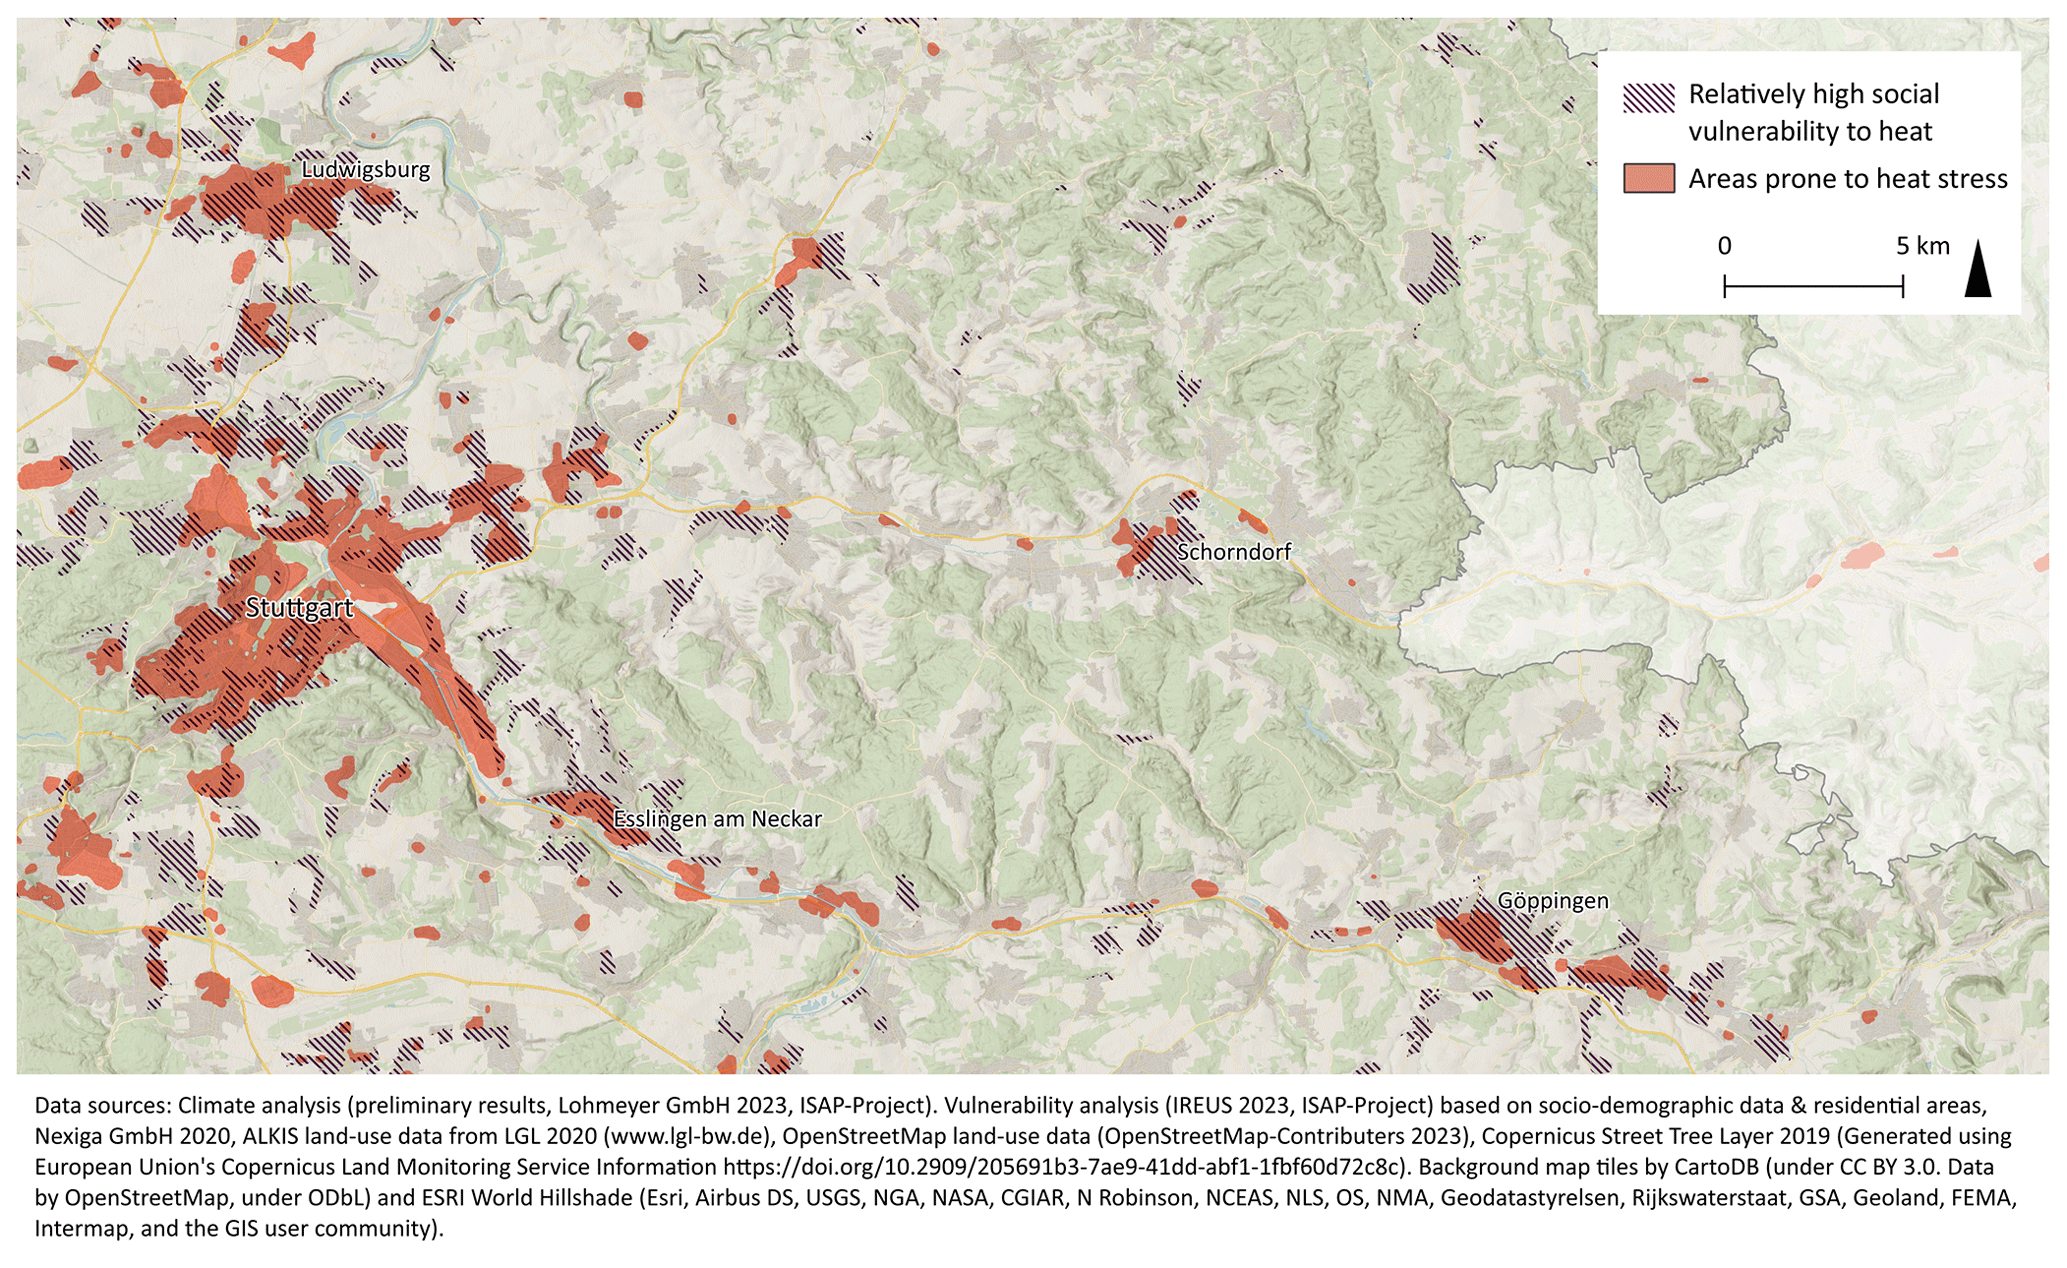
Figure 11Overlay of the areas of relatively high social vulnerability (based on proportion of seniors, socioeconomic status, and access to green) map layer over the areas with the most unfavourable bioclimatic conditions for human well-being in terms of heat load due to a high potential for the heat-island effect (climate analysis results).
In Fig. 11, we overlayed the vulnerability synthesis map with the climate analysis map. Here the inner cities stand out as areas most exposed to extreme heat due to the heat-island effect as well as having high relative vulnerability due to both a higher proportion of socioeconomic disadvantaged households and a lack of green space. For example, in particular the densely populated inner eastern suburbs of the city of Stuttgart are characterised by heat exposure and relatively high social vulnerability including relatively low access to green space, and they thus present a priority area for adaptation (Fig. 11).
In Fig. 12, we overlay the vulnerability synthesis map with the pluvial flood map (maximum water depth). In this case, we show how the overlay looks in the online tool for planners and the public to use. Here the issue of the spatial resolution mismatch can be seen (introduced in Sect. 2). The flood map is very detailed and separated into maximum water depth and velocity in the modelled scenario – both important factors to understand risk. However, this makes it challenging for planners to interpret, especially at the regional level, and challenging to combine with the social vulnerability information. For example, a flood is hazardous sometimes more due to the water depth (e.g. when water enters buildings) or flow velocity (e.g. shallow but fast flowing water can be dangerous for people less stable on their feet). Furthermore, the particularly hazardous spots can be quite small (e.g. a street corner). These two factors make identifying the high-risk areas a challenge (e.g. from what level of water depth or velocity is a spot considered dangerous and from what number or magnitude of dangerous spots and what level of social vulnerability is a suburb considered high risk?). Thus, future research (and future work in the ISAP project in the case study region) should address this issue of translating or interpreting pluvial flood maps into risk maps and into actions required by spatial planning.
Despite these open questions, the overlay of social vulnerability maps with hazard maps can help to better identify the high-risk areas and derive and prioritise necessary action. Measures that reduce hazard and exposure (e.g. through securing open space and implementing blue-green infrastructure) could be prioritised in socially vulnerable areas, as well as measures that reduce the social vulnerability. Depending on the reason for the high social vulnerability (e.g. the socioeconomic situation of residents or the availability of shaded green space), such measures could be to prioritise these areas for hazard reduction, information-based measures such as targeted risk awareness campaigns, or improvement in the quantity and quality of accessible shaded green space. In the case of both pluvial flooding and heat risk assessments, consideration of vulnerability factors can lead to a more comprehensive and nuanced assessment of risk and can also be useful for the following tasks:
-
to further differentiate highly exposed areas in order to identify the high-risk areas which indicate a potential priority for risk reduction action (e.g. which areas within a heat island have a high density of vulnerable residents),
-
to differentiate different types of high-risk areas (e.g. due to hazard exposure or lack of green space) so as to differentiate different appropriate risk reduction measures (e.g. hazard mitigation or improvement of green space access), and
-
to identify areas with high social vulnerability that may not currently be exposed according to the hazard maps but still are potentially at risk to less extreme events (e.g. to avoid increasing risk, future urban development should not exacerbate urban heat through increased soil sealing in areas that are socially vulnerable)
These suggestions about how the maps could be used are based on our own discussions within this study, not on an evaluation of how planners do use the maps – this should be a focus of further study.
At the municipal planning level, an established planning instrument in Germany is socially focused urban renewal programmes, in which socioeconomically disadvantaged neighbourhoods are improved in a participatory process. Through this approach, both social issues and structural issues of an area can be addressed, including climate risk alongside other environmental justice issues such as air and noise pollution and broader vulnerability issues such as social isolation and community cohesion. The spatial information about climate risk, including vulnerability, can provide a basis for identifying issues and for formulating the necessary development concept or framework plan for the urban renewal. Here it must be noted that social disparities cannot be removed by planning alone, but planning based on vulnerability maps can prioritise disadvantaged areas and help ensure equal provision of infrastructure and quality living environments.
7.2 Feedback on the approach and its applicability for spatial planning
In this section, we discuss whether our approach and results meet the end-user requirements outlined in Sect. 4.1, as well as feedback received from spatial planners. Planning decisions are based on a legally binding process of weighing up the different interests and land-use conflicts, as well as being directed by political processes. The deliberation process by planners is based on a range of different inputs including data, analyses, and assessments. Scientific results and structured analyses can, to a certain extent, provide an objective and transparent basis for the decision-making process. However, planners cannot simply rely on analysis results without understanding them. They need to be able to correctly interpret them and explain and defend basing decisions on them, including in the face of legal challenges. In Sect. 4.1 we listed several requirements for spatial data to ensure their applicability for spatial planning, and in the following paragraphs we discuss how this led to our approach to mapping vulnerability, as well as initial feedback on this approach.
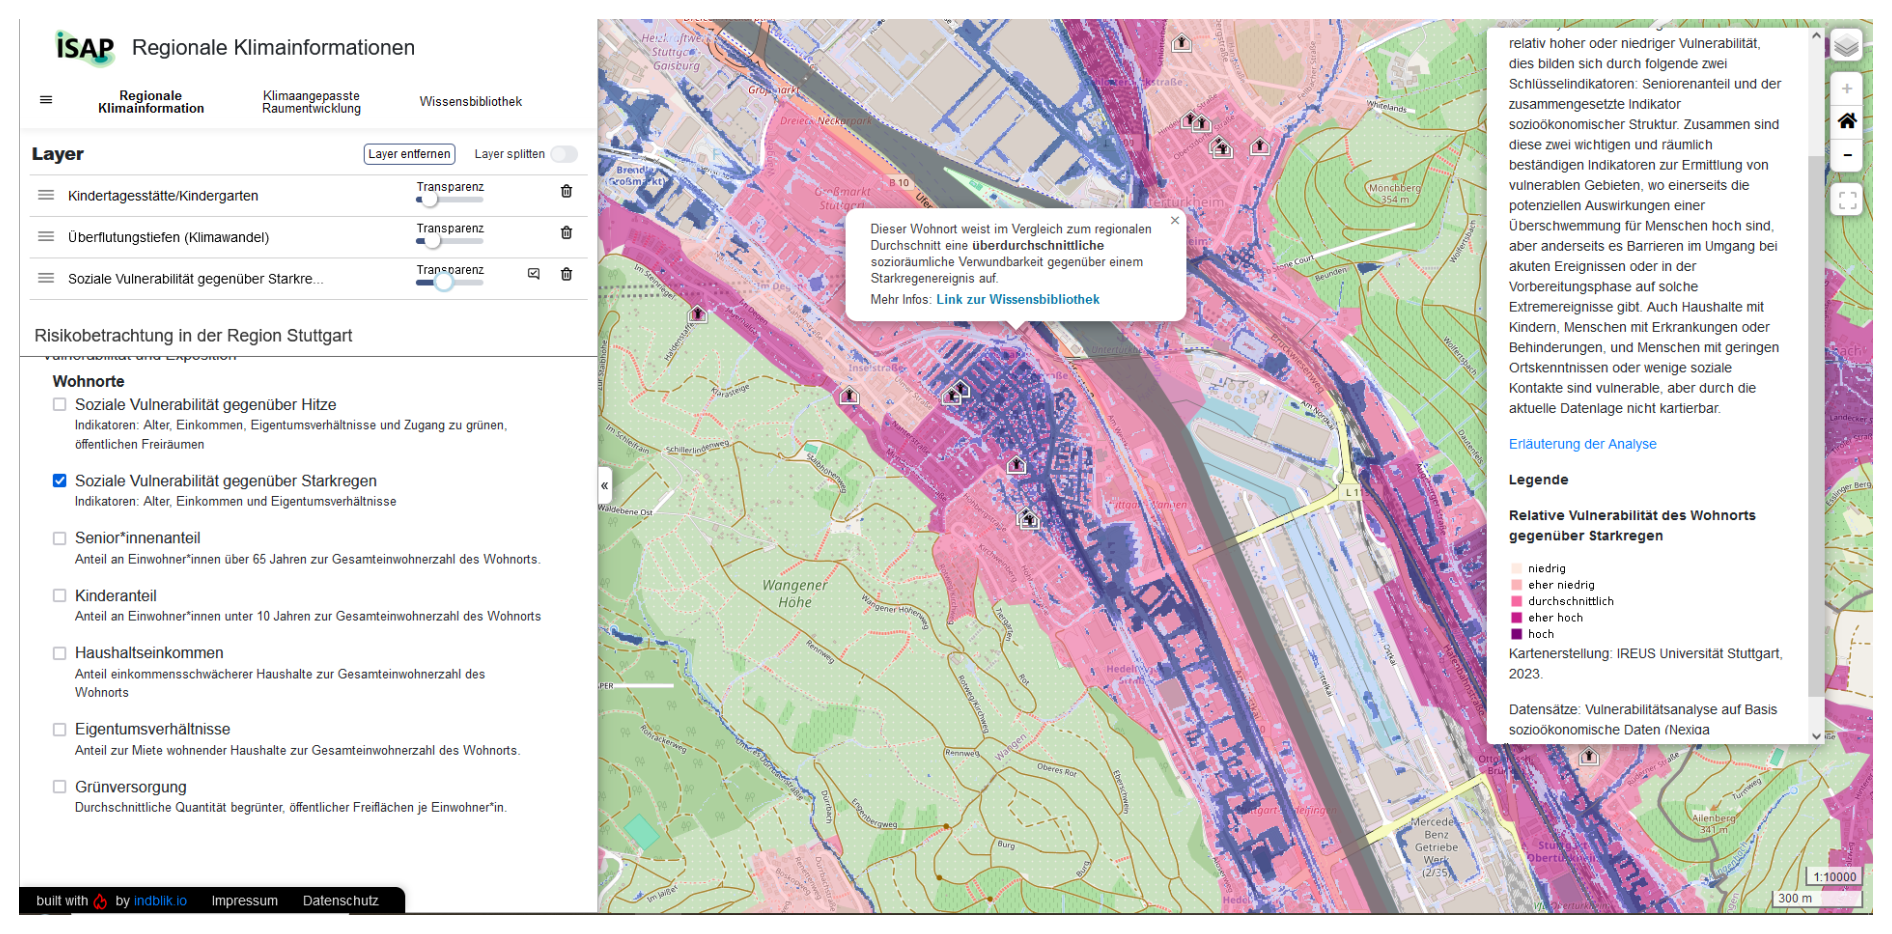
Figure 12Screenshot of a prototype of the new climate atlas of the Stuttgart region (developed by the ISAP project team funded by BMBF, to be hosted by Verband Region Stuttgart, programming and design by indblik.io, 2023). Map shows a pluvial flood map (maximum flood depths for a modelled exceptional heavy rain event taking into account a climate change factor, simulation by Dr. Pecher AG, 2023) overlaying the corresponding vulnerability synthesis map (IREUS, 2023, based on socio-demographic data and residential areas, Nexiga GmbH, 2020a, b) and location of sensitive infrastructure (IREUS, 2023, based on ALKIS building data from LGL, 2020). Background map by OpenStreetMap (©OpenStreetMap contributors 2023, distributed under the Open Data Commons Open Database License (ODbL) v1.0).
Complexity vs. simplicity
One of the key findings from discussions with planning practitioners (Sect. 4.1) is that there is often a discrepancy, firstly, between complex vulnerability indices and usability in planning practice and, secondly, between the scale and detail of hazard maps and vulnerability maps. Therefore, based on these user requirements identified in Sect. 4.1 and data availability assessed in Sect. 4.2, we chose an approach to measuring and mapping vulnerability that focuses on key indicators rather than only on building a composite index. There are several reasons for this decision: firstly, simplicity. By selecting a limited number of indicators rather than building a more complex and comprehensive composite index, we aim to avoid the black box in which the resulting map is only understandable after a lengthy explanation of methods, indicators, and weights. In particular, we found the issue of weights caused issues in the communication of complex indices. However, this highly reduced approach cannot capture the full complexity of vulnerability and thus raises questions about which areas are missed due to this approach. More research, such as a sensitivity and validation study based on further data, could help in this regard.
The second main reason for this simplified approach was data availability. Despite there being strong evidence for many different factors contributing to vulnerability, there is no spatial data available in Germany for many of these factors (Sect. 4.3). Thus, a further reason for not constructing a more comprehensive vulnerability index is that too many factors would have to be left out at this spatial resolution. It would not have been possible to complete a comprehensive index in a statistically sound fashion; thus, the indicators are reported separately. At the same time, there is still a need to compare and combine the individual indicators so as to identify highly vulnerable areas. We thus constructed a simple synthesis of the key indicators using an unweighted index. Due to the limited number of indicators included, the user can more easily break down the index into its components and interpret it for different uses. Breaking the results down into individual indicators is, in fact, what test users did upon seeing the synthesis maps; they wanted to know which indicator caused an area to be considered highly vulnerable in our maps. At the same time, they also showed interest in the synthesis maps as a way to get an overview of the situation and identify where several indicators had high values (e.g. high proportion of elderly and of households with a lower socioeconomic status). Based on this initial feedback, our approach seems appropriate from a planning perspective. However, if more appropriate data were available for more vulnerability factors, other solutions to the issue of translating a composite index for planning purposes could be considered. For example, sensitivity tests or stepwise regression could be used to identify the indicators that led an area to be considered highly vulnerable (as suggested by Cheng et al., 2021).
Interpretation of analysis results for planning
The above paragraphs and this paper focus on developing a methodology that meets planning requirements. However, a different and important aspect of usability by planning is how results can be best translated and communicated for planning purposes. This translation should include clearly written and spatially explicit suggestions for planners. The climate analysis, for example, includes an additional map that translates the climate analysis results into such explicit spatial planning suggestions (e.g. open space with an important cooling function). Online tools to present spatial information can be a part of this translation of climate risk information, as can tools such as risk-based spatial concepts or other so-called “informal” planning instruments such as framework plans for certain districts.
While co-created analyses and well-translated results may improve the link between vulnerability analyses and the planning administration, more is required to support planners in communication with local councils that pass planning statutes and can set strict targets and threshold values for climate and environmental risk (e.g. air pollution levels) that then must be considered in planning deliberation processes. For this translation of climate risk information for local councils, simple and relevant messages are required, for example, the translation of risk into monetary costs. This translation of vulnerability maps into concrete planning suggestions, concepts, and instruments needs further research.
A final remark concerning usability is an own reflection on this research process. We conclude that it is highly beneficial to include planning practitioners in the early stages of analysis and in mapping the results (e.g. for the online tool). Without this input throughout the process, we would have made different decisions about the analysis and mapping, based more on current literature (i.e. producing a more complex composite index), using different data (i.e. older census data or much lower resolution data) and different mapping styles (i.e. grid cells instead of polygons). This would likely have reduced the usability of the results.
7.3 Study limitations, recommendations, and further research needs
This section outlines the limitations of the research, opportunities for improvement, and recommendations for processes that would support integrating climate risk into spatial planning.
Firstly, we analysed the vulnerability of residential areas and the residential population. Thus, we focused only on the people and the settlement areas and not on vulnerabilities of different land uses or structures in and around the settlements or the situation in non-residential settlement areas. This means that risk to the agricultural sector, particularly those working outdoors and therefore highly exposed to heat, is not included in our analysis. In the online tool we do provide an additional map of non-residential areas according to land use (commercial, industrial, public services) and employee density; however, we could not map vulnerability due to lack of data about, for example, the type of working conditions.
There are other factors of vulnerability that we could not include in our analysis due to lack of data, for example, health conditions, social marginalisation, education level, and knowledge of hazards, as discussed in Sect. 4.3. These missing data concern both susceptibility and capacity factors, including factors of socioeconomic disadvantage. One missing factor that is particularly relevant for urban planning is information about the building type and quality and urban form. We were able to make a map of building density and dominant building type per suburb, and while this provides a differentiation of the urban structure that can be relevant to targeted adaptation strategies, it does not allow a judgement of vulnerability. For a map of building vulnerability, information about building quality would be an important factor to find a measure for, especially regarding heat vulnerability (Samuelson et al., 2020).
A limitation also related to data is the coverage and resolution of our analysis, namely for the whole region and at a sub-municipal resolution. This proved to be an unusual combination, particularly because in the Stuttgart region there are no statistical sub-units at a more detailed resolution than the municipalities. This lack of sub-municipal statistical units is a limitation for all kinds of statistical analyses at the regional level. It would also be helpful for planning purposes if the census were made available, not just on the current 100 m × 100 m grid, but also for standardised sub-municipal statistical units available for the whole country and not just large cities (see e.g. the Australian statistical mesh blocks or the United States census tracts).
Furthermore, the issue of the census only being once a decade needs to be addressed. In this study, we investigate the use of statistically updated and disaggregated data. However, in terms of transparency and legitimacy it would be preferable to use the public data source, i.e. the census. Further research should analyse the stability of spatial vulnerability patterns over time. This would allow us to determine if it is possible to justify using census data despite them being up to 10 years old or if a 10-year update cycle would be adequate for vulnerability analyses.
In terms of the research methods, there are several main areas for improvement that present opportunities for further research. Firstly, more input from spatial planning practitioners and related sectoral planers (e.g. water management, green infrastructure management, and social welfare), as well as planners from smaller towns and planning offices, could help to improve the relevance and practical usability of the results. Secondly, the vulnerability aspects of critical and sensitive infrastructure and their assessment at the regional and local scale could be further integrated into the assessment. Thirdly, the analysis of access to green space could be further developed to include barriers to access such as slope steepness and network distance analyses.
Another open topic for research is thresholds for classification of vulnerability data rather than the data-based classification used in this and similar studies. The advantage of a threshold is that comparisons can be more easily made between different areas and over time. In the German context, there are various different thresholds for a sufficient amount of green space that should be accessible, and the discussion is moving towards a standard. There are also various approaches for thresholds of social deprivation and relative poverty, or related current discussions about a social index with which to identify disadvantaged schools. So far, only some cities and states in Germany have social indices. Such current developments are very relevant for the assessment of vulnerability and climate risk, and future research should link up these discourses.
While this paper has focused on the specific case of the region of Stuttgart and the German context, the findings are applicable to other planning systems. Around the world there is work ongoing to integrate climate risk assessments into spatial planning, and while the data quality, climate risk and vulnerability issues, and planning context vary, the identified needs of planners (e.g. transparency, interpretation), solutions (e.g. visibility of individual indicators, appropriate spatial resolution), challenges (e.g. data availability, involvement of different sectors), and lessons learned (e.g. benefits of involving planners early in the analysis, challenges of combining maps of different risk dimensions) can apply and be valuable to these different contexts.
This study has shown a way to map social vulnerability as measured by key indicators at the regional and local level. We found that spatial patterns of susceptibility and coping and adaptive capacities differ. Based on this finding and recommendations from planning practitioners, we conclude that alongside an aggregated synthesis map of vulnerability, maps of individual indicators can provide a useful addition for considering specific policy options in spatial planning such as targeted adaptation of areas with an ageing demographic or with more limited access to green space. In addition, the research shows that vulnerability and hazard information can be usefully combined to provide information about spatial hotspots and differential spatial patterns of risk. The input from practitioners into the development of the vulnerability maps allowed us to better understand the needs of the end users of the maps and cases where such information could be used, for example, in the strategic adaptation planning and improvement of green space. Considering the insights presented in this paper about how to operationalise the vulnerability dimension of risk directly for spatial planning could benefit further work to improve the suitability and usability of risk analyses for adaptive spatial planning.
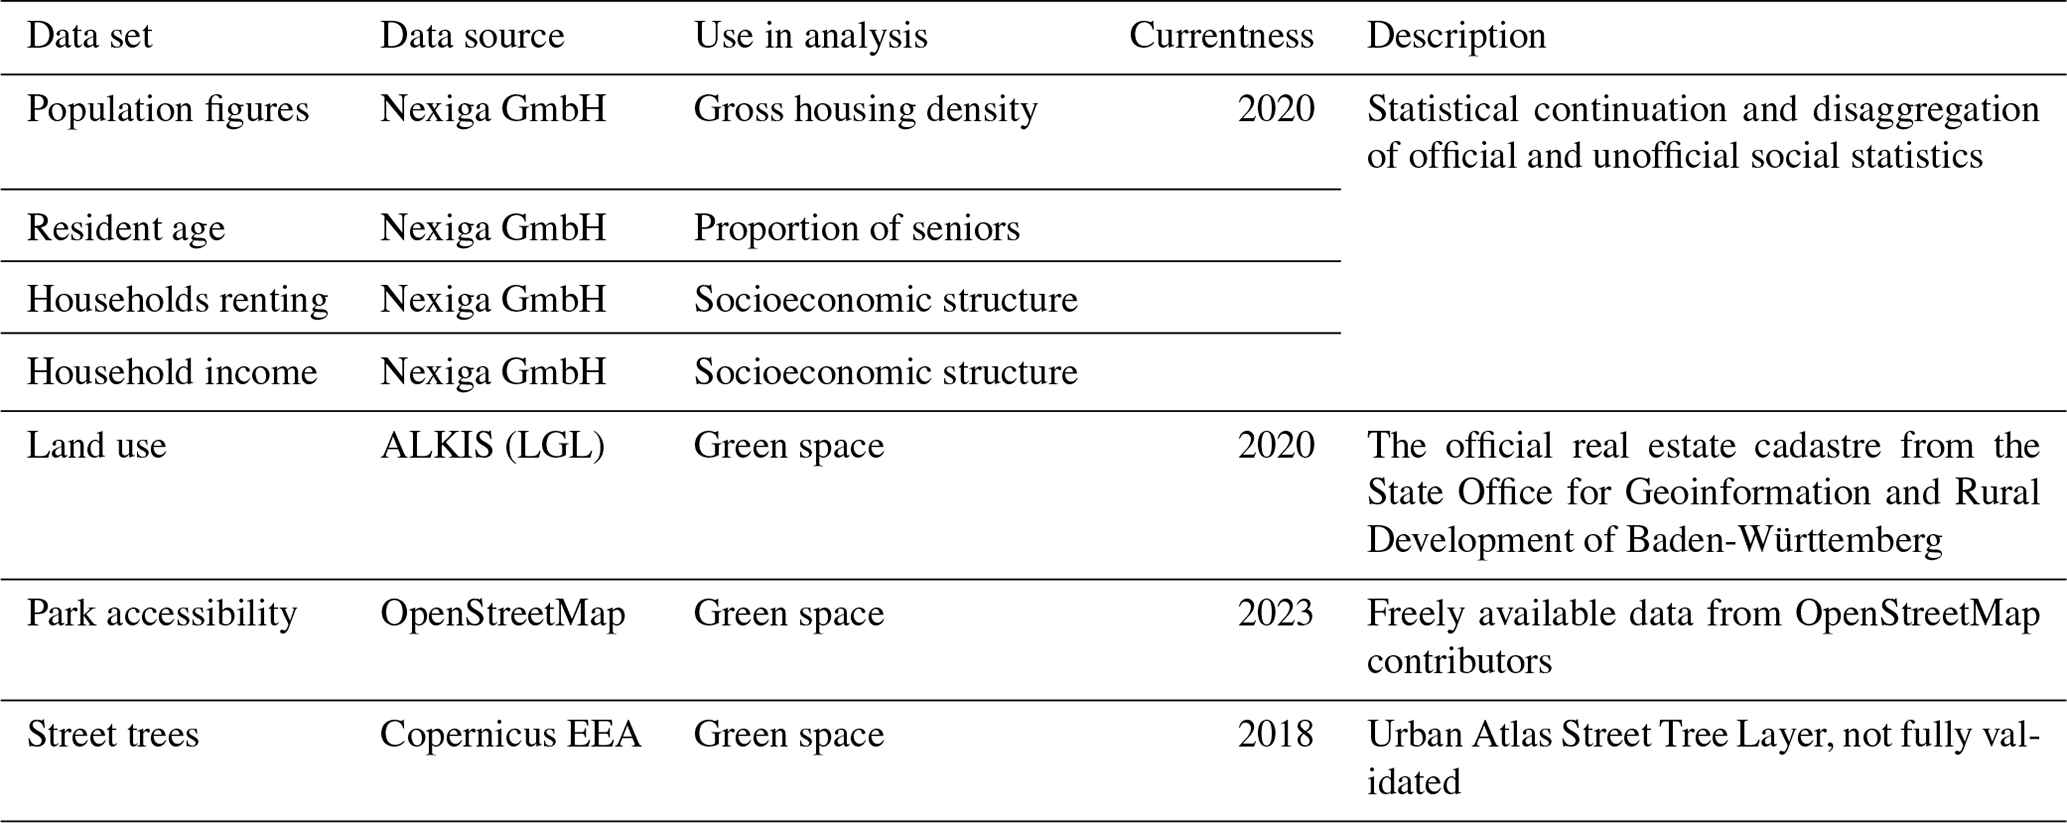
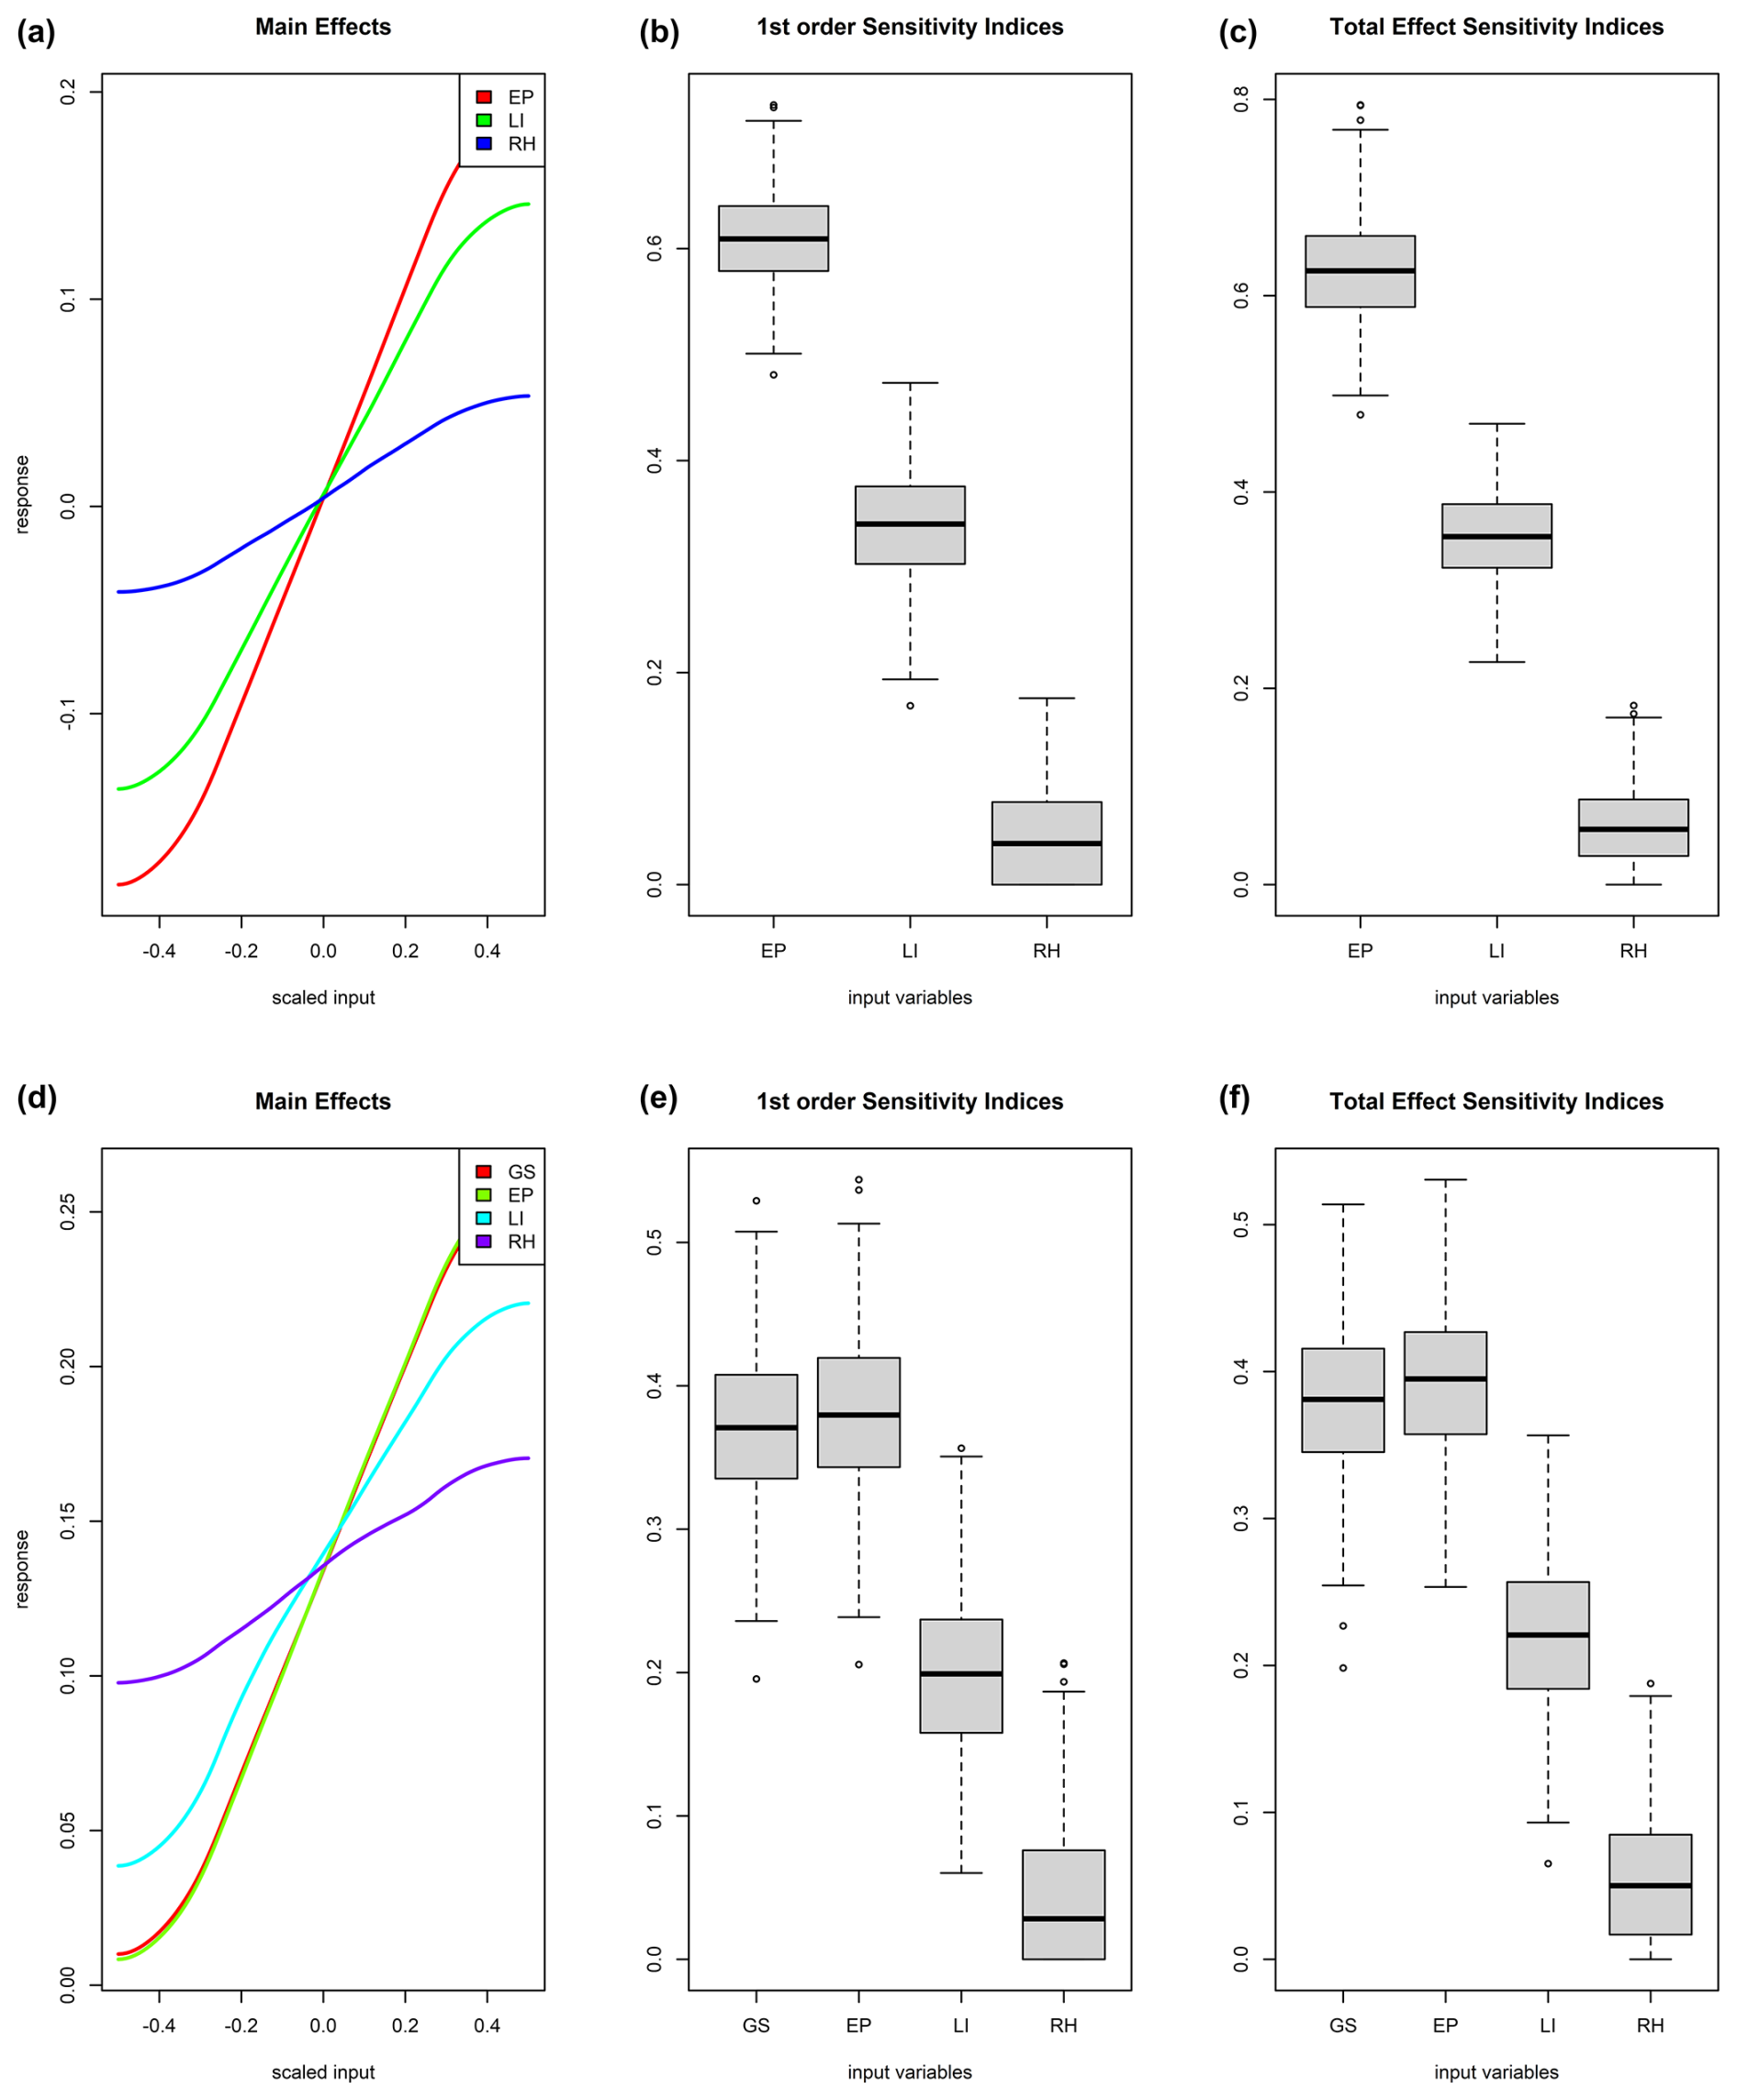
Figure A1A sensitivity analysis of the synthesis maps of vulnerability to flooding (a, b, c) and heat (d, e, f). EP represents the proportion of seniors, RH represents renting households, LI represents lower income, and GS represents access to green space. In the graph on the left, each curve shows how strong the influence of each indicator on the relative vulnerability value is – the steeper the curve, the stronger the influence. The middle graph shows the sensitivity of each indicator – the small size of the box plot indicates a more precise influence while a higher value on the y axis explains a stronger influence. The graph on the right shows how each indicator influences and interacts with others when one indicator changes. If the “total effect sensitivity” of an indicator is zero, then it can be removed or interchangeable with other indicators, while if the indicator's median is greater than zero then it signifies that the indicator is irreplaceable and is relevant in explaining the vulnerability value. This sensitivity analysis indicates that all indicators are relevant and important in explaining vulnerability despite having different strengths of influences.
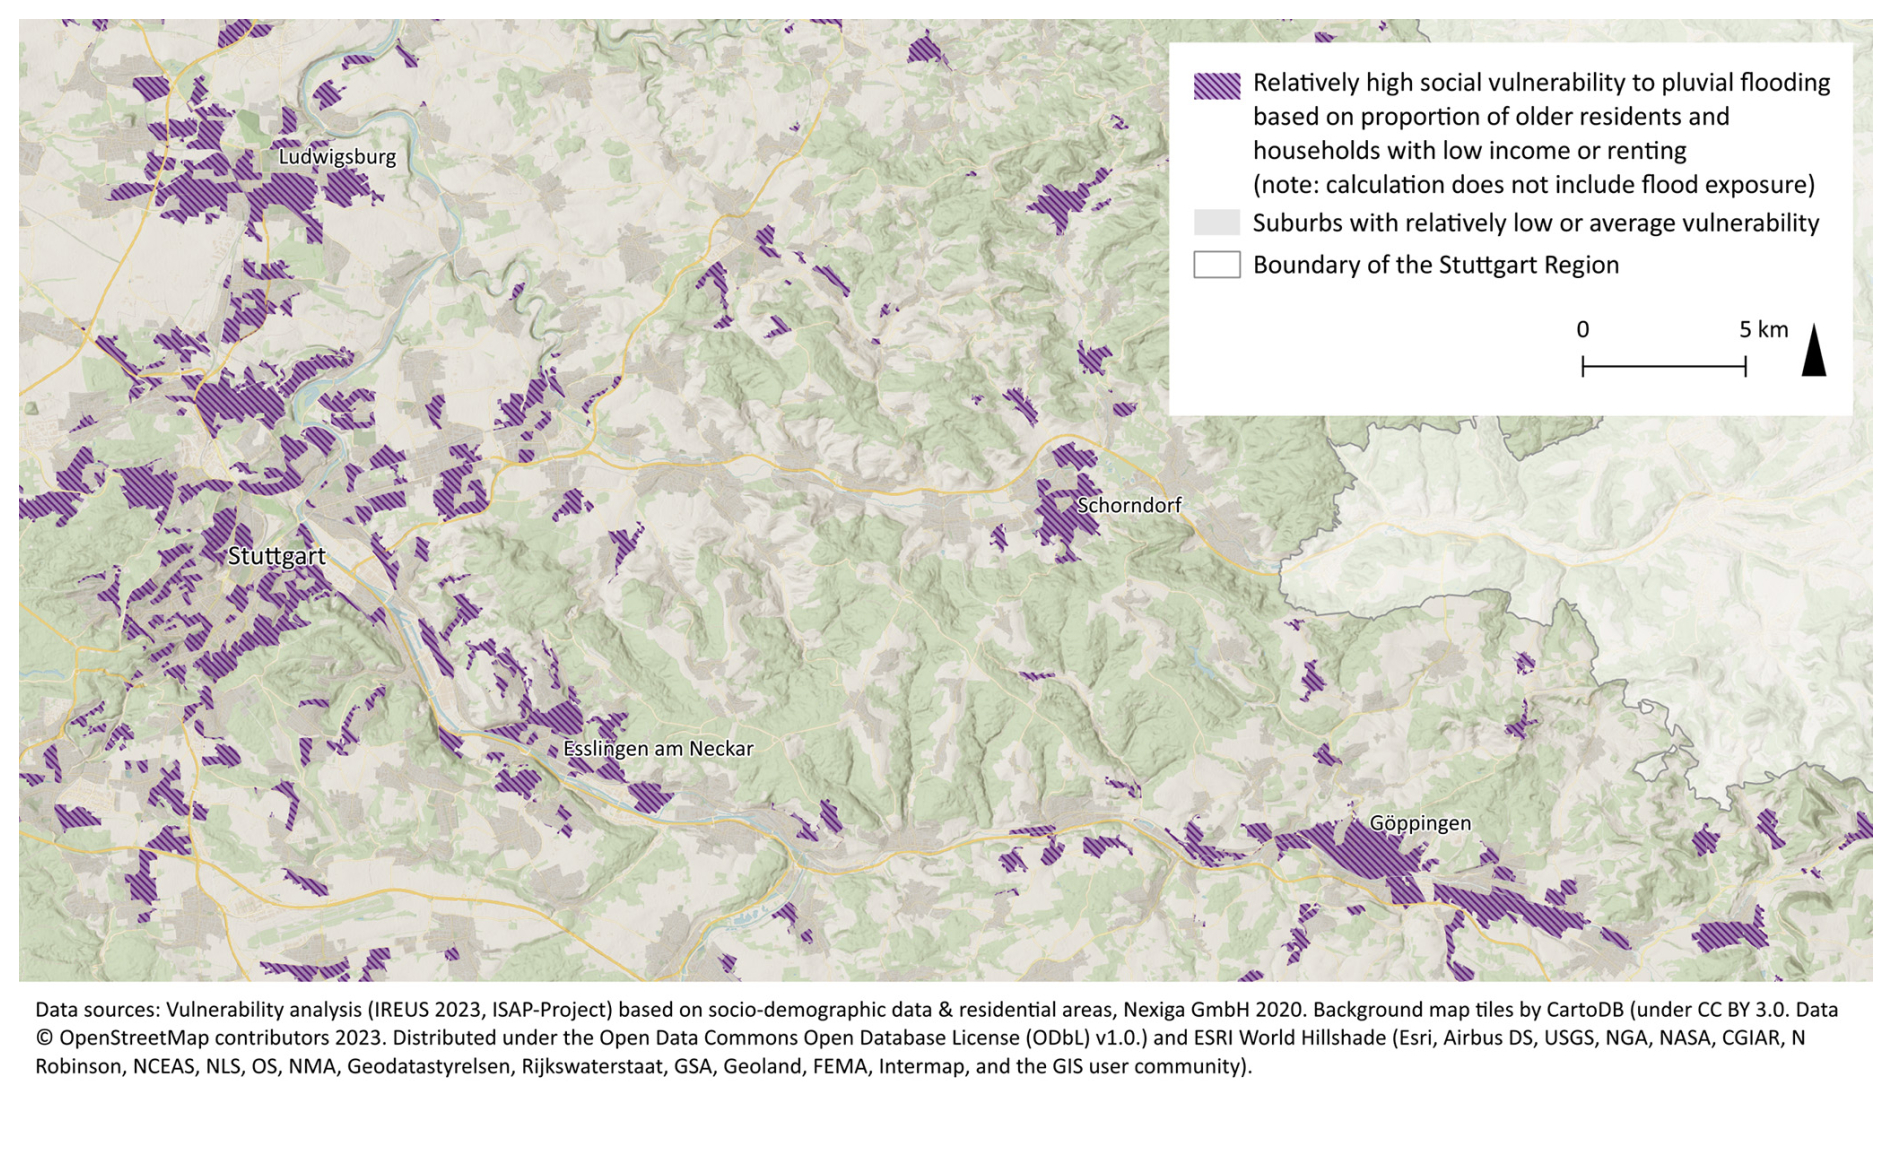
Figure A2Synthesis map of social vulnerability to pluvial flooding that combines the two socio-demographic indicators (excerpt of regional map).
The data set of analysis results, including the initial indicator values and categorised index results for each suburb, is available at https://doi.org/10.5281/zenodo.15024293. The availability of the underlying data sources varies: the Nexiga GmbH data sets are commercial and not freely available (we discuss the reasons for using these data in Sect. 4.2), the land-use cadastre can be requested for a fee from the state office LGL, and the OpenStreetMap and Copernicus data sets are freely available open-data sources. More information on the data sources can be found in Table A1 and in the reference list. To view the resulting maps in detail, see the interactive maps online at https://klimaatlas.region-stuttgart.org/ (VRS, 2023).
The supplement related to this article is available online at https://doi.org/10.5194/nhess-25-1573-2025-supplement.
Conceptualisation: JM, JB, FG, and BW conceptualised the overall research approach. Data gathering and analysis: CS and RK gathered and analysed quantitative data on end-user requirements; JM conducted the spatial data analyses and mapping; AJ conducted additional statistical analyses; JM, FG, and JB gathered and analysed feedback from end users; JM, FG, RK, JB, and BW contributed to the discussion. Project administration: JM and FG coordinated the research. Writing and visualisation: JM wrote the original draft and created the figures; all authors reviewed and edited the manuscript.
The contact author has declared that none of the authors has any competing interests.
Publisher's note: Copernicus Publications remains neutral with regard to jurisdictional claims made in the text, published maps, institutional affiliations, or any other geographical representation in this paper. While Copernicus Publications makes every effort to include appropriate place names, the final responsibility lies with the authors.
This article is part of the special issue “Strengthening climate-resilient development through adaptation, disaster risk reduction, and reconstruction after extreme events”. It is a result of the EGU General Assembly 2023, session NH9.3 “Resilience building and risk reduction: Assessments, frameworks, tools and experiences”, Vienna, Austria, 24 April 2023.
This research has been funded by the German Federal Ministry of Education and Research (BMBF) within the framework of the strategy “Climate Research” (FONA), BMBF funding code Verbundprojekt RegIKlim: Integrative stadt-regionale Anpassungsstrategien in einer polyzentrischen Wachstumsregion, Modellregion – Region Stuttgart (ISAP) (grant no. 01LR2007A).
This open-access publication was funded by the University of Stuttgart.
This paper was edited by Viktor Rözer and reviewed by Alexander Fekete and one anonymous referee.
Arnberger, A., Allex, B., Eder, R., Ebenberger, M., Wanka, A., Kolland, F., Wallner, P., and Hutter, H.-P.: Elderly resident's uses of and preferences for urban green spaces during heat periods, Urban For. Urban Gree., 21, 102–115, https://doi.org/10.1016/j.ufug.2016.11.012, 2017.
Birkmann, J.: Risk and vulnerability indicators at different scales: Applicability, usefulness and policy implications, Environ. Hazards-UK, 7, 20–31, https://doi.org/10.1016/j.envhaz.2007.04.002, 2007.
Birkmann, J.: Globaler Umweltwandel, Naturgefahren, Vulnerabilität und Katastrophenresilienz, Raumforsch. Raumordn., 66, 5–22, https://doi.org/10.1007/bf03184043, 2008.
Birkmann, J., Sauter, H., Garschagen, M., Fleischhauer, M., Puntub, W., Klose, C., Burkhardt, A., Göttsche, F., Laranjeira, K., Müller, J., and Büter, B.: New methods for local vulnerability scenarios to heat stress to inform urban planning—case study City of Ludwigsburg/Germany, Climatic Change, 165, 37, https://doi.org/10.1007/s10584-021-03005-3, 2021.
Bolte, G., Dandolo, L., Gepp, S., Hornberg, C., and Lumbi, S. L.: Climate change and health equity: A public health perspective on climate justice, J. Health Monit., 8, 3–35, https://doi.org/10.25646/11772, 2023.
Breil, M., Downing, C., Kazmierczak, A., Mäkinen, K., and Romanovska, L.: Social vulnerability to climate change in European cities – state of play in policy and practice, European Topic Centre on Climate Change impacts, Vulnerability and Adaptation (ETC/CCA), https://doi.org/10.25424/CMCC/socvul_europcities, 2018.
Butsch, C., Beckers, L.-M., Nilson, E., Frassl, M., Brennholt, N., Kwiatkowski, R., and Söder, M.: Health impacts of extreme weather events – Cascading risks in a changing climate, J. Health Monit., 8, 33–56, https://doi.org/10.25646/11652, 2023.
Cheng, W., Li, D., Liu, Z., and Brown, R. D.: Approaches for identifying heat-vulnerable populations and locations: A systematic review, Sci. Total Environ., 799, 149417, https://doi.org/10.1016/j.scitotenv.2021.149417, 2021.
Christmann, G. B. and Ibert, O.: Vulnerability and resilience in a socio-spatial perspective: A social-scientific approach, Raumforschung Raumord., 70, 259–272, https://doi.org/10.1007/s13147-012-0171-1, 2012.
Cutter, S. L. and Finch, C.: Temporal and spatial changes in social vulnerability to natural hazards, P. Natl. Acad. Sci. USA, 105, 2301–2306, https://doi.org/10.1073/pnas.0710375105, 2008.
Cutter, S. L., Boruff, B. J., and Shirley, W. L.: Social Vulnerability to Environmental Hazards, Soc. Sci. Q., 84, 242–261, 2003.
Davoudi, S., Crawford, J., and Mehmood, A. (Eds.): Planning for Climate Change: Strategies for Mitigation and Adaptation for Spatial Planners (1st Ed.). Routledge, London, https://doi.org/10.4324/9781849770156, 2009.
Deumlich, D. and Gericke, A.: Frequency Trend Analysis of Heavy Rainfall Days for Germany, Water, 12, 1950, https://doi.org/10.3390/w12071950, 2020.
DKKV (Ed.): Die Flutkatastrophe im Juli 2021 in Deutschland. Ein Jahr danach: Aufarbeitung und erste Lehren fur die Zukunft, DKKV-Schriftenreihe Nr. 62, Bonn, ISBN 978-3-933181-72-5, 2022.
Ellena, M., Breil, M., and Soriani, S.: The heat-health nexus in the urban context: A systematic literature review exploring the socio-economic vulnerabilities and built environment characteristics, Urban Climate, 34, 100676, https://doi.org/10.1016/j.uclim.2020.100676, 2020.
European Union's Copernicus Land Monitoring Service information: Urban Atlas Street Tree Layer 2018 (vector), Europe, 6-yearly, https://doi.org/10.2909/205691b3-7ae9-41dd-abf1-1fbf60d72c8c, 2018.
Fekete, A.: Validation of a social vulnerability index in context to river-floods in Germany, Nat. Hazards Earth Syst. Sci., 9, 393–403, https://doi.org/10.5194/nhess-9-393-2009, 2009.
Fekete, A.: Social vulnerability change assessment: monitoring longitudinal demographic indicators of disaster risk in Germany from 2005 to 2015, Nat. Hazards, 95, 585–614, https://doi.org/10.1007/s11069-018-3506-6, 2019.
Fordham, M., Lovekamp, W. E., Thomas, D. S., and Phillips, B. D.: Understanding social vulnerability, in: Social vulnerability to disasters (2nd Ed.), edited by: Thomas, D. S., Phillips, B. D., Fothergill, A., and Blinn-Pike, L., CRC press, Boca Raton, https://doi.org/10.1201/b14854, 2013.
Greiving, S. and Fleischhauer, M.: Climate resilience and environmental justice: state of research and implementation in planning practice in Germany and beyond, Town Plann. Rev., 93, 111–137, https://doi.org/10.3828/tpr.2021.26, 2022.
Greiving, S., Kruse, P., Othmer, F., Fleischhauer, M., and Fuchs, M.: Implementation of risk-based approaches in urban land use planning—the example of the city of Erftstadt, Germany, Sustain. Sci. Pract. Policy, 15, 15340, https://doi.org/10.3390/su152115340, 2023.
Heesen, J., Lorenz, D. F., Nagenborg, M., Wenzel, B., and Voss, M.: Blind Spots on Achilles' Heel: The Limitations of Vulnerability and Resilience Mapping in Research, Int. J. Disast. Risk Sc., 5, 74–85, https://doi.org/10.1007/s13753-014-0014-5, 2014.
Hölzl, S. E., Veskov, M., Scheibner, T., Le, T. T., and Kleinschmit, B.: Vulnerable socioeconomic groups are disproportionately exposed to multiple environmental burden in Berlin - implications– for planning, Int. J. Urban Sustain. Dev., 13, 334–350, https://doi.org/10.1080/19463138.2021.1904246, 2021.
Hundhausen, M., Feldmann, H., Laube, N., and Pinto, J. G.: Future heat extremes and impacts in a convection-permitting climate ensemble over Germany, Nat. Hazards Earth Syst. Sci., 23, 2873–2893, https://doi.org/10.5194/nhess-23-2873-2023, 2023.
Hurlimann, A., Moosavi, S., and Browne, G. R.: Urban planning policy must do more to integrate climate change adaptation and mitigation actions, Land Use Policy, 101, 105188, https://doi.org/10.1016/j.landusepol.2020.105188, 2021.
Hurlimann, A. C. and March, A. P.: The role of spatial planning in adapting to climate change, WIREs Clim. Change, 3, 477–488, https://doi.org/10.1002/wcc.183, 2012.
Imbery, F., Friedrich, K., Fleckenstein, R., Becker, A., Bissolli, P., Haeseler, S., Ziese, M., Daßler, J., Kreis, A., Janssen, W., Posada, R., Leppelt, T., Fränkling, S., and Breidenbach, J. N.: Klimatologischer Rückblick Sommer 2022, Abteilungen für Klimaüberwachung, Hydrometeorologie und Agrarmeteorologie, Deutscher Wetterdienst (DWD), Hamburg, Germany, 2022.
IPCC: Summary for Policymakers, in: Climate Change 2014: Impacts, Adaptation, and Vulnerability. Part A: Global and Sectoral Aspects. Contribution of Working Group II to the Fifth Assessment Report of the Intergovernmental Panel on Climate Change, edited by: Field, C. B., Barros, V. R., Mastrandrea, M. D., Mach, K. J., Abdrabo, M. A.-K., Adger, N., Anokhin, Y. A., Anisimov, O. A., Arent, D. J., Barnett, J., Burkett, V. R., Cai, R., Chatterjee, M., Cohen, S. J., Cramer, W., Dasgupta, P., Davidson, D. J., Denton, F., Döll, P., Dow, K., Hijioka, Y., Hoegh-Guldberg, O., Jones, R. G., Joner, R. N., Kitching, R. L., Kovats, R. S., Larsen, J. N., Lin, E., Lobell, D. B., Losada, I. J., Magrin, G. O., Marengo, J. A., Markandya, A., McCarl, B. A., McLean, R. F., Mearns, L. O., Midgley, G. F., Mimura, N., Morton, J. F., Niang, I., Noble, I. R., Nurse, L. A., O'Brien, K., Oki, T., Olsson, L., Oppenheimer, M., Overpeck, J. T., Pereira, J. J., Poloczanska, E. S., Porter, J. R., Pörtner, H.-O., Prather, M. J., Pulwarty, R. S., Reisinger, A., Revi, A., Romero-Lankao, P., Ruppel, O. C., Satterthwaite, D. E., Schmidt, D. N., Settele, J., Smith, K. R., Stone, D. A., Suarez, A. G., Tschakert, P., Valentini, R., Villamizar, A., Warren, R., Wilbanks, T. J., Wong, P. P., Woodward, A., and Yohe, G. W., Cambridge University Press, Cambridge, United Kingdom and New York, NY, USA, 1–32, 2014.
IPCC: Summary for Policymakers, in: Climate Change 2022: Impacts, Adaptation, and Vulnerability. Contribution of Working Group II to the Sixth Assessment Report of the Intergovernmental Panel on Climate Change, edited by: Pörtner, H.-O., Roberts, D. C., Tignor, M., Poloczanska, E. S., Mintenbeck, K., Alegría, A., Craig, M., Langsdorf, S., Löschke, S., Möller, V., Okem, A., Rama , B., Cambridge University Press, Cambridge, UK and New York, NY, USA, 3–33, 2022.
Jurgilevich, A., Räsänen, A., Groundstroem, F., and Juhola, S.: A systematic review of dynamics in climate risk and vulnerability assessments, Environ. Res. Lett., 12, 013002, https://doi.org/10.1088/1748-9326/aa5508, 2017.
Kuhlicke, C., Madruga de Brito, M., Bartkowski, B., Botzen, W., Doğulu, C., Han, S., Hudson, P., Nuray Karanci, A., Klassert, C. J., Otto, D., Scolobig, A., Moreno Soares, T., and Rufat, S.: Spinning in circles? A systematic review on the role of theory in social vulnerability, resilience and adaptation research, Global Environ. Chang., 80, 102672, https://doi.org/10.1016/j.gloenvcha.2023.102672, 2023.
Landesamt für Geoinformation und Landentwicklung (LGL): ALKIS building use (Das Amtliche Liegenschaftskataster vom Landesamt für Geoinformation und Landentwicklung Baden-Württemberg: Gebäudenutzung), https://www.lgl-bw.de/ (last access: 30 April 2024), 2020a.
Landesamt für Geoinformation und Landentwicklung (LGL): ALKIS land-use data (Das Amtliche Liegenschaftskataster vom Landesamt für Geoinformation und Landentwicklung Baden-Württemberg: Tatsächliche Nutzung), https://www.lgl-bw.de/ (last access: 30 April 2024), 2020b.
Landesamt für Geoinformation und Landentwicklung (LGL): Administrative boundaries (Verwaltungsgrenzen), https://www.lgl-bw.de/ (last access: 30 April 2024), 2023.
Laranjeira, K., Göttsche, F., Birkmann, J., and Garschagen, M.: Heat vulnerability and adaptive capacities: findings of a household survey in Ludwigsburg, BW, Germany, Climatic Change, 166, 14, https://doi.org/10.1007/s10584-021-03103-2, 2021.
Li, A., Toll, M., and Bentley, R.: Mapping social vulnerability indicators to understand the health impacts of climate change: a scoping review, Lancet Planet Health, 7, e925–e937, https://doi.org/10.1016/S2542-5196(23)00216-4, 2023.
Lindley, S., O'Neill, J., Kandeh, J., Lawson, N., Christian, R., and O’Neill, M.: Full Report – Climate change, justice and vulnerability, Joseph Rowntree Foundation, University of Manchester, York, ISBN 978-1-85935-865-8, 2011.
Looks, P., Borchers, P., Reinfried, F., Oertel, H., and Kugler, J.: Umweltgerechtigkeit: Subjektive Hitzebelastung als Folge des Klimawandels in konträren Stadtquartieren, Gesundheitswesen, 83, 303–308, https://doi.org/10.1055/a-1138-0355, 2021.
McMillan, J. M., Birkmann, J., Tangwanichagapong, S., and Jamshed, A.: Spatial Planning and Systems Thinking Tools for Climate Risk Reduction: A Case Study of the Andaman Coast, Thailand, Sustain. Sci. Pract. Policy, 14, 8022, https://doi.org/10.3390/su14138022, 2022.
McMillan, J. M.: Analysis results for “Mapping vulnerability to climate change for spatial planning in the region of Stuttgart”, Zenodo [data set], https://doi.org/10.5281/zenodo.15024293, 2025.
Ministerium für Umwelt, Klima und Energiewirtschaft Baden-Württemberg (Ed.): Strategie zur Anpassung an den Klimawandel in Baden-Württemberg: Fortschreibung, Ministerium für Umwelt, Klima und Energiewirtschaft Baden-Württemberg, Stuttgart, 2023.
Nexiga GmbH: Population figures (Einwohner aus LOCAL®Data KGS22 vom Sichtag 31.12.2020), https://nexiga.com/en/daten/ (last access: 30 April 2024), 2020a.
Nexiga GmbH: Socio-economic data and residential areas (Haushalte & Beschäftigung aus LOCAL®Data KGS22 vom Sichtag 31.12.2020), https://nexiga.com/en/daten/ (last access: 30 April 2024), 2020b.
OpenStreetMap contributors: OpenStreetMap [Areas, Key: Natural], OpenStreetMap Foundation, Available as open data under the Open Data Commons Open Database License (ODbL) at https://www.openstreetmap.org/#map=6/51.33/10.45 (last access: 30 April 2024), 2023.
Rüdiger, A.: Klimawandelgerechte Strategien als Baustein einer integrierten Stadtentwicklung, in: Planung für gesundheitsfördernde Städte, edited by: Baumgart, S. Köckler, H., Ritzinger, A., and Rüdiger, A., Verlag der ARL, Hannover, ISBN 978-3-88838-085-3, 2018.
Rufat, S.: Spectroscopy of Urban Vulnerability, Ann. Assoc. Am. Geogr., 103, 505–525, https://doi.org/10.1080/00045608.2012.702485, 2013.
Samuelson, H., Baniassadi, A., Lin, A., Izaga González, P., Brawley, T., and Narula, T.: Housing as a critical determinant of heat vulnerability and health, Sci. Total Environ., 720, 137296, https://doi.org/10.1016/j.scitotenv.2020.137296, 2020.
Sandholz, S., Sett, D., Greco, A., Wannewitz, M., and Garschagen, M.: Rethinking urban heat stress: Assessing risk and adaptation options across socioeconomic groups in Bonn, Germany, Urban Climate, 37, 100857, https://doi.org/10.1016/j.uclim.2021.100857, 2021.
Scholze, N., Riach, N., and Glaser, R.: Assessing Climate Change in the Trinational Upper Rhine Region: How Can We Operationalize Vulnerability Using an Indicator-Based, Meso-Scale Approach?, Sustain. Sci. Pract. Policy, 12, 6323, https://doi.org/10.3390/su12166323, 2020.
Simmonds, K. E., Jenkins, J., White, B., Nicholas, P. K., and Bell, J.: Health impacts of climate change on gender diverse populations: A scoping review, J. Nurs. Scholarship., 54, 81–91, https://doi.org/10.1111/jnu.12701, 2022.
Sze, J. and London, J. K.: Environmental justice at the Crossroads, Soc. Compass, 2, 1331–1354, https://doi.org/10.1111/j.1751-9020.2008.00131.x, 2008.
Tyler, S. and Moench, M.: A framework for urban climate resilience, Clim. Dev., 4, 311–326, https://doi.org/10.1080/17565529.2012.745389, 2012.
Verband Region Stuttgart: Central places and axes (Strukturkarte, Regionalplan Satzungsbeschluss vom 22.07.2009), https://www.region-stuttgart.org/de/bereiche-aufgaben/regionalplanung/regionalplan/ (last access: 30 April 2024), 2009.
Verband Region Stuttgart (VRS): Digitaler Klimaatlas der Region Stuttgart, https://klimaatlas.region-stuttgart.org/ (last access: 30 April 2024), 2023.
von Szombathely, M., Hanf, F. S., Bareis, J., Meier, L., Oßenbrügge, J., and Pohl, T.: An Index-Based Approach to Assess Social Vulnerability for Hamburg, Germany, Int. J. Disast. Risk Sc., 14, 782–794, https://doi.org/10.1007/s13753-023-00517-7, 2023.
Weichselgartner, J. and Kelman, I.: Geographies of resilience: Challenges and opportunities of a descriptive concept, Prog. Hum. Geog., 39, 249–267, https://doi.org/10.1177/0309132513518834, 2015.
Welle, T., Depietri, Y., Angignard, M., Birkmann, J., Renaud, F., and Greiving, S.: Chapter 5 – Vulnerability Assessment to Heat Waves, Floods, and Earthquakes Using the MOVE Framework: Test Case Cologne, Germany, in: Assessment of Vulnerability to Natural Hazards, edited by: Birkmann, J., Kienberger, S., and Alexander, D. E., Elsevier, San Diego and Waltham, https://doi.org/10.1016/B978-0-12-410528-7.00005-9, 91–124, 2014.
Wilson, E. and Piper, J.: Spatial Planning and Climate Change (1st Ed.), Routledge, London, https://doi.org/10.4324/9780203846537, 2010.
Winklmayr, C., Muthers, S., Niemann, H., Mücke, H.-G., and an der Heiden, M.: Hitzebedingte Mortalität in Deutschland zwischen 1992 und 2021, Dtsch. Arztebl. Int., 119, 451–457, 2022.
Winklmayr, C., Matthies-Wiesler, F., Muthers, S., Buchien, S., Kuch, B., An der Heiden, M., and Mücke, H.-G.: Heat in Germany: Health risks and preventive measures, J. Health Monit., 8, 3–32, https://doi.org/10.25646/11651, 2023.
- Abstract
- Introduction
- Theoretical context
- The case study region of Stuttgart and the research approach
- Preliminary findings: basis for the vulnerability mapping
- Methods: mapping vulnerability
- Results: maps of vulnerable areas
- Discussion
- Conclusion
- Appendix A
- Data availability
- Author contributions
- Competing interests
- Disclaimer
- Special issue statement
- Financial support
- Review statement
- References
- Supplement